Article

A Study on the Factors Influencing High Backfill Slope Reinforced with Anti-Slide Piles under Static Load Based on Numerical Simulation

1
China Construction Industrial & Energy Engineering Group Co., Ltd., No. 1, Chuning Road, Jiangning District, Nanjing 210000, China
2
School of Civil and Transportation Engineering, Guangdong University of Technology, No. 100, Outer Ring West Road, Guangzhou University Town, Panyu District, Guangzhou 510006, China
3
School of Civil Engineering, Guangzhou Institute of Science and Technology, No. 638, Xingtai San Road, Suifeng Village, Taihe Town, Baiyun District, Guangzhou 510040, China
*
Author to whom correspondence should be addressed.
Buildings 2024, 14(3), 799; https://doi.org/10.3390/buildings14030799
Submission received: 29 December 2023 / Revised: 31 January 2024 / Accepted: 5 February 2024 / Published: 15 March 2024
(This article belongs to the Special Issue Low-Carbon and Green Materials in Construction—2nd Edition)

Abstract

:
Based on a real engineering case, this study employs the MIDAS finite element software to model the reinforced high embankment slope using anti-sliding piles. The accuracy of the finite element method is verified by comparing calculated outcomes with field monitoring data. Expanding on this foundation, an analysis of factors influencing the reinforced high embankment slope is undertaken to scrutinize the impact of diverse elements on the slope and ascertain the optimal reinforcement strategy. The results reveal the following: The principal displacement observed in the high embankment slope is a vertical settlement, which escalates with the backfill height. Notably, the highest settlement does not manifest at the summit of the initial slope; instead, it emerges close to the summits of the subsequent two slopes. However, the maximum horizontal displacement at the slope’s zenith diminishes as the fill height increases—a trend that aligns with both field observations and finite element computations. The examination of the influence of anti-sliding pile reinforcement on the high embankment slope unveils that factors like the length, diameter, spacing, and positioning of the anti-sliding piles exert minor impacts on vertical settlement, while variations in the parameters of the anti-sliding piles significantly affect the slope’s horizontal displacement. When using anti-sliding piles to reinforce multi-level high embankment slopes, factoring in the extent of horizontal displacement variation and potential cost savings, the optimal parameters for the anti-sliding piles are a length of 15 m, a diameter of 1.5 m, and a spacing of 2.5 m, presenting the most effective combination to ensure superior slope stability and support.

1. Introduction

China has historically been significantly affected by various geological hazards. Currently, the frequency of geological disasters is increasing, and the instability of slopes during such disasters, mainly, cannot be ignored. These sudden geological events not only impact the stable development of the economy but also bring about numerous safety hazards, threatening people’s lives. In this context, assessing the stability of slopes and adopting appropriate reinforcement methods have become focal points of research for related professionals [1,2,3]. Once potential instability hazards are identified on slopes, timely reinforcement is necessary. Numerous reinforcement design schemes have been proposed, with slope reinforcement using anti-sliding piles being one extensively studied approach.
Anti-slide piles serve as pivotal support structures within slope stabilization endeavors. Their indispensability stems from their robust capability to counteract sliding forces, their versatility in their placement, minimal disruption to the slope’s integrity, broad suitability across contexts, and the overarching enhancement of stability. In order to embark on a comprehensive investigation into the domain of slope reinforcement via anti-slide piles, it becomes imperative to factor in a spectrum of influencing variables [4,5] duly. This strategic inclusion is a requisite step toward devising anti-slide pile solutions that are methodologically sound and optimally attuned to scientific principles and resource-efficient practices [6,7].
In the study conducted by Weilide et al. [8], the finite element method with elastoplastic behavior was employed to calculate the reinforced slope model with anti-slide piles. The calculation process involved the progressive reduction in shear strength to determine the slope safety factor. The results demonstrated that optimizing the anti-slide pile scheme improves slope stability. Notably, placing anti-slide piles within the slope significantly enhances stability, while the spacing between anti-slide piles also exerts a notable impact on slope stability. Yang et al. [9] investigated three types of landslides (translational, compound, and rotational) by varying the positions of anti-slide piles for reinforcement. They calculated the slope safety factor for different pile positions and analyzed the relationship between stress and displacement fields. The results indicated that the optimal positions for anti-slide piles vary for different landslides, corresponding to the upper slope, locations with high stress and displacement in the middle slope, and the lower slope. Zhang [10] developed a novel slope testing system and used various monitoring methods to study double-row piles’ bearing capacity and deformation characteristics, revealing the effectiveness of anti-slide piles. The results showed that anti-slide piles significantly enhance the bearing capacity of slope soil, with the front-row anti-slide piles bearing greater loads than the rear-row piles. Adopting double-row piles effectively improves slope stability. Qu [11] conducted vertical cyclic compression load tests [12] on single-pile models under three types of slope terrain (inclined slope foundation, flat foundation, and inclined rock foundation). They investigated anti-slide piles’ cyclic effect and dynamic response under different dynamic amplitudes, loads, frequencies, and cycle counts.
With the maturation of slope stability analysis theory [13] and the development and popularization of computer technology, numerical analysis methods have also made rapid progress. While two-dimensional analysis methods are still primarily used in slope engineering, they have significant limitations. Two-dimensional finite element models can only analyze profiles representing local features, and the safety factor results obtained from these models often cannot represent the overall slope safety factor. Additionally, two-dimensional models cannot consider the lateral constraints of the computational profile, leading to safety factors that are usually smaller than actual values. Conservative reinforcement methods are often adopted to ensure slope engineering safety, resulting in high safety margins and substantial resource wastage. Furthermore, when designing slope engineering projects, past engineering experiences are often referred to for design, resulting in a lack of novelty and scientific basis in design solutions and hindering accurate risk assessment. Therefore, advancing this field requires a change in the current situation. Researchers are gradually expanding safety analysis and assessment methods from two-dimensional to three-dimensional [14] analysis to address complex slope engineering challenges better. This approach provides more comprehensive and accurate numerical simulation results, contributing to scientifically sound design solutions, enhanced structural safety, and stability.
Based on a specific engineering case, Iefebvre et al. [15] established a three-dimensional dam model by considering the actual physical–mechanical parameters of the slope under valley terrain. They conducted the stress–strain analysis using a three-dimensional approach, marking the first instance of combining slope engineering with a three-dimensional model and employing the finite element method for landslide analysis. Subsequently, the finite element method gradually matured, becoming capable of simulating slope engineering under different geological conditions, hydrological conditions, and load scenarios, thereby guiding practical engineering projects. Xiao et al. [16], employing a three-dimensional rotational failure mechanism, introduced a method combining gravity increment and upper-bound theorem to evaluate the safety factor (FS) of a 3D stepped slope in non-uniform, unsaturated soil. They proposed a new formula for calculating the FS of a two-level 3D slope for practical geological engineering applications. Deendayal et al. [17] conducted numerical simulation analysis using PLAXIS 3D software, investigating the behavior of a pile group located on sloping terrain (1V:5H and 1V:3H slopes) under lateral loads. They studied the influence of slope angle on pile-bearing capacity, lateral deflection, and bending moment distribution of the front, middle, and rear pile groups. GRIFFITHS et al. [18], employing an elastoplastic finite element method, compared three-dimensional slope stability analysis with two-dimensional results. Three-dimensional finite elements can incorporate complex geometric shapes, boundary conditions, and material property changes in out-of-plane directions, yielding more realistic results. Not only can accuracy be improved, but the fundamental nature of slope failure mechanisms can also be better understood. Bushira et al. [19], focusing on a particular layered slope, used UDEC discrete element software to simulate the deformation and failure process of the slope after excavation. They analyzed the failure mechanism, revealing that the failure process of the layered slope could be divided into four stages, with tensile failure being the primary mode, primarily originating at the foot of the slope and involving traction sliding, along with localized shear failure. Zheng et al. [20], based on the strength reduction and step-loading finite element methods, constructed a three-dimensional finite element model of a slope, which considered the interaction between anti-sliding piles and soil. This allowed them to obtain accurate calculation results and understand the bearing capacity of the foundation, load–settlement curve, and failure mechanism.
Zhao et al. [21,22] employed discrete element simulation to model the initial stress field based on the engineering angle and joint spacing. They obtained computation results with a high agreement to analytical and numerical solutions. The asymmetric displacement phenomenon of rock masses highlighted the anisotropy of rock masses, naturally explaining the impact of joints on rock masses. Hong et al. [23] introduced a three-dimensional upper limit theory for the three-dimensional spiral rotational failure mechanism. They proposed a slope power balance equation that considers the influence of the slope crest angle. Utilizing an exhaustive search method with constraints, they optimized and solved for the minimum slope safety factor, quantitatively analyzing the patterns of safety factor computation using the SRM and GIM methods under different parameters. Ma Hao [24] established a three-dimensional slope discrete element model via field investigations and drone imagery. Based on the statistical pattern of joint spacing–layer thickness, they explored the effect of reservoir water softening on the “S”-shaped deformation mechanism of the slope, identifying the leading cause of “S”-shaped deformation in rock layers. Song Jian et al. [25] used FLAC 3D finite difference software to conduct seismic stability simulation and analysis on three types of slopes (homogeneous soil [26], layered soil, and soil with weak interlayers [27]). They investigated the evolution of sliding surfaces and deformation distribution in the slopes.
The above research systematically expounds the methods of numerical simulation analysis applied in slope engineering. It predicts and analyzes the failure mechanism of slopes under various geological conditions, hydrological conditions, and load situations by establishing three-dimensional slope finite element models. The study explores the disease conditions of slopes and the interaction mechanism between pile and soil. The results significantly promote the application of the finite element method and numerical simulation analysis in slope engineering. Among them, two-dimensional analysis methods are the primary methods in slope engineering, but they can only analyze sections representing local characteristics. The safety factor results derived from these models often cannot represent the overall slope’s safety factor. At the same time, there are fewer studies on the reinforcement of high backfill slopes with anti-slide piles. Although scholars have developed methods for reinforcing high backfill slopes with anti-slide piles compared to other reinforcement methods, there are still many shortcomings in the existing experimental studies, not to mention the quantitative research on the impact of various factors on anti-slide piles. The main influencing factors and development trends of the displacement of high backfill slopes are not sufficiently studied, and further analysis is needed on the impact of the parameters of the anti-slide pile on reinforcing high backfill slopes.
In current engineering cases, we often encounter the reinforcement of high backfill slopes, and reinforcing them with piles is a worthwhile scheme to study. Therefore, it is significant to conduct research on reinforcing high backfill slopes with piles, combining numerical simulation and field test data. This paper explores the influencing factors of anti-slide piles on high backfill slopes via numerical analysis and finite element simulation. It compares the calculation results with field monitoring data, analyzes the main displacement development trends of high backfill slopes, and further studies the parameters affecting the displacement of high backfill slopes by varying the main parameters of the anti-slide piles. Based on a comprehensive consideration of the high backfill slope and construction costs, the most suitable size parameters for anti-slide piles are determined, providing practical guidance for the design of on-site anti-slide pile reinforcement of high slopes and landslide prevention.

2. Engineering Overview and Test Point Selection

2.1. Project Overview

The project is located in Youxi County, Sanming City, Fujian Province, approximately 100 km from the sea. The site is in a hilly area with underdeveloped surface water systems in the surrounding area. The groundwater in the vicinity is mainly confined to pore water in the soil layers. Within the scope of this site, the groundwater primarily consists of two major types: the pore phreatic water in the soil layers, and the pore-fracture water in the residual layers, bedrock, and weathered layers [28,29]. Pore water is mainly distributed in the fill soil and fine-grained clay layers, while pore-fissure water is mainly distributed at the bottom of the weathered layer of the bedrock [30].
Based on borehole information and geotechnical reports, the basic physical and mechanical parameters of various rock and soil layers can be determined, as shown in Table 1.

2.2. Selection of Test Points

This study’s reference section selected for numerical simulation is the segment from K3 + 227.85 to K8 + 226.12. The simulation covers the entire construction process, from incremental backfilling of the slope to the application of highway operational loads. The slope reinforcement approach used in this project is the ‘reinforced backfill soil + anti-slide pile’ method. Square anti-slide piles with section dimensions of 1.5 × 1.5 m2, a length of 15 m, and a spacing of 2.5 m are installed at the bottom of the slope. The bottom of these anti-slide piles is embedded in the moderately weathered sandstone layer. The slope construction involves four levels of backfilling, with each level having a height of 8 m and 1 m thick backfill soil applied at each stage. A layer of geogrid is required to be embedded for each level of the slope. The lengths of the geogrids for each level are not the same and decrease gradually with an increase in slope levels [31].

3. Model Establishment

In this study, the MIDAS.GTS.NX 2019 geotechnical finite element software will be employed to model typical slope cross-sections from the construction site, simulating the entire process from incremental backfilling of the slope to the final application of the new line load. According to the research by Bingxiang Yuan [32,33], the slope height is assumed to be H. The best calculation results are achieved when the distance from the slope top to the boundary is not less than 2.5H, the distance from the slope bottom to the boundary is not less than 1.5H, and the distance from the slope base to the lower boundary is not less than 1H. This approach ensures both accuracy in slope calculations and cost savings in computational effort. The model’s dimensions are chosen according to the conditions shown in Figure 1c. Both the soil and bedrock adopt the Mohr–Coulomb constitutive model. The grid division is shown in Figure 1b. Prior to grid generation, grid control must be performed. The backfill layer and the outline of the anti-slide piles are set to 1 m, and the outer boundary lines of the soil body are set to 2 m. X-direction constraints are added to the boundaries on the left and right sides of the model, Y-direction constraints are added to the boundaries on the front and back sides, and both X and Y-direction constraints are applied to the bottom of the slope. Operational loads, including highway loads and vehicle loads, are added to the model. After applying operational loads with an intensity of approximately 50 kPa, Figure 1c depicts the finite element model.

4. Finite Element Results Analysis

4.1. Slope Vertical Displacement Analysis

Figure 2 presents the contour map of vertical settlement, showing that the maximum settlement point of the slope is not at the top but within the interior of the 4–5 m backfilled soil above the slope bottom. The maximum settlement value is 141.28 mm. This phenomenon occurs due to the additional strain induced by the extra load from the upper soil layers on the lower soil layers, resulting in settlement deformation. With the progression of backfilling on the slope, the soil at the bottom is gradually compacted and pushed forward under the influence of gravity. This leads to lateral compression of the soil on the outer side of the slope toe, causing the soil at the forefront of the slope toe to rise. The maximum uplift value is 1.3 mm. Figure 3 illustrates the vertical settlement distribution curves of different points at the slope bottom. The maximum settlements at the slope bottom for each level of backfill slope, from the lowest to the highest, are 48.34 mm, 80.30 mm, 109.18 mm, and 132.64 mm, with growth rates of 66.11%, 35.97%, and 20.90%, respectively. This indicates that as the filling height increases, the compactness of the lower-fill soil improves due to lower porosity and more substantial bearing capacity. This is because the load of each layer of fill continuously decreases, leading to a continuous decline in the rate of settlement growth of the backfilled slope.
The vertical settlement values at the summits of each slope level were ascertained by extracting results from corresponding nodes within the finite element model, as exemplified in Figure 4. The sequence of vertical settlement values at the summits, progressing from the lowest level to the highest, is 8.93 mm, 16.81 mm, 21.26 mm, and 8.61 mm. These values were juxtaposed with the monitoring data, visually represented in Figure 5. The monitoring diagram delineates distinct locations: JC1 and JC2 at the apex of the first-level backfill slope, JC3, JC4, and JC5 atop the second-level backfill slope, JC6, JC7, and JC8 situated at the zenith of the third-level backfill slope, and JC9, JC10, and JC11 positioned on the crest of the fourth-level backfill slope. Scrutinizing the data encapsulated in Monitoring Table 2, it becomes apparent that as the elevation of the fill accumulates, the associated settlement values at each level’s summit progressively increase, albeit with diminishing rates of growth. Intriguingly, the summit with the most pronounced settlement is not aligned with the apex of the initial-level slope; rather, it emerges in proximity to the summits of the second and third levels. This intriguing trend mirrors the observations gleaned from finite element computations.

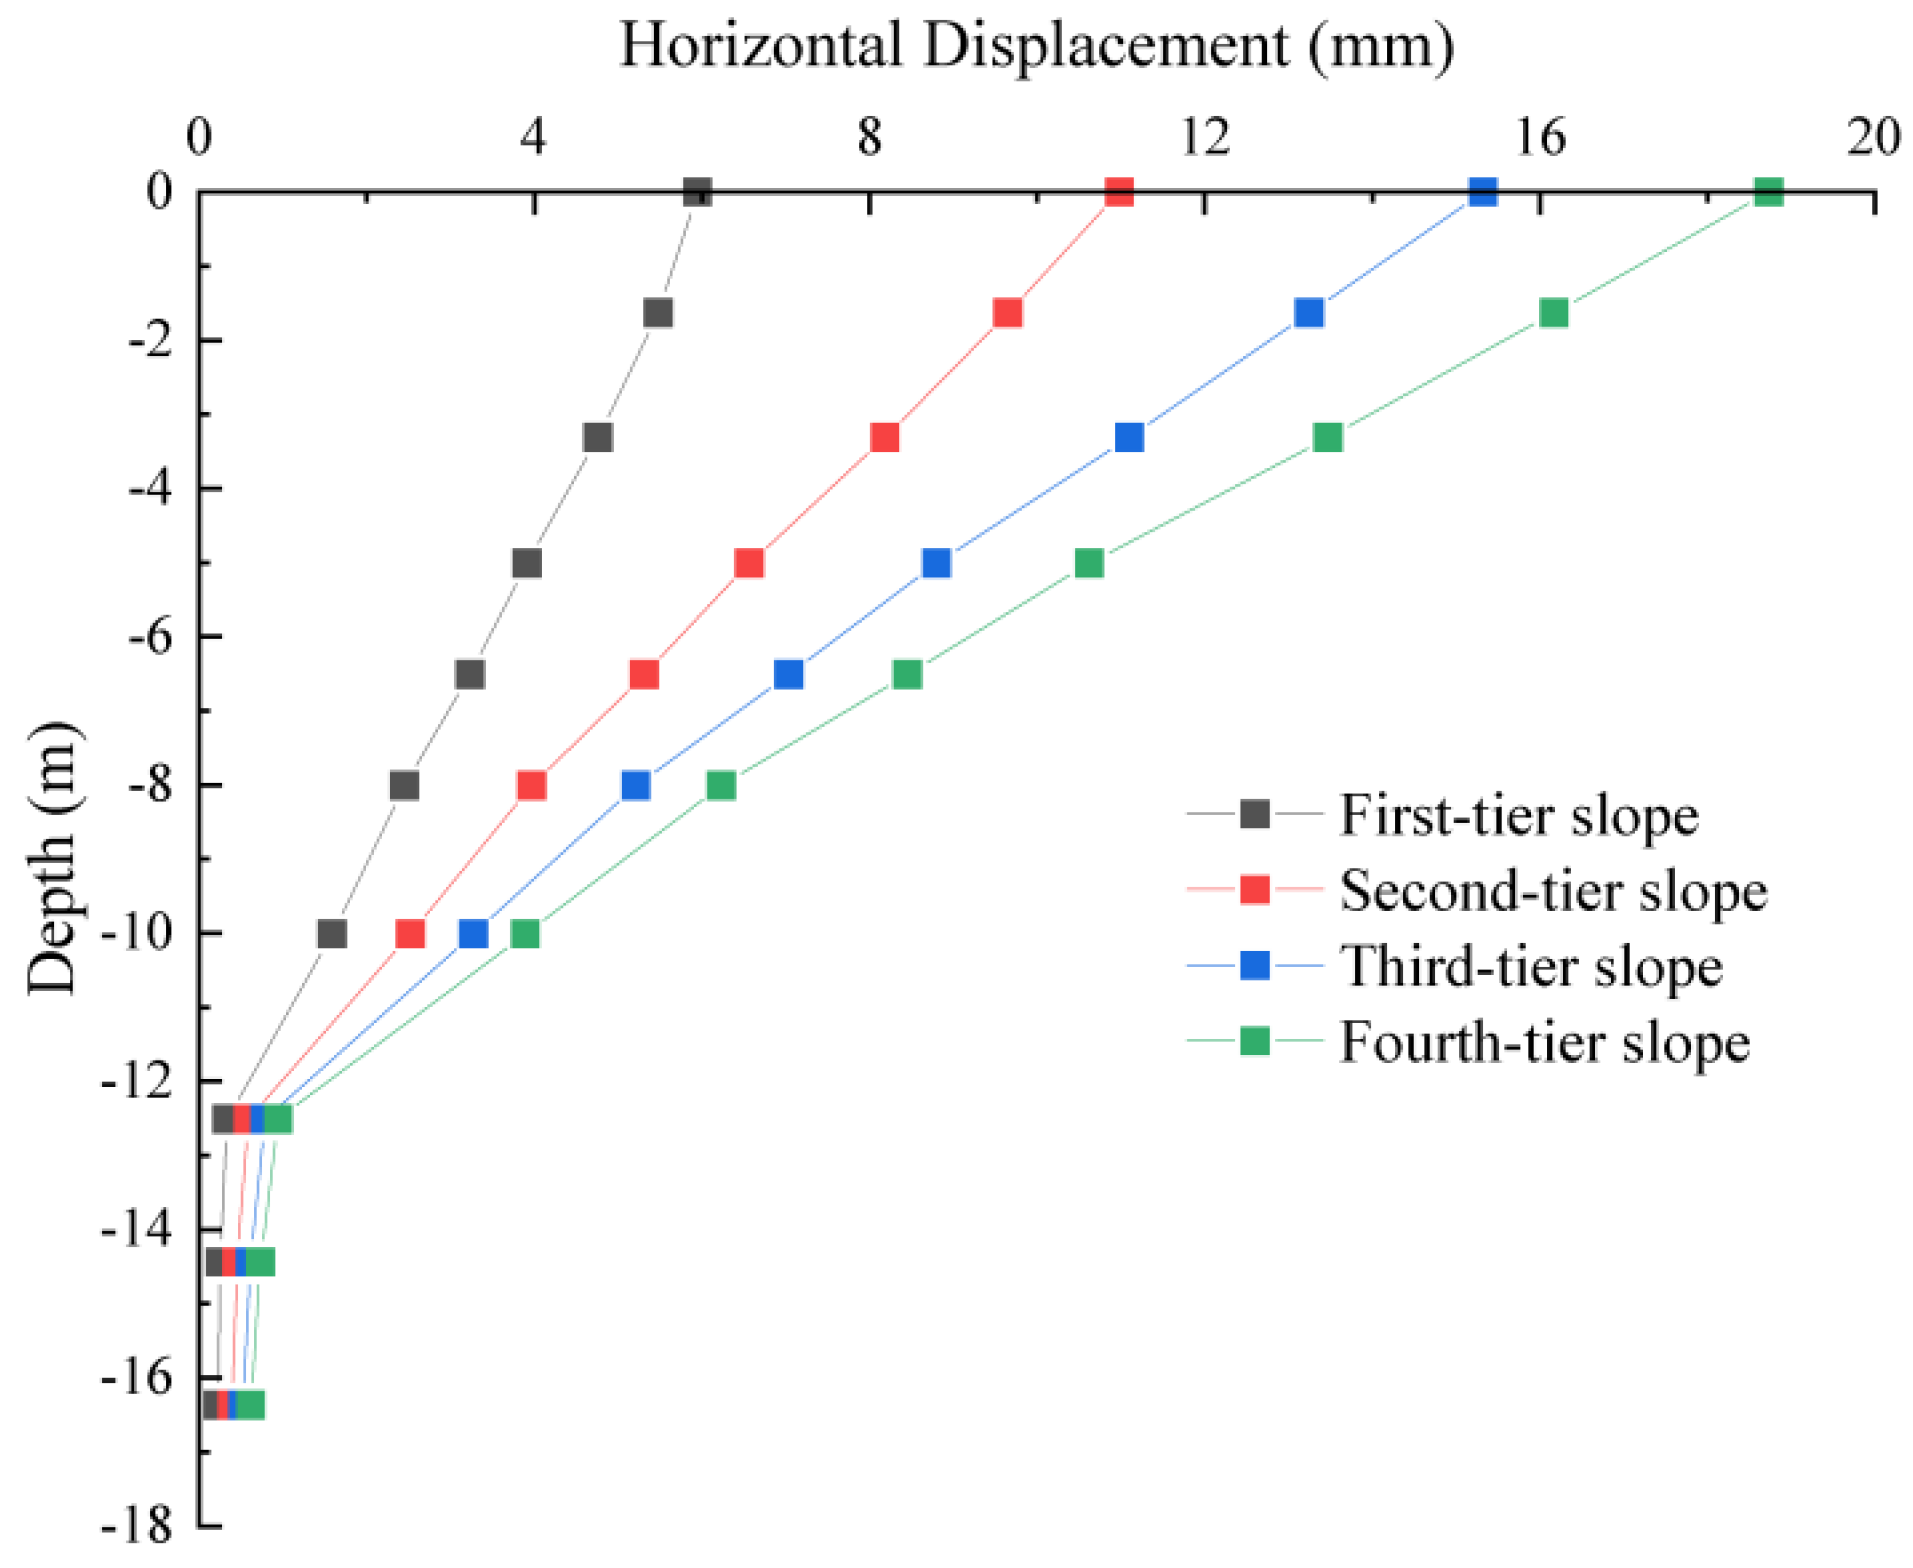
4.2. Slope Horizontal Displacement Analysis

Figure 6 displays the contour map of horizontal displacement for different construction stages of the backfilled slope. As the backfill height increases, the maximum horizontal displacement of the slope gradually grows. The horizontal displacements corresponding to each level of the slope are 8.6 mm, 19.14 mm, 31.61 mm, and 43.55 mm, respectively. With increasing backfill height, the location of the maximum horizontal displacement on the backfilled slope progressively shifts towards the rear. By the time the fourth-level backfill slope is reached, the point of maximum horizontal displacement has moved to the position corresponding to the slope bottom of the second-level slope platform.
Figure 7 presents a depth-wise profile of horizontal soil displacement at the slope toe. The horizontal displacement of the soil at the slope toe increases with the backfill height, although the growth rates vary. Taking the horizontal displacement at the slope toe during the first-level backfill as the reference, the horizontal displacements of the soil at the slope toe for each level of backfill are 5.95 mm, 10.98 mm, 15.32 mm, and 18.73 mm, respectively. The increments in horizontal displacement for each subsequent level of backfill are 84.65%, 39.53%, and 22.23%, respectively. This is due to the initially high porosity of the original soil. When subjected to backfill pressure, the porosity of the original soil decreases rapidly, the relative density of the soil gradually increases, and the bearing capacity of the soil gradually improves. As a result, more backfill pressure is required to produce unit displacement, leading to a gradual decrease in the rate of increase in horizontal displacement.
As depicted in Figure 8, the horizontal displacement values at the top of each slope level, from lowest to highest, are 26.73 mm, 15.25 mm, 4.86 mm, and 1.66 mm. A comparison between the finite element calculation results and the horizontal displacement monitoring values in Table 3 reveals that the maximum horizontal displacement occurs at the top of the first-level slope. With increasing backfill height, the horizontal displacement gradually decreases. The most minor horizontal displacement is observed at the top of the fourth-level slope. The pattern of horizontal displacement at the slope top is consistent with this trend.

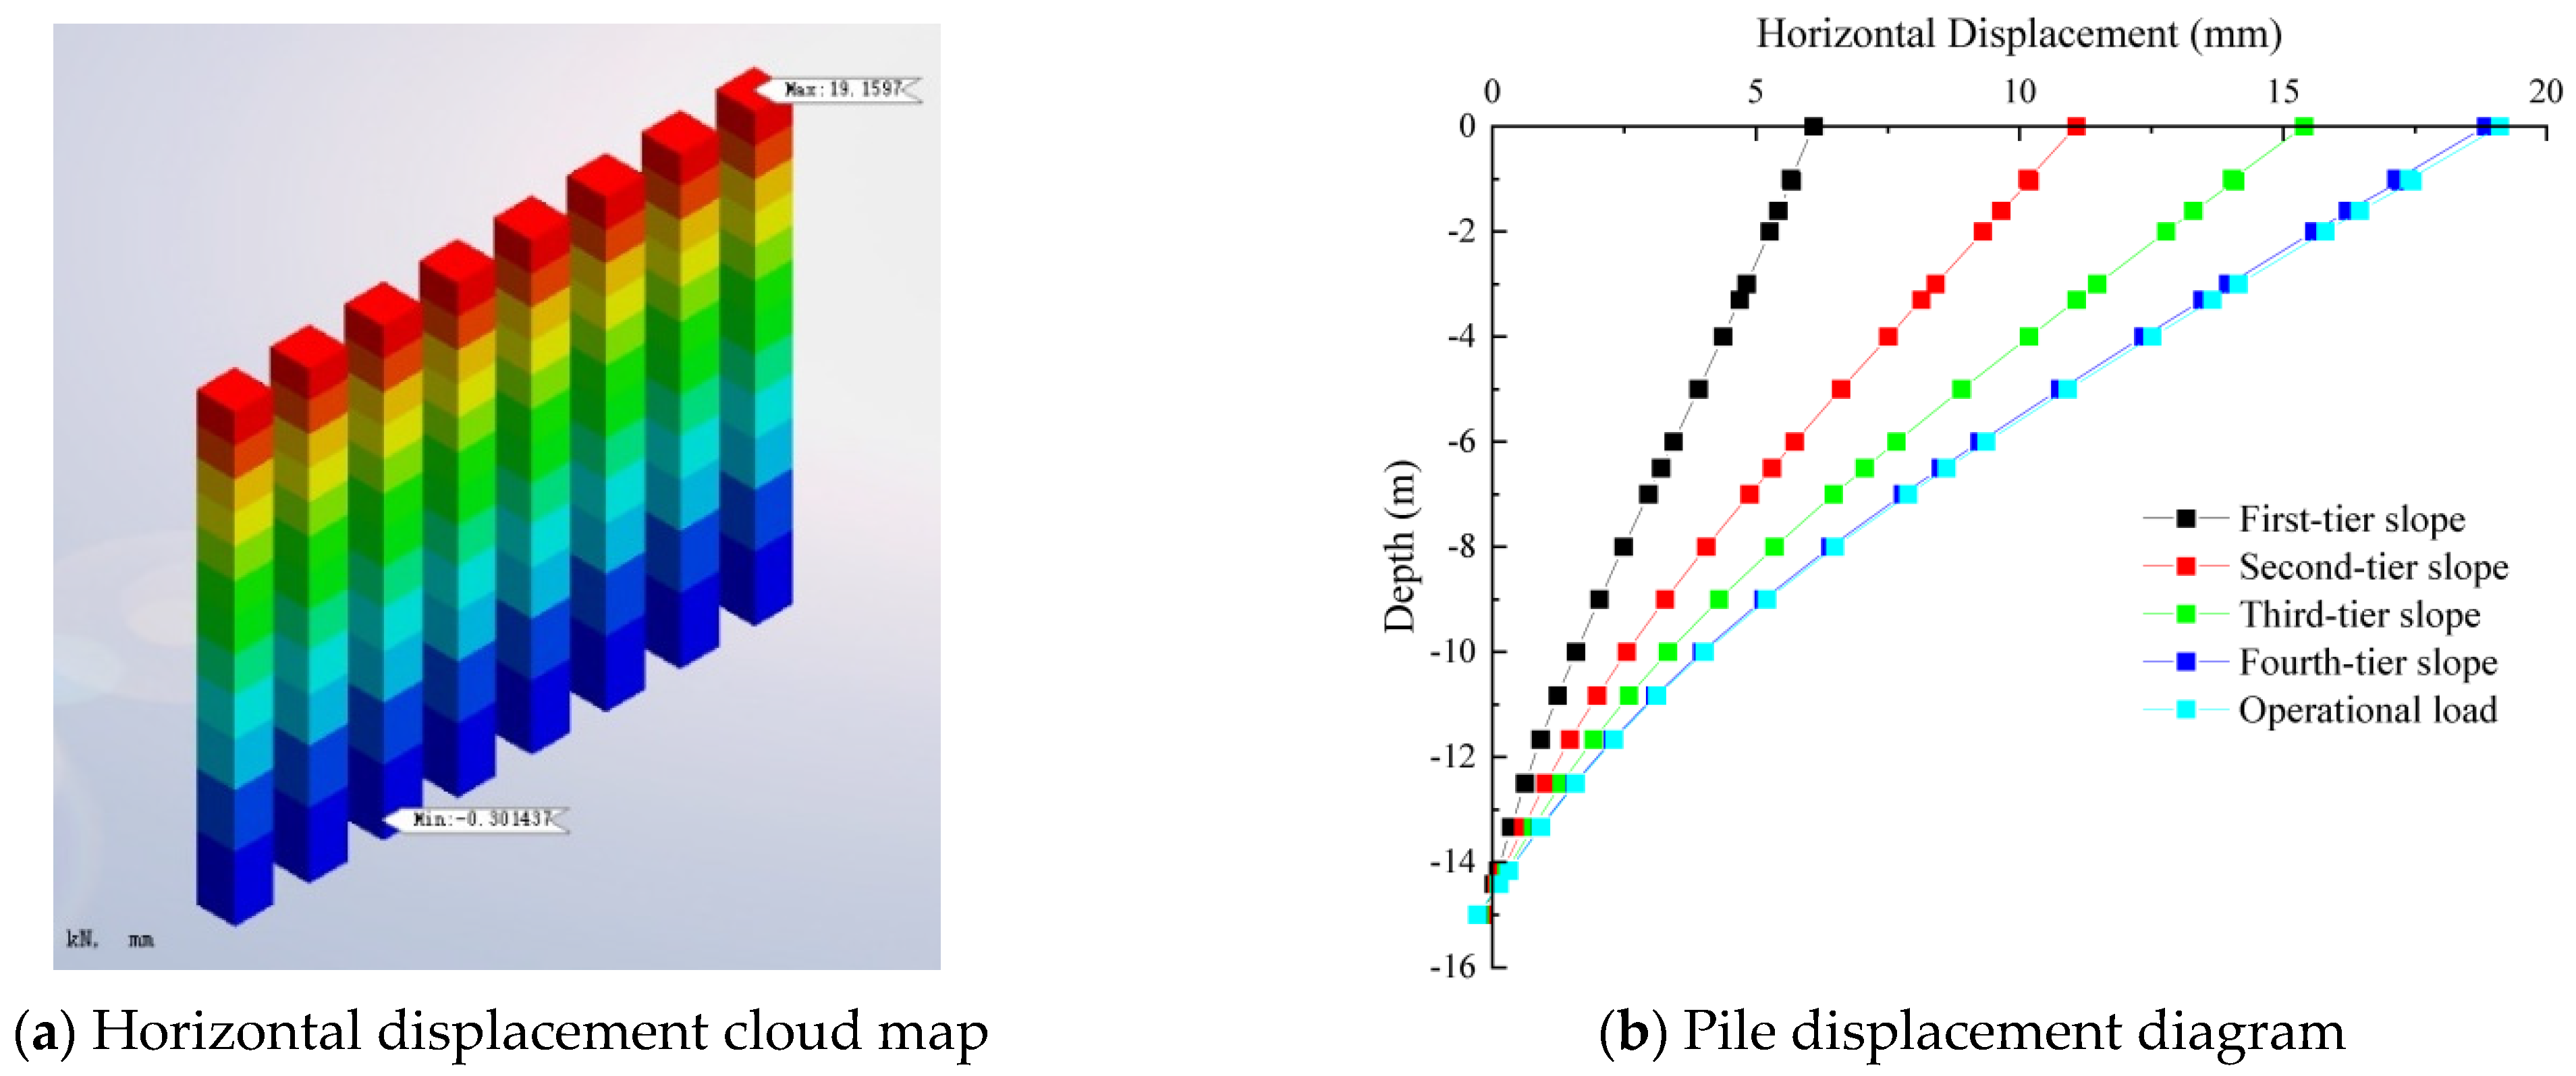
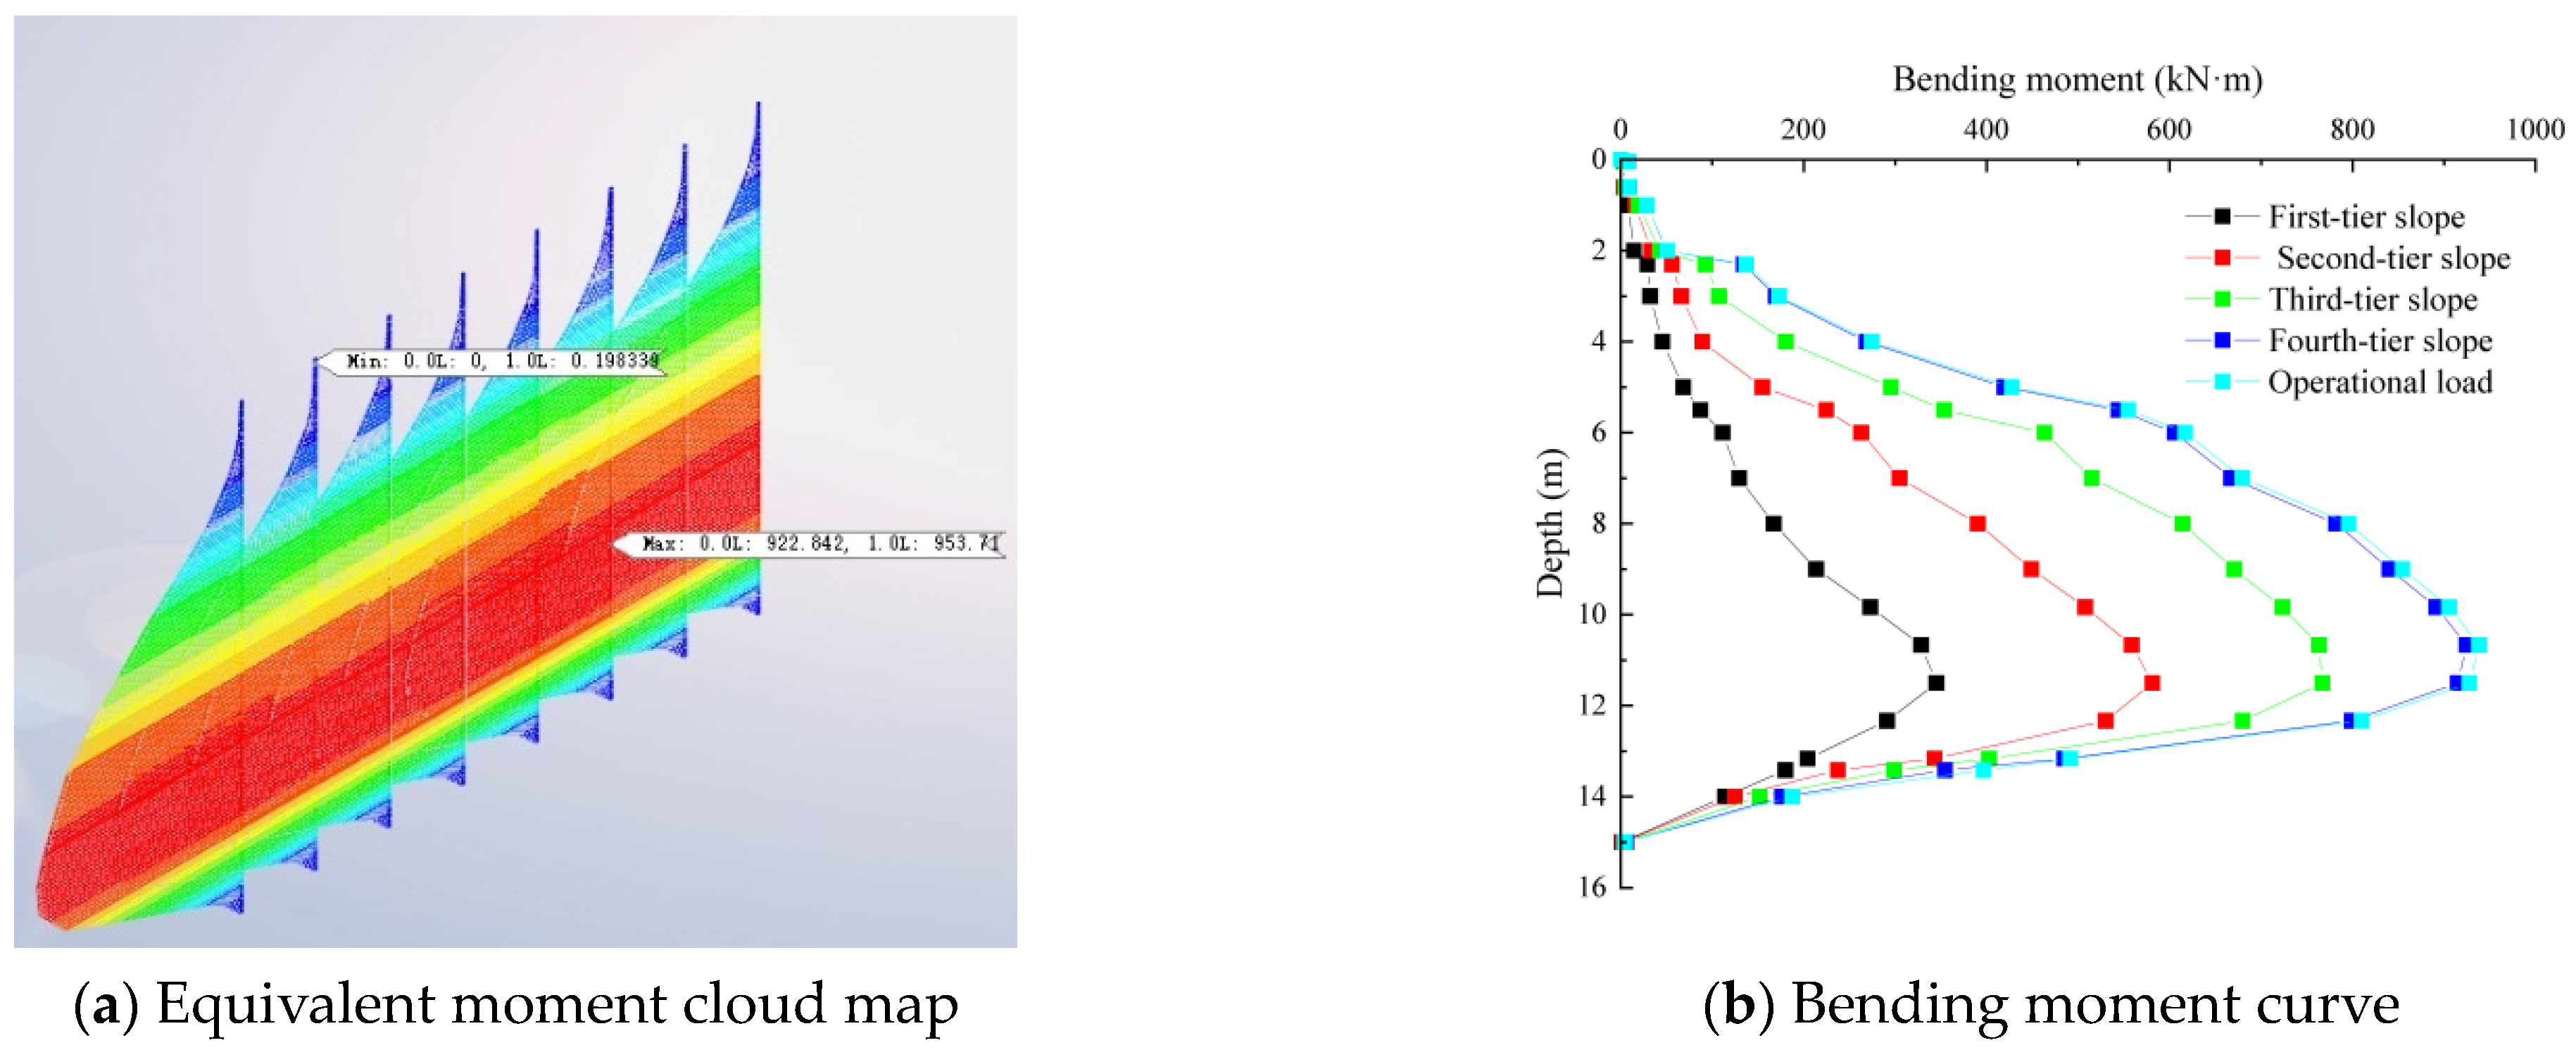
4.3. Analysis of Lateral Displacement and Bending Moment of Anti-Sliding Piles

Figure 9a illustrates the lateral displacement cloud map of the anti-sliding pile. It is evident from the diagram that the maximum lateral displacement of the anti-sliding pile occurs at the slope’s crest. The displacement gradually decreases along the pile from top to bottom, and negative values appear at the pile’s base. This phenomenon is attributed to the anti-sliding pile embedded in moderately weathered granite strata, relying on the stratum’s lateral resistance to restrain the slope’s displacement. The direction of the lateral resistance results in a horizontally rightward reverse displacement near the pile’s base. As depicted in Figure 9b, during the backfilling of the first-level slope, the lateral displacement of the pile’s body from bottom to top increases approximately linearly. However, with the increase in fill height, the pile’s displacement shifts from linear to non-linear. The horizontal displacements of the anti-sliding pile’s top and base are presented in Table 4. As the backfilling construction stages progress, the increment of lateral displacement at the pile’s top diminishes successively with each incremental fill height. The growth values of lateral displacement at the anti-sliding pile’s top, influenced by various slope levels, are 4.96 mm, 4.33 mm, and 3.48 mm, respectively.
In Figure 10a, the contour map illustrates the distribution of bending moments along the depth of the anti-slide pile. Notably, a discernible trend emerges wherein the bending moment of the pile escalates in tandem with its depth of embedment within the soil. This escalating trend culminates in the attainment of the maximum bending moment at a depth of approximately 12 m, coinciding with the segment anchored within the moderately weathered granite. Progressing beyond this depth, the bending moment experiences a rapid descent, ultimately converging towards zero at the base of the pile. Figure 10b further illuminates that as the height of backfilling advances, a corresponding increase unfolds in the maximum bending moment sustained by the anti-slide pile. This positive correlation between backfilling height and maximum bending moment is evident. However, the magnitude of the increase diminishes as the backfilling height continues to rise. For instance, upon the initial application of the first-level backfilling, the anti-slide pile registers a maximum bending moment of 345.09 kN·m. As successive backfilling stages and highway loads come into play, the hierarchy of maximum bending moments linked to each backfilling level and highway load configuration unfolds as follows: 581.12 kN·m, 767.02 kN·m, 914.79 kN·m, and 927.68 kN·m. A keen observation unveils that the escalation rates of maximum bending moments manifest as 40.81%, 13.92%, 6.87%, and 2.07% in a successive manner. This is because the anti-slide piles are arranged at the bottom of the slope. When backfilling the first stage of the slope, the surface of the slope is closest to the anti-slide piles at this time and thus has the greatest impact on them. Subsequently, due to the presence of the slope platform, the backfilled slopes and the road load become increasingly distant from the position of the anti-slide piles, resulting in a diminished impact on the anti-slide piles.

5. Analysis of Factors Affecting High Backfilled Slope Reinforced by Anti-Sliding Piles

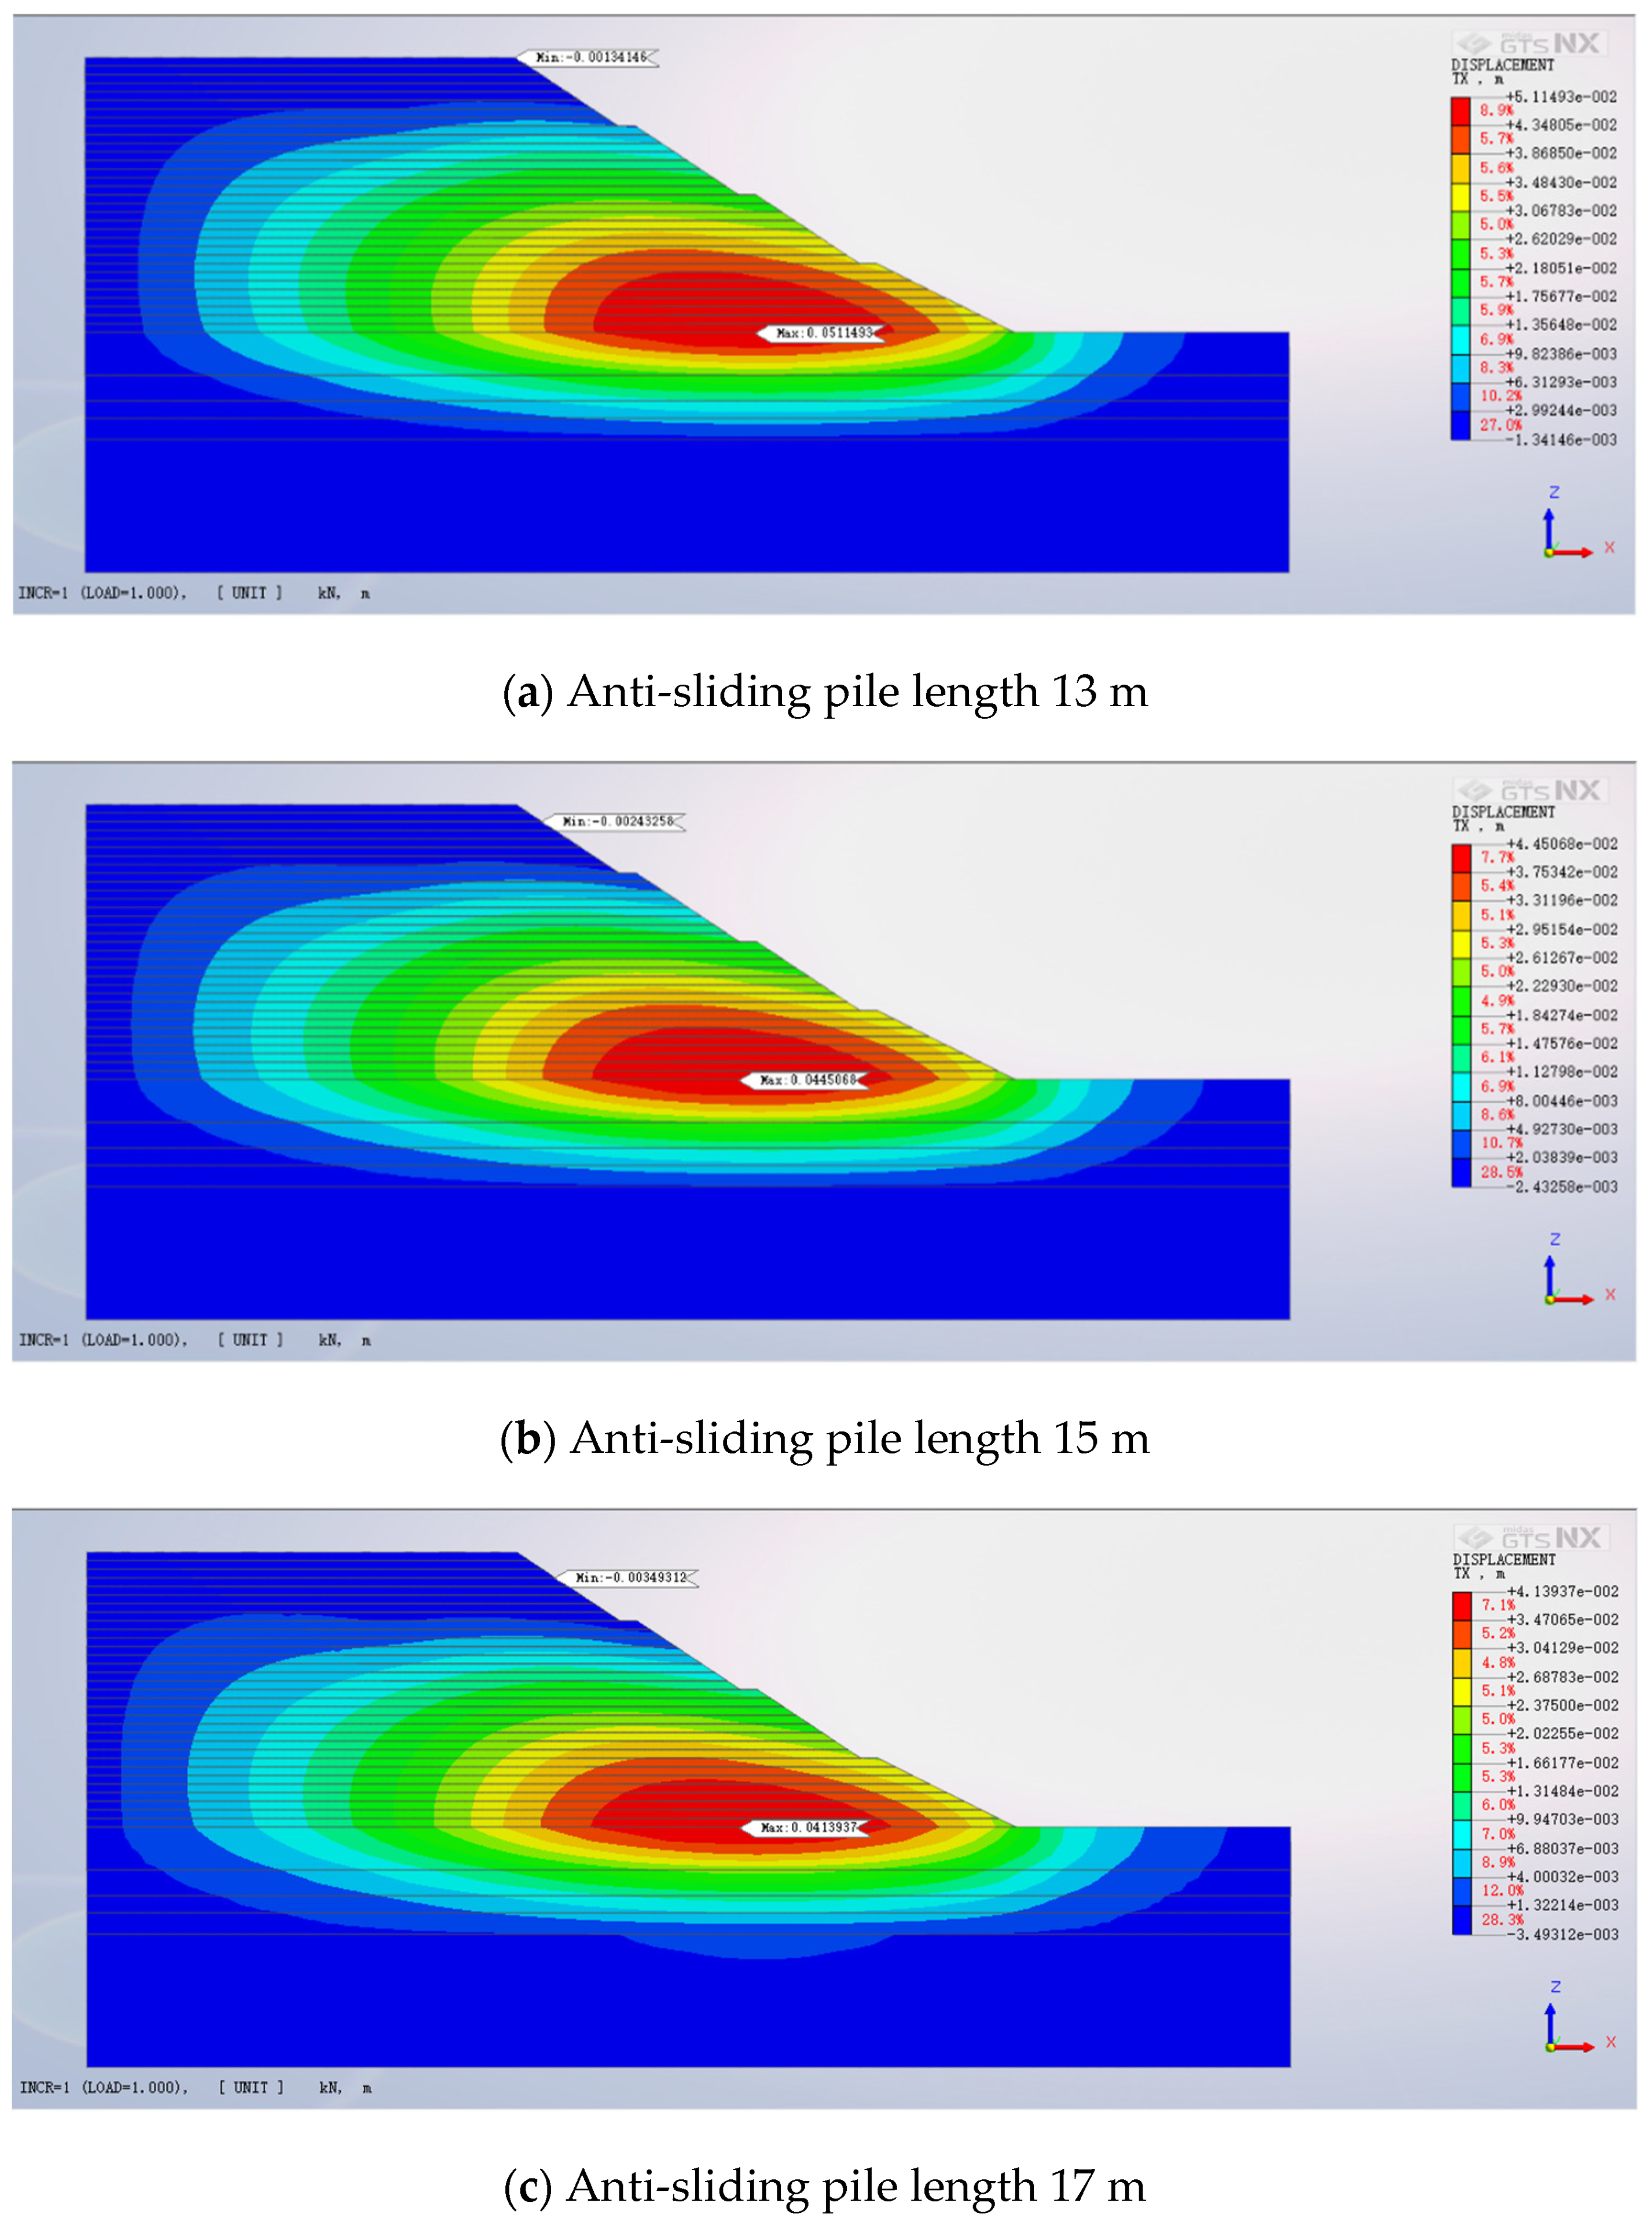
5.1. Influence of Anti-Sliding Pile Length on High Backfilled Slope

Various pile lengths, precisely 13 m, 15 m, and 17 m, were selected for the anti-slide piles, all possessing a consistent diameter of 1.5 m and an equidistant spacing of 2.5 m. While keeping all other parameters uniform, three distinct finite element models were devised to represent the backfill slope. The contour map in Figure 11 provides a visualization of the horizontal displacement across these models, highlighting the discrepancies resulting from the differing pile lengths. For the scenario where the pile length is 13 m, equating to a depth of rock embedding at 0.5 m (within the mid-level weathered granite), the utmost horizontal displacement of the backfill slope measures 51.11 mm. Upon extending the pile length to 15 m, a noteworthy reduction in maximum horizontal displacement emerges, dwindling to 44.48 mm—a decrement of 6.63 mm when juxtaposed with the 13 m pile length. In the case of a 17 m pile length, the trifling horizontal displacement is noted at 41.39 mm, signifying a diminution of 3.09 mm relative to the 15 m pile length. Upon meticulous evaluation of both the spectrum of horizontal displacement variance and the economic considerations, the 15 m pile length emerges as the paramount selection for the anti-slide pile configuration, prominently fostering the stabilization of the backfill slope.

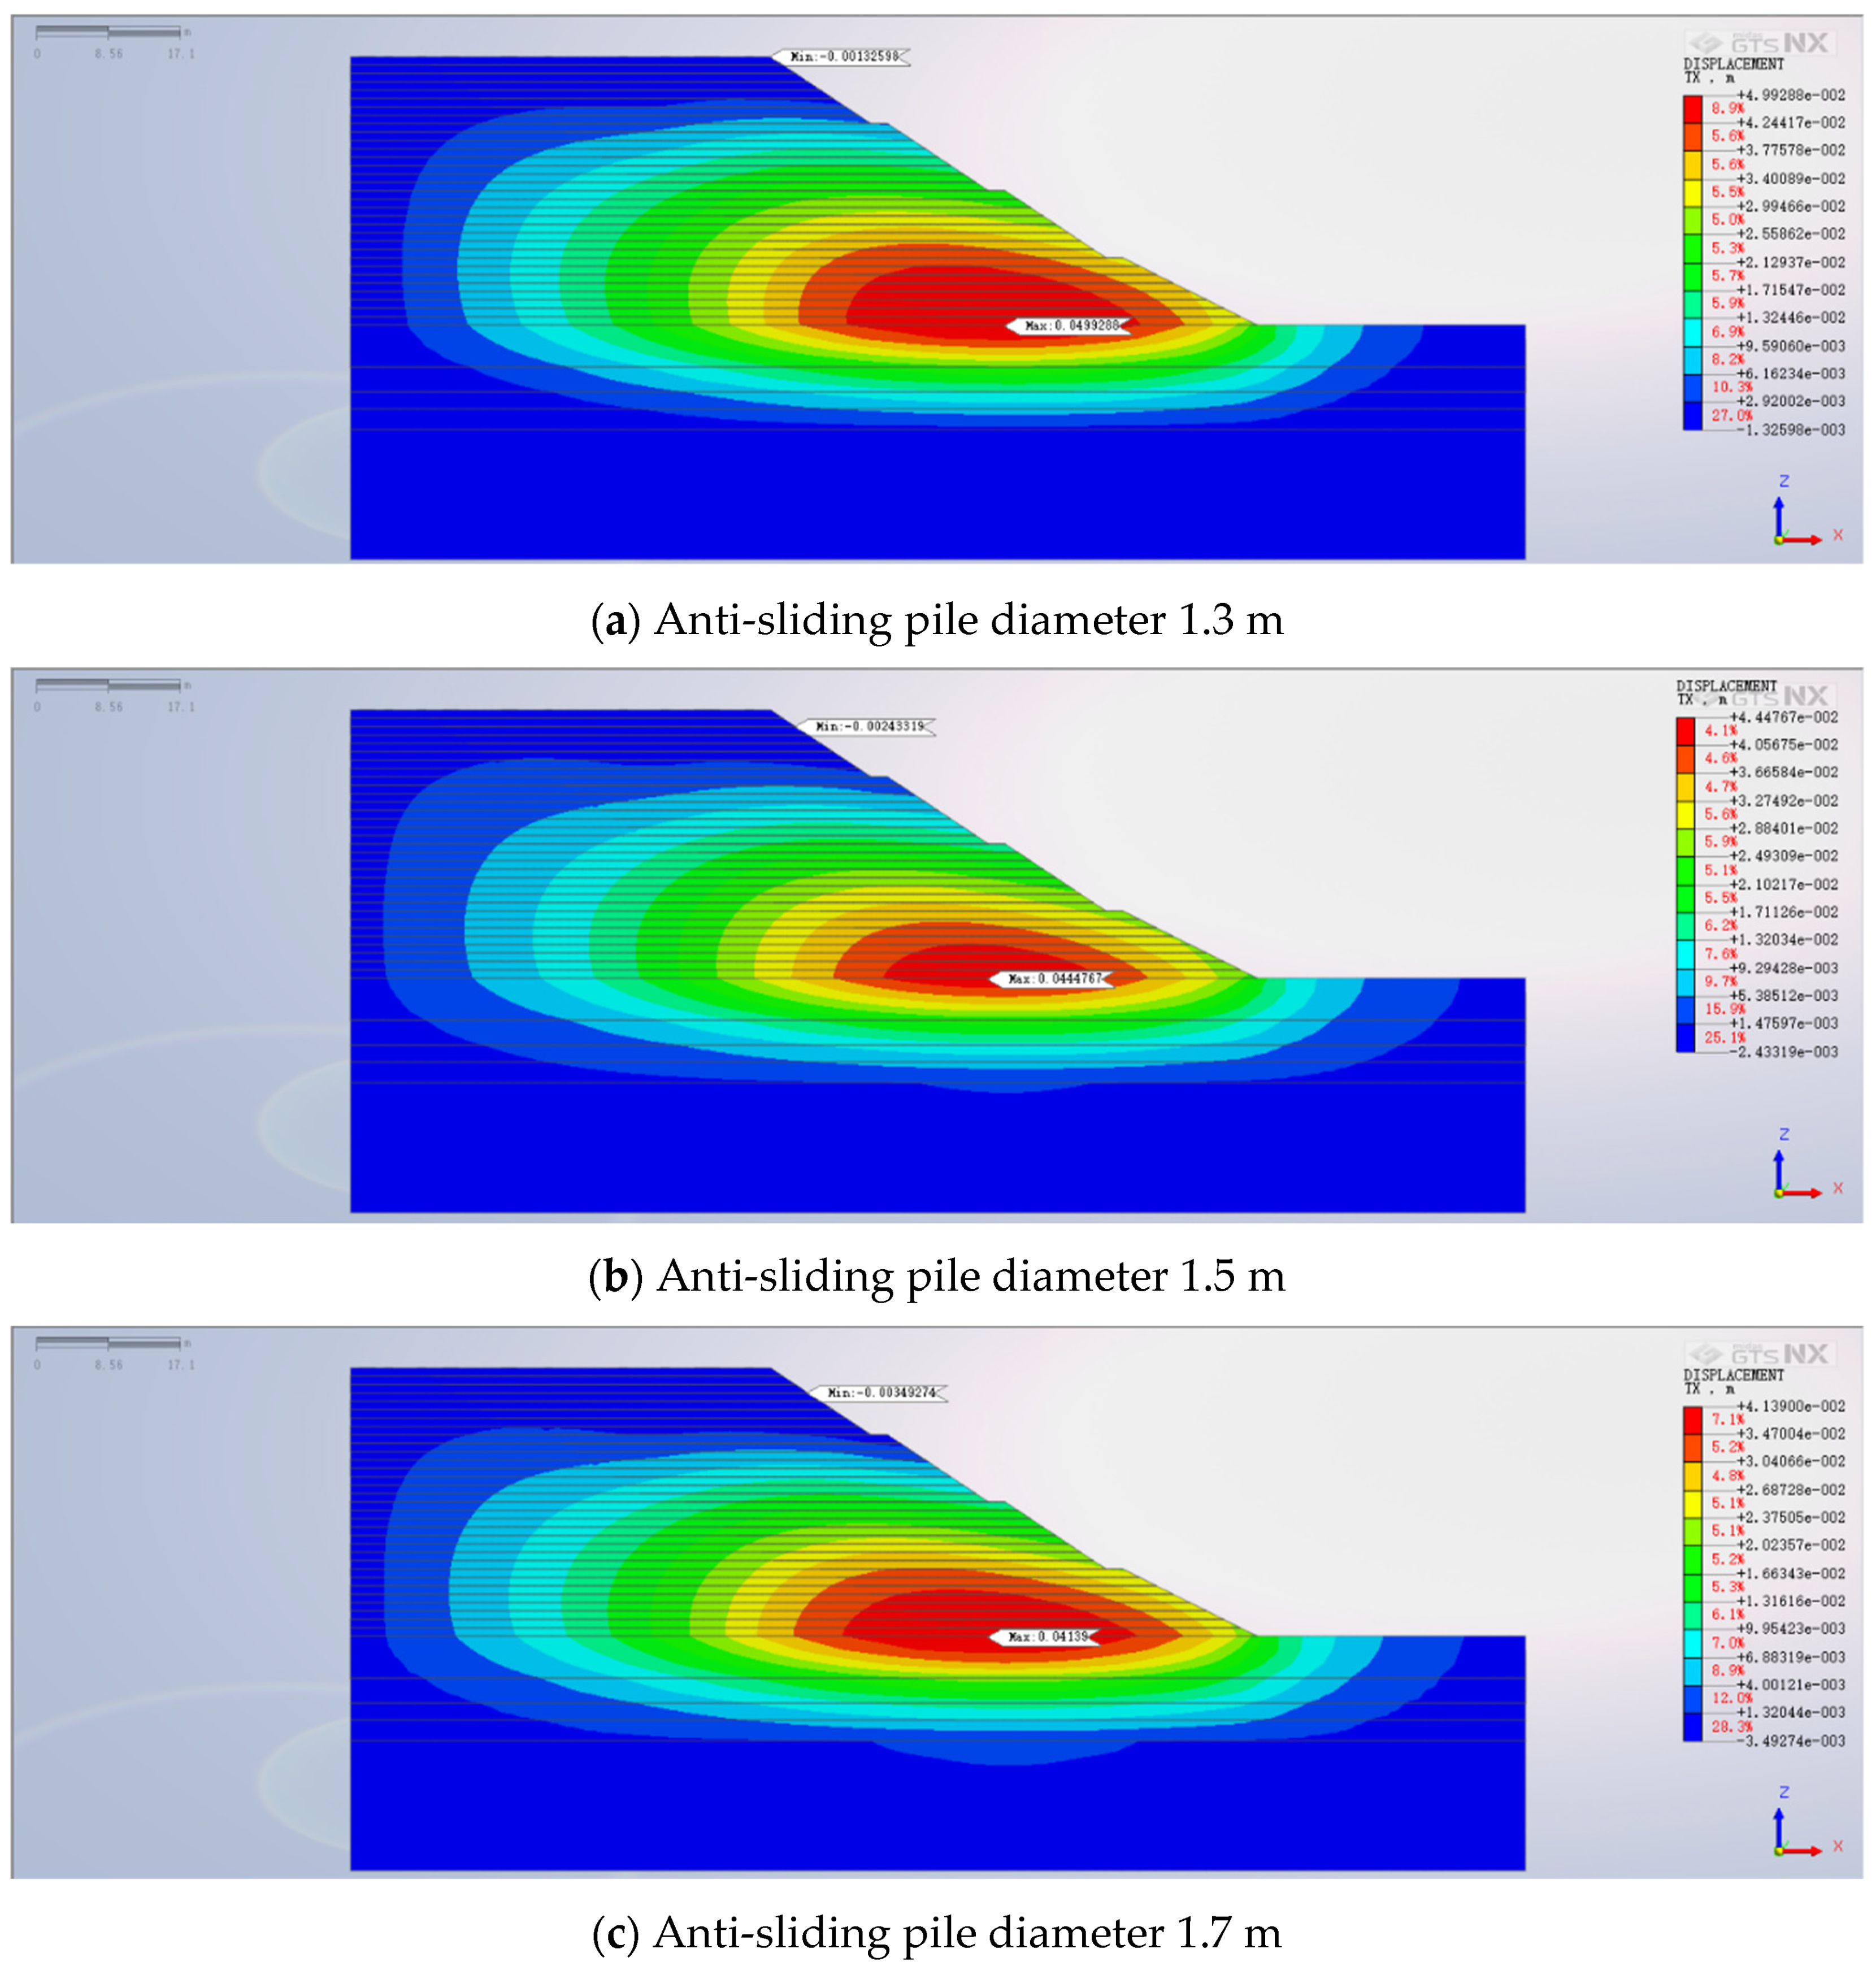
5.2. Impact of Pile Diameter on High Backfill Slope Reinforced with Anti-slide Piles

A constant pile length of 15 m and a uniform spacing of 2.5 m were maintained, while three distinct pile diameters—1.3 m, 1.5 m, and 1.7 m—were chosen for the anti-slide piles. The remaining parameters were kept constant. Figure 12 shows a contour map outlining the resultant horizontal displacement patterns across the high backfill slope fortified with anti-slide piles of varying diameters. Inspection of Figure 12 reveals that the maximum horizontal displacements corresponding to the three distinct pile diameters—ranging from most minor to most significant—are 49.93 mm, 44.48 mm, and 41.39 mm. As the diameter of the anti-slide piles expands, their efficacy in countering bending deformation improves, thereby enhancing their capacity to curtail soil deformation and gradually tempering the magnitude of horizontal slope displacement. However, the extent of reduction in horizontal displacement fluctuates with each increase in pile diameter. Upon increasing the pile diameter from 1.3 m to 1.5 m, the ultimate horizontal displacement diminishes by 5.45 mm. In contrast, when elevating the pile diameter from 1.5 m to 1.7 m, the reduction in final horizontal displacement narrows to 3.09 mm. This observation underscores that the decline in horizontal soil displacement becomes less pronounced with each successive augmentation in pile diameter. Considering both the gamut of horizontal displacement variation and economic feasibility considerations, the most judicious selection for the anti-slide pile diameter, in terms of optimizing backfill slope stability, is 1.5 m.

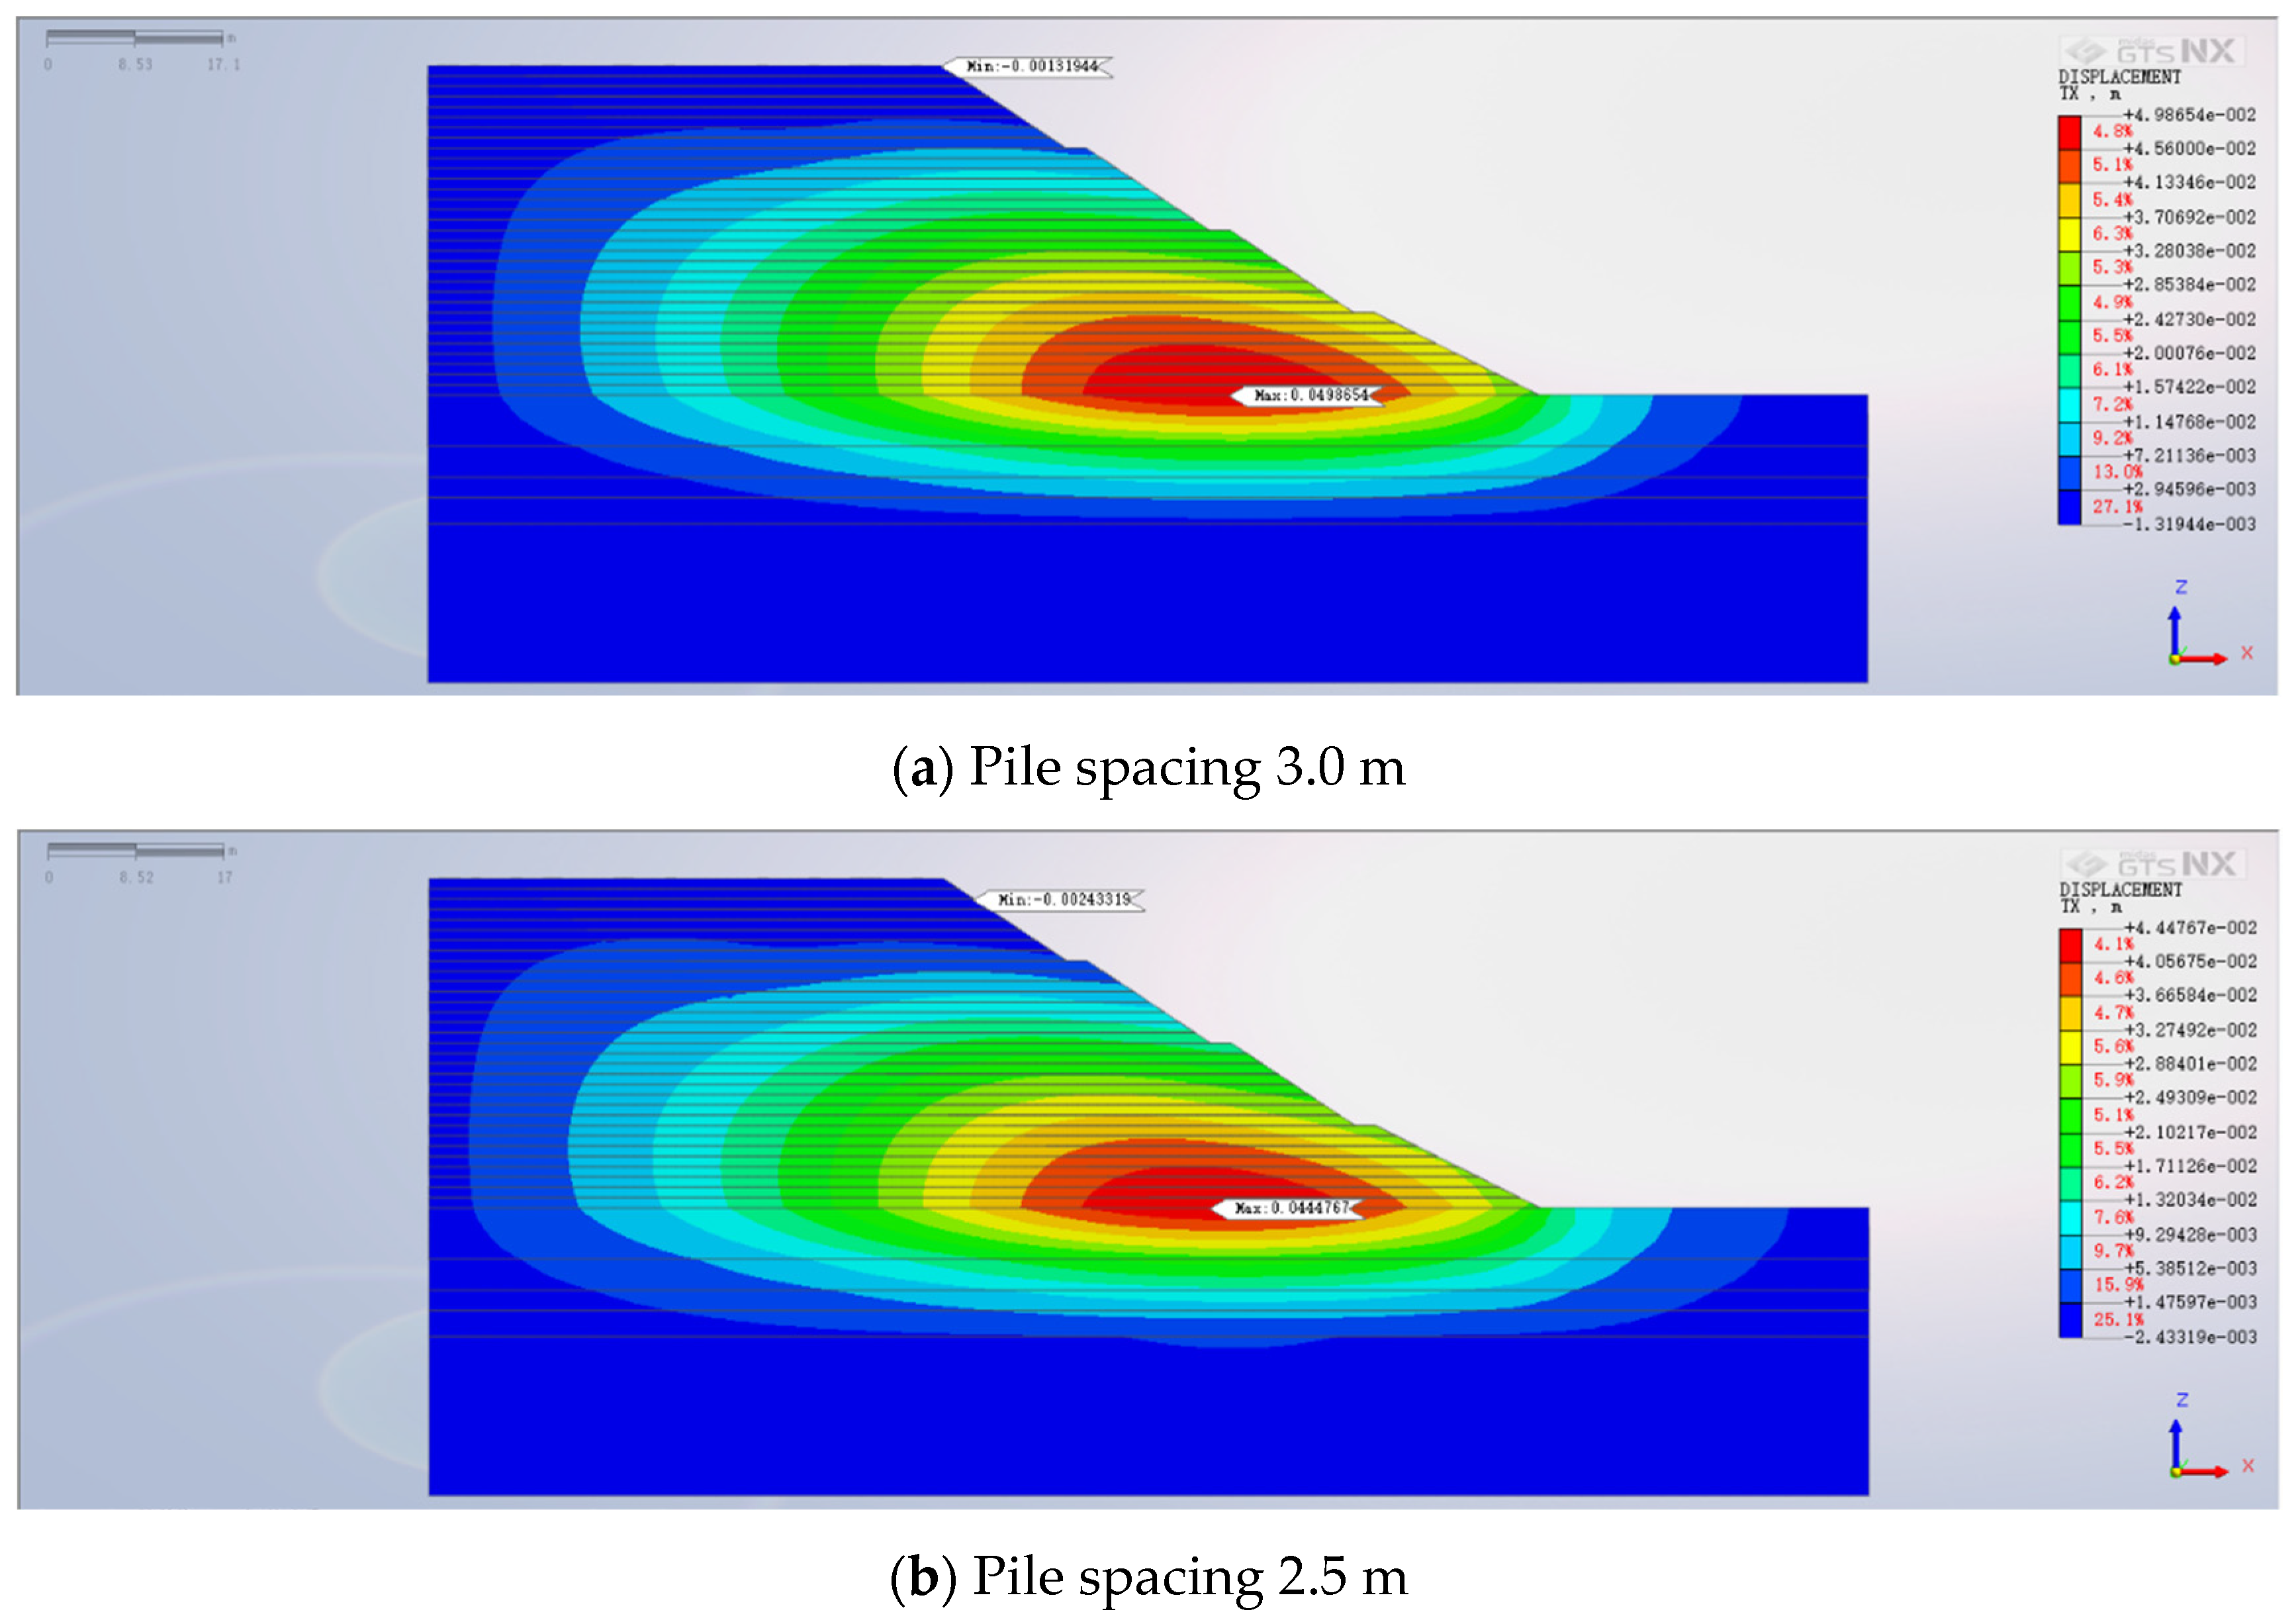
5.3. Impact of Pile Spacing on High Backfill Slope Reinforced with Anti-Slide Piles

With an optimal pile length of 15 m and a pile diameter of 1.5 m, the study explores the impact of varying pile spacings on the reinforced high backfill slope. Analyzing pile spacings of 2 m, 2.5 m, and 3 m while keeping other parameters consistent, Figure 13 presents a contour map illustrating the eventual horizontal displacement pattern for the high backfill slope strengthened with anti-slide piles of different spacings. Figure 13 unmistakably showcases the maximum horizontal displacements corresponding to the three distinct pile spacings, sequentially ranging from smallest to largest, at 49.87 mm, 44.48 mm, and 40.41 mm. The horizontal displacement of the slope decreases as the spacing between anti-slide piles is reduced, and the rate of decrease gradually slows down. When the distance between the piles is larger, the supporting effect of the piles is significantly reduced, allowing the soil to move laterally between the piles, which greatly weakens the anti-sliding capacity and reduces the stability of the slope. This is because when the spacing between the piles is reduced, the soil arching effect is significantly enhanced. However, as the spacing continues to decrease, the rate of reduction becomes smaller due to the marginal effect. The equilibrium between support enhancement and construction cost must be carefully considered. Deliberating both the spectrum of horizontal displacement fluctuation and the balance of cost-effectiveness, the most judicious decision for anti-slide pile spacing, in terms of optimizing backfill slope stability, is 2.5 m. Due to the fact that the results from two-dimensional finite element software cannot intuitively demonstrate the nonlinear relationship between pile spacing and the safety factor of slope stability, the investigation into the relationship between pile spacing and horizontal displacement of the slope using MIDAS.GTS.NX shows that as the pile spacing decreases, the reduction in horizontal displacement of the slope diminishes. This outcome more intuitively aids in determining the choice of pile spacing in engineering projects, making it more valuable for setting pile spacing from an economic perspective in actual engineering projects.

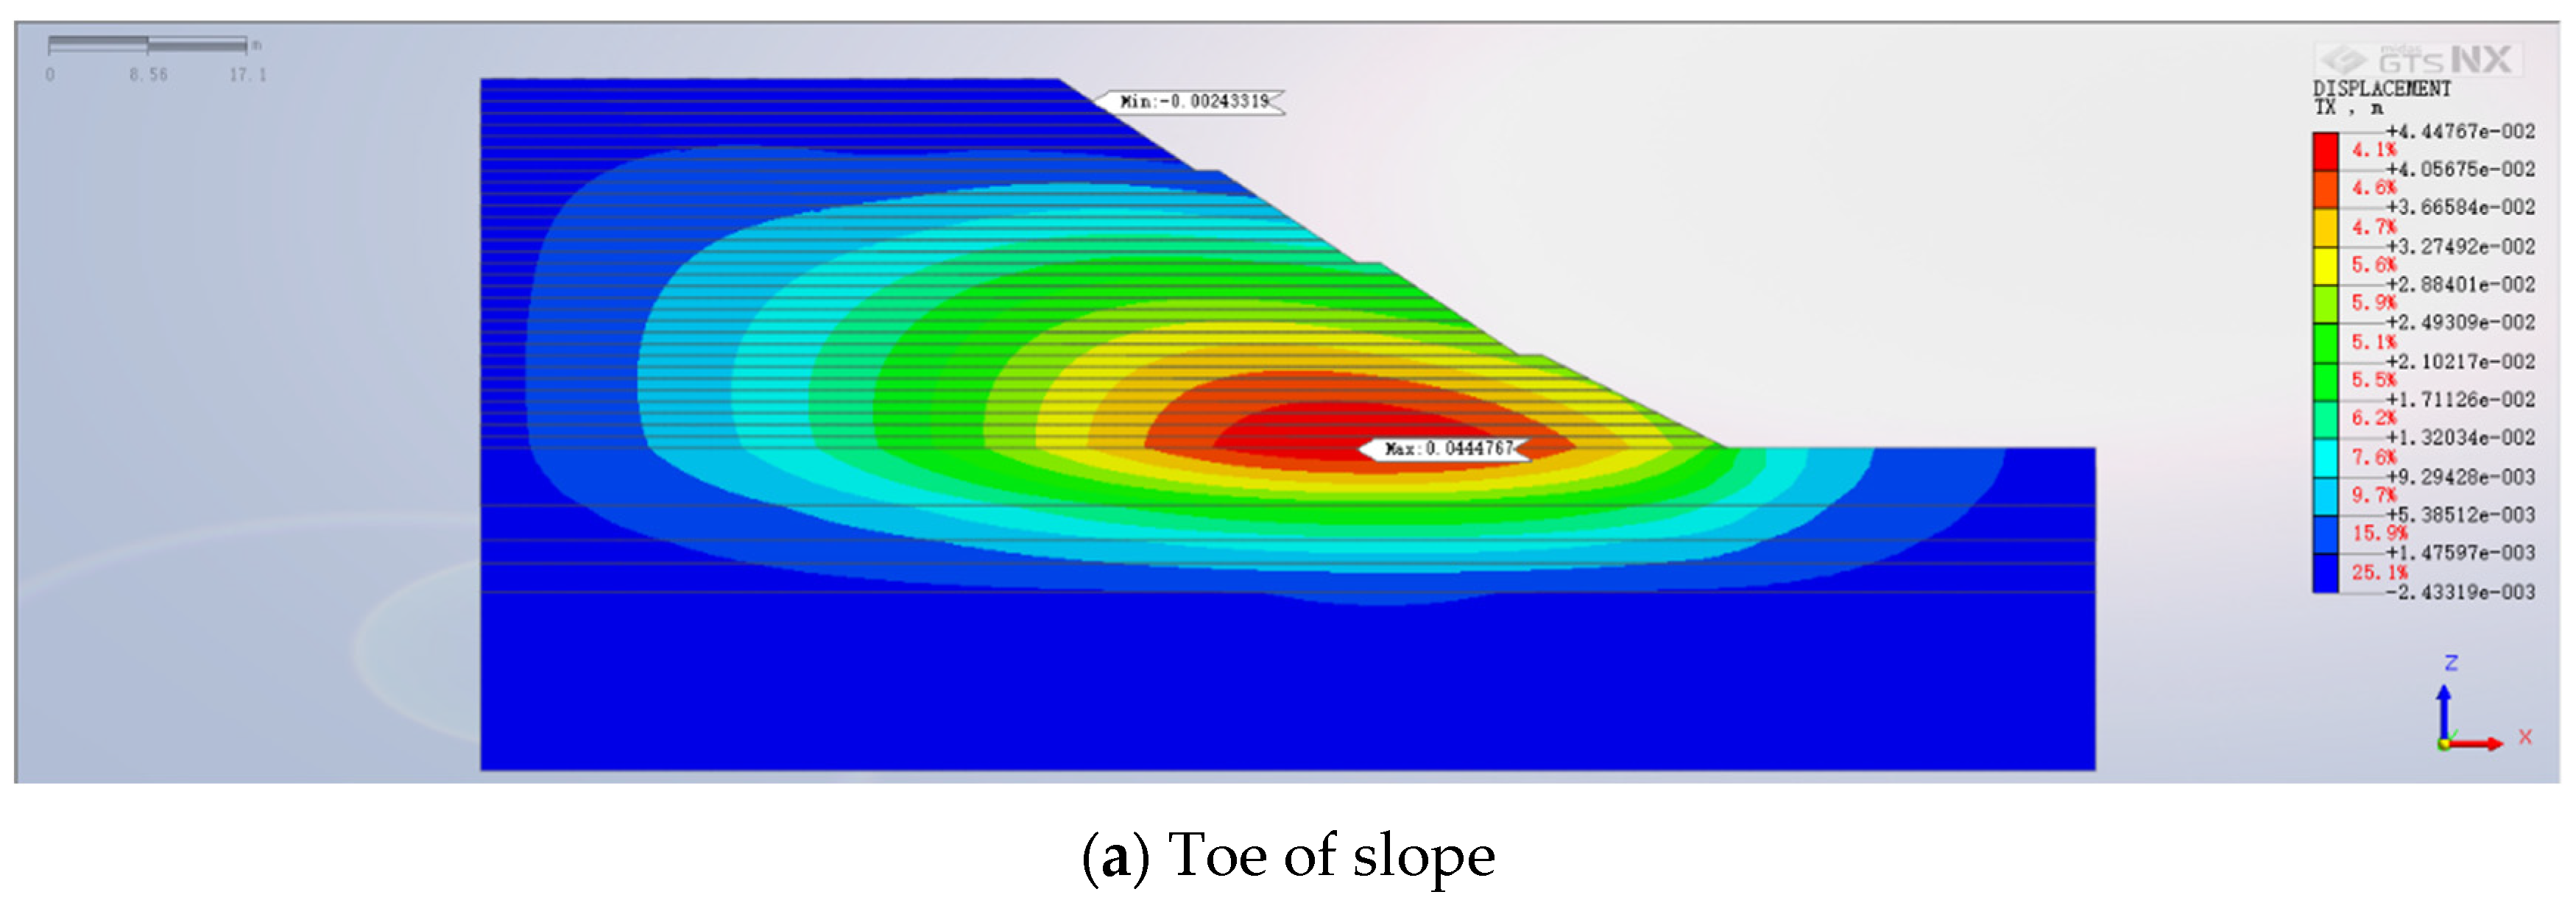
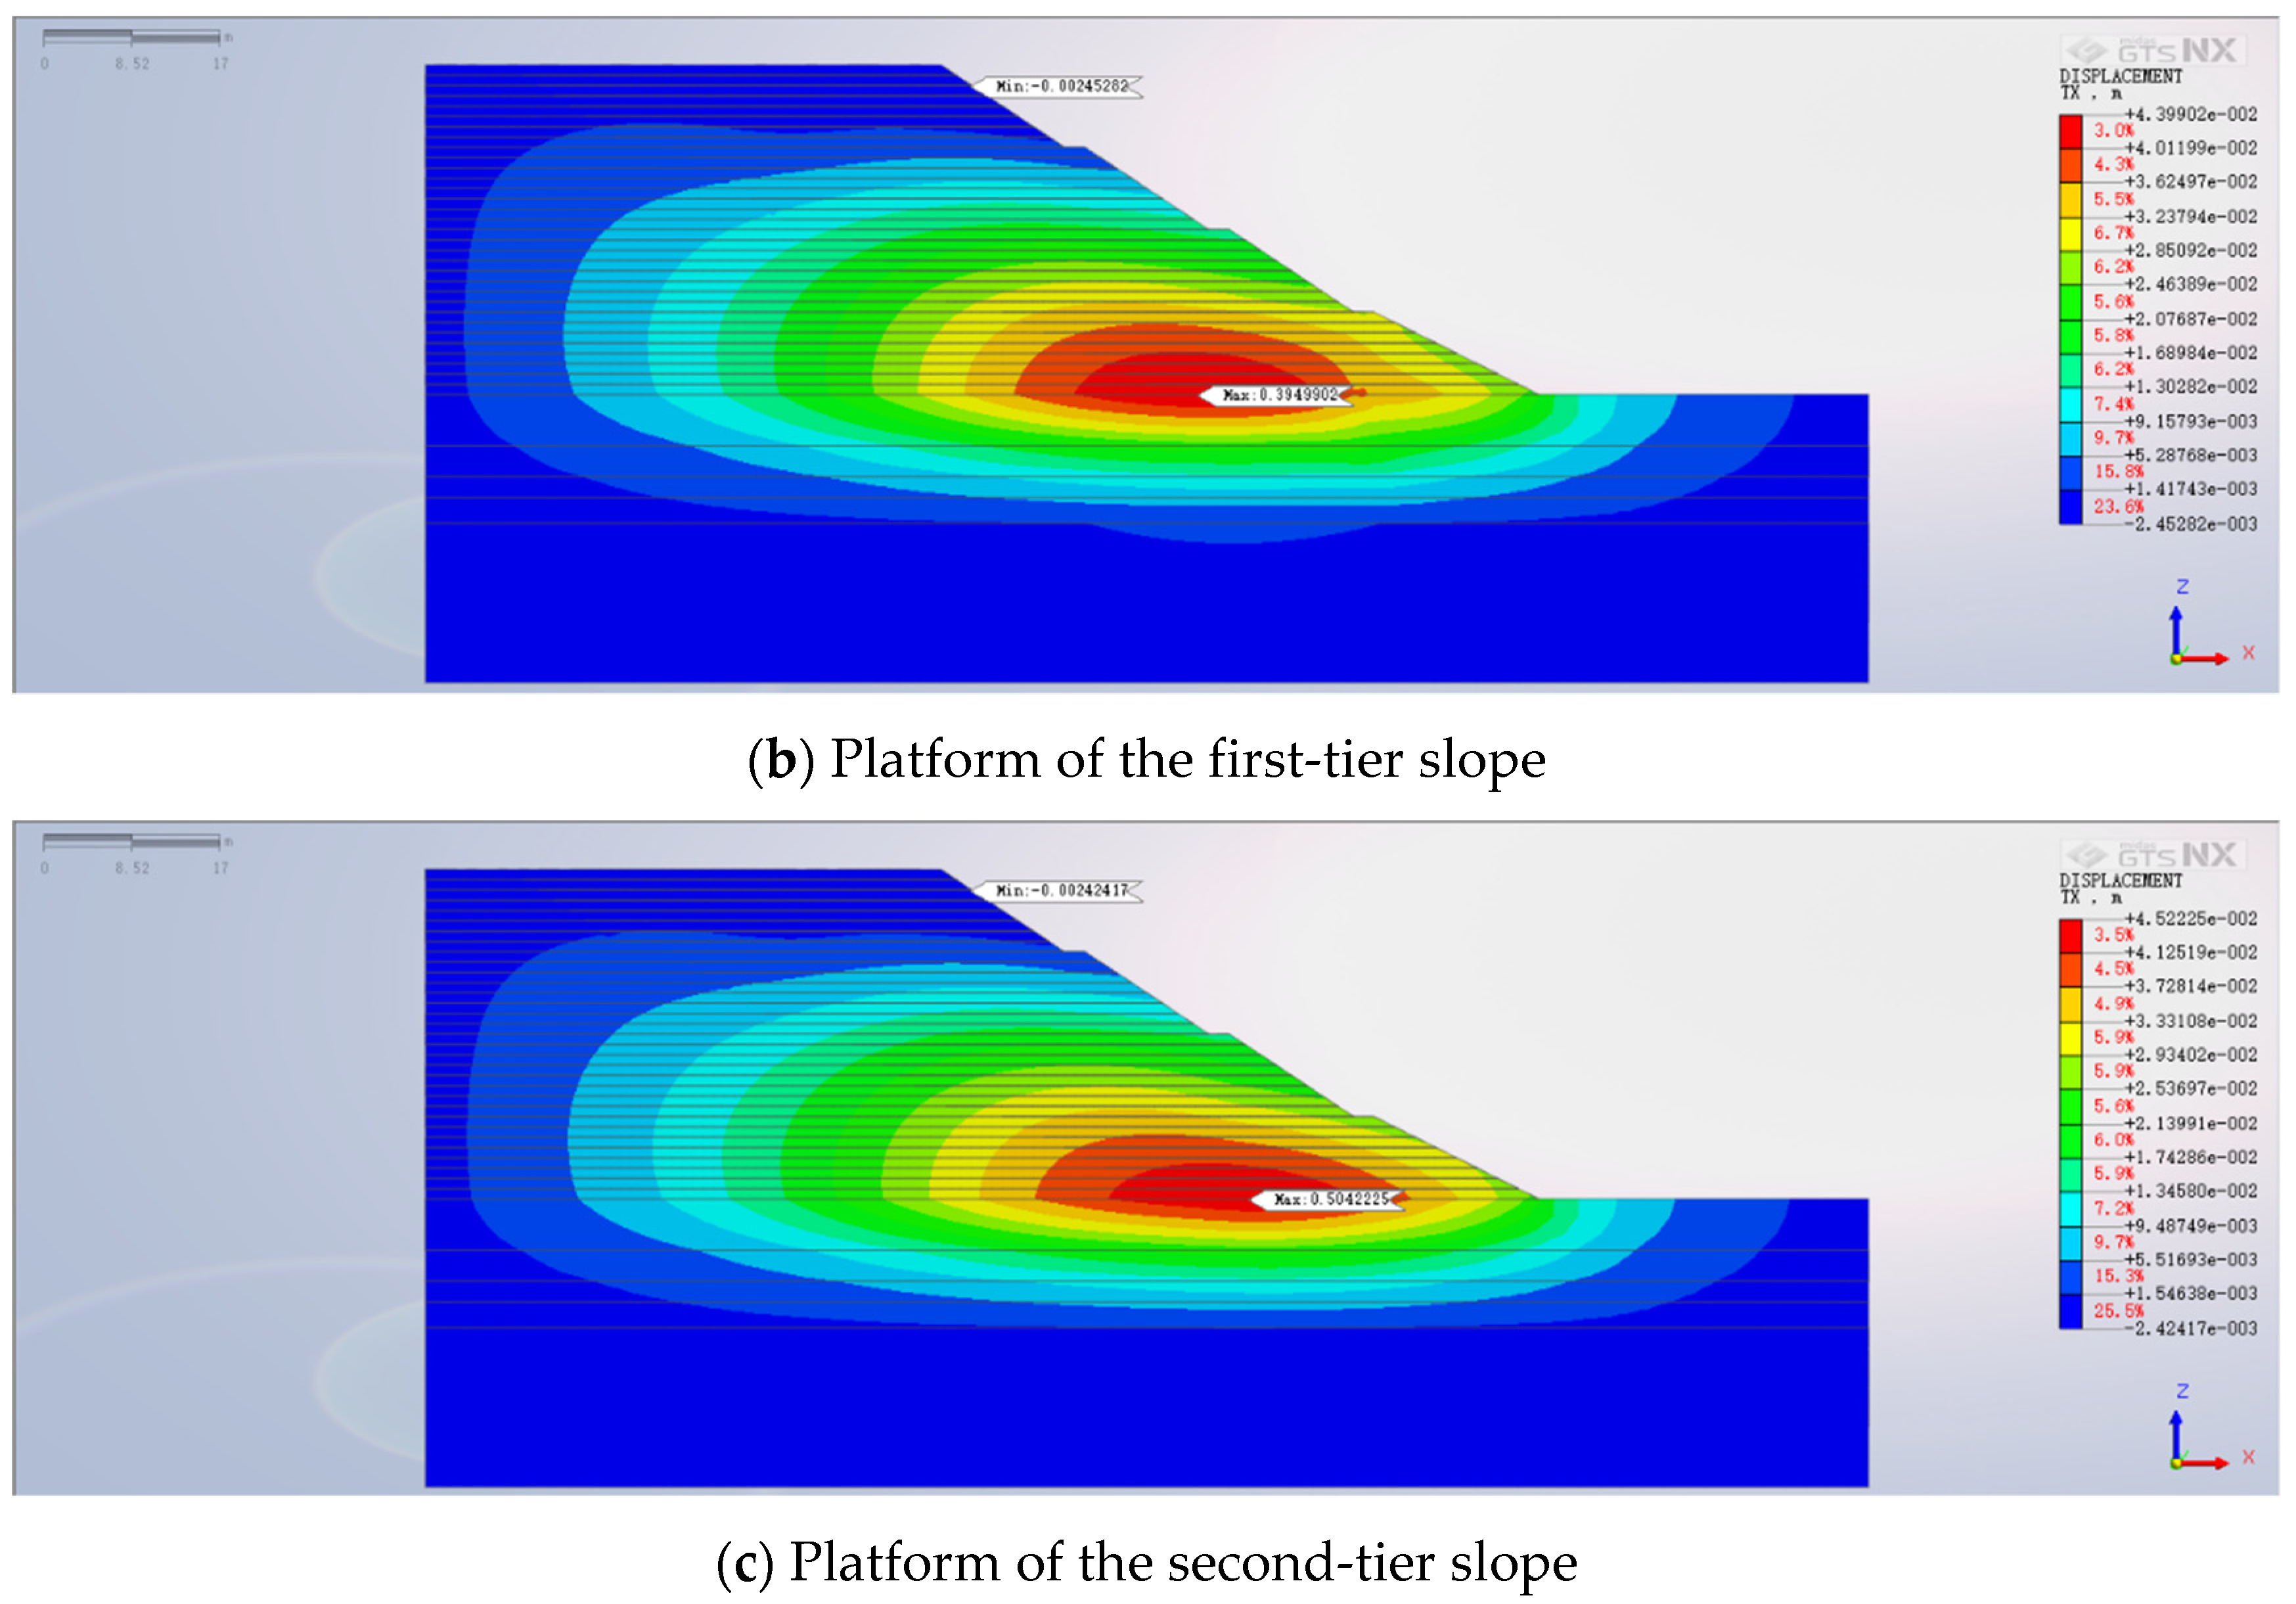
5.4. Influence of Anti-Slide Pile Position on High Backfill Slope

Taking into account the previously defined parameters for the anti-slide piles—specifically, a pile length of 15 m, a pile diameter of 1.5 m, and a pile spacing of 2.5 m—three distinct pile positions were selected: at the foot of the slope, on the first-level slope platform, and on the second-level slope platform. This examination seeks to elucidate the influence of varying anti-slide pile positions on the high backfill slope. Figure 14 depicts the contour map showcasing the ultimate horizontal displacement pattern for the reinforced high backfill slope, employing anti-slide piles in different positions.
Figure 14 shows that the utmost horizontal displacement occurs when the anti-slide pile is situated on the second-level slope platform, yielding a displacement of 50.42 mm. This outcome is due to the anti-slide pile’s base being embedded within the backfill soil stratum rather than the rock stratum. Consequently, the anchoring efficacy of the anti-slide pile is significantly undermined, rendering it unable to provide substantial support. The second highest horizontal displacement manifests when the anti-slide pile is placed at the slope’s base. Although the pile’s base is embedded in moderately weathered granite, its placement is distant from the zone of maximum displacement. As a result, its ability to offer comprehensive support is curtailed. The resultant horizontal displacement value is 44.48 mm, signifying a reduction of 5.94 mm compared to the configuration with the pile on the second-level slope platform. The optimal support configuration is realized when the anti-slide pile is positioned on the first-level slope platform. In this configuration, the pile’s base is embedded in highly weathered granite, and the pile’s proximity to the region of maximal horizontal displacement precludes lateral soil movement. Consequently, this arrangement yields the most modest final horizontal displacement of 39.50 mm, achieving the most effective stabilization outcome for the high backfill slope.
Under the final selected conditions, a comparative analysis of pile bending moments was conducted for three different distributions of anti-slide piles, aiming to explore the influence of various pile positions on the pile bending moments, as shown in Figure 15 below. The graph shows that the patterns of pile bending moments for the three different anti-slide pile positions are consistent. The pile bending moments all initially increase with the depth of soil penetration. Once reaching their maximum values, the bending moments gradually decrease with increasing depth, ultimately approaching 0 at the pile base.
Furthermore, the locations of the maximum pile bending moments differ noticeably among the various anti-slide pile positions. As the position of the anti-slide piles moves upward, the location of the maximum bending moment also shifts correspondingly. When the anti-slide piles are located at the foot of the slope, this position is near the upper interface of moderately weathered granite. The embedding action of the rock and soil on the anti-slide piles significantly increases the shear force borne by the piles at this position, resulting in the maximum bending moment occurring at this point in the anti-slide piles. As the anti-slide pile position moves upward, the restraining effect of the soil on the anti-slide pile weakens, causing the location of the maximum pile bending moment to shift accordingly.

6. Conclusions

This article is based on the theoretical research of reinforcing high backfill slopes with anti-slide piles, and it conducts a study on reinforcing high backfill slopes with anti-slide piles against the backdrop of actual engineering projects. By using MIDAS.GTS.NX finite element software for modeling the reinforced high backfill slopes with anti-slide piles, the numerical simulation results are compared with the actual construction monitoring values. It is found that the two are in good agreement, effectively proving the accuracy of this numerical simulation.
Subsequently, an investigation into the influencing factors of anti-slide pile reinforcement within high backfilled slopes ensued. The inquiry aimed to comprehend the magnitude of influence various factors exert on these slopes. Diverse factors impacting anti-slide piles, such as pile length, diameter, and spacing, were meticulously probed to achieve this. This endeavor facilitated the construction of corresponding finite element models, enabling a comprehensive comparison of outcomes. This iterative process culminated in quantifying the impact of each factor, ultimately revealing the optimal reinforcement strategy. Key insights are summarized as follows:
(1)
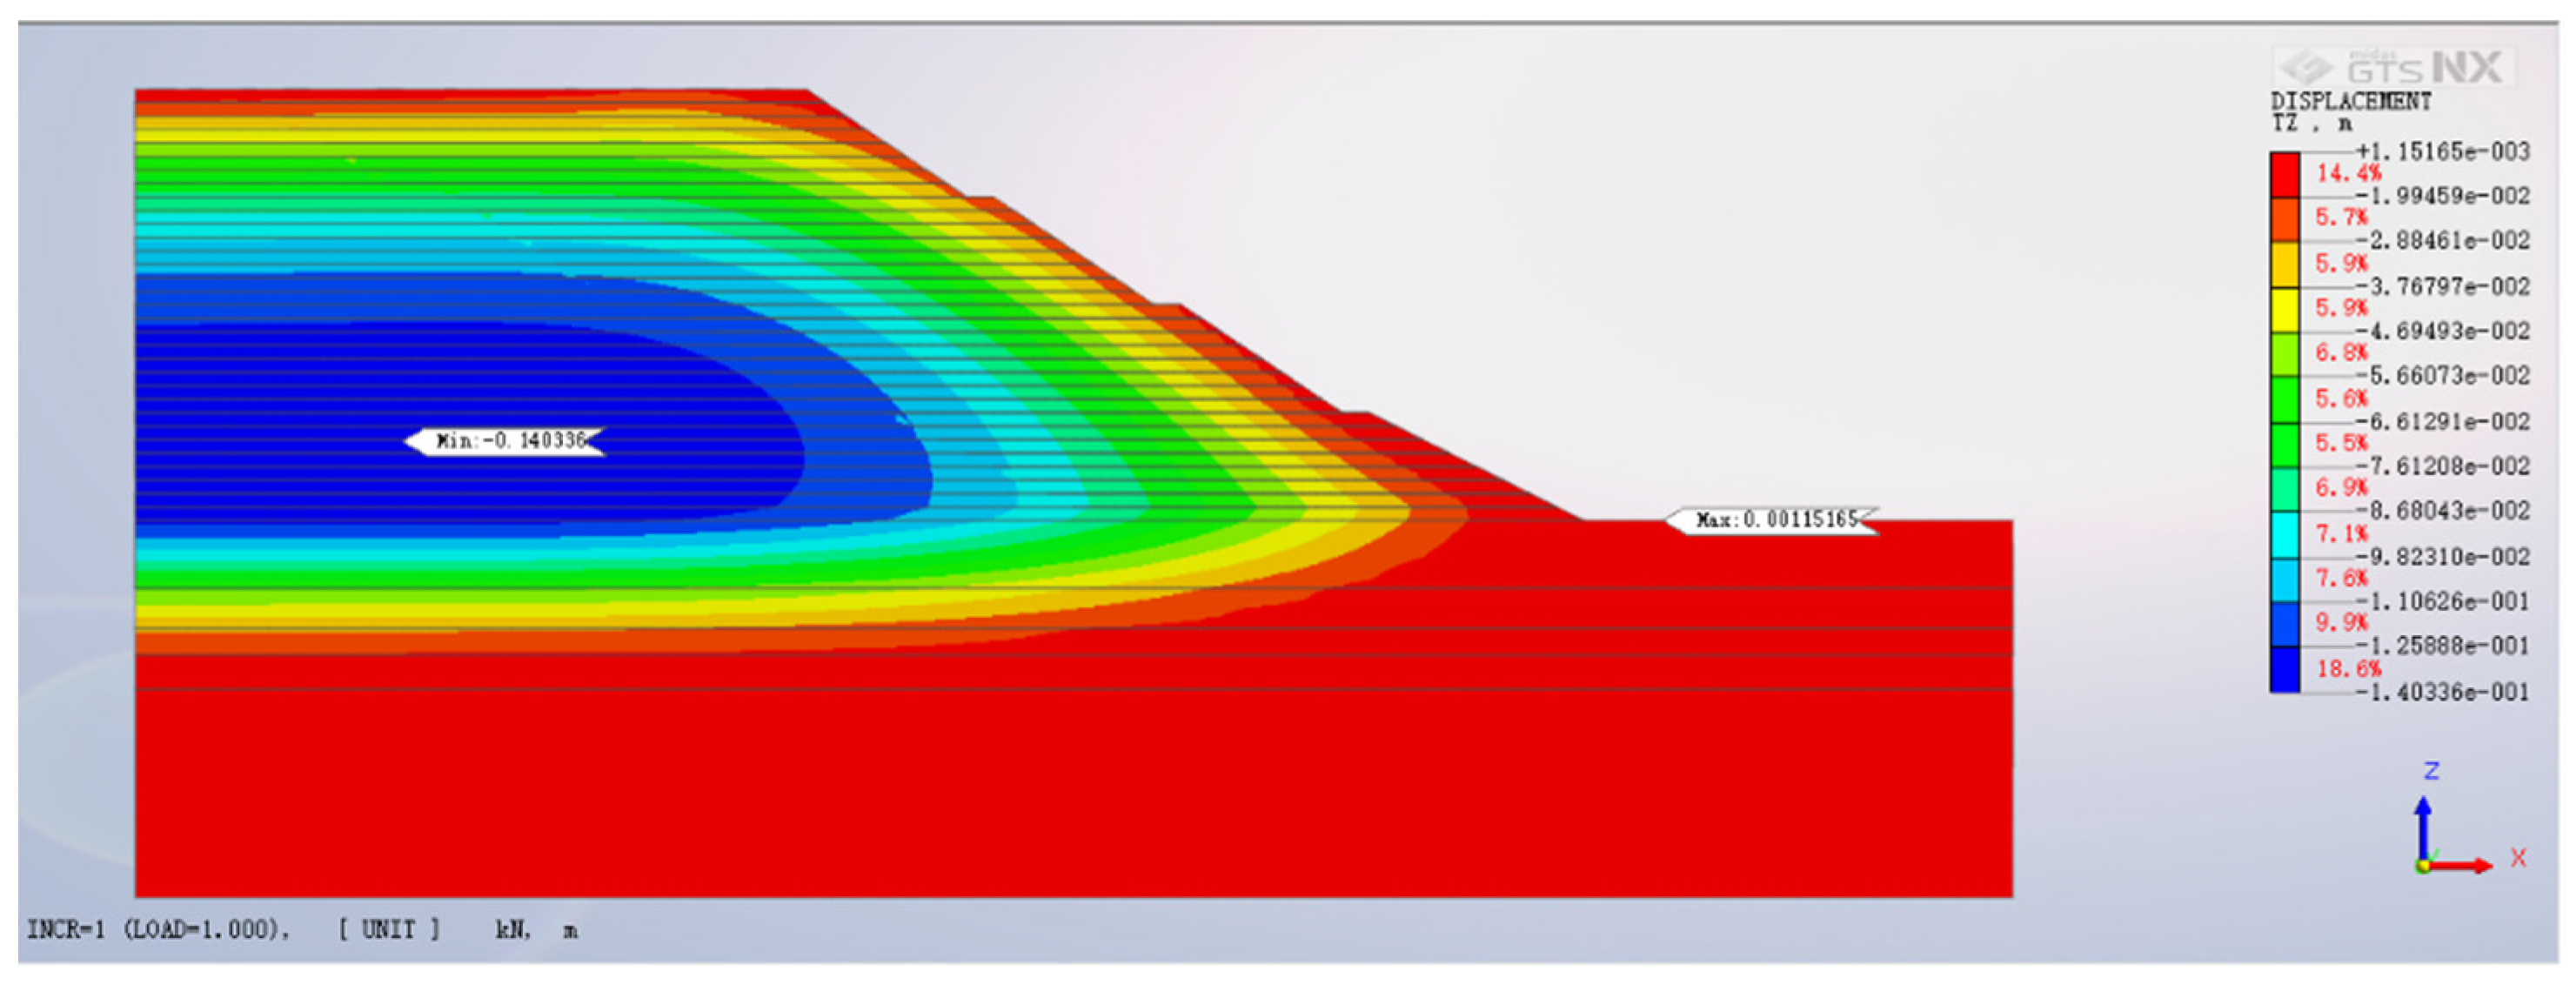
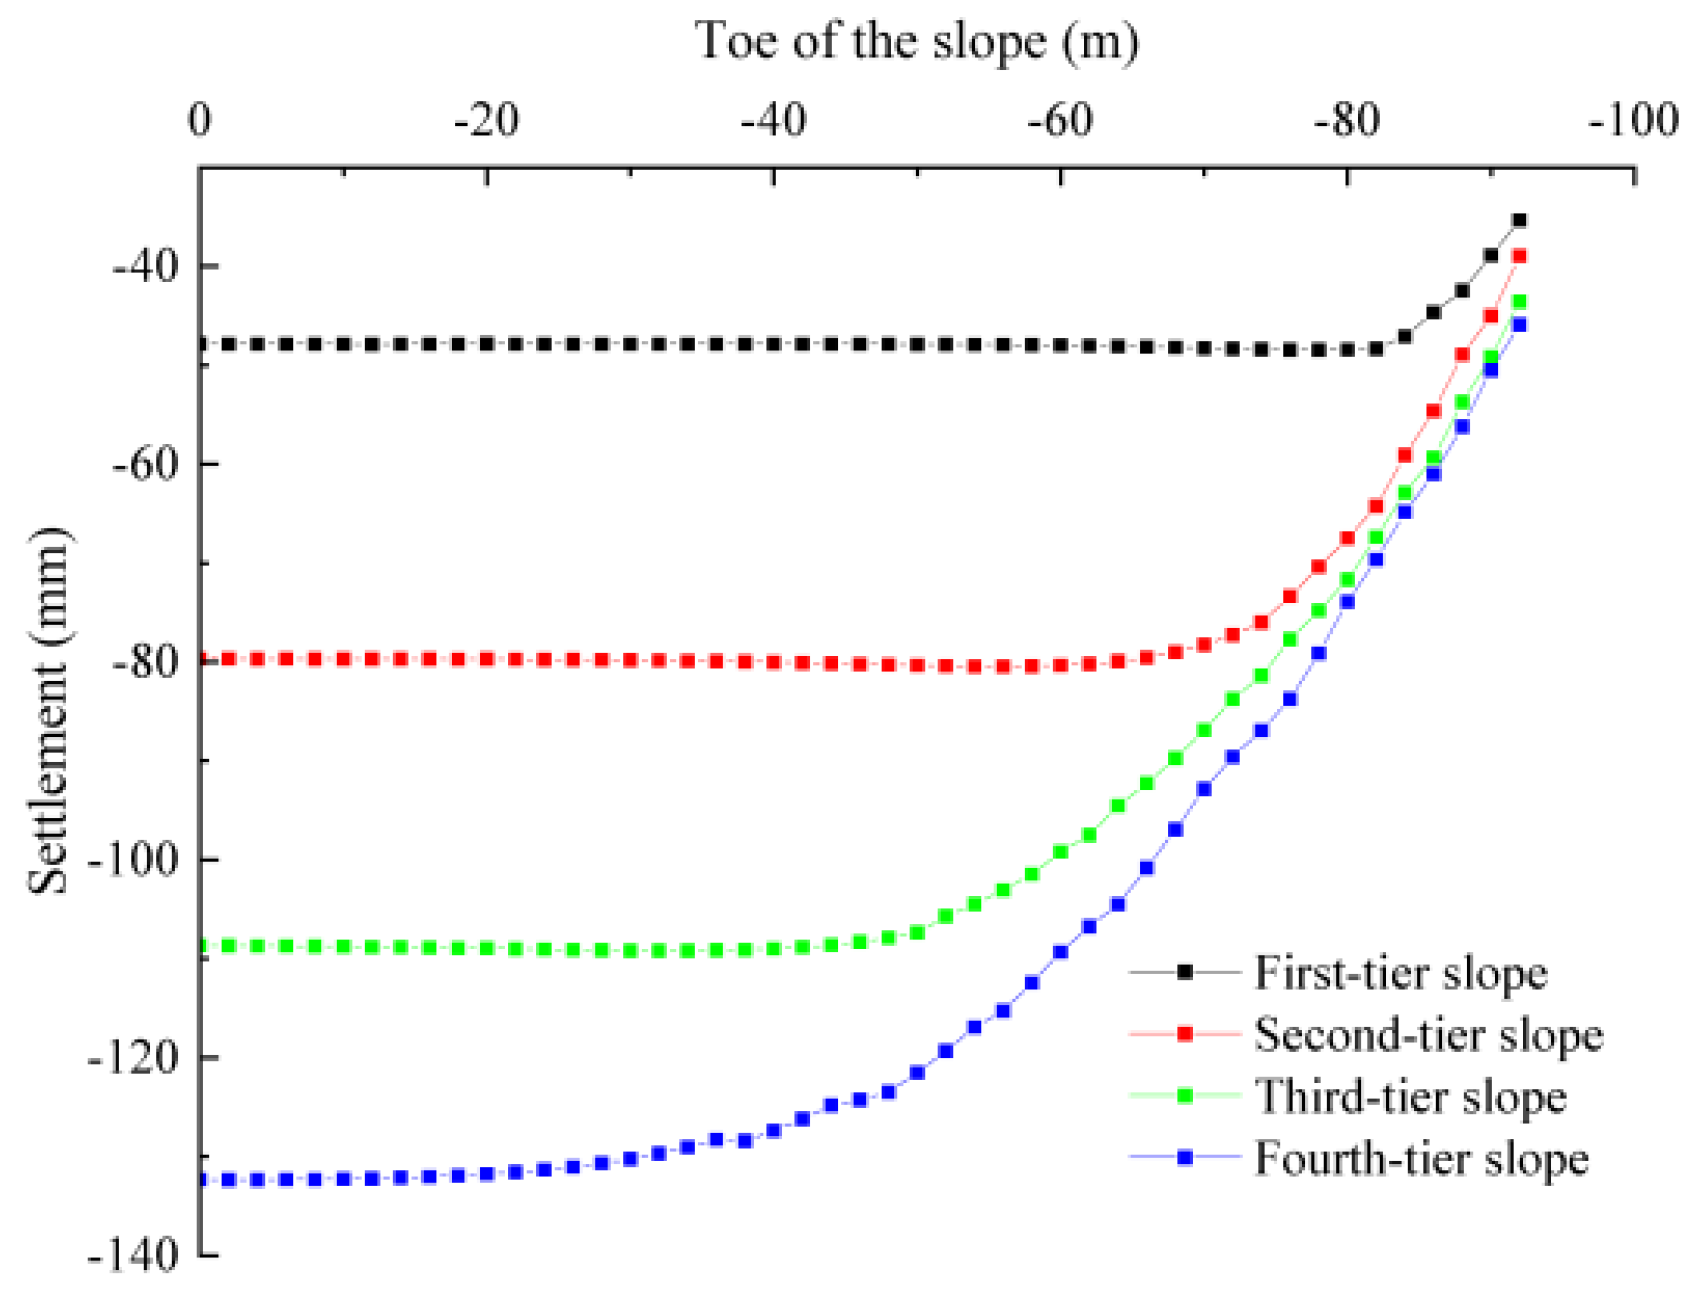
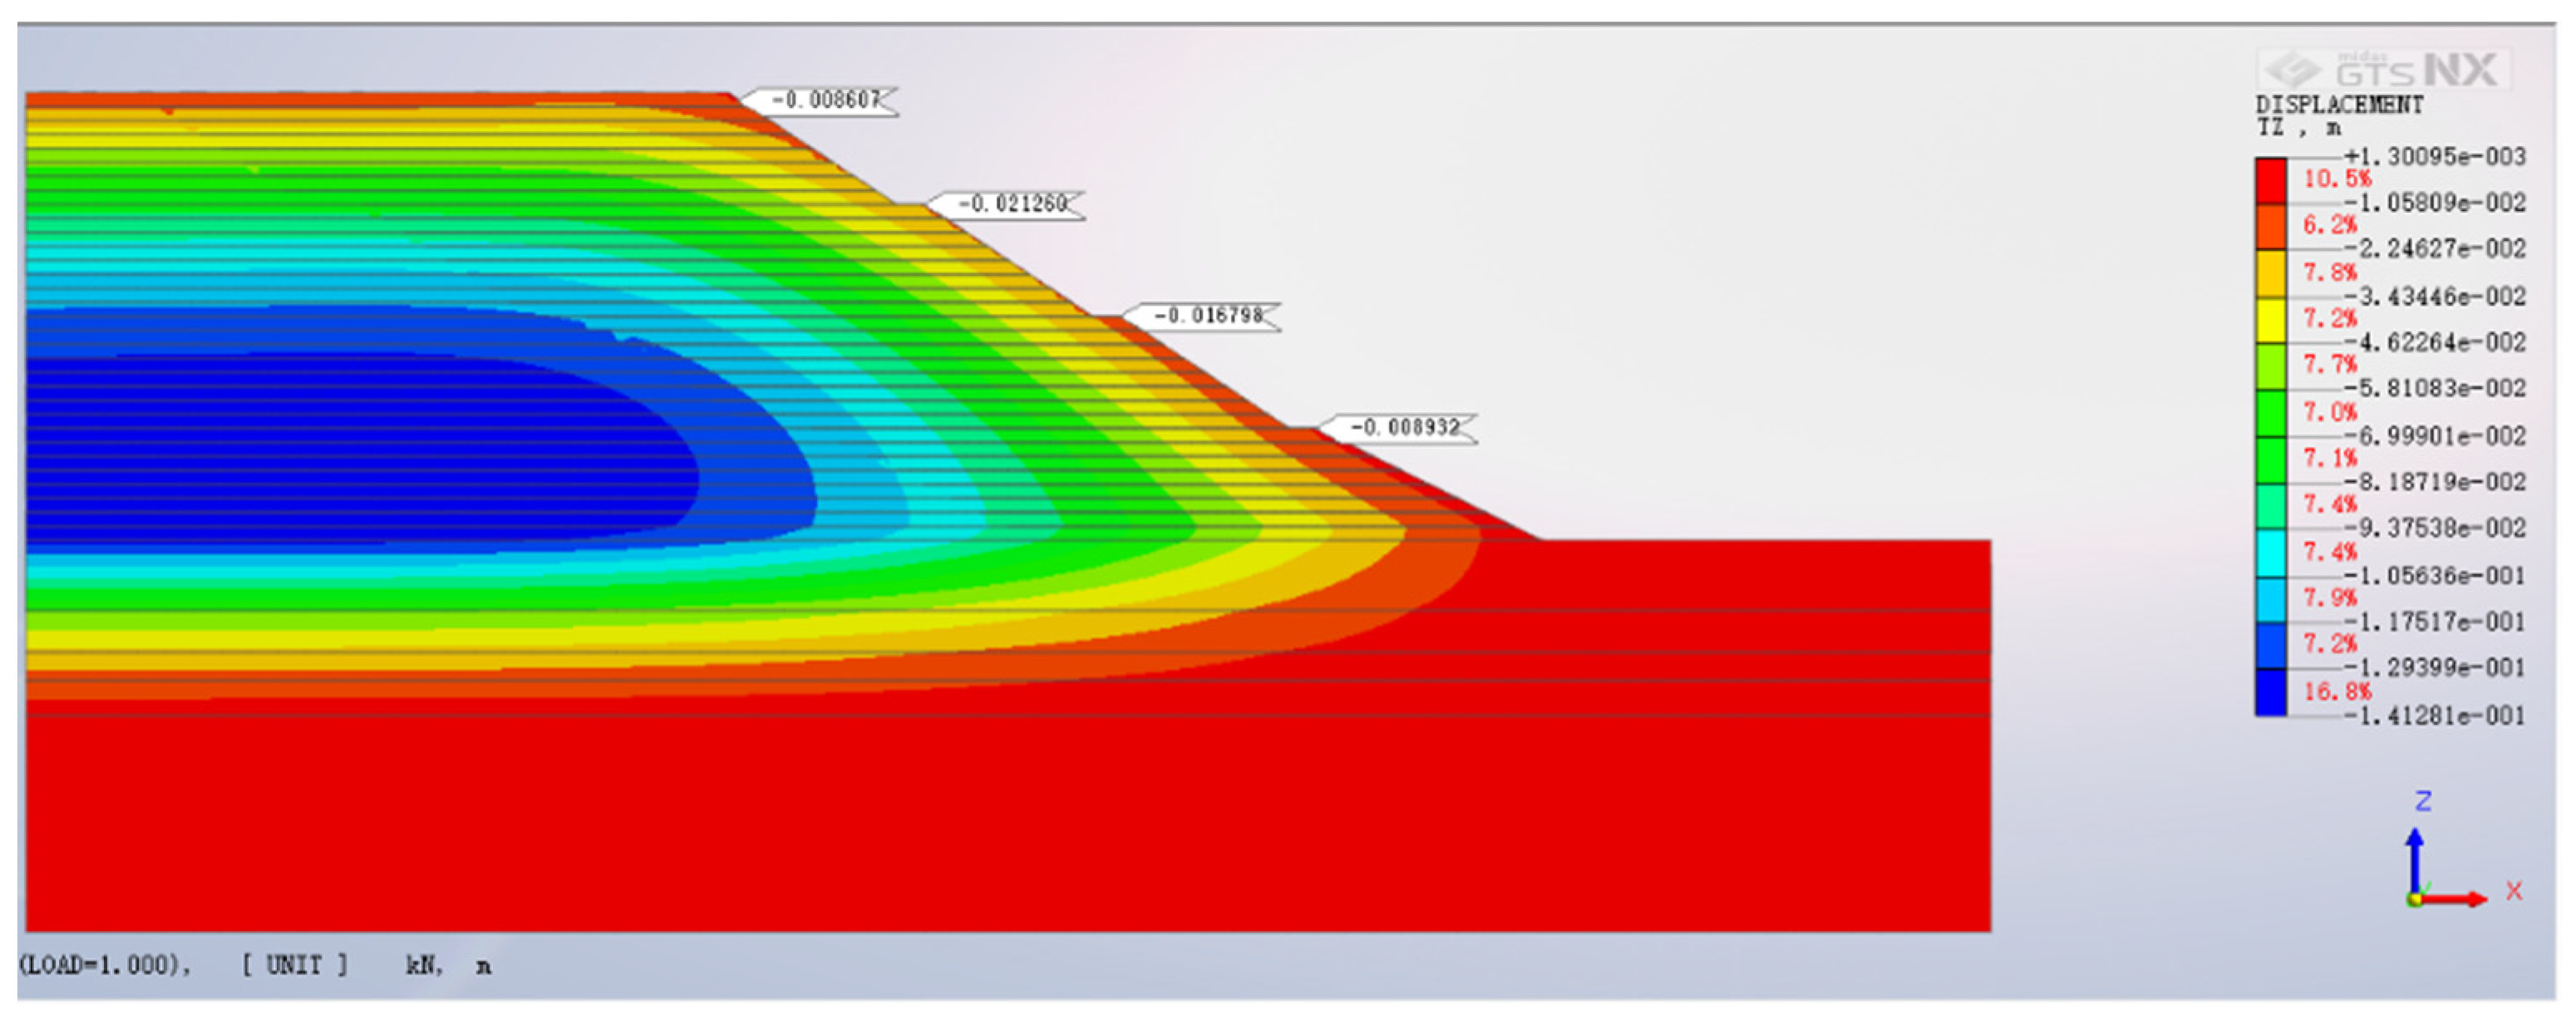
Vertical settlement prevails as the predominant form of displacement in high backfilled slopes, with the zenith of settlement not aligning with the slope crest but instead adjacent to the summits of the second and third tiers. As backfill height escalates, vertical settlement mounts, albeit at a decelerating pace.
(2)
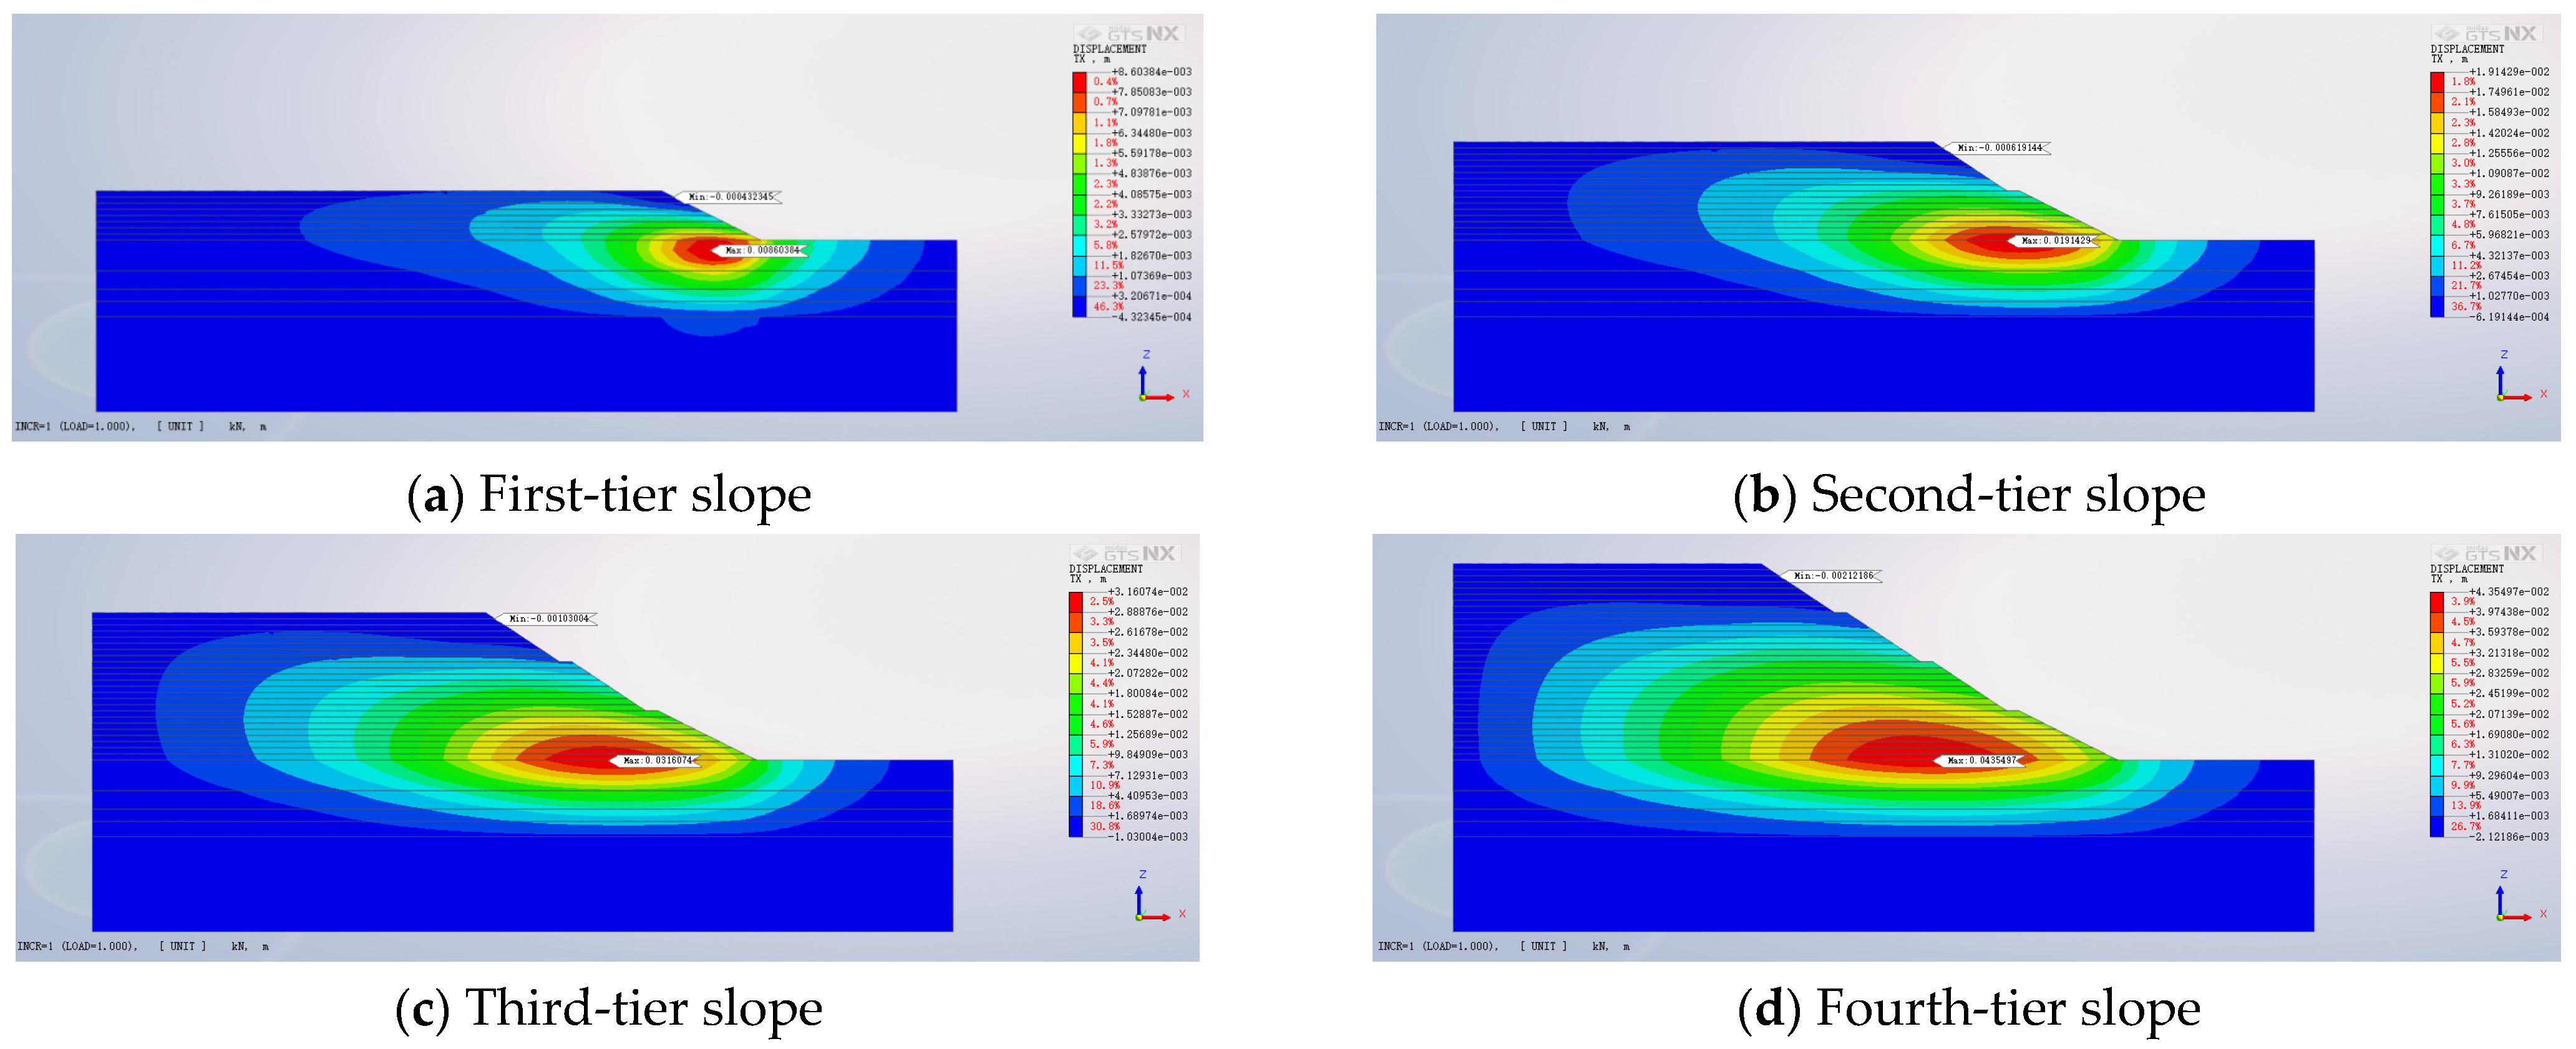
The horizontal slope displacement is subject to both backfill height and the characteristics of anti-slide piles. Augmenting the backfill height induces horizontal displacement escalation, albeit with diminishing rates. The apex horizontal displacement is situated at the first tier’s crest. Furthermore, as the backfill height amplifies, the horizontal displacement at the crest diminishes progressively. This observed pattern from finite element calculations aligns with the displacement trend observed at the crest via field monitoring.
(3)
Alterations in anti-slide pile parameters wield a more substantial influence on the horizontal displacement of the backfilled slope. As pile length and diameter expand, horizontal displacement systematically recedes. However, after penetrating the weathered rock layer, the effect of pile length on horizontal displacement dwindles. Furthermore, reducing pile spacing yields reduced horizontal displacement, although the pace of reduction decelerates progressively.
(4)
The arrangement of anti-slide piles profoundly impacts both horizontal displacement and bending moments within the slope. Placing piles on the second-tier platform diminishes reinforcement efficacy due to inadequate embedding in the rock layer, resulting in the most substantial horizontal displacement. Pile placement at the slope toe embeds them in the weathered rock layer, yet their proximity to the region of maximum displacement hinders full effectiveness. Conversely, situating piles on the first-tier platform effectively curbs lateral soil movement, yielding minor horizontal displacement and optimum reinforcement.

Author Contributions

Conceptualization, B.Z. and K.Y.; methodology, X.Y. and C.C.; software, B.Z. and H.Z.; validation, K.Y. and J.X.; formal analysis, B.Z.; investigation, Y.L. and J.X.; resources, C.C. and B.Y.; data curation, H.Z.; writing—original draft preparation, B.Z. and K.Y.; writing—review and editing, B.Z. and K.Y.; visualization, J.X.; supervision, H.Z.; project administration, B.Z.; funding acquisition, Y.L. and B.Y. All authors have read and agreed to the published version of the manuscript.

Funding

National Natural Science Foundation of China: No. 51978177, 52278336 and 52278160; Guangdong Basic and Applied Basic Research Found: No. 2023B1515020061, 2022A1515240037 and 2021A1515011691.

Data Availability Statement

Data are contained within the article.

Conflicts of Interest

Authors Baogui Zhou, Huabin Zhong and Chifeng Cai were employed by the company China Construction Industrial & Energy Engineering Group Co., Ltd. The remaining authors declare that the research was conducted in the absence of any commercial or financial relationships that could be construed as a potential conflict of interest.

References

  1. Bai, B.; Nie, Q.; Zhang, Y.; Wang, X.; Hu, W. Cotransport of heavy metals and SiO2 particles at different temperatures by seepage. J. Hydrol. 2021, 597, 125771. [Google Scholar] [CrossRef]
  2. Bai, B.; Rao, D.; Chang, T.; Guo, Z. A nonlinear attachment-detachment model with adsorption hysteresis for suspension-colloidal transport in porous media. J. Hydrol. 2019, 578, 124080. [Google Scholar] [CrossRef]
  3. Bai, B.; Zhou, R.; Cai, G.; Hu, W.; Yang, G. Coupled thermo-hydro-mechanical mechanism in view of the soil particle rearrangement of granular thermodynamics. Comput. Geotech. 2021, 137, 104272. [Google Scholar] [CrossRef]
  4. Yuan, B.; Chen, W.; Zhao, J.; Li, L.; Liu, F.; Guo, Y.; Zhang, B. Addition of alkaline solutions and fibers for the reinforcement of kaolinite-containing granite residual soil. Appl. Clay Sci. 2022, 228, 106644. [Google Scholar] [CrossRef]
  5. Yuan, B.; Chen, W.; Li, Z.; Zhao, J.; Luo, Q.; Chen, W.; Chen, T. Sustainability of the polymer SH reinforced recycled granite residual soil: Properties, physicochemical mechanism, and applications. J. Soils Sediments 2023, 23, 246–262. [Google Scholar] [CrossRef]
  6. Cui, C.; Liang, Z.; Xu, C.; Xin, Y.; Wang, B. Analytical solution for horizontal vibration of end-bearing single pile in radially heterogeneous saturated soil. Appl. Math. Model. 2023, 116, 65–83. [Google Scholar] [CrossRef]
  7. Meng, K.; Cui, C.; Liang, Z.; Li, H.; Pei, H. A new approach for longitudinal vibration of a large-diameter floating pipe pile in visco-elastic soil considering the three-dimensional wave effects. Comput. Geotech. 2020, 128, 103840. [Google Scholar] [CrossRef]
  8. Wei, L.; Chen, C.; Yang, C. Study on Constitutive Relation and Permeable Coefficient Tensor of Rocks under Tensile Stress Loading with Micromechanics. Key Eng. Mater. 2006, 324–325, 899–902. [Google Scholar] [CrossRef]
  9. Yang, G.; Zhong, Z.; Zhang, Y.; Fu, X. Optimal design of anchor cables for slope reinforcement based on stress and displacement fields. J. Rock Mech. Geotech. Eng. 2015, 7, 411–420. [Google Scholar] [CrossRef]
  10. Zhang, Q.; Hu, J.; Du, Y.; Gao, Y.; Li, J. A laboratory and field-monitoring experiment on the ability of anti-slide piles to prevent buckling failures in bedding slopes. Environ. Earth Sci. 2021, 80, 44. [Google Scholar] [CrossRef]
  11. Qu, L.-M.; Ding, X.-M.; Wu, C.-R.; Long, Y.-H.; Yang, J.-C. Effects of topography on dynamic responses of single piles under vertical cyclic loading. J. Mt. Sci. 2020, 17, 230–243. [Google Scholar] [CrossRef]
  12. Xiao, J.; Long, X.; Qu, W.; Li, L.; Jiang, H.; Zhong, Z. Influence of sulfuric acid corrosion on concrete stress–strain relationship under uniaxial compression. Measurement 2022, 187, 110318. [Google Scholar] [CrossRef]
  13. Que, X.; Zhu, Z.; Niu, Z.; Zhu, S.; Wang, L. A modified three-dimensional Hoek–Brown criterion for intact rocks and jointed rock masses. Geomech. Geophys. Geo-Energy Geo-Resour. 2023, 9, 7. [Google Scholar] [CrossRef]
  14. Li, X.Z.; Jiang, H.; Pan, Q.J.; Zhao, L.H. Characterizing model uncertainty of upper-bound limit analysis on slopes using 3D rotational failure mechanism. Rock Mech. Bull. 2023, 2, 100026. [Google Scholar] [CrossRef]
  15. Lefebvre, G.; Duncan James, M.; Wilson Edward, L. Closure to “Three-Dimensional Finite Element Analyses of Dams”. J. Geotech. Eng. Div. 1974, 100, 1164. [Google Scholar] [CrossRef]
  16. Yang, X.-L.; Wei, J.-J. Analytical approach for stability of 3D two-stage slope in non-uniform and unsaturated soils. Eng. Geol. 2021, 292, 106243. [Google Scholar] [CrossRef]
  17. Rathod, D.; Muthukkumaran, K.; Thallak, S. Analysis of laterally loaded group of piles located on sloping ground. Int. J. Geotech. Eng. 2018, 14, 580–588. [Google Scholar] [CrossRef]
  18. Griffiths, D.; Marquez, R. Three-dimensional slope stability analysis by elasto-plastic finite elements. Géotechnique 2007, 57, 537–546. [Google Scholar] [CrossRef]
  19. Bushira, K.M.; Gebregiorgis, Y.B.; Verma, R.K.; Sheng, Z. Cut soil slope stability analysis along National Highway at Wozeka–Gidole Road, Ethiopia. Model. Earth Syst. Environ. 2018, 4, 591–600. [Google Scholar] [CrossRef]
  20. Zheng, Y.; Tang, X.; Shangyi, Z.; Deng, C.; Wenjie, L. Strength reduction and step-loading finite element approaches in geotechnical engineering. J. Rock Mech. Geotech. Eng. 2010, 2010, 21–30. [Google Scholar] [CrossRef]
  21. Zhao, L.; Shao, L.; Mao, J.; Mu, K.; Li, T. A fracture model for the deformable spheropolygon-based discrete element method. Granul. Matter 2022, 24, 50. [Google Scholar] [CrossRef]
  22. Shao, L.; Mao, J.; Zhao, L.; Li, T. A three-dimensional deformable spheropolyhedral-based discrete element method for simulation of the whole fracture process. Eng. Fract. Mech. 2022, 263, 108290. [Google Scholar] [CrossRef]
  23. Hong, Y.; Shao, Z.; Shi, G.; Nie, X. Comparison of GIM and SRM calculated slope safety factor based on three-dimensional limit analysis method. J. Hohai Univ. (Nat. Sci.) 2022, 50, 112–120. [Google Scholar]
  24. Hao, M.; Da, H.; Lin, S. Numerical simulation of s-shaped failure evolution of anti-dip slope based on statistics of broken length and layer thickness. J. Eng. Geol. 2020, 28, 1160. [Google Scholar] [CrossRef]
  25. Gao, G.-Y.; Song, J.; Yang, J. Identifying boundary between near field and far field in ground vibration caused by surface loading. J. Cent. South Univ. 2014, 21, 3284–3294. [Google Scholar] [CrossRef]
  26. Yuan, B.; Li, Z.; Chen, Y.; Ni, H.; Zhao, Z.; Chen, W.; Zhao, J. Mechanical and microstructural properties of recycling granite residual soil reinforced with glass fiber and liquid-modified polyvinyl alcohol polymer. Chemosphere 2022, 286, 131652. [Google Scholar] [CrossRef]
  27. Que, X.; Zhu, Z.; He, Y.; Niu, Z.; Huang, H. Strength and deformation characteristics of irregular columnar jointed rock mass: A combined experimental and theoretical study. J. Rock Mech. Geotech. Eng. 2023, 15, 429–441. [Google Scholar] [CrossRef]
  28. Que, X.; Zhu, Z.; Zhou, L.; Niu, Z.; Huang, H. Strength and Failure Characteristics of an Irregular Columnar Jointed Rock Mass Under Polyaxial Stress Conditions. Rock Mech. Rock Eng. 2022, 55, 7223–7242. [Google Scholar] [CrossRef]
  29. Chen, Y.; Tang, L.; Ye, Y.; Cheng, Z.; Zhou, Z. Effects of different chloride salts on granite residual soil: Properties and water–soil chemical interaction mechanisms. J. Soils Sediments 2023, 23, 1844–1856. [Google Scholar] [CrossRef]
  30. Yuan, B.; Li, Z.; Zhao, Z.; Ni, H.; Su, Z.; Li, Z. Experimental study of displacement field of layered soils surrounding laterally loaded pile based on transparent soil. J. Soils Sediments 2021, 21, 3072–3083. [Google Scholar] [CrossRef]
  31. Yang, B.; Chen, Y.; Zhao, C.; Li, Z. Effect of geotextiles with different masses per unit area on water loss and cracking under bottom water loss soil conditions. Geotext. Geomembr. 2023, 52, 233–240. [Google Scholar] [CrossRef]
  32. Yuan, B.; Sun, M.; Xiong, L.; Luo, Q.; Pradhan, S.P.; Li, H. Investigation of 3D deformation of transparent soil around a laterally loaded pile based on a hydraulic gradient model test. J. Build. Eng. 2020, 28, 101024. [Google Scholar] [CrossRef]
  33. Chen, Y.; Tang, L.; Sun, Y.; Cheng, Z.; Gong, W. Physical–mechanical properties and microstructure degradation of acid–alkali contaminated granite residual soil. Geomech. Energy Environ. 2023, 36, 100501. [Google Scholar] [CrossRef]
Figure 1. Model dimension selection and finite element model.
Buildings 14 00799 g001
Figure 2. Contour map of final vertical settlement.
Buildings 14 00799 g002
Figure 3. Distribution curve of settlement at the bottom of the slope.
Buildings 14 00799 g003
Figure 4. Settlement at the top of each slope level.
Buildings 14 00799 g004
Figure 5. Pile Positions and monitoring illustration.
Buildings 14 00799 g005
Figure 6. Horizontal displacement at the top of each level of the slope.
Buildings 14 00799 g006
Figure 7. Horizontal displacement profile of soil along depth.
Buildings 14 00799 g007
Figure 8. Horizontal displacement contour of the pile body.
Buildings 14 00799 g008
Figure 9. Anti-sliding pile displacement diagram.
Buildings 14 00799 g009
Figure 10. Anti-sliding pile bending moment diagram.
Buildings 14 00799 g010
Figure 11. Horizontal displacement contour map.
Buildings 14 00799 g011
Figure 12. Final horizontal displacement contour map.
Buildings 14 00799 g012
Figure 13. Final horizontal displacement contour map.
Buildings 14 00799 g013aBuildings 14 00799 g013b
Figure 14. Final horizontal displacement contour map.
Buildings 14 00799 g014aBuildings 14 00799 g014b
Figure 15. Pile bending moment diagrams for different pile positions.
Buildings 14 00799 g015
Table 1. Basic physical properties of soil layers.
Layer Depth (m)Elastic Modulus E (Mpa)Poisson’s Ratio νUnit
Weight γ
(kN/m3)
Initial
Porosity n
Cohesion
c (kPa)
Internal Friction Angle φ
(°)
Fill Soil1.2500.3180.52637
Residual Sandy Clay8.9300.3319.40.62126
Fully Weathered Sandstone2.43000.3210.54428
Sandy Soil-Like Highly Weathered Granite2.58000.2622.50.650031
Fragmented, Highly Weathered Granite3.110000.24230.580035
Moderately Weathered Granite120000.23240.5120038
Table 2. Vertical settlement monitoring table.
Observation Date
Observation
Point
2021.10.06~2021.10.252021.10.25~2021.11.122021.11.12~2021.12.162021.12.16~2021.12.262021.10.06~2021.12.26
Displacement
(mm)
Change Rate
(mm/d)
Displacement
(mm)
Change Rate
(mm/d)
Displacement
(mm)
Change Rate
(mm/d)
Displacement
(mm)
Change Rate
(mm/d)
Cumulative Displacement
(mm)
JC1+7.68+0.38+2.45+0.14+1.07+0.03+0.98+0.10+12.18
JC2+6.48+0.32+2.04+0.11+1.64+0.05+1.23+0.12+11.39
JC3//+9.08+0.50+5.67+0.17+2.43+0.24+17.68
JC4//+8.48+0.47+6.49+0.19+2.06+0.21+17.03
JC5//+8.75+0.49+5.17+0.15+2.71+0.27+17.13
JC6////+14.48+0.43+4.21+0.42+18.69
JC7////+15.18+0.45+4.28+0.43+19.46
JC8////+11.45+0.34+4.32+0.43+15.77
JC9//////+4.53+0.45+4.53
JC10//////+3.33+0.33+3.33
JC11//////+4.42+0.44+4.42
Explanation: “+” indicates subsidence.
Table 3. Horizontal displacement monitoring table.
Observation Date
Observation
Point
2021.10.06~2021.10.252021.10.25~2021.11.122021.11.12~2021.12.162021.12.16~2021.12.262021.10.06~2021.12.26
Displacement
(mm)
Change Rate
(mm/d)
Displacement
(mm)
Change Rate
(mm/d)
Displacement
(mm)
Change Rate
(mm/d)
Displacement
(mm)
Change Rate
(mm/d)
Cumulative Displacement
(mm)
JC1+9.32+0.47+7.25+0.40+4.42+0.13+1.44+0.14+22.43
JC2+8.46+0.42+6.04+0.34+3.66+0.11+1.01+0.10+19.17
JC3//+8.21+0.46+5.52+0.16+1.64+0.16+15.37
JC4//+8.45+0.47+6.76+0.20+1.12+0.11+16.33
JC5//+7.73+0.43+6.34+0.19+1.77+0.18+15.84
JC6////+7.48+0.22+1.53+0.15+9.01
JC7////+6.18+0.18+2.43+0.24+8.61
JC8////+6.45+0.19+2.22+0.22+8.67
JC9//////+2.56+0.26+2.56
JC10//////+1.58+0.16+1.58
JC11//////+2.03+0.20+2.03
Explanation: “+” indicates subsidence.
Table 4. Horizontal displacement of anti-sliding pile top and base.
Construction StageFirst-Level BackfillSecond-Level BackfillThird-Level BackfillFourth-Level BackfillHighway Vehicle Load
Pile Top Displacement (mm)6.1211.0815.4118.8919.16
Pile Base Displacement (mm)−0.15−0.20−0.25−0.29−0.30
Disclaimer/Publisher’s Note: The statements, opinions and data contained in all publications are solely those of the individual author(s) and contributor(s) and not of MDPI and/or the editor(s). MDPI and/or the editor(s) disclaim responsibility for any injury to people or property resulting from any ideas, methods, instructions or products referred to in the content.

