Article

Investigation of the Structural Strength of Expansive Soil in a Seasonally Frozen Region

1
College of Construction Engineering, Jilin University, Changchun 130026, China
2
Heilongjiang Provincial Institute of Survey and Design for Highway, Harbin 150090, China
3
Central Southern China Electric Power Design Institute, Wuhan 430071, China
*
Author to whom correspondence should be addressed.
Buildings 2024, 14(3), 789; https://doi.org/10.3390/buildings14030789
Submission received: 2 February 2024 / Revised: 10 March 2024 / Accepted: 11 March 2024 / Published: 14 March 2024
(This article belongs to the Special Issue Problematic Soils in Building Construction)

Abstract

:
The existence of structural strength in undisturbed soil results in its distinct characteristics compared to remolded soil. Under the influence of freeze–thaw cycles, this difference may easily cause geotechnical disasters in cold regions. This study aimed to analyze and discuss the expression degree and influencing factors of the structural strength of expansive soil. The unconfined compressive strength (UCS) test, high-pressure consolidation test, and microscopic test were performed on expansive soil retrieved from a seasonally frozen region. Moreover, sensitivity parameters, including stress sensitivity (St.qu, St.σk) and strain sensitivity (St.ɛu, St.Cc), were applied to explore the expression degree and influencing factors of structural strength in a seasonally frozen region. The results reveal that the undisturbed samples have better structural connection and particle arrangement than the remolded samples. However, the primary fractures have a certain degrading effect on the strength of the undisturbed soil as influenced by a seasonally frozen region. With the increase in water content and the decrease in density, the expression degree of the structural strength in terms of compressive strength and the ability to resist deformation enhances under the unconfined condition. By contrast, the expression degree increases in strength and decreases in ability under the confined condition. Furthermore, the effect mechanisms of the basic property, particle composition, structural linkage, lateral confinement, and historical role on the structural expression were analyzed.

1. Introduction

During the formation of soil, various physical and chemical interactions form associations between particles that provide structural strength, and soil with structural strength is called structural soil [1,2]. The structural strength of soil causes differences in the engineering properties of undisturbed and remolded soils [3,4]. In the meantime, soils with special material composition, structure, and engineering geological properties are called special soils and are widely distributed and applied in building materials worldwide. This uniqueness is prone to cause construction damage and geotechnical problems [5]. Therefore, a deeper understanding of the structural strength of special soil has positive significance for exploring soil characteristics and thus alleviating geotechnical problems.
Special soils mainly include loess, laterite, expansive soil, and saline soil [5]. Researchers have discussed the structural strength of loess by combining damage and soil mechanics and considering consolidation pressure, structural disturbance, and wet–dry cycles [6,7,8]. As for laterite, the cementation of free iron oxide provides structural strength, which leads to better compressive and mechanical properties of the undisturbed soil [3,9]. However, for saline soil, the fractures and sand columns have significant negative effects on its structural strength due to the presence of soluble salt [2,10]. Expansive soil, as a typical special soil, swells with water and shrinks without water. Thus, the soil is prone to loosening and cracking [11,12,13]. This case is especially true in seasonally frozen regions, where soils undergo periodic freeze–thaw cycles. The transformation between water and ice is highly susceptible to fracture development, which introduces geotechnical problems such as subgrade cracking and slope instability [14,15]. Therefore, analyzing the properties of undisturbed and remolded expansive soils and exploring the structural expression laws in seasonally frozen regions are meant to reduce engineering disasters.
Wet–dry cycles are a primary factor for disasters of expansive soil due to water sensitivity. Fractures in remolded samples are wider than those in undisturbed samples under wet–dry cycles, and the shear strength of the undisturbed sample is closer to the initial strength of the remolded sample after five wet–dry cycles [16,17]. However, freeze–thaw cycles largely impact the microstructure of undisturbed expansive soil. Scanning electron microscopy (SEM) and mercury intrusion porosimetry (MIP) experiments were conducted by researchers on weakly expansive soil in a seasonally frozen region, and the results showed that undisturbed soil is densely packed with “face-to-face” and “face-to-edge” contacts with a higher content of round-like particles. Correspondingly, the pores of remolded soil are uniformly distributed and mainly have “point–surface” and “point–point” contacts with a higher content of long-trip particles [18,19]. Differences in microstructure result in distinct particle arrangements and linkages in undisturbed and remolded samples, which are the source of the structure. With regard to expansive and compressive properties, the expansiveness of undisturbed soil is greater, and the compressibility is lower than that of remolded soil. As the structural strength is destroyed, the compressibility of undisturbed soil gradually approaches that of remolded soil [20,21]. In addition, the super-subloading surface model with improved state variable has been established, and it reflects the influence of structural strength and super consolidation on the mechanical behavior of soil [22]. In the meantime, fractures in undisturbed samples would close with an increase in consolidation pressure. After the freeze–thaw cycle test in the laboratory, the stress–strain curves of an undisturbed sample change from strain-softening to strain-stable, and the failure modes change from brittle failure to plastic failure [23].
In summary, scholars have experimentally studied macroscopic and microscopic differences between undisturbed and remolded soils to investigate the influence of structural strength on the engineering behaviors of expansive soil. However, most previous works have focused on the difference in the properties between undisturbed and remolded soils under a specific initial condition, such as a certain water content [24], whereas studies on the influencing factors of structural strength are lacking. Therefore, the unconfined compressive strength (UCS) test and high-pressure consolidation test were used to measure the compressive properties of the expansive soil retrieved from seasonally frozen regions, and the microstructure of the soil was observed by SEM test in this study. The advantages and structure of undisturbed samples were characterized differently under various conditions through experiments. Therefore, four sensitivity parameters ( S t . q u , S t . σ k , S t . ε u , S t . C c ) were applied in this study to discuss the expression degree and influencing factors of soil structure. This study aims to deepen the understanding of the structural strength of expansive soil in a seasonally frozen region through the abovementioned research to alleviate geotechnical engineering problems.

2. Materials and Methods

2.1. Study Area

Expansive soil was retrieved in July 2022 from the northern part of the Songnen Plain, Suihua City, China. The climate in this area is characterized by a temperate monsoon climate with a soil-freezing period of more than 6 months. The sampling point is located along the Suibei Highway (46.77° N, 126.84° E). The undisturbed samples were drilled, and surface soil was collected for the preparation of remolded samples. The soil is dark brown at high water content and light yellow after air-drying, pulverizing, and sieving (Figure 1).

2.2. Soil Properties

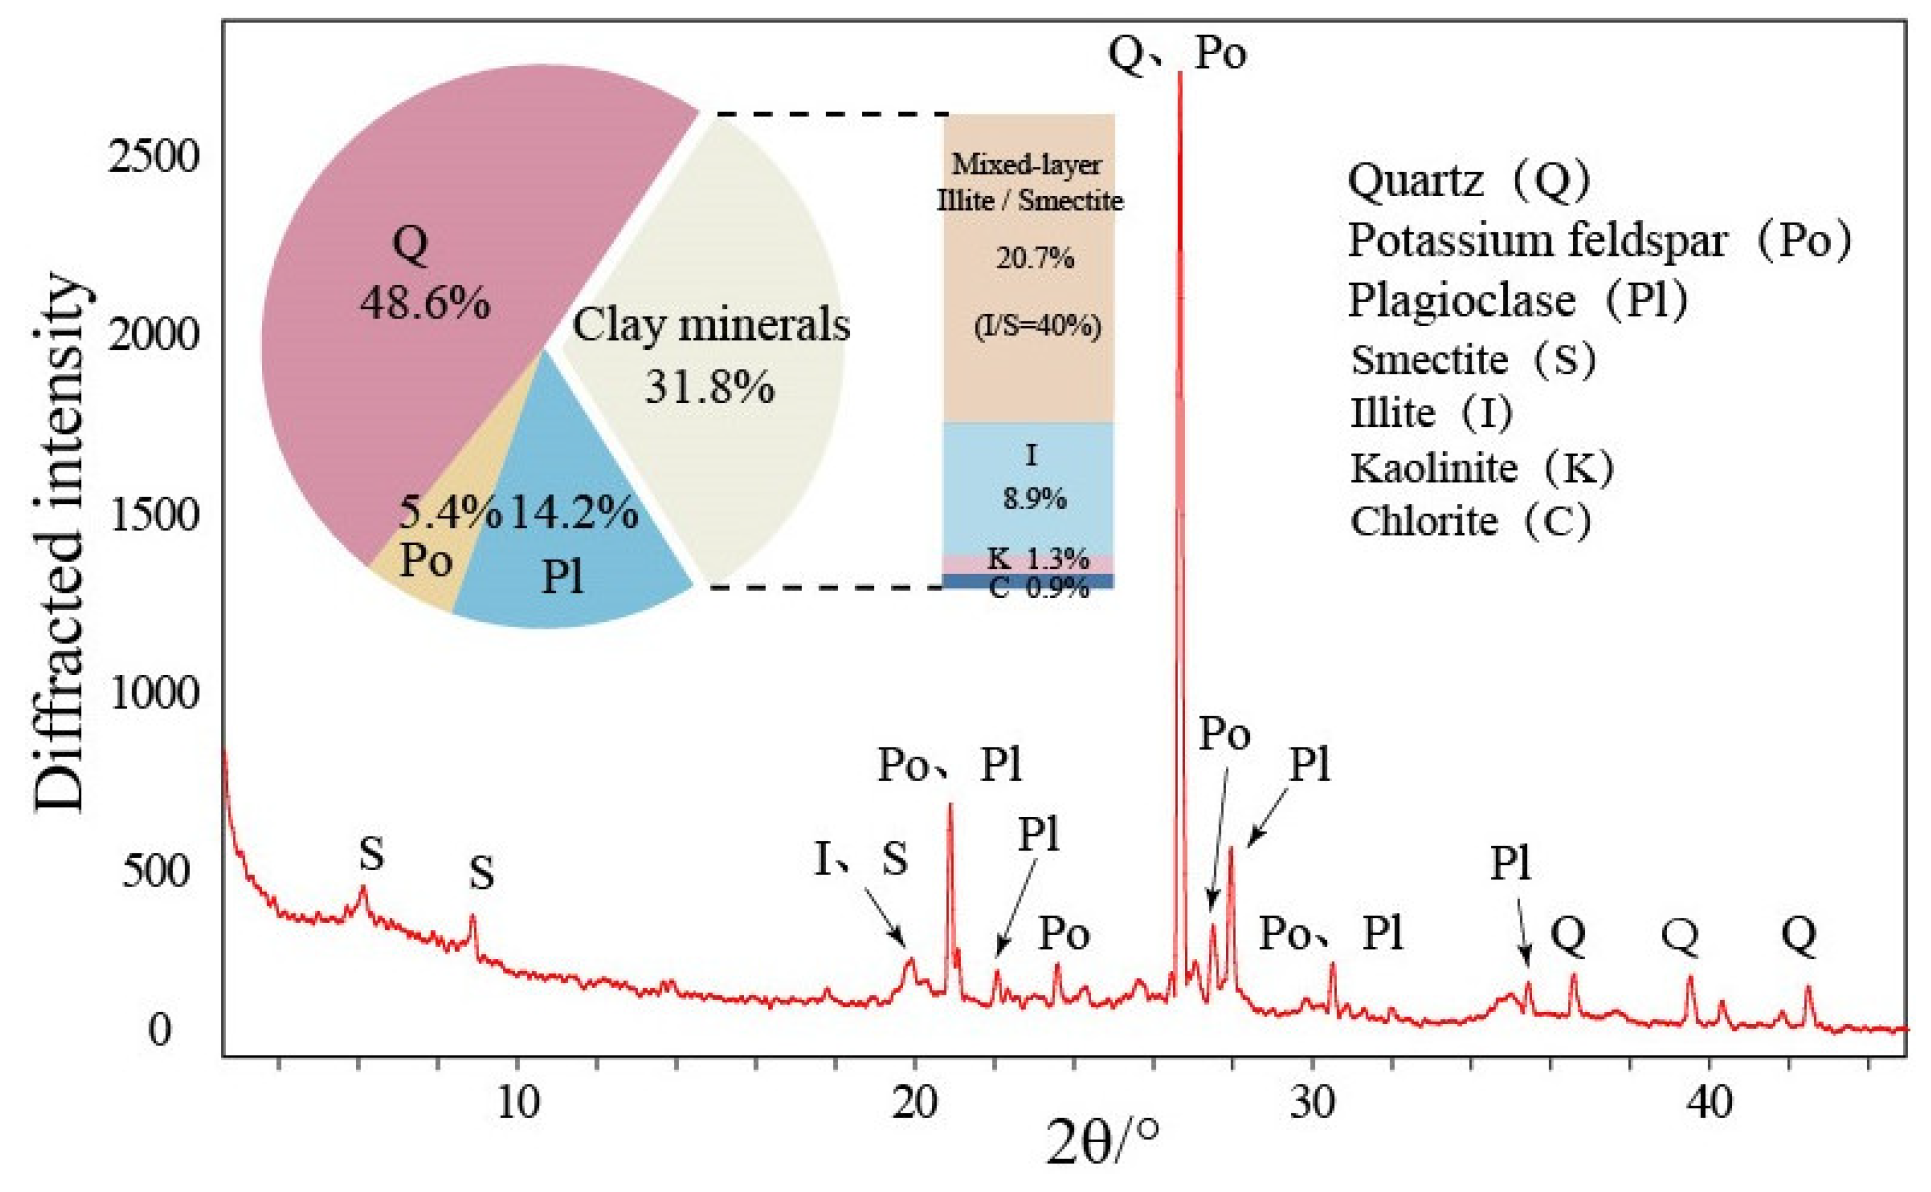
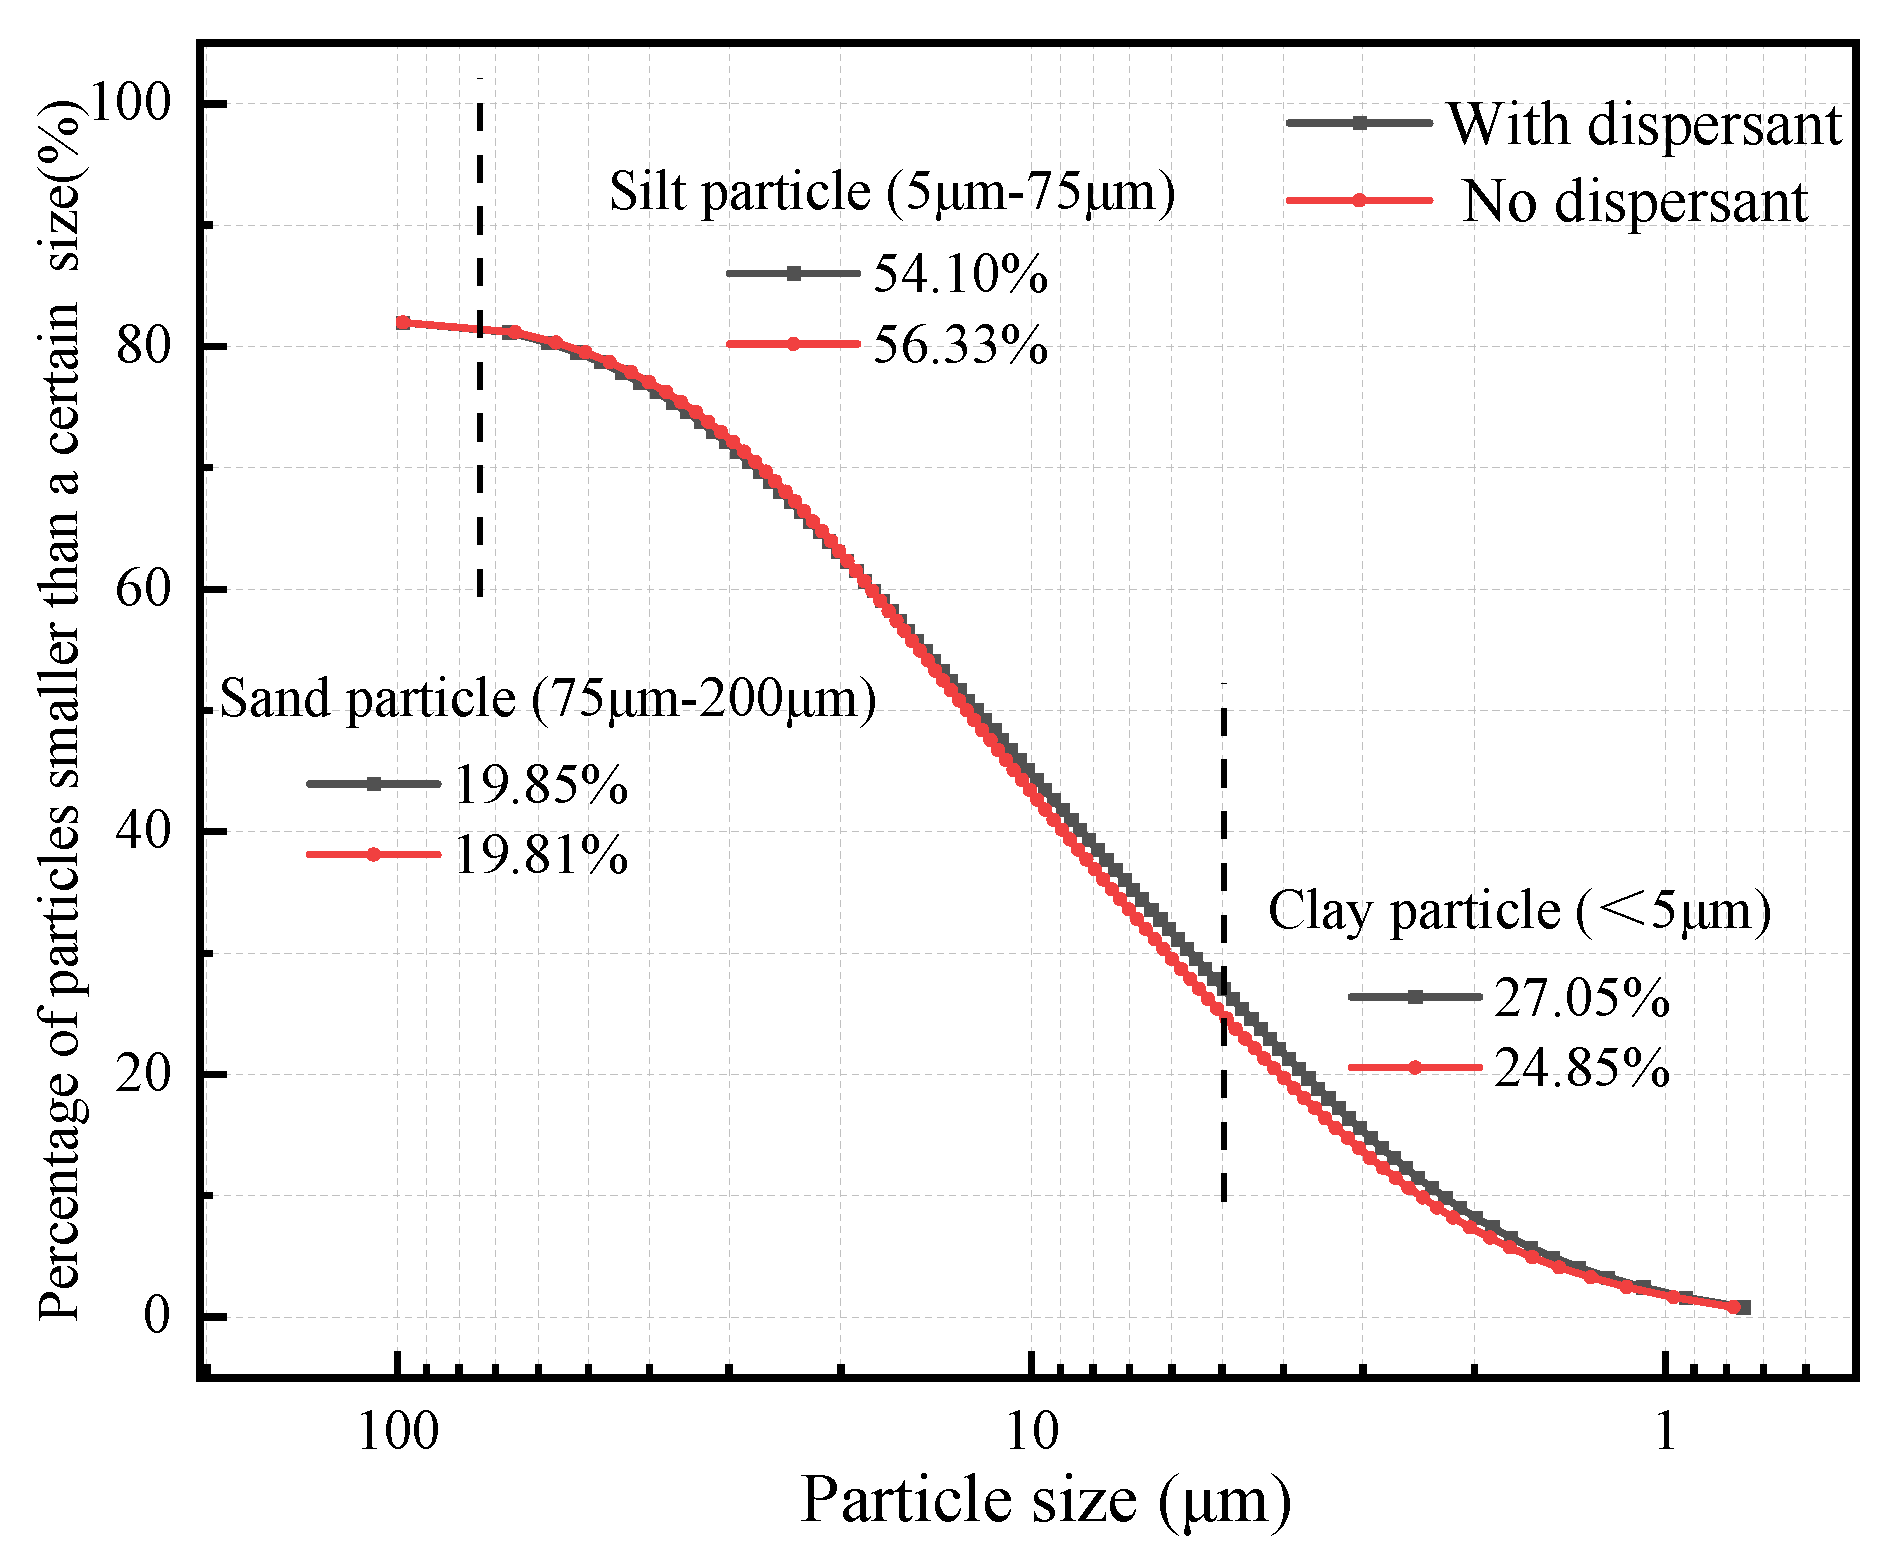
Several experiments were conducted on the expansive soil at the sampling point. The basic properties of the expansive soil are summarized in Table 1 according to GB/T50123-2019 [5]. Furthermore, mineral composition was tested by X-ray diffraction. The results show that primary minerals, which are dominated by quartz, potassium feldspar, and plagioclase, account for 68.2%; and clay minerals, which mainly include mixed-layer illite/smectite and illite, account for 31.8% (Figure 2). In addition, the particle size distribution curves with and without dispersant were determined by laser particle sizer analysis. The curves indicate that the dispersant has a slight effect on the particle size distribution, and the expansive soil is less agglomerated. After adding the dispersant, the silt (5–75 μm) content is the highest (54.10%), followed by the clay (<5 μm) content (27.05%), and the sand (>75 μm) content is the lowest (Figure 3). The free expansion rate of the soil is 76%. Thus, the expansive soil at the sampling point is clay with medium expansion potential according to GB 50112-2013 [25]. The 15 undisturbed samples were drilled within 15 m below the surface every 1 m, and they were named from top to bottom by depth as 1-1 to 1-15. The water content and density of the samples were tested, as shown in Table 2. The water content of undisturbed soil varies widely, and the density fluctuates in the range of 1.90–2.10 g/cm3.

2.3. Sample Preparation

The expansive soil samples from different depths have different water contents ( ω ) and dry densities ( ρ d ) according to Table 2. According to their relationship with the optimum water content ( ω o p ) and maximum dry density ( ρ m a x ), the samples can be divided into three types, as follows: Type I: ω ω o p , ρ d ρ m a x ; Type II: ω ω o p , ρ d ρ m a x ; and Type III: ω ω o p , ρ d ρ m a x . Representative samples of each type for the UCS and high-pressure consolidation tests were determined, as shown in Table 3.
Undisturbed and remolded samples were prepared for the tests. The expansive samples drilled from different depths are cylinders with a height of 200 mm and a diameter of 100 mm (Figure 4a). The undisturbed samples were cut (Figure 4b) to samples with sizes of 80 mm × Φ39.1 mm and 20 mm × Φ61.6 mm (Figure 4c) for the UCS and high-pressure consolidation tests, respectively. The irregular soil samples collected from the sampling point were air-dried, pulverized, and sieved (2 mm) to obtain scattered soil for the preparation of remolded samples (Figure 4d). Distilled water was uniformly sprayed on the sieved soil, and the amount of water added was determined according to the water content and density of the undisturbed samples. The mixed soil was placed for 24 h for uniform moisture distribution. The remolded samples (Figure 4e) were produced using the compaction method with the same water content, density, and size as the undisturbed samples for subsequent experiments.

2.4. USC Test

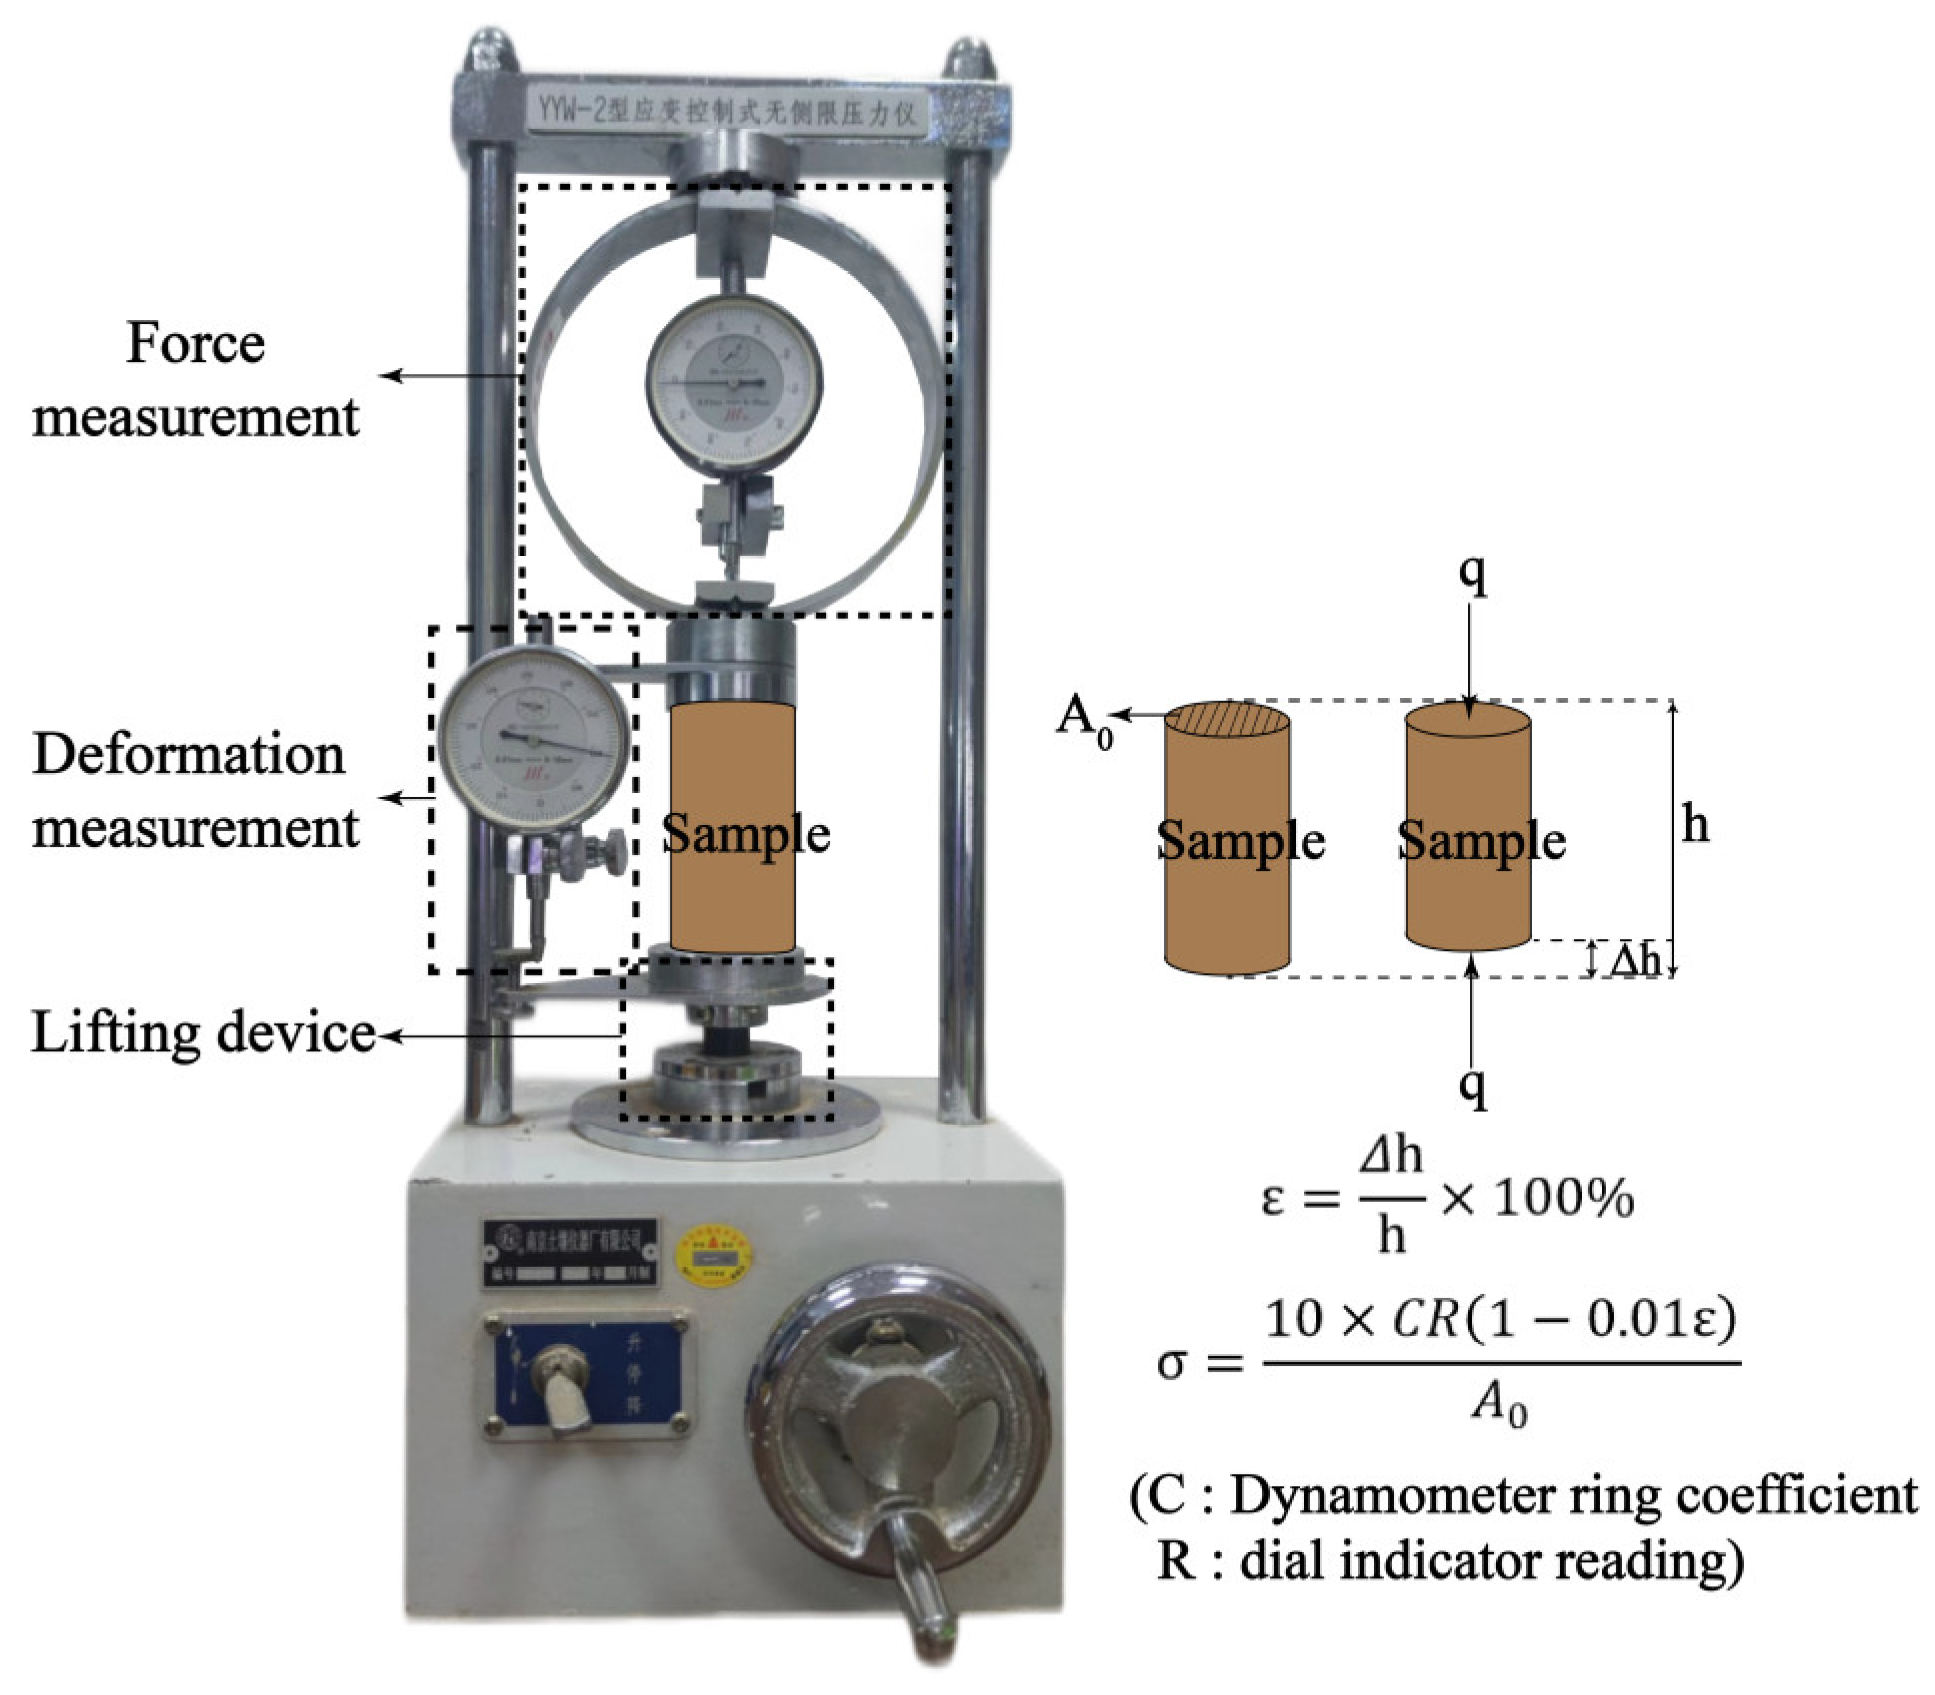
The UCS test can be used to determine the compressive properties of expansive soil under the unconfined condition. It was conducted by the strain-controlled UCS instrument (Figure 5) according to GB/T50123-2019 [5]. The strain rate was kept at 2.4 mm per minute during the experiment. The axial force reading was recorded once for each 0.2 mm increase in sample deformation. When the axial force reading reached the peak or stabilization, the test could be stopped after applying a 3–5% axial strain. The stress–strain curves were plotted according to the test results, and the peak stress of the curve q u and failure strain ε u (the strain corresponds to the peak point) were recorded to evaluate the compressive property.

2.5. High-Pressure Consolidation Test

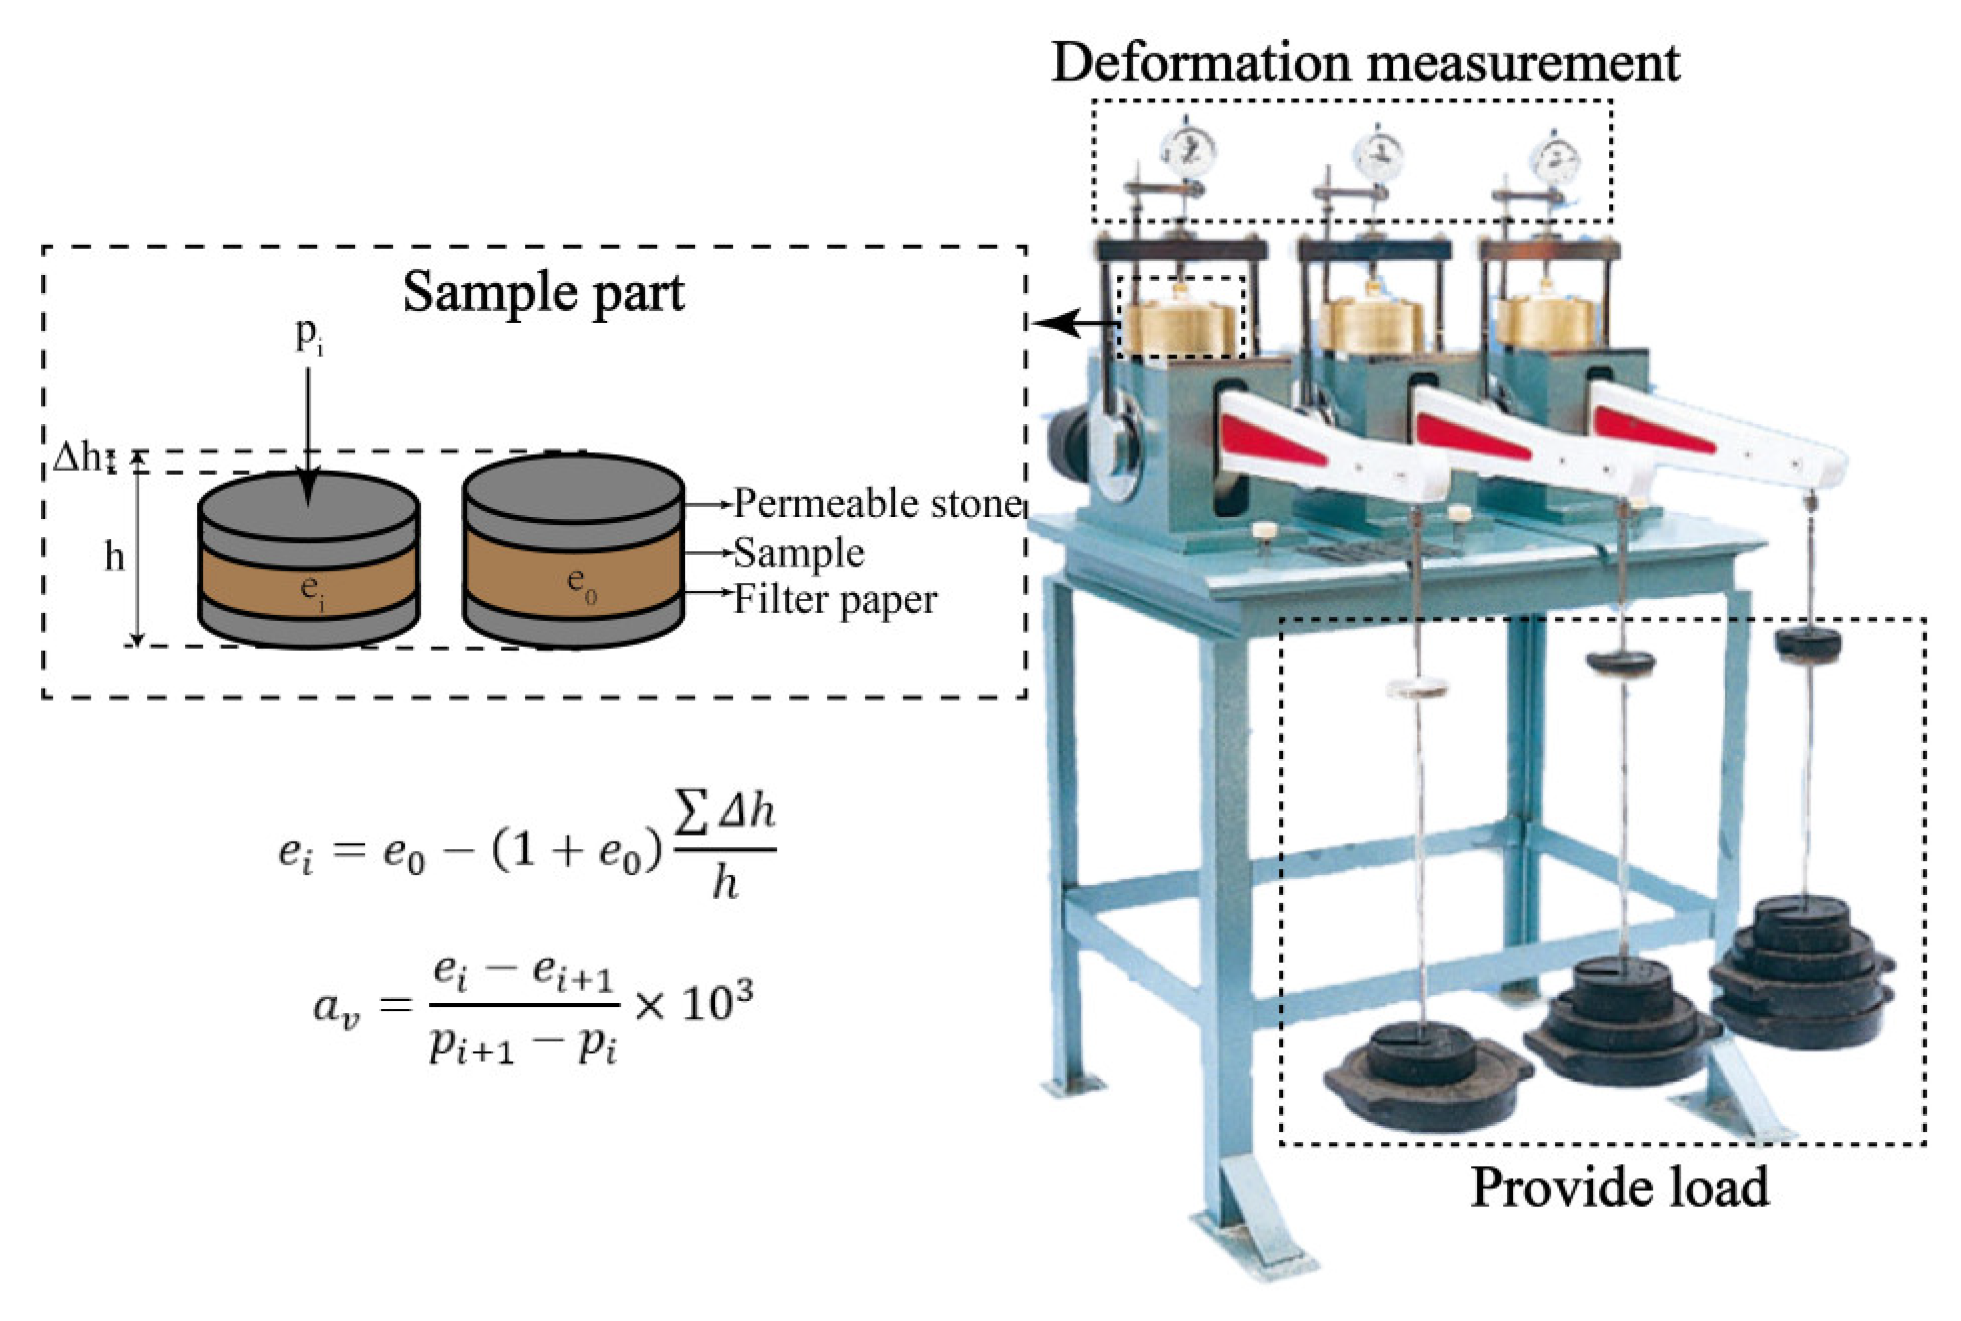
The high-pressure consolidation test was carried out to determine the compressive properties of expansive soil under the confined condition. It was conducted with the triple-lever-type consolidation apparatus (Figure 6) according to GB/T50123-2019 [5]. The rapid compression method was used in this test. The values of the load ( P c ) were used in the order of 25, 50, 100, 200, 400, 200, 100, 50, 100, 200, 400, 800, 1600, and 3200 kPa during the loading–unloading–reloading process. Consolidation was conducted for 1 h under each load level, and the deformation under each load level was recorded. The void ratio (e) of the sample under various levels of load can be calculated by monitoring the deformation, and the e l g P c curve can be graphed. In addition, the compression index ( C c ) and resilience index ( C s ) can be obtained from the curves to evaluate the compressive property of the samples, where C c takes the average slope of the linear compression section, and C s takes the average slope of the unloading section.

2.6. SEM

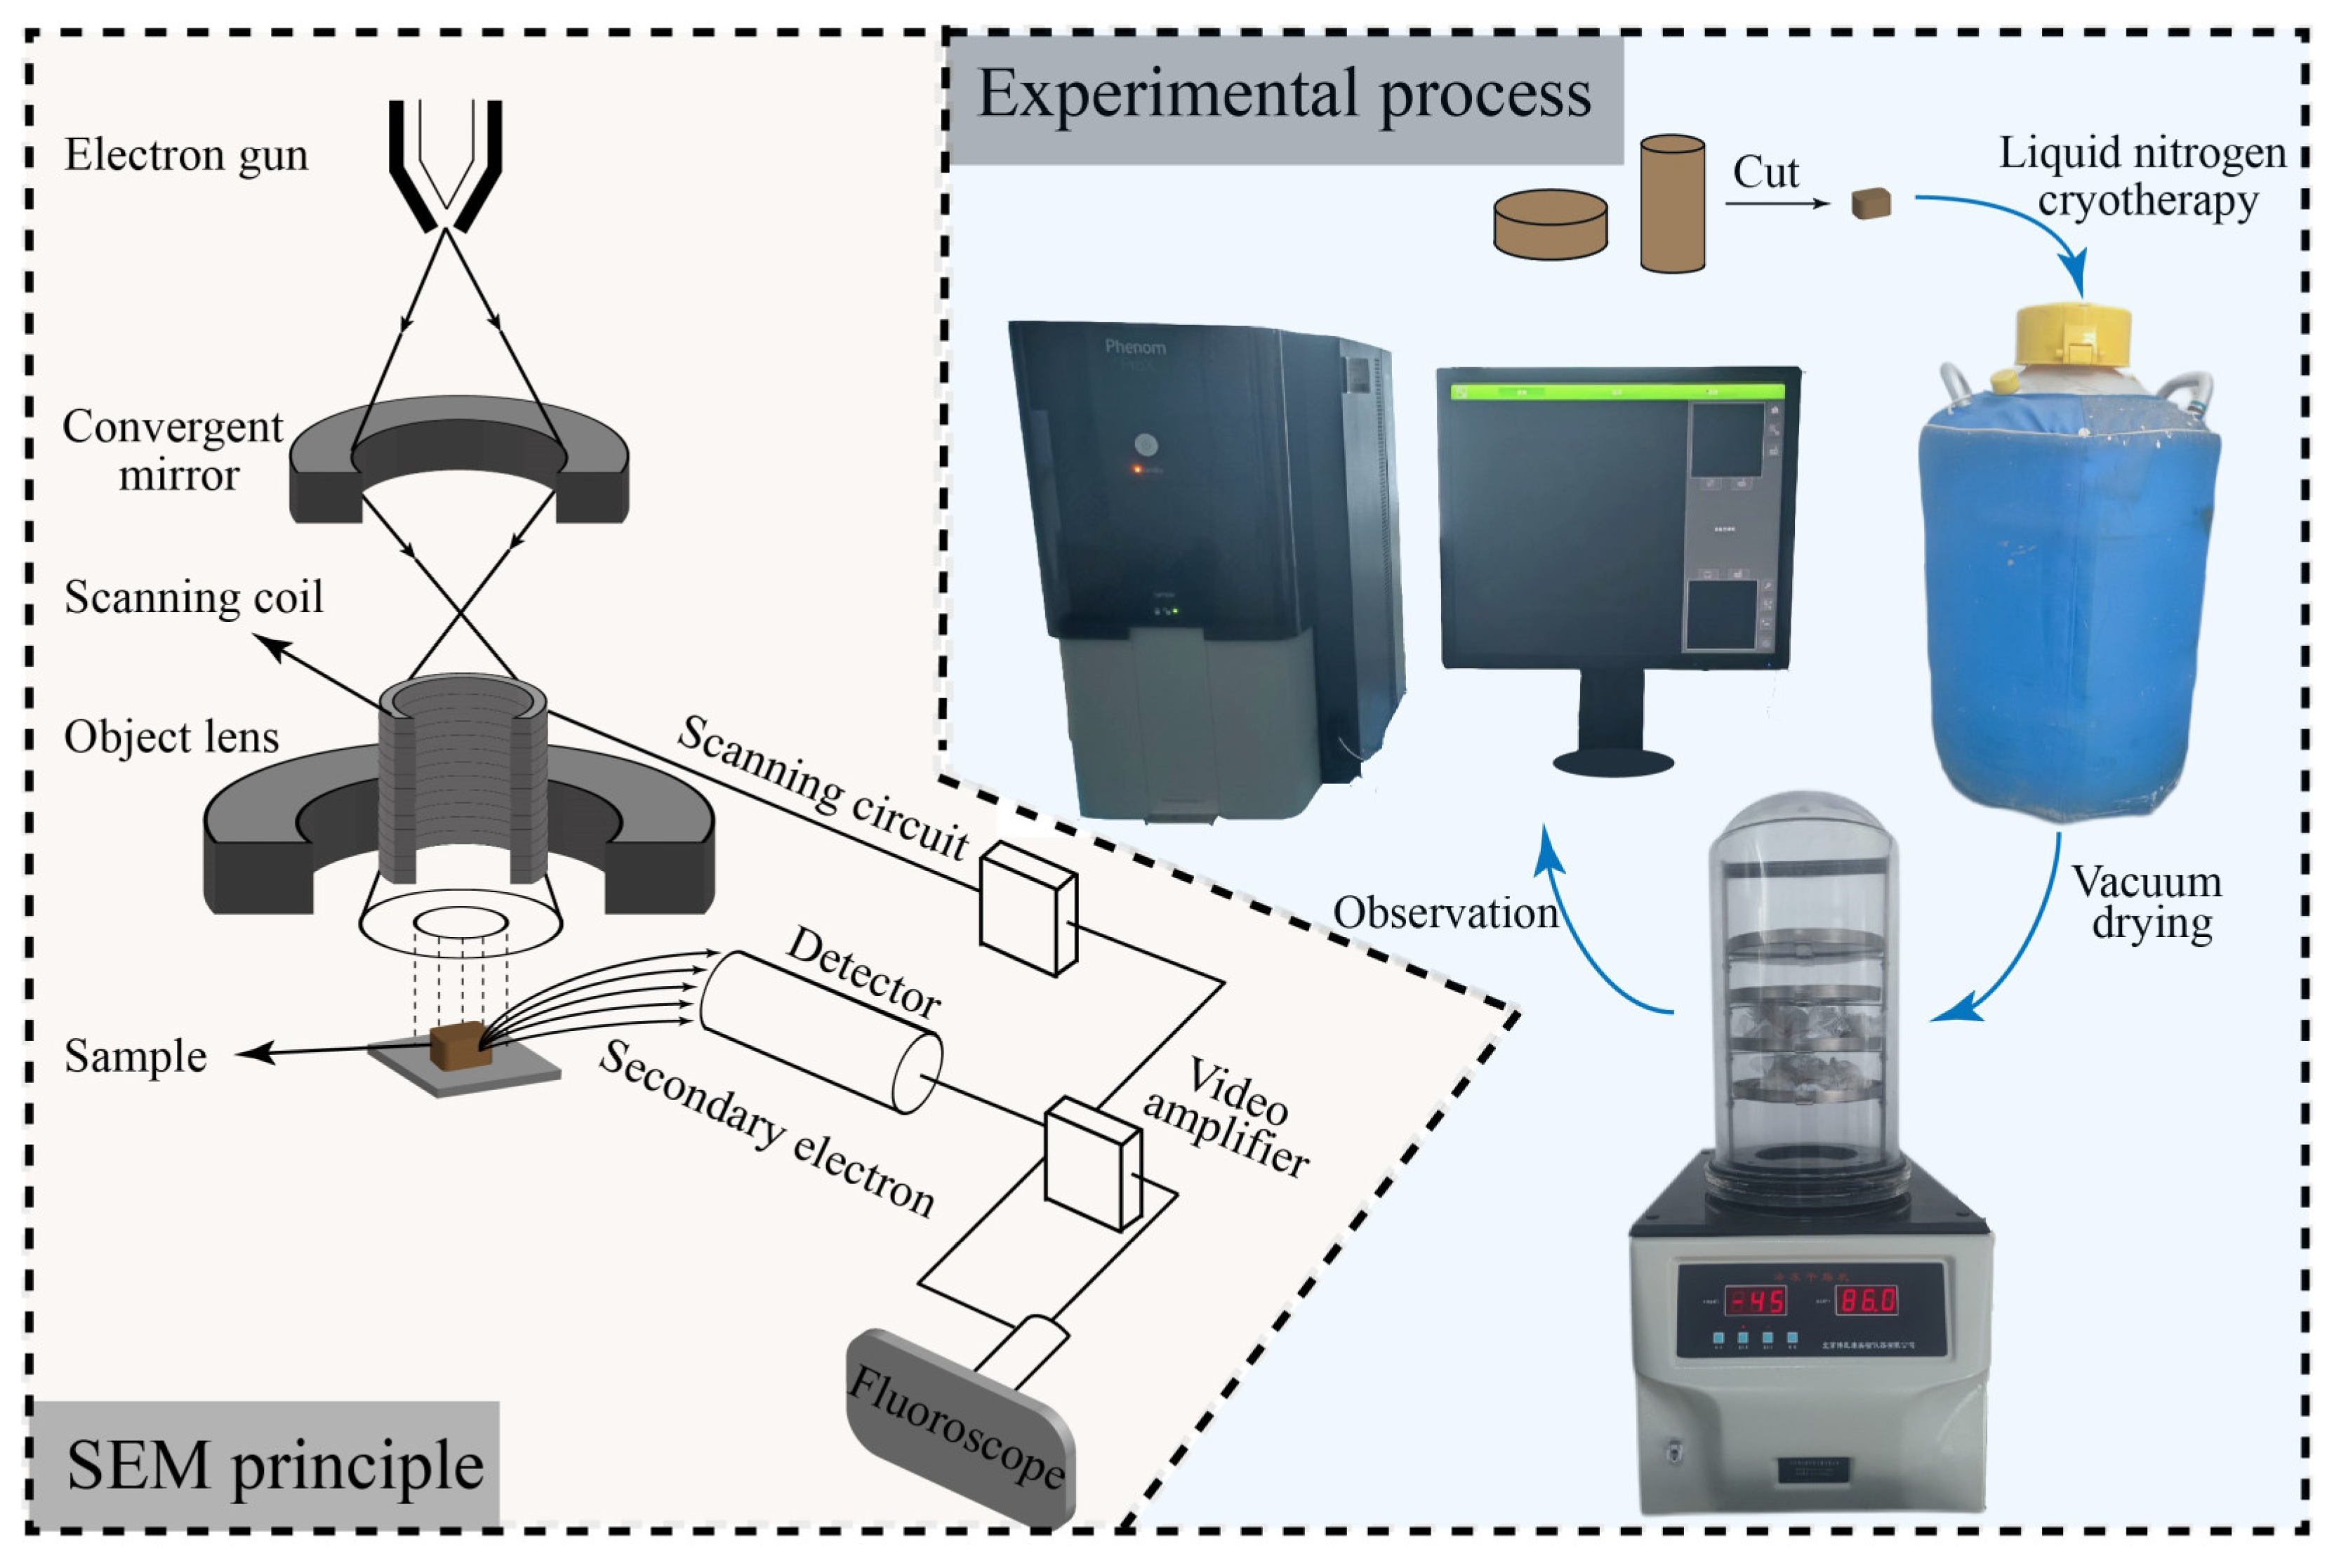
SEM was conducted to observe the microstructure of the undisturbed and remolded samples using a Phenom ProX Desktop SEM (Thermo Fisher Scientific, Waltham, MA, USA) (Figure 7). SEM can scan the surface of samples by emitting an electron beam from an electron gun and receive the reflected secondary electrons to obtain the microstructural characteristics of the soil. The size of the sample used for SEM is 1 mm × 1 mm × 1 mm. Prior to capturing the SEM photos, the sample should be frozen in liquid nitrogen and freeze-dried to avoid changes in the soil’s structure. Then, the sample was sprayed with a gold layer in a high-vacuum sputter coater and connected to the test bench by a conductive adhesive.

3. Results

3.1. Results of UCS Tests

3.1.1. Failure State

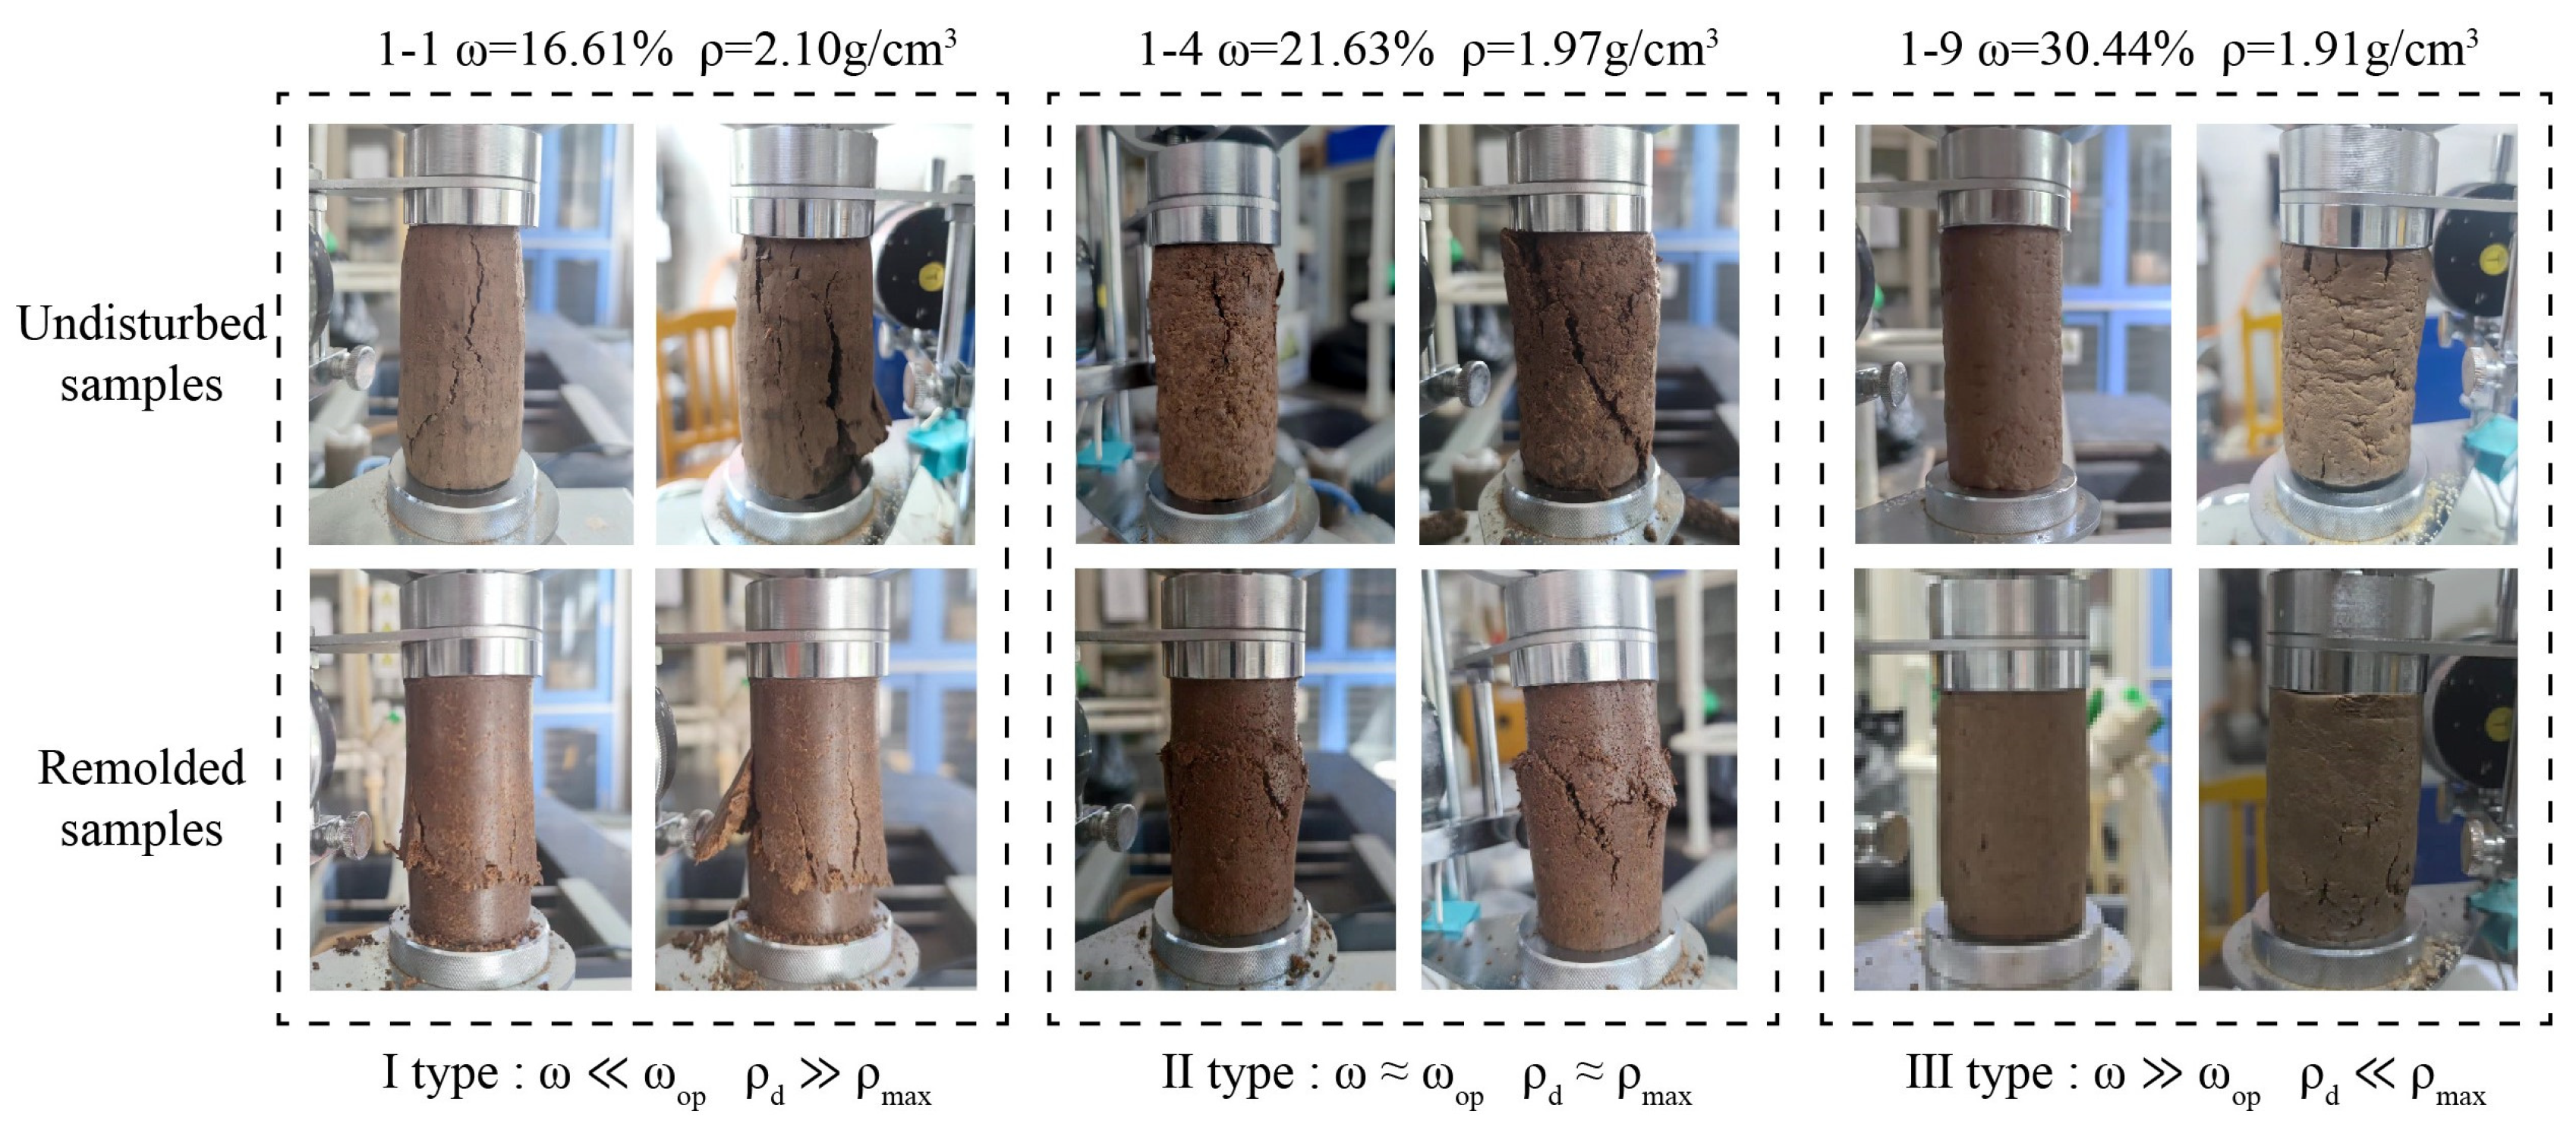
The soil samples used in the test can be classified as Types I, II, and III, as shown in Table 3. Different types of undisturbed and remolded samples exhibit distinct failure states in the UCS test. As shown in Figure 8, numerous primary microfractures are found inside the Type I undisturbed sample, and the microfractures develop and expand until they penetrate during the compression process [26,27]. Thus, the soil sample will be damaged along multiple penetrating vertical fractures. The number of primary fractures in the Type II undisturbed samples is lower than that in Type I. Thus, a complete and clear shear failure surface will be formed after the destruction along the vertical fractures. Simultaneously, the remolded samples of Types I and II have fewer internal cracks, and shear cracks are not developed during the compression process. The samples mainly show bulging deformation when damaged; the cracks open laterally, and the location of bulging is mainly related to the uniformity of the sample making [2]. The failure state of the Type III undisturbed sample is similar to that of the remolded sample, which is manifested as vertical compression, and the diameter of the sample becomes larger without shear damage surface formation.

3.1.2. Stress–Strain Curve

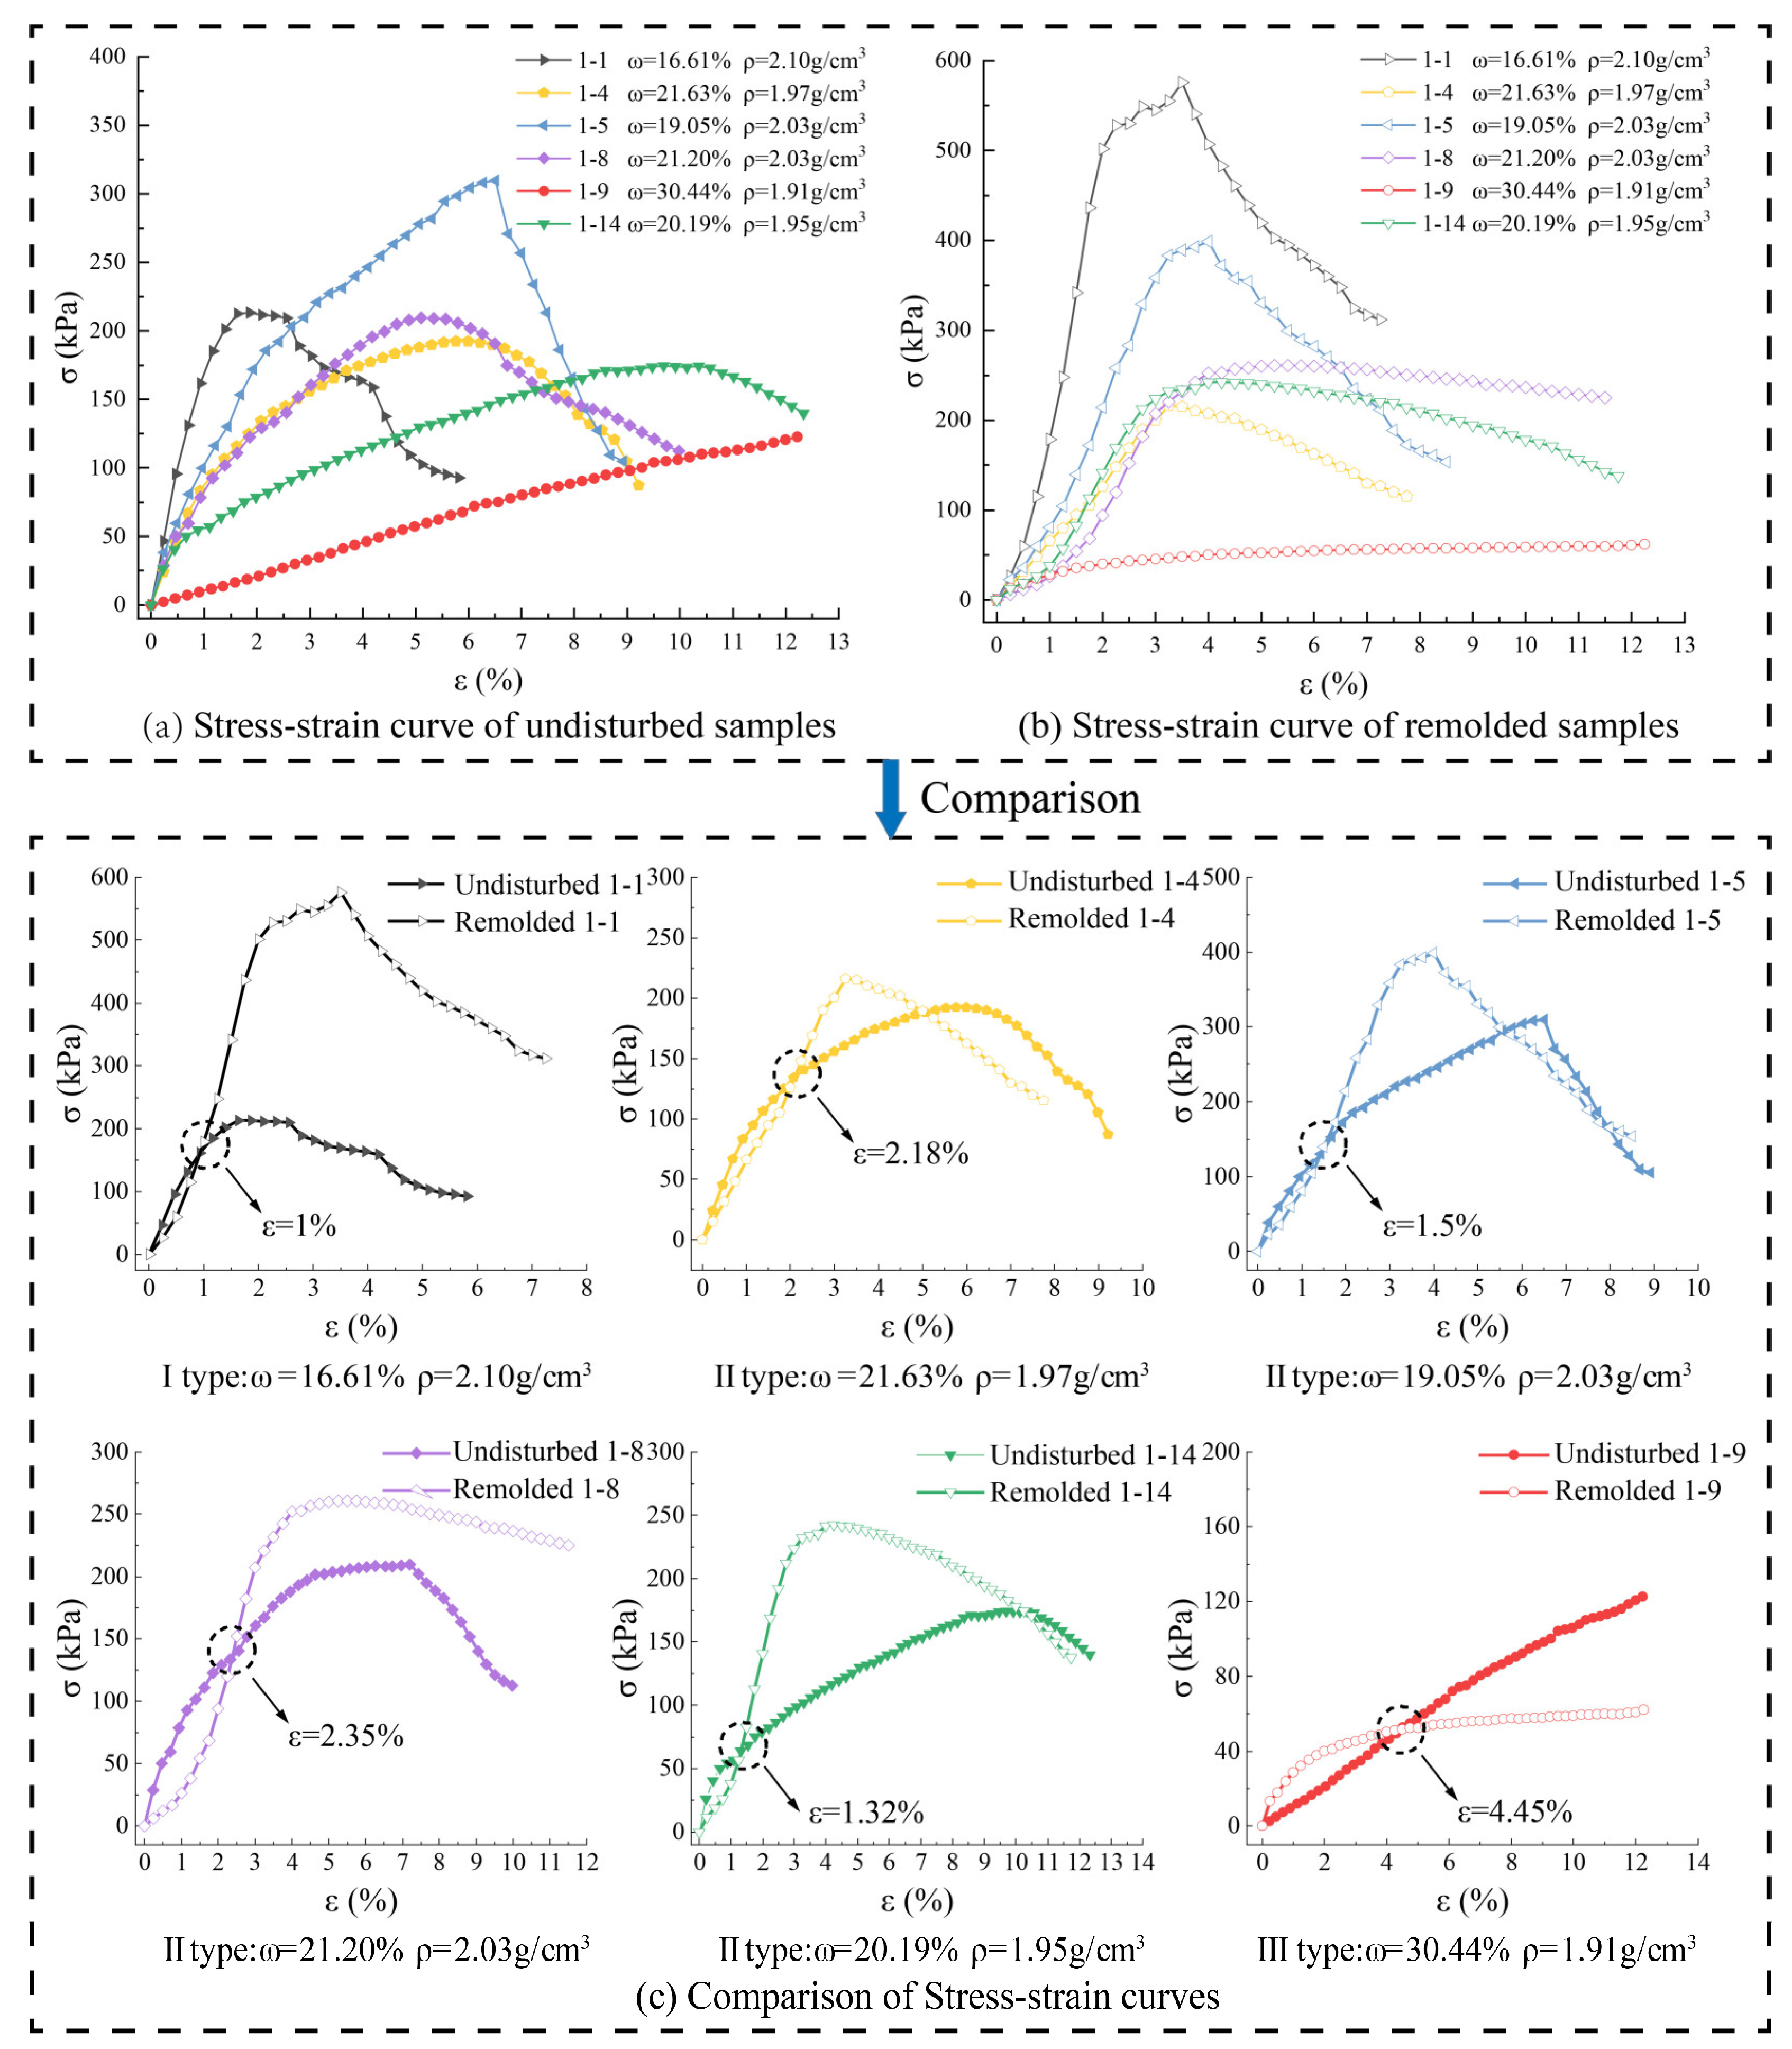
The stress–strain curve can reflect the structural connection and particle arrangement. The structural connection is the sum of the interaction forces between particles, and it includes occlusion and friction between particles, the association of water, and chemical bonding. The particles’ arrangement mainly reflects the shape, orientation, grain size distribution, and spatial arrangement of the particles [28]. A higher slope before the peak point of the curve indicates a better structural connection, and a greater slope after the peak point represents a more unstable particle arrangement. As shown in Figure 9a, the undisturbed and remolded samples of Types I and II are all strain softening, which shows brittle failure. Furthermore, the variation rules of the slope reveal that with the increase in water content and the decrease in density, the structural connection is gradually weakened, and the particle arrangement is gradually stabilized. By contrast, the undisturbed and remolded samples of Type III are strain hardening, and the stress continues to grow with the increase in strain.
The curves of the remolded samples of Types I and II are higher than those of the undisturbed samples based on the comparison of the stress–strain curves of each type of sample (Figure 9b). In the early stage of compression, before an axial strain of approximately 1–2.5%, the slope of the rising section of the undisturbed sample curve is larger than that of the remolded sample. Thus, the undisturbed samples have a stronger association in this range. When the axial strain continues to increase, the primary fractures continue to develop to deteriorate strength, which results in the slope of the rising section of the undisturbed sample curve being gradually smaller than that of the remolded sample. The peak compressive strength of the undisturbed samples of Types I and II is smaller than that of the remodeled sample, whereas the peak compressive strength of the Type III undisturbed sample is higher than that of the remolded sample. As the water content increases and the density decreases, the difference between the peak strengths of the undisturbed and remolded samples gradually decreases. It even surpasses that when the water content is much greater than the optimum one.

3.1.3. Parameters of Strength

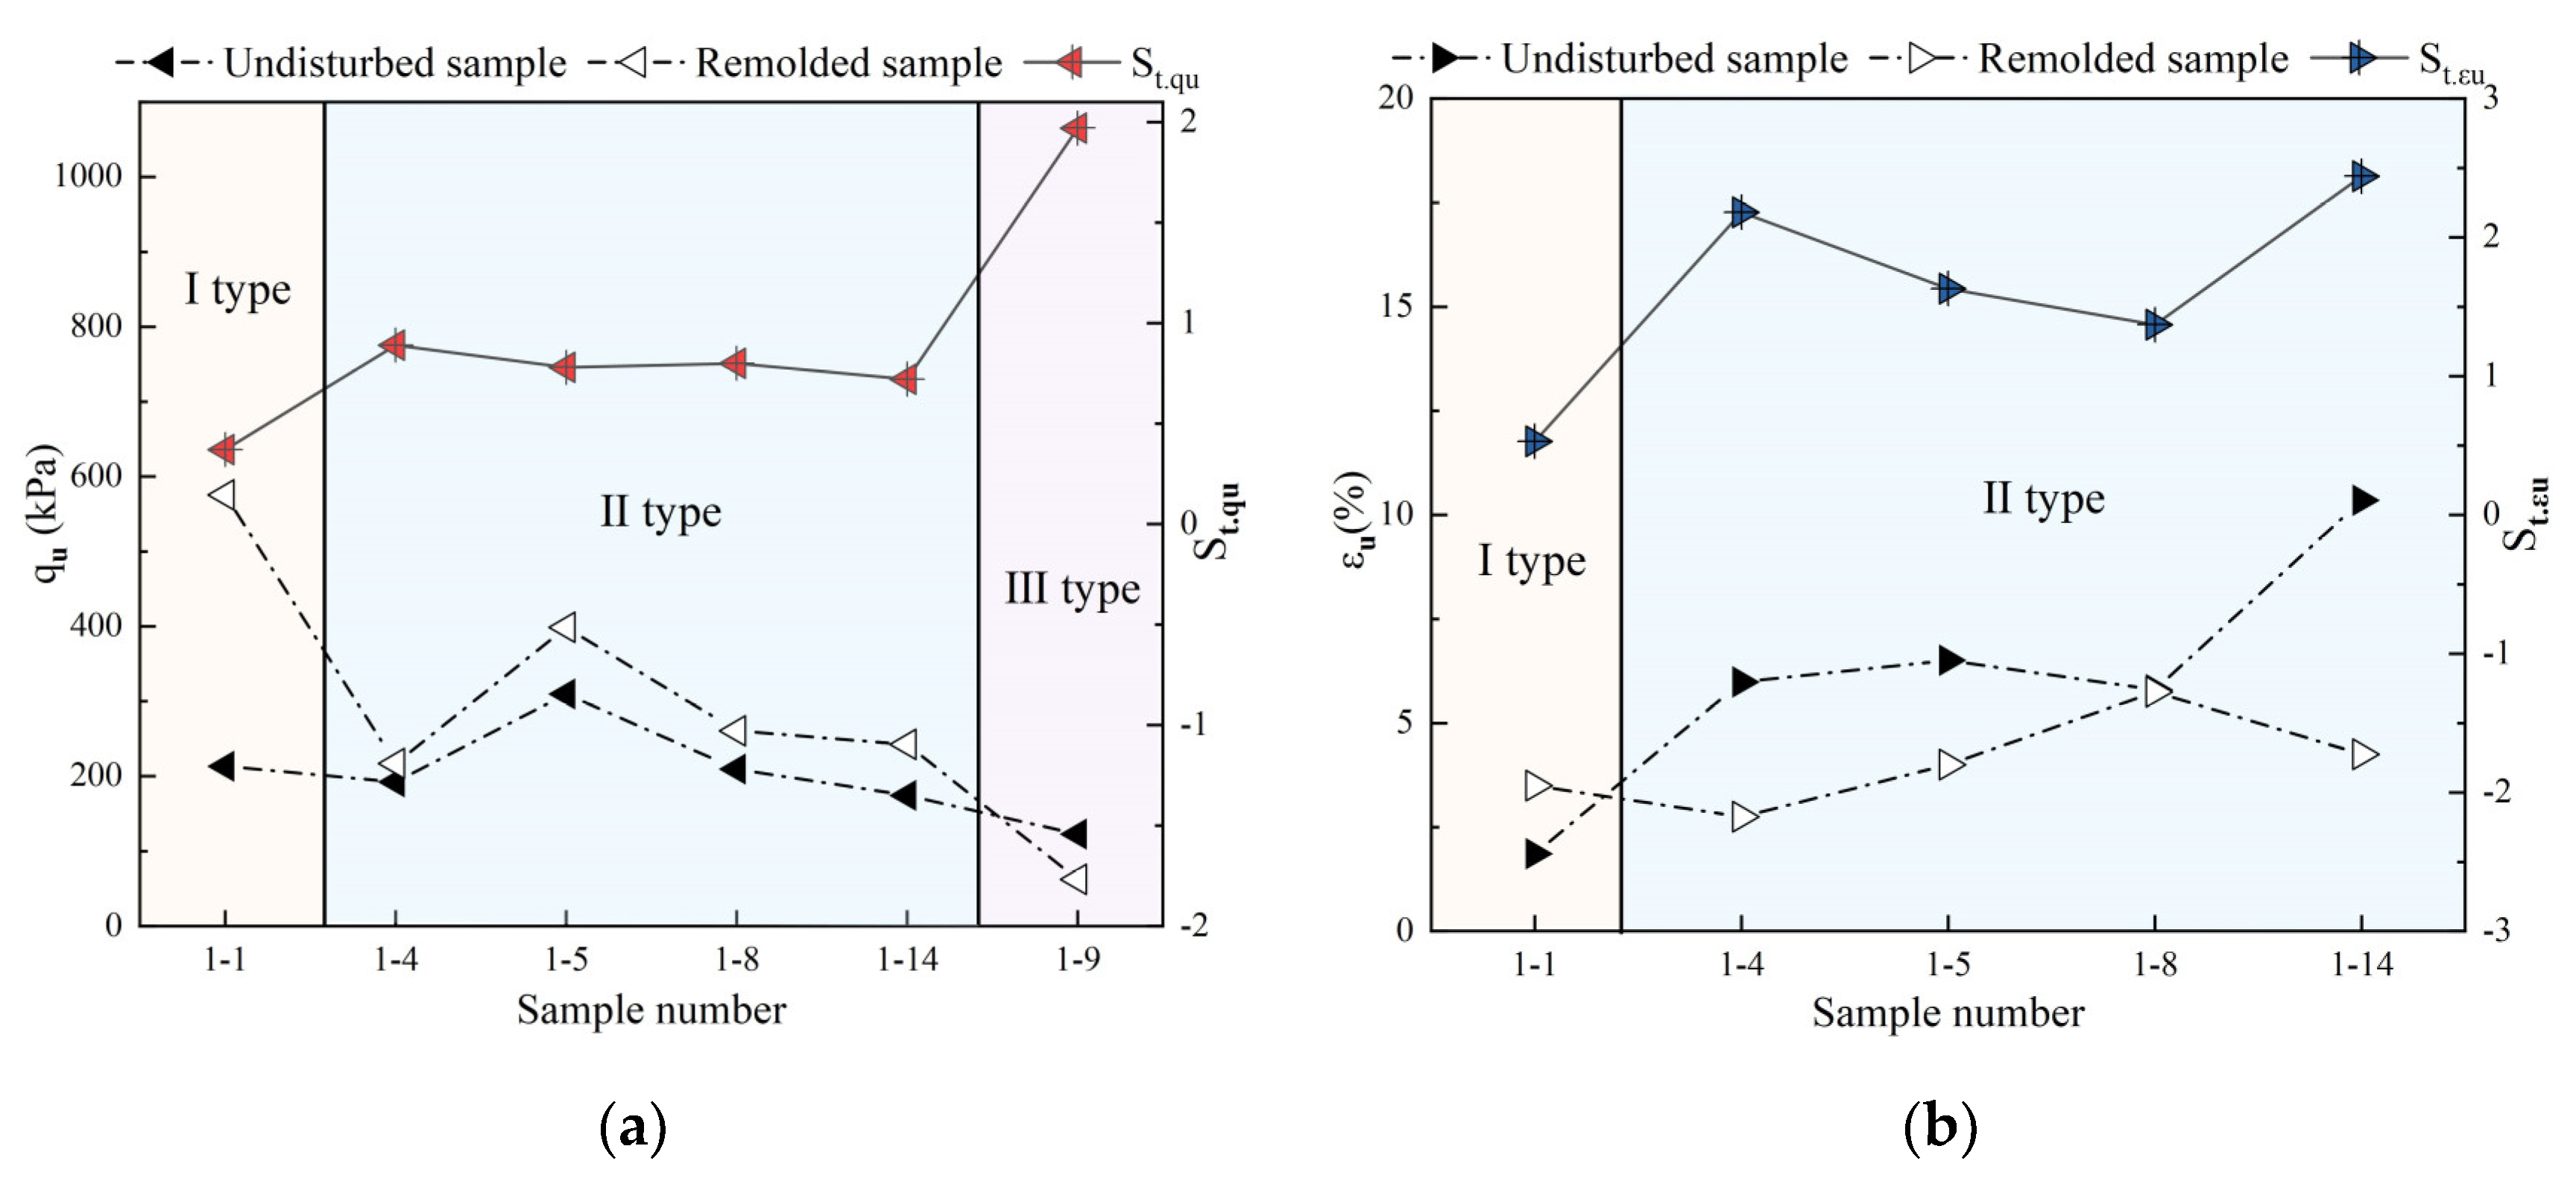
The peak strength of the stress–strain curve can be noted as the UCS q u , and the strain that corresponds to the peak point can be noted as the failure strain ε u . The ratios of q u and ε u between the undisturbed and remodeled samples are calculated as stress sensitivity S t . q u and strain sensitivity S t . ε u , respectively, to explore the structural strength of expansive soil under the unconfined condition. The two parameters enable the evaluation of the expression of the structural strength in terms of strength and resistance to deformation under the unconfined condition. The sensitivity parameters are calculated, as shown in Equations (1) and (2), where q u . u   is the q u of the undisturbed sample, q u . r   is the q u of the remolded sample, ε u . u   is the ε u of the undisturbed sample, and ε u . r   is the ε u . of the remolded sample. As shown in Figure 10, S t . q u is lower than 1 for the samples of Types I and II. Conversely, S t . q u is greater than 1 for the samples of Type III. Meanwhile, the S t . ε u of Type II samples is above 1 and higher than that of Type I. The stress of Type III samples keeps increasing with strain, such that S t . ε u does not exist. Overall, S t . q u and S t . ε u rise with the increase in water content and the decrease in density.
S t . q u = q u . u   / q u . r   ,
S t . ε u = ε u . u   / ε u . r   ,
The sample is susceptible to lateral displacement when compressed under the unconfined condition, and the soil can undergo shear deformation along the weak surface because of the large number of primary fractures contained in the undisturbed sample. Therefore, fully reflecting the superiority of the undisturbed samples in structural connection and particle arrangement is difficult. Thus, the advantage produced by structural strength is less than the disadvantage caused by primary fractures, which causes the S t . q u of the samples of Types I and II to be less than 1. Expansive soil swells with water and shrinks with water loss, which makes the microfractures more developed with a lower water content in the undisturbed samples; as a result, the S t . q u and S t . ε u of the Type I sample are smaller than those of the Type II sample [29]. Similarly, the expansion of the soil particles at a higher water content fills the fractures, the deterioration of fractures on q u . u   is weakened, and the advantage produced by the structural strength of the undisturbed sample is greater than the disadvantage caused by the primary fractures. Ultimately, the S t . q u of the Type III sample is greater than 1. Consequently, the expression degree of structural strength in terms of compressive strength and resistance to deformation rises with the increase in water content and the decrease in density under the unconfined condition.

3.2. Results of High-Pressure Consolidation Test

3.2.1. e l g P c Curve

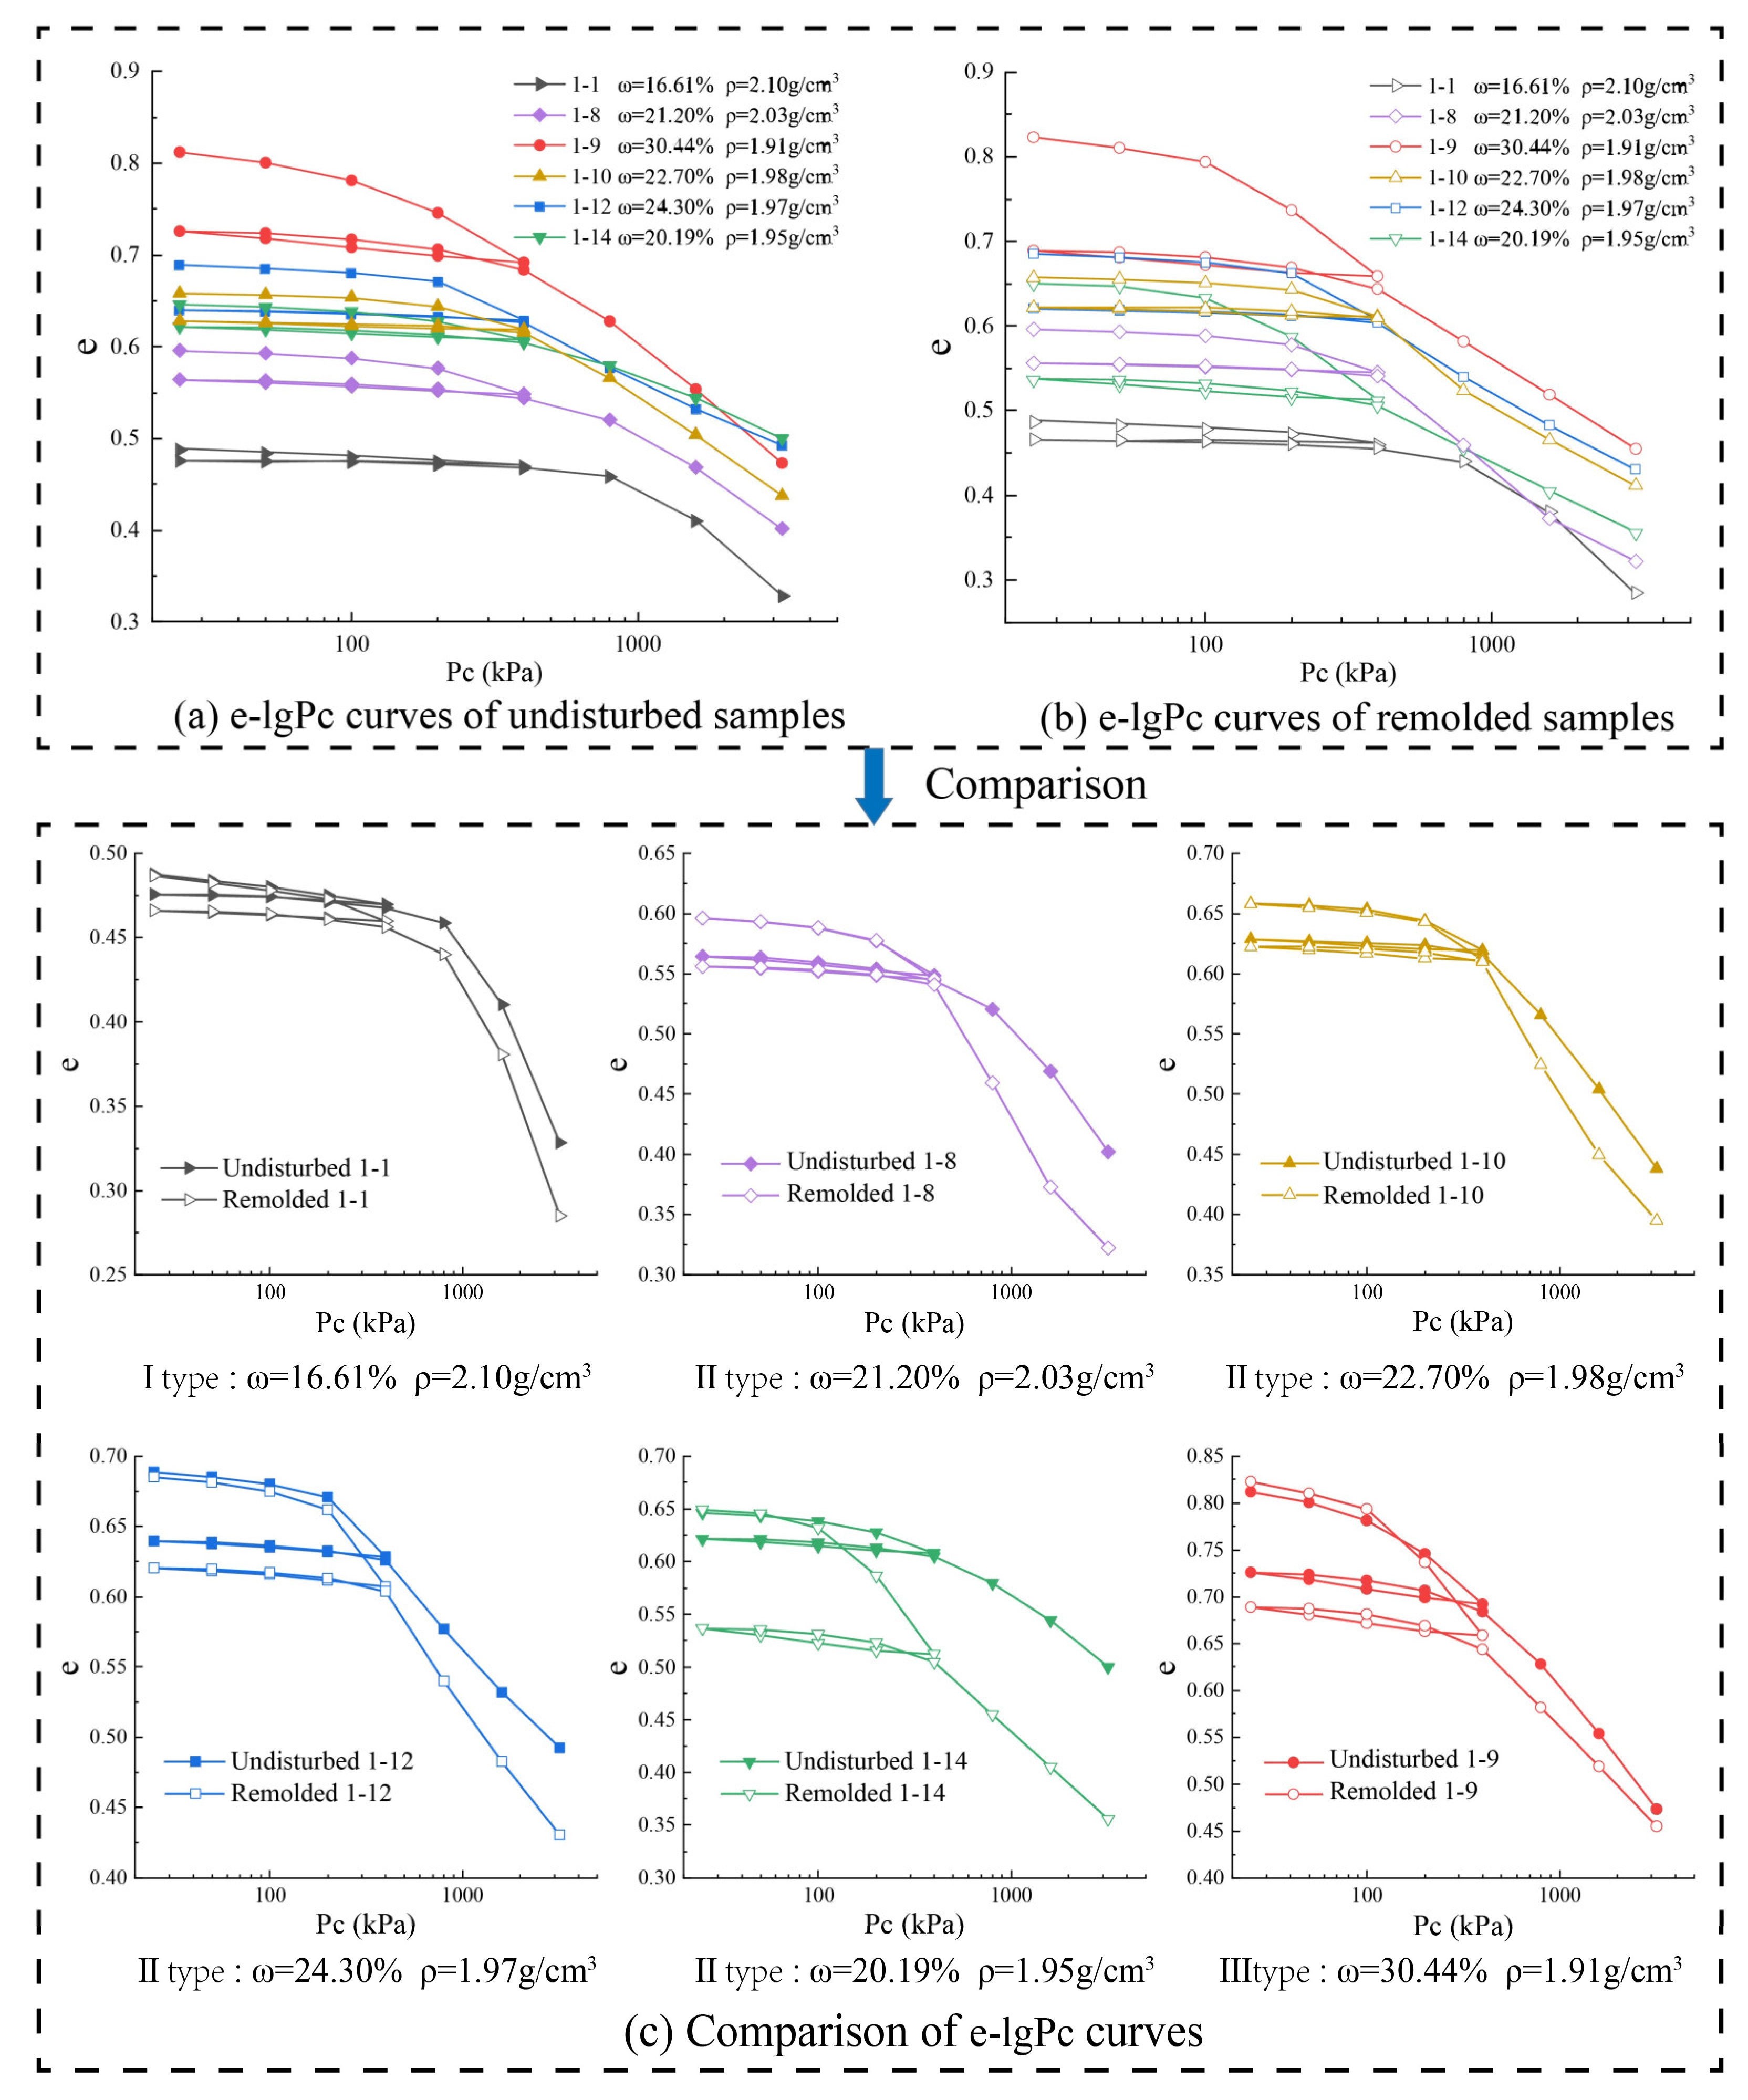
Similarly, according to the difference in water content and density, the samples can be divided into three types, as follows: Type I: ω ω o p , ρ ρ m a x ; Type II: ω ω o p , ρ ρ m a x ; and Type III: ω ω o p , ρ ρ m a x . For the confined condition, the deterioration of primary fractures is effectively suppressed, and the interaction between particles is the key factor to determine the ability of the samples to resist loading. The shape of the e l g P c curve of each sample in Figure 11a is relatively consistent. At the beginning of the experiment, the samples were subjected to low loads, and the connection between the particles was not damaged. As a result, the curve of the 0–100 kPa section is relatively flat. With the gradual increase in the load, the structural linkage and particle arrangement of the samples are disrupted and reorganized, and the water is continuously discharged. Thus, the void ratio decreases rapidly, and the slope of the curve changes in the range of the 100–400 kPa section and steepens in the range of the 400–3200 kPa section. The position of the e l g P c curve is strongly influenced by the basic properties of the soil sample; that is, the curve is positioned higher as the soil sample becomes denser and the water content increases. All undisturbed curves are higher than the remolded curves (Figure 11b), which indicates that the better structural connection and particle arrangement of the undisturbed samples make them more resistant to deformation when subjected to the same vertical load under the confined condition.
The compression index ( C c ) and resilience index ( C s ) of the soil can be obtained from the e l g P c curve (Figure 11), where C c takes the average slope of the linear compression section, and C s takes the average slope of the unloading section (Table 4). The C c of the undistributed samples of Types I and Type II is lower than that of the remolded samples. By contrast, the C c of the Type III undisturbed sample is higher than that of the remolded sample. The reason is that the Type III sample has a larger water content, more clay particles, and more weakly bound water, which makes it difficult for the water to escape. Therefore, the advantages in the occlusion and arrangement of the particles in undisturbed samples are not fully presented. For a certain type of sample, the unloading curves of the undisturbed and remolded samples are nearly parallel, and the values of C s of the two are closer to each other without a uniform magnitude relationship.

3.2.2. Elastic and Residual Deformation

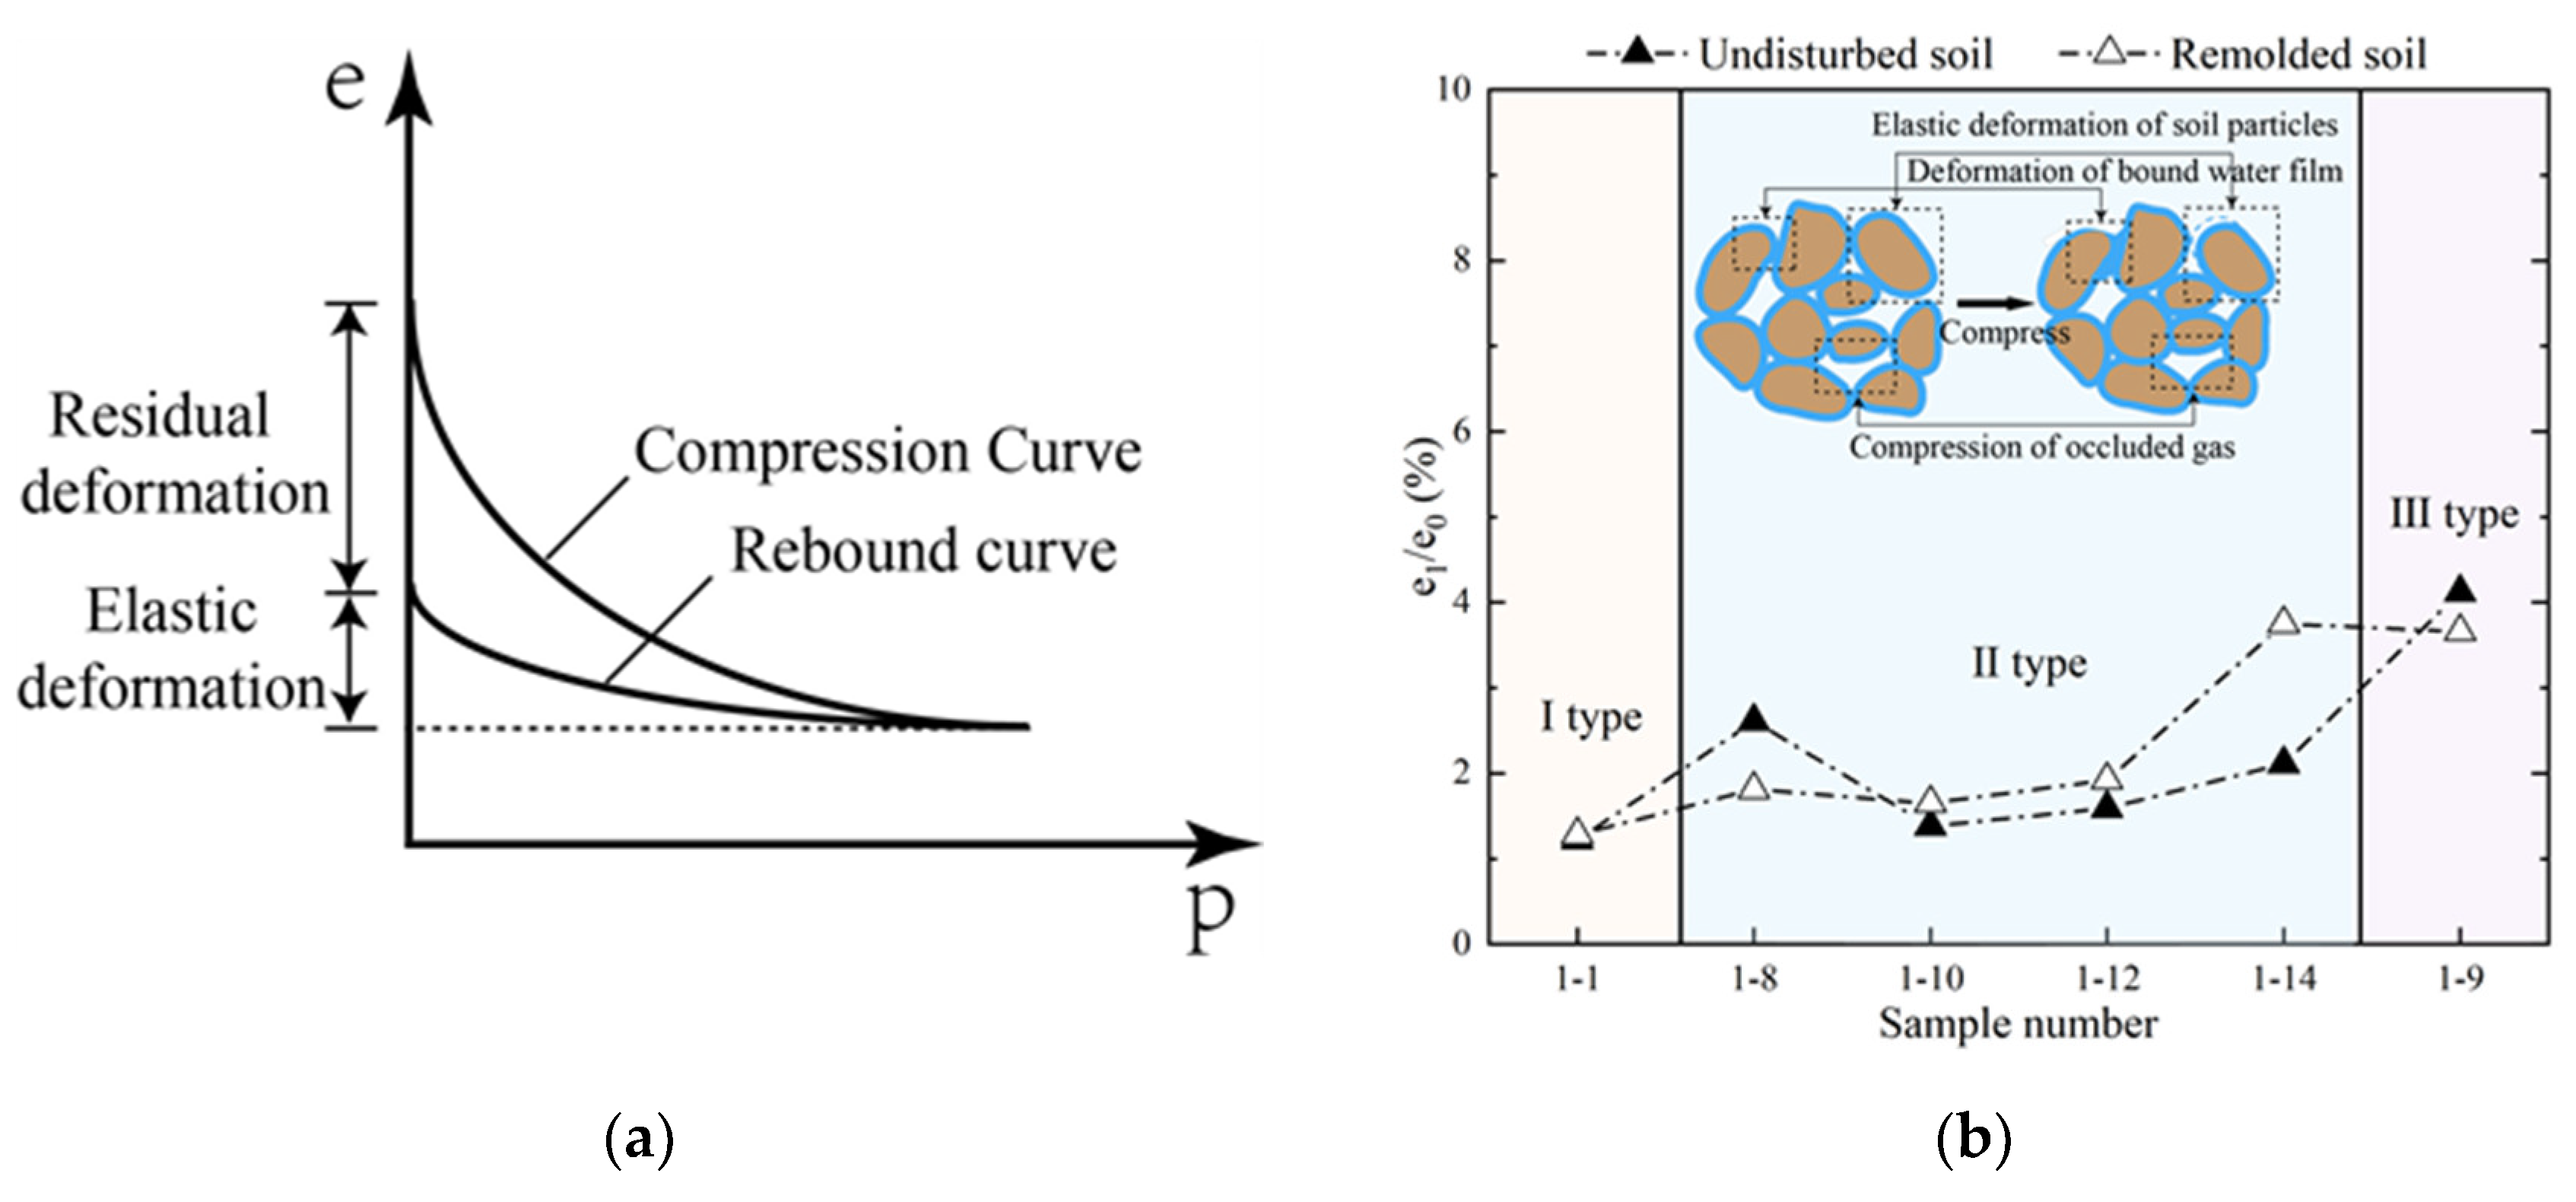
The essence of the consolidation process is the reduction in void ratio and the escape of water and gas. The soil is not an ideal elastomer during the loading–unloading process, and the compression and rebound curves do not coincide (Figure 12a). The deformation that can be and cannot be recovered after unloading is called elastic deformation e 1 and residual deformation e 2 , respectively. The initial void ratio of the sample is e 0 .
e 1 mainly comes from the deformation of the bound water film, the compression of the occluded gas, and the elastic deformation of the soil particles (Figure 12b) [30]. The difference in e 1 between the undisturbed and remolded soils during unloading is minimal, with a maximum difference of 1.65%. The reason is that they have the same water content and density. Along with the increase in water content and the decrease in density, the bound water film is more easily deformed, and the occluded gas is more vulnerable to compression. These conditions lead to an increasing trend of e 1 / e 0 of the undisturbed and remolded samples.
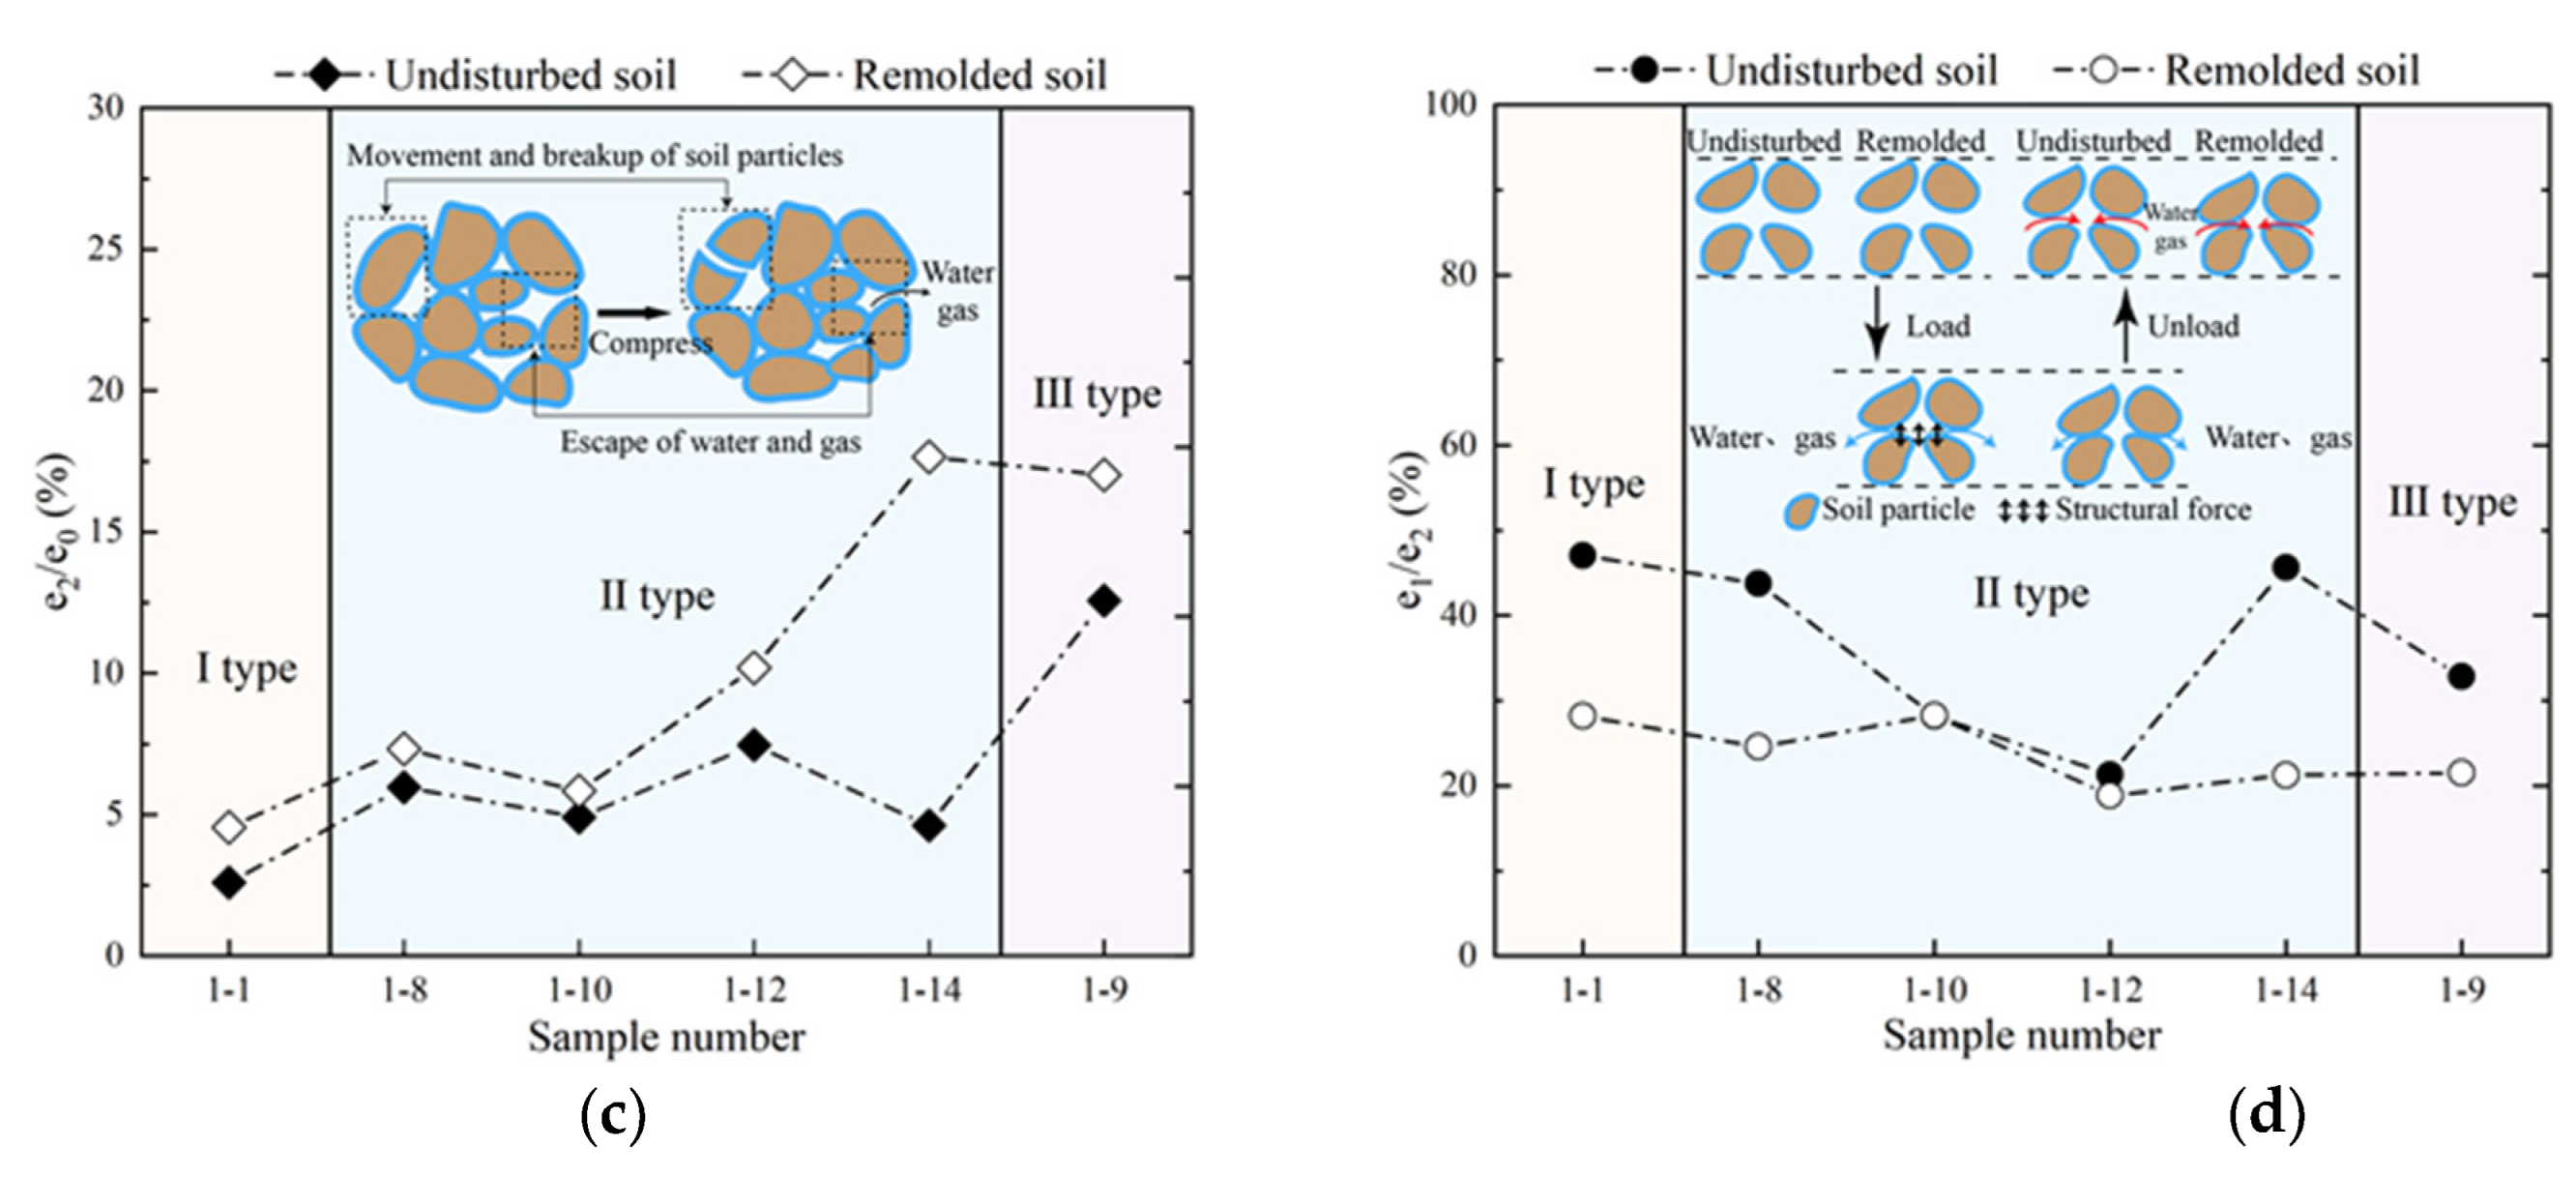
In addition, e 2 mainly originates from the escape of water and gas and the movement or fragmentation of soil particles (Figure 12c) [30]. As the water content increases and the density decreases, the water and gas become more prone to discharge, and the particles are more likely to move or break. These factors cause a growing trend of e 2 / e 0 in the undisturbed and remolded samples. The e 2 values of the undisturbed and remolded samples of Types I, II, and III are larger than those of e 1 . Moreover, the e 2 of the undisturbed samples is smaller than that of the remolded samples, with a maximum difference of 13.04%. The reason is that the undisturbed soil has undergone various loading and unloading behaviors over a long geological time, and the soil particles gradually move to a more stable position after several deformations. This migration enhances the structural connection and particle arrangement ability. In other words, the undisturbed sample has structural force. The existence of structural force significantly reduces the e 2 of the undisturbed sample compared with that of the remolded sample and exhibits a stronger ability to resist compressional deformation under vertical loading (Figure 12d).

3.2.3. Structural Yield Stress

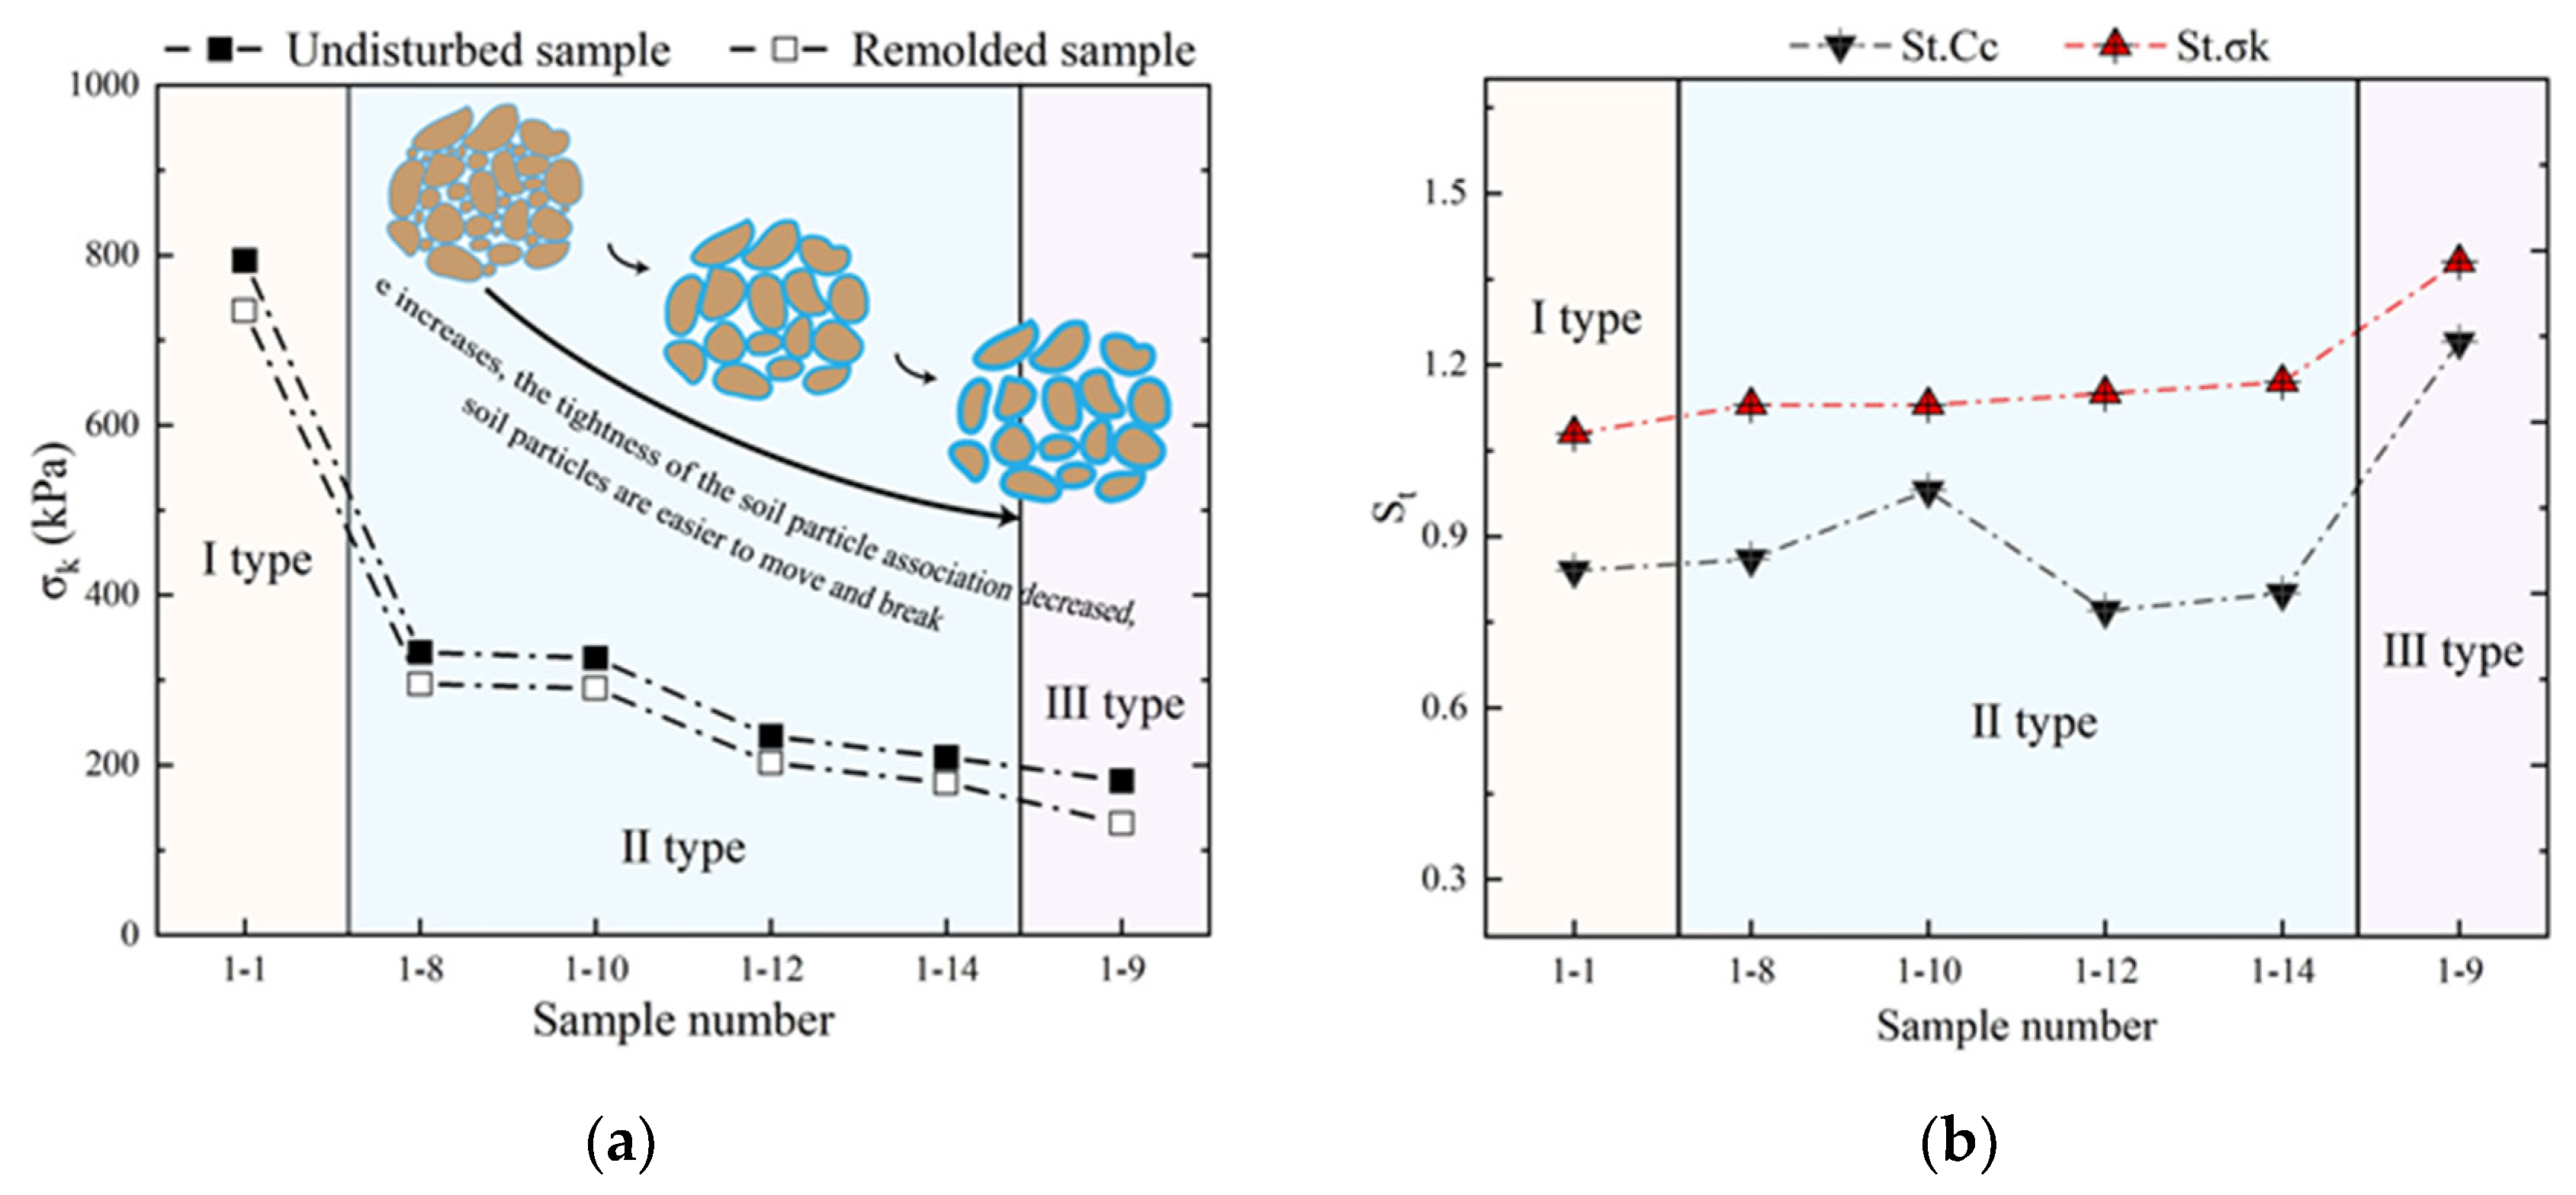
The e l g P c curve shows that the void ratio of the soil does not change seriously before the vertical load exceeds a certain pressure value, and drops steeply after the value. In other words, the soil property differs considerably before and after yielding, and this critical pressure value is called the structural yield stress ( σ k ). Its value can be calculated using the ln 1 + e l g P c double logarithm method proposed by Buyyerfield. The results suggest that the σ k values of all undisturbed samples are larger than those of the remolded samples (Figure 13a). The advantage of structural yield stress is reflected macroscopically in the fact that the gentle section of the e l g P c curve of the undisturbed sample sustains longer than that of the remolded sample. It is also reflected microscopically in the fact that the better structural connection and particle arrangement of the undisturbed soil make it more resistant to vertical load.
The ratios of σ k and C c between undisturbed and remolded samples are calculated as stress sensitivity S t . σ k and strain sensitivity S t . C c , respectively, to explore the structural strength of expansive soil under the confined condition. The two parameters enable the evaluation of the expression of the structural strength in terms of strength and resistance to deformation under the confined condition. The sensitivity parameters are calculated, as shown in Equations (3) and (4), where σ k . u is the σ k of the undisturbed sample, σ k . r is the σ k of the remolded sample, C c . u is the C c of the undisturbed sample, and C c . r is the C c of the remolded sample.
S t . σ k = σ k . u / σ k . r ,
S t . C c = C c . u / C c . r ,
Under the confined condition, the sidewalls restrict the development of fractures and the shear deformation of soil. Moreover, the undisturbed samples express a higher degree of benefit in terms of structural connection and particle arrangement, which means that the advantage generated by the structural strength of the undisturbed samples is greater than the disadvantage arising from the fractures. With the increase in water content and the decrease in density, the void ratio of the samples gradually enlarges, the degree of particle association and occlusion reduces, and the samples are more prone to fragmentation. Thus, the σ k values of the undisturbed and remolded samples decline. However, the advantage of the undisturbed sample on particle linkage and arrangement allows it to maintain a higher σ k than that of the remolded sample even after the load has caused great damage, and the S t . σ k gradually increases. As for S t . C c , draining the water from the undisturbed sample of Type III is difficult in the late stage of compression, which makes its S t . C c above 1. In general, the differences in the S t . C c of the samples of Types I and II are small, and all of them are lower than those of Type III samples (Figure 13b). Overall, as the water content increases and the density decreases, the structural strength of expansive soil is expressed to a greater extent in terms of strength and to a lesser extent in terms of resistance to compressive deformation.

4. Discussion

4.1. Microstructure of Undisturbed and Remolded Expansive Soil

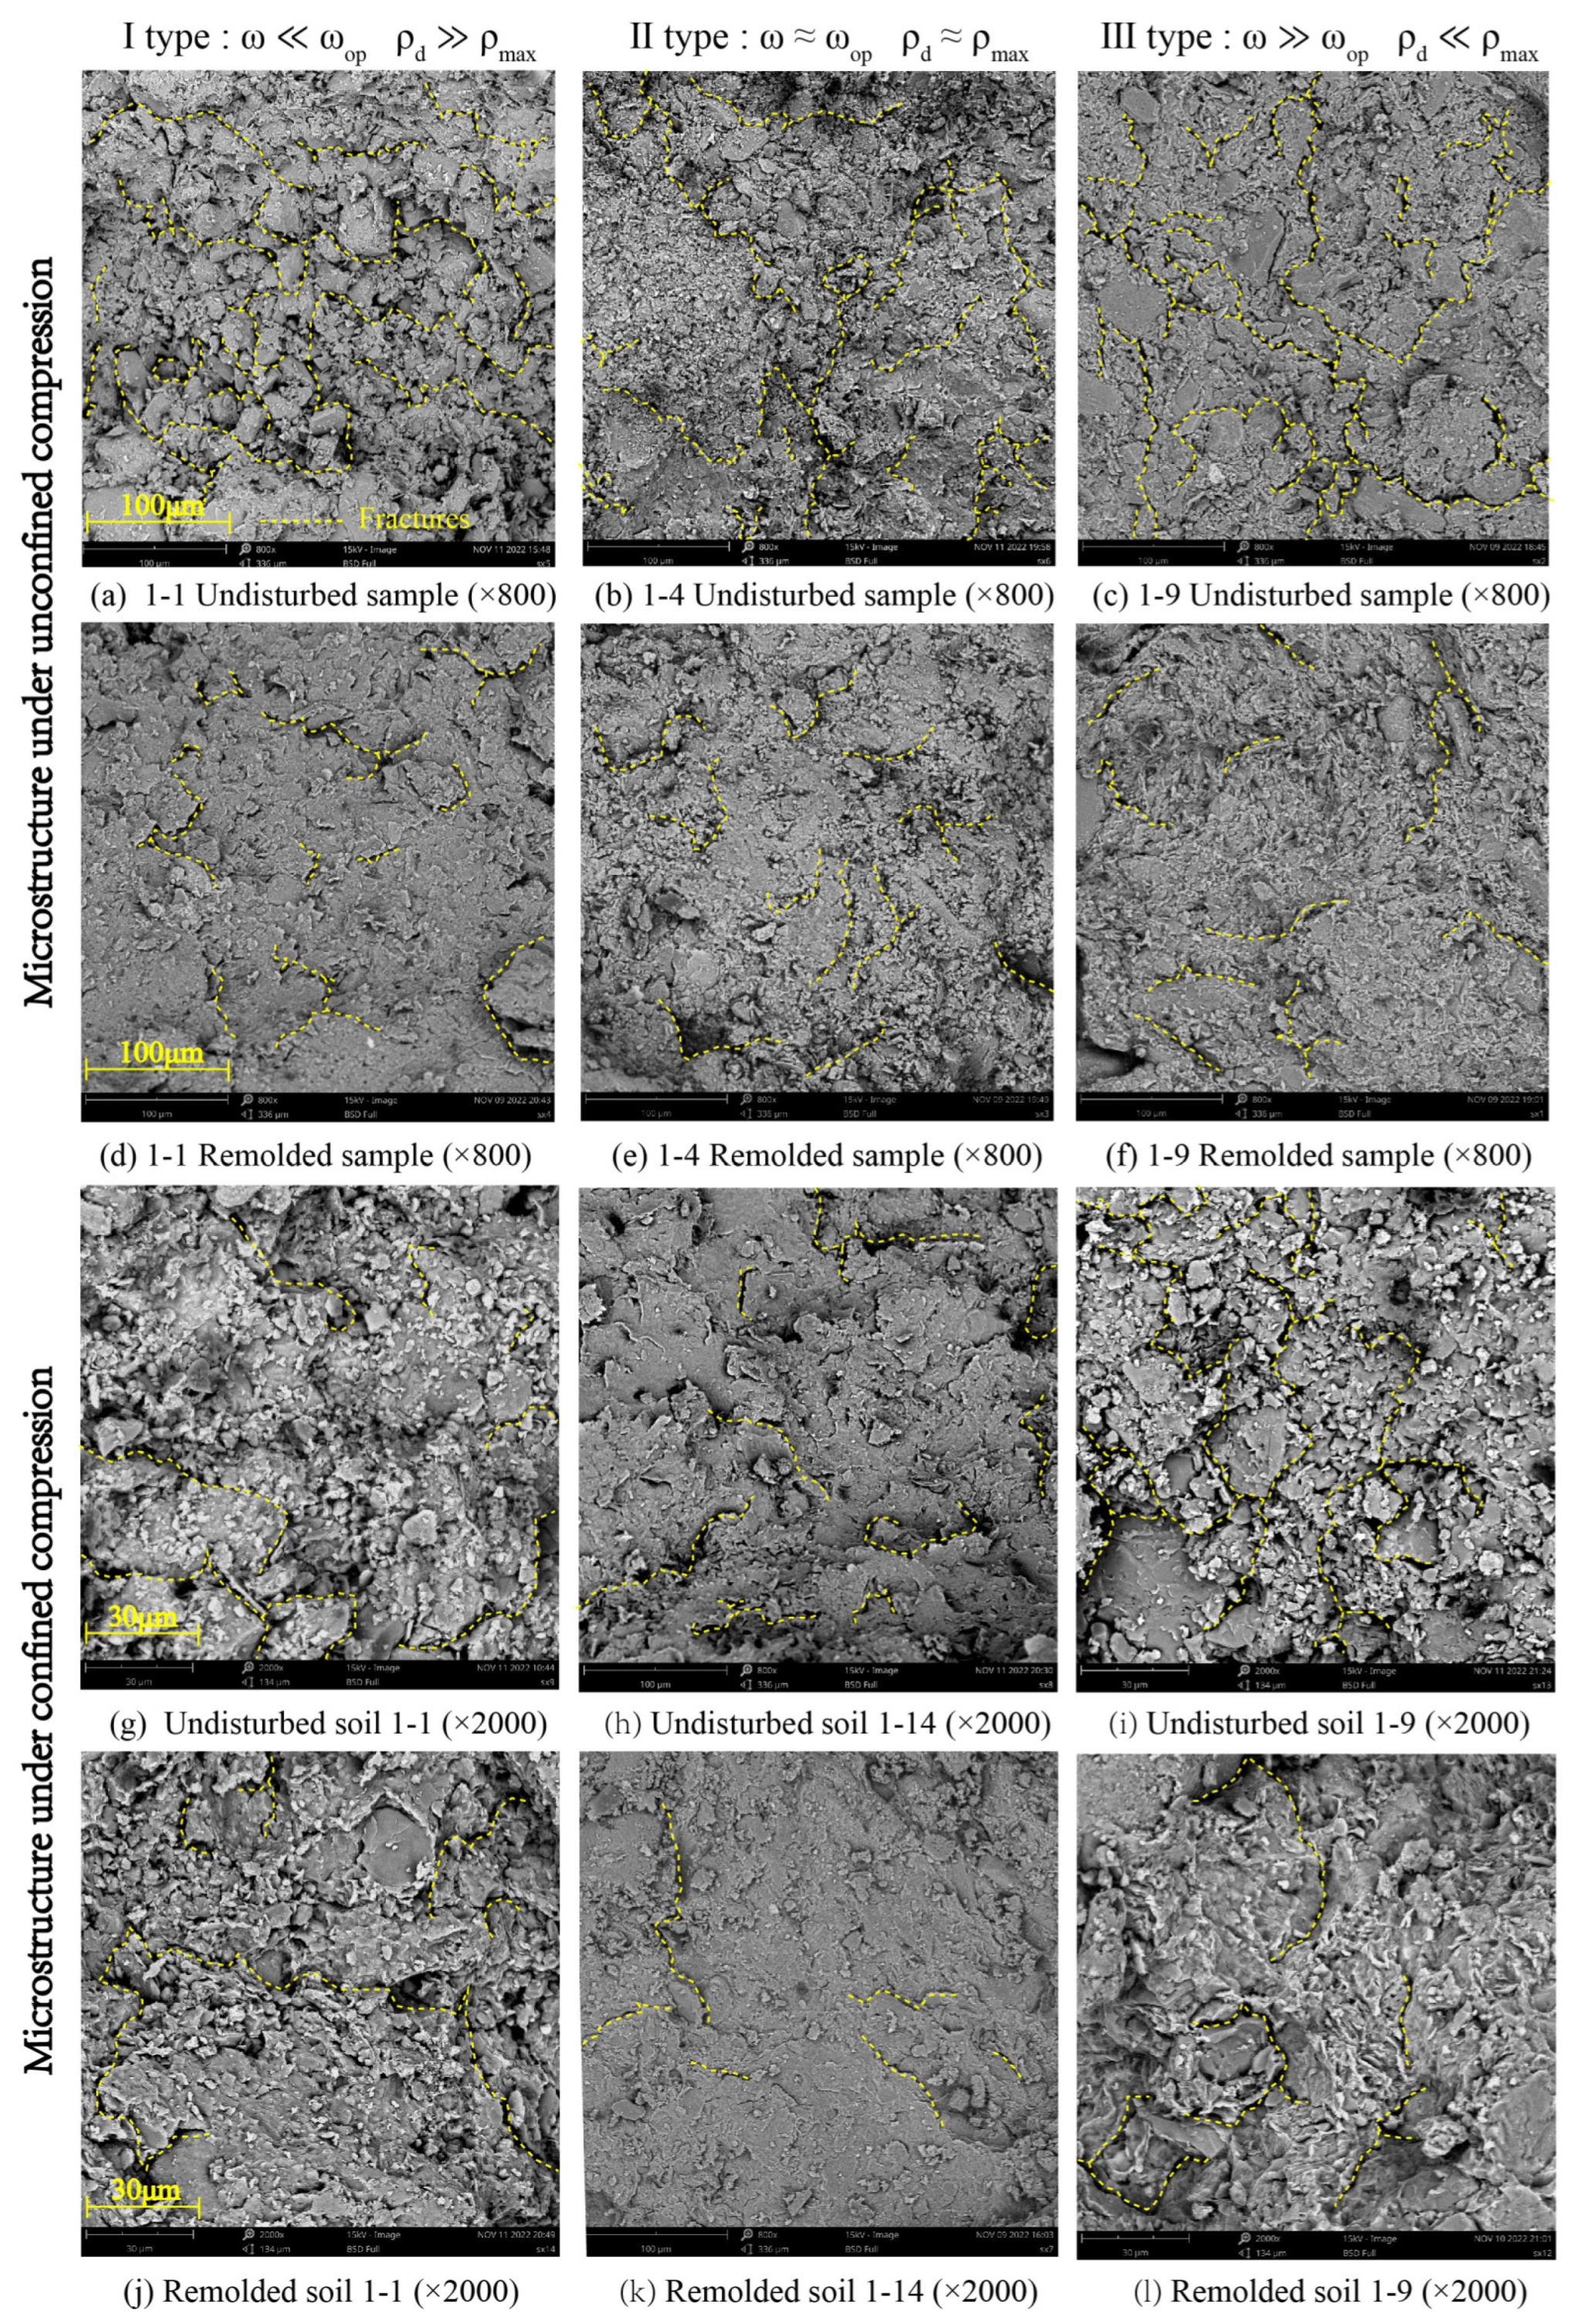
Based on the previous experimental results, the engineering properties of undisturbed and remolded expansive soils in a seasonally frozen region exhibit large differences. SEM tests were conducted in this study to further analyze the structural strength of expansive soil from a microscopic perspective. Figure 14 shows that the long-term wet–dry and freeze–thaw cycles have caused many microfractures inside the undisturbed sample, which provide the initial requirement for the damage of the sample. However, fewer microfractures are within the remolded sample, which lack the initial condition for the formation of penetrating fractures. The clay minerals within the undisturbed sample are poorly crystallized, well defined, and hydrophilic [31,32], mostly in face-to-face contact. By contrast, more flocculent particles are present within the remolded samples, the boundary of the clay minerals is blurred, and edge-to-face and point-to-face contacts are observed in addition to face-to-face contact.
The microstructure of each sample under unconfined compression is shown in Figure 15a–f. The clay particles of the remolded sample are filled into the pores and fractures, and the surface is dense and flat, with tiny but not penetrating fractures. This finding corresponds to the bulging deformation of the remolded samples in the UCS test without a complete shear failure surface, and the microstructures of the different remolded samples at the time of damage are more similar. On the contrary, the fractures in the undisturbed samples are not gradually closed due to the compression but are more developed because of the lack of lateral deformation limitation, and the failure states of different types of samples are completely diverse. The Type I undisturbed sample has a low water content and more primary fractures. Therefore, the number and direction of fractures after compression are complicated, the particle agglomeration phenomenon is serious, and it will eventually be destroyed by multiple vertical fractures. The fractures of the Type II undisturbed sample are mainly developed in the vertical direction after compression with an obvious vertical fracture through the fracture, and the sample forms a shear damage surface in the end. The experiment was not stopped until the strain reached approximately 21% because no damage to the Type III sample was observed, whereas the other samples were stopped at about 10% strain. Although the Type III samples have a higher water content and fewer primary fractures, they are compressed for a longer period. Thus, their surface is flat, and the fractures are well developed. As the water content increases and density decreases, the degree of fracture development drops such that the deterioration effect on strength is gradually weakened. This condition gradually improves the expression of structural strength in terms of strength under the unconfined condition.
In the high-pressure consolidation experiments, the compaction degree of the samples is improved substantially. As shown in Figure 15g–l, the microfractures of the undisturbed and remolded samples in all types are reduced. The clay particles of the remolded samples of Types I and III fill the pores and fractures with serious particle agglomeration, whereas the particle boundary of the undisturbed samples remains explicit without large aggregates. However, the microstructure of the Type II remolded sample is very flat, and the soil sample is more highly monolithic than the other types of remolded samples. The Type II undisturbed sample is less compact than the remolded sample, but its flatness is still better than that of the other types of undisturbed samples. This finding not only demonstrates that the undisturbed samples have stronger resistance to vertical compression deformation than the remolded sample, but also verifies that the samples are more easily compacted and reach the maximum density under the optimum water content condition.

4.2. Influencing Factors of Structural Expression

According to previous experimental results, the structural strength of expansive soil is mainly expressed in the stronger structural connection of the undisturbed sample in the initial stage of unconfined compression, the better resistance to deformation in the later stage of unconfined compression, and the superior ability to withstand vertical load under confined compression. Moreover, the expression degree of structural strength varies among different types of samples. As the water content increases and the density decreases, the expression degree of structural strength in terms of strength and resistance to deformation grows when under the unconfined condition. Correspondingly, the expression degree of structural strength in terms of strength rises but declines for resistance to deformation under the confined condition.
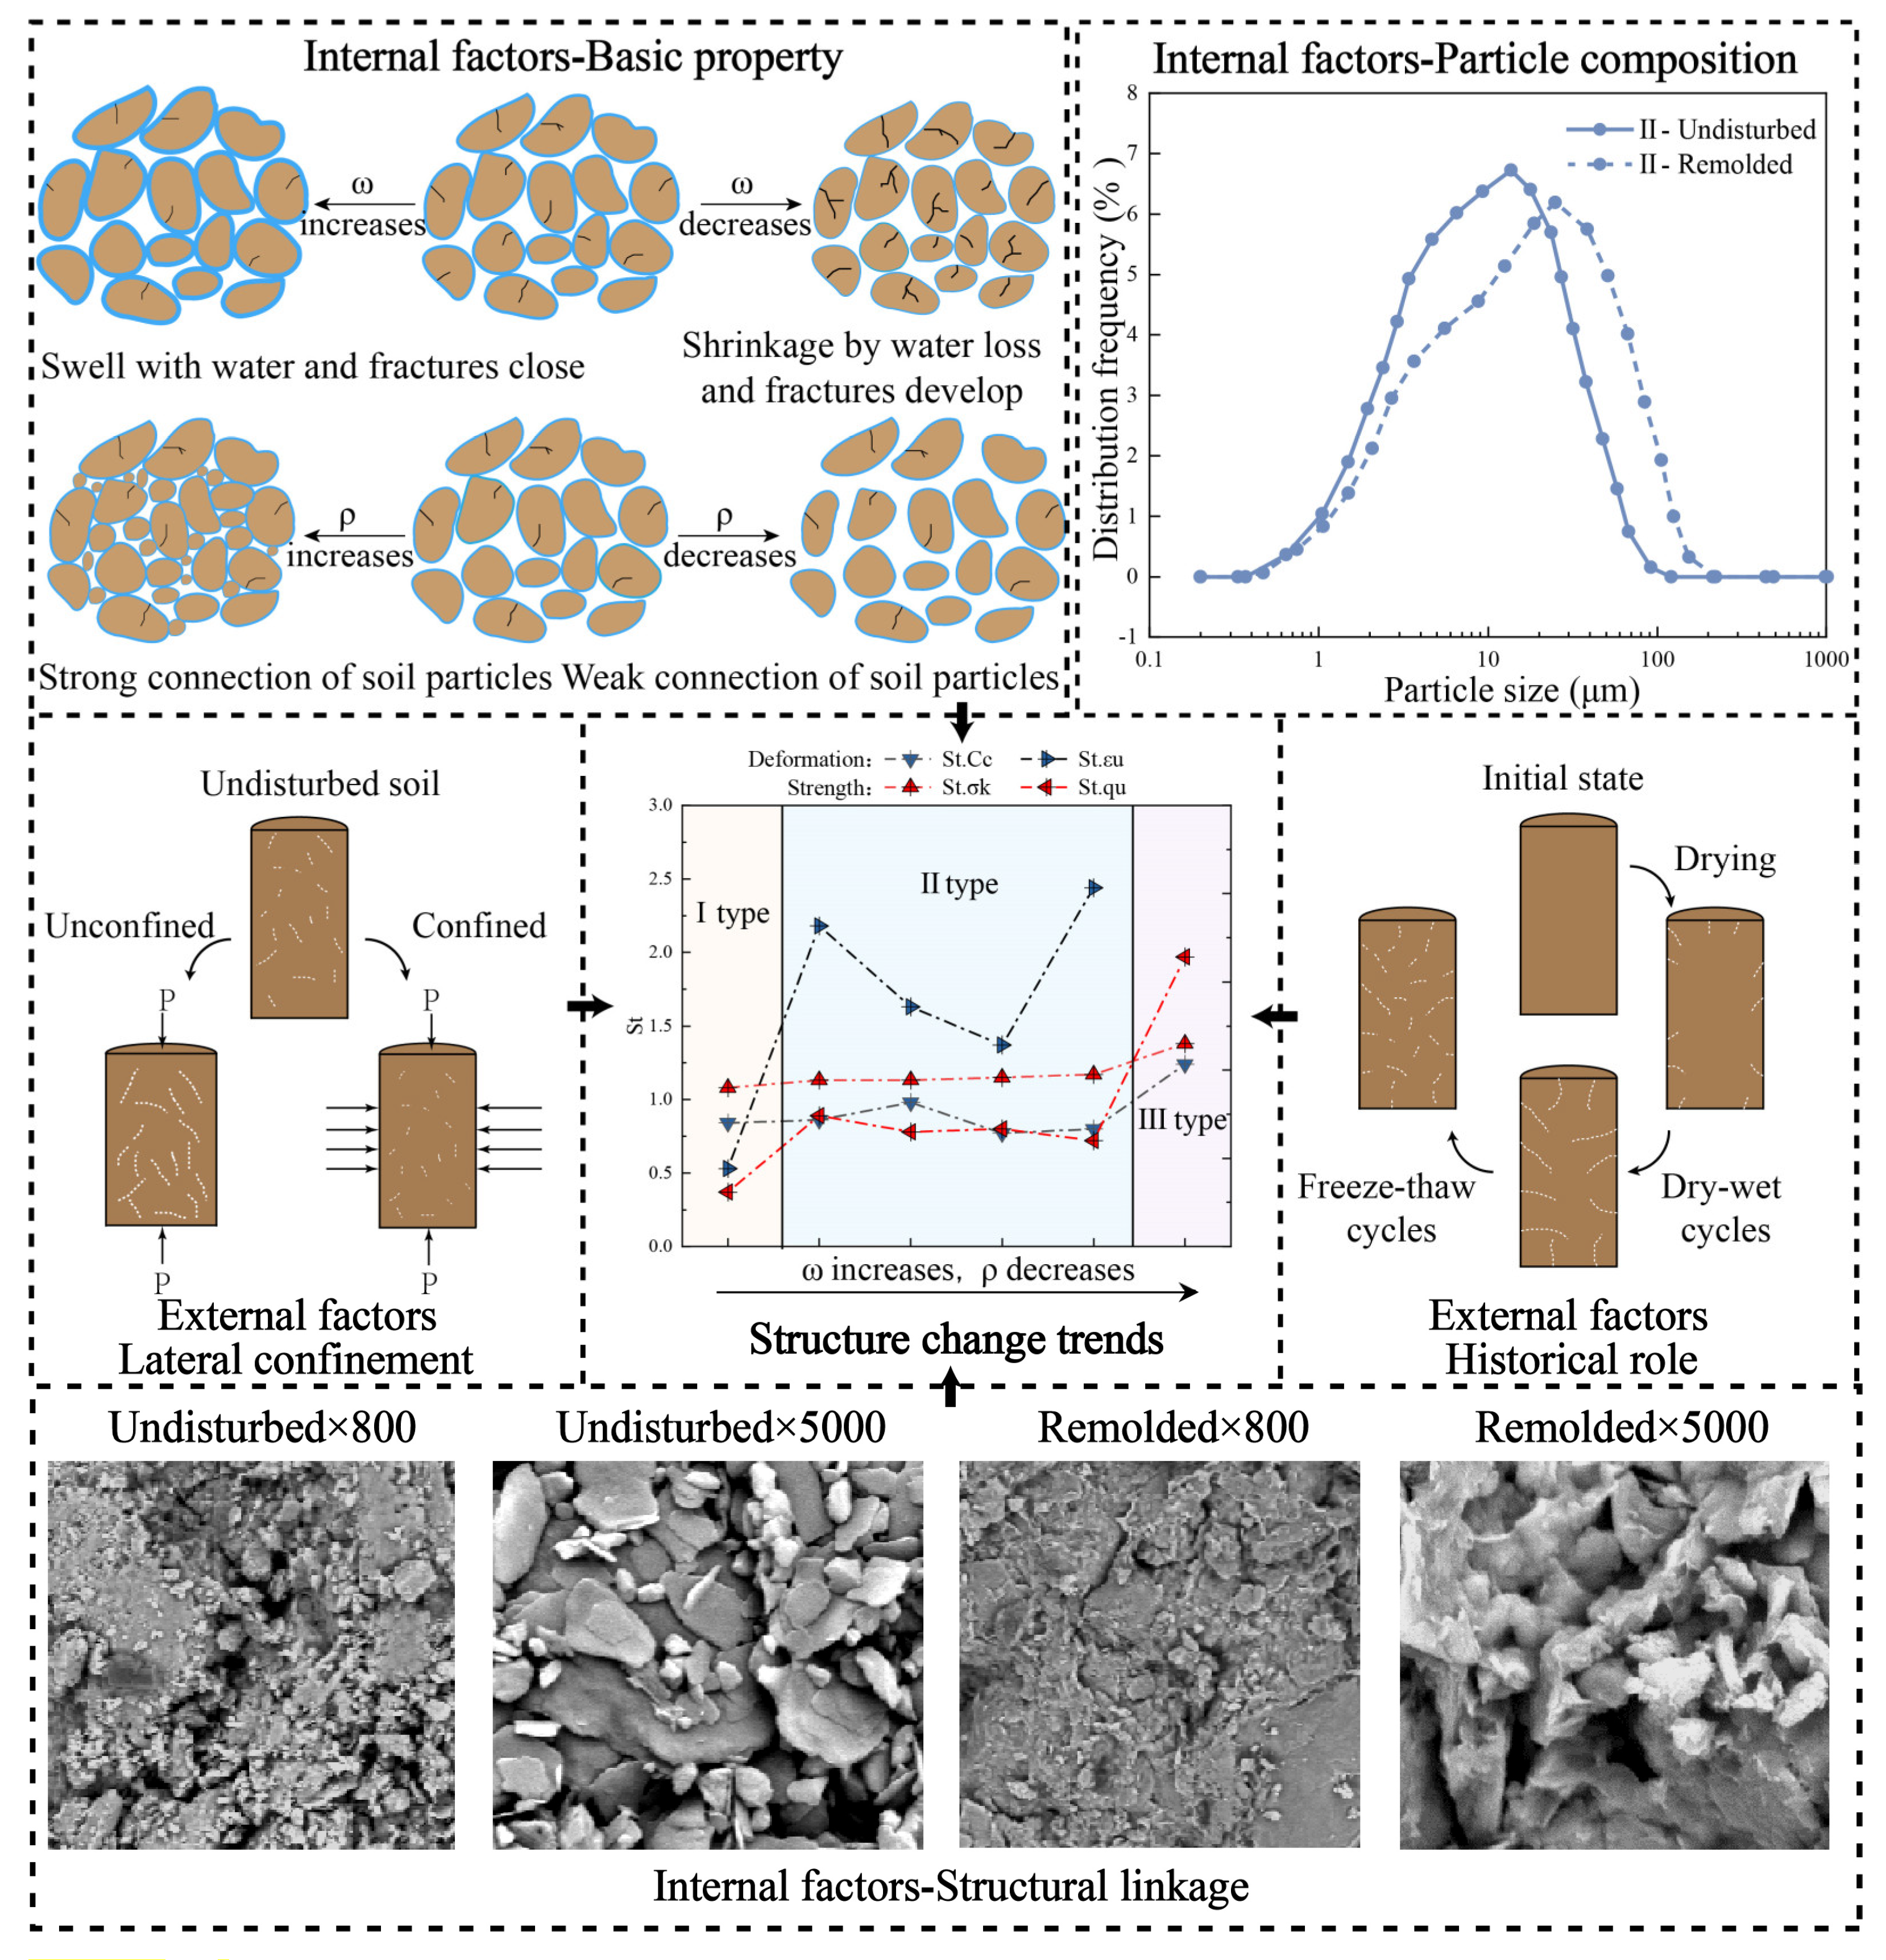
As a result, the structural expression characteristics of expansive soil in a seasonally frozen region are influenced by several factors. This study summarizes them into two parts, internal and external factors, of which the internal factors include basic properties (water content and density), particle composition, and structural linkage, and the external factors include lateral confinement and historical role.
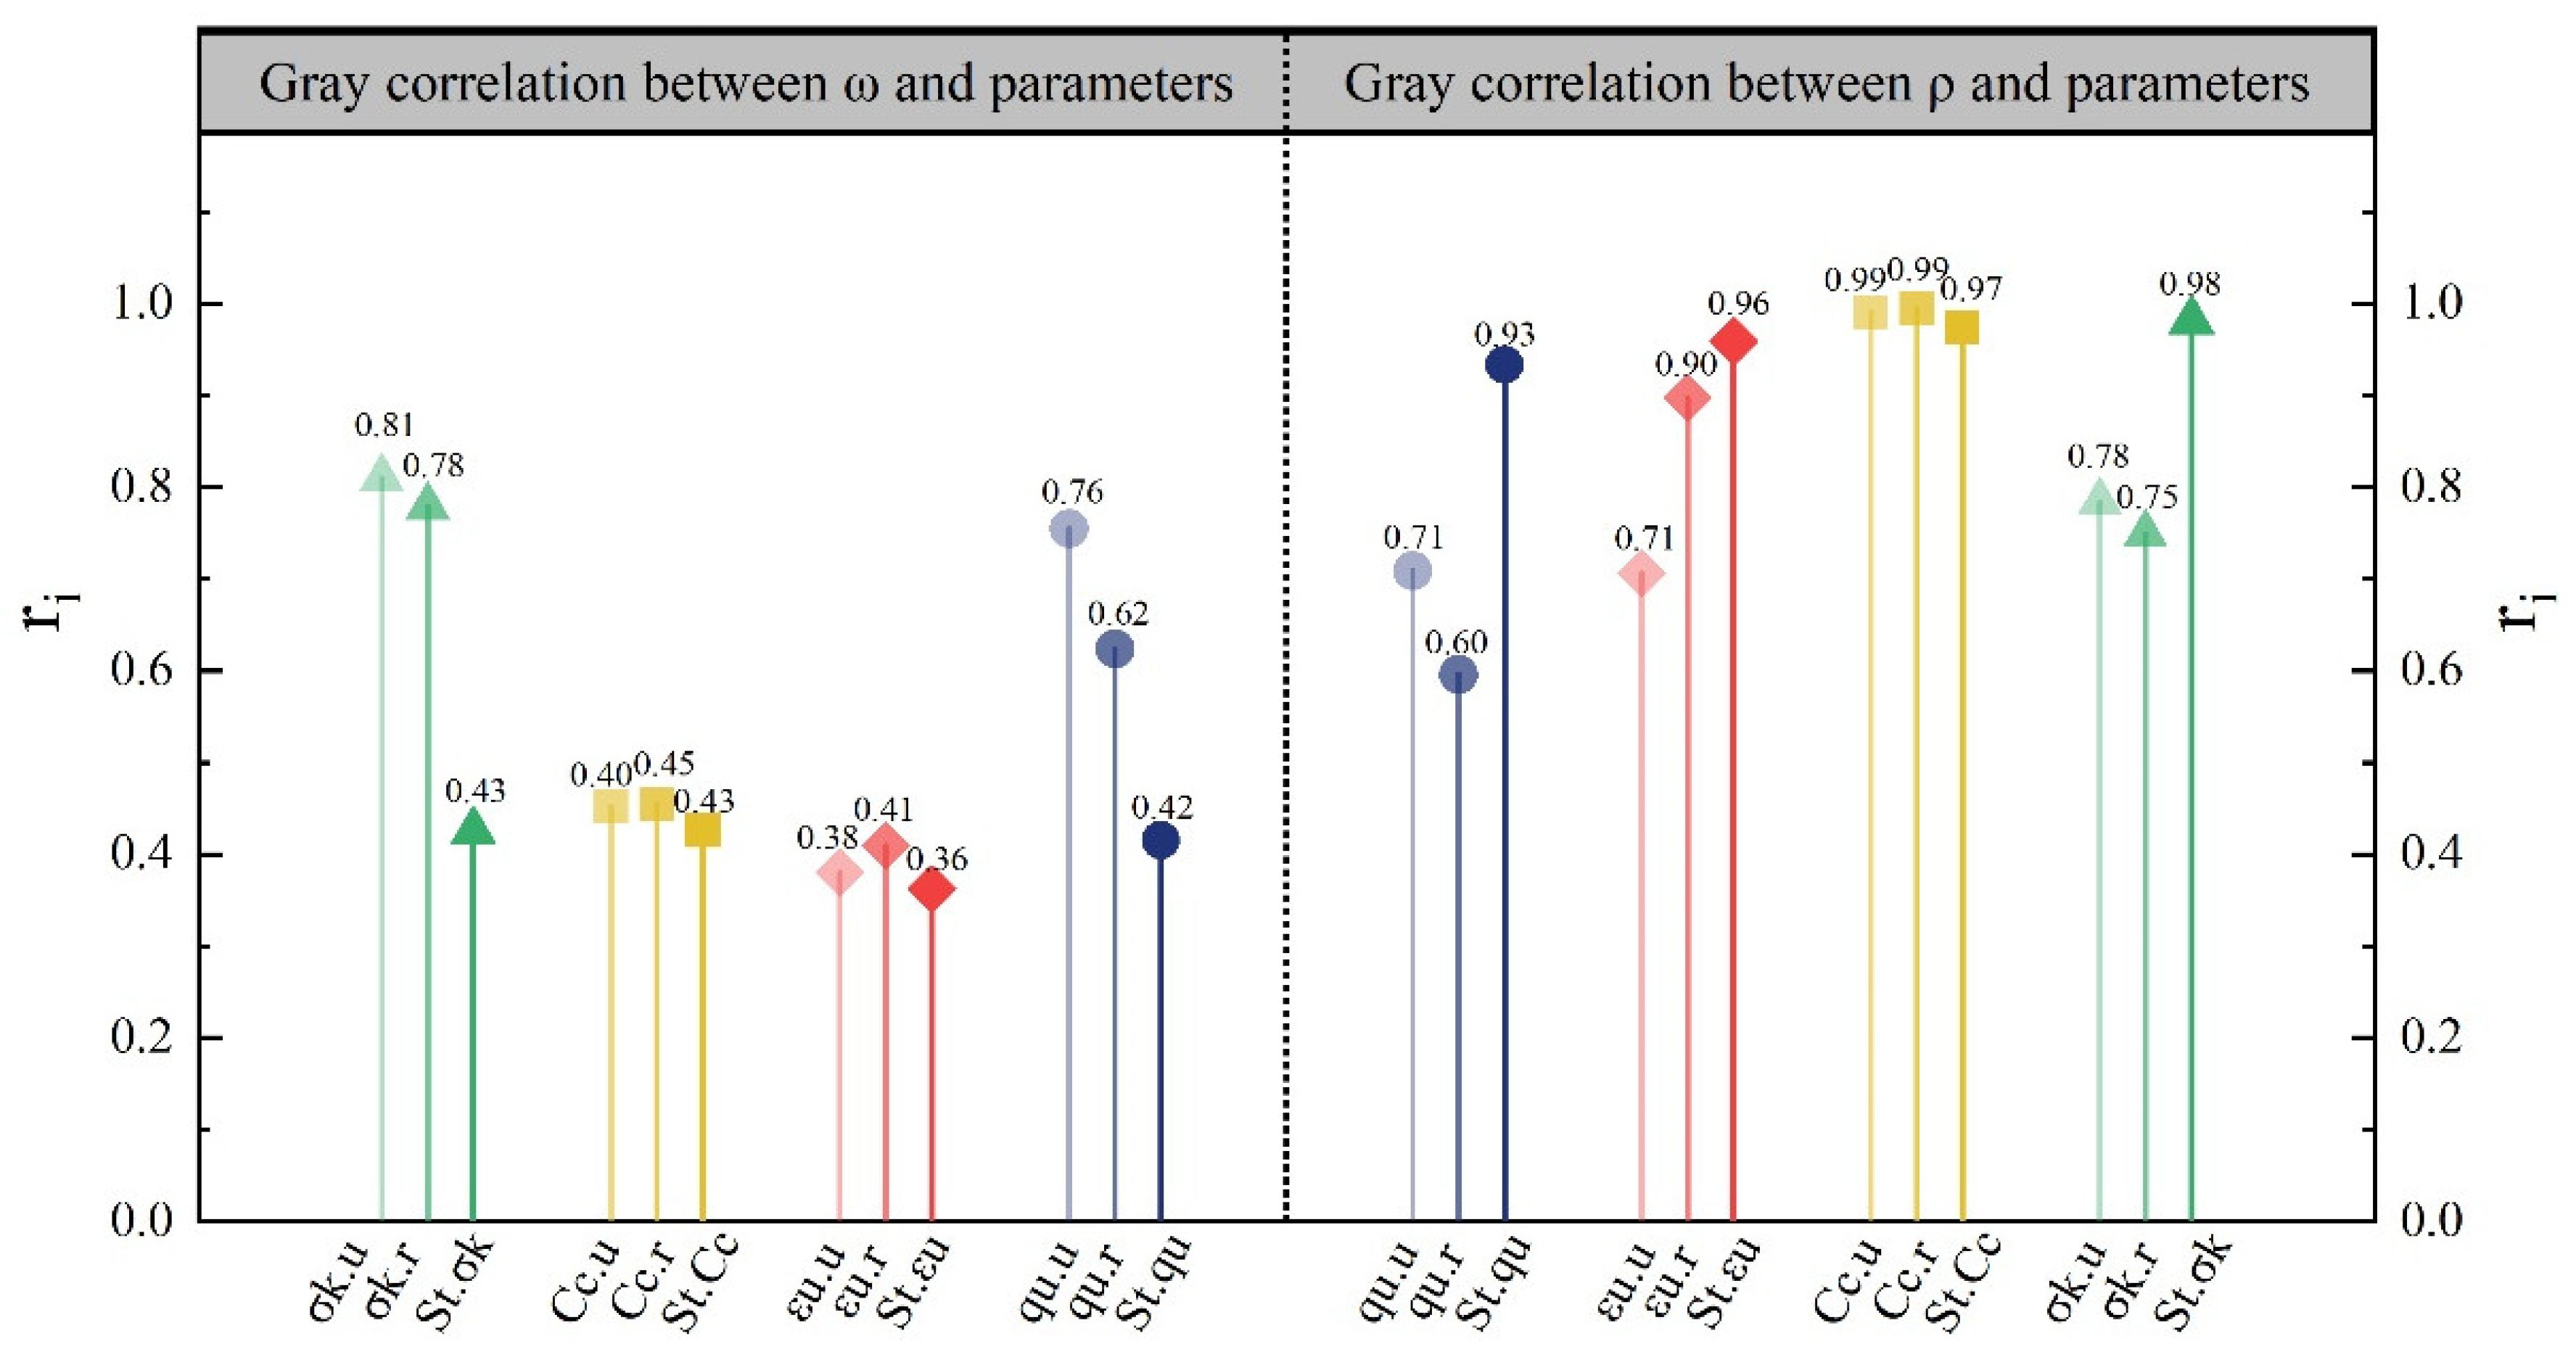
For the basic property, exploring the influence degree using the control variable method is difficult because the undisturbed samples from different depths have high randomness of water content and density. In this study, the gray correlation method was used to calculate the influence degree of water content and density on structural strength, and the results are shown in Figure 16. The gray correlation degree refers to a quantitative evaluation method based on gray system theory, which measures the degree of association between factors of comparative tests according to the degree of similarity between indicators, and the calculation equation is expressed as follows:
r i = 1 m k = 1 m m i n i m i n k x o k x i k + ρ m a x i m a x k x o k x i k x o k x i k + ρ m a x i m a x k x o k x i k ,
where x o k is the reference series, which is the property parameter of the expansive soil in this study, and x i k is the comparison series, which refers to the water content or density of the samples in this paper.   x i k . r i > 0.6 with ρ   = 0.5 represents a better correlation [33,34].
Water content can reveal the fractured status of the samples. The particles swell with water, and the fractures will be closed. Rather, the particles shrink without water, and the fractures will be developed. Therefore, the water content determines the degree of strength depression by the fractures. The density controls the compactness of the samples. The dense samples have a high degree of particle association. The loose samples have a weaker one. Figure 16 shows that water content and density have a substantial effect on the strength parameters ( q u ,   σ k ), with water content being slightly more relevant. For the deformation parameters ( ε u ,   C c ), density has a stronger influence than water content. In summary, the strength of the samples is mainly determined by the water content, and the density predominantly controls the resistance to deformation.
Considering that water content affects strength by influencing the closure degree of primary fractures, the correlation of water content with strength parameters ( q u ,   σ k ) in remolded samples is weaker than that in undisturbed samples, particularly for q_u. Similarly, the structural strength of the undisturbed samples can provide partial resistance to vertical deformation, but that of the remolded samples cannot. Thus, the density of the remolded samples is more correlated with the deformation parameters ( ε u ,   C c ) than the undisturbed samples. ε u is especially consistent with this rule, which is due to the fact that the pressure applied to the high-pressure consolidation test is high. Furthermore, structural strength has been destroyed and cannot resist deformation. Therefore, the correlation between density and C c of undisturbed and remolded soils is approximated. Moreover, the correlation of water content with strength sensitivity ( S t . q u , S t . σ k ) is lower than that of the parameters themselves ( q u , σ k ), and the correlations of density with deformation sensitivity ( S t . ε u , S t . C c ) are slightly higher than those of the parameters themselves ( ε u , C c ). Overall, the influence degree of density on all four sensitivity parameters is stronger than that of water content. Thus, density is more impactful on the structural strength of expansive soil in the study area.
For particle composition and structural linkage (Figure 17), the frequency curve of particle distribution shows a significant rightward shift after remodeling. This trend means that the undisturbed sample has a higher proportion of clay. This observation corresponds to the fact that the clay particles in the undisturbed sample are present in the large particles to play a better role in structural linkage, which results in clear boundaries of the particles and a higher degree of occlusion. Conversely, fewer small particles are found in the remolded samples, which corresponds to the fuzzy particle boundaries, higher agglomeration, and poor particle occlusion in the SEM images. For the internal factors, the basic properties (water content and density) greatly influence the development of fractures in the samples. Moreover, the particle composition and structural linkage affect the microstructure of the soil, which ultimately leads to the existence of structural strength and the differences in the expression characteristics.
As for the external factors (Figure 17), the presence or absence of lateral confinement impacts the deformation mode of the samples, which, in turn, affects the relationship between the primary fractures and the structural strength in expression. Specifically, under the unconfined condition, apart from Type III samples with higher water content, the deterioration of the primary fractures is stronger than the structural strength, and the fractures are continuously developed until penetration. These factors result in the q u of the undisturbed samples being lower than that of the remolded samples. As the water content increases and the density decreases, the degradation of primary fractures reduces, and the expression of structural strength in terms of strength enhances. Meanwhile, the increase in water content contributes to a better integrity of the samples, a rise in ε u , and an enhancement in the structural expression degree to resist deformation. Conversely, under the confined condition, the deterioration of the primary fractures is weaker than the structural strength, which means that the e 2 and C c of the undisturbed samples are smaller than those of the remodeled samples, and the undisturbed samples are more resistant to vertical deformation. With the increase in water content and the decrease in density, the deterioration of the fractures is diminished, and the structural expression in strength is elevated. With regard to the deformation aspect, the vertical load in the high-pressure consolidation experiment is heavy, and the compression process is accompanied by the escape of water. The increase in water content thickens the weakly bound water film and makes it more difficult for water to drain out, which gradually deteriorates the structural expression in resistance to vertical deformation.
For the historical role, given that the study area is located in a seasonally frozen region where the winter is cold and dry and the summer is warm and rainy, the fracture formation and the wet–dry or freeze–thaw cycles are correlated. The fractures in the expansive soil gradually evolve from the edge to the center, which ultimately forms a network under the wet–dry cycles. Then, the fractures break up and transform from long fractures to small fractures after the freeze–thaw cycles [35,36]. Consequently, the large number of tiny fractures formed inside the undisturbed samples offer the initial requirement for property deterioration. Among them, the effect on strength, which causes the UCS of the undisturbed samples of Types I and II to be lower than that of the remolded samples, is the most obvious. With the increase in water content and the decrease in density, the degradation of strength by primary fractures gradually diminishes, which leads to the growth of S t . q u and S t . σ k . This condition means that the expression of structural strength in terms of strength is enhanced.
Combined with the research related to the structural strength of saline soil in Jilin Province, China, by our research group, the findings show that the structural strength of soil in a seasonally frozen region shows some special characteristics compared with other regions [2]. In particular, saline and expansive soils in a seasonally frozen region can exhibit strong structural strength in contact mode and association, but the primary fracture network has a noticeable negative effect on strength. This finding indicates that the wet–dry and freeze–thaw cycles undergone by the soil in a seasonally frozen region produce a certain weakening effect on the structural expression, which makes it different from the soil in a non-frozen region.

5. Conclusions

In this study, the UCS test, high-pressure consolidation test, and SEM were performed on expansive soil to explore the structure in a seasonally frozen region. The conclusions are drawn as follows:
(1)
The undisturbed samples have structural strength due to a better structural connection and particle arrangement than those of the remolded samples. The structural strength of undisturbed expansive soil is mainly expressed in the stronger structural connection in the initial stage of unconfined compression, the better resistance to deformation in the later stage of unconfined compression, and the superior ability to withstand vertical load under confined compression.
(2)
Under unconfined compression, the samples display various failure states due to differences in water content and density. Type I undisturbed samples are broken along multiple vertical penetration fractures, Type II undisturbed samples are destroyed along a shear surface, Type III undisturbed samples do not show shear damage, and remolded samples all show bulging damage.
(3)
Under unconfined compression, the deterioration of primary fractures is stronger than the structural strength. Thus, the qu values of the undisturbed samples of Types I and II are lower than those of the remolded samples. With the increase in water content and the decrease in density, the expression degree of structural strength in terms of compressive strength and resistance to deformation rises.
(4)
Under confined compression, the structure strength is more highly expressed due to the suppression of the development of primary fractures. Therefore, the Cc and e2 values of the undisturbed samples are smaller, and the structural yield stress is greater. With the increase in water content and the decrease in density, the expression degree of structural strength in terms of strength ascends, but the resistance to compressive deformation declines.
(5)
Internal factors (basic property, particle composition, and structural linkage) and external factors (lateral confinement and historical role) all affect the expression of structural strength. For the basic property, water content mainly determines strength (qu, σk), and density predominantly affects resistance to deformation (ɛu, Cc). Particle composition and structural linkage affect the microstructure of the soil. Lateral confinement and historical role primarily affect the formation and development of fractures and, consequently, the expression of structural strength.
(6)
The soils in a seasonally frozen region undergo periodic freeze–thaw cycles, which can also impact the expression of structure. In future work, freeze–thaw cycle tests can be conducted on undisturbed and remolded samples to provide a better discussion on the structure of expansive soils.

Author Contributions

Conceptualization, Q.W.; methodology, Q.W. and X.L.; software, W.X.; validation, X.L.; formal analysis, S.S.; investigation, X.Z. and C.D.; resources, X.Z. and C.D.; data curation, C.N.; writing—original draft preparation, X.S.; writing—review and editing, X.S.; visualization, X.S., C.N. and W.X.; supervision, W.X.; project administration, S.S.; funding acquisition, Q.W. All authors have read and agreed to the published version of the manuscript.

Funding

This research was supported by the Key Program of National Natural Science Foundation of China (No. 42330708).

Data Availability Statement

The original contributions presented in the study are included in the article, further inquiries can be directed to the corresponding author.

Acknowledgments

The authors would like to express their sincere thanks to the editor and anonymous reviewers for their professional comments and suggestions regarding this manuscript.

Conflicts of Interest

The authors declare no conflicts of interest.

References

  1. Wang, Q.; Kong, Y.Y.; Zhang, X.D.; Ruan, Y.K.; Chen, Y. Mechanical effect of pre-consolidation pressure of structural behavior soil. J. Southwest Jiaotong Univ. 2016, 51, 987–994. [Google Scholar]
  2. Peng, W. Analysis of Quantitative Structural Parameters and Elastoplastic Constitutive Model of Saline Soil under Freeze-Thaw Cycle. Ph.D. Thesis, Jilin University, Changchun, China, 2022. [Google Scholar]
  3. Zhang, Y.Z.; Pu, S.Y.; Li, R.Y.M.; Zhang, J. Microscopic and mechanical properties of undistributed and remoulded red clay from Guiyang, China. Sci. Rep. 2020, 10, 18003. [Google Scholar] [CrossRef]
  4. Zhen, Z.L.; Ma, G.L.; Zhang, H.Y.; Gai, Y.X.; Su, Z.Y. Thermal Conductivities of Remolded and Undisturbed Loess. J. Mater. Civ. Eng. 2019, 31, 04018379. [Google Scholar] [CrossRef]
  5. GB/T 50123-2019; Standard for Soil Test Methods. China Planning Press: Beijing, China, 2019.
  6. Jiang, M.J.; Zhang, F.G.; Hu, H.J.; Cui, Y.J.; Peng, J.B. Structural characterization of natural loess and remolded loess under triaxial tests. Eng. Geol. 2014, 181, 249–260. [Google Scholar] [CrossRef]
  7. Yuan, Z.H. Research on Change Mechanism of Strength and Microstructure of Loess under Wetting-Drying Cycle. Ph.D. Thesis, Chang’an University, Xi’an, China, 2015. [Google Scholar]
  8. Zhang, S.; Liang, C.; Zheng, C.; Zhai, J.Y. Comparative study on triaxial test of undisturbed and remolded loess. Math. Probl. Eng. 2022, 2022, 6392909. [Google Scholar] [CrossRef]
  9. Ma, L. A Study on Constitutive Model and Tests on Influence of Free Ferric Oxide on Increasing of Strengh of Granite Residual Red Soil. Ph.D. Thesis, Jilin University, Changchun, China, 2007. [Google Scholar]
  10. Kong, Y.Y. Experimental Research on the Saline Soil Water-Salt Transport and Structure Evolution in Zhenlai Zone. Ph.D. Thesis, Jilin University, Changchun, China, 2017. [Google Scholar]
  11. Sarker, D.; Wang, J.X. Moisture influence on structural responses of pavement on expansive soils. Transp. Geotech. 2022, 35, 100773. [Google Scholar] [CrossRef]
  12. Muhammed, T.; Volkan, E.; Islam, G. Utilization of waste materials in the stabilization of expansive pavement subgrade: An extensive review. Constr. Build. Mater. 2023, 398, 132435. [Google Scholar]
  13. Shi, B.X.; Zhang, C.F.; Wu, J.K. Research progress on expansive soil cracks under changing environment. Sci. World J. 2014, 2014, 816759. [Google Scholar] [CrossRef] [PubMed]
  14. Yang, Z.N.; Lu, Z.C.; Shi, W.; Wang, C.; Ling, X.Z.; Liu, X.; Guan, D.; Cheng, Z.J. Dynamic Properties of Expansive Soil-Rubber under Freeze-Thaw Cycles. J. Mater. Civil Eng. 2023, 35, 04023026. [Google Scholar] [CrossRef]
  15. Zhang, Q.; Xia, Y.J.; Zhao, J.C.; Tang, C.; Zhang, B. Experimental investigation of crack evolution in expansive soil-rubber mixture (ESR) under freeze-thaw cycles. Cold Reg. Sci. Technol. 2024, 217, 104016. [Google Scholar] [CrossRef]
  16. Wang, Q.; Liu, Y.F.; Liu, S.W.; Zhang, X.D.; Peng, W.; Li, C.Y.; Xu, X.C.; Fan, J.H. Evolution law of the properties of saline soil in western Jilin province under multi field effect. J. Jilin Univ. (Earth Sci. Ed.) 2017, 47, 807–817. [Google Scholar]
  17. Hu, X.H.; Zhang, K.Y.; Nie, M.J.; Pan, R.Y. Effect of experimental conditions on strength indexes of expansive soil during wet-dry cycles. J. Central South Univ. (Earth Sci. Ed.) 2022, 53, 269–279. [Google Scholar]
  18. Ye, W.J.; Chen, Y.Q.; Gao, C.; Xie, T.F.; Jing, H.J.; Deng, Y.S. Experimental study on the microstructure and expansion charac-teristics of paleosol based on spectral scanning. J. Spectrosc. 2021, 2021, 6689073. [Google Scholar] [CrossRef]
  19. Jiang, P.F.; Kong, Y.Y.; Song, Z.Y.; Zhao, R.X.; Zhan, J.W.; Liu, X.H. Development characteristics and sensitivity analysis of expansive soil slope. Geofluids 2022, 2022, 4303911. [Google Scholar] [CrossRef]
  20. Liu, G.S.; Zhao, S.D.; Mou, Z.; Mo, K.Y.; Zhao, Q.S. Experimental study of the influence of structure on the shrinkage charac-teristics of expansive soil. Rock Soil Mech. 2022, 43, 1772–1780. [Google Scholar]
  21. Gaspar, T.A.V.; Jacobsz, S.W.; Heymann, G.; Toll, D.G.; Gens, A.; Osman, A.S. The mechanical properties of a high plasticity expansive clay. Eng. Geol. 2022, 303, 106647. [Google Scholar] [CrossRef]
  22. Pan, B.Y. Study on Expansive Soil in Drying-Watering Cycle and Constitutive Models Considering over Consolidation and Structure. Master’s Thesis, Guangxi University, Nanning, China, 2014. [Google Scholar]
  23. Li, T.G.; Kong, L.W.; Wang, J.T.; Wang, F.H. Trimodal pore structure evolution characteristics and mechanical effects of expansive soil in seasonally frozen areas based on NMR test. Rock Soil Mech. 2021, 42, 2741–2754. [Google Scholar]
  24. Karunarathne, A.M.A.N.; Gad, E.F.; Rajeev, P. Effect of insitu moisture content in shrink-swell index. Geotech. Geol. Eng. 2020, 38, 6385–6392. [Google Scholar] [CrossRef]
  25. GB 50112-2013; Technical Code for Buildings in Expansive Soil Regions. China Architecture & Building Press: Beijing, China, 2013.
  26. Li, J.H.; Zhang, L.M. Study of desiccation crack initiation and development at ground surface. Eng. Geol. 2011, 123, 347–358. [Google Scholar] [CrossRef]
  27. Pei, P.; Zhao, Y.L.; Ni, P.P. A protective measure for expansive soil slopes based on moisture content control. Eng. Geol. 2020, 269, 105527. [Google Scholar] [CrossRef]
  28. Yu, Q.B.; Wang, Q.; Li, X.H.; Yao, M.; Sun, X.; Xia, W.T.; Shu, H.; Liu, J.; Wang, Z.X. Dynamic characteristics and concept expression of soil structure. J. Eng. Geol. 2022, 30, 1914–1928. [Google Scholar]
  29. Ferreira, S.R.D.M.; Araújo, A.G.D.D.; Barbosa, F.A.S.; Silva, T.C.R.; Bezerra, M.L. Analysis of changes in volume and propagation of cracks in expansive soil due to changes in water content. Rev. Bras. Ciênc. Solo. 2020, 44, e0190169. [Google Scholar] [CrossRef]
  30. Tang, D.X.; Liu, Y.R.; Zhang, W.S.; Wang, Q. Rock and Soil Engineering, 2nd ed.; Geology Press: Beijing, China, 1999. [Google Scholar]
  31. Lin, B.T.; Cerato, A.B. Applications of SEM and ESEM in microstructural investigation of shale-weathered expansive soils along swelling-shrinkage cycles. Eng. Geol. 2014, 177, 66–74. [Google Scholar] [CrossRef]
  32. Wang, W.W.; Wang, R.; Zang, M.; Zhang, C.C.; Yi, Y. Experimental research on three-dimensional space distribution characteristics of the expansive soil cracks. Sci. Technol. Eng. 2017, 17, 245–251. [Google Scholar]
  33. Bao, S.C.; Wang, Q.; Bao, X.H. Study on dispersive influencing factors of dispersive soil in western Jilin based on grey correlation degree method. Appl. Mech. Mater. 2013, 291–294, 1096–1100. [Google Scholar] [CrossRef]
  34. Zhang, J.H.; Zhang, A.S.; LI, J.; Li, F.; Peng, J.H. Gray correlation analysis and prediction on permanent deformation of subgrade filled with construction and demolition materials. Materials 2019, 12, 3035. [Google Scholar] [CrossRef] [PubMed]
  35. Cai, Z.Y.; Zhu, X.; Huang, Y.H.; Zhang, C. Influences of freeze-thaw process on evolution characteristics of fissures in expansive soils. Rock Soil Mech. 2019, 40, 4555–4563. [Google Scholar]
  36. Huang, Z.; Zhang, H.; Liu, B.; Wei, B.X.; Wang, H. Using CT to test the damage characteristics of the internal structure of expansive soil induced by dry-wet cycles. AIP Adv. 2021, 11, 075305. [Google Scholar] [CrossRef]
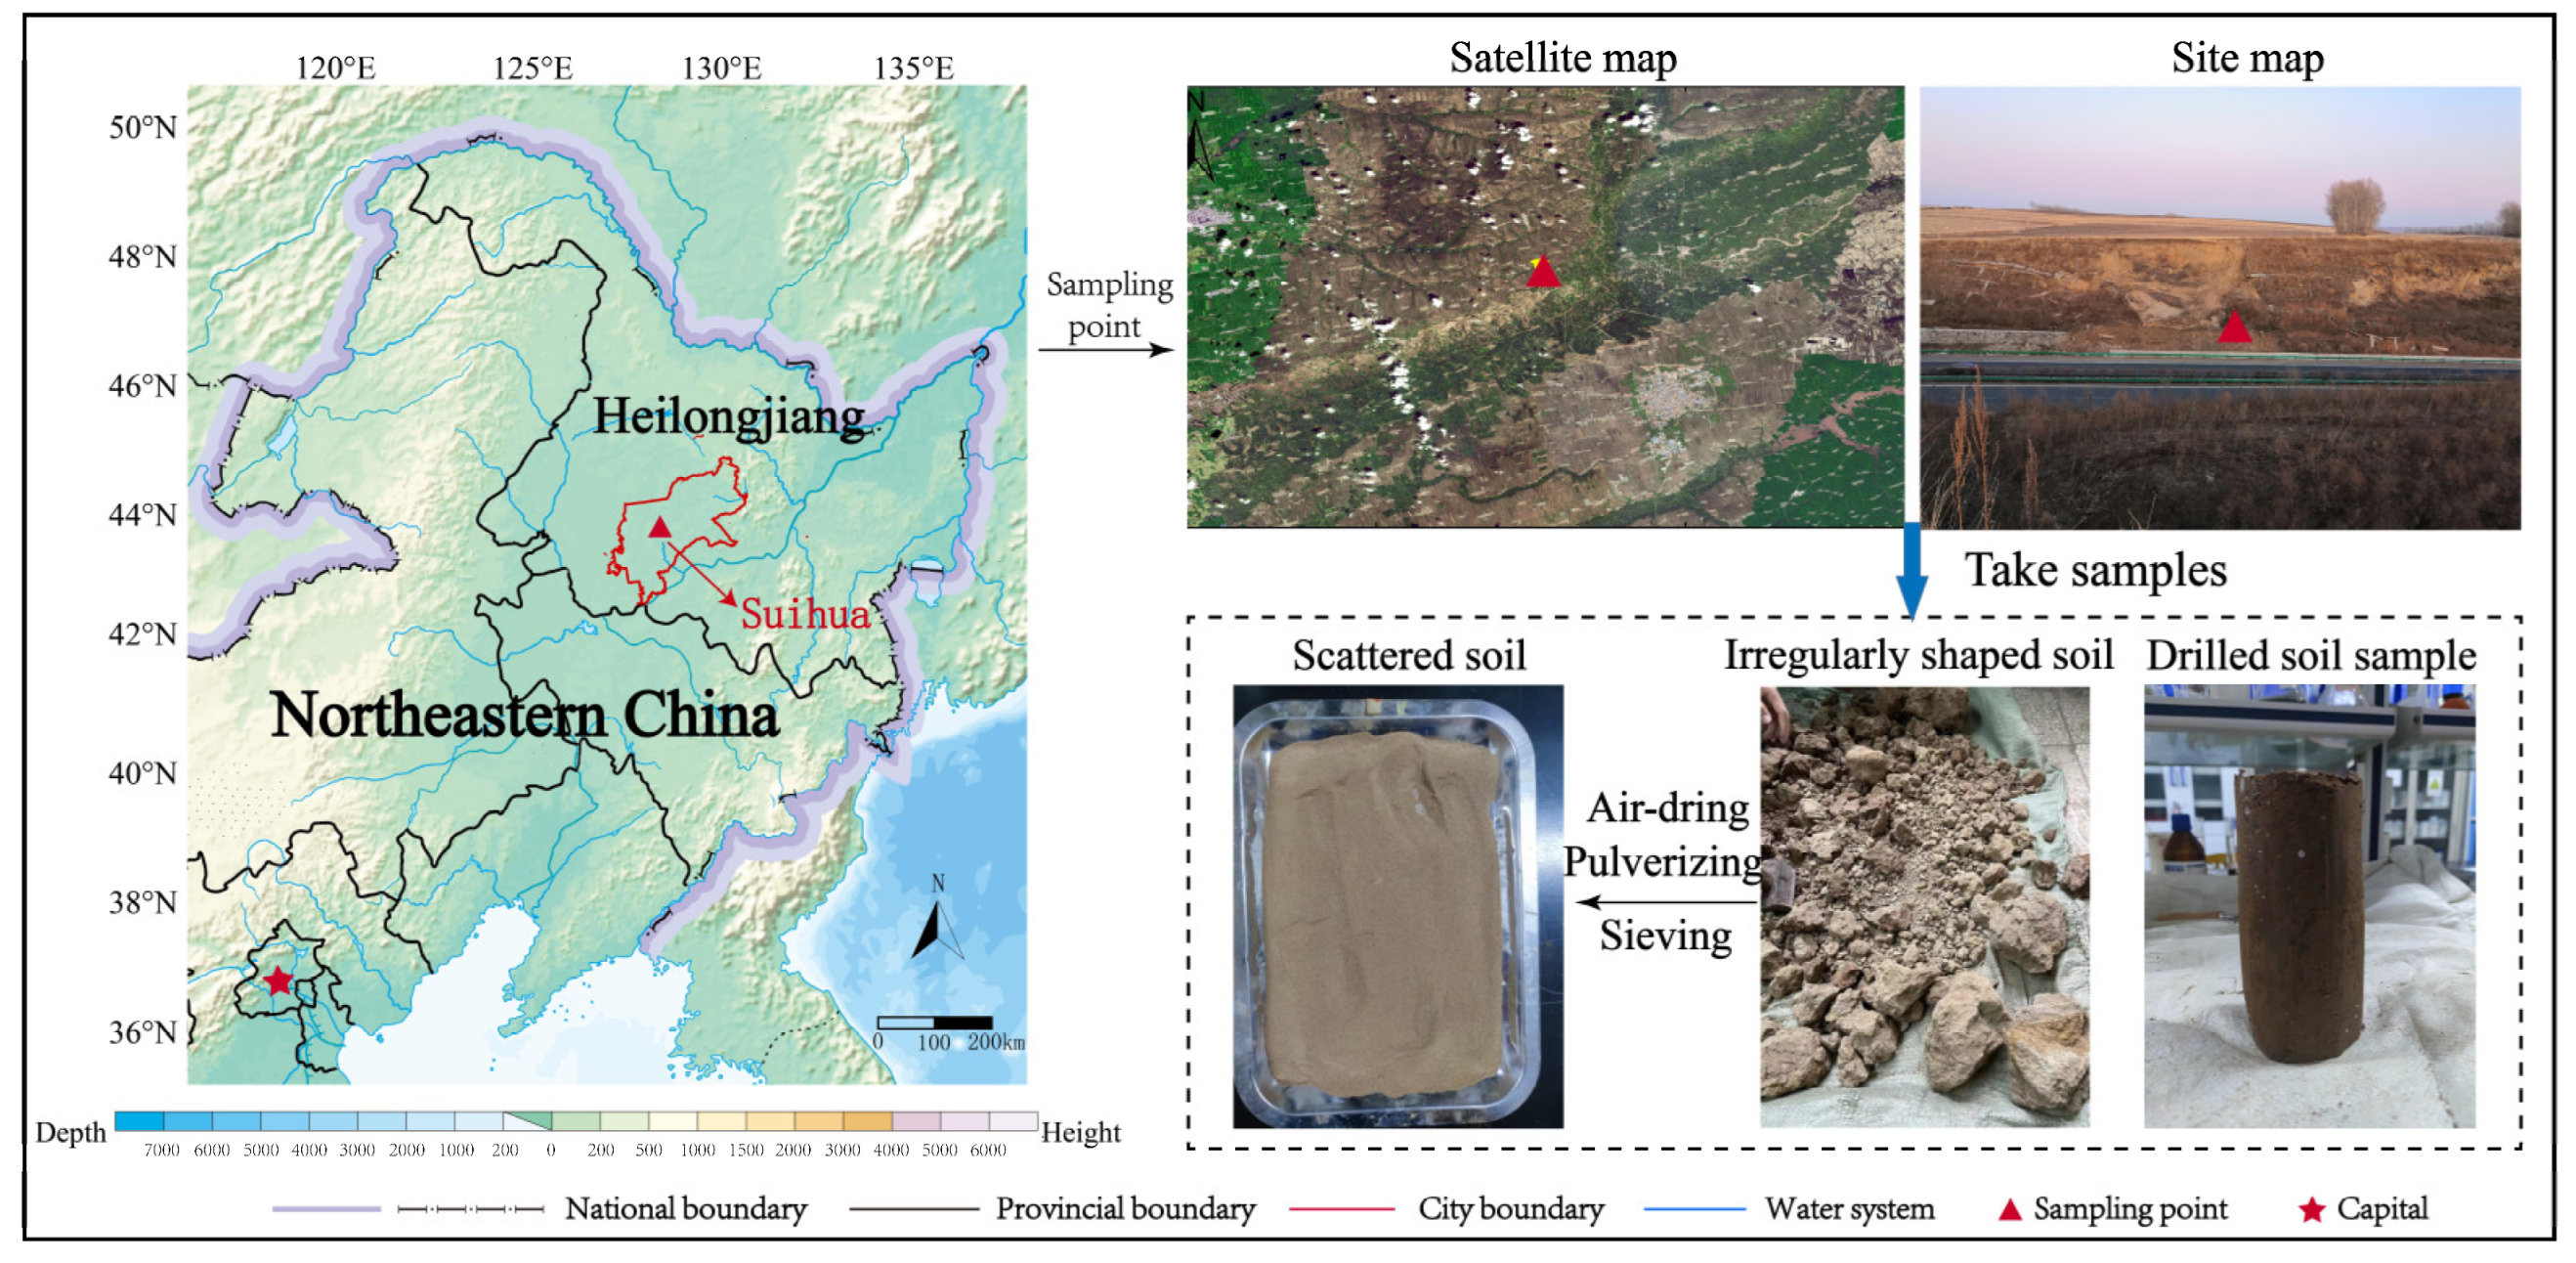
Figure 1. Location and environment of the study area.
Buildings 14 00789 g001
Figure 2. XRD diffraction pattern and mineral composition of expansive soil.
Buildings 14 00789 g002
Figure 3. Grain size distribution of expansive soil.
Buildings 14 00789 g003
Figure 4. Samples preparation. (a) Drilled sample; (b) Cutting sample; (c) Undisturbed sample; (d) Scattered soil; (e) Remolded sample.
Buildings 14 00789 g004
Figure 5. Unconfined compressive strength instrument.
Buildings 14 00789 g005
Figure 6. Triple-lever-type consolidation apparatus.
Buildings 14 00789 g006
Figure 7. Principle and process of scanning electron microscopy (SEM) test.
Buildings 14 00789 g007
Figure 8. Failure state of undisturbed and remolded expansive samples.
Buildings 14 00789 g008
Figure 9. (a) Stress-strain curves of undisturbed samples; (b) Stress-strain curves of remolded samples; (c) Comparison of Stress-strain curves.
Buildings 14 00789 g009
Figure 10. Parameters of UCS tests. (a) q u ; (b) ε u .
Buildings 14 00789 g010
Figure 11. (a) e l g P c curves of undisturbed samples; (b) e l g P c curves of remolded samples; (c) Comparison of e l g P c curves.
Buildings 14 00789 g011
Figure 12. (a) Loading–unloading curves; (b) e 1 / e 0 ; (c) e 2 / e 0 ; (d) e 1 / e 2 .
Buildings 14 00789 g012aBuildings 14 00789 g012b
Figure 13. (a) σ k ; (b) S t . σ k and S t . C c .
Buildings 14 00789 g013
Figure 14. Microstructure of Type II undisturbed and remolded samples.
Buildings 14 00789 g014
Figure 15. Microstructure of undisturbed and remolded samples under different condition.
Buildings 14 00789 g015
Figure 16. The diagram of gray correlation.
Buildings 14 00789 g016
Figure 17. Mechanism diagram of influencing factors.
Buildings 14 00789 g017
Table 1. Some basic properties of the expansive soil.
PropertyValues
Liquid limit ω L /%41
Plasticity limit ω p /%24
Plasticity index I P 17.42
Liquidity index I L −0.13
Free expansion rate δ e f /%76
Optimum water content ω o p /%21.60
Maximum dry density ρ m a x /(g/cm3)1.65
Table 2. Water content and density of undisturbed samples.
ItemsDepth/m ω /% ρ /(g/cm3) ρ d /(g/cm3)
1-1116.612.101.80
1-2218.052.051.74
1-3318.261.991.68
1-4421.631.971.62
1-5519.052.031.71
1-6620.791.881.56
1-7720.851.921.59
1-8821.202.031.67
1-9930.441.911.46
1-101022.701.981.61
1-111122.441.851.51
1-121224.301.971.58
1-121224.301.981.59
1-131320.191.951.62
1-141423.661.911.54
Table 3. Samples information for UCS test and high-pressure consolidation test.
Items ω /% ρ /(g/cm3) ρ d /(g/cm3)ComparisonType
UCS
tests
1-116.612.101.80 ω ω o p , ρ d ρ m a x I
1-421.631.971.62 ω ω o p , ρ d ρ m a x II
1-519.052.031.71 ω ω o p , ρ d ρ m a x II
1-821.202.031.67 ω ω o p , ρ d ρ m a x II
1-930.441.911.46 ω ω o p , ρ d ρ m a x III
1-1423.661.911.54 ω ω o p , ρ d ρ m a x II
High-pressure consolidation tests1-116.612.101.80 ω ω o p , ρ d ρ m a x I
1-821.202.031.67 ω ω o p , ρ d ρ m a x II
1-930.441.911.46 ω ω o p , ρ d ρ m a x III
1-1022.01.981.62 ω ω o p , ρ d ρ m a x II
1-1224.301.971.58 ω ω o p , ρ d ρ m a x II
1-1423.661.911.54 ω ω o p , ρ d ρ m a x II
Table 4. The compression index ( C c ) and resilience index ( C s ) of samples.
ItemsCcCsItemsCcCs
Undisturbed 1-10.2160.0049Remolded 1-10.2580.0052
Undisturbed 1-40.1970.0130Remolded 1-40.2280.0090
Undisturbed 1-50.2120.0076Remolded 1-50.2150.0061
Undisturbed 1-80.1400.0091Remolded 1-80.1820.0110
Undisturbed 1-90.1320.0114Remolded 1-90.1640.0203
Undisturbed 1-140.2570.0284Remolded 1-140.2110.0252
Disclaimer/Publisher’s Note: The statements, opinions and data contained in all publications are solely those of the individual author(s) and contributor(s) and not of MDPI and/or the editor(s). MDPI and/or the editor(s) disclaim responsibility for any injury to people or property resulting from any ideas, methods, instructions or products referred to in the content.