Article

A Review of Building Carbon Emission Accounting Methods under Low-Carbon Building Background

1
China Construction Science and Industry Corporation Ltd., Shenzhen 518052, China
2
State Key Laboratory of Mountain Bridge and Tunnel Engineering, Chongqing Jiaotong University, Chongqing 400074, China
3
School of Civil Engineering, Chongqing Jiaotong University, Chongqing 400074, China
*
Author to whom correspondence should be addressed.
Buildings 2024, 14(3), 777; https://doi.org/10.3390/buildings14030777
Submission received: 21 February 2024 / Revised: 8 March 2024 / Accepted: 11 March 2024 / Published: 13 March 2024
(This article belongs to the Section Building Structures)

Abstract

:
With the continuous development of the global economy, carbon dioxide and other greenhouse gas emissions are persistently increasing, making global warming an indisputable fact. As a high-energy consuming industry, the building industry has gradually emerged as the primary source of greenhouse gas emissions during urban expansion. Consequently, countries are exploring sustainable development pathways for low-carbon buildings to minimize the detrimental impact caused by the construction industry. This paper summarizes the current status of low-carbon building development and, through literature analysis concerning carbon standard systems and carbon emission accountings, discusses the challenges and possible improvements for the future. Establishing a quantitative evaluation tool for carbon emissions and elucidating accounting methods in the construction field is fundamental and a prerequisite for comprehensively studying low-carbon buildings throughout their life cycle. The challenges of low-carbon building development are as follows: (1) lack of a set of carbon emission measurement standards that can be commonly used internationally, (2) lack of a deep and systematic study of the theory of carbon emission accountings and (3) difficulty in recognizing carbon emission boundaries and related data for existing carbon emission accounting methods. This paper provides a comprehensive analysis of the current progress in low-carbon building development, along with an examination and optimization of the application of carbon emission accounting methodologies within construction to address the challenges.

1. Introduction

1.1. Background

With the rapid growth of the global economy and population, the concentration of greenhouse gases (GHGs), like carbon dioxide, in the atmosphere is steadily increasing, consequently, the resulting issue of global warming has posed a serious challenge to the development and survival of mankind [1]. Studies have shown that a significant portion of the rise in global temperatures is related to excessive human emissions of CO2 and other GHGs into the atmosphere. Between 1970 and 2004, GHG emissions witnessed a staggering increase of 70%, with emissions still on a rising trend, therefore, it is necessary to study the emission of greenhouse gases to reduce the greenhouse effect [2].
In 2023, the United Nations Environment Programme (UNEP) published the report “Buildings And The Climate: Constructing A New Future”, which pointed out that the buildings and construction sector is by far the largest emitter of greenhouse gases, accounting for a staggering 37% of global emissions [3]. This makes it one of the crucial domains for low-carbon energy savings. Figure 1 shows the share of global carbon emissions from the construction sector. As the international community attaches importance to carbon emissions, relevant regulations have been proposed at the international level. The Copenhagen Conference proposed the establishment of a carbon emission reduction framework for the next few years, along with the formulation of a mandatory carbon reduction system. As of now, the international carbon trading mechanism has been formed and is gradually improving. “Carbon has become intricately connected to the economy, and the future development of the economy will inevitably be closely tied to carbon emissions. Reducing carbon emissions is no longer merely a voluntary endeavor, it has become a necessity [4].
The IPCC’s Fourth Assessment Report shows that the construction sector has a huge carbon reduction potential of up to 5–7 billion tons of CO2-equivalent by 2030, and is suitable for both developing and developed countries as well as countries with economies in transition [5]. As the world’s largest emitter of GHGs in the world, China submitted the “Enhanced Action on Climate Change—China’s National Autonomous Contribution” to the secretariat of the United Nations Framework Convention on Climate Change (UNFCC) in June 2015, which focuses on curbing carbon emissions from buildings and transportation, strengthening the decarbonization of cities, improving the level of energy efficiency of buildings and the quality of construction works, extending the service life of buildings, increasing the renovation of existing buildings, and constructing energy-saving and low-carbon urban infrastructures [6].
In China, according to a study by the Energy Research Institute of the National Development and Reform Commission, compared with the industrial and transportation sectors, the construction sector has a greater potential for carbon reduction and is less difficult to reduce carbon emissions [7]. However, to achieve emission reduction, it is necessary to quantify building carbon emissions, establish relevant hard indicators and use specific figures to measure the effect of emission reduction. At present, the research on the carbon footprint of buildings is still in its infancy. Both the basic data and the building carbon emission accounting model are not perfect, so it is necessary to carry out an in-depth study on the issue of greenhouse gas emissions from buildings. Figure 2 [8] shows the basic idea and significance of the study of building carbon emissions. By quantifying building carbon emissions, we can work towards achieving carbon neutrality, reducing building carbon emissions and preserving the natural environment.
This paper summarizes the current status of low-carbon building development and, through literature analysis concerning carbon standard systems and carbon accounting, discusses the challenges and possible improvements for the future. Section 2 is the methodology of this work and conducts a bibliometric analysis of carbon emission accountings. Section 3 is about the existing carbon emission accounting standards and the current status and challenges regarding research on carbon emission accounting methods, which also refers to the possible future work of low-carbon building development. Section 4 is the main conclusion. This paper aims to have a guiding effect on achieving carbon emission reduction by comparing, analyzing and optimizing carbon emission accounting methods.

1.2. Policies for Low-Carbon Building

With the increasing prominence of global climate issues and the growing severity of the global energy crisis, the Paris Agreement came into effect in 2016, aiming to alleviate climate change by reducing CO2 emissions. Meanwhile, developing low-carbon buildings, which emphasize low energy consumption and low emissions, has become a global consensus. To conform to the trend of the times and follow the development of the world’s low-energy building trend, some countries and regions have actively carried out research on low-carbon building and led the way in implementing low-carbon building practices. The following is a brief introduction to the current status of low-carbon building development in several countries, including the UK, the United States, Denmark, Japan and China.
The UK is a world leader in the field of low-carbon buildings. Accompanied by the constraints of a perfect legal system and the support of effective emission reduction technology, the UK’s low-carbon buildings have been normalized and have become a daily routine for buildings. The modern sense of sustainable development in the United Kingdom began in the 1960s and 1970s, when Alexander Pike of the University of Cambridge began to research self-sustainable housing through building self-supply. After entering the 21st century, the UK pays more attention to the use of new materials, technologies and high-tech ecoprojects. Beddington ecovillage (BedZED) is a low-carbon demonstration project of the UK government that adopts a variety of environmentally friendly building materials and energy technologies to minimize the negative impact on the environment. The project ended up with a high level of virtually no carbon dioxide emissions into the atmosphere and has been called “zero energy development” [10].
In 2006, the UK government released the Code for Sustainable Homes, a UK government-backed guideline aimed at encouraging and promoting the residential construction industry to move towards a more sustainable and environmentally friendly approach [11]. The Code for Sustainable Homes has already had a positive impact on the UK residential construction industry and has promoted the development of sustainable buildings. In 2008, the UK Parliament passed the Climate Change Act, the world’s first bill to set GHG emissions reductions to combat climate change [12,13]. The main objective of the act is to ensure that the UK reduces its greenhouse gas emissions to 80% of 1990 levels by 2050 [14]. Additionally, in 2021, the UK promulgated the Heat and Buildings Strategy, which explicitly required improving household energy standards and reducing the CO2 emissions of heating. By 2035, the UK will have completely stopped selling gas-fired boilers and switched to low-carbon alternatives, with the act requiring the UK to put electric heat pumps (HPs) at the core of its net-zero strategy and to develop low-carbon systems [15].
The focus of low-carbon laws and regulations for the U.S. construction industry is on building energy efficiency. The Energy Policy and Conservation Act of 1975 required the federal government to implement an effective energy conservation program, and thus began the journey towards energy efficiency in U.S. buildings. In 1977, the Energy Conservation in New Building Construction Code established mandatory energy conservation standards for new buildings. In 1993, the U.S. Building Commission was established to require the construction of energy-efficient green buildings and to create a green building rating system, the “Pioneer in Energy and Environmental Design”. The Energy Efficient Building Certification Act and the Energy Independence and Security Act, enacted in 2007, set out the requirements for specifying the use of new energy-saving technologies and improving energy use in the building industry [16,17]. The U.S. mandatory energy-efficiency standards are mainly composed of two parts: the International Energy Conservation Code (IECC), which was developed by the International Code Council (ICC), applies to the energy-efficient design of low-rise residential buildings; meanwhile, the Building Energy Conservation Code for Buildings Other Than Low-Rise Residential Buildings (BECB), which was developed by the Refrigeration and Air Conditioning (ASHRAE), applies to all public buildings and residential buildings over three storeys. In 2015, the U.S. introduced its plan for federal sustainability in the next decade, which requires that all new federal buildings with a total area of more than 5000 square feet be designed to achieve net-zero energy beginning in 2020, and net-zero water or waste by 2030 [18,19].
Denmark is recognized as one of the world’s most successful countries in achieving green and low-carbon development. Today, Denmark is at the forefront of the world in renewables and energy efficiency. Since 1976, the Danish energy system has undergone a major shift towards cogeneration, renewables and energy efficiency, supported by a political economy of democratic inclusion in decentralized energy planning and a cultural sensitivity to the social and environmental costs of fossil fuel use [20]. The decarbonization of the energy structure is an important pillar for the sustainable development of the Danish economy. During the period 1980–2010, Denmark’s energy consumption emphasized a decrease of 27.8%, and per capita energy consumption decreased by 7.7%; meanwhile, the proportion of renewable energy in total energy consumption increased by 232% during the same period [21]. In terms of low-carbon towns and cities, Denmark focuses on innovation and practice, and has developed a series of advanced concepts and experiences. One notable example is the Sønderhøj Solar Village, located in Aarhus, Denmark. This sustainable community is known for its use of renewable energy sources, such as solar and wind. Meanwhile, the community demonstrates how renewable energy and energy-efficient technologies can be applied to building and community design, providing insights into the future of housing and community development [22,23]. In accordance with the EU strategy, Denmark requires that the annual energy consumption per unit area of residential apartments be limited to 20 kWh/(m2·a) after 2020. Similarly, the annual energy consumption per unit area of public buildings, such as offices and schools, should be restricted to 25 kWh/(m2·a) [24].
Japan is one of the pioneering countries in advocating for the construction of a low-carbon society, and its low-carbon development strategy was launched relatively early. As a country with relatively scarce energy and resources, Japan has designated and promulgated a series of energy-saving and emission-reduction policies and regulations since 1992 [25]. The Kyoto Agreement of 2005 requires Japan’s emission reduction target to be reduced by 6% compared with 1990, while in fact, Japan’s carbon reduction target has not been accomplished, and the carbon emissions have increased by 11.3% instead of decreasing [26]. Based on the above background, the Japanese government proposed a zero-carbon building development plan in 2008 and formulated a technical roadmap for zero-energy buildings in 2012, with the goal of realizing the average energy consumption of newly built single-family residential buildings and public buildings to reach the level of zero-energy buildings by 2030. On 13 May 2016, the Japanese government established the Global Warming Countermeasures Plan to implement the Paris Agreement it signed. The plan proposes that 100 percent of new public buildings and more than 50 percent of buildings in Japan should adopt intelligent building control systems by 2020, among other things [27]. Today, Japan is actively engaged in research in the field of zero-energy buildings. The Japanese government requires new public buildings to meet average energy consumption targets by 2020; meanwhile, all new buildings should meet the ZEB target by 2030. The specific requirement is that the ZEB-ready buildings should achieve a 50% reduction in primary energy consumption [28,29].
In 2011, China surpassed the United States in becoming the world’s largest energy consumer. According to BP statistics, China’s energy consumption was 30.53 million tons of oil equivalent in 2016, accounting for 23% of the global total. This huge energy consumption and pollutant emissions make China face a challenging mission of energy conservation and emissions reduction [30]. At present, the construction industry is a field with relatively high energy consumption and carbon emissions in China. According to statistics, carbon emissions directly or indirectly related to the construction industry account for as much as 37% of China’s carbon emissions [31]. In 2019, the Ministry of Housing and Construction issued the “near-zero energy consumption building technical standards”, determining the “ultra-low, near-zero, zero” energy consumption building progressive “three-step” development path, in which the ultra-low energy consumption building refers to the level of energy consumption compared to the national building energy-saving design standards in 2016 to reduce the level of more than 50%, the near-zero energy consumption building refers to a reduction in more than 60–75%, the zero-energy building refers to the building of self-generated where renewable energy is greater than or equal to the building of all the energy use. In 2020, China put forward the “double carbon” strategic goal, and steadily promoted carbon peak and carbon neutrality [32]. Compared with developed countries, China is facing multiple challenges, such as the high density of human settlements, the complex technology of high-quality urban renewal and the level of urbanization that continues to increase and the task of realizing that the goal of “double carbon” in the construction industry is arduous [33,34]. In March 2022, the Ministry of Housing and Construction released the “14th Five-Year Plan” for Building Energy Efficiency and Green Building Development, which specifies the area of energy-saving renovation of existing buildings and the target for the construction of ultra-low-energy and near-zero-energy buildings in 2025.
To make society understand and take notice of low-carbon buildings, each country has its own unique promotion mechanism. Table 1 shows the latest policies and core objectives in low-carbon buildings [35].
Through the experience of various countries over the years, it has been observed that a combination of mandatory and voluntary standards is employed, with mandatory standards ensuring compliance with minimum requirements and voluntary standards elevating the upper limit of low-carbon building performance. Secondly, emphasis is placed on carbon emissions within these standards, making carbon emission indicators a pivotal control factor while stipulating specific requirements to incentivize low-carbon construction activities among enterprises.

2. Methodology

2.1. Literature Research

Literature research is the main method used in this work. Firstly, the keywords “low-carbon building, carbon emission accounting method, carbon emission accounting standard, carbon footprint and energy saving” were searched in academic databases (i.e., ScienceDirect and Web of Science). Secondly, the sources were academic, as well as nonacademic, consisting of industry and university studies, governments and international agency reports, internet and media publications and references. Finally, literature was uncovered by further searching the cited references in the review articles. Using bibliometric and content analysis techniques, this research undertakes a quantitative and qualitative analysis of carbon emission accounting methods.

2.2. Bibliometric Analysis

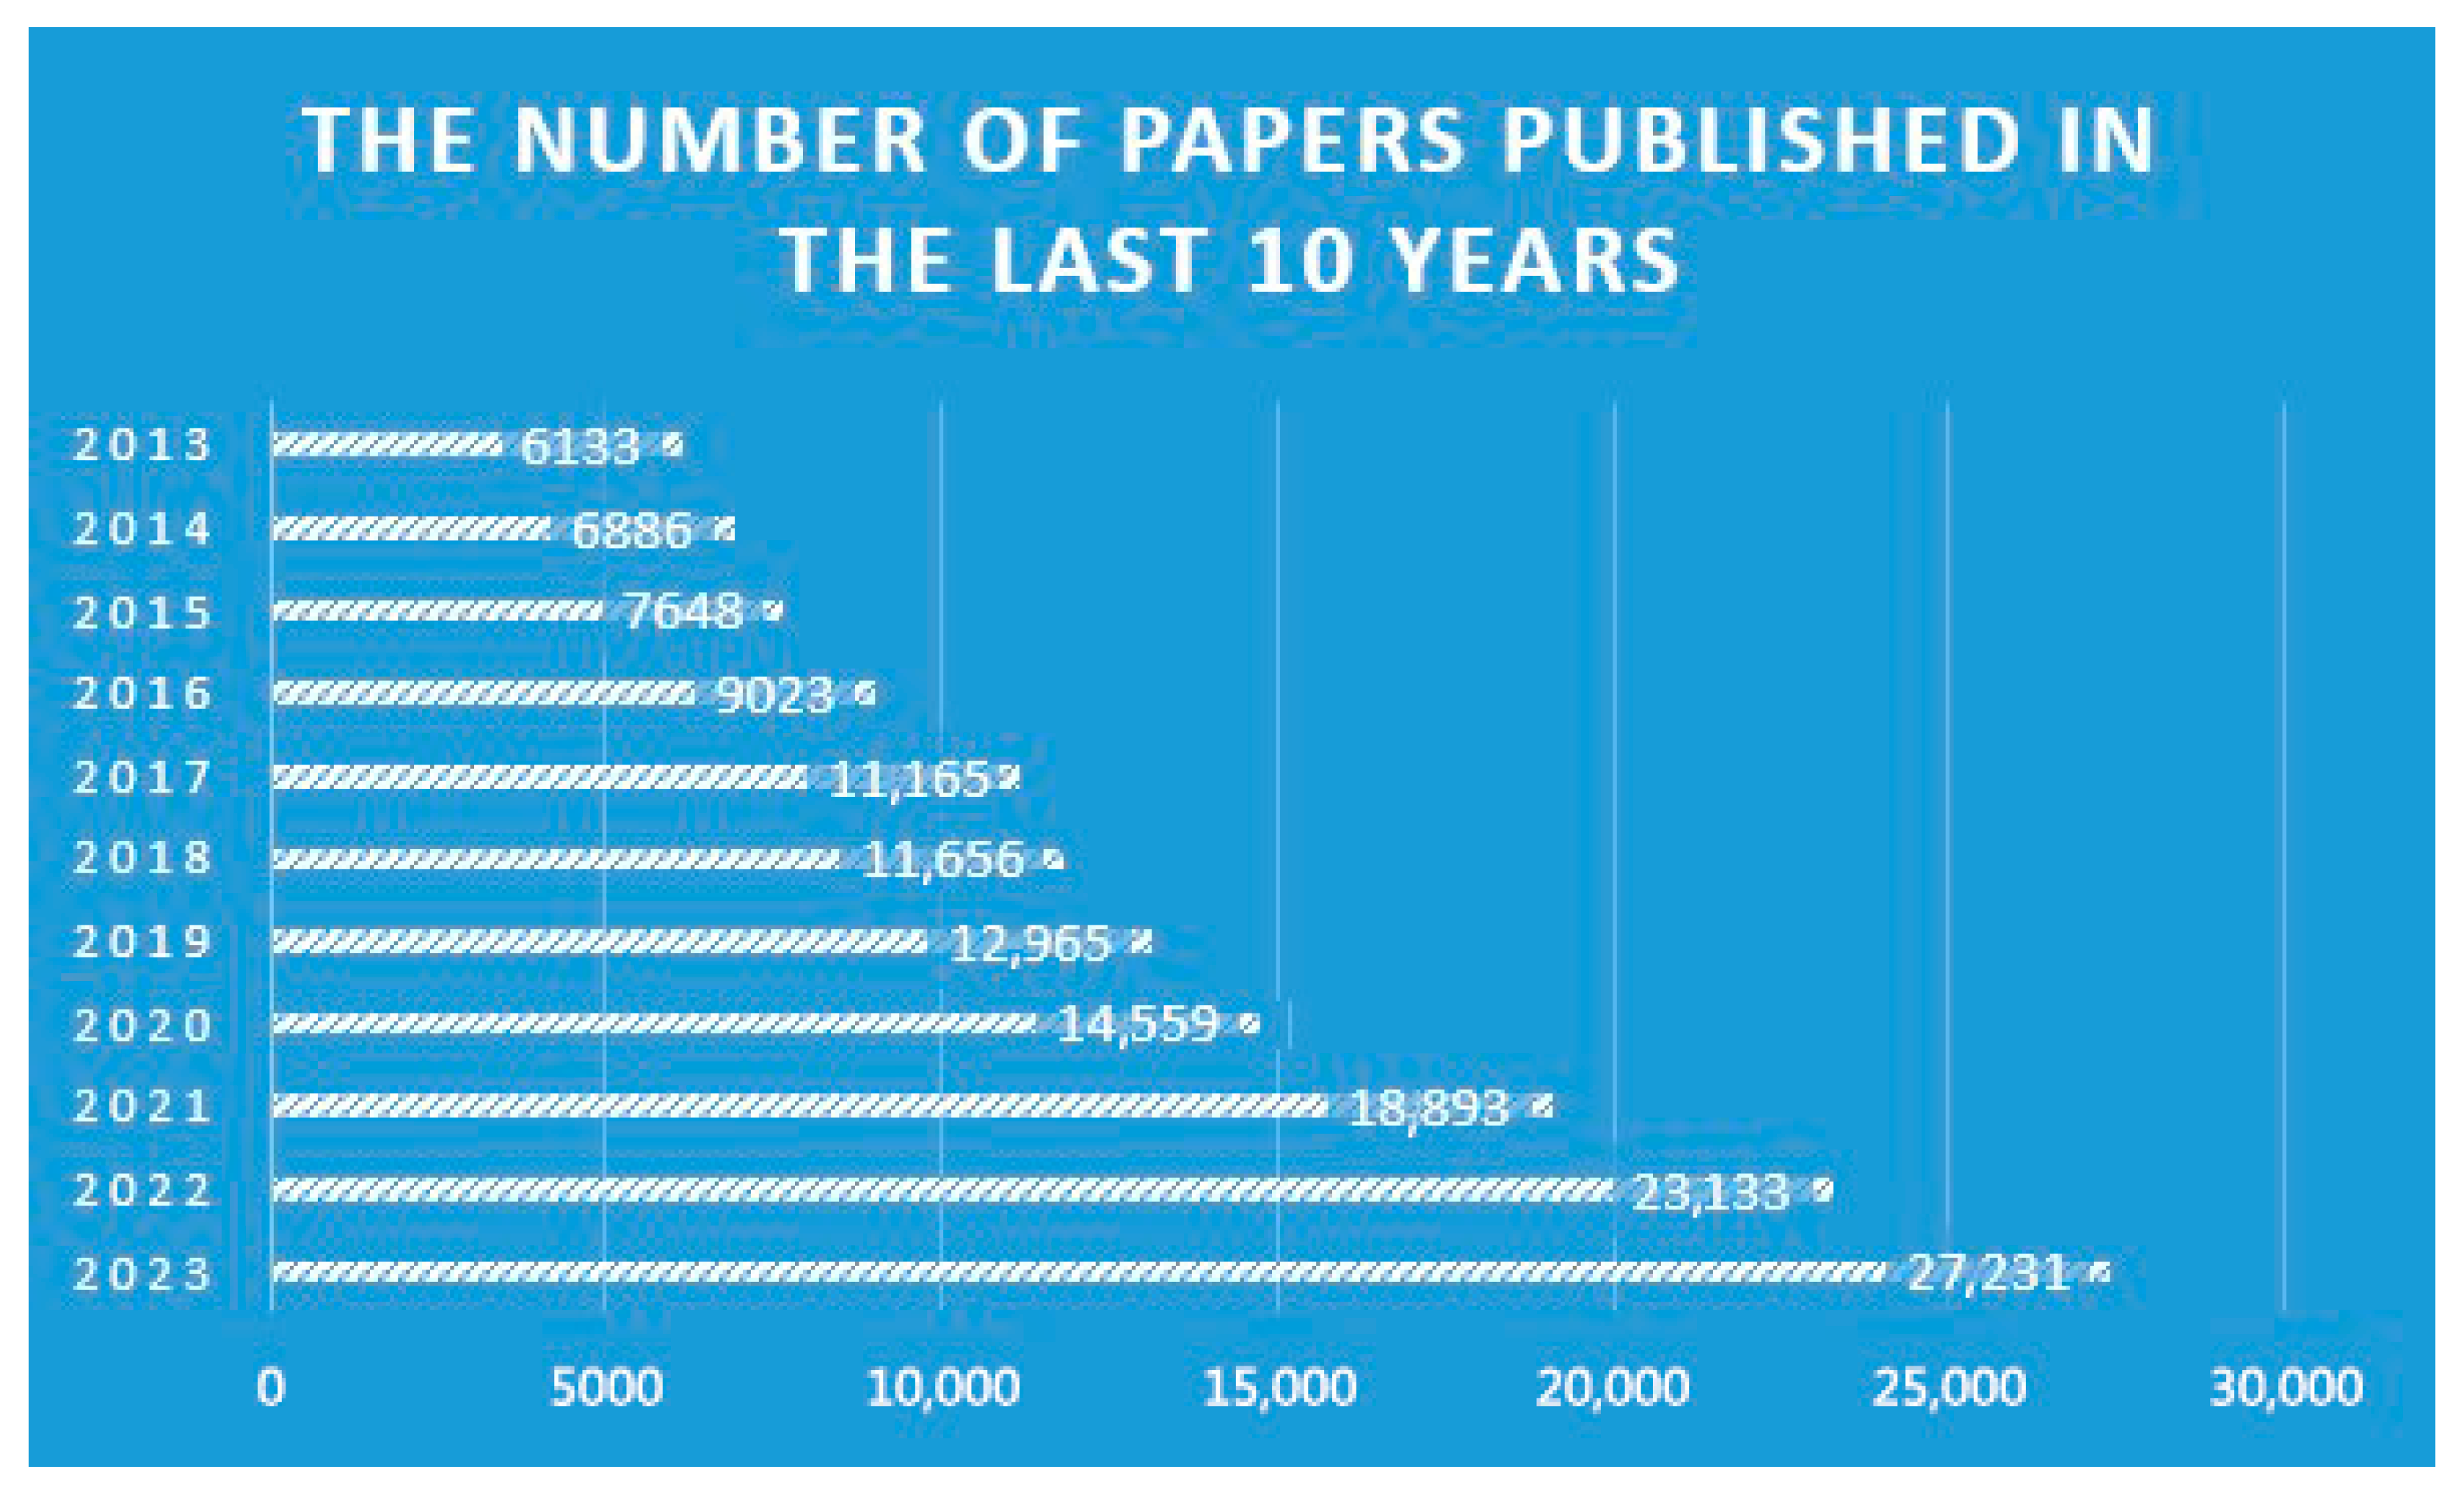
2.2.1. Literature Trends

The number of papers serves as a valuable indicator of the growing trend of research on building carbon emissions [36]. Figure 3 shows the number of papers concerning building carbon emissions published from 2013 to 2023 in the Science Direct database, which reveals a continuous upward trend in both the annual distribution and cumulative number of papers in this research field. Since 2017, the average yearly publication count has surpassed 11,165, indicating a gradual growth in academic interest in this issue. After 2021, the publication count increased significantly to an average of 23,133 papers per year, indicating that the topic is of great interest to the academic community.

2.2.2. Quantitative Analysis of the Main Source Journals

According to the number of building carbon emission research articles published, Table 2 lists the top 10 journals in the Science Direct database. The top 10 journals account for 66.76% of the total number of papers published. Firstly, in terms of the number of articles, the Journal of Cleaner Production is the top journal, accounting for 14.71% of the total number of articles, which is much higher than other journals. Construction and Building Materials had the second-highest number of articles, accounting for 9.15% of the total. Secondly, in terms of academic impact, Table 2 presents an important indicator—the impact factor (IF), which measures the academic influence of journals. The higher the IF, the greater the academic influence. In addition to Energy Procedia, the highest is Renewable and Sustainable Energy Reviews with 15.9, and the lowest is the Journal of Building Engineering with 6.4.

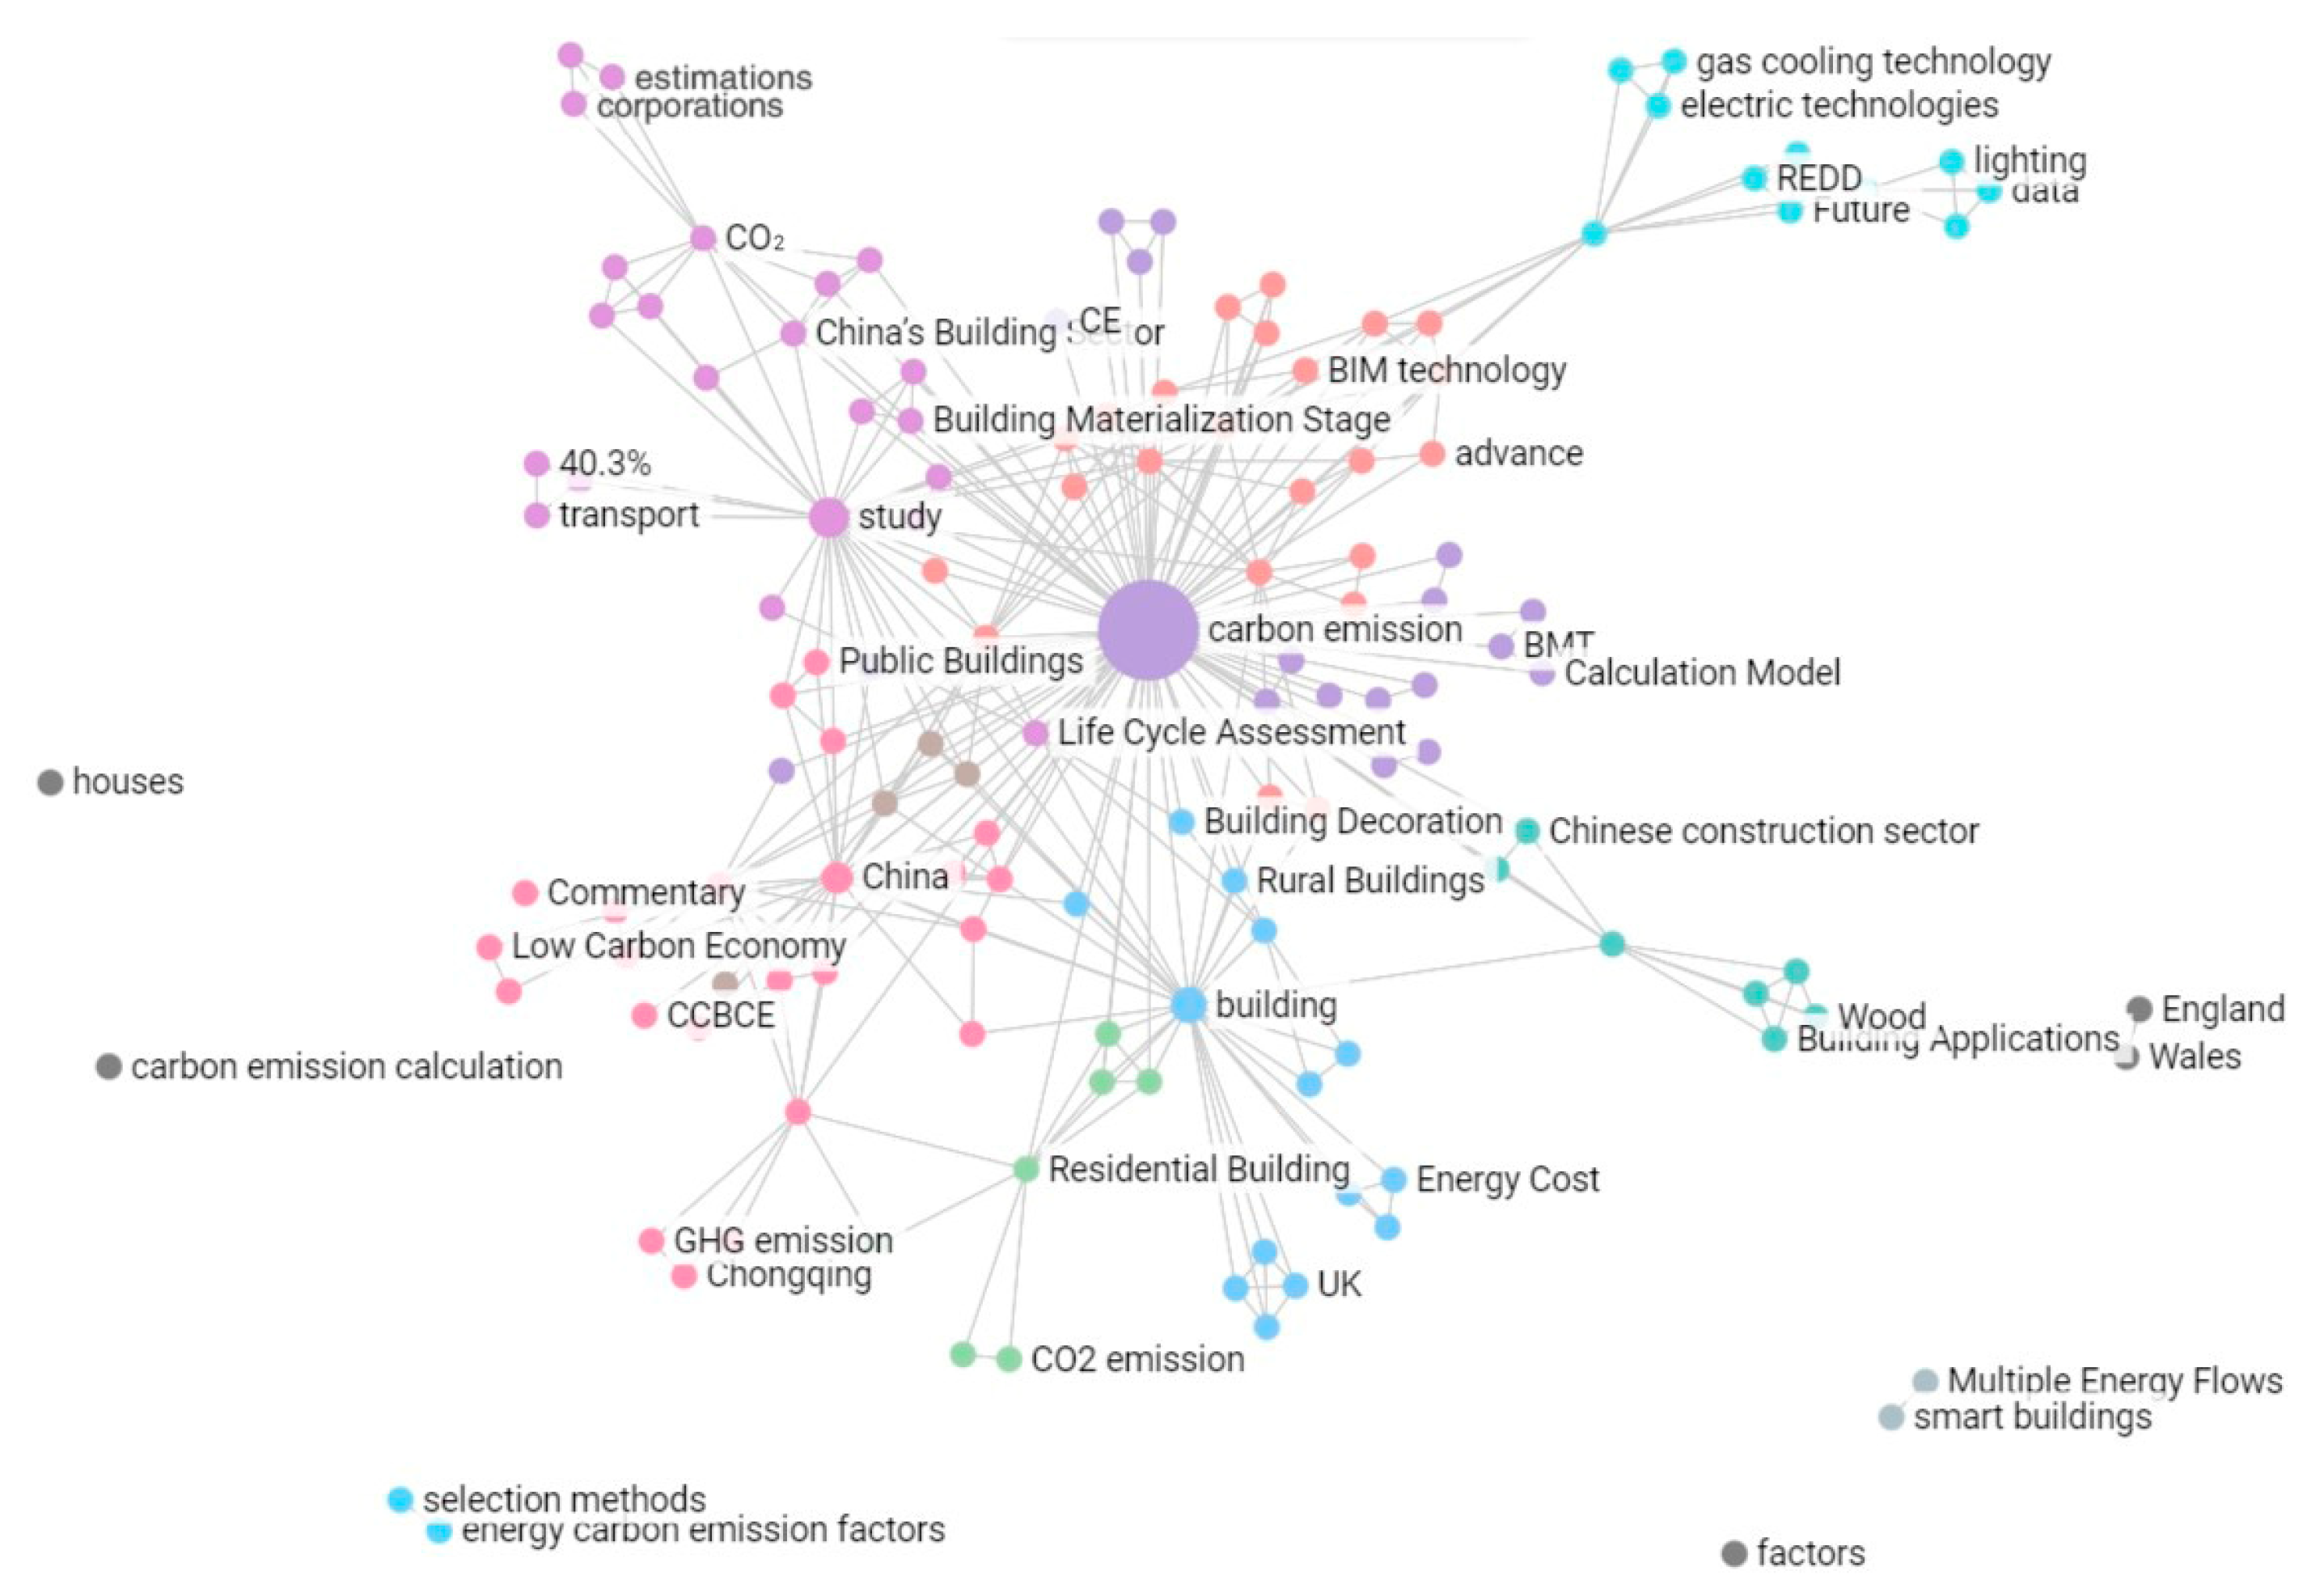
2.2.3. Keyword Co-Occurrence Analysis

Keywords reflect the essential themes explored in a topic and help to identify key areas of research [37]. Therefore, the analysis of keyword networks shows the relationships between topics in a knowledge domain [38]. In this research, the co-occurrence of keywords was analyzed, and the network map was visualized using the Summit Keyword Graph. Figure 4 shows the areas of interest in building carbon emission accounting research.
As can be seen in the figure, the intricate connecting lines between different keywords indicate that there are complex relationships between them. The keywords “life cycle assessment” and “building materialization stage” indicate that the life cycle assessment method and the accounting of the physicalizing phase of the whole life cycle have received more attention among carbon emission accounting under the low-carbon building background. The keywords “China’s building”, “Chinese construction sector” and “UK” indicate that China and the United Kingdom pay more attention to the field of building carbon emission accounting.
Further analysis of the network indicates that topics that frequently co-occurring in research studies tend to be closely related to each other, or vice versa, based on the strength of the connection [39]. Hence, two close topics such as “carbon emission” and “calculation model” indicate that both topics have been studied frequently and therefore have a strong connection between them. On the contrary, although energy carbon emissions from fossil fuels consumed in building construction are critical to building construction, the long distance between carbon-related topics and energy carbon emission factors demonstrates that the carbon emissions research theme is yet to gain popularity in the application of energy and carbon emission factors [40].

3. Application Status for Carbon Emission Accounting

3.1. Carbon Emission Accounting Standards

The prerequisite for realizing carbon peak and carbon neutrality is the accurate and quantitative calculation of carbon emissions from different industries. However, the construction industry, which is a major emitter of carbon, does not have a set of carbon emission measurement standards that can be commonly used internationally. The standards commonly used and referenced internationally are the ISO 14064 series of standards, developed by the International Organization for Standardization (ISO) in 2006 and PAS 2050: 2008 “Specification for the evaluation of greenhouse gas emissions over the life cycle of goods and services” [41], developed by the United Kingdom in 2008 [42].

3.1.1. Standard for Product Carbon Footprint Methodology

To encourage companies to meet their CO2 reduction targets, it is time to develop a standardized methodology to measure and reduce carbon emissions throughout the supply chain. The need for transparency, reliability and consistency of information, the carbon footprint of a product or service and the control of carbon emissions are essential for companies, while gaining credibility for their business [43]. PAS 2050 was born out of this need.
The PAS 2050 methodology [44,45] represents the first attempt to establish a practical and consistent approach for assessing the GHGs associated with any product or service [46]. It allows consumers to compare similar products according to their GHG “footprint” and facilitates the development of a “business-to-business” database of “footprinted” products. The term “carbon footprinting” is used to describe the GHG emissions generated by a specific activity or entity, providing organizations and individuals with a way to assess the contribution of GHG emissions to climate change. “Carbon footprinting” is an important tool in the fight against climate change; it allows individuals and organizations to assess their impact on the environment and helps them to understand where they are emitting greenhouse gases, which is essential for reducing carbon emissions in the future. To reduce GHG emissions, it is necessary to recognize these emissions and their sources. PAS 2050 requires that all emissions that make a significant contribution (i.e., >1% of emissions) be included, and at least 95% of the total emissions. To put it differently, the processes that contribute less than 1% may be excluded [47].

3.1.2. Standard for Defining Carbon Source Types

Carbon sources are the basis for identifying building carbon emission factors and accurately determining building carbon emissions. Therefore, the accuracy of the types of carbon sources directly determines the accuracy of the carbon emission factors for the construction process under study.
ISO 14064, as a practical tool for quantifying, reporting and verifying GHG emissions, strives to improve the reliability and consistency of GHG quantification and reporting with a neutral standard. It enhances the comparability of reported results. The standard sets out the best international models for managing, reporting and verifying greenhouse gas information and data. Emission values can be calculated and verified using standardized methods to ensure consistent measurement of 1 ton of CO2 around the world [48,49]. ISO 14064 consists of three parts: Part I provides guidelines for the quantification and reporting of greenhouse gas emissions and removals at the organizational level (referred to as ISO 14064-1), Part II offers guidelines for the quantification, monitoring and reporting of greenhouse gas emission reductions and removal increments at the project level and Part III provides guidelines for the validation and certification of GHG declarations. Part I, known as ISO 14064-1, establishes a standard for greenhouse gas accounting at the organizational level. Part I is a standard for greenhouse gas accounting at the organizational level—ISO 14064-1. The ISO 14064-1 classifies greenhouse gas emissions into three types:
  • Direct emissions: greenhouse gas emissions from sources directly owned or controlled by a frustrated organization.
  • Energy indirect emissions: electricity, steam, etc., used by an organization for production and other activities.
  • Energy indirect emissions: electricity, steam, etc., used by a frustrated organization for production and other activities.
For this reason, the classification of direct versus indirect emissions based on whether the accounting organization has or does not have control over the source of the emissions has become the most dominant way of classifying GHG emissions.

3.2. Carbon Emission Accounting Methods

The evaluation of greenhouse gases through carbon emissions calculation is an effective approach, with the current main methods including the IPCC inventory method, input-output analysis, life cycle assessment and emission factor estimation. In practice, these methods are often combined in an integrated manner to achieve more optimal results. The following sections provide detailed descriptions of the IPCC inventory method, input-output analysis, life cycle assessment and emission factor estimation.

3.2.1. The IPCC Inventory Method

After recognizing the urgency of the global warming crisis, the World Meteorological Organization (WMO) and the United Nations Environment Programme (UNEP) have actively collaborated to address climate change and its environmental implications. In 1988, they jointly established the Intergovernmental Panel on Climate Change (IPCC) [50], dedicated to assessing the present state, future projections and potential impacts of global climate change worldwide. The IPCC also aims to provide policy recommendations and guidelines pertaining to climate change. The Guidelines for National Greenhouse Gas Inventories, published by the IPCC in 2006, are the guidelines used by the IPCC for the preparation and reporting of national GHG inventories. Although the IPCC is not directly engaged in statistical and research work on national GHG inventory methodologies, it publishes assessment reports that provide scientific, technical, social and economic information related to climate change, and provide a scientific basis and guidance to national governments and the international community [51,52,53].
The IPCC inventory method is derived from the 2006 IPCC Guidelines for National Greenhouse Gases (hereinafter referred to as the 2006 Inventory Guidelines), which divides the scope of GHG emissions accounting into the components of energy, industrial processes and product use, other land use and waste [54], where the important sector in the GHG emissions inventory is the energy sector, which can contribute more than 90% of the CO2 emissions and 75% of total GHG emissions.
Related scholars have conducted relevant studies based on the IPCC inventory method, Liu [55] estimated the direct N2O emissions from paddy fields and vegetable fields in China-based on the IPCC method and came to the conclusion that N2O emissions from vegetable production in China have become an important component that should not be ignored relative to rice and other dryland crop production. Zhang et al. [56] detected and assessed the carbon stock of forest vegetation based on the IPCC method, which helps to prepare a greenhouse gas inventory and reflects the important role of forestry in addressing climate change. Shu et al. [57] calculated the carbon metric parameters of the Xing’an larch plantation forest based on the guidelines released by the IPCC and concluded that the biomass carbon metric parameter values based on the IPCC method would change with forest age, stand conditions, forest species and other factors. Zhang [58] took the arbor forest of Genhe Forestry Bureau as the research object and used the IPCC method to calculate the biomass, carbon stock and carbon density of the Bureau, and the results showed that both Xing’an larch and white birch accounted for 97.29% of the total carbon stock in the arbor forest, and the carbon density of the forest field was higher when the carbon stock of Xing’an larch pine was less. To obtain changes in soil organic carbon (SOC), Mark [59] uses fixed factors based on the IPCC method to estimate how land use and management changes affect default reference SOC stocks.
From the above studies, since the IPCC inventory method uses a series of coefficients that vary by climate and soil type to capture the influence of land use and disturbance history, tillage intensity, productivity and residue management on nitrogen oxide and SOC stocks, the research on carbon emission accounting based on the IPCC inventory method mainly focuses on the research of carbon measurement parameters in agriculture and forestry instead of research on carbon emission accounting for the construction industry. Therefore, our research in the field of building carbon accounting does not primarily focus on the IPCC inventory method.

3.2.2. The Input-Output Analysis

The input-output analysis model was first proposed by the famous American economist Wassily W. Leontief [60,61]. Input-output analysis, also known as the input-output method, is an economic tool for assessing the interrelationships and economic efficiency between different industries in an economic system [62]. In input-output analysis, input refers to the various factors of production required by an industry, such as labor, raw materials, equipment, etc., and output refers to the final products or services produced by the industry. Through quantification and analysis of the inputs and outputs of each industry, a range of indicators can be derived, including employment benefits, economic growth, environmental impacts, etc. Input-output analysis is a top-down approach to calculating carbon footprints. By counting the greenhouse gas emissions of each sector of an enterprise, the input-output analysis can be used to analyze the greenhouse gas carbon emissions generated throughout the production chain.
The process of calculating the input-output analysis is as follows: first, on the basis of the input-output analysis, a matrix is created through which the total output is calculated. This includes the direct and indirect outputs of each sector.
x = I + A + A × A + A × A × A y = ( I A ) 1 y
The x is calculated according to Equation (1), where x represents the total output, I is the unit matrix, A is the direct consumption matrix, y is final demand, A × y is the direct output of the sector, A × A × y is the indirect output of the sector and so on.
The second step involves calculating the carbon footprint at each level, which is determined by the CO2 emissions per unit of output of each subsector, and the direct consumption matrix of the energy providing sector.
b i = R i I y = R i y
b i = R i I + A y
b i = R i x = R i ( I A ) 1 y
The first level is calculated according to Equation (2), the second level is calculated according to Equation (3) and the third level is calculated according to Equation (4), where bi is the carbon footprint and Ri is the CO2 emission matrix, the diagonal values of which represent the CO2 emissions per unit of output for each subsector (divided by the total CO2 emissions of the subsector divided by the total production of the subsector) and A is the direct consumption matrix for the energy supply sector.
Based on Leontief’s input-output analysis model, Chen et al. [63] propose a new parallel-series structure consisting of two stages—interindustry transactions and value-added stages. Each stage further includes three sectors—energy, transport and economy. At stage 1, each sector transforms two inputs (self-input and intermediate-input) into an intermediate product and undesirable output (CO2), where sector-input represents self-use from the examined sector and intermediate-input denotes intermediate use from other sectors. At stage 2, each sector transforms inputs (capital, labor, and intermediate products) into desirable outputs (sector output). Figure 5 shows the new parallel-series input-output data envelopment analysis model.
Dong et al. [64] conducted an in-depth study on the characteristics of the direct and indirect carbon footprints of residents’ consumption in Beijing in 2007. The study concluded that the total carbon footprints of urban residents were approximately 79.93 million tons, which was approximately seven times higher than the total carbon footprints of rural residents at 11.9555 million tons. It was found that the carbon footprints of urban residents were primarily influenced by indirect footprints, while the carbon footprints of rural residents were mainly influenced by direct footprints. To study the carbon emissions of China’s construction industry and measure the influence of the construction industry, Zhang et al. [65] divided it into two parts: direct carbon emissions and indirect carbon emissions in the process of carbon emission accounting, they used input-output analysis to calculate the indirect carbon emissions, and obtained the indirect carbon emissions of the construction industry in 2002, 2005 and 2007, respectively, which were 922,461,600 tons, 122,303,484 tons and 171,963,494 tons, and it was found that the influence of the construction industry’s carbon emissions was very prominent among the major industries, of which the indirect carbon emissions of the construction industry in 2007 ranked the first among all industries. Yang et al. [66] established a carbon emission accounting model based on input-output analysis to calculate and evaluate the carbon emissions of China’s paper industry in 2020. The results showed that China’s paper industry had a significant carbon emissions impact; direct carbon emissions generated a relatively high unit output. Meanwhile, indirect carbon emissions contributed to the electricity supply industry, with the highest carbon emissions.
The input-output analysis can be used to estimate the implied carbon footprint, which is applicable to the one-time estimation of carbon emissions in multiple industries, mainly focusing on the macro level such as industry and region, and it can provide useful references for the industry and enterprises to find out the key links of carbon emissions and implement the carbon reduction tasks in the context of dual-carbon [25,67]. One of the notable advantages of input-output analysis is its ability to use the information available in input-output tables to calculate the direct and indirect environmental impacts of economic changes. This is achieved by utilizing the Leontief inverse matrix to determine the physical transformations between products and their material inputs. The limitations of the method are:
  • This method calculates CO2 emissions by sector, but there are many different products within the same sector, and the CO2 emissions of these products may vary greatly, so it is easy to generate errors when using the averaging method in the calculation.
  • The input-output analysis method yields results that only provide industry data, rather than product-specific data. As a result, it can be utilized to assess the carbon footprint of a sector or industry, but not to calculate the carbon footprint of an individual product.
Compared with other industries, input-output analysis is not much used in the construction industry. For construction projects, it is necessary to collect data and analyze and calculate the carbon footprint of construction projects at all stages. It is difficult to meet this need by using input-output analysis, so it is not suitable for measuring the carbon footprint of construction projects.

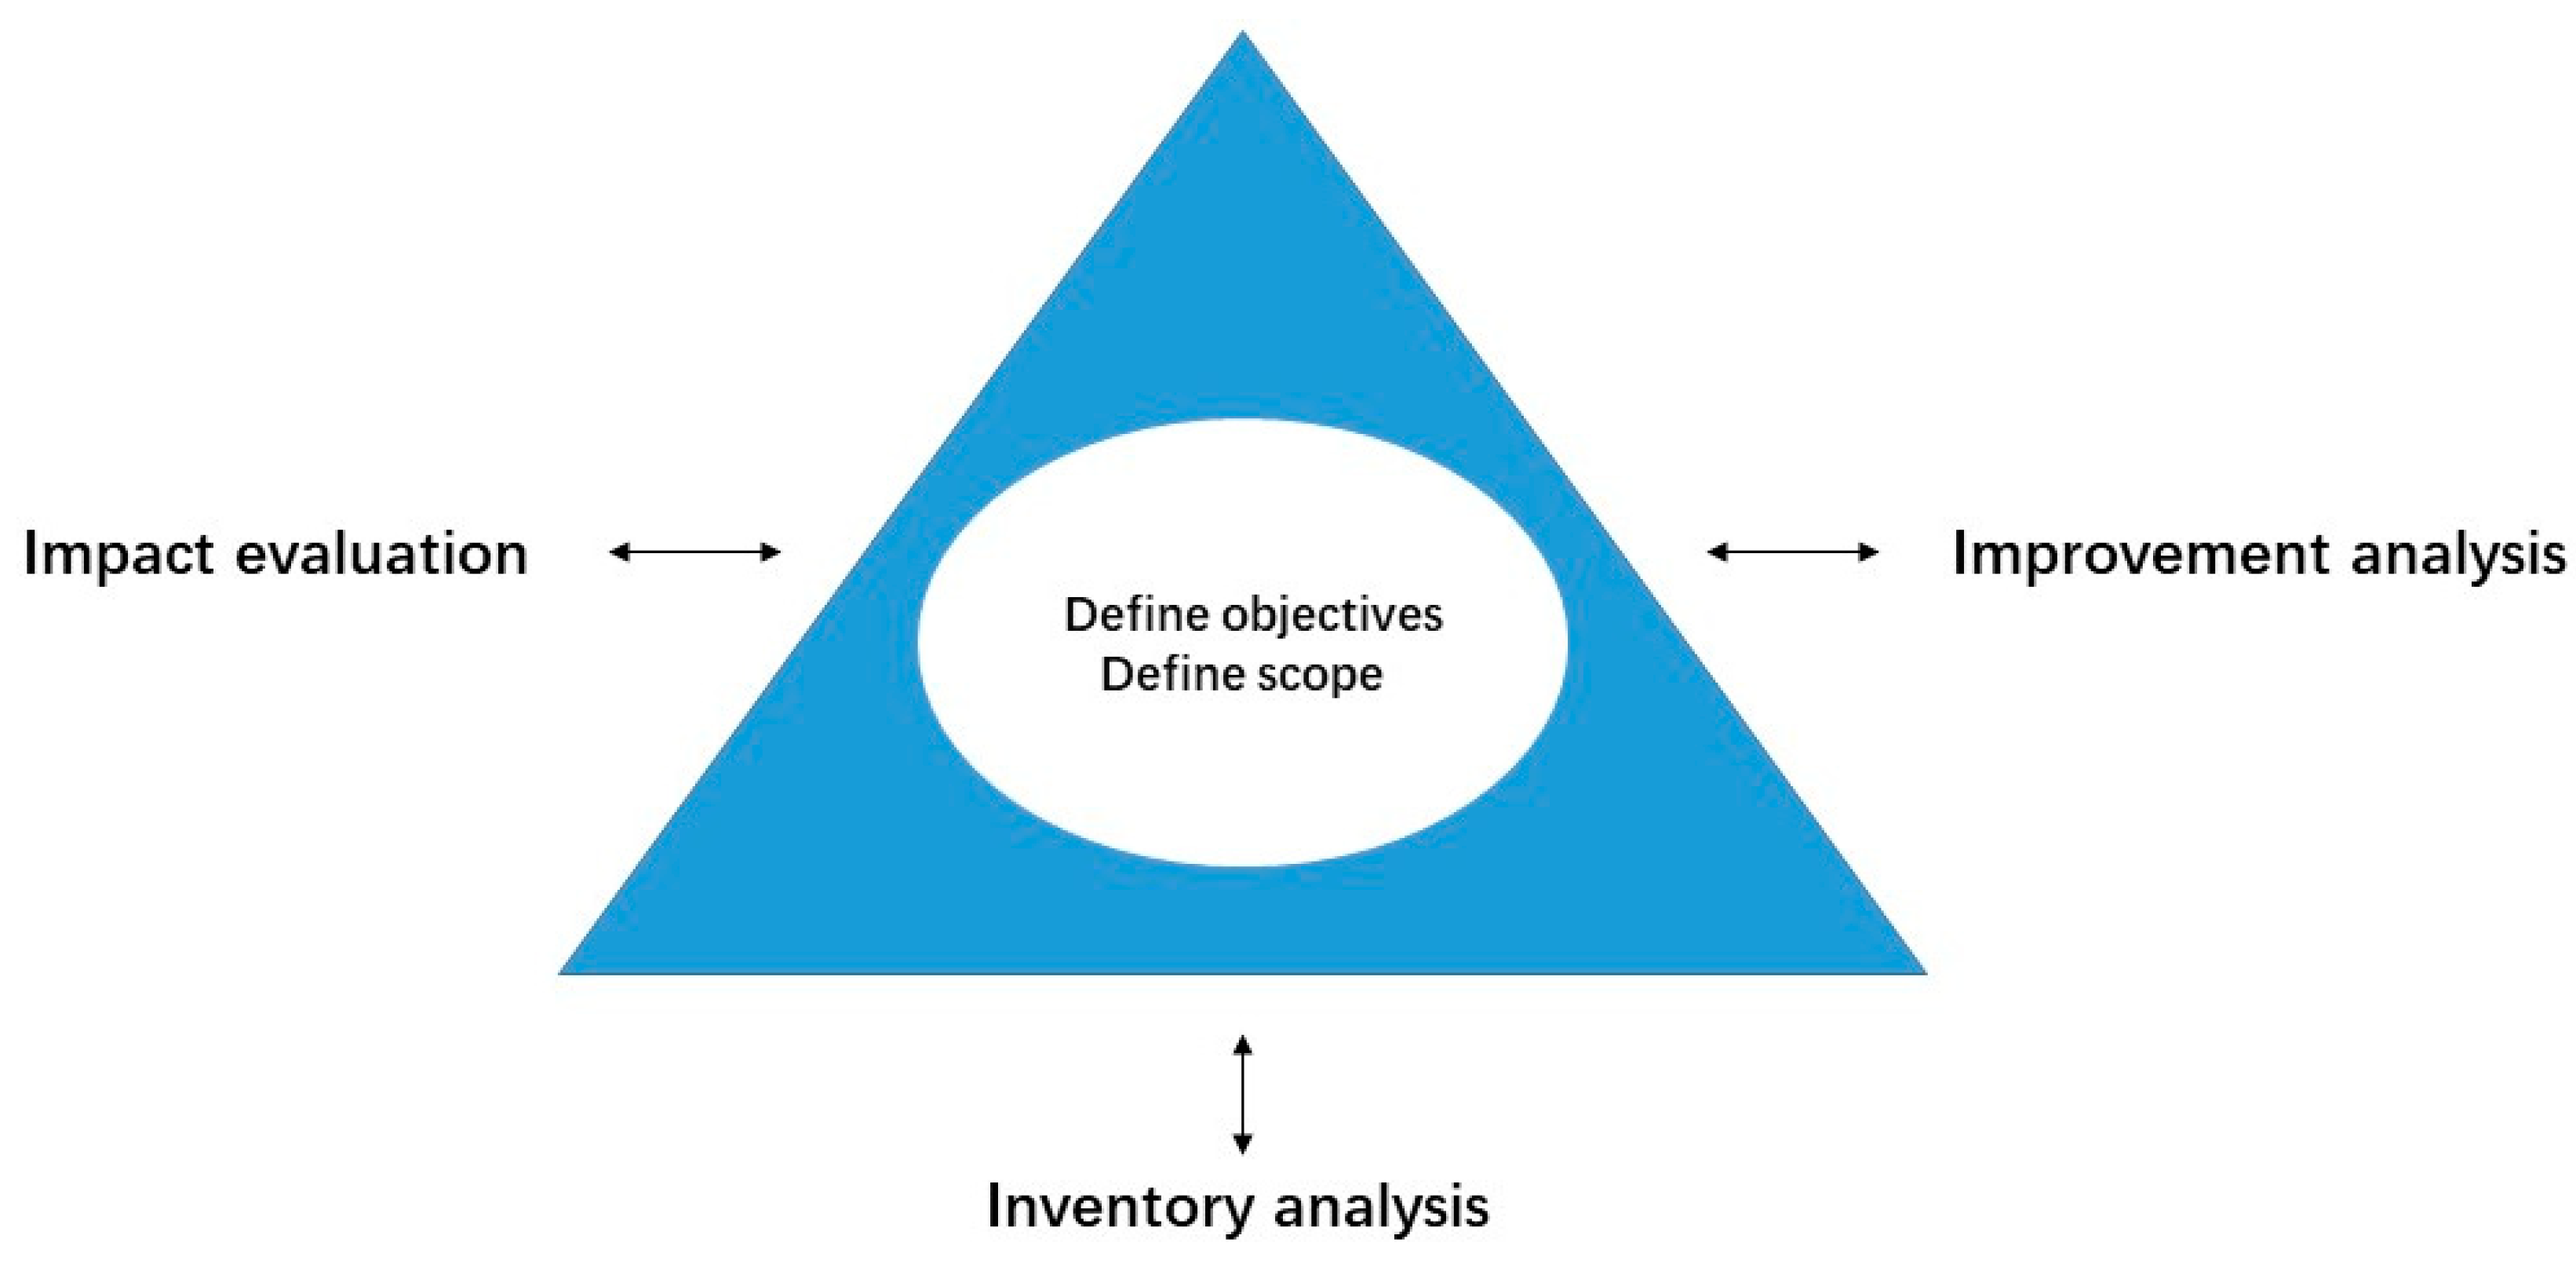
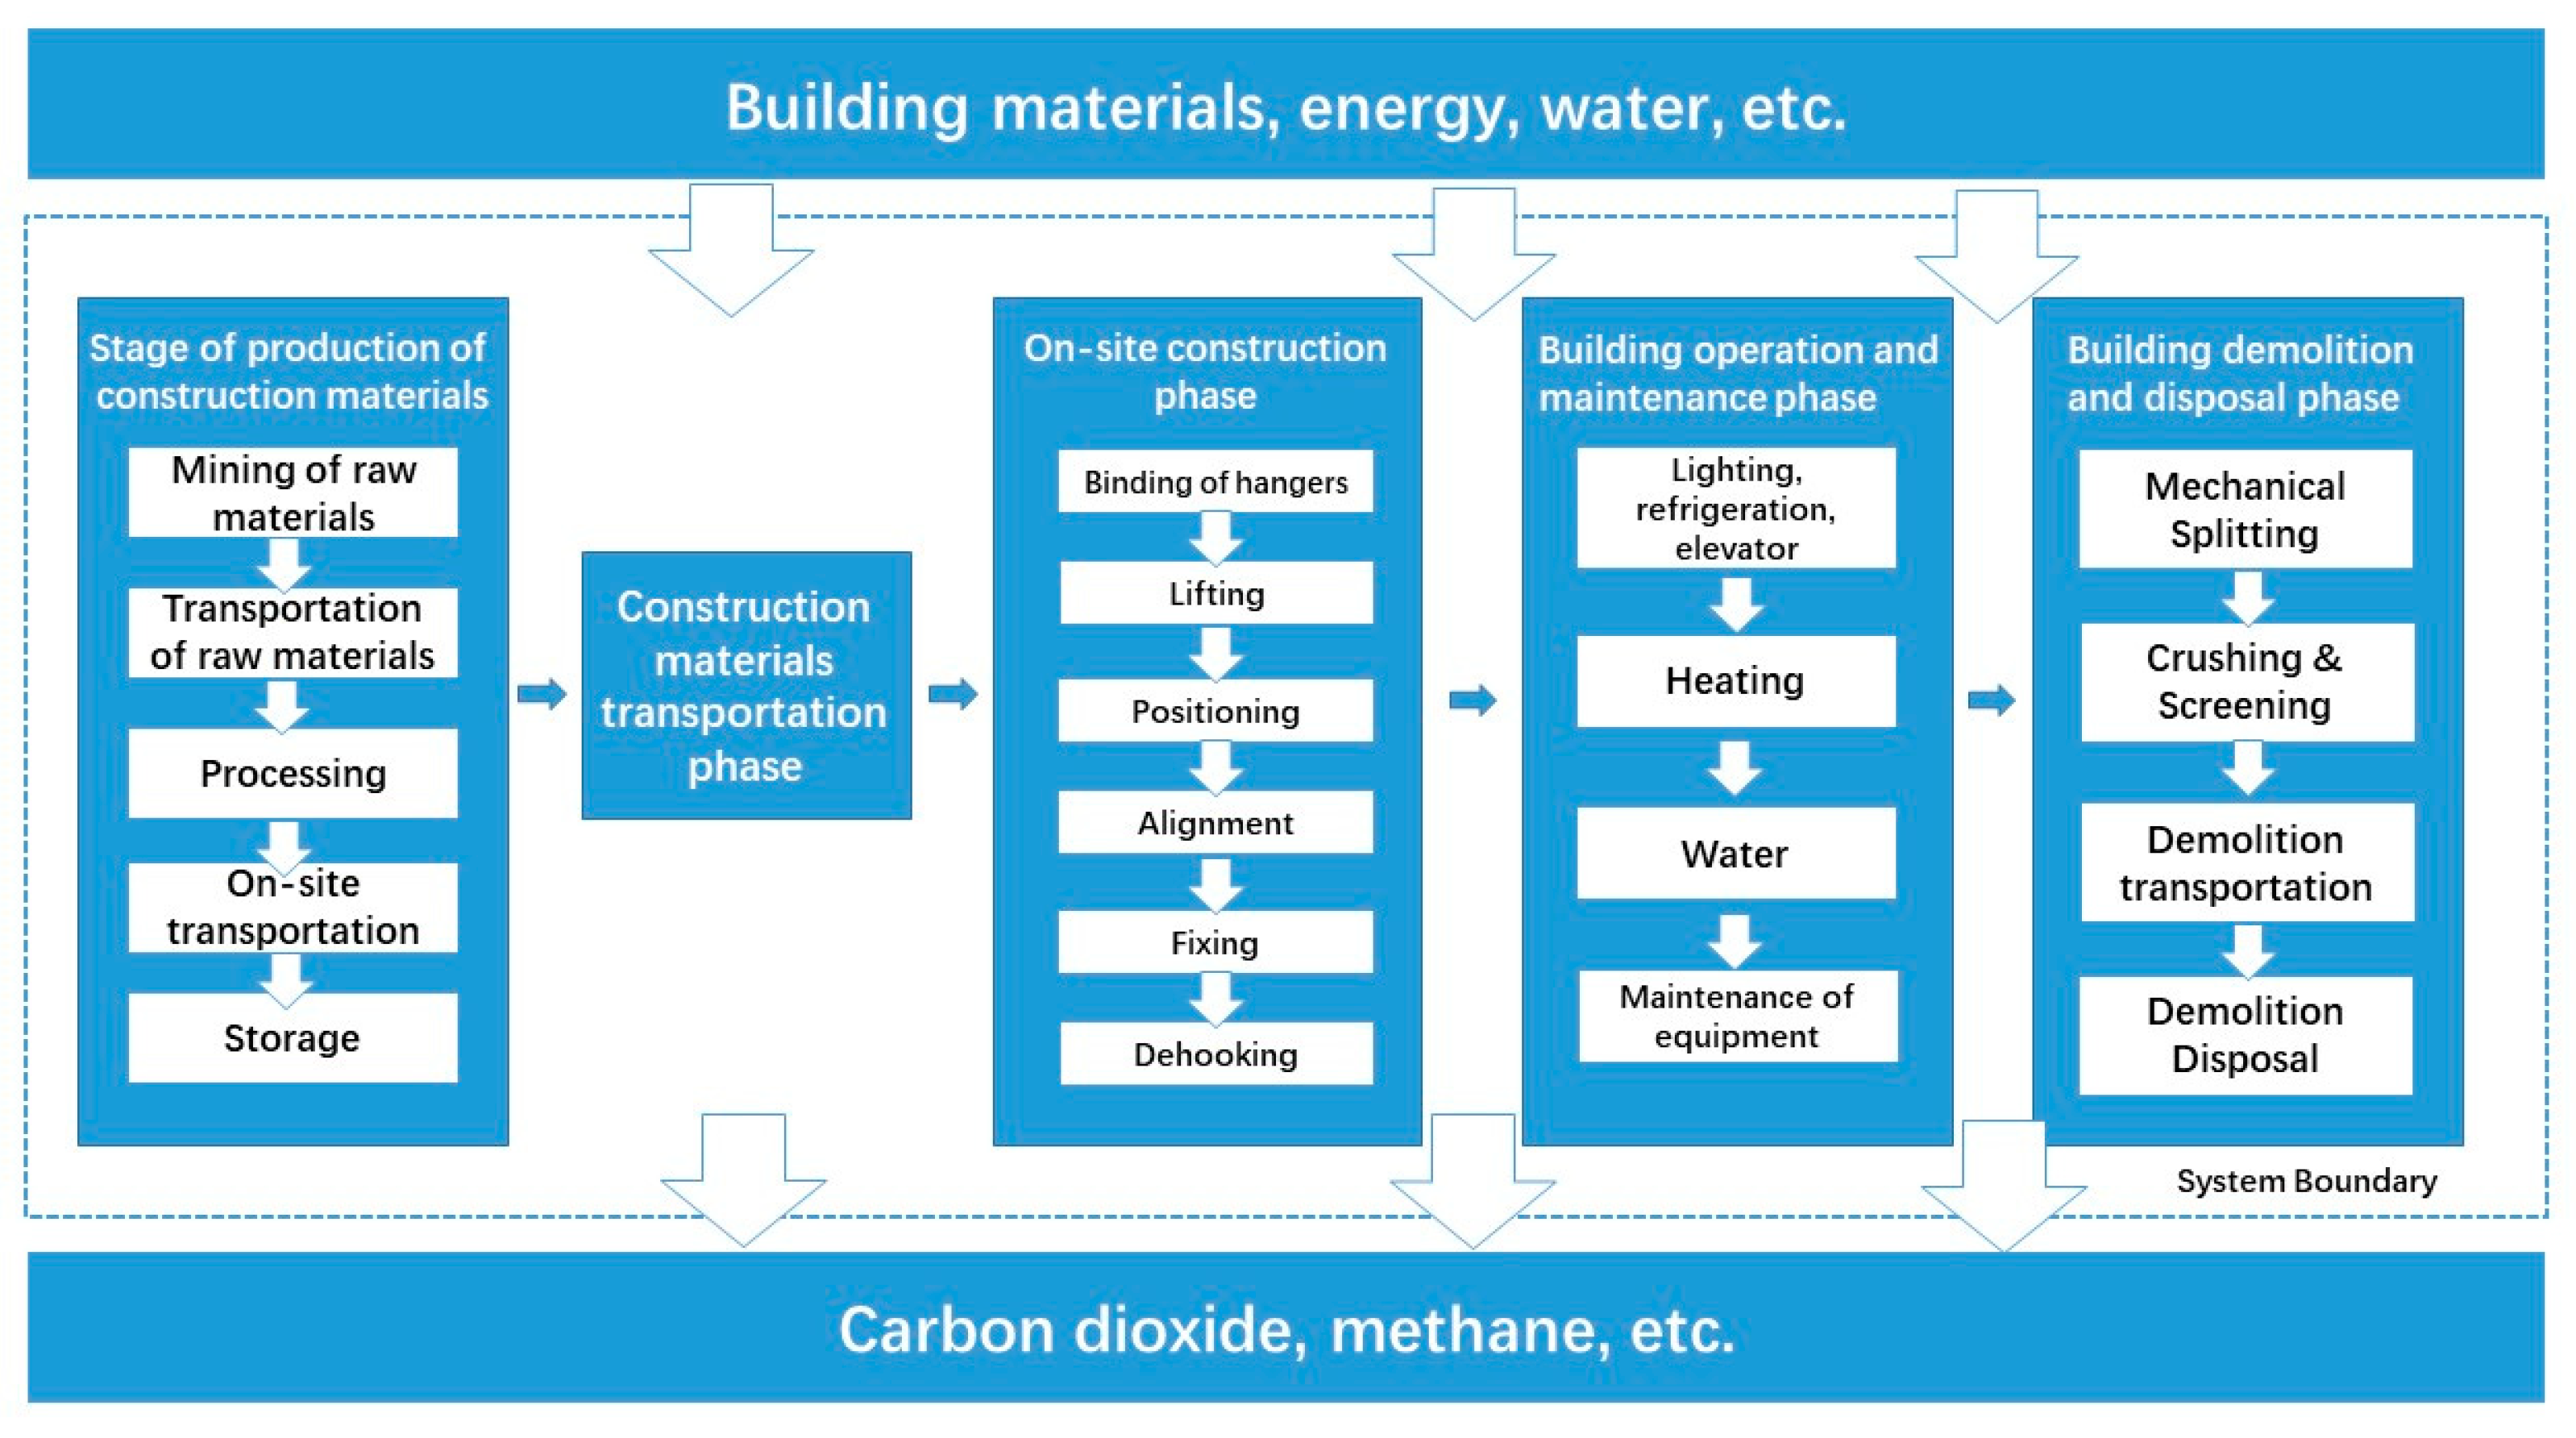
3.2.3. The Life Cycle Assessment

The life cycle assessment (LCA) was put forward by the Society of Environmental Toxicology and Chemistry (SETAC) and was originally derived from a software development methodology that emphasizes the development and management of software products throughout their life cycle, which consists of various phases designed to meet different needs and goals. LCA proposed by SETAC divides the whole life cycle into four organically linked components: definition of objectives and scope, inventory analysis, impact assessment and improvement assessment, whose interrelationships are shown in Figure 6 [68]. LCA is the theoretical model for most research methodologies and is an important tool for analyzing the carbon footprint of products, which can be applied to various industries and fields, such as energy, transportation and construction, to assess and reduce carbon emissions [69].
At present, the application of LCA in sustainable building design is very extensive, and the whole life cycle analysis model requires that the building come from nature to nature, the whole process of “from nothing (before the generation of the concept) to nothing (the demise of the building itself)”. That is to say, the whole life cycle not only focuses on a visible process of building existence from the initial overall project planning and program design to the subsequent construction, to the longtime of use and maintenance and the final demolition, but also is a comprehensive tracking of the whole life cycle of the building based on the in-depth qualitative research and detailed quantitative evaluation of each period [70]. Figure 7 [71] shows the scope of the whole life cycle of a building.
Luo et al. [72] proposed a building-related theory concerning LCA and low-carbon building. This paper has mentioned that low-carbon buildings are proposed with the rise of a low-carbon economy, which emphasizes low energy consumption and low emissions. Its objective is to minimize GHG emissions across all stages and levels of economic development. Compared with ordinary buildings, low-carbon buildings place a strong emphasis on resource and energy conservation, which strive to use local resources whenever possible to minimize transportation energy consumption. To calculate the carbon emissions of the building structure using LCA, it is necessary to divide the life cycle of the building structure and then analyze it in stages. The total carbon emission is the sum of the carbon emissions of each stage, and the formula accounting for the total carbon emission is shown in Equation (5).
C = C 1 + C 2 + C 3 + C 4 + C 5
where C refers to the total GHG emissions during the whole life cycle, C1 is the stage of production of construction materials, C2 is the construction materials transportation phase, C3 is the on-site construction phase, C4 is the building operation and maintenance phase and C5 is the building demolition and disposal phase.
Several studies have shown that LCA can provide a more comprehensive assessment of building carbon emissions. Cheng [73], based on LCA, comparatively analyzed the carbon emissions of cast-in-place buildings and assembled building superstructures, determined the amount of carbon savings at each stage, and proposed the carbon reduction measures for the whole life cycle of assembled buildings to be able to enhance the recognition of assembled buildings among the construction enterprises and, at the same time, provide ideals for the development of assembled buildings. Markel et al. [74] developed a simplified methodology for the environmental and economic assessment of residential building renovations with LCA. Bele’n et al. [75] proposed a methodology to compare the toxicity of different construction materials and highlight the need to consider toxicity criteria in the selection of materials during the design phase based on LCA. Vasilis et al. [76] introduced an innovative online tool capable of conducting dynamic life cycle analysis and global warming impact assessments by leveraging established LCA and LCC methodologies. This tool is designed for application in building renovation scenarios. Monahan et al. [77] investigated the carbon emission of a typical case of wooden structure in the UK based on LCA theory, and the results showed that, compared with the traditional cast-in-place construction method, assembly construction can reduce the carbon emission of a building by 34%.
LCA can determine the potential environmental impacts, especially the GHG emissions [78]. By adopting LCA, the carbon footprint can be assessed more comprehensively at all stages of a product’s life cycle. When it comes to sustainable energy, LCA is a highly effective way of determining the environmental impact and assessing the “greenness” of an energy source. It also makes it possible to compare the environmental performance of renewable and conventional energy sources [79]. However, there are several challenges and limitations to the LCA methodology in the accounting of carbon emissions from buildings. First, data collection and processing are key steps in life cycle evaluation, which requires a lot of time and effort, and in practice, it is difficult to obtain the initial data for each process. Second, the model-building and evaluation process requires specialized skills and knowledge; it is hard to take all the influencing factors into account, which affects the accuracy of the carbon assessment.

3.2.4. The Emission Factor Estimation

The basic concept of emission factor estimation, also known as the emission factor method, is to generate activity data and emission factors for each emission source according to the carbon inventory list. The product of the activity data and the emission factor is then used as the estimated carbon emission value of the emissions project [80]. The emission factor estimation is essentially an extension and improvement of the IPCC inventory method. Several organizations are currently involved in this process, including the IPCC and the US Environmental Protection Agency, and the Danish Center for Environment and Energy, along with other organizations, has reported emission factor values. One of the most used values is the IPCC’s preliminary estimation factor for greenhouse gases emitted during the construction processes. Using the emission factor estimation to calculate the carbon emissions of the life cycle of a building structure, the carbon emissions of each activity in each stage of the process can be obtained by multiplying the corresponding carbon emission factor based on the estimated volume of the building design, the cost list and other activity data, such as the volume of building materials input, construction work, mechanical equipment use plan, etc. [81]. The basic equation for the emission factor estimation is shown in Equation (6).
E m i s s i o n = i = 1 n A D i × E F i
where Emission is the GHG emissions (KgCO2eq), ADi refers to activity data (carbon source-specific utilization data), and EFi is the carbon emission factor (kgCO2eq/activity unit).
To study the carbon emission characteristics and pain points of assembled buildings, Han et al. [82] simulated and measured the carbon emissions of assembled buildings with different assembly rates through the carbon emission coefficient method not only obtained the carbon emission of the building in the physical stage, but also summarized the objective law that the carbon emission decreases with the increase of the assembly rate, which provides a theoretical basis for promoting the promotion and development of the assembly building. Lv et al. [83] provide a detailed introduction to the emission factor method for carbon emission audits of commercial buildings, propose a calculation method for carbon emissions using emission factors, and summarize four methods for obtaining emission factors, which are conducive to quantitative emission reduction studies of large-scale commercial buildings for energy conservation and emission reduction. Ju et al. [84] analyzed the emission factor estimation commonly used for carbon emissions in the operation phase of buildings, and pointed out that the emission factor estimation is simple and direct, and the accuracy of its results depends on the energy carbon emission factor and energy consumption. Based on collecting a large amount of information, Gao [85] takes the emission factor estimation as the main object, calculates the carbon footprint factor, establishes a carbon footprint evaluation system for the physical phase of building products in line with China’s national conditions, and analyzes the degree of influence of different structures on the carbon footprint of the building by collecting 17 buildings with different structures to conduct a quantitative study of the carbon footprint.
The emission factor has several advantages. It is considered to be simple, clear and easy to understand [86]. Furthermore, there are well-established accounting formulas and databases available for activity data and emission factors. Additionally, there are a vast number of application examples that can be referenced. As a result, the estimation of carbon emission factors is widely used in calculating the carbon emissions of buildings [87]. However, the method also suffers from the disadvantage of being less able to deal with changes in the emission system itself. It is widely used in cases where changes in socioeconomic sources of emissions are relatively stable, where natural sources of emissions are not very complex or where the internal complexity of the sources is ignored.

3.2.5. Comparative Analysis of Carbon Emission Accounting Methods

In summary, carbon emission accounting methods can be divided into the IPCC inventory method, input-output analysis, life cycle assessment and the carbon emission estimation. The emission factor estimation is the main method recommended by the IPCC [88] and is currently the most widely used method [2]. The four calculators are compared and analyzed, as shown in Table 3.
The accounting principles of the four carbon emission methods above are different, as are the application characteristics and scenarios of each method. Although the carbon emission research methods are different, the various methods can penetrate each other. Only one of the methods of studying carbon emissions in the field of construction is relatively rare; in many cases, it is through a combination of several methods to achieve a more ideal research result. For instance, the Stockholm Environment Institute [89] combined both the life cycle assessment and the input-output analysis to calculate the carbon footprint of UK schools. The desirability of the study lies in the fact that the input-output analysis is supplemented by process analysis to obtain detailed data, and the method has the systematic nature of a top-down approach without losing the subtlety of a bottom-up approach, which ultimately yields a more accurate and comprehensive study.
From the current studies, there have been numerous explorations of the policies related to carbon emissions in the construction industry, as well as research on the accounting standards and accounting methods for carbon emissions in the construction industry, which have also been relatively perfect and mature. After a review of existing carbon emission standards and carbon emission accounting methodologies in the construction industry, it was found that there are still the following areas that can be improved:
  • Although the literature on carbon emissions research has grown rapidly in recent years, most carbon accounting frameworks are based on the study and citation of ISO standards and IPCC research results prior to 2010, and there is a lack of literature that can deeply and systematically analyze the theory of carbon emission accounting, which results in a lack of innovation in the theory of carbon emission research.
  • In terms of carbon emission accounting methods, emission factor estimation combined with life cycle analysis is the most commonly used method nowadays, while the calculation boundary, data selection, and carbon emission coefficients of the process analysis method need to be further explored and improved.
  • At present, it is still difficult to apply physical input-output analysis to the accounting of real carbon emissions because of the difficulties in obtaining data, and the next step of the carbon emission research should be combined with the sector/industry, regional and national input-output data.
Based on the results of this study, subsequent studies will improve and revise existing methods for analyzing carbon emissions, and research into new accounting methods such as mixing analysis should continue.

4. Conclusions

The construction industry plays a key role in saving energy and reducing emissions. The urgency of the climate crisis requires a paradigm shift in construction towards low-carbon or even net-zero emissions. This paper reviews the current status of the carbon standards system and carbon emission accounting methods under the low-carbon building background. Meanwhile, we have specified the comparison between different accounting methods and the positive or negative factors regarding their use.
The main challenges of low-carbon building development are as follows: (1) lack of a set of carbon emission measurement standards that can be commonly used internationally, (2) lack of a deep and systematic study of the theory of carbon emission accountings and (3) difficulty in recognizing carbon emission boundaries and related data for existing carbon emission accounting methods. Therefore, possible future work will examine dealing with the above challenges. It is important to develop low-carbon buildings in terms of policy, technology, and evaluation methods [35] and conduct research on quantifying carbon emissions in this industry to accelerate the establishment of a standardized system for the accounting of carbon emissions and to achieve the goals of carbon peak and carbon neutrality [90]. Furthermore, it is of great significance to accurately measure carbon emissions to formulate corresponding emission reduction measures, which is a key link to realizing energy savings and emission reduction in the construction industry and is the basis for quantitative analysis of low-carbon buildings.

Author Contributions

Writing—original draft preparation, data curation, L.X.; visualization, J.M.; conceptualization, writing—review and editing, M.W. and B.H.; supervision, J.M. and B.H. All authors have read and agreed to the published version of the manuscript.

Funding

The authors are grateful for the support in this research given to the project from China Construction Science and Industry Corporation Ltd. (030720232201403036), the Venture and Innovation Support Program for Chongqing Overseas Returnees (cx2020104), Chongqing Technology Innovation and Application Development Project (CSTB2022TIAD-KPX0205).

Data Availability Statement

The data presented in this study are available on request from the corresponding author ([email protected]).

Conflicts of Interest

Authors Lun Xiong and Jin Mao were employed by the company China Construction Science and Industry Corporation Ltd. The remaining authors declare that the research was conducted in the absence of any commercial or financial relationships that could be construed as a potential conflict of interest.

References

  1. Denning, A.S. Combustion to concentration to warming: What do climate targets mean for emissions? Climate change and the global carbon cycle. Encycl. Anthr. 2018, 1, 443–452. [Google Scholar] [CrossRef]
  2. IPCC. 2006 IPCC Guidelines for National Greenhouse Gas Inventories; Cambridge University Press: Cambridge, UK, 2006. [Google Scholar]
  3. UNEP—UN Environment Programme. Building Materials and The Climate: Constructing A New Future. Available online: https://www.unep.org/resources/report/building-materials-and-climate-constructing-new-future (accessed on 12 September 2023).
  4. Zabalza Bribián, I.; Aranda Usón, A.; Scarpellini, S. Life cycle assessment in buildings: State-of-the-art and simplified lca methodology as a complement for building certification. Build. Environ. 2009, 44, 2510–2520. [Google Scholar] [CrossRef]
  5. UNEP S BCI. Buildings and Climate Change: A Summary for Decision-Makers. Available online: https://www.unep.org/SBCI/pdfs/SBCI-BCCSummary.pdf (accessed on 9 January 2013).
  6. The Central People’s Government of the People’s Republic of China. Strengthening Action on Climate Change-China’s National Autonomous Contribution. Available online: http://www.gov.cn/xinwen/2015-06/30/content_2887330.htm (accessed on 30 June 2015).
  7. Thormark, C. A low energy building in a life cycle—Its embodied energy, energy need for operation and recycling potential. Build. Environ. 2002, 37, 429–435. [Google Scholar] [CrossRef]
  8. Yin, S.C. Carbon Accounting for the Whole Life Cycle of Buildings; Harbin Institute of Technology: Harbin, China, 2012. (In Chinese) [Google Scholar]
  9. ISO 14064-1:2018; Greenhouse Gases—Part 1: Specification with Guidance at the Organization Level for Quantification and Reporting of Greenhouse Gas Emissions and Removals. ISO: Geneva, Switzerland, 2018.
  10. Chance, T. Towards sustainable residential communities; the Beddington zero energy development (BedZED) and beyond. Environ. Urban. 2009, 21, 527–544. [Google Scholar] [CrossRef]
  11. McManus, A.; Gaterell, M.R.; Coates, L.E. The potential of the code for sustainable homes to deliver genuine ‘sustainable energy’ in the uk social housing sector. Energy Policy 2010, 38, 2013–2019. [Google Scholar] [CrossRef]
  12. Lockwood, M. The political sustainability of climate policy: The case of the UK climate change act. Glob. Environ. Chang. 2013, 23, 1339–1348. [Google Scholar] [CrossRef]
  13. Clarke, J.; Littlewood, J.R.; Karani, G. Developing tools to enable the UK construction industry to adopt the active building concept for net zero carbon buildings. Buildings 2023, 13, 304. [Google Scholar] [CrossRef]
  14. Martiskainen, M.; Kivimaa, P. Creating innovative zero carbon homes in the United Kingdom—Intermediaries and champions in building projects. Environ. Innov. Soc. Transit. 2018, 26, 15–31. [Google Scholar] [CrossRef]
  15. Heat and Buildings Strategy in United Kindom. Available online: https://www.gov.uk/government/publications/heat-and-buildings-strategy (accessed on 19 October 2021).
  16. 2021 Global Status Report for Buildings and Construction. Available online: https://www.nypassivehouse.org/2021-global-status-report-for-buildings-and-construction/ (accessed on 20 October 2021).
  17. Planning for Federal Sustainability in the Next Decade in United States of America. Available online: https://www.govinfo.gov/content/pkg/FR-2015-03-25/pdf/2015-07016.pdf (accessed on 16 July 2015).
  18. Measurement Science Roadmap for Net-Zero Energy Buildings Workshop Summary Report. Available online: https://www.govinfo.gov/content/pkg/GOVPUB-C13-552f71735710557499a02208ec0277b8/pdf/GOVPUB-C13-552f71735710557499a02208ec0277b8.pdf (accessed on 17 March 2010).
  19. Sovacool, B.K.; Blyth, P.L. Energy and environmental attitudes in the green state of denmark: Implications for energy democracy, low carbon transitions, and energy literacy. Environ. Sci. Policy 2015, 54, 304–315. [Google Scholar] [CrossRef]
  20. Zhang, M.G.; Wu, Q.W. Heat pumps in Denmark: Current situation in providing frequency control ancillary services. J. Power Energy Syst. 2022, 8, 769–779. [Google Scholar] [CrossRef]
  21. Buildings’ Energy Needs. Calculation Guide; Danish Building Research Institute Publishing: Aarhus, Denmark, 2018. (In Danish) [Google Scholar]
  22. Kiviste, M.; Musakka, S.; Ruus, A.; Vinha, J. A review of non-residential building renovation and improvement of energy efficiency: Office buildings in Finland, Sweden, Norway, Denmark, and Germany. Energies 2023, 16, 4220. [Google Scholar] [CrossRef]
  23. Lee, C.M.; Erickson, P. How does local economic development in cities affect global GHG emissions? Sustain. Cities Soc. 2017, 35, 626–636. [Google Scholar] [CrossRef]
  24. EPBD. Implementation in Denmark Status in December. 2016. Available online: http://epbd-ca.eu/wp-content/uploads/2018/08/CA-EPBD-IV-Denmark-2018.pdf (accessed on 2 May 2019).
  25. Suzuki, M.; Oka, T.; Okada, K. The estimation of energy consumption and co2 emission due to housing construction in Japan. Energy Build. 1995, 22, 165–169. [Google Scholar] [CrossRef]
  26. Lu, X.C. Experience and inspiration of low-carbon technology innovation in Japan. Enterp. Manag. 2021, 6, 15–19. (In Chinese) [Google Scholar] [CrossRef]
  27. Li, H.; Zhang, S.; Okumiya, M.; Yoon, G. Japan zero energy building development status. Build. Sci. 2017, 33, 142–148. [Google Scholar] [CrossRef]
  28. Plan for Global Warming Countermeasures, Ministry of the Environment in Japan. Available online: https://www.env.go.jp/press/110060.html (accessed on 22 October 2021).
  29. Bühler, D.; Schuetze, T.; Junge, R. Towards development of a label for zero emission buildings: A tool to evaluate potential zero emission buildings. Sustainability 2015, 7, 5071. [Google Scholar] [CrossRef]
  30. Pervez, H.; Ali, Y.; Petrillo, A. A quantitative assessment of greenhouse gas (GHG) emissions from conventional and modular construction: A case of developing country. J. Clean. Prod. 2021, 294, 126210. [Google Scholar] [CrossRef]
  31. An, M.; Liu, M.F.; Wu, H.L. Study on the influence of prefabricated building demonstration city policy on carbon emission in the construction industry. Acta Sci. Circumstantiae 2023, 464–476. (In Chinese) [Google Scholar] [CrossRef]
  32. Huang, H.; Cheng, F.; Su, Y.; Yao, L.; Hu, J. Energy-saving potential analysis and countermeasures for carbon peaking in China. Chin. J. Eng. Sci. 2021, 23, 81–91. [Google Scholar] [CrossRef]
  33. IEA-EBC Annex 82-Energy Flexible Buildings Towards Resilient Low Carbon Energy Systems. Available online: https://annex82.iea-ebc.org (accessed on 17 May 2023).
  34. HM Treasury, Infrastructure UK, Department for Business. Infrastructure Carbon Review. Available online: https://assets.publishing.service.gov.uk/government/uploads/system/uploads/attachment_data/file/260710/infrastructure_carbon_review_251113.pdf (accessed on 25 May 2013).
  35. Li, Y.; Li, S.; Xia, S.; Li, B.; Zhang, X.; Wang, B.; Ye, T.; Zheng, W. A Review on the policy, technology and evaluation method of low-carbon buildings and communities. Energies 2023, 16, 1773. [Google Scholar] [CrossRef]
  36. Liu, Z.; Xu, Z.; Zhu, X.; Yin, L.; Yin, Z.; Li, X.; Zheng, W. Calculation of carbon emissions in wastewater treatment and its neutralization measures: A review. Sci. Total Environ. 2023, 912, 169356. [Google Scholar] [CrossRef]
  37. Liao, L.; Quan, L.; Yang, C.; Li, L. Knowledge Synthesis of intelligent decision techniques applications in the AECO Industry. Autom. Constr. 2022, 140, 104304. [Google Scholar] [CrossRef]
  38. Akram, R.; Thaheem, M.J.; Nasir, A.R.; Ali, T.H.; Khan, S. Exploring the role of building information modeling in construction safety through science mapping. Saf. Sci. 2019, 120, 456–470. [Google Scholar] [CrossRef]
  39. Van Eck, N.J.; Waltman, L. Software Survey: VOSviewer, a Computer program for bibliometric mapping. Scientometrics 2010, 84, 523–538. [Google Scholar] [CrossRef]
  40. Yevu, S.K.; Owusu, E.K.; Chan, A.P.C.; Sepasgozar, S.M.E.; Kamat, V.R. Digital twin-enabled prefabrication supply chain for smart construction and carbon emissions evaluation in building projects. J. Build. Eng. 2023, 78, 107598. [Google Scholar] [CrossRef]
  41. PAS 2050:2008; Specification for the Assessment of the Life Cycle Greenhouse Gas Emissions of Goods and Services. BSI: London, UK, 2008.
  42. Yi, L.; Li, C.P.; Wang, X.C. Research on the carbon management pattern of chinese enterprises—Based on the establishment of the national carbon market. Sci. Technol. Manag. Res. J. 2016, 11, 247–253. (In Chinese) [Google Scholar] [CrossRef]
  43. Whittaker, C.; McManus, M.C.; Hammond, G.P. Greenhouse gas reporting for biofuels: A comparison between the RED, RTFO and PAS 2050 Methodologies. Energy Policy 2011, 39, 5950–5960. [Google Scholar] [CrossRef]
  44. PAS 2050; How to Assess the Carbon Footprint of Goods and Services. BSI (British Standards Institute): London, UK, 2008.
  45. PAS 2050:2011; Specification for the Assessment of the Life Cycle Greenhouse Gas Emissions of Goods and Services. BSI (British Standards Institution): London, UK, 2015.
  46. Sinden, G. The contribution of PAS 2050 to the evolution of international greenhouse gas emission standards. Int. J. Life Cycle Assess. 2009, 14, 195–203. [Google Scholar] [CrossRef]
  47. Liang, Z.; Deng, H.; Xie, H.; Chen, B.; Sun, M.; Wang, Y. Rethinking the paper product carbon footprint accounting standard from a life-cycle perspective. J. Clean. Prod. 2023, 393, 136352. [Google Scholar] [CrossRef]
  48. Zhang, Y.; Xia, S.; Yang, F. Research on carbon emission measurement method based on carbon emission reduction of power grid supply chain. In Proceedings of the 2022 Asian Conference on Frontiers of Power and Energy (ACFPE), Chengdu, China, 21–23 October 2022; pp. 298–302. (In Chinese). [Google Scholar]
  49. Matthews, H.S.; Hendrickson, C.; Weber, C. The importance of carbon footprint estimation boundaries. Environ. Sci. Technol. 2008, 42, 5839–5842. [Google Scholar] [CrossRef]
  50. IPCC. Good Practice Guidance and Uncertainty Management in National Greenhouse Gas Inventories; IGES: Hayama, Japan, 2000; pp. 1–15. [Google Scholar]
  51. Gitarskiy, M.L. The refinement to the 2006 IPCC guidelines for national greenhouse gas inventories. Appl. Climatol. 2019, 2, 5–13. [Google Scholar] [CrossRef]
  52. Liang, Y.M.; Jin, S.P.; Zeng, Z.D.; Li, Y.; Jin, Y.H.; Long, Y. The research of greenhouse gas emission inventories for energy activities in china based on IPCC guidelines—From district level to national level. New Energy Sustain. Dev. 2016, 531–540. [Google Scholar] [CrossRef]
  53. Zhu, S.L.; Wang, W.T. Development of National Greenhouse Gas Emissions Inventories in the Context of International Climate Negotiations,” Advances in Climate Change Research. Adv. Clim. Chang. Res. 2013, 4, 60–68. [Google Scholar] [CrossRef]
  54. Kaur, R.; Patsavellas, J.; Haddad, Y.; Salonitis, K. The concept of carbon accounting in manufacturing systems and supply chains. Energies 2021, 17, 10. [Google Scholar] [CrossRef]
  55. Liu, Q.H. Estimation of Direct Nitrous Oxide Emissions from Paddy Fields and Vegetable Fields in China Based on IPCC Emission Factor Methodology; Nanjing Agricultural University: Nanjing, China, 2017. (In Chinese) [Google Scholar]
  56. Zhang, L.M.; Ren, J.; Lv, M.Y.; Wang, X.N.; Mao, H. Technical research on estimating forest vegetation carbon storage based on IPCC method. Shanxi Agric. Econ. 2019, 33, 77–79. (In Chinese) [Google Scholar] [CrossRef]
  57. Shu, Y.; Guo, J.Y.; Zhou, M.; Guan, L.J.; Zhang, J.Q. Research on carbon measurement parameters of Xing’an larch plantation forest in Daxing’anling based on IPCC method. Temp. For. Res. 2022, 5, 30–35. (In Chinese) [Google Scholar] [CrossRef]
  58. Zhang, L. Carbon Storage Value and Carbon Density Analysis of Arbor Forest in Genhe Forestry Bureau. Master’s Thesis, Inner Mongolia Agricultural University, Hohhot, China, 2021. (In Chinese). [Google Scholar]
  59. Sperow, M. Updated Potential Soil Carbon Sequestration Rates on U.S. Agricultural Land Based on the 2019 IPCC Guidelines. Soil Tillage Res. 2020, 204, 104719. [Google Scholar] [CrossRef]
  60. Leontief, W.W. The Structure of American Economy; IASP Publishing: New York, NY, USA, 1941; pp. 1919–1929. [Google Scholar]
  61. Leontief, W.W. Studies in Structure of the American Economy; Oxford University Press: London, UK, 1953; ISBN 9780195006186. [Google Scholar]
  62. Leontief, W.W. Structure of the American Economy, 1919–1939: An Empirical Application of Equilibrium Analysis, 2nd ed.; Oxford University Press: London, UK, 1951; ISBN 9780196 311265. [Google Scholar]
  63. Chen, S.; Zhang, R.; Li, P.; Li, A. How to improve the performance of china’s energy-transport-economy-environment system: An analysis based on new strategy parallel-series input-output data envelopment analysis models. Energy 2023, 281, 128235. [Google Scholar] [CrossRef]
  64. Dong, H.J.; Geng, Y. A study on the carbon footprint of Beijing residents’ consumption based on input-output analysis. Resour. Sci. 2012, 34, 494–501. (In Chinese) [Google Scholar]
  65. Zhang, Z.H.; Liu, R.J. Carbon emission accounting for the construction industry based on input-product analysis. J. Tsinghua Univ. Nat. Sci. Ed. 2013, 53, 53–57. [Google Scholar] [CrossRef]
  66. Yang, B.X.; Jiang, T.; Liu, X.Q. Carbon emission accounting of china’s paper industry based on the input-output analyses. China Paper 2023, 42, 120–125. (In Chinese) [Google Scholar] [CrossRef]
  67. Nässén, J.; Holmberg, J.; Wadeskog, A.; Nyman, M. Direct and indirect energy use and carbon emissions in the production phase of buildings: An input–output analysis. Energy 2007, 32, 1593–1602. [Google Scholar] [CrossRef]
  68. Chau, C.K.; Leung, T.M.; Ng, W.Y. A review on life cycle assessment, life cycle energy assessment and life cycle carbon emissions assessment on buildings. Appl. Energy 2015, 143, 395–431. [Google Scholar] [CrossRef]
  69. Zawartka, P.; Burchart-Korol, D.; Blaut, A. model of carbon footprint assessment for the life cycle of the system of wastewater collection, transport and treatment. Sci. Rep. 2020, 10, 5799. [Google Scholar] [CrossRef]
  70. Borjeson, L.; Hojer, M.; Dreborg, K.H.; Ekvall, T.; Finnveden, G. Scenario types and techniques: Towards a user’s guide. Futures 2006, 38, 723–739. [Google Scholar] [CrossRef]
  71. Zhang, Y.M.; Guo, X.J.; Zhou, J.J.; Bai, L.B. Research on life cycle carbon footprint evaluation of assembled buildings—Take a residential building in Shaanxi province as an example. Proj. Manag. Technol. 2023, 21, 167–173. (In Chinese) [Google Scholar]
  72. Luo, L.; Chen, Y. Carbon emission energy management analysis of LCA-based fabricated building construction. Sustain. Comput. Inform. Syst. 2020, 27, 100405. [Google Scholar] [CrossRef]
  73. Cheng, X.C. Research on analyzing carbon emission of building superstructure based on life cycle approach. China Build. Decor. Renov. 2023, 1, 90–93. (In Chinese) [Google Scholar] [CrossRef]
  74. Arbulu, M.; Oregi, X.; Etxepare, L. Environmental and economic optimization and prioritization tool-kit for residential building renovation strategies with life cycle approach. Build. Environ. 2023, 228, 109813. [Google Scholar] [CrossRef]
  75. Rey-Álvarez, B.; Silvestre, J.; García-Martínez, A.; Sánchez-Montañés, B. A comparative approach to evaluate the toxicity of building materials through life cycle assessment. Sci. Total Environ. 2023, 912, 168897. [Google Scholar] [CrossRef]
  76. Apostolopoulos, V.; Mamounakis, I.; Seitaridis, A.; Tagkoulis, N.; Kourkoumpas, D.-S.; Iliadis, P.; Angelakoglou, K.; Nikolopoulos, N. An integrated life cycle assessment and life cycle costing approach towards sustainable building renovation via a dynamic online tool. Appl. Energy 2023, 334, 120710. [Google Scholar] [CrossRef]
  77. Monahan, J.; Powell, J.C. An Embodied Carbon and Energy Analysis of Modern Methods of Construction in Housing: A Case Study Using a Lifecycle Assessment Framework. Energy Build. 2011, 43, 179–188. [Google Scholar] [CrossRef]
  78. Norouzi, M.; Haddad, A.N.; Jiménez, L.; Hoseinzadeh, S.; Boer, D. Carbon footprint of low-energy buildings in the United Kingdom: Effects of mitigating technological pathways and decarbonization strategies. Sci. Total Environ. 2023, 882, 163490. [Google Scholar] [CrossRef] [PubMed]
  79. Mondello, G.; Salomone, R. Assessing Green processes through life cycle assessment and other LCA-related methods. In Studies in Surface Science and Catalysis; Elsevier: Amsterdam, The Netherlands, 2020; pp. 159–185. ISBN 9780444643377. [Google Scholar]
  80. Wang, Z.; Zhou, K.; Fan, J.; Zhao, H. Progress of research on energy-related carbon emission accounting methods at the prefectural and county levels. Prog. Geogr. 2023, 42, 1406–1419. [Google Scholar] [CrossRef]
  81. Johnson, T.E.; Butcher, J.B.; Parker, A.; Weaver, C.P. Investigating the sensitivity of U.S. streamflow and water quality to climate change: U.S. epa global change research program’s 20 watersheds project. J. Water Resour. Plan. Manag. 2012, 138, 453–464. [Google Scholar] [CrossRef]
  82. Han, Y.H.; Yu, Z.; Chen, T. Measurement and analysis of carbon emission of assembled buildings with different assembly rates based on carbon emission factor method. Build. Struct. 2023, 53, 1337–1342. (In Chinese) [Google Scholar] [CrossRef]
  83. Lv, L.T.; Wang, L.; Li, J. A Study on Carbon Audit of Large Commercial Buildings. Environ. Eng. 2014, 10, 142–144. (In Chinese) [Google Scholar] [CrossRef]
  84. Ju, Y.; Chen, Y. Calculation of carbon emissions in the operation phase of buildings—A study of carbon emission factor method based on carbon emission factors. Sichuan Res. Build. Sci. 2015, 41, 175–179. (In Chinese) [Google Scholar] [CrossRef]
  85. Gao, Y.X. Carbon Footprint Evaluation Methodology and Empirical Research in the Physicalization Phase of Building Products; Tsinghua University: Beijing, China, 2012. (In Chinese) [Google Scholar]
  86. Zhang, Y.; Peng, T.; Yuan, C.; Ping, Y. Assessment of carbon emissions at the logistics and transportation stage of prefabricated buildings. Appl. Sci. 2023, 13, 552. [Google Scholar] [CrossRef]
  87. Yu, L.; Wang, Y.; Li, D. Calculating and analyzing carbon emission factors of prefabricated components. Sustainability 2023, 15, 8706. [Google Scholar] [CrossRef]
  88. Gao, H.; Wang, X.; Wu, K.; Zheng, Y.; Wang, Q.; Shi, W.; He, M. A review of building carbon emission accounting and prediction models. Buildings 2023, 13, 1617. [Google Scholar] [CrossRef]
  89. UK Schools Carbon Footprint Scoping Study for Sustainable Development Commission by Global Action Plan; SEI (Stockholm Environment Institute): Stockholm, Sweden, 2006.
  90. Cheng, S.; Zhou, X.; Zhou, H. Study on Carbon emission measurement in building materialization stage. Sustainability 2023, 15, 5717. [Google Scholar] [CrossRef]
Figure 1. Share of global carbon emissions from the construction sector.
Buildings 14 00777 g001
Figure 2. Carbon emission research ideals [9].
Buildings 14 00777 g002
Figure 3. The number of papers concerning building carbon emissions published from 2013 to 2023.
Buildings 14 00777 g003
Figure 4. Areas of interest in building carbon emission accounting research.
Buildings 14 00777 g004
Figure 5. The new parallel-series input-output data envelopment analysis model.
Buildings 14 00777 g005
Figure 6. Technical framework for life cycle assessment.
Buildings 14 00777 g006
Figure 7. Scope of the whole life cycle of a building.
Buildings 14 00777 g007
Table 1. Latest policies and core objectives in low-carbon buildings.
CountryPolice (Year)Core Objectives
United KingdomHeat and Buildings Strategy (2021)Reduce greenhouse gas emissions from public places by 75% from 2017 levels by 2037.
United States of AmericaNet-Zero Energy Commercial Building Initiative (2021)Net zero energy for all public buildings by 2050.
DenmarkEPBD Implementation in DenmarkResidential building: 20 kWh/(m2·a) Public building: 25 kWh/(m2·a)
JapanPlan for Global Warming Countermeasures (2021)All new buildings will consume zero energy on average by 2030.
China“14th Five-Year Plan” for Building Energy Efficiency and Green Building Development (2022)Promote the development of low-carbon buildings on a large scale and encourage the construction of zero-carbon buildings and near-zero-energy consumption buildings.
Table 2. Top 10 source journals ranked by total publication.
RankJournalPercentage (%)IF
1Journal of Cleaner Production14.71%11.1
2Construction and Building Materials9.15%7.4
3Renewable and Sustainable Energy Reviews6.65%15.9
4Science of the Total Environment6.37%9.8
5Energy6.02%8.9
6Energy Procedia5.66%\
7Applied Energy5.61%11.2
8Energy and Buildings4.62%6.7
9Energy Policy4.43%9.0
10Journal of Building Engineering3.52%6.4
Table 3. Comparison of carbon emission accounting methods.
Accounting MethodsField of
Application
AdvantagesDisadvantages
The IPCC inventory methodMicro and macro levels
  • Comprehensive and specific consideration of greenhouse gas
  • Calculation methods and emission principles are provided
  • Carbon footprinting only from a product production perspective
  • The practical example of carbon accounting basically only for agroforestry
  • Implicit carbon emissions cannot be calculated
The input-output analysisMacro level
  • For multi-sectoral carbon one-time estimation
  • Implied carbon emissions can be estimated
  • Emissions from a single product cannot be calculated
  • Data are averaged and prone to error
The life cycle assessmentMicro level
  • A comprehensive and systematic assessment of the product during the life cycle
  • Direct and indirect carbon emissions can be analyzed
  • Costly and time-consuming
  • The method for determining the carbon footprint accounting boundary is not harmonized
The emission factor estimationMicro and macro levels
  • High level of promotion and recognition
  • can be used for the whole building life cycle
  • Simple calculations
  • Emission factors are easily accessible
  • With high requirements for geographical and temporal
  • Carbon emission factors vary more large
Disclaimer/Publisher’s Note: The statements, opinions and data contained in all publications are solely those of the individual author(s) and contributor(s) and not of MDPI and/or the editor(s). MDPI and/or the editor(s) disclaim responsibility for any injury to people or property resulting from any ideas, methods, instructions or products referred to in the content.

