Abstract
The surge in demand for upscale apartments in South Korea in the 2000s necessitates the enhanced quality of apartment complexes. Achieving this improvement involves creating diverse spaces within complexes and categorizing them based on spatial arrangement. However, obtaining actual as-built drawings poses challenges, and manual analysis lacks objectivity. The study utilized map API for data collection and Roboflow API for labeling, employing a YOLOv8n-cls model for categorization. Performance evaluation included accuracy, precision, recall, and F1-score values using a confusion matrix. Eigen-CAM was utilized for an analysis that revealed the specific features influencing predictions. The classification model demonstrated relatively high accuracy. Furthermore, the prediction performance was high for lattice and square apartment complexes but low for distributed apartment complexes. These results indicate that a classification model is insufficient for assessing complex characteristics such as the scattered arrangement of building layouts and outdoor spaces, as seen in distributed apartment complexes. We determined that an in-depth analysis of the architectural plans for distributed apartment complexes is necessary to clearly identify their types, and the types must be categorized into several classes, including the distributed type.
1. Introduction
In response to the escalating housing shortage driven by population growth and increased density in South Korea’s metropolitan areas during the 1960s, the concept of apartments was introduced, evolving to become a quintessential housing type in the country. Over the years, multi-unit housing complexes in South Korea, particularly since the late 1990s, have witnessed a substantial surge, making them the preferred residential choice among Koreans. Notably, starting from the 2000s, a discernible correlation has emerged between the volume of supply and the brand value in housing transactions. Consequently, construction firms have directed their focus towards specialized design strategies, integrating them into apartment complex blueprints, with a concerted emphasis on both the quantity and quality of supply. Initially, the design of apartments prioritized the quantitative aspect of supply, featuring flat-type buildings parallelly arranged within complexes, primarily designed for parking purposes [1]. However, as the new millennium unfolded, there was a notable augmentation seen in outdoor spaces such as squares and playgrounds, reflecting a commitment to enhancing residents’ quality of life. Deliberate differentiations in space utilization between buildings emerged, incorporating spaces between structures or arranging outdoor areas around expansive squares. Furthermore, conventional above-ground parking gradually transformed into underground parking. Fueled by evolving social awareness and diverse lifestyle trends, outdoor spaces within apartment complexes in South Korea rapidly adapted to residents’ demands, prompting a greater consideration for the arrangement of buildings and open spaces in the complex [2].
This marked the beginning of a transformation in the composition of apartment complexes, triggered by an increase in the residents’ utilization of external spaces. It is presumed that various specialized designs, aimed at enhancing the accessibility and usability of external spaces, influenced the types of apartment complexes. Therefore, to understand the impact of specialized designs and other factors on the transformation process over different periods, there is a need to analyze the chronological changes and the evolving components of apartment complex types in Korea.
Through research, a classification system for South Korean apartments based on the spatial arrangement of complexes has been identified. Three primary types have been delineated: the lattice type, characterized by flat buildings parallelly arranged, with minimal outdoor spaces; the distributed type, dispersing outdoor spaces throughout the complex based on building layout and planning characteristics; and the center type, distinguished by a central square as the focal point with numerous surrounding outdoor spaces [1,3].
However, prior studies employing formal analysis for the classification of apartment complexes have predominantly focused on a limited sample size, facing challenges in data collection, such as acquiring completed drawings from architect offices. This poses a significant issue of subjectivity, as planning characteristics are often analyzed through the lens of the researcher.
This study, as shown in Figure 1, seeks to overcome these limitations by employing deep learning for the systematic classification of apartment complexes. Utilizing the entire database of South Korean apartment complexes [4] as a foundational dataset, we inputted the addresses of each complex into Kakao Maps. This process facilitates the extraction of maps and acquisition of floor plans, enabling the identification of complex boundaries, building arrangements, and outdoor spaces. Subsequently, through image classification, the results are incorporated into the database to comprehensively analyze the diverse types of apartment complexes in South Korea.
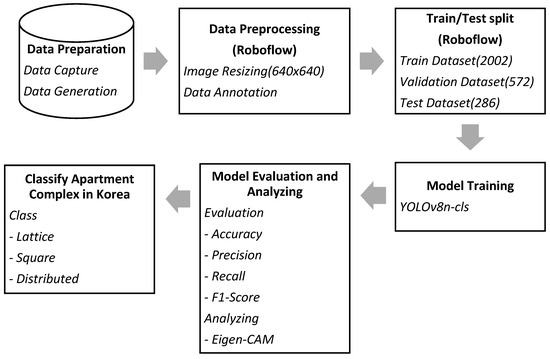
Figure 1.
Workflow of the proposed methodology.
2. Related Works
2.1. Apartment Complex
2.1.1. History of the Apartment Complex
A comprehensive examination of previous studies reveals a temporal division of apartment planning into first and second five-year periods within each decade [5,6]. The evolution of apartments in South Korea, as shown in Figure 2, corresponds intricately to the unique circumstances characterizing each era. Commencing in the early 1970s, construction was initiated on the pioneering high-rise apartment complex, Yeouido Sibeom Apartment (1971), distinguished as an iconic pillar-style apartment. Subsequently, in the late 1970s, the establishment of apartment districts (1976), mandating the development of Gangnam and other apartment complexes, played a pivotal role in shaping South Korea into what is colloquially referred to as the ‘Republic of Apartments’. The early 1980s witnessed the enactment of the Housing Site Development Promotion Act (1980) and the emergence of Mokdong New Town (1983), facilitating the acquisition of expansive land at economical prices by project sponsors. These sponsors, in turn, orchestrated the planning and development of urban living spaces, encompassing city-wide urban planning. The latter half of the 1980s, marked by an economic boom characterized by a low dollar value, low wages, and low inflation, prompted the government’s initiative to construct 2 million homes as a measure to stabilize housing prices. Simultaneously, policies fostering land supply expansion, exemplified by the development of five new cities in the metropolitan area (1986–1989), catalyzed a substantial surge in housing construction, intensifying competition in the real estate market and enhancing private sector construction capabilities [7,8]. The early 1990s saw vibrant development in the initial phase of new cities within the metropolitan area, aligning with the new city policy implemented in 1988. In the latter half of the 1990s, escalating land prices and regulatory policies on housing prices fueled a rise in the density and height of residential complexes. This period also witnessed the formulation of plans for satellite cities and new city construction, coupled with the relaxation of criteria for new land allocation and redevelopment. Consequently, there was a notable upswing in urban redevelopment projects within the city. In the 1990s, building arrangements within complexes were characterized by simplicity, and after the self-regulation of housing prices in 1999, private construction enterprises embarked on strategies for upscale development. This marked the onset of diverse designs for apartment facades, outdoor spaces, and other architectural elements. The early 2000s ushered in the era of apartment branding, with construction companies actively engaging in marketing endeavors. Notably, tower-type apartments made their debut in 2002 [9,10]. In the latter half of the 2000s, to counteract the soaring real estate market, the government introduced a price ceiling system for pre-sale housing (2007), applying the brakes on reconstruction and redevelopment projects. Since the 2010s, with more than half of South Korea’s population residing in apartments, surpassing a nationwide housing supply rate of 100%, apartments have become the predominant residential type. Consequently, the South Korean government initiated measures such as the Housing Market Stability Plan (2017) and the Urban Regeneration New Deal (2017) to rejuvenate declining city centers, address aging residential areas, and reduce population density in urban areas [11].
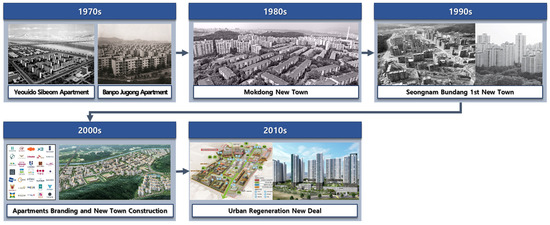
Figure 2.
History of the apartment complex.
2.1.2. Classification of Apartment Complex Sites
Examining the historical trajectory of apartments in South Korea reveals a noteworthy shift in focus. Until the latter half of the 1980s, the emphasis was primarily on the quantitative supply of apartments. Conversely, from the second half of the 1990s, there has been a notable pivot towards the qualitative supply of apartments. As living standards improve, there is a growing demand for luxury apartments and distinctive designs. This evolution has prompted construction companies to refine their specialization strategies in apartment design, evident in the meticulous planning and design of apartment complexes. Numerous specialized strategies, such as building type, layout, and tailored designs for outdoor spaces, have been explored [2]. The classification of apartment complexes in South Korea is rooted in the arrangement of outdoor spaces and the type and layout of buildings. It has been discerned that outdoor spaces are influenced by building type and layout rather than the topography of the land [3]. When evaluated across different periods, these complexes can be categorized into three types: lattice apartment complexes from the 1970s to the early 2000s, with flat-type buildings parallelly arranged; square apartment complexes from the 2000s to the 2010s, featuring expansive open spaces at the center; and distributed apartment complexes from 2010 to the present, with small, dispersed outdoor spaces instead of unified large-scale spaces [1].
2.2. Analysis of Trends in Architecture Using Deep Learning
2.2.1. Computer Vision
Within the realm of architecture, deep learning techniques, particularly in the domain of computer vision applications, have garnered prominence. Image recognition and classification, alongside object detection techniques, stand out as primary tools for comprehending and analyzing architectural drawings, aligning with the intrinsic nature of the architecture field. Image recognition classification technology, anchored in convolutional neural network (CNN) architecture, exhibits remarkable proficiency in image recognition. Noteworthy models such as VGG, GoogleNet, and Resnet, pretrained on datasets like ImageNet and COCO, demonstrate efficacy in extracting pivotal features from images. These models can be easily retrained with new data, facilitating the rapid and efficient development of high-performance image recognition models. Object detection technology, essential for identifying the location and type of objects in a given image, features notable algorithms such as Faster R-CNN, YOLO, and SSD. Among these, YOLO serves as an integrated approach combining object localization and classification, enabling real-time applications such as CCTV with swift processing speeds [12].
2.2.2. Urban- and Architecture-Related Research Using Deep Learning
Research in the architecture field, particularly in urban and architectural engineering, reveals an active trend in utilizing deep learning. Through an analysis of previous studies, it is possible to see that there has been a significant surge in research applying artificial intelligence, machine learning (ML), and deep learning in the domain of architectural structural engineering, with over 4000 studies conducted from 2010 to 2020. The primary algorithms employed were artificial neural networks, genetic algorithms, genetic programming (GP), and support vector machines. Although there are no explicit criteria for an optimal dataset size, the most prevalent approach involved dataset partitioning for model training. Performance metrics such as the correlation coefficient (R), mean squared error, and root mean squared error were predominantly utilized [13]. Additionally, a study proposing a deep learning framework for seismic performance-based design of buildings was analyzed, highlighting the efficient identification of structural systems and the detection of seismic risks using ML techniques during both the initial and detailed design phases [14].
To comprehend architectural spaces effectively, an analysis of visual representations such as floor plans is imperative. CNNs demonstrate exceptional proficiency in scrutinizing two-dimensional images, rendering them particularly well suited for investigations into architectural spaces. This includes the examination of floor plan images or visibility graphs, transforming them into two- to three-dimensional grid points. A notable contribution in this realm is the ArchiGAN research study, which employs deep learning techniques specifically tailored to apartment floor plans. In this study, a deep learning model trained on apartment plans in the Boston area sequentially generated building layouts, unit configurations, living space arrangements, and interior furniture placements based on site conditions. ArchiGAN adopts a structure founded on generative adversarial networks (GAN). The methodology employs two neural networks: (1) a discriminator distinguishing between authentic and synthetic residential space arrangements within a given plane and (2) a generator fabricating virtual planes capable of deceiving the discriminator. Through mutually beneficial training, these networks unveil latent patterns in the data [12]. Additionally, another study introduces an algorithm utilizing deep learning to identify planes and interpret diverse architectural drawings as graph diagrams. This algorithm autonomously extracts spatial relationship information from the graph representation of the plane data. The generated dataset serves as a foundation for developing a recommendation model for architectural space relationships during the planning phase of construction projects [11].
Similarly, in urban and architectural engineering, diverse applications of deep learning have emerged, providing effective solutions from early design stages to detailed design and performance evaluation.
3. Materials and Methods
3.1. Apartment Complex Dataset
3.1.1. Scope of Apartment Complexes
Data provided by the Korea Apartment Management Information System (K-apt) were used for the database of all apartments. This system contains detailed information data on apartment complexes with 100 or more units, which are required by the Multi-Family Housing Management Act of South Korea to disclose apartment management fees. The data include the address, year of completion, number of households, number of buildings, and number of floors for apartment complexes. Moreover, it features a total of approximately 18,000 sets of data on residential complexes. In this study, a total of approximately 18,000 residential complexes were filtered to identify those that specifically corresponded to apartment buildings. Furthermore, according to the legal criteria [6] in South Korea, the installation of community centers, playgrounds, daycare centers, and residential facilities is mandatory for apartment complexes with 300 or more units. The total number of apartments with 300 or more units was 13,264. The number of units was divided into four categories based on the range of units: 300–499 units (4987 apartments), 500–999 units (4887 apartments), 1000–1999 units (2155 apartments), and 2000 or more units (324 apartments).
3.1.2. Types of Apartment Complexes
The classification of apartment complexes into lattice, square, and distributed types, as per prior research, serves as a foundational element for image analysis in this study. The lattice type, as shown in Figure 3a, features flat buildings arranged in a parallel grid-like pattern, emphasizing vehicle-centric circulation efficiency with predominantly parking-centric outdoor spaces. By contrast, the square type, as shown in Figure 3b, adopts a layout centered around a large square, with smaller outdoor spaces and walkways extending from it. The distributed type, as shown in Figure 3c, entails scattered outdoor spaces interconnected by complex pathways, fostering the creation of diverse outdoor spaces. These classifications form the basis for subsequent image analysis in this study.
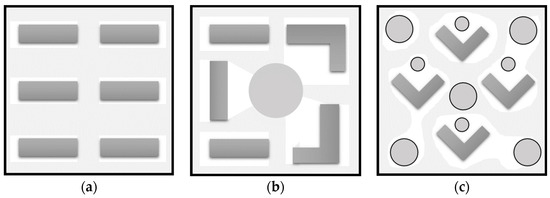
Figure 3.
Apartment complex types in South Korea: (a) an example of the lattice apartment complex; (b) an example of the square apartment complex; (c) an example of the distributed apartment complex.
3.2. Image Dataset
3.2.1. Image Acquisition
For the acquisition of apartment layouts, Kakao Maps [15], a map API utilized in South Korea, played a crucial role. This service, akin to Google Maps [16], facilitated the retrieval of diverse information, including boundaries, building layouts, recreational areas such as playgrounds and badminton courts, and waterfront zones, as well as infrastructure details like roadways, sidewalks, and parking lots. Leveraging data from K-apt, the addresses of each complex were input into Kakao Maps, enabling the capture and storage of images for the respective complexes, as shown in Figure 4a. This process allowed us to procure detailed maps for each apartment complex. To streamline the acquired maps and eliminate extraneous information, specifically non-apartment complex elements, the maps underwent refinement through the precise cropping of apartment complex boundaries, as shown in Figure 4b, provided on the map. This meticulous process ensured the extraction of the layout for each apartment complex.
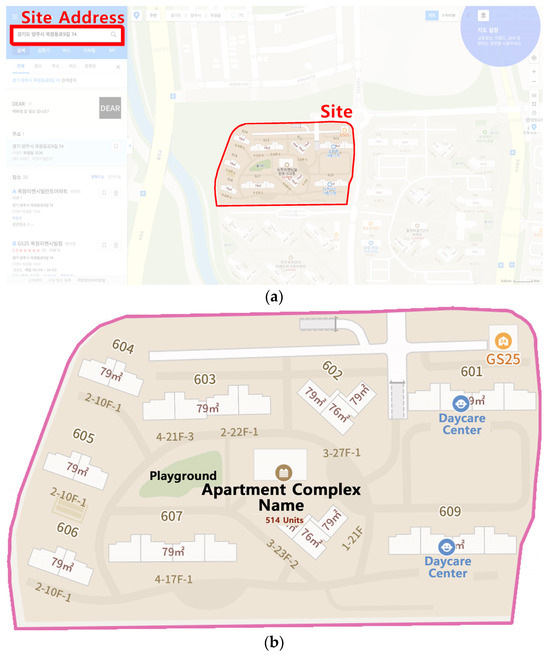
Figure 4.
Apartment layout dataset using maps: (a) An example of address input and output in the map API; (b) an example of apartment complex with a cropped result based on the output image.
3.2.2. Image Processing
While conducting the mapping service, it was noted that the boundaries corresponding to each address were represented as pink areas based on the cadastral map provided by the government, despite some discrepancies with the actual land boundaries. The dataset underwent refinement by excluding complexes where the address-based areas lacked clear boundaries. A total of 13,064 apartment complex layouts were acquired, and subsequent image labeling was performed to categorize the types of apartment complexes into lattice, square, and distributed types, as identified in prior research. For the implementation of image classification utilizing the YOLOv8 network model, the original photos underwent annotation, as shown in Figure 5, through the Roboflow API [17]. In alignment with the characteristics of the apartment complex types proposed in previous studies, three classes were defined, encompassing a total of 2860 complexes: lattice, square, and distributed apartment complexes. To meet the requirements of pre-trained models, the collected images were resized to 640 × 640 and further expanded to enhance their size and mitigate overfitting. The training set/validation set/testing set ratio was maintained at 7:2:1, respectively. The dataset was compiled through the aforementioned image preprocessing procedures.
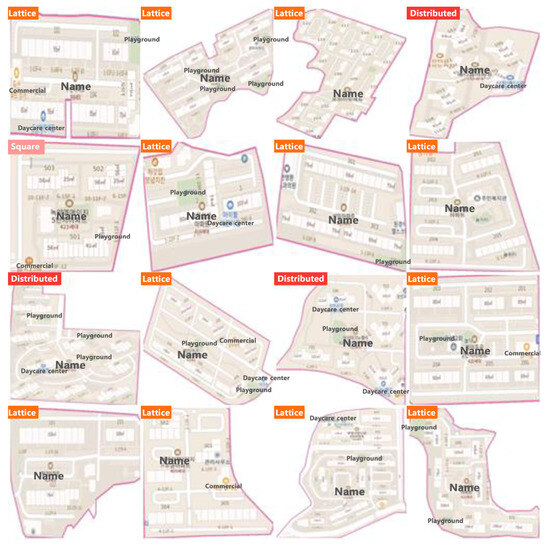
Figure 5.
Examples of data labeling according to the apartment complex type.
3.3. Research Methods
3.3.1. Image Classifier
Image classification involves performing image classification using pre-trained models based on various image datasets such as ImageNet [18], COCO dataset [19], and CIFAR [20]. In contrast to datasets such as COCO and CIFAR, ImageNet stands out for its characteristics of comprising over 1000 classes and containing more than 1,000,000 images, making it a large-scale and diverse dataset. The advantage lies in its ability to train models with a large number of classes and images, enhancing generalization performance [18]. Pre-trained models based on this dataset include ResNet [21], VGGNet [22], EfficientNet [23], GoogleNet [24], MobileNet [25], and YOLO [26], each designed with unique features and purposes. Notably, ResNet and VGGNet have relatively larger model sizes, i.e., a higher number of parameters, and are not lightweight models, resulting in comparatively slower inference speeds. Other models, on the contrary, are relatively lightweight with fewer parameters, but EfficientNet and GoogleNet may require high computational costs, and their complex structures can be challenging to comprehend. MobileNet is advantageous for mobile and edge devices but may have limitations for more complex tasks. By contrast, YOLO, functioning as a one-stage detector, prioritizes real-time processing for object detection and classification, enabling faster inference with lower computational requirements. Its flexibility for training on diverse datasets and ease of customization make YOLO an attractive choice.
In this study, we aimed to compare categories based on a pre-trained model using the ImageNet dataset, which enhances generalization performance. Given the significant number of images for training in this study, a model with relatively faster inference speed was required for analysis. Hence, we chose the YOLO model, which allows for the analysis of objects of various sizes with fewer computations compared to those of other established classifiers.
3.3.2. You Only Look Once (YOLO) Model
YOLO typically comprises a fundamental structure consisting of a Head and Backbone, components commonly inherent in object detectors. The Head module utilizes extracted results from the Backbone to ascertain the position of an object, with the primary advantage of the Backbone lying in its capacity to extract the Feature Map of an image for classification [27]. The original YOLO was initially crafted for object detection, identifying objects within an image and determining their locations. By contrast, YOLOv8 has evolved to yield superior outcomes by refining the structure and architecture of its predecessor. Engineered to be fast, accurate, and user-friendly, YOLOv8 is well suited for a diverse array of tasks encompassing object detection, image segmentation, and classification.
The standout feature of YOLOv8 is its extensibility, designed as a framework that accommodates all the preceding versions of YOLO. This design facilitates seamless transitions between different versions, enabling the comparison of their respective performances. The YOLOv8 model incorporates a novel Backbone network, an innovative anchor-free detecting Head, and a new loss function. Notably, YOLOv8 exhibits high efficiency and can be deployed on various hardware platforms, spanning CPUs to GPUs. Its performance surpasses that of earlier versions, demonstrating faster and more accurate model performance [28,29].
The YOLOv8 model utilized for image classification undergoes training on Imagenet, housing over 1000 classes. This furnishes the YOLOv8x-cls model, with YOLOv8n-cls identified as the fastest among them [28]. In the context of this study, the necessity for a high-performance classification model to categorize types of apartment complexes was recognized. Given the multifaceted elements within apartment complexes, the YOLOv8n-cls model was selected for its adeptness in efficiently analyzing the feature map of images and handling voluminous data.
3.3.3. Evaluation Metrics Accuracy
A confusion matrix is a matrix that represents the number of accurately classified data by comparing the predicted classification of the model with the actual classification of the data. In a 2 × 2 matrix table, as shown in Figure 6, if the cell in the first row and first column is predicted as ‘1’, and the actual data is also ‘1’, it represents a True Positive (TP). The cell in the 2nd row and 2nd column is considered a True Negative (TN) if it is predicted as ‘0’ and the actual data is also ‘0’. If the predicted value is 1 but the actual value is 0 for the cell in the first row and second column, it is a False Positive (FP). In the case of a cell in row 2 and column 1, if the predicted value is 0 but the actual value is 1, it represents a False Negative (FN). The confusion matrix can be used to calculate accuracy, precision, recall, and the F1-Score.
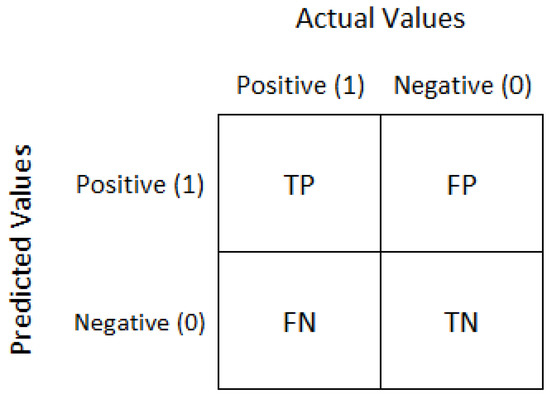
Figure 6.
An example of the confusion matrix.
Accuracy, precision, recall, and the F1-Score were employed to evaluate the performance of the developed model. The aforementioned metrics ranged from 0 to 1. When evaluating a CNN deep learning model, a precision and recall of 0.8 or more are considered indicators of a high performance. Additionally, a smaller difference between these two metrics suggests that the model’s performance is not compromised. Furthermore, a classification model with an F1-Score of 0.9 or higher is considered excellent [30]. Accuracy refers to the proportion of correctly classified data out of the total data, and a higher accuracy indicates better performance of the model.
Precision serves as the measure of accurate predictions made by the model, signifying the model’s reliability in generating truthful predictions. Contrarily, recall pertains to the number of measurements correctly predicted by the model as relevant to the total pertinent predictions. Equations (2) and (3) outline the expressions used for calculating these scores. The F1-Score, a valuable metric for assessing the performance of a model, particularly in cases of imbalanced data labels, is the harmonic mean of precision and recall. A higher F1-Score suggests superior performance by the model.
The convolutional units within various layers of CNN function as object detectors. However, when flattening the final layer of CNN into a fully linked layer, the positional information and features of each pixel in such an object become lost. Consequently, fully CNN-based methods have recently found application. The utilization of the global average pooling (GAP) method, commonly employed as a regularization technique, enables the generation of class-specific activation maps, as shown in Figure 7, that retain localization. These maps facilitate the creation of heat maps for specific classes, providing insights into a CNN’s classification scheme [31]. The introduction of Guided Grad-CAM [32] aims to overcome the challenge of providing fine-grained, detailed explanations for the issues encountered by CAM. This is achieved through the utilization of guided backpropagation via elementwise multiplication. Additionally, Eigen-CAM has emerged as a method that generates heatmaps through principal component analysis using a learned weight matrix, departing from the traditional CAM approach. A notable feature of Eigen-CAM is its ability to generate heatmaps without necessitating a modification of the network structure or computation of gradients with noise, distinguishing it from traditional CAM and Grad-CAM methods. Eigen-CAM not only excels in terms of performance but also outperforms existing CAMs [33].
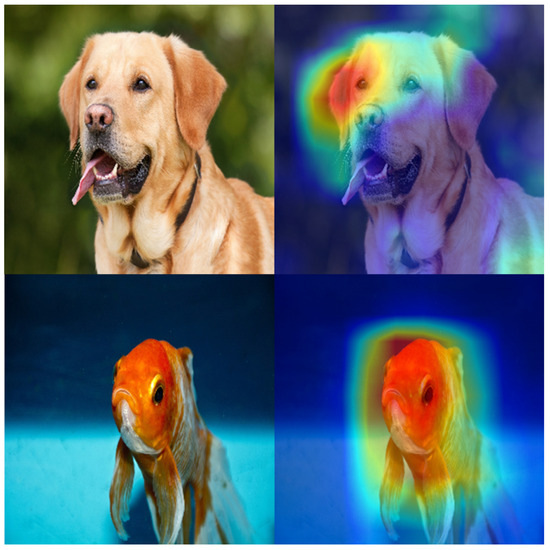
Figure 7.
Examples of CAM utilization.
4. Results and Discussions
This study focused on apartment complexes within the domestic market, specifically those comprising more than 300 households. We acquired a dataset of site plans utilizing a map API. Subsequently, we employed the Roboflow API, a data annotation tool, to label the apartment complex dataset based on the typologies proposed in prior research, which include lattice type, square type, and distributed type. Following this, a model built upon YOLOv8n-cls was developed to scrutinize the apartment complex dataset and was applied comprehensively to all such complexes across the country. The results of this study are succinctly outlined in this section.
4.1. Site Classifier
4.1.1. Evaluation Matrix
In this study, YOLOv8 was utilized to create the most optimized model with the learning results, as shown in Figure 8, through multiple experiments. The parameters, influencing the efficiency and performance of the model, were set to approximately 1.4 million. The measure of computational cost, expressed by GFLOPs, was set to 3.4. The learning rate was set to 0.01, and momentum was set to 0.937, considering the model’s convergence and stability. For enhancing the generalization performance and training stability, the weight decay was set to 0.005, and the batch size was set to 16.
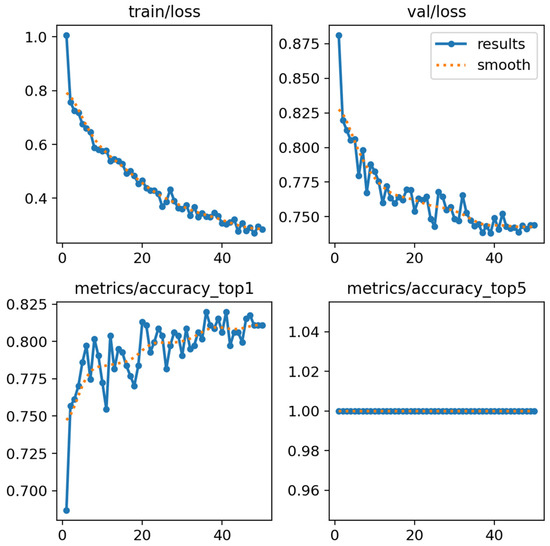
Figure 8.
Training result of the apartment complex classification model.
To evaluate the classification model created as described above, the results for each class were visualized in a confusion matrix, as shown in Figure 9. Based on this, accuracy, precision, recall, and the F1-Score were computed as shown in Table 1. The model demonstrated a relatively high accuracy of 0.83. Precision represents the ratio of TPs among instances predicted as positive by the model. Recall, also known as sensitivity, indicates the ratio of TPs among all actual positive instances. The F1-Score, as the harmonic mean of precision and recall, indicates a balanced performance when higher. Specifically, the lattice-type classification exhibited strong performance, with a precision value of 0.94, recall of 0.92, and F1-score of 0.93. With a precision of 0.94, the model correctly identified 94% of instances predicted as lattice-type complexes among all predicted instances. A recall of 0.92 meant that the model successfully detected 92% of the actual lattice-type complexes among all instances of this type. The F1-score of 0.93 indicated a balanced performance between precision and recall for lattice-type complexes. In the case of square-type complexes, the precision was 0.78, recall was 0.67, and the F1-score was 0.71. The marginal difference between precision and recall values was insignificant, both registering above-average figures. The model, when predicting square-type complexes, had a precision value of 0.78, meaning 78% of the instances predicted as square type were correct. With a recall of 0.67, the model identified 67% of the actual square-type instances among all instances of this type. An F1-score of 0.71 suggests a trade-off between precision and recall for central layout complexes. However, the lattice apartment complex revealed a performance shortfall compared to its classification. Conversely, the distributed type displayed a noticeable disjunction in precision and recall values, recording precision at 0.57, recall at 0.73, and an F1-score of 0.64. Additionally, it exhibited a lower accuracy, indicating that the model faced challenges in accurately classifying distributed apartment complexes.
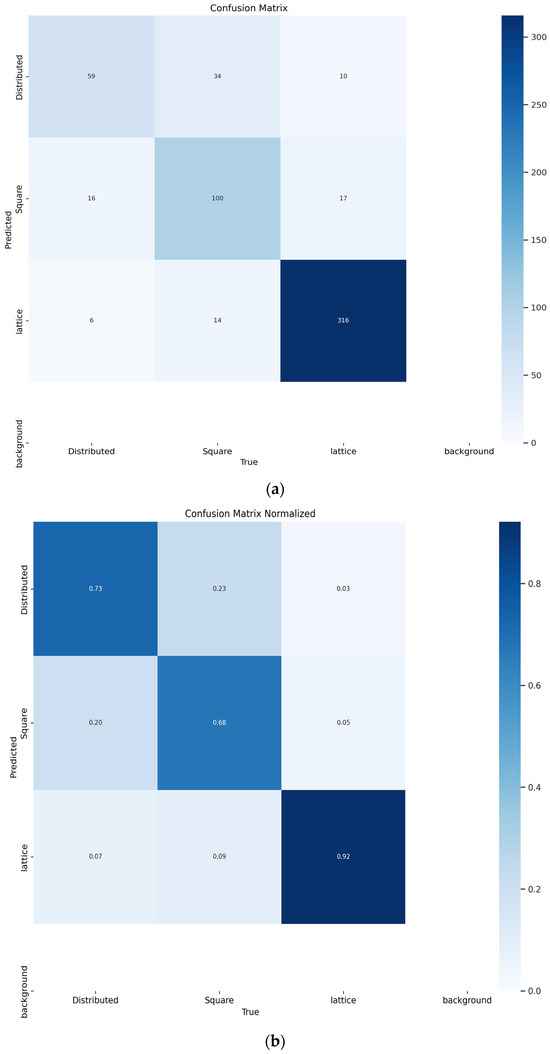
Figure 9.
Results of the confusion matrix for the apartment complex classification model: (a) confusion matrix not normalized; (b) normalized confusion matrix.

Table 1.
Evaluation of the apartment complex classification model.
4.1.2. Eigen CAM
Eigen-CAM was employed to produce a heatmap, aiming to corroborate the positional information that enabled the pre-established classification model to accurately predict images of specific classes. The analysis, as shown in Figure 10, revealed that the lattice type is predominantly distinguished by the building structure and the ground parking lot. In the case of the square type, the emphasis is on expansive outdoor spaces situated at the complex’s center. Conversely, for some complexes of the distributed type, the focus was on a central square, while others accentuated the configuration of the buildings.
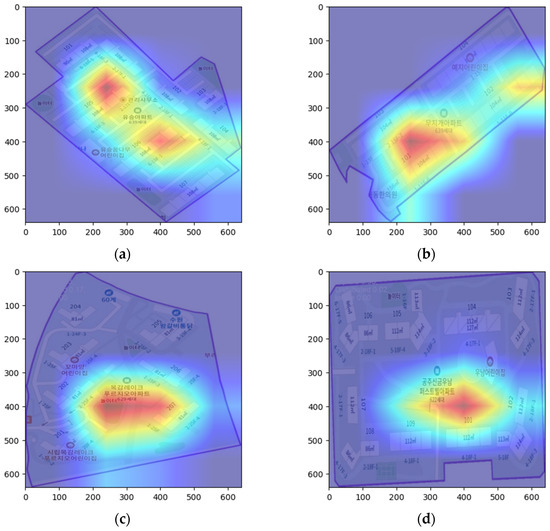
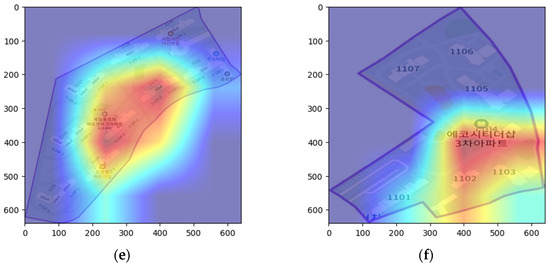
Figure 10.
Results of the apartment complex classification by Eigen-CAM: (a,b) Eigen-CAM result for lattice apartment complex; (c,d) Eigen-CAM result for square apartment complex; (e,f) Eigen-CAM result for distributed apartment complex.
4.2. Classification of South Korean Apartment Complexes by Period
4.2.1. Overview of Apartment Complexes by Period
The South Korean apartment complexes were categorized over time, utilizing a five-year interval, and Table 2 illustrates the yearly count of apartment complexes with 300 or more units. Examining the historical trends in apartment construction in South Korea, there is noticeable substantial growth commencing in the first half of the 1980s, escalating rapidly into the early 1990s.

Table 2.
Number of apartment complexes with 300 units or more by period in South Korea.
4.2.2. Analysis of Apartment Complex Types by Period
The classification model developed in this study successfully categorized domestic apartment complexes, revealing 6937 lattice apartment complexes, 3078 square apartment complexes, and 3049 distributed apartment complexes as shown in Table 3. When scrutinized across different periods, lattice apartment complexes reached their zenith in the latter half of the 1990s, experiencing a gradual decline thereafter. Square apartment complexes saw a surge starting from the latter half of the 1990s, peaking at 838 in the latter half of 2010. Distributed apartment complexes, akin to square complexes, exhibited an incremental trend from the latter half of the 1990s, though at a more modest pace. The most substantial increase for distributed complexes was noted in the latter half of the 2010s as shown in Figure 11.

Table 3.
Apartment complex types by period in South Korea, obtained by applying the apartment complex classification model.
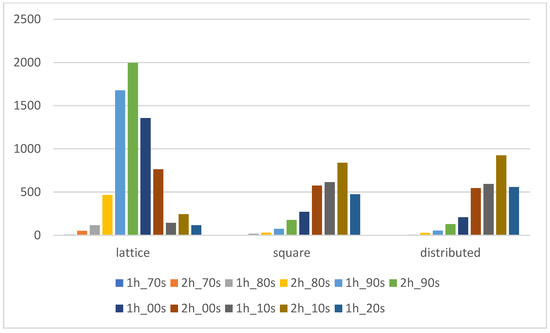
Figure 11.
Graph of apartment complex types by period in South Korea with the apartment complex-type classification model applied.
This signifies the rise of apartment complexes of these categories, attributed to the growing demand for luxury apartments driven by enhanced quality of life in the latter half of the 1990s. The upscale strategies employed by private construction companies, along with intense competition among apartment brands, further contributed to this trend.
5. Discussion
In this study, a model capable of classifying apartment complex types based on the data collected using map APIs was created for various types of apartment complexes in Korea, as derived from previous research. The results of predicting the entire dataset of apartment complexes in Korea using this model were analyzed seasonally. While the accuracy for lattice and square types was found to be satisfactory according to the evaluation matrix, the accuracy for the distributed type was observed to be lower. This discrepancy in accuracy is attributed to the unique characteristics inherent in each complex type.
Lattice-type complexes are characterized by parallel arrangements of buildings, mainly utilizing ground parking spaces without separate resting or exercise areas. Square-type complexes, however, feature a large central space such as a square, with buildings arranged around it. By contrast, distributed-type complexes have scattered small external spaces, and intricate pathways connect these spaces, forming various external areas. Therefore, the distributed type lacks distinct characteristics easily detectable by the classification model, making it challenging to identify. To facilitate the detection of distributed-type complexes, it is deemed necessary to establish new definitions for complex types and further categorize them for the ease of feature recognition.
The significance of this study lies in securing big data for Korean apartment complexes, providing a foundation for analyzing complex plans using maps, especially when actual completion drawings are difficult to obtain. Additionally, utilizing deep learning for architectural planning analysis, as demonstrated in this study, ensures objectivity and efficiency in analyzing changes in apartment complex types over the history and trends of Korea’s apartment complexes. Furthermore, for newly constructed apartment complexes, this study provides a basis for recommending complex types that align with site conditions during the architectural planning stage. Thus, employing deep learning for architectural planning analysis is deemed to enhance temporal efficiency and objectivity in the analysis process.
6. Conclusions
6.1. Summary
This study aimed to scrutinize the various types of apartment complexes in South Korea across different time periods. Data collection was facilitated through a mapping API designed for apartment complexes. A model was then constructed using deep learning, employing types derived from prior research to classify these complexes. Evaluation results of the classification model yielded an accuracy of 0.83, indicating a commendable performance. The predictive accuracy for lattice and square apartment complexes was notably high. Conversely, a lower prediction accuracy was observed for distributed apartment complexes. When categorizing apartment complexes, the lattice and square types exhibit distinctive characteristics, facilitating their classification through Image Classification in the development of a CNN model. However, the distributed type presents challenges, as its complex features, such as building layout and the scattered arrangement of outdoor spaces, cannot be adequately assessed through a simplistic Image Classification approach alone. This implies that a detailed dataset, including precise data labeling, is essential to detect objects within the complex through image segmentation and subsequently classify the detected images. Moreover, for a distributed apartment complex, a comprehensive analysis of the building layout and outdoor space arrangement is imperative, in contrast to lattice and square apartment complexes. It is recommended to derive multiple classes through architectural analysis rather than simply assigning a generic label to a distributed apartment complex, if necessary. Through an in-depth analysis of apartment complex types in Korea, this study provides a framework for specialized designs that can reflect evolving societal perceptions and lifestyles. It aims to derive optimal apartment complex types that enhance the accessibility and usability of external spaces. Thus, this research establishes a foundation for analyzing and deriving apartment complex types that can adapt to changing societal trends and lifestyle preferences.
This study represents a significant effort to explore the distinctive spatial characteristics of South Korean apartment complexes through deep learning, diverging from existing research that predominantly concentrates on plan drawings and other activated areas within the architectural domain. Additionally, the dataset of South Korean apartment complex layouts developed in this study is considered valuable for future research endeavors, establishing a robust foundation for investigations utilizing architectural big data. In subsequent research, it will be imperative to scrutinize instances predicted as distributed apartment complexes using the previously established classification model. This scrutiny should aim to identify the reasons behind the low accuracy observed in the data. Furthermore, conducting research on image segmentation is essential for detecting and analyzing intricate objects within images. This, in turn, would enable the reclassification of currently distributed apartment complexes into more nuanced categories.
6.2. Limitations
This study holds significance in acquiring site plan datasets for apartment complexes through mapping, overcoming the challenge of obtaining actual completion drawings, which are often difficult to obtain. However, there is a limitation in this study, owing to potential discrepancies between the acquired mapping data and actual completion drawings, introducing the possibility of errors. The utilization of a specific map API suggests that classification may be challenging for different input data, such as Google Maps. Despite these limitations, the methodology employed in this study showcases the feasibility of conducting architectural planning analysis, especially when faced with difficulties in obtaining actual completion drawings. This study also highlights the potential for further research in comparing and analyzing different deep learning or classification methods, in addition to the YOLOv8n-cls model based on the dataset created in this study. This comparative analysis could lead to the derivation of a model optimized for classifying complex types.
Author Contributions
Conceptualization, S.-B.Y. and S.-E.H.; methodology, S.-B.Y. and J.H.L.; software, S.-B.Y. and J.H.L.; validation, S.-E.H. and J.H.L.; formal analysis, S.-B.Y. and B.S.K.; investigation, S.-B.Y. and S.-E.H.; resources, S.-B.Y. and J.H.L.; data curation, J.H.L.; writing—original draft preparation, S.-B.Y. and S.-E.H.; writing—review and editing, S.-B.Y. and S.-E.H.; visualization, S.-B.Y. and J.H.L.; supervision, S.-E.H.; project administration, B.S.K. and S.-E.H.; funding acquisition, B.S.K. All authors have read and agreed to the published version of the manuscript.
Funding
This work was supported by the National Research Foundation of Korea (NRF) grant funded by the Korea government (MSIT) (No. 2020R1A2C1102911).
Data Availability Statement
The raw data supporting the conclusions of this article will be made available by the authors on request.
Conflicts of Interest
The authors declare no conflicts of interest.
References
- Ryu, S.M.; Hyun, C.Y. Analysis of Spatial Structure for Outdoor Space according to the Changes of Pedestrian Environment in the Apartment Complex by Period. KIEAE J. 2023, 23, 77–83. [Google Scholar] [CrossRef]
- Song, H.M.; Kang, B.S.; Yoon, S.B.; Hwang, S.E. An Analysis of Resident Satisfaction Based on Types of External Spaces in Apartment. KIEAE J. 2023, 23, 23–32. [Google Scholar] [CrossRef]
- Jang, S.C.; Kim, C.Y. A Study on the Characteristics of Planing and Design of External Environment in Apartment House. Urban Des. 2022, 21, 5–18. [Google Scholar]
- K-apt. Available online: http://www.k-apt.go.kr/cmmn/main.do (accessed on 23 October 2023).
- Byun, N.H.; Choi, J.P. A Typology of Korean Housing Units: In Search of Spatial Configuration. J. Asian Archit. Build. Eng. 2016, 15, 41–48. [Google Scholar] [CrossRef]
- Park, I.S.; Park, N.H.; Chun, H.S. Changes in Apartment Unit Plan Caused by the Revision of Regulations for Area Calculating Criteria and Balcony Use. J. Korean Hous. Assoc. 2014, 25, 27–36. [Google Scholar] [CrossRef][Green Version]
- Kang, B.S.; Kang, I.H.; Park, G.J.; Park, I.S.; Park, C.S.; Baek, H.S.; Lee, G.I. History of Korean Apartment Housing Planning; Land and Housing Research Institute: Seoul, Republic of Korea, 1999. [Google Scholar]
- Kang, B.S.; Kang, I.H.; Park, G.J.; Park, I.S.; Parck, C.S.; Lee, G.I. Urban Housing Planning; Land and Housing Research Institute: Seoul, Republic of Korea, 1997. [Google Scholar]
- Park, I.S.; Kang, B.S.; Kang, I.H.; Park, G.J.; Park, C.S.; Baek, H.S.; Lee, G.I. Residential Complex Plan; Land and Housing Research Institute: Seoul, Republic of Korea, 2007. [Google Scholar]
- Kang, B.S.; Kang, I.H.; Park, G.J.; Park, I.S. Housing Design 2010; Land and Housing Research Institute: Seoul, Republic of Korea, 2010. [Google Scholar]
- Ahn, E.S. Deep Learning Based Spatial Analysis Method for Korean Apartment Unit Plans. Ph.D. Thesis, Seoul National University, Seoul, Republic of Korea, 2021. [Google Scholar]
- Choo, S.Y.; Seo, J.H.; Park, H.J.; Ku, H.M.; Lee, J.K.; Kim, K.T.; Park, S.H.; Kim, J.S.; Song, J.Y.; Lee, S.H.; et al. AI-Based Architectural Design Automation Technology Development; Korea Agency for Infrastructure Technology Advancement: Seoul, Republic of Korea, 2020. [Google Scholar]
- Tapeh, A.T.G.; Naser, M.Z. Artificial Intelligence, Machine Learning, and Deep Learning in Structural Engineering: A Scientometrics Review of Trends and Best Practices. Arch. Comput. Methods Eng. 2023, 30, 115–159. [Google Scholar] [CrossRef]
- Mohsen, Z.E. Leveraging Machine Learning Techniques to Support a Holistic Performance-Based Seismic Design of Civil Structure; Woodhead Publishing: Cambridge, UK, 2024; pp. 25–49. [Google Scholar]
- Kakao Map. Available online: https://map.kakao.com/ (accessed on 23 October 2023).
- Google Map. Available online: https://www.google.com/maps/?hl=ko (accessed on 23 October 2023).
- Roboflow. Available online: https://roboflow.com/ (accessed on 20 December 2023).
- Russakovsky, O.; Deng, J.; Su, H.; Krause, J.; Satheesh, S.; Ma, S.; Huang, Z.; Karpathy, A.; Khosla, A.; Bernstein, M.; et al. ImageNet Large Scale Visual Recognition Challenge. Int. J. Comput. Vis. 2015, 115, 211–252. [Google Scholar] [CrossRef]
- Lin, T.Y.; Maire, M.; Belongie, S.; Hays, J.; Perona, P.; Ramanan, D.; Dollár, P.; Zitnick, C.L. Microsoft COCO: Common Objects in Context. In Proceedings of the 2014 European Conference on Computer Vision (ECCV), Zurich, Switzerland, 6–12 September 2014. [Google Scholar]
- Krizhevsky, A. Learning Multiple Layers of Features from Tiny Images; Technical Report; University of Toronto: Toronto, ON, USA, 2009. [Google Scholar]
- He, K.; Zhang, X.; Ren, S.; Sun, J. Deep Residual Learning for Image Recognition. In Proceedings of the 2016 IEEE Conference on Computer Vision and Pattern Recognition (CVPR), Las Vegas, NV, USA, 27–30 June 2016; pp. 770–778. [Google Scholar]
- Simonyan, K.; Zisserman, A. Very Deep Convolutional Networks for Large-Scale Image Recognition. In Proceedings of the 3rd International Conference on Learning Representations, San Diego, CA, USA, 7–9 May 2015; pp. 1–14. [Google Scholar]
- Tan, M.; Le, Q. EfficientNet: Rethinking Model Scaling for Convolutional Neural Networks. In Proceedings of the International Conference on Machine Learning, Long Beach, CA, USA, 9–15 June 2019; pp. 6105–6114. [Google Scholar]
- Szegedy, C.; Liu, W.; Jia, Y.; Sermanet, P.; Reed, S.; Anguelov, D.; Erhan, D.; Vanhoucke, V.; Rabinovich, A. Going Deeper with Convolutions. In Proceedings of the 2015 IEEE Conference on Computer Vision and Pattern Recognition (CVPR), Boston, MA, USA, 7–12 June 2015. [Google Scholar]
- Howards, A.G.; Zhu, M.; Chen, B.; Kalenichenko, D.; Wang, W.; Weyand, T.; Andreetto, M.; Adam, H. MobileNets: Efficient Convolutional Neural Networks for Mobile Vision Applications. arXiv 2017, arXiv:1704.04861. [Google Scholar]
- Bochkovskiy, A.; Wang, C.Y.; Liao, H.Y.M. YOLOv4: Optimal Speed and Accuracy of Object Detection. arXiv 2020, arXiv:2004.10934. [Google Scholar]
- Myung, H.J.; Song, J.W. Deep Learning-based Poultry Object Detection Algorithm. J. Digit. Contents Soc. 2022, 23, 1323–1330. [Google Scholar] [CrossRef]
- Ultralytics. Available online: https://github.com/ultralytics/ultralytics (accessed on 21 December 2023).
- Medium. Available online: https://sidharkal.medium.com/image-classification-with-yolov8-40a14fe8e4bc (accessed on 21 December 2023).
- Lee, J.K.; Son, Y.H. Development of Image Classification Model for Urban Park User Activity Using Deep Learning of Social Media Photo Posts. J. Korean Inst. Landsc. Archit. 2022, 50, 42–57. [Google Scholar] [CrossRef]
- Zhou, B.; Khosla, A.; Lapedriza, A.; Lapedriza, A.; Oliva, A.; Torralba, A. Learning Deep Features for Discriminative Localization. In Proceedings of the 2016 IEEE Conference on Computer Vision and Pattern Recognition (CVPR), Las Vegas, NV, USA, 27–30 June 2016. [Google Scholar]
- Selvaraju, R.R.; Cogswell, M.; Das, A.; Vedantam, R.; Parikh, D.; Batra, D. Grad-CAM: Visual Explanations from Deep Networks via Gradient-based Localization. In Proceedings of the 2017 IEEE International Conference on Computer Vision (ICCV), Venice, Italy, 22–29 October 2017. [Google Scholar]
- Muhammad, M.B.; Yeasin, M. Eigen-CAM: Class Activation Map using Principal Components. In Proceedings of the 2020 International Joint Conference on Neural Networks (IJCNN), Glasgow, UK, 19–24 July 2020. [Google Scholar]
Disclaimer/Publisher’s Note: The statements, opinions and data contained in all publications are solely those of the individual author(s) and contributor(s) and not of MDPI and/or the editor(s). MDPI and/or the editor(s) disclaim responsibility for any injury to people or property resulting from any ideas, methods, instructions or products referred to in the content. |
© 2024 by the authors. Licensee MDPI, Basel, Switzerland. This article is an open access article distributed under the terms and conditions of the Creative Commons Attribution (CC BY) license (https://creativecommons.org/licenses/by/4.0/).