Abstract
Wind, a renewable resource with growing importance in the contemporary world, is considered a capable tool for addressing some of the problems linked with rapid urbanization, unsustainable development, and climate change. As such, understanding modelling approaches to wind characteristics in cities becomes crucial. While prior reviews delve into the advancements in reduced-scale models and computational fluid dynamics simulations, there is scant literature evaluating large-scale spatial modelling of urban wind environments. This paper aims to consolidate the understanding of spatial modelling approaches to wind characteristics in cities by conducting a systematic literature review with the PRISMA protocol to capture the contributions to sustainable urban development. The reviewed articles are categorized under two distinctive approaches: (a) studies adopting the wind morphometric approach, encompassing theoretical foundations, input factors, and computation methods and (b) studies adopting the urban climate mapping approach, centering on the amalgamation of wind with urban microclimate analysis. The findings suggest that wind morphometric methodologies hold considerable promise due to their straightforward calculations and interpretability. Nonetheless, issues related to data precision and accuracy challenge the validity of these models. This review also probes into the implications of these two distinctive approaches for urban planning and policymaking, advocating for more sustainable urban development.
1. Introduction
Wind has historically been recognized as a crucial mechanism for deriving mechanical energy and facilitating natural cooling. In contemporary times, the burgeoning emphasis on urban sustainability and the shift towards carbon neutrality has resulted in a prolific increase in the literature investigating the interplay between wind and urban form [1]. Given wind’s positive impact on urban sustainability performance, a new term was coined in recent years—i.e., Wind-Sensitive Urban Design (WiSUD). This new design perspective, WiSUD, advocates treating wind as a renewable asset that can be used for both ventilation and energy production in urban planning processes [2,3,4].
The urban climate in urban areas differs significantly from those in other regions due to various interacting factors at multiple scales. The prevailing background climate in a region is mostly driven by mesoscale meteorological and geographical factors, whereas the microclimate within the city boundaries is primarily determined by its urban form [5]. Specifically, the characteristics of urban surfaces, along with the urban form, exert the most significant impact on the variations in local climate conditions, including airflow patterns, ambient air and surface temperatures, and relative humidity [5].
Considering the complexity of urban form and the variability in urban climatic conditions, a systematic understanding of simulation and modelling techniques is vital for effectively managing climate development outcomes [6]. As such, numerous modelling and simulation studies have been undertaken to comprehend the unique urban climatic phenomena over the past decades. In the case of studies on urban wind patterns, a search of “urban wind modelling” on Google Scholar returns over 17,900 articles since the year 2000. A thorough literature analysis that gives insights into the approaches used to analyze the urban environment has become timely and important, considering the huge volume of results.
Two primary disciplines predominantly drive studies on urban wind modelling—namely engineering and geographical studies. Within the engineering domain, three prevailing methods stand out—i.e., field measurement, physical modelling, and numerical modelling [7]. Field measurements, typically carried out in real urban environments, capture the physical and geometrical nuances of these settings. Nonetheless, due to inherent imprecision and uncertainties, such measurements only offer a snapshot of actual conditions unless taken over an extended duration [7].
On the other hand, wind tunnel experiments use mock-up city models to test hypothetical scenarios. These experiments present an advantage over field measurements in that controlled meteorological conditions, repeatability of tests, and the generation of comprehensive, high-quality data are achievable [8]. However, replicating urban areas in these models is not only time-consuming and expensive, but certain architectural details often become simplified due to manufacturing constraints [9].
The use of numerical or computational fluid dynamics (CFD) modelling has seen a significant rise, largely attributed to advancements in computational capabilities; the method facilitates the control of meteorological conditions and the detailed representation of building characteristics [10]. Such attributes make CFD an indispensable tool for conducting urban wind studies. Yet CFD modelling is not without its challenges. One primary concern is its sensitivity to input parameters stemming from its mathematical basis; any inconsistency in the dataset might adversely impact the simulation’s precision [11]. Additionally, converting and modifying geographical or geometrical data, often performed manually, can introduce human errors, further complicating the modelling results [10]. Furthermore, cities inherently possess a multitude of complex geometrical elements, making very-large-scale modelling computationally unviable [12].
The usage of field measurements, wind tunnels, and CFD simulations has been instrumental in advancing the comprehension of the urban wind environment. Several exemplary reviews have been conducted in recent years. For example, Zhao et al. [13] reviewed wind tunnel experiments for airflow around buildings. They identified key modelling characteristics and the strengths and weaknesses of the methodology. Toparlar et al. [14] produced a detailed account of the advancement in CFD studies focusing on urban microclimate. They found that more studies are exploring urban-scale adaptation measures and suggest that CFD simulations, which connect various aspects like economy and scales like buildings, could bridge urban climate knowledge to engineering and design practices.
Nevertheless, given the high cost, complexity, and uncertainty involved in both physical and numerical models, an alternative modelling approach emerged in the geography discipline [11]. The premise of this approach is that certain urban spatial elements or “roughness elements” have a statistical correlation with airflow [15]. The underlying concept is that complex fluid mechanics computations can be circumvented by integrating spatial and meteorological data. This allows for a comprehensive illustration of the urban wind environment on a larger scale while substantially minimizing computational costs [5,16].
Additionally, there is considerable diversity in how spatial methods model the urban wind environment. Unlike the engineering field, there has not been a comprehensive review of spatial modelling related to urban wind up to this point. On the other hand, there is a notable gap in the integration of urban climate studies into mainstream urban planning practices [17]. As such, a review study would not only serve as a knowledge consolidation tool but also as a catalyst for fostering interdisciplinary collaboration between architects, urban planners, wind engineers, and urban climatologists. This synergistic approach would consequently facilitate the formulation of cities that are both sustainably designed and adept at adapting to specific climate factors.
To achieve this, this paper is structured as follows: Section 2 outlines the research methodology; Section 3 showcases the results; Section 4 delves into the findings and their significance; and Section 5 provides a conclusion. Through this comprehensive review, the objective of this paper is to consolidate the knowledge on urban wind modelling techniques and foster a more holistic approach to urban wind and climate studies within the realm of urban planning and design.
2. Methodology
This research employs the systematic literature review methodology, specifically adopting the Preferred Reporting Items for Systematic Reviews and Meta-Analyses (PRISMA) approach. This technique, as suggested by Moher et al. [18] and Cortese et al. [19], progresses through four key stages: (a) identification of potential articles; (b) initial screening; (c) assessing eligibility; and (d) selection for inclusion. The initial identification phase involved a search within two prominent databases known for their large collection of peer-reviewed articles, namely Scopus and Web of Science.
This study recognized the fact that wind condition is an integral part of the urban climate system. Thus, the search string needs to include “Climate” OR “Microclimate” to capture all relevant articles. On the other hand, WiSUD focuses on the triadic relationship between urban form, urban wind environment, and urban planning objectives. To reduce the number of unrelated results, the search string “morphology” or “urban form” was not included. This is due to the following: (a) many studies seldomly attempt to establish the relationship between one urban form or morphology feature, such as street orientation’s impact on pedestrian level wind speed, and (b) many studies attempting to present methodologies extracting urban form data. The focus of this article is to assess and document the methodological development of spatial modelling approaches to address specific urban planning outcomes.
To include all the aspects of urban wind study based on spatial methods, search strings in Scopus and Web of Science combined two sets of concepts: (a) urban wind and climate and (b) GIS and/or spatial methods/models/modelling. Primary criteria to identify relevant sources were as follows: (a) peer-reviewed journal articles; (b) full text available online; and (c) written in English language. The search strings were as follows: “Urban OR Cit*” AND “Wind OR Airflow OR Climate OR Microclimate” AND “GIS OR Geographical Information System OR Spatial”. The earliest publishing date was purposefully kept open to capture all available publications. The search was conducted in October 2023; hence, it is the end date of the search. The inclusion and exclusion criteria are listed in Table 1.

Table 1.
Exclusion and inclusion criteria.
Searches conducted in Scopus and Web of Science yielded 183 and 385 publications, respectively. Upon conducting a thorough review of the available literature, it was observed that Nature and Science datasets did not, at the time, offer articles directly related to the specific field of inquiry. Hence, they have not been included. After duplicates were removed, the aggregate count was reduced to 101 journal papers. An assessment of titles and abstracts was performed to determine the relevance of these papers to the study’s objective. Subsequently, the list was narrowed down to 105 articles, which were then read in full. An additional 65 papers were subsequently omitted due to being solely focused on specific urban morphological parameters’ impact on urban wind environment. To address potential bias towards natural sciences and engineering in Scopus and Web of Science, as indicated by Mongeon and Paul-Hus [20], a supplement search in Google Scholar was also performed. This search added 10 more articles, leading to a final total of 51 articles. Figure 1 depicts the PRISMA flowchart. The concluding set of papers was reviewed and categorized, and the findings were divided into two main categories.
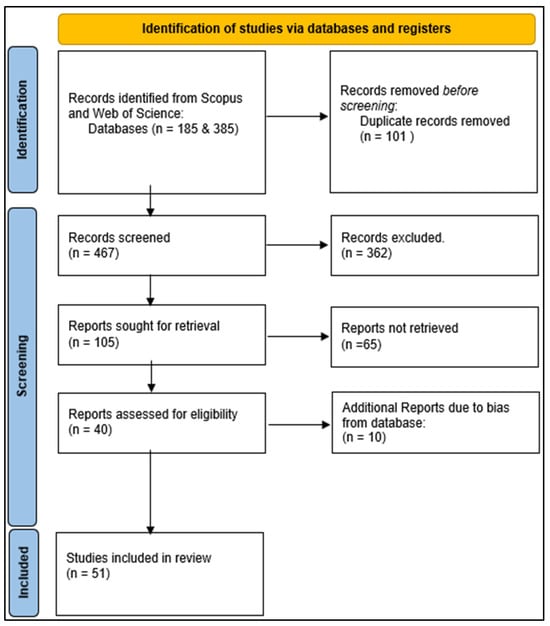
Figure 1.
PRISMA flowchart.
3. Results
3.1. Research Landscape
During the review of the articles, we observed two key facts to report: these are the study regions and journals they are published in. As illustrated in Figure 2, studies conducted on Chinese cities appear to have attracted substantial scholarly interest (n = 23). This phenomenon may be explained by the fact that the broad interest in understanding the urban wind environment coincides with the increasing tendency in many Chinese cities to implement innovative concepts and technologies, owing to the rapid and unparalleled urban growth witnessed in China over the past decades. Chinese cities are now grappling with dual challenges. On the one hand, they face concerns related to energy sustainability; on the other, they are witnessing a decline in the quality of the urban environment, such as air pollution and urban overheating, a consequence of unsustainable urban development practices [21,22,23]. This dual challenge underscores the urgency of rethinking development approaches to ensure a balance between growth and sustainability [24].
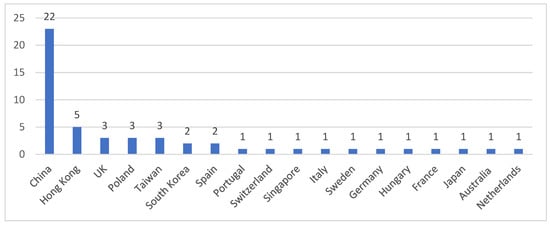
Figure 2.
Case study locations.
In addition, some studies have been undertaken in other East Asian cities, including Hong Kong (n = 5) and Taiwan (n = 3). The phenomenon can be attributed to the particularly high population and building densities observed in cities in these regions. These densely populated urban centers often experience reduced wind permeability due to the compact nature of their infrastructures. This scenario can amplify urban heat islands and reduce overall air quality, exacerbating environmental and health concerns for the cities’ residents [25,26]. Consequently, understanding the dynamics of urban wind environments and the associated modelling techniques has become crucial, leading to an increase in related research within these regions.
According to the findings, the selected articles are divided into two categories: (a) morphometrical wind studies and (b) urban climate mapping studies. The details of these findings are expanded upon in the subsequent sub-sections, and a summarization of the articles can be found in Appendix A, Table A2 and Table A3. Both categories of studies utilize comparable theoretical assumptions and numerical approximations to general spatial representations of the urban wind environment. The core concept centers on the relationship between urban form and observed wind data. The incorporation of geographic information systems (GISs) proves particularly beneficial for studies related to spatial phenomena [27]. Consequently, these investigations leverage the analytical capabilities of GISs to superimpose analyses of wind environment, urban form, and land use over larger areas, thereby providing urban planners with rapid, comprehensive, and intuitive results [28].
Of the 51 reviewed articles, 35 employed the morphometric wind modelling method for their computations. These 35 articles can be further divided into two categories:
- ▪
- Urban ventilation studies (n = 30) pertaining to the urban planning objective of mitigating urban heat islands and pollutant concentration;
- ▪
- Wind energy studies (n = 5) pertaining to the application of wind energy production in urban areas.
3.2. Morphometric Wind Modelling
For effective morphometric wind modelling, a detailed description of the urban form parameters is essential. Emphasis should be placed on morphological parameters [29]. This requires employing spatial data to compute these parameters [30]. Combined with background meteorological conditions, the simulation approach reconstructs the climate condition and characterizes the spatial variation in the urban wind environment [31]. Owing to the challenges posed by large-scale geographical analysis and the unpredictable nature of urban wind flow patterns, even the highest quality spatial data cannot eliminate inherent uncertainties [32]. To address this, the model’s performance is typically validated using field measurements or more fine-scale analysis techniques, such as CFD [32]. Figure 3 displays a generic process framework for the morphometric wind model. The seven main components of the framework are discussed in the following sections.
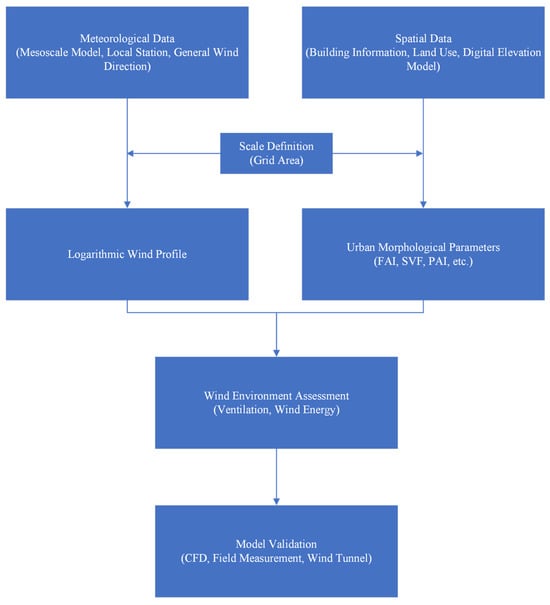
Figure 3.
Process framework of morphometric wind model.
The wind flow characteristics are shaped by two important parameters: roughness length, , and zero-plane displacement height, . A higher suggests greater obstruction, typical in densely built urban areas. , on the other hand, is the height above ground where wind speed theoretically drops to zero, essentially elevating the effective wind flow level in areas with significant obstructions such as tall buildings. The relationship of and and wind speed at different heights in urban areas is governed by the logarithmic wind law, as shown in Equation (1) below.
where u is the wind speed at height (z), is the friction velocity, is the Von Karman constant (=0.4), and z is the height overground.
The computation of urban morphological parameters based on and has evolved depending on the scope and purpose of research, with each technique containing its own assumptions and approximations. There are three general approaches for the determination of roughness length and displacement height:
- ▪
- Morphometric method, which uses the measurement of urban morphological parameters through mathematical computation. Different empirical formulas and models exist for this purpose, derived from studies correlating urban form with these parameters [33,34]. By quantifying the physical characteristics of an urban area, the morphometric method provides estimates of roughness length and displacement height. Alternatively, the “rule of thumb” uses predetermined roughness classes and visual estimation.
- ▪
- Micrometeorological method, which uses the field measurement of wind speed. Instruments are used to measure wind speeds and other meteorological variables at different heights above the ground.
The computation for and utilizing the morphometric method is far from perfect, and empirical evaluation of the equation results has been inconsistent. This results in the absence of a single, well-defined, and relatively accurate morphometric approach for evaluating the urban wind profile [35,36]. To address this issue and improve the relevance of the morphometric method in large-scale urban planning, studies have proposed using the Frontal Area Index, λf, as the main morphological parameter to determine roughness length. This approach has demonstrated a positive correlation with and [15].
Subsequent empirical studies have indicated that morphological parameters and associated surface roughness can predict wind speed at pedestrian or “podium” levels, effectively below the displacement height [28]. These insights have opened avenues for more accurate yet simplified studies that link urban morphological parameters with ventilation capacities [37]. Utilizing morphological parameters as independent variables in urban ventilation studies reduces computational costs for large-scale modelling and facilitates data collection from readily available sources [38]. Nevertheless, this approximation method of ventilation assessment cannot be used for assessing urban wind energy. Given that wind resource evaluation requires detailed wind speed measurements, it is important to note that wind speeds on rooftops are typically higher than those at pedestrian level.
3.2.1. Spatial Data Source
Morphometric wind modelling utilizes three types of source data, which are the Digital Elevation Model (DEM), land use, and building dataset. The source data are the basic spatial information that is required for the further computation of morphological parameters. The DEM is stored in a raster form, while land use and building datasets are stored in vector forms.
The DEM is the most often utilized baseline product for remote sensing-based urban spatial studies. Owing to its efficacy in the cost-effective gathering of large-scale data, Light Detection and Ranging (LiDAR) technology has emerged as a crucial tool for articulating the three-dimensional architecture of urban landscapes [26]. The DEM offers a comprehensive depiction of terrain characteristics, encapsulating not only the footprints of buildings but also additional vertical elements such as building heights, vegetation, and surface elevations [26,39,40]. Another advantage of the DEM-measured building height is its proficiency in discerning height variations in complex urban areas [26].
In addition to remote sensing methods, vector data pertaining to urban form, including land use and building details, are essential for charting land cover and illustrating the 3D structure of buildings. This encompasses building details like height, width, and number of floors, as well as land cover detailing surface configurations such as built-up regions, water bodies, streets, and vegetation coverage. Typically, these datasets are curated by national, state, or municipal public agencies. Cadaster plans, which contain comprehensive records about geographical entities like land parcels and buildings, can be leveraged to amalgamate datasets that depict urban plots and edifices at an exceptionally detailed spatial resolution, combined with insights on their specific functions [39].
3.2.2. Spatial Units
Figure 4 illustrates the distribution of spatial units according to their frequency in wind morphometric studies. The most used is the 100 m uniformed resolution, cited in 13 different studies. This preference for a 100 m grid is not arbitrary; it has been shown to strike a balance between detail and computational feasibility. For instance, Wong et al.’s [37] study on the heterogeneity of Hong Kong’s climate concludes that a 100 m resolution is particularly effective for urban climatology research. They argue that this resolution is ideal for capturing the necessary details without overwhelming computational resources.
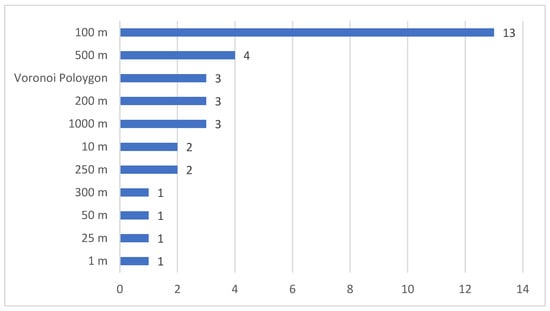
Figure 4.
Basic spatial units used.
Further supporting this choice, Hsieh and Huang [32] noted that a 100 m resolution is roughly equivalent to 1 hectare, which is a common plot size in urban areas. This equivalence suggests that the 100 m grid size is not only a practical choice for computational reasons but also reflects the actual scale of urban land parcels. The widespread adoption of the 100 m grid can be seen as an attempt to establish a standardized metric in morphometric studies. Such a standard is crucial for achieving consistency across studies, allowing researchers to effectively compare and contrast findings.
The presence of a variety of grid sizes from 1 m to 1000 m also highlights the diversity of methodological approaches in urban climatology, tailored to the specific demands of each study. Ng and Yuan [28] introduced a unique method for incorporating cross-sectional areas into the morphological parameter counting of large buildings partitioned into smaller grids. Lv et al. [36] employed a moving grid to compute the aerodynamic characteristics of each structure. In this study, a semi-circular area was chosen based on the interference of incoming airflow, allowing the individual calculation of the roof wind speed of urban buildings.
Recognizing that variations in urban form can introduce certain levels of uncertainty, alternative methodologies are being advanced in conjunction to uniform grid systems. For example, Gál and Unger [29] employed Voronoi polygons as a partitioning scheme in their grid to prevent the fragmentation of large structures like stadiums, shopping centers, and transportation hubs. These alternative approaches are indicative of an effort to refine spatial analysis to more accurately reflect the complexity of urban environments, which are not uniformly partitioned and require more sophisticated modelling techniques to account for their varied morphological features.
The Modifiable Areal Unit Problem (MAUP) introduces uncertainty in GIS-based modelling stemming from data aggregation [32]. To counteract this, spatial modelling often employs consistent vector grids to depict urban regions, computing morphological attributes for each grid segment. While this uniform grid approach is beneficial for developing climate models, it does not accurately capture the true essence of urban forms. Urban layouts typically exhibit irregular contours and distinctive spatial boundaries, often influenced by diverse socioeconomic dynamics. As urban areas have varying geometries, it is not possible to fully resolve the MAUP, so studied areas are usually divided into square-shaped “neighborhood” regions with resolutions ranging from 100 m to 1 km depending on their study scope and available spatial data [32,41].
3.2.3. Meteorological Data
As the major aim for ventilation studies is typically urban heat island mitigation and pollution dispersion, the necessity of background wind data is typically a secondary concern [42]. Studies have illustrated spatial and statistical correlations, establishing a clear relation between urban morphological parameters and particular planning objectives like temperature reduction. As such, these findings were achieved without employing empirical meteorological data, choosing instead to base their research on general wind pattern [43,44,45]. On the other hand, owing to the logarithmic wind law, areas with minimal surface roughness, whether in open spaces or on elevated structures, are most optimal for wind energy harvesting. Accordingly, the spatial modelling of urban wind speed using the morphometric approach emphasizes the detail simulation at the hub height or roof heights of most buildings, thereby placing a higher demand on the quality and resolutions of the spatial and meteorological datasets [46,47].
Wind flow characteristics in urban areas are governed by two types of flow characteristics: buoyancy-driven and external-wind-driven. Typically, the change in air temperature in a street canyon determines the course of buoyancy-driven winds. In the context of urban-scale studies, the buoyancy forces’ effect on wind speed and direction is far less significant than that of external wind sources.
External wind originates from various sources, including synoptic wind and sea and mountain breeze. The synoptic wind is characterized by its large-scale meteorological presence, prevailing dominantly during specific seasons. In proximity to water bodies, temperature disparities between land and water give rise to sea, river, or lake breezes. Adjacent to mountainous terrains, mountain winds emerge in response to temperature variations between hilltops and valleys.
As shown in Figure 5, meteorological data are gathered and presented in a variety of forms, depending on the scope of studies. Local station measurements (n = 17), general wind direction (n = 11), and a mesoscale meteorological model (n = 7) are examples of data collection methods included in these selected articles. Local station measurements are categorized based either on data supplied by a local meteorological department or data gathered from stationary anemometers in specified sites. Airports are frequently utilized as a reference point in research, primarily because data are continuously recorded throughout the year [48,49]. In the absence of an actual meteorological reference, the general prevailing wind direction is utilized in studies. Wind directions are generalized depending on the scope of the study. For instance, Tong et al. [45] used computed morphological parameters based on eight different directions for the assessment of fluid flows, since they were extensively employed in hydrology studies. Chen et al. [50] only computed the wind environment in one direction, presuming that the only significant external wind in the study area was the sea breeze.
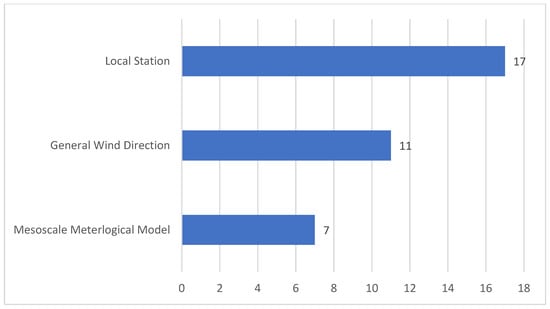
Figure 5.
Source of meteorological data.
Large-scale background meteorological conditions are simulated numerically using mesoscale meteorological models. The Weather Research and Forecasting (WRF) model and Fifth-Generation Penn State/NCAR Mesoscale Model (MM5) are among the most common models [28,51]. These models need meteorology bureaus’ long-term meteorological data. These models are used in conjunction with the urban-scale canopy model to reflect the effect of diverse urban surfaces on meteorological variables, allowing for the observation at a full scale of all potential wind directions and speeds in cities. However, the model’s resolution is often more than 1 km and cannot reflect the influence of morphological factors on wind speeds and directions at the lower urban canopy layer [28]. Typically, the model is employed as a guidance for prevailing wind direction in morphometric calculation and post-assessment validation [31,52]. Beyond just accounting for wind direction, the wind speed in a coarse grid can be further refined through the imposition of wind velocity boundary conditions, which are derived from the vertical wind profile characteristic of the urban boundary layer [46].
3.2.4. Morphological Parameters
As forementioned, and , which link the features of the urban surface to flow profiles in the lower part of the atmospheric layer, are well established from a theoretical perspective. These parameters serve as fundamental connectors between surface characteristics and atmospheric conditions. Numerous models designed to compute these aerodynamic parameters have been developed [46,48]. Central to each approach is the utilization of a succinct mathematical model to derive the aerodynamic values from morphological parameters [36]. This necessitates the additional processing of source data for the morphological parameters [29,53]. At the urban scale, these parameters are spatially aggregated into predefined grids with index-like values. Morphological parameters in the selected articles are listed in Table 2. Building heights are essential in calculating both and ; to distinguish the parameters used by different articles, building height is excluded in this section and Appendix A, Table A1.
Table 2.
Morphological parameters in reviewed studies.
Most of the selected articles (n = 30) used the Frontal Area Index (FAI), Frontal Area Ratio (FAR), or Frontal Area Density (FAD) as its primary morphological parameters. The three indices are different names representing the frontal areas of building oversite areas. Ng et al. [28] demonstrated a robust correlation between FAI and pedestrian-level wind velocities when normalized by reference height wind velocity, commonly referred to as the wind velocity ratio. Based on this, FAI values computed in GISs can serve as effective tools for assessing the wind environment within urban canyons, especially in spatially heterogeneous urban areas [37,38,54].
The calculation of frontal areas is the most frequently employed morphological metric for evaluating roughness length. Beyond computing the frontal area in a unidirectional context, wind direction is also assessed, given its three-dimensional nature. The method of computation has been adjusted to accommodate varied geographical conditions. Wong et al. [37] modified the Frontal Area Index (FAI) computation technique by excluding areas obstructed by front-facing structures on the leeward sides of buildings. In scenarios where wind flow only reaches the first facet and not the second, only the first facet is included in the calculation. The significance of the height of topographical features, particularly in relation to high-rise buildings, cannot be neglected in cities situated in hilly or mountainous regions. Chen et al. [55] proposed incorporating topography into the frontal area, defining it as the cumulative projected area of both buildings and hills oriented towards the wind. Guo et al. [56] further adapted this by conceptualizing the entire landscape, comprising all buildings, vegetation, and topographical elements, as a single obstacle cluster. In a divergence from these methods, Yuan et al.’s [38] point-based FAI calculation technique incorporates a distance index to analyze the varying impacts of individual structures on wind velocity at a specific location.
Site Coverage (SC), Ground Coverage Ratio (GCR), Plan Area Ratio (PAR), and Plan Area Index (PAI) all describe the extent to which artificial structures cover the ground (n = 14). However, although SC and GCR may encompass parking lots and other structures, PAR and PAI quantify the building footprint inside a particular area. All criteria may be utilized to characterize the intensity of building development. In urban aerodynamics, PAR and PAI have been utilized for the direct calculation of [49,57,58]. GCR was offered as an alternative to FAI as it indicates podium-/street-level wind permeability. It has been observed that SC and GCR are frequently associated with a high Frontal Area Density [59].
In addition to frontal and plan area, Sky View Factor (SVF) is commonly utilized as an indicator for heat accumulation measurement in UHI assessment, but it may also be utilized as an indicator for relative surface openness. SVF can apparently predict wind permeability in certain situations, according to studies [30,59,60]. Other morphological indices include Street Canyon Density, Density of Tall Vegetation Areas, Gross Floor Area Ratio, and Height Variability [61].
3.2.5. Model Validation
The morphometric approach, which employs algorithms to link aerodynamic parameters with morphometric surface features, necessitates laboratory validation [15]. The computation of aerodynamic parameters in urban morphometrics can often overlook the complex geometrical complexities inherent to real-world urban areas, such as irregular building arrangements and varying heights. Such oversights can lead to notable uncertainties in the modelling outcomes. While research has consistently identified a connection between local morphological parameters and an area’s wind environment, the parameterization of urban form can merely suggest the likelihood of specific flow characteristics. Essentially, this index offers an approximation of flow dynamics within urban canyons. Moreover, validation is needed to accurately assess the precision and reliability of these models, ensuring their real-world applicability in urban wind pattern analysis.
In total, 17 out of 34 morphometric studies validated their models. Most studies rely mostly on field measurements or CFD simulations. Typically, field measurements (n = 6) were undertaken in a campaign-style approach, in which field personnel recorded wind flow direction and speed in specified locations of interest over a given time period. Chen and Ng [27] utilized a mobile meteorological station for wind speed and air temperature readings. The results were utilized to validate the wind dynamic and urban climatic map’s functionality. In addition to using meteorological station data for field measurements, one can also utilize meteorological station data for field measurements. Drew et al. [48] used data from local meteorological stations to validate their modelling predictions. Their methodology predicts the yearly mean wind speed to be within one standard deviation of the figure measured in the field. However, the two stations are located in airports and near the study area’s periphery.
Validation studies can benefit from CFD’s ability (n = 6) to provide insights on the appropriate measurement locations for a full assessment and full field data, whereas field studies can only acquire isolated measurements. The results could be utilized to perform a spatially weighted regression against GIS-based wind models [62]. Nevertheless, field measurements and CFD simulations are highly complementary. For example, Guo et al. [56] used both techniques to validate their model, as field measurements can provide important data for the validation of CFD simulation, which is a necessary step for ensuring the accuracy of the computational results.
3.2.6. Wind Environment Assessment
Within GIS platforms, the combination of meteorological and morphological data results in a map that depicts the spatial wind environment of an urban area. For ventilation studies, the primary subject can be separated into two distinct objectives. These mapping data are predominantly employed for (a) broad-scale estimations of the wind environment predicated on morphological parameters (n = 9) and (b) identifying ventilation corridors for the dispersion of heat and pollutants (n = 20). In contrast, when addressing wind energy, the studies concentrate on wind speed assessments and the identification of potential zones for wind turbine installation. This section focuses on methods regarding ventilation.
The general estimation of the wind environment refers to the association between morphological parameters and wind speed within the urban canyon. By computing morphological parameters, grid areas can be classified in GISs as a simple value to reflect the general ventilation capacity of an area [38,63]. The value can be used in combination with temperature data to indicate an urban area’s resilience and mitigation potential of urban heat island effects [39,54,64]. The capacity can also be employed as an indicator for pollution dispersion capacity [58,61].
The notion of a “ventilation corridor” originated in German cities, where a collaborative effort between urban climatologists and planners was undertaken to assess patterns of airflow distribution. The objective was to identify potential pathways capable of channeling fresh air from adjacent hills into the urban core [63]. These corridors can be formed through the strategic placement of buildings, open space, and natural or artificial canyons and valleys. Based on morphological factors and meteorological conditions, the spatial distribution of ventilation corridors can be analyzed using either rule-based or least-cost path (LCP) methods [62]. These methods are intuitive, widely utilized, and share a common premise. Higher FAI and PAD, for example, are associated with lower wind speed, supposing that morphological parameters are related to climatic performance [59]. Consequently, airflow tends to follow the path of least wind resistance, enabling the formulation of a linear correlation between morphological parameters and meteorological data. This relationship facilitates the identification of ventilation corridors as spatially continuous features. Although the LCP method can dynamically analyze ventilation corridors of the urban canopy in response to changes in wind direction, it is dependent on GIS software functionalities that can only predict a wind flow through a city from a single starting point to a single ending point [26,50].
Morphological parameters used in rule-based or LCP-based studies have seen various refinements and adaptations over time. On the other hand, Yuan and Ng [63] divided FAI into four distinct classes to compute urban wind permeability and potential ventilation paths. Based on FAI and PAR, Suder and Szymanowski [57] calculated city-wide using FAI and PAR as a spatial indicator for ventilation corridor detection. In later studies, a number of morphological indices derived from the aforementioned criteria were created.
Grunwald et al. [30] calculated a cold air layer index based on building heights and weather conditions; the index layer was coupled with the land use layer to identify ventilation corridors. Tong et al. [45] formulated a coverage rate coefficient, drawing from building elevations and land use differences. Their approach leaned on hydrological principles and considered wind flow in line with the raster-based resistance index. Qiao et al. [65], for instance, established a wind resistance coefficient index based on the mean building heights of selected grids for the identification of ventilation corridors. Two morphological indices for LCP computation were developed using spatial regression between climatic and morphological characteristics by Liu et al. [66] and Fang and Zhao [60].
The primary issue with rule-based and LCP-based ventilation corridor detection is that they are unable to effectively identify ventilation corridor variations in complex urban environments because they can only generate limited ventilation corridor paths. To counter this, Xie et al. [43] proposed an electric-current-based approach. Upon encountering a branch in the model, it is postulated that the airflow disperses in accordance with the branch’s ventilation capacity. The present value serves as an indicator of the probability that wind will traverse through each respective branch, while the conductivity value embodies the branch’s ventilation capability. The outcomes of the simulation are expressed through probabilistic metrics, with numerical values denoting each branch’s potential for ventilation. In a follow-up study, the ventilation condition value was standardized using Neighborhood Components Analysis, a machine learning technique [62].
3.3. Urban Climate Mapping
3.3.1. Urban Climate Mapping and Wind Morphometrical Studies
Before delving further into the discourse on urban climate mapping studies, it is crucial to explain the difference between wind morphometric studies and urban climate mapping studies. Figure 6 and Table 3 outline the general similarities and differences between the two. Wind morphometric studies represent a singular part of research in the broader realm of urban climate studies, with their primary objective being the quantification and characterization of urban morphology in relation to wind flow patterns, as well as application in wind energy generation. In comparison, urban climate mapping follows a layered approach and spans a wide and interdisciplinary spectrum, encompassing issues of the urban microclimate, from urban heat islands and thermal comfort to air quality. In addition, urban wind environments are not solely dependent upon broader classifications like land use and coverage; they are also strongly dependent on building arrangements, architectural and topographical details, and other structural elements. Considering this breadth of complexity, it is understandable that not all urban climate mapping studies would include explicit wind considerations. As such, it is sensible that urban climate mapping studies constitute a minority of the shortlisted results, with a particular concentration on urban ventilation (n = 16). Appendix A, Table A3, provides a summary of the referenced articles.
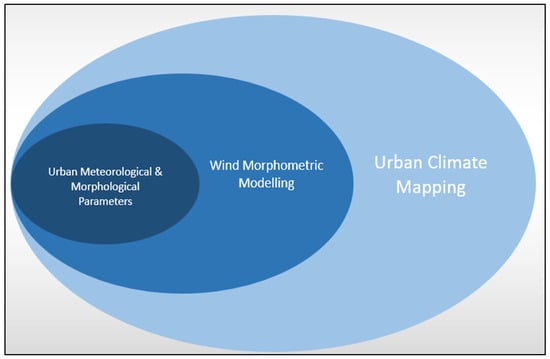
Figure 6.
Morphometrical modelling and climate mapping relationship.
Table 3.
Differences and similarities between the two categories.
Fundamentally, both the morphometric technique and the urban climate mapping share the same theoretical underpinning. This foundational theory delves into the interplay between surface roughness and wind velocity within the urban canopy. Consequently, leveraging land cover and elevation data makes the actual spatial distribution of wind speed discernible [51].
3.3.2. Urban Climate Mapping Methods
In mapping studies, a common method is to substitute all varying parameters with a comprehensive land use type. This approach streamlines the process by allocating predefined values to distinct morphological features based on urban archetypes, such as water bodies or building height and density. Such a unified handling of urban components eliminates the need for complex morphological computations or meteorological data inputs. Consequently, the derived urban archetype, grounded in a rule-based classification scheme, establishes a direct correlation with the wind environment [67,68].
The subdivision of a large urban region into smaller sections or designing climatopes is one technique to make these distribution functions applicable [69]. Climatopes are areas with specific climatic performance with a spatial range of several tens to hundreds of meters. In the case of wind environment, “ventilation class” climatopes have been used to define areas with varying wind speed capacities [70]. Rather than using computed morphological parameters, the ventilation climatopes are determined using predefined roughness length [52,71].
The local climate zone (LCZ) is a similar concept, albeit it is utilized more frequently in urban heat island analyses. The LCZ classification categorizes sites of interest based on the attributes of their urban form typology [72,73]. In the case of wind environments, the LCZ is typically employed or modified to subdivide metropolitan regions into urban archetypes for additional investigation. Zheng et al. [74] subdivided the study region based on the classification of the local climate zone (LCZ). The divided land parcel was used to display the spatial distribution of normalized wind speed and provide information on the built environment. Using the LCZ to classify metropolitan areas, Yang et al. [75] discovered that the effects of wind and accompanying temperature varied between zones. Brousse et al. [76] developed a modified LCZ to distinguish area cover based solely on built-up area. The generated urban canopy was used as an input for WRF wind speed prediction at an urban scale. He et al. [77] proposed a precinct ventilation zone concept that defines urban archetypes according to a combination of compactness, building height, and street structure.
Based on the classification of urban archetypes, an aggregated urban climate map can be produced. A UCM is a type of map that provides climate information for a city. Temperature, precipitation, humidity, and wind speed and direction, as well as land use, population density, and building height, are typically depicted on these maps [78,79]. The UCM serves as a valuable instrument for the evaluation and assessment of the urban climatic landscape. Utilizing a two-dimensional spatial representation, the UCM highlights climate-related urban phenomena and prevailing issues [52].
Both morphometric models and urban climate maps require both meteorological and spatial data for development. However, the process has evolved in accordance with the scope of various studies. Han et al. [80] analyzed building heights and density in addition to land use types to determine pollutant flow patterns. In conjunction with data on pollutant concentration, their findings indicated that ventilation corridors could contribute to an increase in pollutant concentration in certain areas. Sasaki et al. [31] utilized wind speed, temperature distribution, building heights, and local terrain to develop a climate map that illustrates the effects of sea breeze. If several field measurement locations and a continuous time period are supplied, wind speed data can be assigned to grids via spatial interpolation [74]. Accordingly, by utilizing multi-criteria analysis, the resulting data on wind speed are used to create a UCM for urban planning purposes [79,81].
4. Discussion
Wind has historically been acknowledged as an integral factor in the planning and design of the urban built environment. Most research concerning the impact of wind within urban settings relies on small-scale models such as CFD and physical models, aiming to forecast air movements around individual structures or clusters of buildings. Conversely, spatial analysis of urban form combines with meteorological data to facilitate broader, city-wide wind environment examination.
Nonetheless, no review studies have specifically focused on this approach. This review aims to fill this gap by consolidating urban-scale wind modelling and providing an overview of the theoretical, methodological, and application aspects of 51 reviewed articles. Through this review, notable challenges have arisen for both wind morphometric and climate mapping methods. Importantly, it is imperative to recognize that these challenges are not confined to a singular method; they undeniably share substantial parallels. These parallels manifest in the definition of spatial units, the availability and uncertainty of data, and the need for robust theoretical underpinning. On the other hand, when it comes to their application in the realms of urban planning and design, both methods encounter similar sets of challenges. In conjunction with these challenges, both methods have promising opportunities for future research.
4.1. Methodological Challenges for Morphometric and Climate Mapping
The first challenge in the reviewed articles lies in the definition of spatial units. Articles typically incorporate a step to define spatial units, breaking down an urban area into smaller segments, followed by a post-processing phase to amalgamate these classified sections. At its core, the morphometric method functions as a spatial classification technique based on parameter values. Given the nature of this process, ensuring accuracy and detail becomes problematic, particularly in complex urban landscapes, such as high-density areas and mixed natural environment combinations of blue and green spaces [82].
For example, take the prevalent use of 100 m uniform grids. This approach, routinely employed in morphometric studies, offers simplicity but can overlook the complex influence of urban structures on general airflow, thus often failing to capture general wind conditions in their prescribed area [83]. This deficiency has given rise to a proliferation of fragmented methodologies and subsequent data processing techniques, adding to the complexity of achieving precise definitions and classifications tailored to specific locales. This challenge is relevant not only to studies focused on wind morphometrics studies but also extends to broader studies aimed at mapping climatic conditions.
The second challenge pertains to the robustness of the theoretical foundation. The approaches used in calculating morphological parameters and defining climatopes exhibit significant diversity, as discussed in previous sections. For instance, the computation of and , which is crucial for deriving wind speed profiles, is far from straightforward and continues to present ongoing challenges. Multiple methods are available for determining aerodynamic roughness, with the morphometric approach relying on empirical equations.
Notably, there are two well-known morphometric formulas—one assuming homogeneous roughness elements and the other considering height variations [34]. However, the results derived from these equations for wind speed computation have demonstrated inconsistency in empirical evaluations. Consequently, there is a notable absence of a single, well-defined, and consistently accurate morphometric approach for assessing the urban wind profile above the urban canopy [36]. Owing to this constraint, the computed “wind pattern”, whether intended for pedestrian comfort or wind energy harvesting, remains an estimated representation of the actual wind velocity at the specified site.
Conversely, drawing VCs and climatopes heavily relies on localized knowledge. In contrast to the LCZ framework, which has undergone standardization and is supported by vigorous theoretical examinations and extensive empirical validations, VCs and climatopes are shaped by the expertise of individuals familiar with local geography and climate in specific cities [84]. Frequently, these definitions lack empirical evidence and validation studies to substantiate their validity and applicability, as shown by the lack of validation in the reviewed papers.
The third challenge is related to the availability and uncertainty of data. While the growing availability of urban datasets, especially in the GIS format, has simplified estimations, finer-scale analyses still face obstacles [85]. Detailed information on tree and plant heights is largely absent, and in some instances, not all buildings have available height data. Of the studies reviewed, only a few leveraged large-scale meteorological models or long-term field measurements to support their modelling. Most were contingent on the accessibility of local meteorological data, which were often sourced from distant locations like airports. On the other hand, in densely built environments, field measurement results could be affected by nearby structures or activities [86]. This limitation potentially compromises the accuracy of the findings.
Temporal variation introduces another layer of complexity. Urban areas, especially in developing countries, are rapidly evolving. Capturing subtle variations in spatial changes requires high-resolution datasets [87]. The interplay of shifting climate conditions heightened urban heat island effects, and escalating pollution due to urban expansion underscores the importance of sustained, long-term meteorological data collection at sites of interest. However, maintaining and updating both spatial and meteorological datasets can be both time- and resource-intensive [85].
4.2. Challenges of Application in Urban Planning and Design
The challenges associated with the application of both morphometric wind modelling and urban climate mapping in urban planning and design are inherently distinct, driven by their distinct objectives.
Morphometric methods are primarily tailored for the singular purpose of assessing urban ventilation and wind energy potential. However, urban development is a multifaceted process involving various stakeholders, each with divergent concerns and performance criteria that often clash [88]. The efficacy of the morphometric wind modelling method in facilitating effective communication and negotiation among these stakeholders remains ambiguous. Stakeholders may rightfully question the feasibility of such interventions, particularly in cities where winds are sporadic or variable.
While urban wind energy generation holds the promise of fostering cities’ energy independence, it currently resides in a niche domain that demands substantial advancements in both theory and practical application. The skepticism arises from the inherent challenges posed by the turbulent nature of urban wind patterns, which cast doubt on the efficiency of wind energy systems within densely developed urban landscapes. Moreover, the crucial aspects of social acceptance and regulatory frameworks, particularly those related to mitigating noise and turbulence, require meticulous attention and can be time-consuming to establish [89].
When it comes to creating ventilation corridors, the implementation of long-term measures for enhancing airflow often involves making choices between either restricting high-density development in specific areas or demolishing existing obstructing structures. The former approach can clash with the potential economic benefits tied to land development, while the latter may trigger significant social and political upheaval and opposition [24]. These hurdles have the potential to hinder the practical application of the findings from wind morphometric studies in the realm of urban planning and policies aimed at promoting wind-related urban improvements.
Urban climate mapping faces a challenge when it comes to aligning with existing zoning systems and urban design guidelines due to the fundamental disparity between the parameters used for classification in urban climate maps and those employed by traditional zoning and design regulations. In many urban areas, zoning systems and design guidelines rely on established morphological parameters that are often centered around land use, building height, or zoning categories. These parameters are typically aimed at addressing issues such as land allocation, infrastructure planning, and land use restriction [90]. Conversely, urban climate maps are driven by a different set of parameters that focus primarily on climatic considerations, including factors like temperature variations, wind patterns, and microclimatic conditions. This misalignment raises questions about how urban development can effectively adhere to both sets of criteria simultaneously. The conflict arising from the prioritization of building and land use rules in traditional guidelines, in contrast to the emphasis on climate considerations within urban climate mapping, presents significant complexities for urban planners and policymakers [88]. Consequently, future policy innovation becomes imperative.
4.3. Opportunities for Sustainable Urban Development Planning
At its core, sustainable urban development (SUD) involves the strategic arrangement and management of land use, infrastructure, and services within urban areas, focusing on how spaces are created and used [91]. Integral to this is spatial planning and the gathering and analysis of urban data. The success of such planning hinges on the accuracy and completeness of these data, underscoring their importance in underpinning effective SUD strategies.
As seen in the emphasis on wind morphometric and urban climate mapping studies, a paradigm shift towards evidence-based approaches is evident. These methods are pivotal in making informed, data-driven decisions to align development with specific environmental performance goals. Concurrently, the field is experiencing the emergence of novel opportunities, particularly in the enhanced accessibility of descriptive urban data. These data, encompassing critical components such as urban form and land use, are instrumental in addressing the data precision and implementation challenges previously identified.
The collection of urban data through crowdsourcing methods, like those employed by the Open Street Map (OSM) community, or the WUAPT initiative has significantly aided climate change research [92]. Such data resources enable researchers to execute more rigorous analyses, thereby enhancing the validity of their mapping outcomes [85]. Studies have shown that there have been increased efforts to improve the resolution of remote sensing data that allow researchers to build 3D models for analysis [93]. Yet, it is essential that these data maintain consistency in both their content and quality. Ensuring this uniformity would streamline the creation of generic urban data, paving the way for advanced high-resolution urban climate modelling in cities worldwide.
The advent of the Internet of Things (IoT) offers a distinctive advantage. Through a dense array of interconnected sensors deployed across a target area, it is possible to gather real-time data on airflow patterns [94]. Such rich and continuously updated data transform wind environment assessments from static to dynamic ones, mirroring the actual fluctuating conditions of wind in urban areas. Meanwhile, machine learning (ML) techniques, as evidenced in numerous studies, enable the forecasting of airflow patterns within congested street networks where traditional field measurements might be challenging [95,96]. Furthermore, advancements in artificial intelligence (AI) and its integration with GIS platforms can produce more detailed and interactive maps. This can lead to better visualization tools, aiding in the effective communication of complex climate data to non-experts. As urban planning often involves multiple stakeholders, having clear, interactive, and easily understandable visual tools can facilitate more informed decision-making, thereby solving the communication problems [97,98,99,100,101].
5. Conclusions
The significance of wind in sustainable urban environments, both as a renewable energy source and a key factor in urban air quality and thermal comfort, is well recognized. This growing importance underscores the need for robust and comprehensive modelling techniques to understand its characteristics across different urban forms. This paper aims to consolidate the understanding of spatial modelling approaches to wind characteristics in cities by conducting a systematic literature review with the PRISMA protocol to capture recent developments, as well as challenges and opportunities.
The main finding of this paper is as follows: First, the reviewed articles can be categorized under two approaches: (a) studies adopting the wind morphometric approach, encompassing theoretical foundations, input factors, and computation methods and (b) studies adopting the urban climate mapping approach, centering on the amalgamation of wind with urban microclimate analysis. The approach shares a common theoretical foundation and utilizes similar data but diverges in terms of scope and methods.
Wind morphometric and urban climate mapping methods, as revealed by this systematic review, offer an attractive combination of simplicity and interpretability, rendering them accessible and practical for urban planners and policymakers. Essentially, both are alternative approaches when dealing with the deficiency in reduced-scale models and CFD simulations. Their potential is particularly noteworthy when it comes to rapid analyses and preliminary assessments. Furthermore, by deploying spatial modelling, there is an opportunity to integrate wind morphometric methodologies with broader GIS platforms, potentially aiding in urban microclimate studies and environmental assessments at varying scales.
Second, the findings suggest that wind morphometric and urban climate mapping methodologies hold considerable promise due to their straightforward calculations and interpretability. Nonetheless, issues related to theoretical robustness, data precision, and accuracy challenge the validity of these models. As urban environments become more intricate and heterogeneous, the fidelity and the validation of morphometric models must advance in tandem. Overcoming these limitations will require an interdisciplinary approach, combining insights from urban planning and design, urban climatology, and engineering disciplines.
In sum, while the wind morphometric modelling approach holds significant promise for large-scale spatial analyses of urban wind environments, it is essential for researchers and practitioners to be aware of its limitations. The method serves as a rough approximation of the real wind velocity at the target location. A combination of innovative data sourcing, validation strategies, technological advancement, and interdisciplinary collaboration will be pivotal in pushing the boundaries of this field.
It is important to acknowledge the inherent limitation of the review methodology. Restricting the review to articles published in English and available as a full text online might exclude relevant research documented in other languages or formats. The results may also be limited by the predefined search strings and criteria. This approach may inadvertently exclude studies that use different terminologies or concepts that are relevant but not directly aligned with the chosen search terms.
Future research could delve into the integration of high-resolution data to enhance the accuracy of wind morphometric modelling. In addition, further studies on the impact of urban morphological parameters on microscale wind patterns are needed. Such studies would not only refine our understanding of wind behavior in densely built environments but also improve the predictive capabilities of current models, enabling more effective urban planning and design strategies that are responsive to wind conditions.
As the world moves forward in the quest for sustainable urban environments, the role of wind, both as an energy resource and an environmental parameter, will only grow in significance. The advancements and insights in this area, as outlined in this study, are a testament to the increasing importance of wind in the academic and practical spheres of urban planning and development.
Lastly, this study hopes to provide urban planners and designers with tools for assessing and integrating wind elements into their practices. This is crucial for creating sustainable urban environments. Applying these insights will lead to better-planned, more resilient cities that harmoniously balance human needs with environmental considerations, ultimately contributing to healthier societies and a more sustainable planet.
Author Contributions
Y.-S.L.: data collection, processing, investigation, analysis, and writing—original draft; T.Y., M.G., K.D. and A.L.: supervision, conceptualization, writing—review and editing. All authors have read and agreed to the published version of the manuscript.
Funding
This research received no external funding.
Data Availability Statement
Not applicable.
Acknowledgments
The authors thank the editor and anonymous referees for their invaluable comments on an earlier version of this manuscript.
Conflicts of Interest
The authors declare no conflicts of interest.
Appendix A
Table A1.
Acronyms used.
Table A1.
Acronyms used.
| Acronym | Full Name | Definition |
|---|---|---|
| FAI | Frontal Area Index | Same calculation method, different name =(total frontal area of buildings of windward direction)/(site area) |
| FAD | Frontal Area Density | |
| FAR | Frontal Area Ratio | |
| SVF | Sky View Factor | Fraction of visible sky =cos (arctan [Height/0.5 Width]) |
| SC | Site Coverage | Same calculation method, different name =(total plan area of the buildings)/(total site area) |
| GCR | Ground Coverage Ratio | |
| PAR | Plan Area Ratio | |
| PAI | Plan Area Index | |
| DEM | Digital Elevation Model | Based on LiDAR remote sensing which measures all the vertical features as well as topography |
| LCP | Least-cost path | The function within GIS software that calculates the minimum-cost distance between various points and considers both the actual distance covered and the associated traversal costs |
| PET | Physiological equivalent temperature | Measure the thermal comfort of an individual in a given situation by comparing physiological responses |
| RL | Roughness length Z0 | Numerical index that represents the roughness of an object; the higher the value, the higher the roughness; logarithmic calculation with various methods |
| Zd | Zero-plane displacement | |
| VC | Ventilation corridor | General expression for all other similar terms, e.g., ventilation path, ventilation lane, etc. |
| LCZ | Local Climate Zone | Mapping term that describes the general typology of a homogenous urban area |
| WUDAPT | World Urban Database and Access Portal Tools | To compile data on urban morphology and functionality on a global scale to support urban weather, climate, hydrology, and air quality modelling |
Table A2.
Review table for morphometric wind modelling.
Table A2.
Review table for morphometric wind modelling.
| Authors | Title | Country and Region | Spatial Data Source | BSU (Basic Spatial Unit) | Planning Focus | Meteorological Information | Computational Morphological Parameters | Validation | Aim | Relevance |
|---|---|---|---|---|---|---|---|---|---|---|
| Gál and Unger (2009) [29] | Detection of ventilation paths using high-resolution roughness parameter mapping in a large urban area | Hungary | Building dataset | Voronoi polygon | Ventilation | Local station | PAR, FAR | N/A | Visualized RL in raster at urban scale to determine wind environment | Rule-based; Voronoi polygon is calculated using Avenue script in ArcView; porosity calculated using mean height and volume; the method is suitable for areas with low building density |
| Wong et al. (2010) [37] | A simple method for designation of urban ventilation corridors and its application to urban heat island analysis | Hong Kong | 3D building and land use dataset | 100 m | Ventilation | General wind direction | FAI | Field measurements | Use Frontal Area Index (FAI) to map urban ventilation corridors | FAI was calculated for 8 different wind directions; ventilation pathway identification using LCP method; regression shows better correlation relation between FAI and HII at lower resolution |
| Wong et al. (2011) [53] | A study of the “wall effect” caused by proliferation of high-rise buildings using GIS techniques | Hong Kong | 3D building and land use dataset | 100 m | Ventilation | General wind direction | FAI | Field measurements | Outlines an approach that employs GIS to examine the “Wall effect” induced by tall structures | FAI was calculated for 8 different wind directions; VC located using LCP; wind speed greatly reduced behind tall buildings in target area |
| Badach et al. (2020) [61] | A framework for Air Quality Management Zones–-Useful GIS-based tool for urban planning: Case studies in Antwerp and Gdańsk | Poland, Belgium | Land use | 200 m | Ventilation | Local station | PAD, FAR, Street Canyon Density, Tall Vegetation Area Density, Gross Floor Area Ratio, Height Variability | N/A | Identify zones for managing air quality, considering local climatic, wind, and topographical conditions | Rule-based; urban form maps indicate the capacity of local pollutant mitigation, which are suitable from preliminary planning strategy formulation for air quality management |
| Cariolet et al. (2018) [58] | Assessing the resilience of urban areas to traffic-related air pollution: Application in Greater Paris | France | Building dataset | 500 m | Ventilation | General wind direction | FAI, PAI | N/A | Evaluate the capacity of an urban area to withstand air pollution, considering its urban form | Three resilience capacities have been identified; smaller grid size is suggested for more accurate ventilation estimation |
| Morano et al. (2017) [49] | GIS application and econometric analysis for the verification of the financial feasibility of roof-top wind turbines in the city of Bari (Italy) | Italy | Building dataset | 100 m | Wind energy | Local station | PAD, FAD | N/A | Examine the economic viability of installing wind turbines on rooftops and assess the correlations between aerodynamic parameters in the urban context and the financial aspects of the investment | Morphological parameters were used to assess annual city-wide wind speed and corresponding energy production performance, based on airport wind data; RL and PAD most relevant to energy production output |
| Chen et al. (2011) [27] | Quantitative urban climate mapping based on a geographical database: a simulation approach using Hong Kong as a case study | Hong Kong | Building dataset, DEM | 100 m | Ventilation | General wind direction | FAR, SVR, SC | Field measurement | Introduce a simulation methodology based on GIS to assess the urban climate | Rule-based; wind dynamics map can be derived based on FAD and SVF heat intensity classification; FAR/SC cannot accurately simulate aerodynamics in comparison with FAD; point-selected field measurement using PET validated results with certain discrepancy |
| Luo et al. (2021) [44] | Suitability of human settlements in mountainous areas from the perspective of ventilation: A case study of the main urban area of Chongqing | China | DSM land use map | 100 m | Ventilation | Local station | FAI | N/A | Analyze suitability of urban development base on vector and raster data | Rule-based; multi-criteria weighted analysis using regressed value performed against population distribution; FAI used in conjunction with surface temperature and land use index to determine suitability |
| Liu et al. (2022) [41] | Detection of wind corridors based on “Climatopes”: a study in central Ji’nan | China | Building dataset | 25 m | Ventilation | Local station | SVF, FAD | N/A | Use novel index to produce wind corridor map based on climatopes | Rule-based approach; ventilation potential coefficient (RL/SVF) is presented; the higher the value, the lower the potential for ventilation; the coefficient has positive correlation with other UAP |
| Liu et al. (2020b) [49] | A preliminary study on the influence of Beijing urban spatial morphology on near-surface wind speed | China | Building vector | 500 m | Ventilation | Local station | FAR, SVF | N/A | Assess the effect of urban development on wind speeds at near-surface levels | Regression against wind speed shows FAR, FAI, and SVF are the most critical spatial morphological parameters for ventilation assessment |
| Yuan et al. (2014) [63] | GIS-based surface roughness evaluation in the urban planning system to improve the wind: environment—a study in Wuhan, China | China | Building dataset (height based on estimate) | 100 m | Ventilation | Local station | FAD | Wind tunnel | Illustrate urban wind permeability using surface roughness parameters within GIS environment | Rule-based; permeability is classified by three height bands and corresponding FAD; low permeability is associated with low wind speed in street canyon |
| Ng et al. (2011) [28] | Improving the wind environment in high-density cities by understanding urban morphology and surface roughness: A study in Hong Kong | Hong Kong | Building dataset | 200 m | Ventilation | Mesoscale meteorological model | FAD, GCR | CFD | Develop FAD map that illustrates surface roughness by taking into account wind flow at different height increments | Rule-based; wind speed at 0–15 m is well related to FAD at given reference height; GCR allows large-spatial-scale wind permeability analysis at the podium-/street level, between 0 and 15 m; more useful for planner |
| Hsieh and Huang (2016) [32] | Mitigating urban heat islands: A method to identify potential wind corridor for cooling and ventilation | Taiwan | Building dataset (height based on estimate) | 100 m | Ventilation | Local station | FAI | CFD | Use FAI as surface roughness indicator to identify VCs and validate using CFD | LCP method was utilized; CFD results confirm LCP method correctly predicted high wind velocity in an area at given height |
| Yuan et al. (2016) [38] | A modelling-mapping approach for fine-scale assessment of pedestrian-level wind in high-density cities | China | Building dataset | 1 m | Ventilation | Mesoscale meteorological model | FAD (point-specific) | Regression analysis | Resolve the issue of conventional morphological method in high-density environment and varied wind direction | Modelling that approximates FAD at certain points, thereby circumventing the need to calculate airflow between various roughness elements; in this model, airflow is conceptualized as air particles influenced by forces such as momentum transfer and drag; a distance index is incorporated to explore the unique impact of individual buildings on wind speed at specific target locations |
| Xie et al. (2020) [43] | A New method of simulating urban ventilation corridors using circuit theory | China | Building dataset (height based on estimate) | 100 m | Ventilation | General wind direction | FAI | N/A | Proposes an approach for VC identification based on circuit theory from the field of electrical engineering | Compared to LCP method, simulation results from circuit approach are represented by probabilistic value, with number indicating conditions; the method is also suitable for larger areas, since LCP only extracts paths with unidentifiable width and limited VCs given pre-set wind direction |
| Millward-Hopkins et al. (2013) [46] | Assessing the potential of urban wind energy in a major UK city using an analytical model | UK | Building dataset, DEM | 250 m | Wind energy | Mesoscale meteorological model | FAD, PAD | N/A | Locating viable urban wind energy sites using LiDAR-based DEM | A mast height was added; LiDAR-based DEM wind speed estimate shows higher accuracy compared to building with single height; logarithmic wind speed under RL calculated at specific height for better wind speed prediction; estimation results highly depend upon wind speed estimation |
| Drew et al. (2013) [48] | Estimating the potential yield of small wind turbines in urban areas: a case study for Greater London, UK | UK | Building dataset, DEM | 1000 m | Wind energy | Mesoscale meteorological model | FAR, PAR | Field measurement (station) | Performs logarithmic vertical wind profile estimation of wind energy potential using displacement height, derived from spatial morphological parameters | 1 km BSU is assumed to predict neighborhood level wind energy environment; logarithmic models can be effective in large-scale wind speed assessment with different wind direction |
| Adam et al. (2016) [47] | Methodologies for city-scale assessment of renewable energy generation potential to inform strategic energy infrastructure investment | UK | Building dataset, DEM | 250 m | Wind energy | Mesoscale meteorological model | FAI, PAR | N/A | Use spatial building parameters and logarithmic vertical wind profile to predict solar and wind energy production sites | Similar to Millward Hopkins but with lesser consideration of hub height in roughness calculation |
| Guo et al. (2018) [56] | Detection and evaluation of a ventilation path in a mountainous city for a sea breeze: The case of Dalian | China | Building dataset | 100 m | Ventilation | Local station | FAI | CFD and field measurement | Detect VCs for city under sea and mountain breeze | VC is identified using LCP method; FAI is computed with aggregated urban topography and the buildings on a hypothetical horizontal as an integrated obstacle to the sea breeze |
| Chen et al. (2016) [55] | A quantitative method to detect the ventilation paths in a mountainous urban city for urban planning: A case study in Guizhou, China | China | Building dataset | 100 m | Ventilation | Local station | FAI | CFD | Proposed an enhanced method for calculating FAI specifically tailored for cities in mountainous regions; in this approach, mountains are treated as significant obstacles that exhibit a wind-blocking effect | VC is identified for two directions using LCP method; complex terrain requires modification to FAI computation |
| Lv et al. (2022) [36] | An urban-scale method for building roofs available wind resource evaluation based on aerodynamic parameters of urban sublayer surfaces | China | Building dataset | 500 m | Wind energy | Local station | PAI, FAI | N/A | Identify and illustrate suitable building for wind energy production using urban aerodynamic computation within the GIS environment | Used a moving gird to calculate aerodynamics parameters of each building and building height; roughness calculation based on basic fluid principle shows best accuracy at urban scale |
| Grunwald et al. (2019) [30] | Mapping urban cold-air paths in a Central European city using numerical modelling and geospatial analysis | Germany | Building dataset, land use | 10 m | Ventilation | Mesoscale meteorological model | SVF | Field measurement | Introduced a method to identify ventilation paths which are low-roughness open areas that support cold-air transport from rural into urban areas | Building height and roughness length predetermined for each land use type in GIS; combine with mesoscale metrological model data, which are based on heat transfer theory and solve for ventilation pathway via identification of “cold air sources” |
| Peng et al. (2017) [26] | Modeling of urban wind ventilation using high resolution airborne LiDAR data | China | DEM | 10 m | Ventilation | General wind direction | FAI | CFD | Developed a GIS-based model for estimating the FAI of buildings, infrastructure, and vegetation using LiDAR data | FAI was calculated in GIS software using height data from DEM and 4 wind directions; LCP method was used to determine VC path |
| Qiao et al. (2017) [65] | Urban ventilation network model: A case study of the core zone of capital function in Beijing metropolitan area | China | Building dataset | N/A | Ventilation | Local station | Wind resistance coefficient | LST | An urban ventilation network model (UVNM) has been formulated to investigate the influence of urban form and building elevation on the condition of ventilation within the urban environment | Wind resistance coefficient calculated (deduced using fluid mechanic) using rule-based “control height”; LCP used to designate VCs based on online densities of 16 wind directions evaluated |
| Liu et al. (2022) [66] | Wind environment assessment and planning of urban natural: ventilation corridors using GIS: Shenzhen as a case study | China | Building vector, DEM, land use | 1000 m | Ventilation | Local station | FAD, road density | Mesoscale meteorological model | Developed an integrated air ventilation assessment index (IAVA) and assessed urban wind environment | Taking DEM, vegetation, road, and building coverage, and morphological parameters and using Pearson correlation to develop IAVA for LCP determination of VC path |
| Fang and Zhao (2022) [60] | Assessing the environmental benefits of urban ventilation corridors: a case study in Hefei, China | China | Building dataset | 500 m | Ventilation | Local station | FAI, SVF | N/A | A GIS model has been proposed, grounded in the Ventilation Resistance Coefficient (VRC); this model quantifies and compares environmental indicators across various corridor levels with the aim of understanding the environmental benefits thus created | FAI calculated based on 4 mean directions; LCP used for VC identification; SVF used as indicator for relative surface openness; VRC is based on RL/SVF; VC is determined by environmental indicators and has correlation |
| Ren et al. (2018) [51] | Creating breathing cities by adopting urban ventilation assessment and wind corridor plan: the implementation in Chinese cities | China | Building vector, DEM, land use | 1000 m | Ventilation | Mesoscale meteorological model | SVF, FAI | N/A | Review the urban VC plan in Chinese cities and present a case study to demonstrate local implementation of VC planning | Follows a three-step process: (a) urban planning data used for wind dynamics at pedestrian level, (b) GIS and remote sensing data used for morphology calculation and heat problem identification, and (c) climate information used WRF for background and surrounding rural wind environment analysis |
| Suder and Szymanowski (2013) [57] | Determination of Ventilation Channels in Urban Area: A Case Study of Wrocław (Poland) | Poland | DEM | Voronoi polygon | Ventilation | General wind direction | FAI, PAR | N/A | Based on LiDAR height data and morphometric methods of RL calculations, determines ventilation path in urban area | Rule-based VC identification; building heights are aggregated into groups; FAI calculated for 2 directions; ventilation paths lead to ventilation channels |
| Wicht et al. (2018) [40] | LiDAR-Based Approach for Urban Ventilation Corridors Mapping | Poland | DEM | Voronoi polygon | Ventilation | General wind direction | FAI, PAR | N/A | Compare an existing approach in mapping potential VCs with consideration of topography and vegetation | Rule-based VC identification, with low RL, Z0, and minimum width; used same porosity as Gál and Unger (2009) [29], which is deemed as a highly complex index; low-ventilation path detected in this article may indicate over-detection in articles that did not consider topography and vegetation; FAI calculated for 8 directions |
| Tong et al. (2021) [45] | Mapping the urban natural ventilation potential by hydrological simulation | China | DEM | 300 m | Ventilation | General wind direction | Coverage rate of wind corridor (CRW) | Mesoscale meteorological model | Map ventilation potential based on hydrological simulation through integrating terrain height data | Rule-based; urban parameter is ignored, using solely building height and LCZ classification; D8 algorithm used for cell computation; assume wind flow according to raster-based resistance CRW (coverage rate of wind corridor) computed using area of VC; better than LCP which assumes only one exit, and difference in wind speed does not reflect on ventilation |
| Xie et al. (2022) [62] | Urban scale ventilation analysis based on neighborhood normalized current model | China | Building dataset | 100 m | Ventilation | General wind direction | FAI | CFD | Enhanced method for identifying VCs, termed the neighborhood normalized current model | The proposed method reduced the subjectivity of the previous circuit theory results; using 16 wind directions; grids are assigned with rule-based value and computed using circuit theory |
| Acero et al. (2013) [39] | Deriving an Urban Climate Map in coastal areas with complex terrain in the Basque Country (Spain) | Spain | Building dataset, land use, DEM | 100 m | Ventilation | Local station | PAR, FAR | Field measurement | Computations involving spatial and climate information layers to assess the climatic dynamic of the urban area | 5 GIS layers were created: building volume, building surface fraction, green areas, ventilation paths, and slopes; field measurements are utilized to validate the weighting factors that integrate the GIS layer, and these factors are subsequently used to validate the mapping result |
| Zhang and Yuan (2023) [54] | Multi-scale climate-sensitive planning framework to mitigate urban heat island effect: A case study in Singapore | Singapore | Building dataset, land use, DEM | 200 m | Ventilation | Local station | FAD | N/A | Use wind morphometric and heat island intensity assessment to identify optimization scenarios for different land uses | Sky View Factors and local temperature data used to identify focus areas for wind permeability analysis using FAD; air paths are mapped and climate-sensitive design prototypes are proposed by considering land use pattern |
| Park et al. (2023) [64] | Mapping urban cool air connectivity in a megacity | South Korea | Building dataset, land use, DEM | 100 m | Ventilation | Local station | FAI | N/A | Suggest a new method for mapping the urban cooling effect using land use connectivity | Cooling potential and spread is calculated via the mono-scale model which requires every cell to be scored by the parametrization of sensible heat flux; FAI was used to calculate the resistance to cool air spread |
Table A3.
Review table for urban climate mapping.
Table A3.
Review table for urban climate mapping.
| Author | Title | Region | Aim | Relevance |
|---|---|---|---|---|
| Svensson et al. (2003) [68] | A geographical information system model for creating bioclimatic maps–examples from a high, mid-latitude city | Sweden | Air temperature and wind pattern are combined, considering factors such as land use, elevation, and proximity to the coast. These integrated maps are then associated with predetermined parameters. | Rule-Based. Produced large-scale bioclimate maps that illustrate physiological equivalent temperature values. Categorization of urban form can be further developed to improve accuracy. |
| He et al. (2019) [77] | Enhancing urban ventilation performance through the development of precinct ventilation zones: A case study based on the Greater Sydney, Australia | Australia | A technique was developed for the evaluation of precinct-level ventilation, aimed at characterizing the urban surface configurations for systematic investigation into the local ventilation performance within Sydney. | The concept of the precinct ventilation zone was formulated using three primary criteria: “compactness, building height, and street structure”. From this foundational concept, 20 distinct precinct ventilation zone types were derived. |
| Luo et al. (2017) [67] | Analysis of urban ventilation potential using rule-based modelling | China | Introduces a methodology capable of swiftly evaluating the urban ventilation potential across an entire city as well as its individual districts. This is achieved by amalgamating rule-based modelling techniques with the urban enclosure index. | The enclosure index represents the blockage of wind by height and width; the index is superimposed on the wind rose diagram to analyze ventilation potential. The urban model is generated in 3 dimensions. |
| Alcoforado et al. (2009) [71] | Application of climatic guidelines to urban planning: the example of Lisbon (Portugal) | Portugal | Combine remote sensing images and digital terrain model (DTM) to generate a climate map based on the concept of climatopes. | DTM was used to analyze ventilation capacity based on predefined RL and remote sensing image for building density. |
| Scherer et al. (1999) [69] | Improved concepts and methods in analysis and evaluation of the urban climate for optimizing urban planning processes | Switzerland | Introduce the concept of climatopes and conduct a case study to demonstrate it. | Climatopes, defined as ventilation classes, encapsulate the collective impact of terrain features and buildings on the wind field. These classifications are rooted in topographic data and surface attributes sourced from digital terrain models (DTMs) and land-use datasets. |
| Wang et al. (2018) [72] | Mapping the local climate zones of urban areas by GIS-based and WUDAPT methods: A case study of Hong Kong | Hong Kong | Compare local climate zone mapping using GIS data and World Urban Database and Access Portal Tools level 0 data. | Urban-scale weather and climate models can use WUDAPT level 0 data as spatial data input. On the other hand, the GIS-based technique detects more details than the WUDAPT method at the district level. But the WUDAPT method does a better job of classifying land cover types. |
| Ren et al. (2013) [79] | The application of urban climatic mapping to the urban planning of high-density cities: The case of Kaohsiung, Taiwan | Taiwan | Develop an urban climate map using land use and general meteorological condition. | Introduces a rapid, social–scientific approach for constructing UCM tailored for high-density cities. The method incorporates eight input layers and produces a final evaluation map. Additionally, climatic planning recommendations are formulated and integrated into a local urban planning framework. |
| Zhang et al. (2019) [73] | Measurement, normalisation and mapping of urban-scale wind environment in Xi’an, China | China | Introduces a hybrid measurement methodology for assessing the urban-scale wind environment, amalgamating data from both stationary reference stations and portable or mobile stations. This approach enhances the spatial resolution and comprehensiveness of wind data across the urban area. | LCZ used to divide land parcels of study area. Background station used as a reference for normalization. Impossible to determine the wind direction in a parcel. |
| Han et al. (2022) [80] | Urban ventilation corridors exacerbate air pollution in central urban areas: evidence from a Chinese city | China | Investigates the condition of air quality in cities typically plagued by smog to assess whether VCs exacerbate the problem of air pollution. The study subsequently proposes mitigative strategies to counter any adverse effects. | Analyzed building heights and density and land use types to identify pollutant flow channels. All morphological computations require a precise description of the site’s area, which is typically the size of a uniform grid or polygon. |
| Yang et al. (2019) [3] | Local climate zone ventilation and urban land surface temperatures: towards a performance-based and wind-sensitive planning proposal in megacities | China | Evaluates the influence of urban form on local surface temperatures under varying wind conditions. | Used LCZ to categorize urban areas and discovered that while seasonal variations influenced by wind direction were minimal, the same wind conditions had diverse effects on the surfaces of urban buildings across different climate zones. |
| Brousse et al. (2016) [76] | WUDAPT, an efficient land use producing data tool for mesoscale models? Integration of urban LCZ in WRF over Madrid | Spain | Examines the viability of utilizing WUDAPT data in the application of the Weather Research and Forecasting (WRF) model, which integrates both Building Effect Parameterization (BEP) and Building Energy Model (BEM) schemes. | The WRF model indicates that areas within the same UCZ can exhibit distinct microclimates based on their position within the city. This suggests that intra-urban climate variations are not solely determined by land use types but also by the interactions between neighborhoods and prevailing meteorological circulations. |
| Eum et al. (2013) [70] | Integrating urban climate into urban master plans using spatially distributed information—The Seoul example | South Korea | Evaluates the influence of urban forms on local surface temperature under varying wind conditions. | Develop a conceptual framework for analyzing, evaluating, and mapping climate information. Ventilation class is developed according to the climatope concept. |
| Ren et al. (2012) [52] | Urban Climate Map System for Dutch spatial planning | The Netherlands | Introduces the Urban Climate Map System (UCMS), an instrument for assisting densely populated cities in systematically incorporating climate considerations into urban planning processes. | Ventilation maps developed via predefined RL. |
| Sasaki et al. (2018) [31] | Sea breeze effect mapping for mitigating summer: urban warming: for making urban environmental: climate map of Yokohama and its surrounding area | Japan | Create a climate information map that indicates sea breeze and temperature distribution across different urban areas. | The wind distribution is analyzed using WRF based on basic urban canopy layer data. |
| Xu et al. (2020) [78] | Temporal and spatial variations of urban climate and derivation of an urban climate map for Xi’an, China | China | Documents the temporal and spatial fluctuations within the urban climate and presents an approach for crafting an urban climate map using spatial statistical analysis of field measurements. | Multi-criteria classification is performed using different layers of climate information, including normalized wind speed measurement. |
| Wang et al. (2022) [81] | Identifying urban ventilation corridors through quantitative analysis of ventilation potential and wind characteristics | China | Developed a method that merges Land Surface Temperature (LST) retrieval, GIS spatial analysis, and meteorological data to create VCs at the city level. | “Functional and compensative” (hot/cold) area determined using LST measured by remote sensing. Rule-based ventilation coefficient developed for VC identification, according to urban form. LCP method used to verify VCs. |
References
- Liu, Y.S.; Yigitcanlar, T.; Guaralda, M.; Degirmenci, K.; Liu, A.; Kane, M. Leveraging the opportunities of wind for cities through urban planning and design: A PRISMA review. Sustainability 2022, 14, 11665. [Google Scholar] [CrossRef]
- Yuan, C. Urban Wind Environment: Integrated Climate-Sensitive Planning and Design; Springer: Berlin/Heidelberg, Germany, 2018. [Google Scholar]
- Yang, J.; Jin, S.; Xiao, X.; Jin, C.; Xia, J.C.; Li, X.; Wang, S. Local climate zone ventilation and urban land surface temperatures: Towards a performance-based and wind-sensitive planning proposal in megacities. Sustain. Cities Soc. 2019, 47, 101487. [Google Scholar] [CrossRef]
- He, B.-J.; Ding, L.; Prasad, D. Wind-sensitive urban planning and design: Precinct ventilation performance and its potential for local warming mitigation in an open midrise gridiron precinct. J. Build. Eng. 2020, 29, 101145. [Google Scholar] [CrossRef]
- Oke, T.R.; Mills, G.; Christen, A.; Voogt, J.A. Urban Climates; Cambridge University Press: Cambridge, MA, USA, 2017. [Google Scholar]
- Eliasson, I. The use of climate knowledge in urban planning. Landsc. Urban Plan. 2000, 48, 31–44. [Google Scholar] [CrossRef]
- Moonen, P.; Defraeye, T.; Dorer, V.; Blocken, B.; Carmeliet, J. Urban Physics: Effect of the micro-climate on comfort, health and energy demand. Front. Archit. Res. 2012, 1, 197–228. [Google Scholar] [CrossRef]
- Allegrini, J.; Dorer, V.; Carmeliet, J. Wind tunnel measurements of buoyant flows in street canyons. Build. Environ. 2013, 59, 315–326. [Google Scholar] [CrossRef]
- Cermak, J.E. Wind-tunnel development and trends in applications to civil engineering. J. Wind Eng. Ind. Aerodyn. 2003, 91, 355–370. [Google Scholar] [CrossRef]
- Blocken, B. Computational Fluid Dynamics for urban physics: Importance, scales, possibilities, limitations and ten tips and tricks towards accurate and reliable simulations. Build. Environ. 2015, 91, 219–245. [Google Scholar] [CrossRef]
- Mirzaei, P.A. CFD modeling of micro and urban climates: Problems to be solved in the new decade. Sustain. Cities Soc. 2021, 69, 102839. [Google Scholar] [CrossRef]
- Calautit, J.K.; Hughes, B.R. Wind tunnel and CFD study of the natural ventilation performance of a commercial multi-directional wind tower. Build. Environ. 2014, 80, 71–83. [Google Scholar] [CrossRef]
- Zhao, Y.; Li, R.; Feng, L.; Wu, Y.; Niu, J.; Gao, N. Boundary layer wind tunnel tests of outdoor airflow field around urban buildings: A review of methods and status. Renew. Sustain. Energy Rev. 2022, 167, 112717. [Google Scholar] [CrossRef]
- Toparlar, Y.; Blocken, B.; Maiheu, B.; Van Heijst, G. A review on the CFD analysis of urban microclimate. Renew. Sustain. Energy Rev. 2017, 80, 1613–1640. [Google Scholar] [CrossRef]
- Grimmond, C.S.B.; Oke, T.R. Aerodynamic properties of urban areas derived from analysis of surface form. J. Appl. Meteorol. Climatol. 1999, 38, 1262–1292. [Google Scholar] [CrossRef]
- Ng, E. Towards planning and practical understanding of the need for meteorological and climatic information in the design of high-density cities: A case-based study of Hong Kong. Int. J. Climatol. 2012, 32, 582–598. [Google Scholar] [CrossRef]
- Mills, G.; Cleugh, H.; Emmanuel, R.; Endlicher, W.; Erell, E.; Mcgranahan, G.; Ng, E.; Nickson, A.; Rosenthal, J.; Steemer, K. Climate information for improved planning and management of mega cities (needs perspective). Procedia Environ. Sci. 2010, 1, 228–246. [Google Scholar] [CrossRef]
- Moher, D.; Shamseer, L.; Clarke, M.; Ghersi, D.; Liberati, A.; Petticrew, M.; Shekelle, P.; Stewart, L.A.; Group, P.-P. Preferred reporting items for systematic review and meta-analysis protocols (PRISMA-P) 2015 statement. Syst. Rev. 2015, 4, 1–9. [Google Scholar] [CrossRef]
- Cortese, T.T.P.; Almeida, J.F.S.d.; Batista, G.Q.; Storopoli, J.E.; Liu, A.; Yigitcanlar, T. Understanding sustainable energy in the context of smart cities: A PRISMA review. Energies 2022, 15, 2382. [Google Scholar] [CrossRef]
- Mongeon, P.; Paul-Hus, A. The journal coverage of Web of Science and Scopus: A comparative analysis. Scientometrics 2016, 106, 213–228. [Google Scholar] [CrossRef]
- Yigitcanlar, T. Sustainable Urban and Regional Infrastructure Development: Technologies, Applications and Management: Technologies, Applications and Management; IGI Global: Hershey, PA, USA, 2010. [Google Scholar]
- Yigitcanlar, T.; Fabian, L.; Coiacetto, E. Challenges to urban transport sustainability and smart transport in a tourist city: The Gold Coast, Australia. Open Transp. J. 2008, 2, 29–46. [Google Scholar] [CrossRef]
- Li, F.; Yigitcanlar, T.; Nepal, M.; Thanh, K.N.; Dur, F. Understanding Urban Heat Vulnerability Assessment Methods: A PRISMA Review. Energies 2022, 15, 6998. [Google Scholar] [CrossRef]
- Hong, D.-L.; Chien, S.-S. ‘Summoning’ Wind for Urban Cooling: Urban Wind Corridor Projects in China; Springer: Berlin/Heidelberg, Germany, 2018; pp. 137–150. [Google Scholar]
- Kamruzzaman, M.; Deilami, K.; Yigitcanlar, T. Investigating the urban heat island effect of transit oriented development in Brisbane. J. Transp. Geogr. 2018, 66, 116–124. [Google Scholar] [CrossRef]
- Peng, F.; Wong, M.S.; Wan, Y.; Nichol, J.E. Modeling of urban wind ventilation using high resolution airborne LiDAR data. Comput. Environ. Urban Syst. 2017, 64, 81–90. [Google Scholar] [CrossRef]
- Chen, L.; Ng, E. Quantitative urban climate mapping based on a geographical database: A simulation approach using Hong Kong as a case study. Int. J. Appl. Earth Obs. Geoinf. 2011, 13, 586–594. [Google Scholar] [CrossRef]
- Ng, E.; Yuan, C.; Chen, L.; Ren, C.; Fung, J.C. Improving the wind environment in high-density cities by understanding urban morphology and surface roughness: A study in Hong Kong. Landsc. Urban Plan. 2011, 101, 59–74. [Google Scholar] [CrossRef]
- Gál, T.; Unger, J. Detection of ventilation paths using high-resolution roughness parameter mapping in a large urban area. Build. Environ. 2009, 44, 198–206. [Google Scholar] [CrossRef]
- Grunwald, L.; Kossmann, M.; Weber, S. Mapping urban cold-air paths in a Central European city using numerical modelling and geospatial analysis. Urban Clim. 2019, 29, 100503. [Google Scholar] [CrossRef]
- Sasaki, Y.; Matsuo, K.; Yokoyama, M.; Sasaki, M.; Tanaka, T.; Sadohara, S. Sea breeze effect mapping for mitigating summer urban warming: For making urban environmental climate map of Yokohama and its surrounding area. Urban Clim. 2018, 24, 529–550. [Google Scholar] [CrossRef]
- Hsieh, C.-M.; Huang, H.-C. Mitigating urban heat islands: A method to identify potential wind corridor for cooling and ventilation. Comput. Environ. Urban Syst. 2016, 57, 130–143. [Google Scholar] [CrossRef]
- Macdonald, R.; Griffiths, R.; Hall, D. An improved method for the estimation of surface roughness of obstacle arrays. Atmos. Environ. 1998, 32, 1857–1864. [Google Scholar] [CrossRef]
- Kanda, M.; Inagaki, A.; Miyamoto, T.; Gryschka, M.; Raasch, S. A new aerodynamic parametrization for real urban surfaces. Bound. Layer Meteorol. 2013, 148, 357–377. [Google Scholar] [CrossRef]
- Kent, C.W.; Grimmond, C.S.B.; Gatey, D.; Barlow, J.F. Assessing methods to extrapolate the vertical wind-speed profile from surface observations in a city centre during strong winds. J. Wind Eng. Ind. Aerodyn. 2018, 173, 100–111. [Google Scholar] [CrossRef]
- Lv, G.; Zhao, K.; Qin, Y.; Ge, J. An urban-scale method for building roofs available wind resource evaluation based on aerodynamic parameters of urban sublayer surfaces. Sustain. Cities Soc. 2022, 80, 103790. [Google Scholar] [CrossRef]
- Wong, M.S.; Nichol, J.E.; To, P.H.; Wang, J. A simple method for designation of urban ventilation corridors and its application to urban heat island analysis. Build. Environ. 2010, 45, 1880–1889. [Google Scholar] [CrossRef]
- Yuan, C.; Norford, L.; Britter, R.; Ng, E. A modelling-mapping approach for fine-scale assessment of pedestrian-level wind in high-density cities. Build. Environ. 2016, 97, 152–165. [Google Scholar] [CrossRef]
- Acero, J.A.; Arrizabalaga, J.; Kupski, S.; Katzschner, L. Deriving an Urban Climate Map in coastal areas with complex terrain in the Basque Country (Spain). Urban Clim. 2013, 4, 35–60. [Google Scholar] [CrossRef]
- Wicht, M.; Wicht, A. LiDAR-based approach for urban ventilation corridors mapping. IEEE J. Sel. Top. Appl. Earth Obs. Remote Sens. 2018, 11, 2742–2751. [Google Scholar] [CrossRef]
- Liu, Y.; Cheng, P.; Chen, P.; Zhang, S. Detection of wind corridors based on “Climatopes”: A study in central Ji’nan. Theor. Appl. Climatol. 2020, 142, 869–884. [Google Scholar] [CrossRef]
- Degirmenci, K.; Desouza, K.C.; Fieuw, W.; Watson, R.T.; Yigitcanlar, T. Understanding policy and technology responses in mitigating urban heat islands: A literature review and directions for future research. Sustain. Cities Soc. 2021, 70, 102873. [Google Scholar] [CrossRef]
- Xie, P.; Yang, J.; Wang, H.; Liu, Y.; Liu, Y. A New method of simulating urban ventilation corridors using circuit theory. Sustain. Cities Soc. 2020, 59, 102162. [Google Scholar] [CrossRef]
- Luo, X.; Yang, J.; Sun, W.; He, B. Suitability of human settlements in mountainous areas from the perspective of ventilation: A case study of the main urban area of Chongqing. J. Clean. Prod. 2021, 310, 127467. [Google Scholar] [CrossRef]
- Tong, Z.; Luo, Y.; Zhou, J. Mapping the urban natural ventilation potential by hydrological simulation. In Proceedings of the Building Simulation, Bruges, Belgium, 1–3 September 2021; pp. 351–364. [Google Scholar]
- Millward-Hopkins, J.; Tomlin, A.; Ma, L.; Ingham, D.; Pourkashanian, M. Assessing the potential of urban wind energy in a major UK city using an analytical model. Renew. Energy 2013, 60, 701–710. [Google Scholar] [CrossRef]
- Adam, K.; Hoolohan, V.; Gooding, J.; Knowland, T.; Bale, C.S.; Tomlin, A.S. Methodologies for city-scale assessment of renewable energy generation potential to inform strategic energy infrastructure investment. Cities 2016, 54, 45–56. [Google Scholar] [CrossRef]
- Drew, D.; Barlow, J.; Cockerill, T. Estimating the potential yield of small wind turbines in urban areas: A case study for Greater London, UK. J. Wind Eng. Ind. Aerodyn. 2013, 115, 104–111. [Google Scholar] [CrossRef]
- Morano, P.; Tajani, F.; Locurcio, M. GIS application and econometric analysis for the verification of the financial feasibility of roof-top wind turbines in the city of Bari (Italy). Renew. Sustain. Energy Rev. 2017, 70, 999–1010. [Google Scholar] [CrossRef]
- Chen, Y.-C.; Lin, T.-P.; Lin, C.-T. A simple approach for the development of urban climatic maps based on the urban characteristics in Tainan, Taiwan. Int. J. Biometeorol. 2017, 61, 1029–1041. [Google Scholar] [CrossRef]
- Ren, C.; Yang, R.; Cheng, C.; Xing, P.; Fang, X.; Zhang, S.; Wang, H.; Shi, Y.; Zhang, X.; Kwok, Y.T. Creating breathing cities by adopting urban ventilation assessment and wind corridor plan–The implementation in Chinese cities. J. Wind Eng. Ind. Aerodyn. 2018, 182, 170–188. [Google Scholar] [CrossRef]
- Ren, C.; Spit, T.; Lenzholzer, S.; Yim, H.L.S.; Heusinkveld, B.; van Hove, B.; Chen, L.; Kupski, S.; Burghardt, R.; Katzschner, L. Urban climate map system for Dutch spatial planning. Int. J. Appl. Earth Obs. Geoinf. 2012, 18, 207–221. [Google Scholar] [CrossRef]
- Wong, M.S.; Nichol, J.; Ng, E. A study of the “wall effect” caused by proliferation of high-rise buildings using GIS techniques. Landsc. Urban Plan. 2011, 102, 245–253. [Google Scholar] [CrossRef]
- Zhang, L.; Yuan, C. Multi-scale climate-sensitive planning framework to mitigate urban heat island effect: A case study in Singapore. Urban Clim. 2023, 49, 101451. [Google Scholar] [CrossRef]
- Ling Chen, S.; Lu, J.; Yu, W.W. A quantitative method to detect the ventilation paths in a mountainous urban city for urban planning: A case study in Guizhou, China. Indoor Built Environ. 2017, 26, 422–437. [Google Scholar] [CrossRef]
- Guo, F.; Zhang, H.; Fan, Y.; Zhu, P.; Wang, S.; Lu, X.; Jin, Y. Detection and evaluation of a ventilation path in a mountainous city for a sea breeze: The case of Dalian. Build. Environ. 2018, 145, 177–195. [Google Scholar] [CrossRef]
- Suder, A.; Szymanowski, M. Determination of ventilation channels in urban area: A case study of Wrocław (Poland). Pure Appl. Geophys. 2014, 171, 965–975. [Google Scholar] [CrossRef]
- Cariolet, J.-M.; Colombert, M.; Vuillet, M.; Diab, Y. Assessing the resilience of urban areas to traffic-related air pollution: Application in Greater Paris. Sci. Total Environ. 2018, 615, 588–596. [Google Scholar] [CrossRef]
- Liu, Y.; Xu, Y.; Zhang, F.; Shu, W. A preliminary study on the influence of Beijing urban spatial morphology on near-surface wind speed. Urban Clim. 2020, 34, 100703. [Google Scholar] [CrossRef]
- Fang, Y.; Zhao, L. Assessing the environmental benefits of urban ventilation corridors: A case study in Hefei, China. Build. Environ. 2022, 212, 108810. [Google Scholar] [CrossRef]
- Badach, J.; Voordeckers, D.; Nyka, L.; Van Acker, M. A framework for Air Quality Management Zones-Useful GIS-based tool for urban planning: Case studies in Antwerp and Gdańsk. Build. Environ. 2020, 174, 106743. [Google Scholar] [CrossRef]
- Xie, P.; Yang, J.; Sun, W.; Xiao, X.; Xia, J.C. Urban scale ventilation analysis based on neighborhood normalized current model. Sustain. Cities Soc. 2022, 80, 103746. [Google Scholar] [CrossRef]
- Yuan, C.; Ren, C.; Ng, E. GIS-based surface roughness evaluation in the urban planning system to improve the wind environment–A study in Wuhan, China. Urban Clim. 2014, 10, 585–593. [Google Scholar] [CrossRef]
- Park, C.Y.; Choe, H.; Thorne, J.H. Mapping urban cool air connectivity in a megacity. Urban Clim. 2023, 47, 101362. [Google Scholar] [CrossRef]
- Qiao, Z.; Xu, X.; Wu, F.; Luo, W.; Wang, F.; Liu, L.; Sun, Z. Urban ventilation network model: A case study of the core zone of capital function in Beijing metropolitan area. J. Clean. Prod. 2017, 168, 526–535. [Google Scholar] [CrossRef]
- Liu, X.; Huang, B.; Li, R.; Zhang, J.; Gou, Q.; Zhou, T.; Huang, Z. Wind environment assessment and planning of urban natural ventilation corridors using GIS: Shenzhen as a case study. Urban Clim. 2022, 42, 101091. [Google Scholar] [CrossRef]
- Luo, Y.; He, J.; Ni, Y. Analysis of urban ventilation potential using rule-based modeling. Comput. Environ. Urban Syst. 2017, 66, 13–22. [Google Scholar] [CrossRef]
- Svensson, M.K.; Thorsson, S.; Lindqvist, S. A geographical information system model for creating bioclimatic maps–examples from a high, mid-latitude city. Int. J. Biometeorol. 2003, 47, 102–112. [Google Scholar] [CrossRef]
- Scherer, D.; Fehrenbach, U.; Beha, H.-D.; Parlow, E. Improved concepts and methods in analysis and evaluation of the urban climate for optimizing urban planning processes. Atmos. Environ. 1999, 33, 4185–4193. [Google Scholar] [CrossRef]
- Eum, J.-H.; Scherer, D.; Fehrenbach, U.; Köppel, J.; Woo, J.-H. Integrating urban climate into urban master plans using spatially distributed information—The Seoul example. Land Use Policy 2013, 34, 223–232. [Google Scholar] [CrossRef]
- Alcoforado, M.-J.; Andrade, H.; Lopes, A.; Vasconcelos, J. Application of climatic guidelines to urban planning: The example of Lisbon (Portugal). Landsc. Urban Plan. 2009, 90, 56–65. [Google Scholar] [CrossRef]
- Wang, R.; Ren, C.; Xu, Y.; Lau, K.K.-L.; Shi, Y. Mapping the local climate zones of urban areas by GIS-based and WUDAPT methods: A case study of Hong Kong. Urban Clim. 2018, 24, 567–576. [Google Scholar] [CrossRef]
- Zhang, Y.; He, S.; Gu, Z.; Wei, N.; Wah Yu, C.; Li, X.; Zhang, R.; Sun, X.; Zhou, D. Measurement, normalisation and mapping of urban-scale wind environment in Xi’an, China. Indoor Built Environ. 2019, 28, 1171–1180. [Google Scholar] [CrossRef]
- Zheng, Y.; Ren, C.; Xu, Y.; Wang, R.; Ho, J.; Lau, K.; Ng, E. GIS-based mapping of Local Climate Zone in the high-density city of Hong Kong. Urban Clim. 2018, 24, 419–448. [Google Scholar] [CrossRef]
- Yang, F.; Qian, F.; Lau, S.S. Urban form and density as indicators for summertime outdoor ventilation potential: A case study on high-rise housing in Shanghai. Build. Environ. 2013, 70, 122–137. [Google Scholar] [CrossRef]
- Brousse, O.; Martilli, A.; Foley, M.; Mills, G.; Bechtel, B. WUDAPT, an efficient land use producing data tool for mesoscale models? Integration of urban LCZ in WRF over Madrid. Urban Clim. 2016, 17, 116–134. [Google Scholar] [CrossRef]
- He, B.-J.; Ding, L.; Prasad, D. Enhancing urban ventilation performance through the development of precinct ventilation zones: A case study based on the Greater Sydney, Australia. Sustain. Cities Soc. 2019, 47, 101472. [Google Scholar] [CrossRef]
- Xu, D.; Zhou, D.; Wang, Y.; Meng, X.; Chen, W.; Yang, Y. Temporal and spatial variations of urban climate and derivation of an urban climate map for Xi’an, China. Sustain. Cities Soc. 2020, 52, 101850. [Google Scholar] [CrossRef]
- Ren, C.; Lau, K.L.; Yiu, K.P.; Ng, E. The application of urban climatic mapping to the urban planning of high-density cities: The case of Kaohsiung, Taiwan. Cities 2013, 31, 1–16. [Google Scholar] [CrossRef]
- Han, L.; Zhao, J.; Zhang, T.; Zhang, J. Urban ventilation corridors exacerbate air pollution in central urban areas: Evidence from a Chinese city. Sustain. Cities Soc. 2022, 87, 104129. [Google Scholar] [CrossRef]
- Wang, W.; Wang, D.; Chen, H.; Wang, B.; Chen, X. Identifying urban ventilation corridors through quantitative analysis of ventilation potential and wind characteristics. Build. Environ. 2022, 214, 108943. [Google Scholar] [CrossRef]
- Vaeztavakoli, A.; Lak, A.; Yigitcanlar, T. Blue and green spaces as therapeutic landscapes: Health effects of urban water canal areas of Isfahan. Sustainability 2018, 10, 4010. [Google Scholar] [CrossRef]
- Ferreira, D.G.; Diniz, C.B.; de Assis, E.S. Methods to calculate urban surface parameters and their relation to the LCZ classification. Urban Clim. 2021, 36, 100788. [Google Scholar] [CrossRef]
- Stewart, I.D.; Oke, T.R. Local climate zones and urban climatic mapping. In The Urban Climatic Map: A Methodology for Sustainable Urban Planning; Ng, E., Ren, C., Eds.; Routledge: London, UK, 2015; pp. 397–401. [Google Scholar]
- Masson, V.; Heldens, W.; Bocher, E.; Bonhomme, M.; Bucher, B.; Burmeister, C.; de Munck, C.; Esch, T.; Hidalgo, J.; Kanani-Sühring, F. City-descriptive input data for urban climate models: Model requirements, data sources and challenges. Urban Clim. 2020, 31, 100536. [Google Scholar] [CrossRef]
- Tominaga, Y.; Stathopoulos, T. Ten questions concerning modeling of near-field pollutant dispersion in the built environment. Build. Environ. 2016, 105, 390–402. [Google Scholar] [CrossRef]
- Huang, X.; Wen, D.; Li, J.; Qin, R. Multi-level monitoring of subtle urban changes for the megacities of China using high-resolution multi-view satellite imagery. Remote Sens. Environ. 2017, 196, 56–75. [Google Scholar] [CrossRef]
- Hurlimann, A.; Moosavi, S.; Browne, G.R. Urban planning policy must do more to integrate climate change adaptation and mitigation actions. Land Use Policy 2021, 101, 105188. [Google Scholar] [CrossRef]
- Stathopoulos, T.; Alrawashdeh, H.; Al-Quraan, A.; Blocken, B.; Dilimulati, A.; Paraschivoiu, M.; Pilay, P. Urban wind energy: Some views on potential and challenges. J. Wind Eng. Ind. Aerodyn. 2018, 179, 146–157. [Google Scholar] [CrossRef]
- Gurran, N. Australian Urban Land Use Planning: Principles, Systems and Practice; Sydney University Press: Sydney, Australia, 2011. [Google Scholar]
- Naess, P. Urban planning and sustainable development. Eur. Plan. Stud. 2001, 9, 503–524. [Google Scholar] [CrossRef]
- Fonte, C.C.; Lopes, P.; See, L.; Bechtel, B. Using OpenStreetMap (OSM) to enhance the classification of local climate zones in the framework of WUDAPT. Urban Clim. 2019, 28, 100456. [Google Scholar] [CrossRef]
- Truong-Hong, L.; Laefer, D.F. Quantitative evaluation strategies for urban 3D model generation from remote sensing data. Comput. Graph. 2015, 49, 82–91. [Google Scholar] [CrossRef]
- Kaginalkar, A.; Kumar, S.; Gargava, P.; Niyogi, D. Review of urban computing in air quality management as smart city service: An integrated IoT, AI, and cloud technology perspective. Urban Clim. 2021, 39, 100972. [Google Scholar] [CrossRef]
- Zhu, Q.; Chen, J.; Zhu, L.; Duan, X.; Liu, Y. Wind speed prediction with spatio–temporal correlation: A deep learning approach. Energies 2018, 11, 705. [Google Scholar] [CrossRef]
- Li, F.; Yigitcanlar, T.; Nepal, M.; Nguyen, K.; Dur, F. Machine Learning and Remote Sensing Integration for Leveraging Urban Sustainability: A Review and Framework. Sustain. Cities Soc. 2023, 96, 104653. [Google Scholar] [CrossRef]
- Deng, T.; Zhang, K.; Shen, Z.-J.M. A systematic review of a digital twin city: A new pattern of urban governance toward smart cities. J. Manag. Sci. Eng. 2021, 6, 125–134. [Google Scholar] [CrossRef]
- Mayer, I.; Bueren, E.; Bots, P.; Voort, H.; Seijdel, R. Collaborative decisionmaking for sustainable urban renewal projects: A simulation–gaming approach. Environ. Plan. B Plan. Des. 2005, 32, 403–423. [Google Scholar] [CrossRef]
- Villanueva, G.; Gonzalez, C.; Son, M.; Moreno, E.; Liu, W.; Ball-Rokeach, S. Bringing local voices into community revitalization: Engaged communication research in urban planning. J. Appl. Commun. Res. 2017, 45, 474–494. [Google Scholar] [CrossRef]
- Sarimin, M.; Yigitcanlar, T. Towards a comprehensive and integrated knowledge-based urban development model: Status quo and directions. Int. J. Knowl.-Based Dev. 2012, 3, 175–192. [Google Scholar] [CrossRef]
- Stigt, R.; Driessen, P.; Spit, T. A window on urban sustainability: Integration of environmental interests in urban planning through ‘decision windows’. Environ. Impact Assess. Rev. 2013, 42, 18–24. [Google Scholar] [CrossRef]
Disclaimer/Publisher’s Note: The statements, opinions and data contained in all publications are solely those of the individual author(s) and contributor(s) and not of MDPI and/or the editor(s). MDPI and/or the editor(s) disclaim responsibility for any injury to people or property resulting from any ideas, methods, instructions or products referred to in the content. |
© 2024 by the authors. Licensee MDPI, Basel, Switzerland. This article is an open access article distributed under the terms and conditions of the Creative Commons Attribution (CC BY) license (https://creativecommons.org/licenses/by/4.0/).