Abstract
Roads degrade over time due to various factors such as traffic loads, environmental conditions, and the quality of materials used. Significant investments have been poured into road construction globally, necessitating regular evaluations and the implementation of maintenance and rehabilitation (M&R) strategies to keep the infrastructure performing at a satisfactory level. The development and refinement of performance prediction models are essential for forecasting the condition of pavements, especially to address longitudinal cracking distress, a major issue in thick asphalt pavements. This research leverages multiple machine learning methods to create models predicting non-wheel path (NWP) and wheel path (WP) longitudinal cracking using data from the Long-Term Pavement Performance (LTPP) program. This study highlights the marked differences in distress conditions between WP and NWP, underscoring the importance of precise models that cater to their unique features. Aging trends for both types of cracking were identified through correlation analysis, showing an increase in WP cracking with age and a higher initial International Roughness Index (IRI) linked to NWP cracking. Factors such as material characteristics, kinematic viscosity, pavement thickness, air voids, particle size distribution, temperature, KESAL, and asphalt properties were found to significantly influence both WP and NWP cracking. The Exponential Gaussian Process Regression (GPR) emerged as the best model for NWP cracking, showcasing exceptional accuracy with the lowest RMSE of 89.11, MSE of 7940.72, and an impressive R-Squared of 0.63. For WP cracking, the Squared Exponential GPR model was most effective, with the lowest RMSE of 12.00, MSE of 143.93, and a high R-Squared of 0.62. The GPR models, with specific kernels for each cracking type, proved their adaptability and efficiency in various pavement scenarios. A comparative analysis highlighted the superiority of our new machine learning model, which achieved an R2 of 0.767, outperforming previous empirical models, demonstrating the strength and precision of our machine learning approach in predicting longitudinal cracking.
1. Introduction
Government agencies leverage pavement management systems (PMSs) to facilitate objective decisions and actions for maintaining pavements in operational conditions at the lowest possible expense [1]. Since the early 1970s, Departments of Transportation (DOTs) and other transportation bodies have been evolving PMSs tailored to their needs, leading to substantial cost efficiencies and improved conditions of the road network [2]. For example, the Arizona DOT reported savings of USD 14 million in the first year and USD 101 million over the first four years after implementing PMS [3]. The Colorado Department of Transportation (CDOT) utilizes PMS to manage its USD 740 million annual budget efficiently for the upkeep of more than 9100 center-line miles (approximately 23,000 total lane miles) [4], indicating that enhancements in PMS could further optimize expenditure. A specific type of pavement distress, not previously considered in standard pavement design approaches, has been observed more frequently in various countries, including the USA [5,6,7], Japan [8], Kenya [9], South Africa [10], France [11], and the Netherlands [12]. This distress, characterized by longitudinal cracks initiating at or just below the pavement surface and extending downwards, has been distinguished from conventional bottom-up cracking, which starts at the bottom of asphalt layers and works upwards due to tensile stress/strain [13]. Termed top-down cracking (TDC), this condition, alongside bottom-up cracking, can be attributed to fatigue failure—the gradual degradation of material properties under cyclic stresses below the material’s strength. Investigations into the prevalence of longitudinal cracks, particularly those forming near wheel paths on Italian highways, began in 2018. A study by Ingrassia et al., 2020, which surveyed 200 km of motorway, revealed that TDC could affect 20–30% of the slow traffic lane, varying with traffic levels and pavement age [14]. These findings highlight the critical need to address TDC in the construction and maintenance strategies for Italian highways.
The LTPP, the world’s largest and most comprehensive pavement performance database, investigates the effects of design factors, environmental conditions, traffic loads, material properties, construction quality, and maintenance practices on pavement performance [15,16,17]. Managed by the FHWA, the LTPP includes data from over 2500 sections and consists of two main components: General Pavement Studies (GPS) and Specific Pavement Studies (SPS). The GPS evaluate the performance of various pavement types under in-service conditions, while the SPS focus on the impact of specific variables such as drainage design, layer thickness, and rehabilitation or maintenance treatments [18,19,20]. SPS sections are tailored for particular research goals, like evaluating rehabilitation strategies (SPS-5) or the effectiveness of material design systems (SPS-9). Each LTPP test section measures 152 m in length and 12 feet in width per lane. The primary objective of the LTPP program is to provide high-quality data for research, supporting studies on the effectiveness of maintenance and rehabilitation strategies [18,21,22,23,24], the application of mechanistic-empirical pavement design guide (MEPDG) performance models to local conditions [25,26,27], and the optimization of maintenance decision-making processes [28,29].
Numerous studies have utilized computational intelligence methods to overcome the limitations of traditional empirical-based pavement performance prediction models [30,31,32,33,34,35,36,37,38,39]. In predicting pavement roughness, neural networks have demonstrated superior accuracy over conventional prediction models [37,38,39]. Additionally, neural networks have been applied to predict the expansion of cracked regions over time [40] and to identify the onset of fatigue cracking [41]. Attoh-Okine [42] developed a neural network model for predicting rutting progression, showing that neural networks offer better performance and generalization on unseen data compared to traditional statistical approaches. Furthermore, a study comparing the predictive capabilities of multivariate adaptive regression splines (MARS) against a widely used empirical equation found that MARS achieved a significantly higher R2, indicating superior predictive accuracy [43].
Another group stands out in our assessment of longitudinal cracking prediction models, including models that rely on field parameters and real-world operational data to forecast pavement longitudinal performance [44,45,46]. By incorporating actual conditions into their forecasts, these models provide a useful perspective for pavement engineers and maintenance practitioners. In the existing literature, there is a notable research gap pertaining to the prediction of longitudinal cracking in both WP and NWP of pavements. The studies summarized in Table 1 of Field Models for Longitudinal Cracking Prediction primarily focus on overall longitudinal cracking without distinguishing between WP and NWP. This lack of differentiation is significant as the mechanisms and influencing factors for WP and NWP longitudinal cracking can differ substantially. Moreover, the accuracy of these existing models is observed to be relatively low.

Table 1.
Summary of field models used for longitudinal cracking prediction.
Furthermore, the gap extends to the limited utilization of machine learning techniques in longitudinal cracking prediction. Machine learning offers a powerful and versatile approach capable of capturing intricate and non-linear relationships within the data. However, there is a dearth of studies in the literature that harness the potential of machine learning specifically for predicting both WP and NWP longitudinal cracking. This research gap underscores the need for more nuanced models that differentiate between WP and NWP and leverage the capabilities of machine learning for improved accuracy and a deeper understanding of the complex factors influencing longitudinal cracking in different pavement sections.
2. Research Objectives
The primary aim of this research is to assess the performance of seven artificial intelligence/machine learning approaches in predicting WP and NWP longitudinal cracking. The methods employed include linear regression, regression decision tree, support vector machine (SVM), ensemble tree (bagged and boosted), GPR, artificial neural networks (ANNs), and kernel ridge regression. The dataset utilized for this study was sourced from the LTPP database. The choice of LTPP data is motivated by their comprehensive nature in terms of both temporal coverage and the variety of variables. To achieve this objective, the following research goals are outlined:
- Investigate the data by computing descriptive statistics.
- Investigate how wheel path (WP) and non-wheel path (NWP) longitudinal cracking (the primary variables of interest) correlate with various scalar-independent design elements (features).
- Determine the impact of diverse factors on the accuracy of predicting WP and NWP longitudinal cracking.
- Employ a range of machine learning methods to create prediction models for WP and NWP longitudinal cracking, utilizing data sourced from the LTPP database.
- Evaluate the effectiveness of these models by comparing their predictive accuracy and the time required for model training.
- Benchmark the best-performing machine learning model against conventional empirical models for longitudinal cracking, examining their accuracy, reliability, and overall robustness. This includes a comparison with established empirical approaches, as detailed in the Summary of Field Models for Longitudinal Cracking Prediction.
3. Methodology
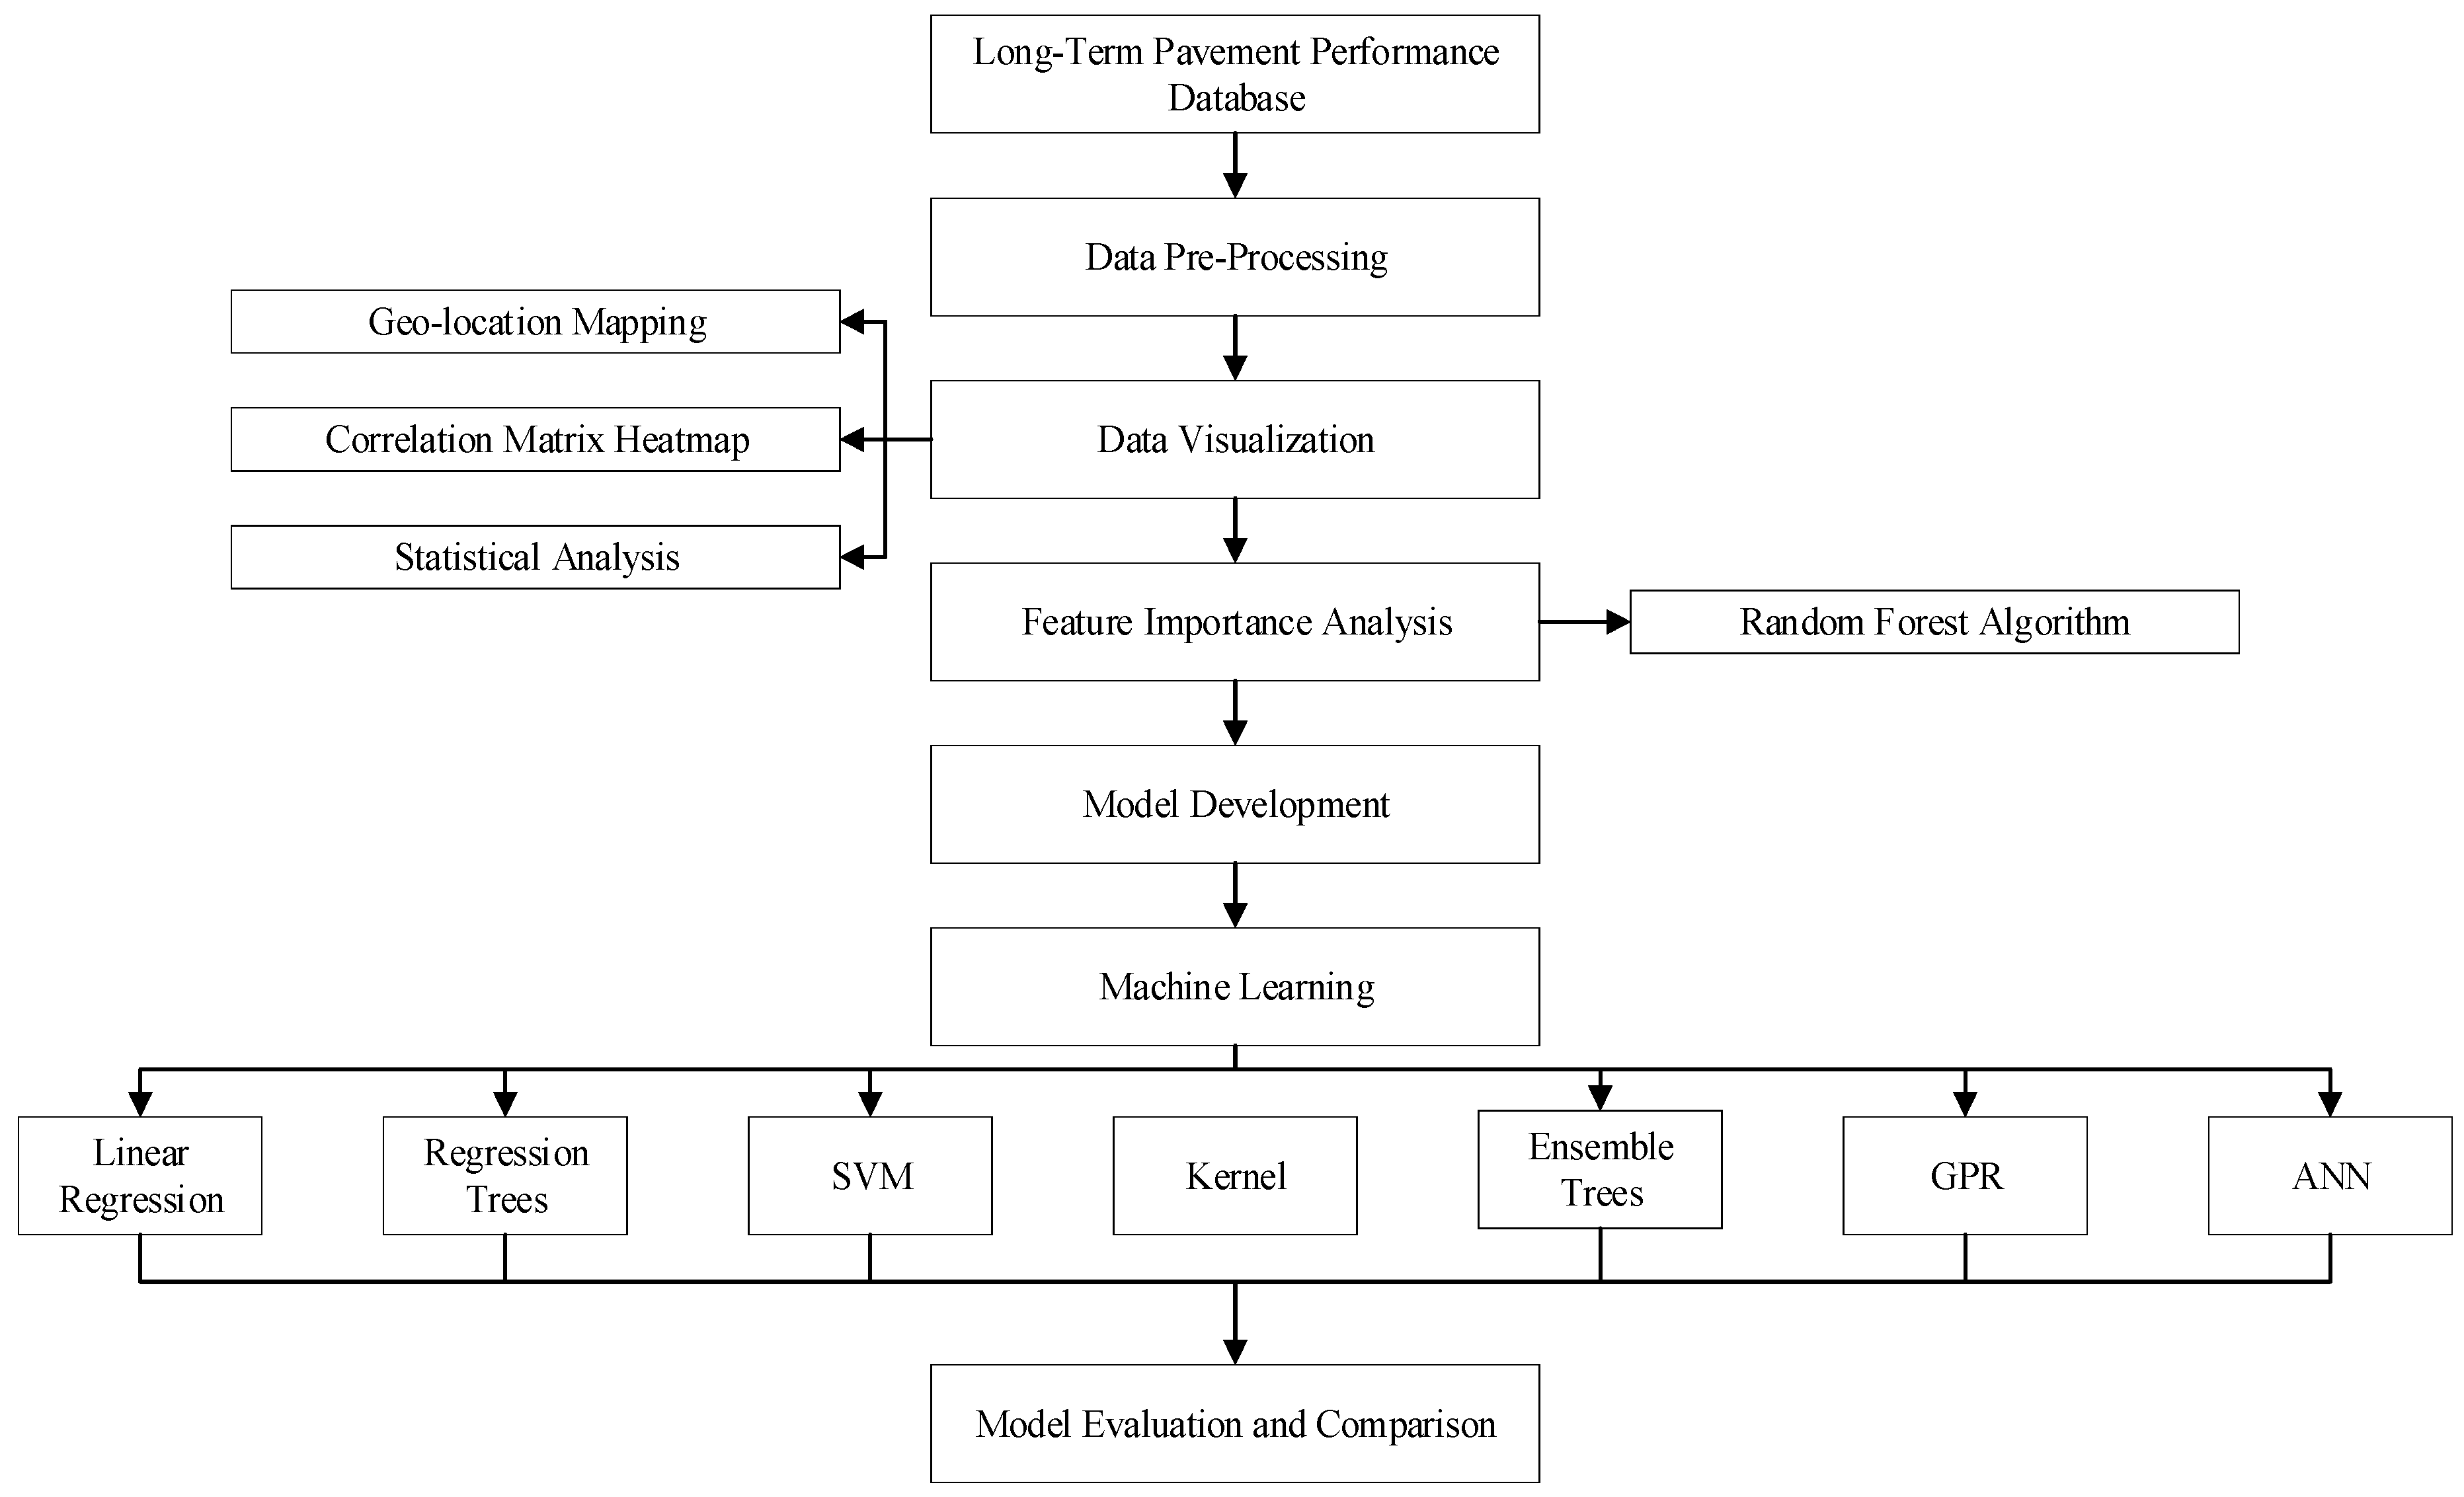
The methodology of our study is meticulously designed to ensure the integrity and reliability of our predictive models on pavement performance, specifically focusing on longitudinal cracking. This approach is illustrated in Figure 1 and involves several key stages, starting with the careful selection of data from the Long-Term Pavement Performance (LTPP) database. We specifically gathered data from 234 asphalt pavement sections strategically chosen for their location across both cold and warm temperature zones and, critically, for their history of no maintenance or rehabilitation activities during the observation period. This selection criterion was essential to our study’s aim: to analyze the natural progression of pavement conditions without the influence of external interventions.
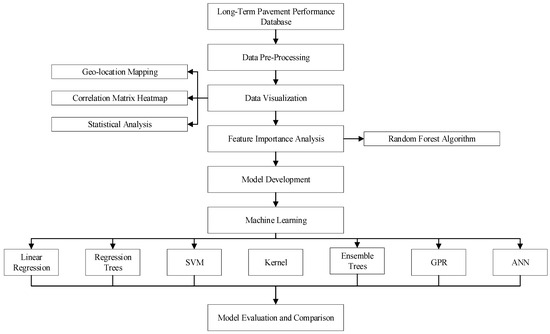
Figure 1.
Framework of the methodology.
After the initial data-collection phase, we embarked on a rigorous data-processing routine. This involved the integration and cleaning of the raw data to prepare them for further exploration, visualization, and modeling. Our study utilized longitudinal cracks within the wheel path (WP) and non-wheel path (NWP) as key indicators of pavement performance.
To understand the relationship between longitudinal cracks (our primary dependent variables) and various independent variables (features), we employed heat map analysis. This step allowed us to visually identify any significant associations worthy of further investigation.
Given the exploratory nature of our research, particularly the uncertainty surrounding the most effective machine learning technique for modeling longitudinal cracking, we adopted a comprehensive approach. We tested a variety of advanced machine learning models to identify the best performer for our specific dataset and research goals. The techniques evaluated included regression tree (RT), support vector machine (SVM), ensemble methods, Gaussian process regression (GPR), artificial neural networks (ANN), and kernel ridge regression. Each of these methods was chosen for its potential to handle the complex, non-linear relationships often found in pavement performance data.
In the subsequent sections, we delve deeper into the specifics of these six machine learning strategies, outlining their theoretical foundations and practical applications within our study’s context. This rigorous methodological framework aims to contribute significantly to the existing body of knowledge on pavement deterioration and maintenance prediction, providing valuable insights for both researchers and practitioners in the field.
4. Data Description and Preprocessing
The dataset utilized for this study was sourced from the Long-Term Pavement Performance (LTPP) database, which was initiated in 1987 to explore better pavement design and construction techniques under various conditions. Currently, the LTPP tracks over 600 pavement sections and holds historical data on more than 1900 sections. Data collection is conducted through two primary methodologies: General Pavement Studies (GPS) and Specific Pavement Studies (SPS), under the supervision of the Federal Highway Administration, which offers open access to this data via their website at https://infopave.fhwa.dot.gov/ (accessed on 6 October 2023).
For the purposes of this analysis, control asphalt pavement sections from the LTPP database, representing both cold and warm climate zones (with and without freezing conditions), were selected. These sections had not undergone any maintenance or rehabilitation activities. A total of 234 control pavement sections fitting these criteria were identified, encompassing 942 recordings. The LTPP data encompass four principal categories: structure, climate, traffic, and performance, with specific attributes selected from each category for analysis, as shown in Table 2.
Table 2.
Summary of the collected data.
The comprehensive dataset compiled for this study provides a foundation for an in-depth analysis of pavement performance, focusing particularly on longitudinal cracking. This dataset is categorized into several critical domains: structural and material properties, climate factors, traffic loads, and performance metrics, each contributing unique insights into pavement behavior under various conditions.
Structural and material properties form the core of the dataset, detailing the age, construction specifics, material composition, and structural characteristics of the pavement layers. Information on the age and unique construction identifiers offers a temporal and historical context essential for longitudinal studies. The dataset further delves into the specifics of each pavement layer, including material types, thicknesses, and detailed descriptions that shed light on the structural integrity and design rationale. Material quality indicators such as bulk specific gravity, asphalt content, air voids, and effective asphalt content are included to assess the composition and condition of the pavement materials. Additionally, granular details on particle size distribution and viscosity measurements provide a nuanced understanding of the aggregate blends and asphalt binder properties, which are pivotal in predicting pavement responses to environmental stresses and loading conditions.
Climate variables capture the environmental conditions to which the pavement is exposed, including climate zone, annual averages of precipitation, temperature, Freeze Index, and humidity levels. These factors are instrumental in understanding the external stresses pavements endure, from thermal expansion and contraction to moisture-induced damage and freeze–thaw cycles. The inclusion of these variables allows for an assessment of how climatic conditions influence pavement deterioration, particularly the development of longitudinal cracking.
Traffic data, encompassing the number of lanes, Equivalent Single Axle Loads (ESALs), and Annual Average Daily Truck Traffic (AADTT), quantify the loading stresses imposed on pavement structures. This traffic-related information is crucial for evaluating the mechanical impact of vehicular loads on pavement wear and tear, influencing the initiation and propagation of cracks.
Lastly, performance metrics such as the Initial International Roughness Index (IRI) and measurements of longitudinal cracking within and outside the wheel path provide direct indicators of pavement condition. The WP and NWP longitudinal cracking serve as the outcome variables against which the predictive accuracy of machine learning models is evaluated, offering insights into the effectiveness of different material compositions, structural designs, and maintenance strategies in mitigating pavement cracking.
By integrating a wide array of variables across these domains, this study aims to build a holistic model of pavement performance, leveraging advanced machine learning techniques to predict longitudinal cracking. This approach not only enhances the understanding of the multifaceted influences on pavement degradation but also informs targeted interventions for pavement maintenance and rehabilitation, ultimately contributing to improved pavement longevity and serviceability.
Exploring the intricate relationship between the material characteristics of pavement layers and their impact on longitudinal cracking is a critical aspect of pavement performance. By analyzing the composition and properties of the surface layer (L4—asphalt layer), base (L3), sub-base (L3), and subgrade (L1), we aim to uncover how variations in these layers contribute to the pavement’s susceptibility to longitudinal cracking.
The surface layer, primarily consisting of asphalt concrete (AC), is vital for enduring direct traffic stresses. The resilience of this layer against longitudinal cracking hinges on the asphalt mixture’s composition, specifically the aggregate size, binder type, and air void content. An optimal asphalt mixture can significantly enhance the pavement’s flexibility and resistance to fatigue, thereby diminishing the occurrence of cracking. In contrast, improper mixture proportions can lead to premature distress, emphasizing the need for meticulous asphalt layer design.
The base layer is crucial for distributing traffic loads and preserving the structural integrity of the pavement. Whether composed of bound or unbound materials, the base layer’s stiffness directly influences its load-distributing efficacy. A well-constructed base layer that effectively spreads out traffic loads can significantly reduce the stress experienced by the subgrade, thereby mitigating the risk of longitudinal cracking. Conversely, a base layer lacking in stiffness or durability may fail to provide adequate support, heightening the pavement’s vulnerability to cracking.
Beneath the surface, the sub-base layer provides essential support and drainage, impacting the pavement’s structural capacity. The material properties of this layer, such as aggregate gradation and moisture management capabilities, play a significant role in ensuring adequate support for the layers above. Ineffectively designed sub-base materials might not offer sufficient stiffness or moisture resistance, potentially leading to increased stress concentrations and a higher likelihood of surface cracking.
At the foundation of the pavement structure lies the subgrade layer, whose stability and strength are fundamental to the pavement’s overall performance. The subgrade’s material characteristics, including soil type and compaction level, determine its ability to underpin the pavement layers. A robust and stable subgrade minimizes differential settlements, reducing the potential for stress points that can lead to the initiation and propagation of longitudinal cracks through the pavement structure.
This comprehensive analysis across all pavement layers—from the asphalt surface to the subgrade—underscores the significance of material selection and structural design in combating longitudinal cracking. Our study leverages a detailed dataset encompassing a wide range of variables across structural, material, climatic, and traffic domains. By correlating these variables with observed pavement performance, we aim to identify key factors that influence cracking, thereby informing strategies for enhanced pavement durability and longevity. This holistic approach not only enhances our understanding of pavement behavior but also guides the development of predictive models for improved maintenance and rehabilitation practices.
5. Preliminary Analysis, Data Visualization, and Attribute Selection
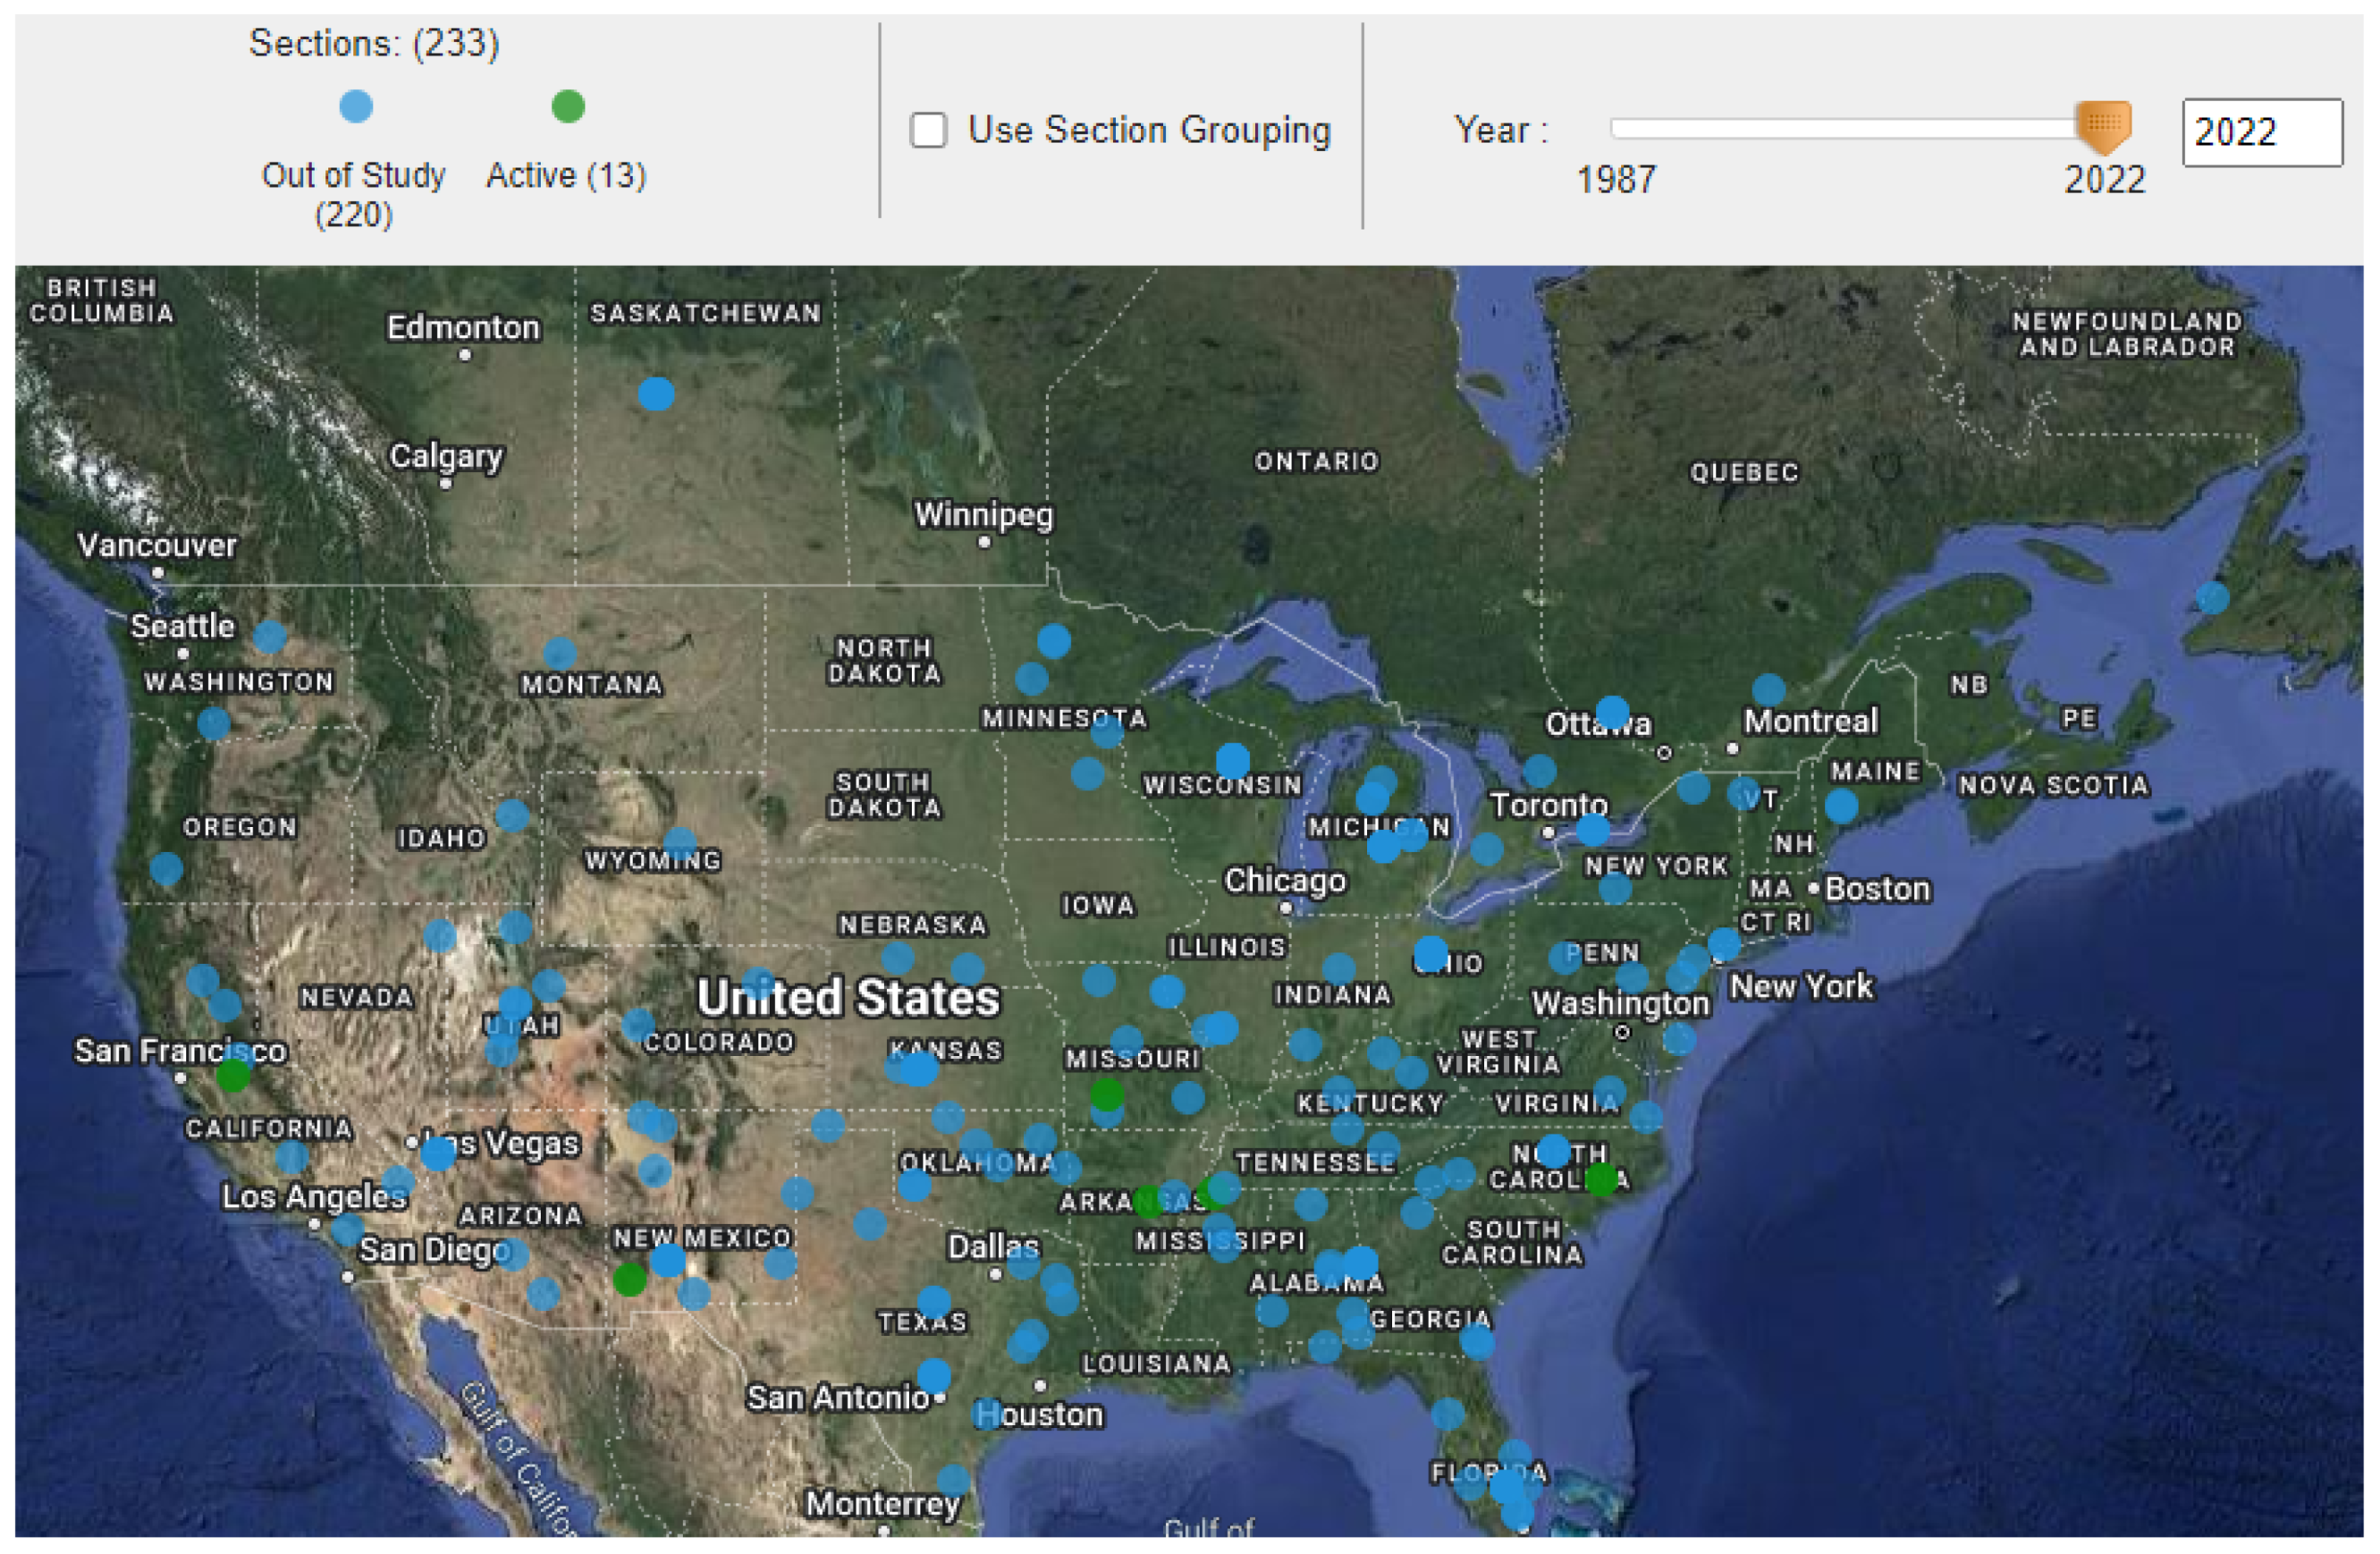
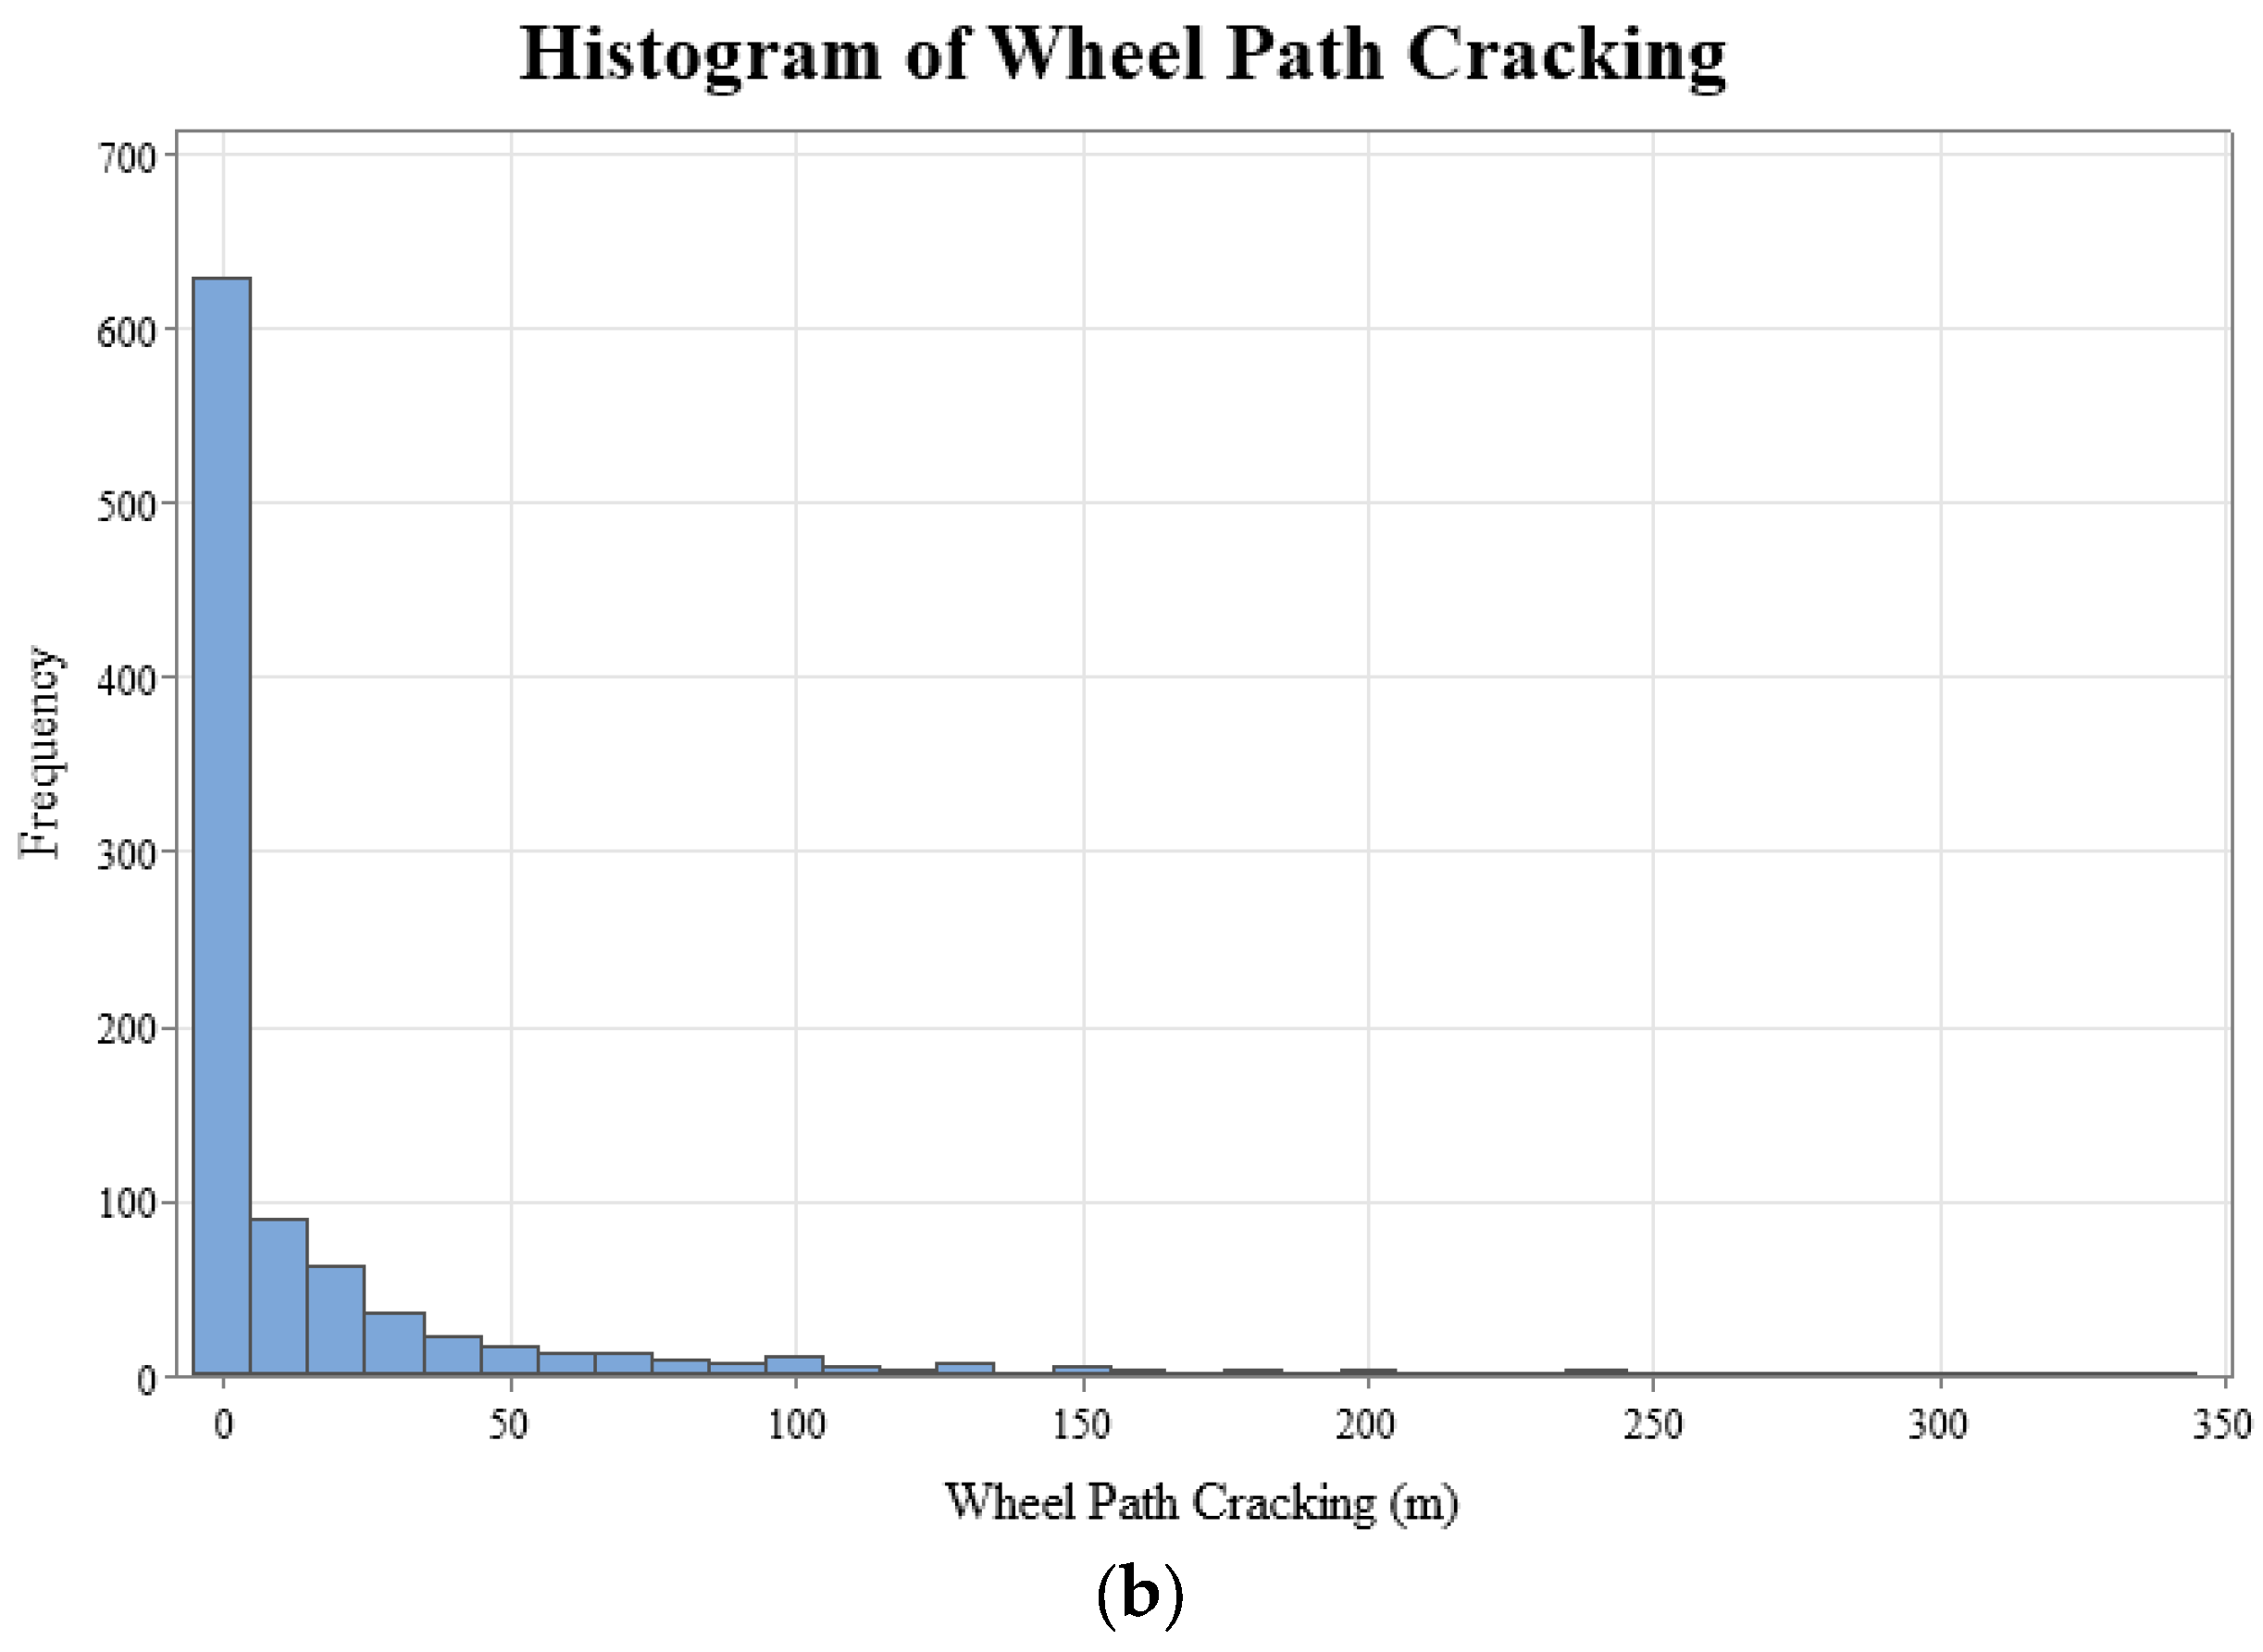
The geographical distribution of the 234 LTPP pavement sections, categorized by state, has been visually represented to facilitate an understanding of the study’s geographic scope, as shown in Figure 2. This mapping aligns with best practices in data visualization for geographical data, enhancing the interpretability of spatial relationships within pavement performance studies [50]. Furthermore, Figure 3 presents histograms of the dependent variables for wheel path (WP) and non-wheel path (NWP) longitudinal cracking, revealing right-skewed distributions with mean values of 15.57 for WP and 110.48 for NWP, respectively. This skewness in the distribution of pavement distress measurements underscores the variability in pavement conditions across the sampled sections.

Figure 2.
Geolocation of the selected asphalt pavement sections.
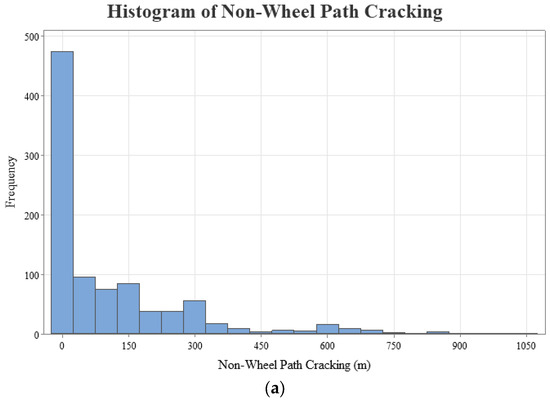

Figure 3.
Histograms (distributions) of dependent variables: (a) NWP cracking and (b) WP cracking.
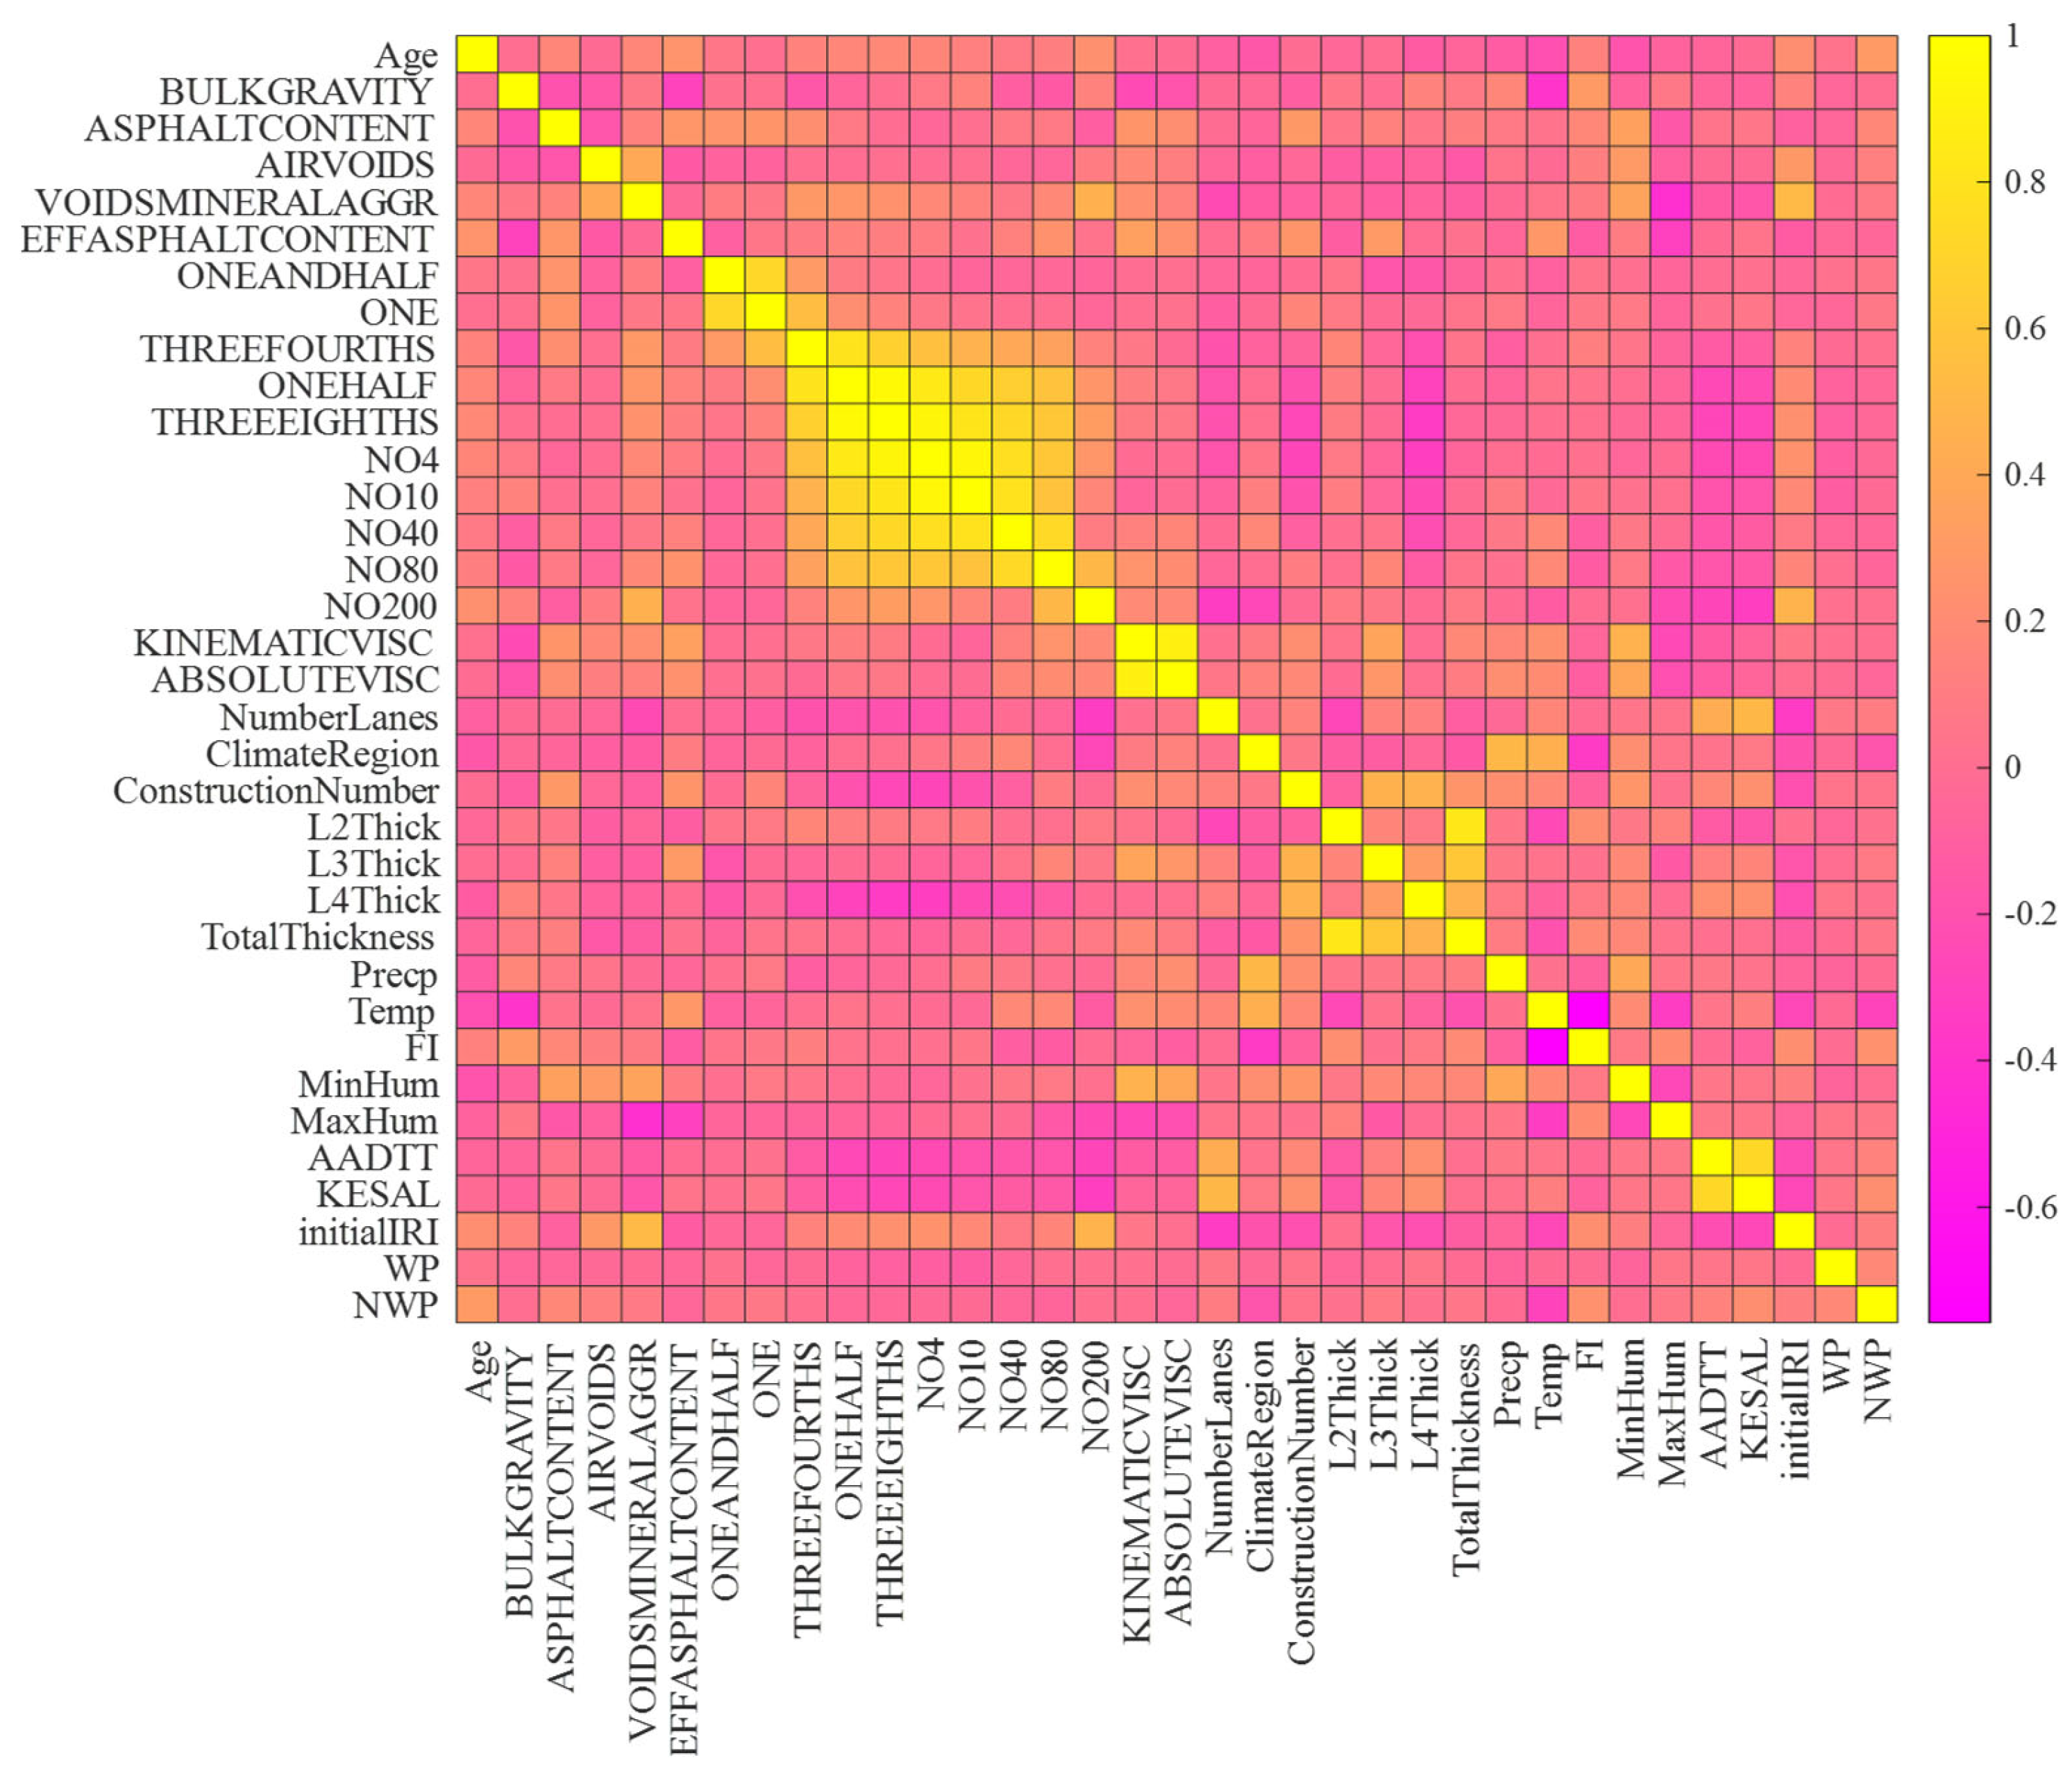
Table 3 shows a descriptive statistical summary of the quantitative database variables. Furthermore, the heatmap correlation matrix in Figure 4 offers a detailed perspective on the relationships among various factors within the dataset, specifically focusing on the dependent variables WP and NWP cracking. Analyzing the correlations related to these critical pavement condition indicators sheds light on the factors influencing longitudinal cracking in wheel and non-wheel path areas. Starting with the correlation between WP cracking and Initial IRI, a positive association with a correlation of 0.514 indicates that as the initial roughness of the pavement increases, there is a tendency for longitudinal cracking in the wheel path to worsen. This insight is essential for pavement management and maintenance strategies, suggesting a potential correlation between pavement roughness and the development of WP longitudinal cracks. Examining the correlation between WP longitudinal cracking and Min Humidity (correlation: 0.323), the positive relationship suggests that lower humidity levels are associated with an increased occurrence of WP longitudinal cracking. Understanding this correlation is crucial for anticipating and managing longitudinal cracking scenarios in the wheel path, considering the impact of humidity on the road surface. Moving to the correlation between WP longitudinal cracking and precipitation, the positive correlation of 0.243 indicates that increased precipitation is linked to a higher occurrence of WP longitudinal cracking. This finding aligns with common expectations but quantifies the relationship, providing valuable data for planners and decision makers concerned with weather-related impacts on WP longitudinal cracking.
Table 3.
Statistical summary of the numeric variables.
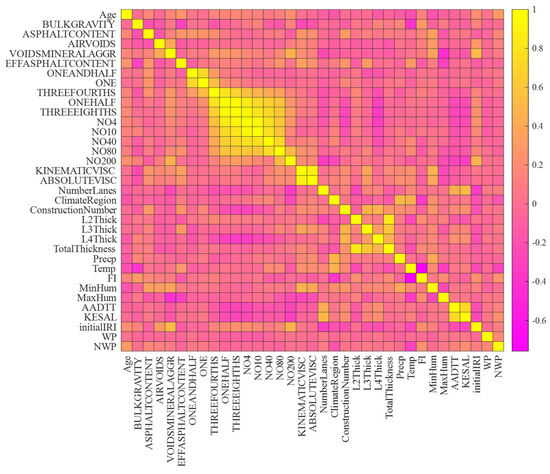
Figure 4.
Heatmap of dependent variables versus independent variables.
In contrast, NWP longitudinal cracking is negatively correlated with the Freeze Index (FI), with a correlation coefficient of −0.525. This suggests that higher Freeze Index values lead to a decrease in NWP longitudinal cracking, highlighting the importance of the Freeze Index in enhancing road safety by reducing susceptibility to longitudinal cracking in non-wheel path areas. Furthermore, a negative correlation of −0.437 between NWP longitudinal cracking and the kinematic viscosity of the asphalt binder indicates that lower kinematic viscosity is associated with a reduced risk of NWP longitudinal cracking. This relationship sheds light on the impact of asphalt binder’s flow properties on preserving optimal pavement conditions in NWP zones, particularly in conditions that are not wet.
6. Feature Importance and Significance of Attributes
Random Forest is a popular and strong ensemble learning method for making robust and accurate predictions by combining the predictions of several decision trees. Leo Breiman initially proposed it in 2001 [51]. Because of its capacity to handle large datasets and deliver trustworthy predictions, the approach has achieved considerable acceptance in a variety of disciplines, including machine learning, data mining, and bioinformatics. The Random Forest approach constructs an ensemble of decision trees, with each tree trained on a random portion of the training data. Each tree is exposed to different subsets of the features during the training phase, adding randomization to the model. This randomization aids in the reduction in overfitting and the improvement of generalization performance. The key concept behind Random Forest is that the ensemble of decision trees can collectively produce more accurate forecasts than any individual tree. Each tree in the ensemble makes predictions independently, and the final forecast is obtained by aggregating the predictions from all the trees. In regression tasks, predictions are typically averaged, whereas in classification tasks, voting or averaging with probability is commonly utilized.
One of the advantages of Random Forest lies in its capability to quantify the significance of features. This is achieved by assessing the impact of each feature on the ensemble’s prediction accuracy. The importance of a feature is determined by evaluating the loss in prediction accuracy when its values are randomly permuted. The greater the decline in accuracy, the more crucial the characteristic is considered. In this study, a Random Forest model for regression was trained using the TreeBagger function in MATLAB 2022a, which serves as a built-in implementation of the Random Forest algorithm. The forest comprised 100 trees, and the Out-of-Bag (OOB) Predictor Importance was enabled. OOB Predictor Importance calculates the importance scores based on the change in prediction error when the values of each predictor are permuted within the out-of-bag samples.
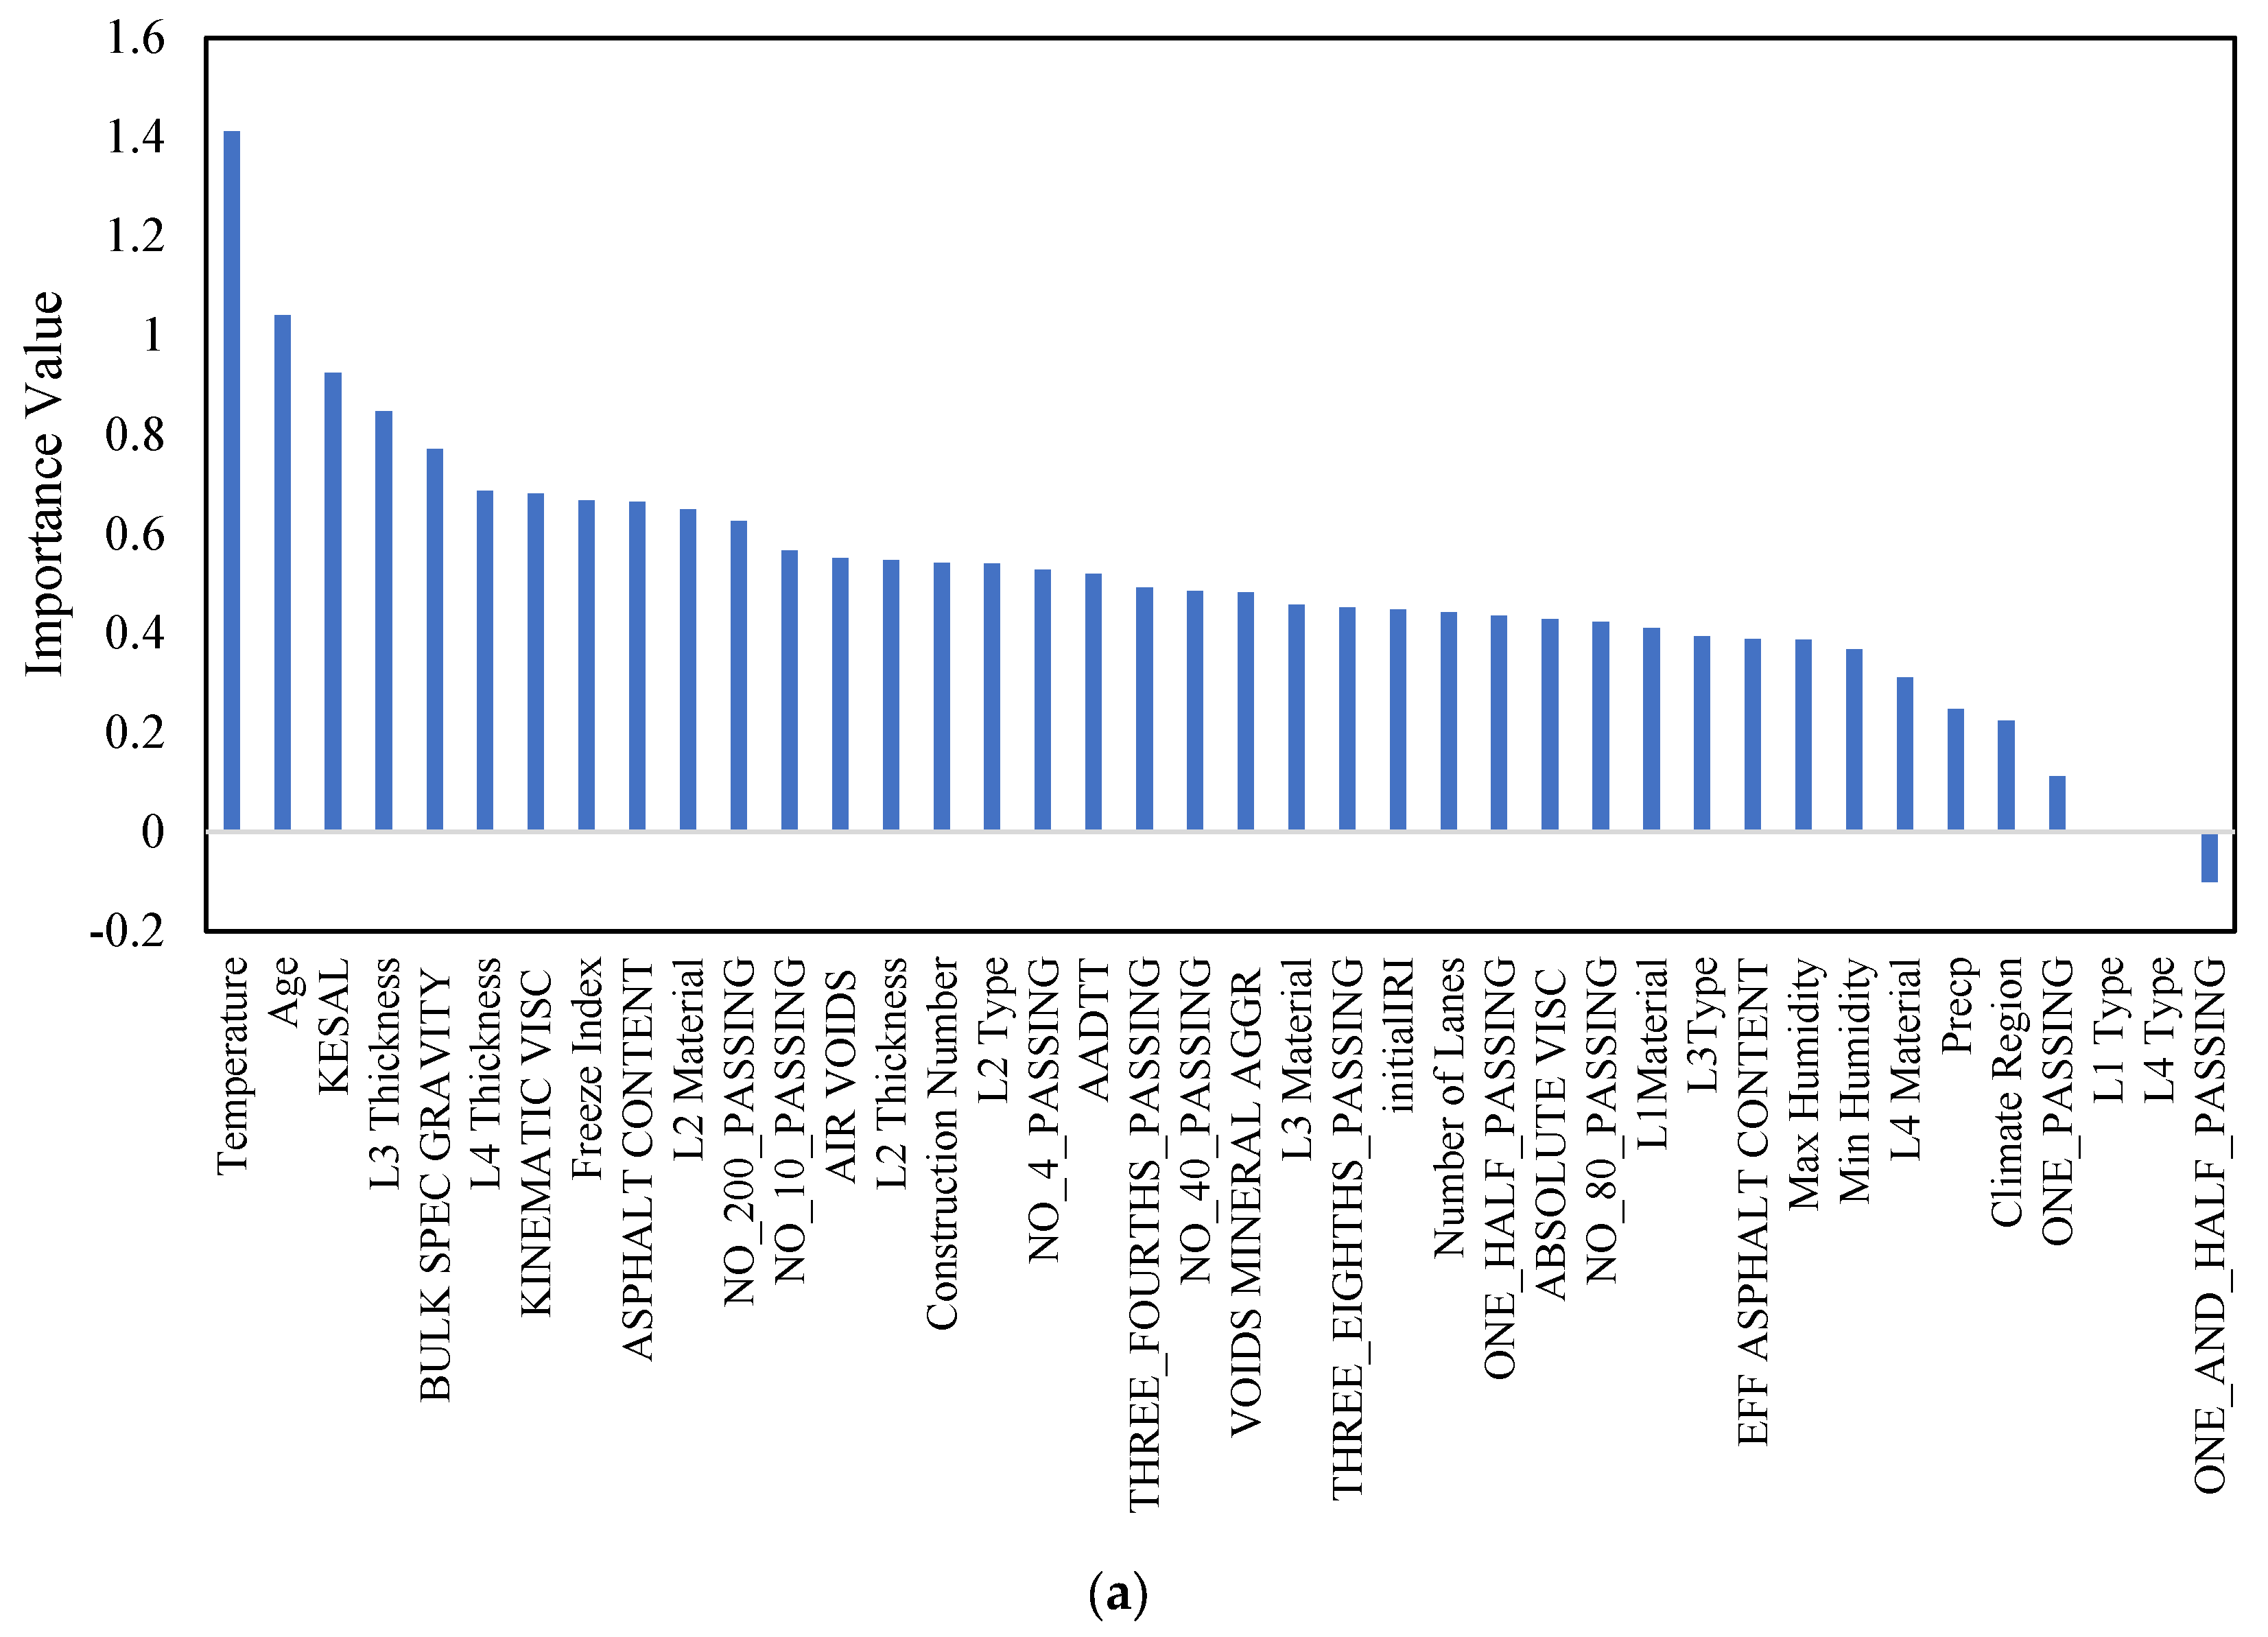
Figure 5a,b shows the importance scores for each factor to NWP and WP longitudinal cracking, respectively. The feature importance analysis conducted for non-wheel path (NWP) longitudinal cracking identifies several pivotal factors contributing to distress in areas outside the wheel path, with temperature (1.41) standing out as the foremost critical variable. The pronounced influence of temperature on NWP longitudinal cracking can be attributed to its direct impact on the asphalt binder’s viscosity and the pavement’s ability to resist cracking under thermal stress. Fluctuations in temperature cause expansion and contraction in the pavement materials, which, over time, can lead to the formation of longitudinal cracks due to the differential thermal movement between layers and the weakening of the asphalt’s structural integrity. Following temperature, pavement age (1.04) is identified as a significant factor, underscoring the natural degradation process pavements undergo with time. Aging leads to a reduction in the asphalt binder’s elasticity and the aggregate’s cohesion, making the pavement more susceptible to cracking as it becomes brittle and less capable of accommodating traffic-induced stresses and thermal movements. The KESAL value (0.93), representing the equivalent single axle load, highlights the impact of traffic loading on NWP longitudinal cracking. While NWP areas are less directly affected by traffic compared to wheel paths, the cumulative effect of traffic loads over time can still contribute to the initiation and propagation of longitudinal cracks due to the fatigue and structural breakdown of pavement materials. Layer thickness, particularly L3 and L4 Thickness and BULK SPEC GRAVITY (0.77), draws attention to the structural configuration of the pavement. Adequate layer thickness is crucial for distributing traffic loads and mitigating stress concentrations within the pavement structure. Thinner layers or those with inadequate bulk specific gravity may not provide sufficient structural support, leading to increased stress and the potential for cracking. Lastly, the kinematic viscosity of the asphalt binder (0.68) plays a vital role in the pavement’s resistance to longitudinal cracking. Lower kinematic viscosity indicates a more fluid asphalt binder at high temperatures, which may not effectively bind the aggregates, leading to a weakened pavement structure prone to cracking. Conversely, higher viscosity at lower temperatures can result in a brittle pavement that is more susceptible to cracking under stress. These factors collectively illustrate the complex interplay of material properties, structural characteristics, environmental conditions, and loading in influencing the occurrence and severity of NWP longitudinal cracking. Understanding these relationships is essential for the development of effective pavement maintenance and rehabilitation strategies.

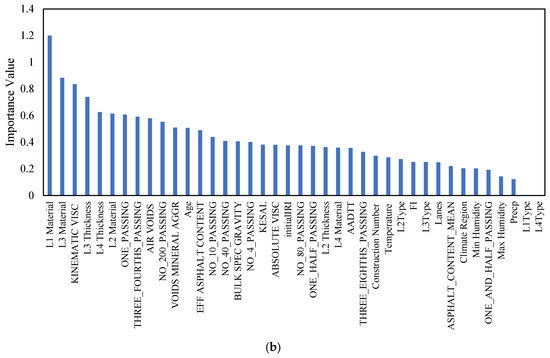
Figure 5.
Feature importance analysis using Random Forest algorithms for (a) NPW and (b) WP.
The analysis of feature importance for wheel path (WP) longitudinal cracking unveils significant insights into the determinants of pavement integrity in the face of such distress. The prominence of material characteristics and asphalt binder properties, highlighted by the critical roles of L1 Material (1.20) and L3 Material (0.88), along with kinematic viscosity (0.84), underlines their foundational impact on the pavement’s resilience. The choice and quality of materials directly influence the pavement’s ability to withstand traffic stresses and environmental conditions, thereby affecting its susceptibility to longitudinal cracking. Higher-quality materials and optimal asphalt viscosity enhance the pavement’s flexibility and durability, reducing the likelihood of crack formation under repeated loading.
Additionally, the structural design, as indicated by the importance of L3 Thickness and L4 Thickness, plays a pivotal role in the distribution of loads across the pavement layers. Adequate thickness ensures that the stresses are more evenly distributed, lessening the strain on any single layer and, by extension, mitigating the risk of longitudinal cracking. This is particularly relevant in the wheel path, where the concentration of traffic loads exacerbates the stress on the pavement structure.
The analysis also emphasizes the significance of particle size distribution, with factors such as ONE_PASSING and THREE_FOURTHS_PASSING being crucial. These variables indicate how well the aggregate interlocks and the compactness of the asphalt mixture, both of which affect the pavement’s ability to resist deformation and cracking. A well-graded aggregate provides a denser asphalt mixture, which improves the pavement’s structural strength and durability.
Climatic conditions, represented by factors like temperature, min humidity, max humidity, and precipitation, also play a variable but notable role in influencing WP longitudinal cracking. These environmental factors affect the pavement’s material properties and behavior over time, with temperature fluctuations causing expansion and contraction that can initiate or propagate cracks. Humidity and precipitation can exacerbate these effects by introducing moisture into the pavement structure, leading to material degradation or freeze–thaw cycles in colder climates.
These insights underscore the multifaceted nature of WP longitudinal cracking, pointing to a combination of material quality, structural design, aggregate composition, and environmental conditions as key contributors. Understanding these relationships enables pavement engineers to devise targeted strategies for maintaining and improving pavement performance, focusing on optimizing material selection, structural design, and maintenance practices to counteract the identified risk factors effectively.
7. Machine Learning Modeling
Machine learning encompasses a suite of algorithms and strategies that empower computers to mimic a fundamental human capability: learning from experience. Unlike traditional approaches that depend on pre-defined mathematical models, machine learning algorithms extract insights directly from data. These techniques fall into two primary categories: supervised and unsupervised learning. Supervised learning involves training a model on a labeled dataset to make predictions or decisions using either discrete labels (classification) or continuous outcomes (regression). Unsupervised learning, conversely, explores patterns within data without predefined labels, typically through clustering.
In addressing the specific challenges of this study, we employed supervised regression techniques, leveraging the power of regression decision trees, support vector machines (SVM), ensemble methods, and Gaussian process regression (GPR) to predict future states based on continuous input and output data. To enhance the robustness and validity of our predictive models, we implemented cross-validation techniques throughout our analysis. Cross-validation involves partitioning the data into complementary subsets, systematically training the models on one subset while validating them on another to ensure that our models are not only accurate but also generalize well to unseen data. This method is crucial in supervised learning, particularly in regression tasks, as it helps in assessing the predictive performance and stability of the models across different data segments, thereby providing a more reliable measure of their effectiveness in real-world scenarios. In the development of our predictive models, we adopted a holistic approach by incorporating all variables listed in Table 2. This comprehensive strategy was chosen to ensure a thorough examination of the potential influences each variable might have on the outcomes of interest. Our intent was to capture the intricate interactions and the cumulative impact of these variables on the predictive accuracy of our models. By including the entire set of variables, we aimed to provide a nuanced and detailed understanding of the factors affecting WP and NWP longitudinal cracking.
7.1. Regression Decision Trees
Regression trees, also known as regression trees, predict a numerical target variable’s value using a tree structure comprising roots, leaves, and branches. Breiman’s more detailed examination of regression trees and their components, including roots, leaves, and branches, is outlined in Figure 6 [52]. Numerical records traverse from the root at the top node down the tree. Each internal node conducts a conditional test to navigate the path along the branches, where the conditional testing at each node aims to minimize errors, such as the sum of squared errors. The prediction of the tree is derived from the leaf node at the path’s end. The data-partitioning concept aims to reduce the deviation (D) from the mean of the target features, as described in Equation (1) [52].
where Y represents the average of the output features, and Yi is the specific target feature. Considering the cut point divides the data into two distinct subsets (namely, left and right), the decrease in deviation (D) can be reformulated as described in Equation (2):
where DRight and DLeft are the deviances of the right and left subsets, respectively.
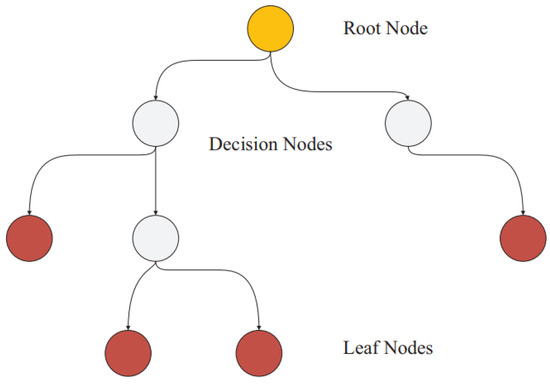
Figure 6.
Schematic of conventional regression decision trees.
It is crucial to mention that several types of regression trees exist, including complex trees, medium trees, and simple trees. These are typically distinguished by the minimum size of their leaves.
7.2. SVM
SVM operates on the principle of structural risk minimization to ensure robust generalization from a limited dataset [53]. It achieves this by mapping input data into a high-dimensional feature space through a non-linear function, where it then computes a linear regression function. Designed to perform well even with small samples, SVM finds a globally optimal solution by resolving a convex quadratic optimization problem. Various SVM models exist, such as linear, quadratic, and cubic SVMs, each defined by their unique mathematical kernel function (k) as outlined in the following Equation (3):
The parameter P, chosen by the user, influences the nature of the kernel in SVM, determining if it is linear, quadratic, or cubic. SVM variations are further categorized into fine, medium, and coarse based on their Gaussian kernel scales: the fine class uses a kernel scale of P/4, medium is set at P, and coarse is set at 4P, with P representing the count of predictors. Initially developed by Cortes and Vapnik in 1995 [54], SVMs have seen a rise in application and interest from the research community in recent times [53,55,56].
7.3. Ensembles
An ensemble approach combines multiple weaker models to generate a robust prediction. Typically, the ensemble’s output is obtained by averaging the predictions of the constituent models, which may be homogeneous or heterogeneous [57]. This study utilized two types of ensemble tree methodologies: bagged trees and boosted trees [58]. Bagged trees create multiple bootstrap trees, combining their outputs into one decision tree, with the final decision derived from averaging these outputs. Although bagged tree ensembles often yield more precise results than individual trees, they are more computationally intensive for large datasets. Conversely, boosted trees form an ensemble through a two-step process that first creates a series of moderate-performing models from the data subsets. These models are then enhanced through a specific cost function. Unlike bagging, boosted trees build their data subsets based on the performance of prior models, using a weighted average for the final prediction, offering efficiency in time and memory usage over bagged trees, albeit potentially requiring more models in the ensemble. The equation for ensemble regression trees is depicted in Equation (4):
where ŷbag (x) is a target value resulting from average, Ŷb(x) is the detected target value for observation x in bootstrap sample b, and B is the total bootstrap samples.
7.4. GPR
Gaussian process regression (GPR) models serve as powerful tools for tackling intricate machine learning problems, offering significant flexibility through their nonparametric approach. The standout feature of GPR models lies in their capacity to not only predict outcomes but also quantify uncertainty, learning about noise and smoothness directly from the data. Compared to other models reliant on kernel functions, GPR models are particularly noted for their dependable responses [59]. Further details on GPR models are available in the literature [60,61]. GPR employs a probabilistic framework, modeling predictions using Gaussian distributions to represent uncertainties. Variants of GPR include squared exponential GPR, matern GPR, exponential GPR, and rational quadratic GPR, distinguished by the specific kernel function each employs, outlined as follows:
- Squared Exponential Kernel:
- 2.
- Matern Kernel:
- 3.
- Exponential Kernel:
- 4.
- Rational Quadratic Kernel:
In this study, we employed a diverse array of machine learning models to develop predictive models for longitudinal cracking. Each model was carefully chosen based on its potential to capture the complex relationships inherent in the data. To ensure the robustness and reliability of our predictions, we meticulously selected and optimized the hyperparameters for each model type. Below, we provide a detailed overview of the models used, including their specifications and hyperparameter settings.
Table 4 presents the specific configurations of the machine learning models utilized in our study, outlining the hyperparameters adjusted to optimize each model’s performance. The hyperparameters for each model were selected based on a combination of empirical evidence, literature review, and preliminary testing to ensure optimal model performance. These settings reflect our commitment to leveraging the strengths of each model to accurately predict WP and NWP longitudinal cracking, taking into account the complexities of the dataset.
Table 4.
Hyperparameter settings for machine learning models.
8. Results and Discussion
This section presents a summary of the outcomes from utilizing different machine learning and traditional modeling approaches to simulate longitudinal cracking behaviors. The evaluation of the models’ effectiveness was based on the following performance metrics:
where n = the number of records, ŷt = the predicted response (i.e., predicated longitudinal cracking), yt = the measured response (i.e., measured longitudinal cracking), and = the average of measured response.
To ensure the robustness of our models and to mitigate the risk of overfitting, we employed a 10-fold cross-validation technique for each model’s evaluation. In this approach, the dataset is partitioned into ten equal segments. For each validation run, nine segments are utilized for training the model, while the remaining segment is used for testing its performance. This process is iterated ten times, with each segment serving as the test set once, ensuring that every data point contributes to both training and validation phases. The overall performance of each model is then assessed by calculating the average outcomes from these ten cross-validation runs, providing a comprehensive and reliable measure of the model’s predictive capabilities. Table 5 shows that machine learning models for predicting NWP longitudinal cracking exhibit varying performance across different algorithms. Linear regression, with a linear and robust variant, yields R-Squared values of 0.53 and 0.33, respectively, indicating moderate predictive capability. Regression trees, categorized as fine, medium, and coarse, demonstrate potential, with the fine tree achieving the highest R-Squared of 0.52. SVM exhibits mixed results, with linear SVM and quadratic SVM performing reasonably well, whereas cubic SVM struggles with an R-Squared of 0.02. Gaussian process regression models, particularly squared exponential GPR and matern 5/2 GPR, show promising predictive accuracy, surpassing many other algorithms with R-Squared values of 0.63. Ensemble trees, specifically boosted trees and bagged trees, outperform several models, achieving R-Squared values of 0.58 and 0.59, respectively.
Table 5.
Performance measures of machine learning models for NWP longitudinal cracking.
However, ANNs demonstrate varied performance. While the narrow neural network and medium neural network exhibit suboptimal R-Squared values (−0.08 and −0.71, respectively), the wide neural network, bilayered neural network, and trilayered neural network display negative R-Squared values, suggesting limitations in their ability to capture the complexity of NWP longitudinal cracking patterns. It has been reported that the reason for having a negative R-Squared is due to the very poor fitting of actual data, which increases the SSR beyond the TSS [62]. This means that the model fitting is poorer than fitting the data using the mean value. In this case, the SSR/TSS ratio will be more than 1.0, which yields a negative R-Squared value. Kernel-based models, such as SVM kernel and Least Squares Regression Kernel, showcase mixed results, with the former exhibiting an R-Squared of −0.24. The machine learning models present a spectrum of performance in predicting NWP longitudinal cracking, with Gaussian process regression and ensemble trees standing out as effective approaches. The findings emphasize the importance of selecting appropriate algorithms tailored to the specific characteristics of the distress pattern under consideration, offering valuable insights for the development of robust predictive models in pavement engineering.
The results of machine learning models for predicting WP longitudinal cracking summarized in Table 6 indicate diverse performance across different algorithms. Linear regression, including a linear and robust variant, shows varying success, with R-Squared values ranging from 0.22 to −0.14. Regression trees, categorized as fine, medium, and coarse, display promising predictive capability, particularly the medium tree, with an R-Squared of 0.35. SVMs exhibit mixed results, with cubic SVM outperforming others, with an R-Squared of 0.54. Gaussian process regression models, specifically squared exponential GPR and matern 5/2 GPR, demonstrate notable success, with R-Squared values of 0.62 and 0.61, respectively.
Table 6.
Performance measures of machine learning models for WP longitudinal cracking.
Ensemble trees, including boosted trees and bagged trees, showcase strong predictive accuracy, with R-Squared values of 0.60 and 0.51, respectively. ANNs present varying performance, with the narrow neural network and medium neural network yielding negative R-Squared values, suggesting limitations in capturing WP cracking patterns. The wide neural network, bilayered neural network, and trilayered neural network exhibit mixed success, emphasizing the importance of architecture selection. Kernel-based models, such as the SVM kernel and Least Squares Regression Kernel, demonstrate diverse outcomes, with the Least Squares Regression Kernel exhibiting a notable R-Squared of 0.39. In summary, the machine learning models offer a spectrum of performance in predicting WP longitudinal cracking, with notable success observed in regression trees, Gaussian process regression, and ensemble trees. These findings underscore the significance of tailored model selection for accurate prediction of WP longitudinal cracking distress in pavement engineering applications.
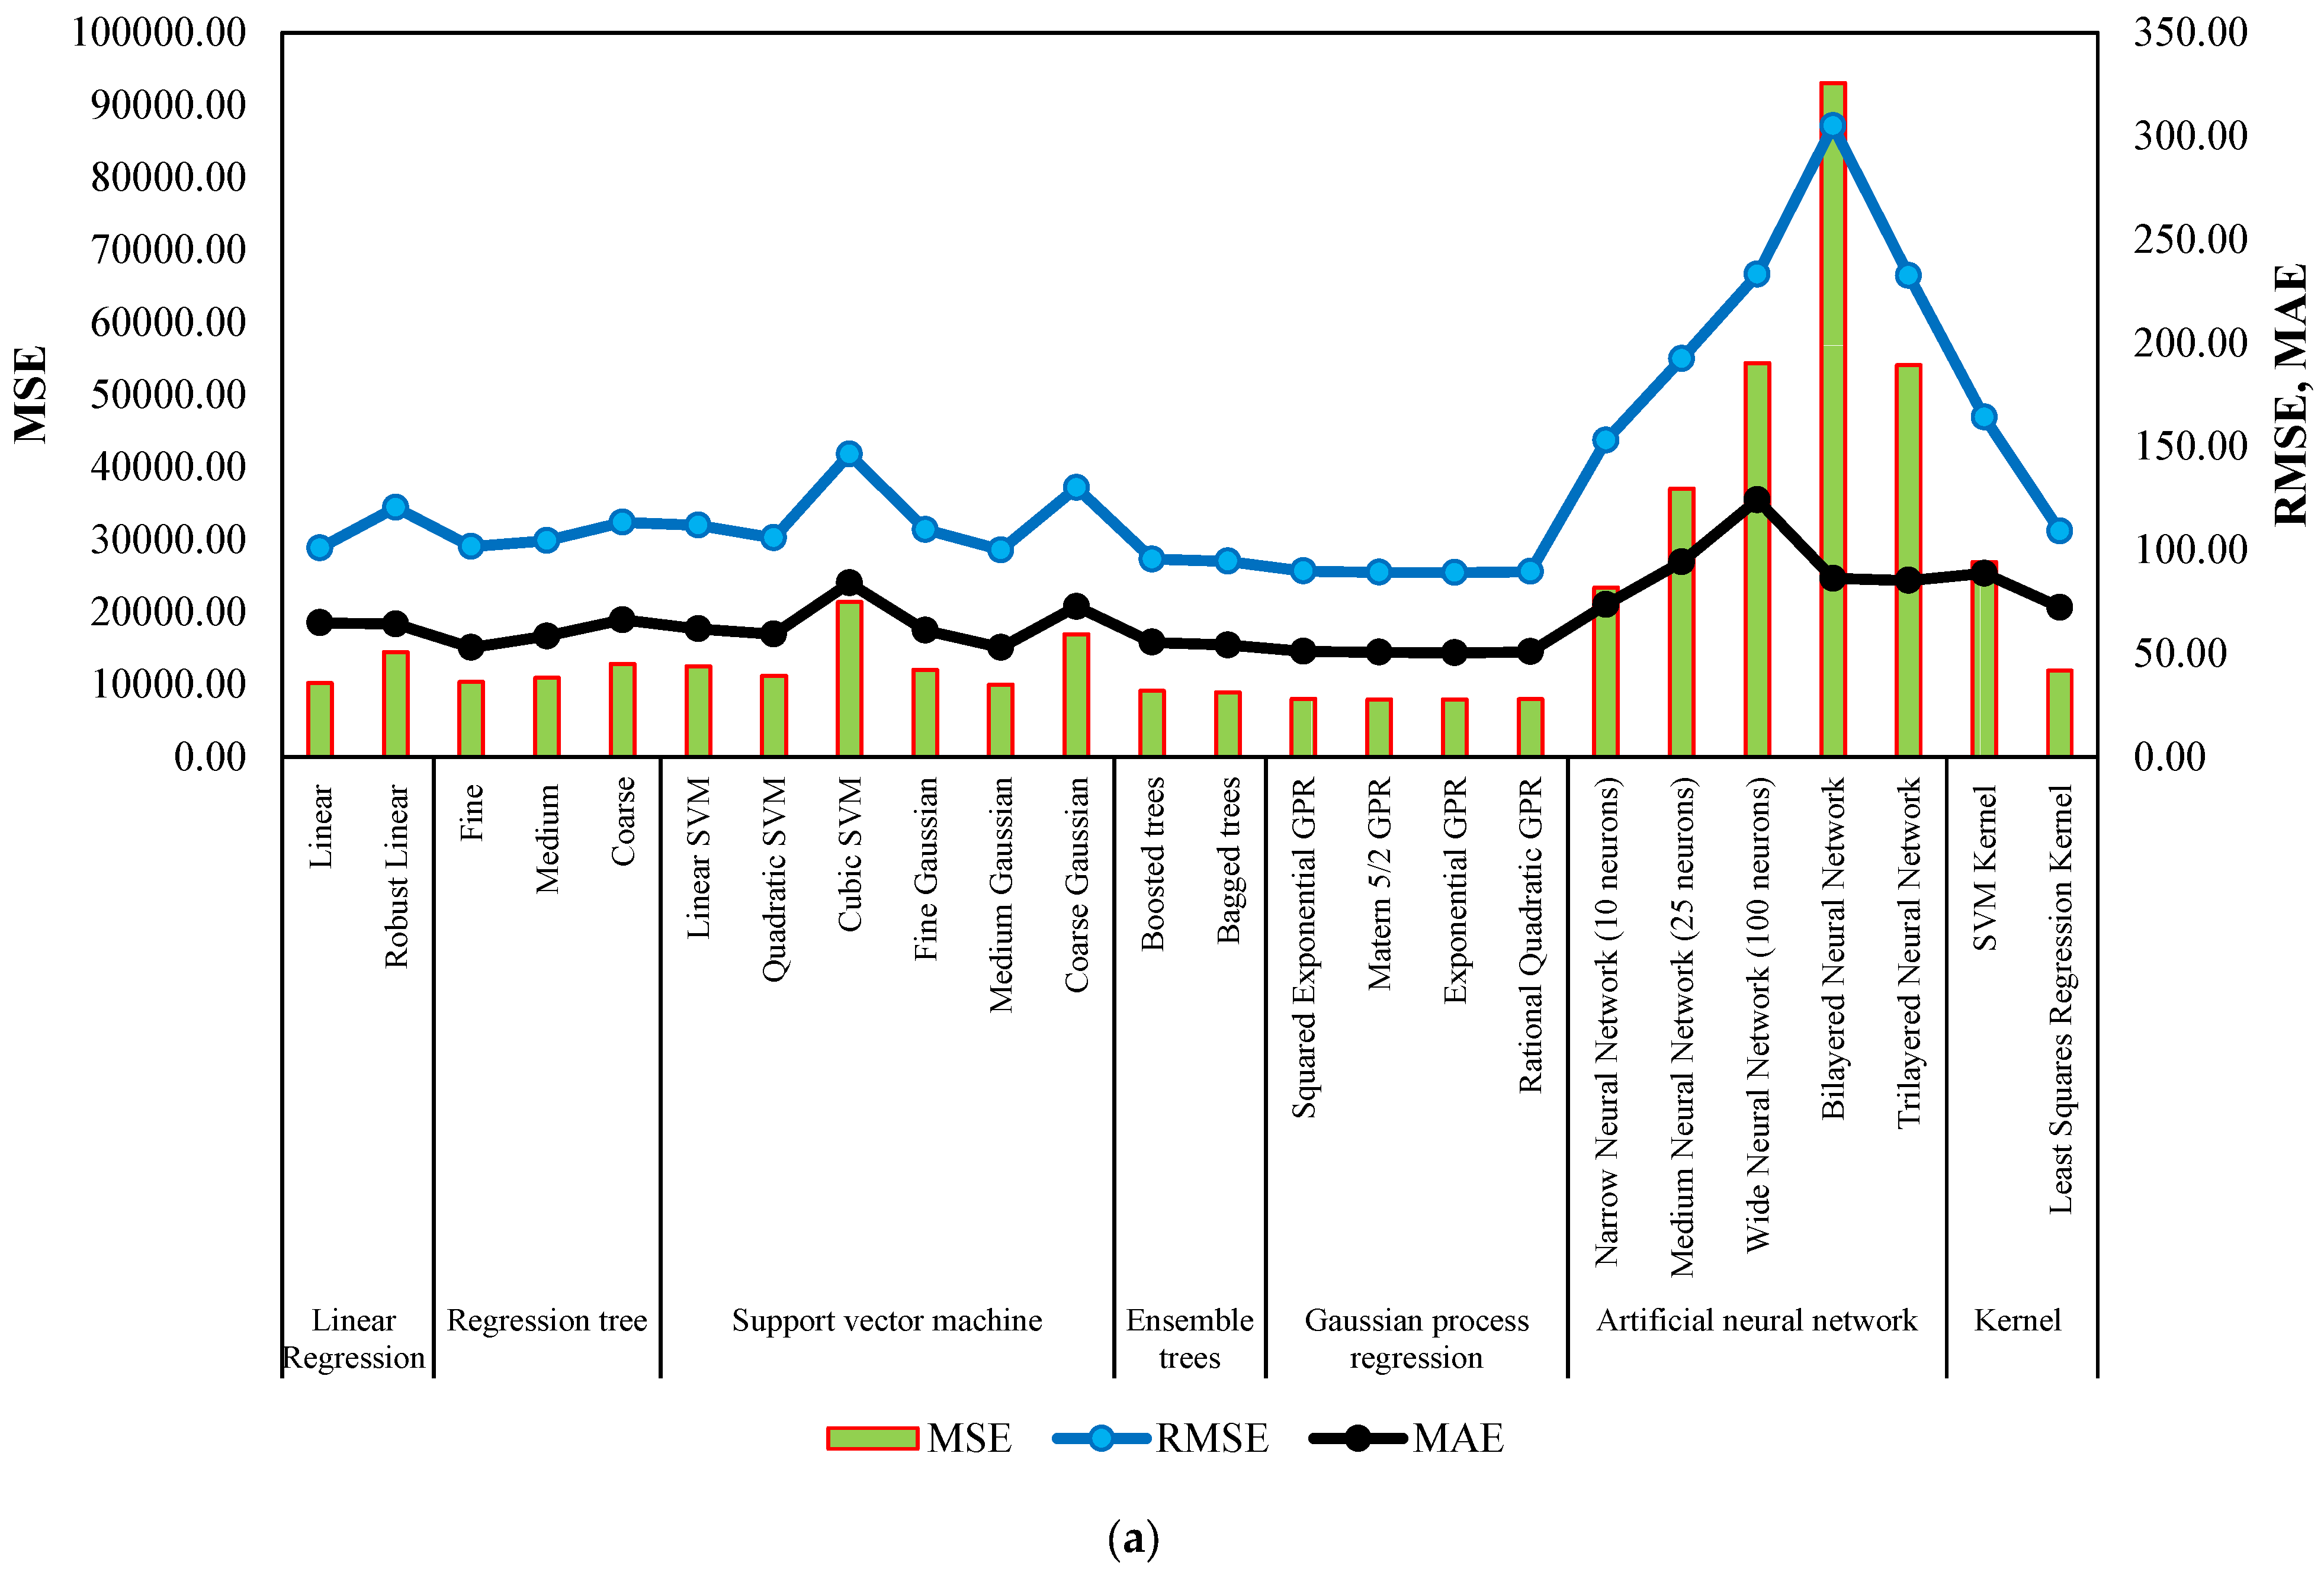
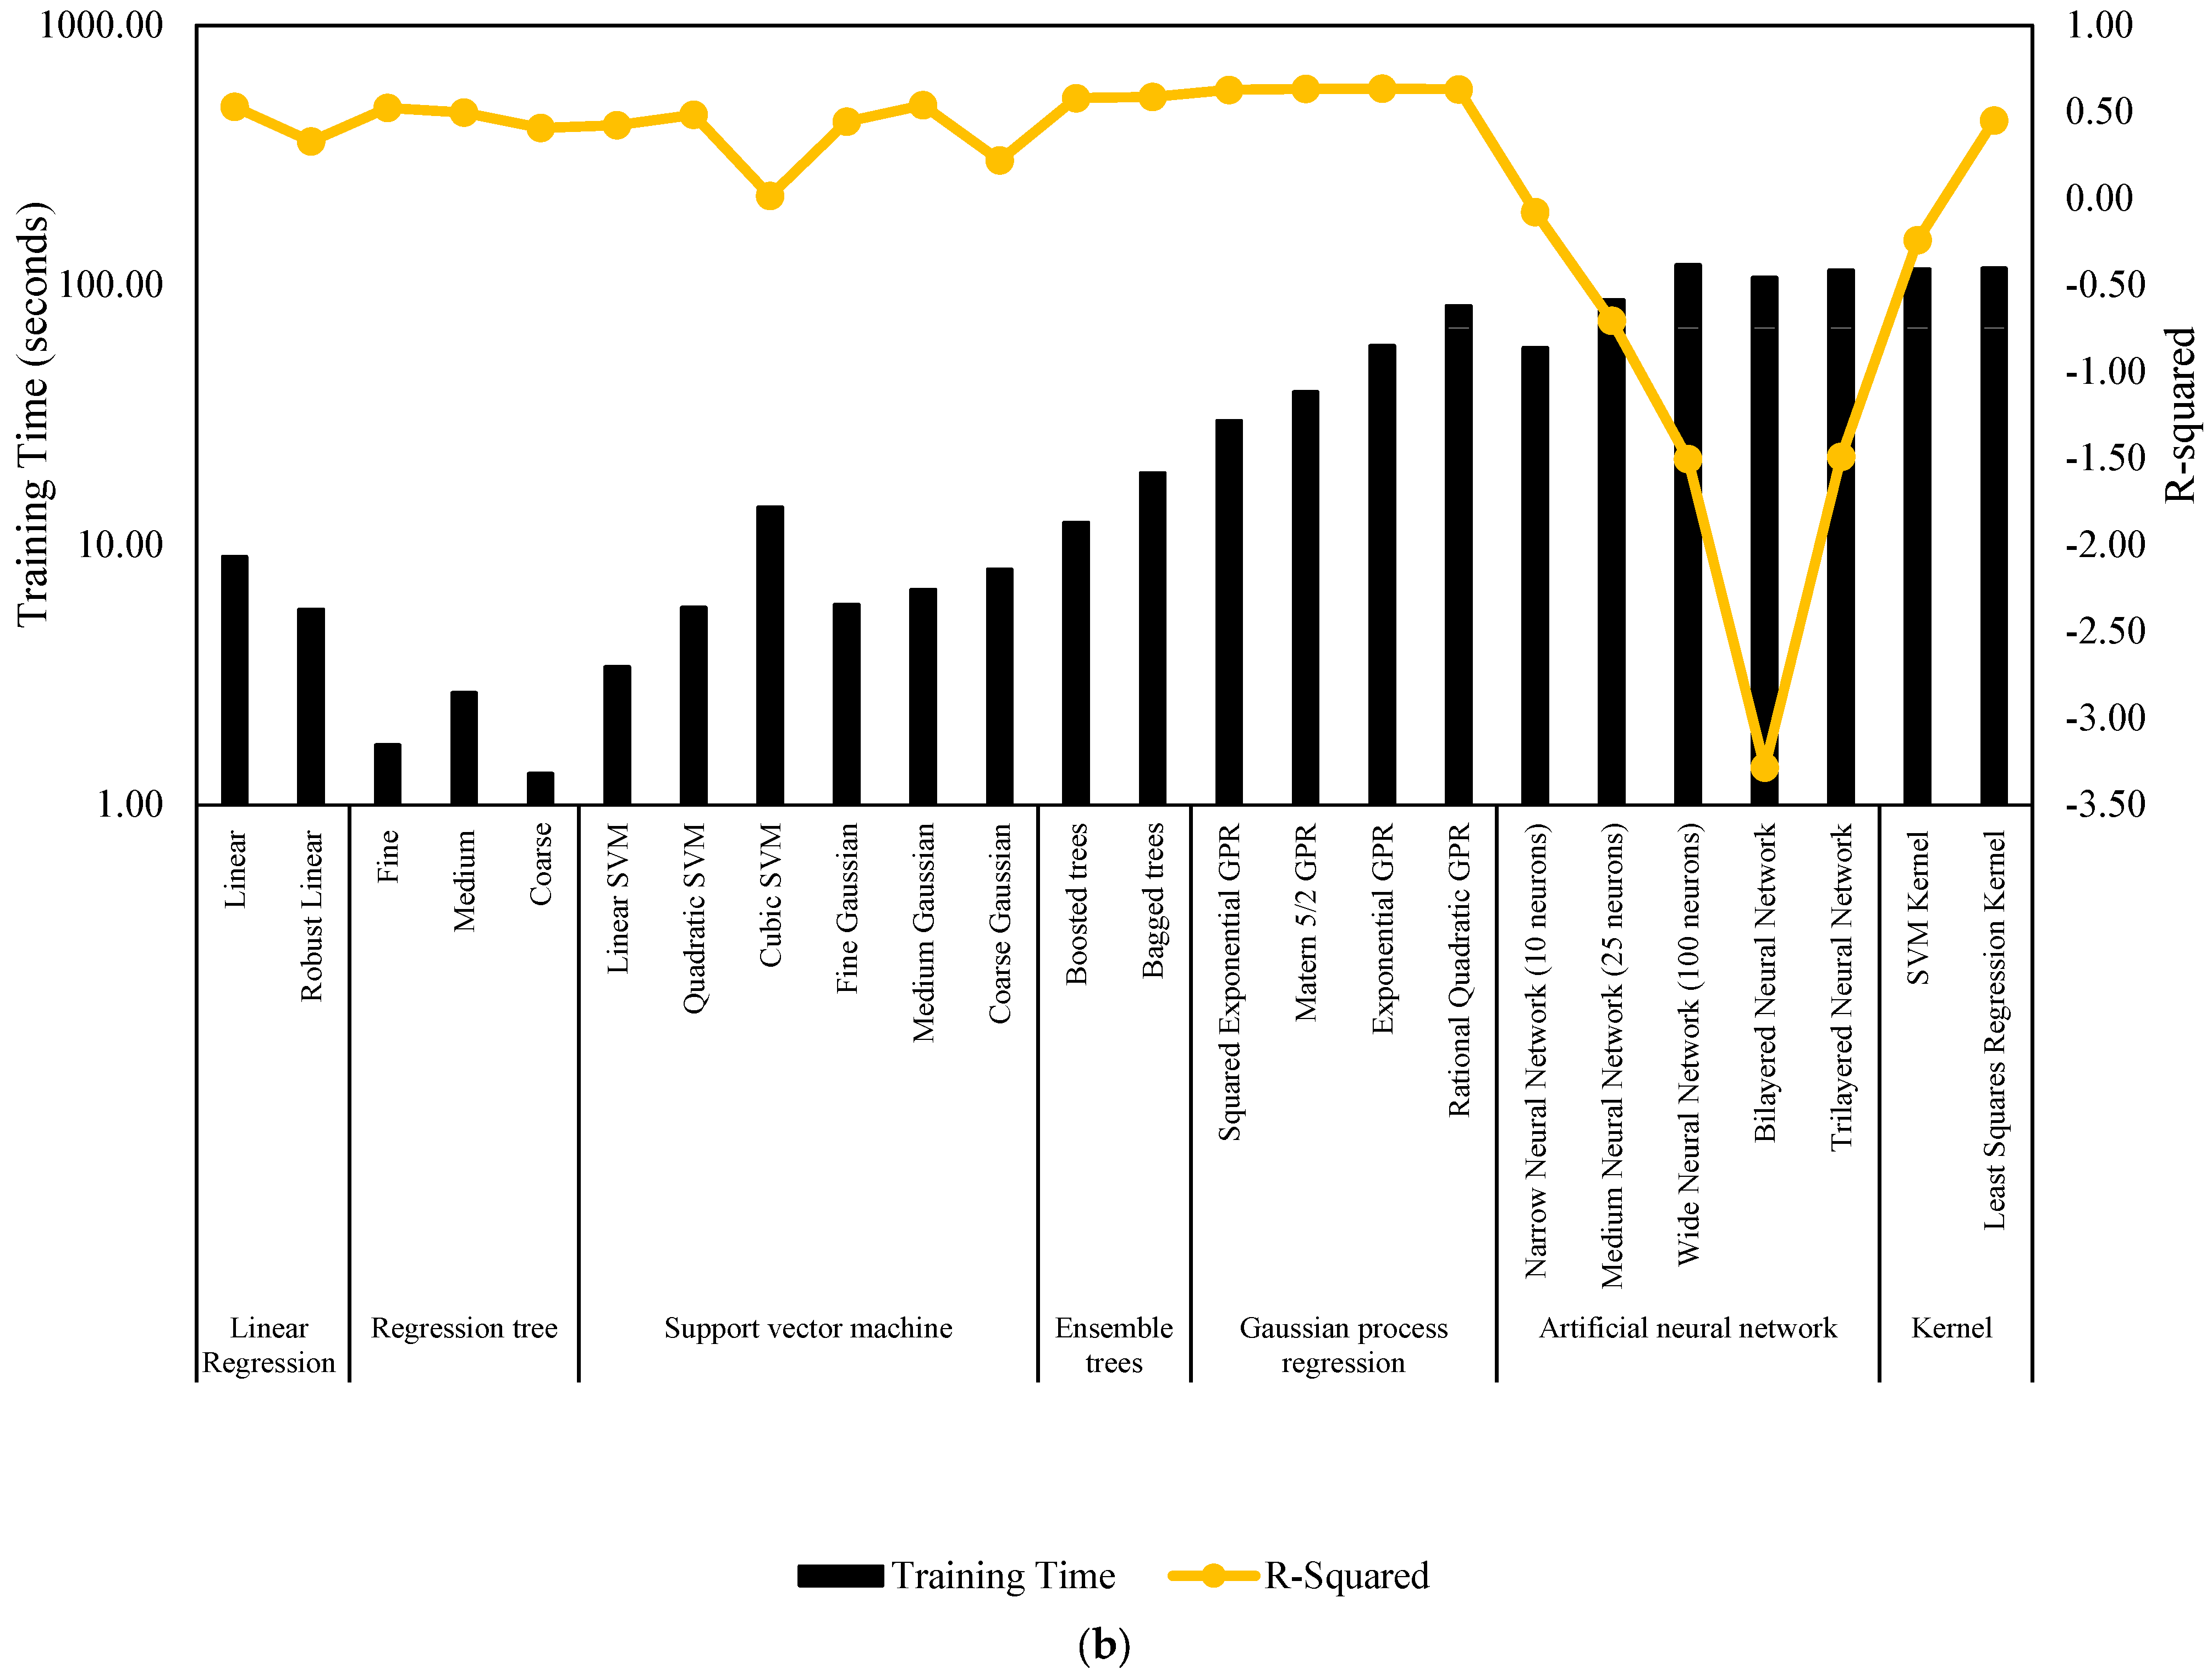
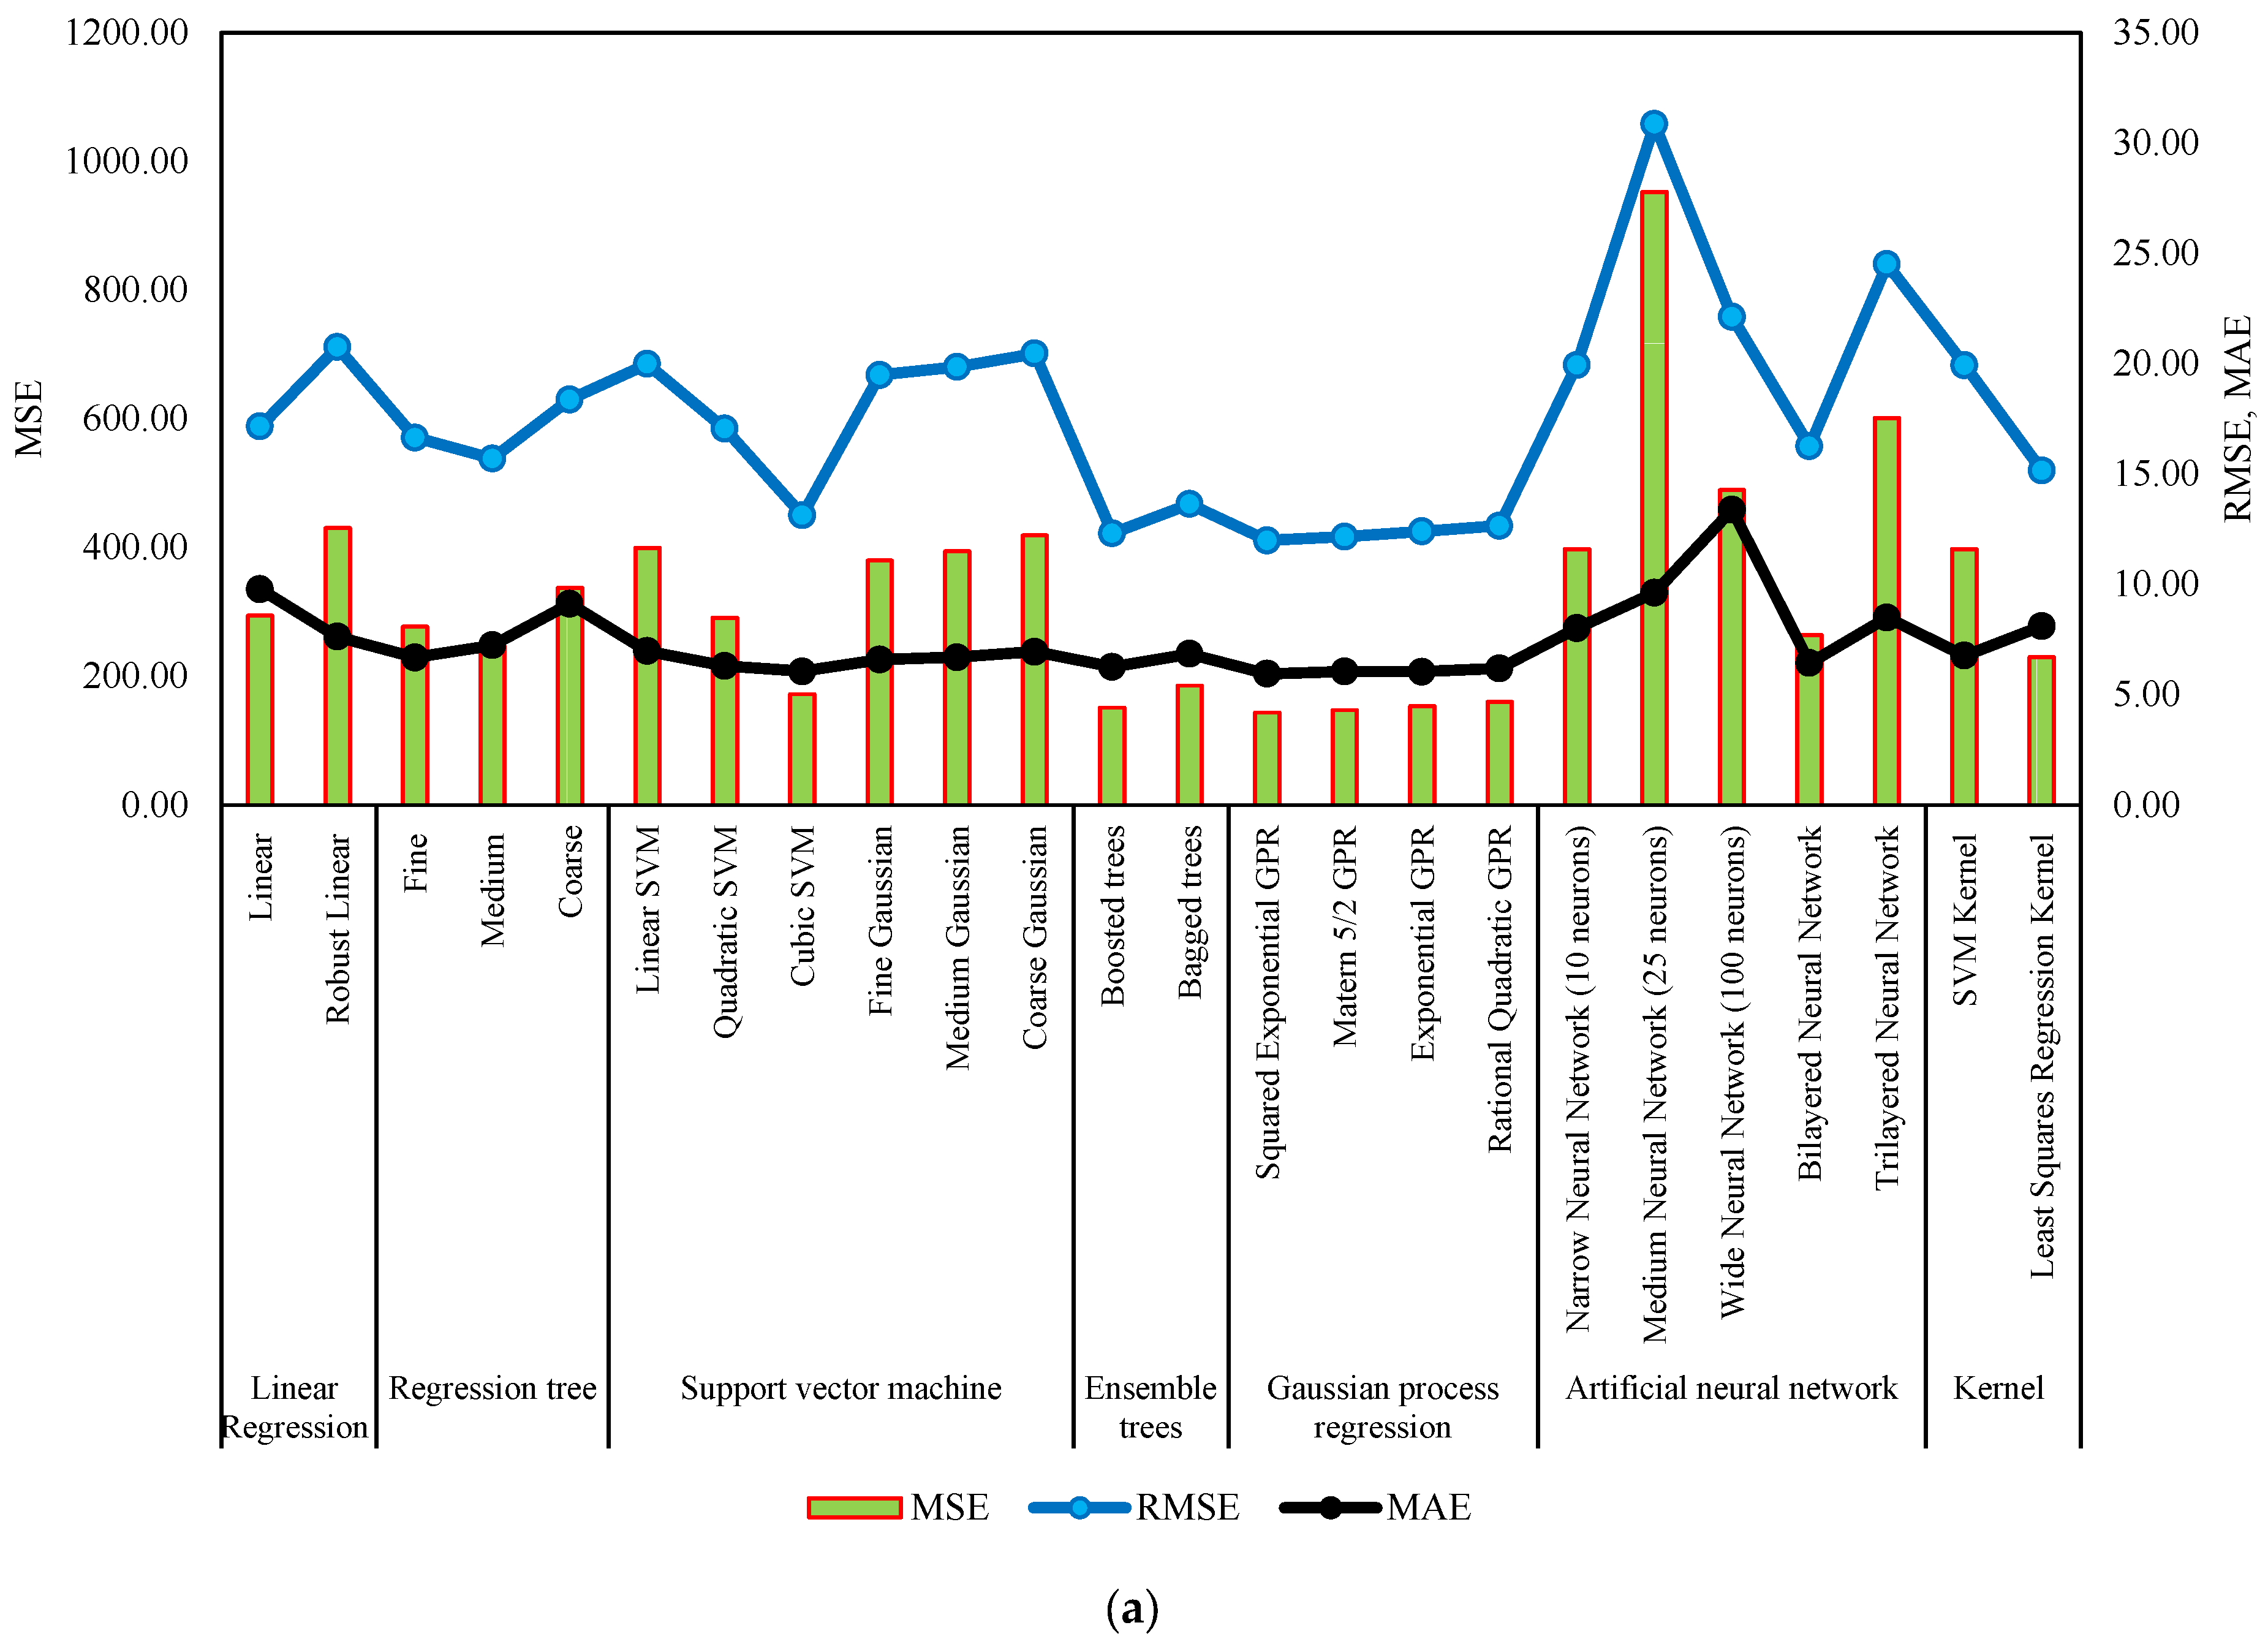
Figure 7 and Figure 8 serve as comprehensive visual representations of the performance of machine learning models in predicting NWP and WP longitudinal cracking, respectively. These figures offer a condensed overview of the accuracy measures, including RMSE, MSE, R-Squared, and MAE, for each model. The horizontal bars in the charts correspond to specific machine learning algorithms, facilitating a direct comparison of their predictive capabilities. The inclusion of multiple metrics allows for a nuanced evaluation of model performance, capturing various aspects of predictive accuracy. These figures complement the detailed tabular results in the manuscript, providing a visual aid that enhances the accessibility and interpretability of the extensive performance analysis conducted for NWP and WP longitudinal cracking prediction.
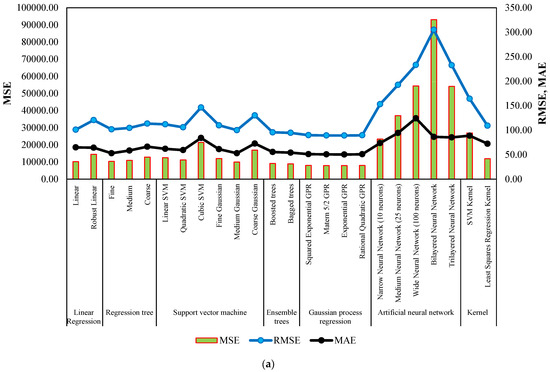
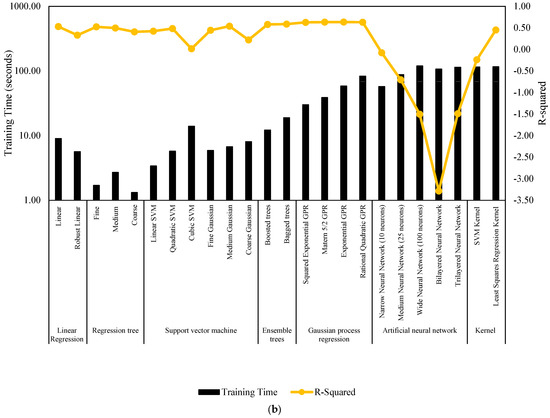
Figure 7.
Performance summary of machine learning models for NWP longitudinal cracking. (a) MSE, RMSE, and MAE. (b) Training time and R-Squared.
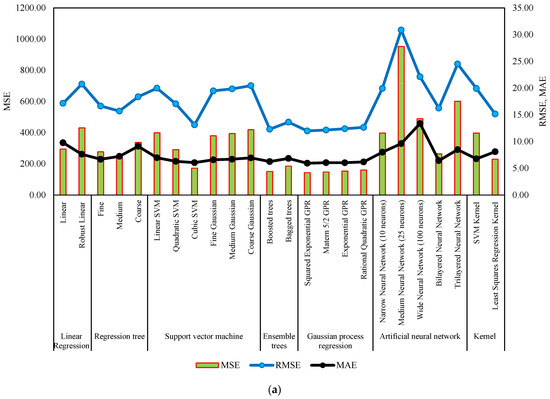
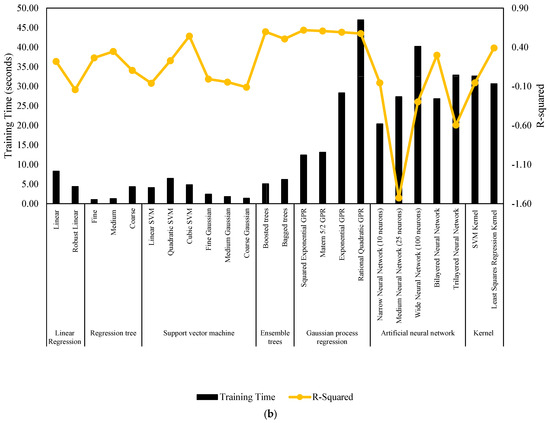
Figure 8.
Performance summary of machine learning models for WP longitudinal cracking. (a) MSE, RMSE, and MAE. (b) Training time and R-Squared.
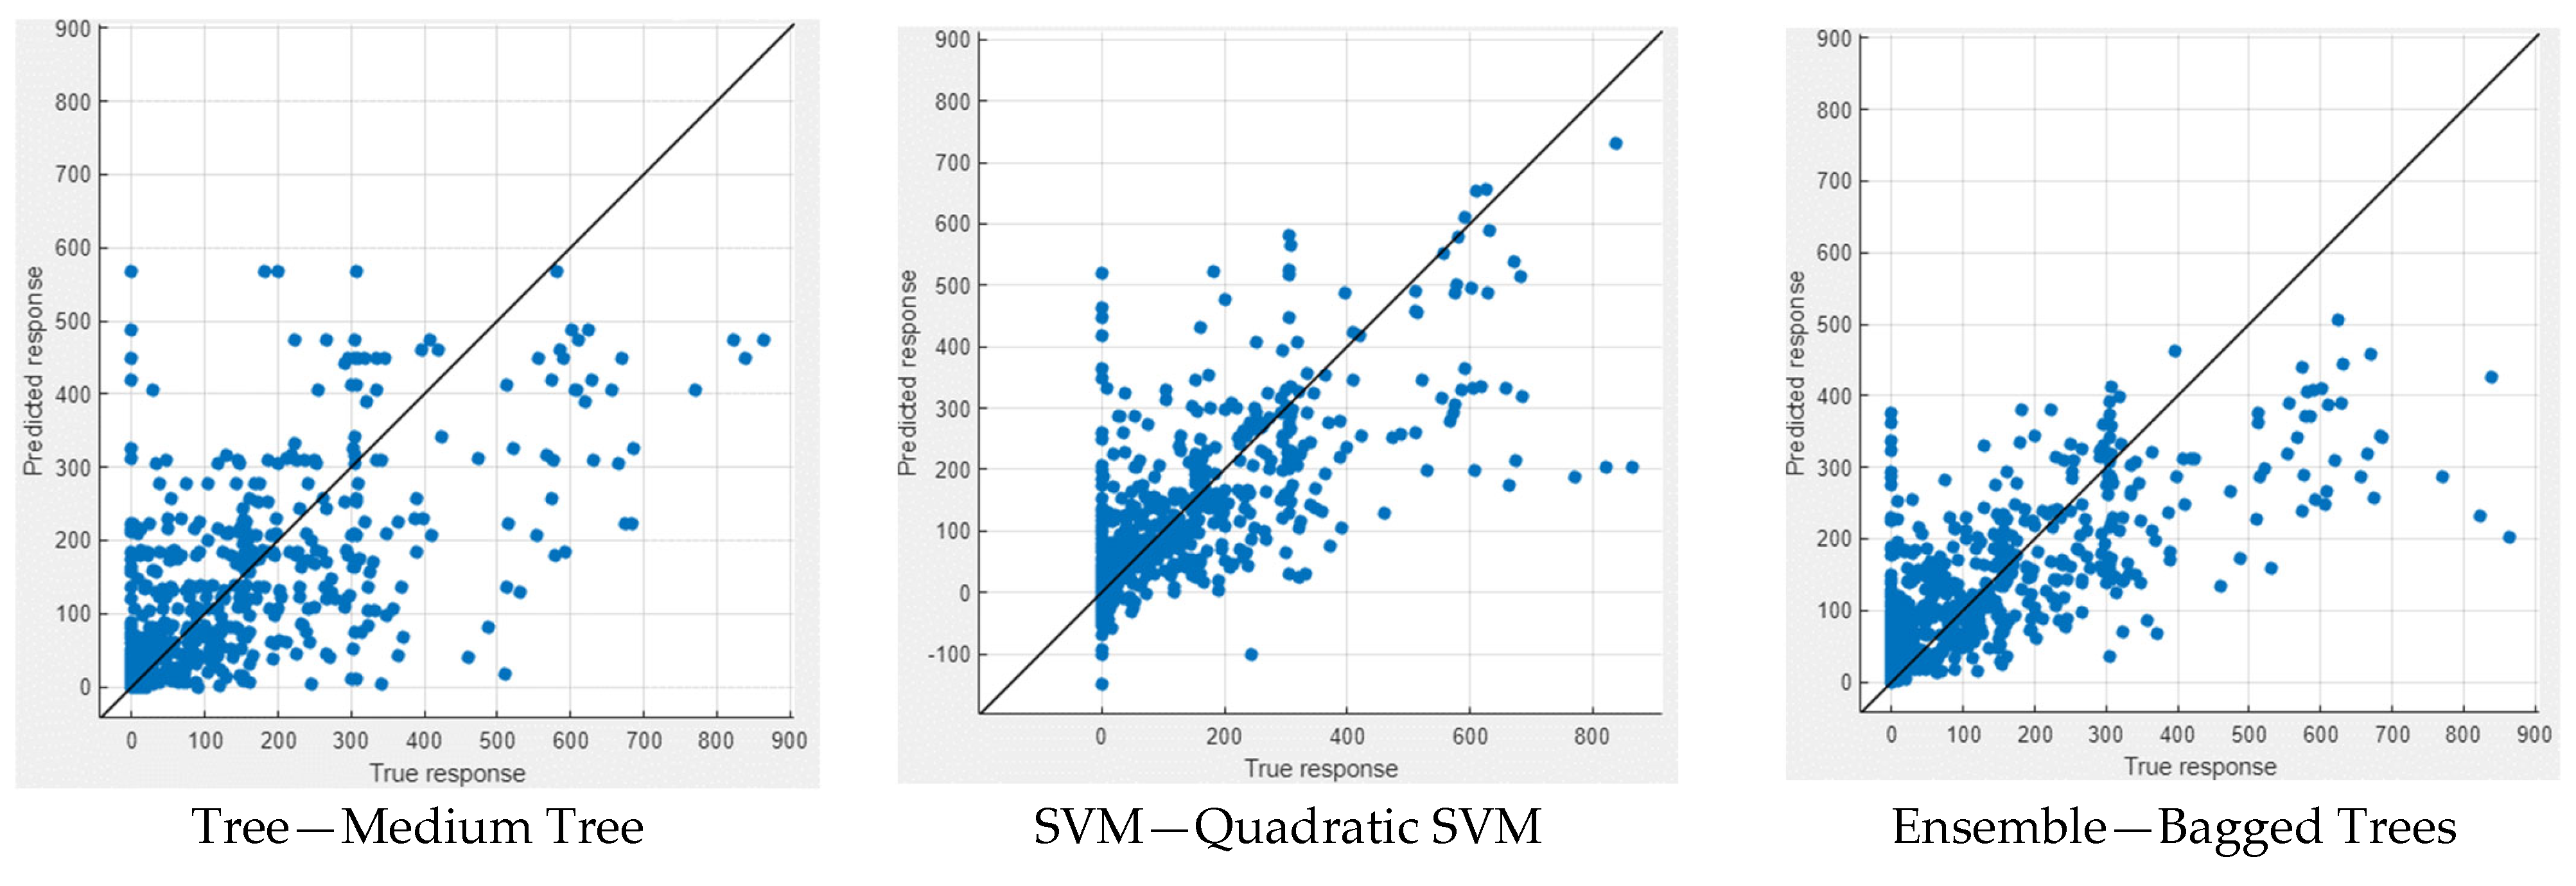
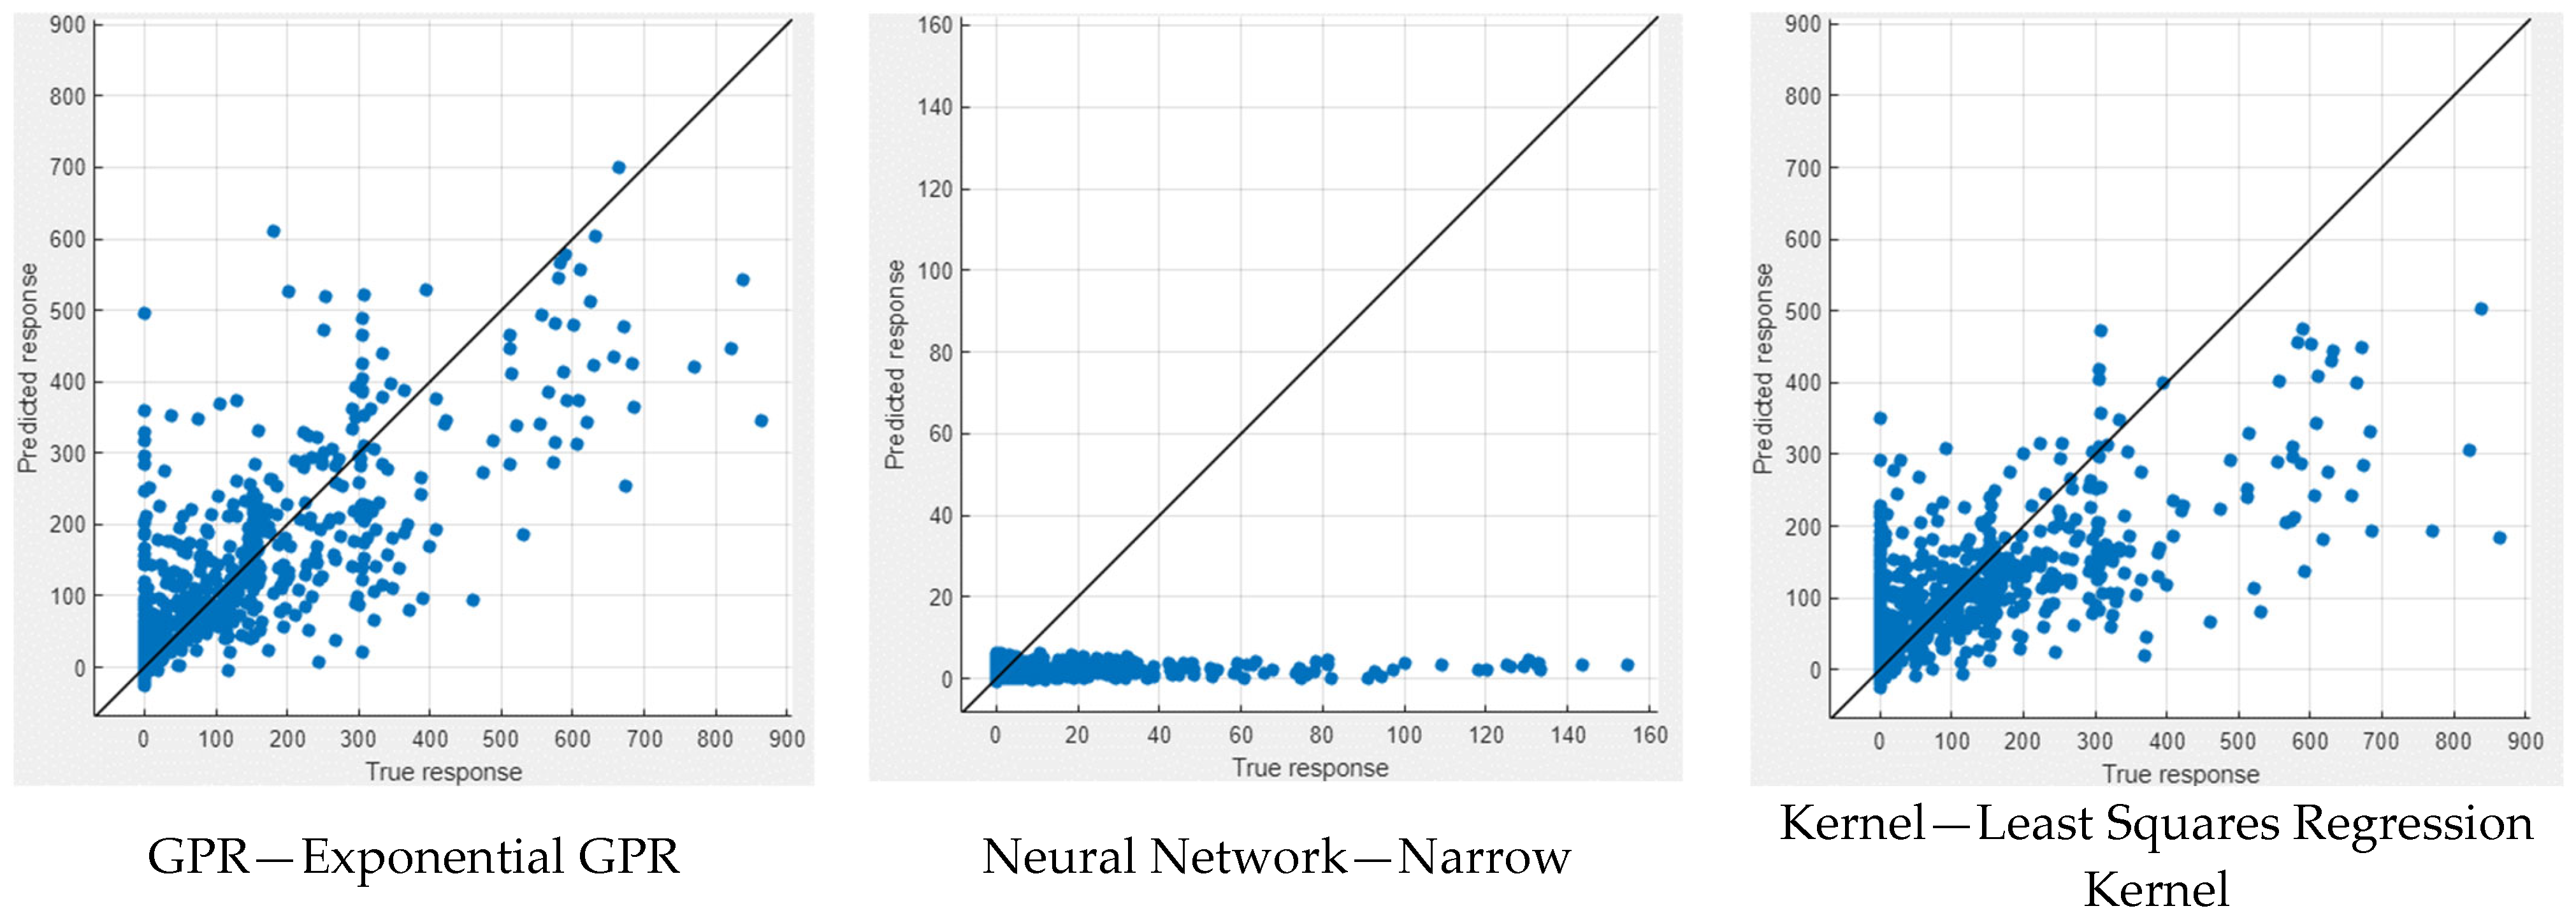
In Figure 9 and Figure 10, the performance measures for both NWP and WP longitudinal cracking are visually presented through scatter diagrams, showcasing the comparison between measured and predicted values for the six best-performing machine learning models for each crack type. The scatter patterns offer valuable insights into the predictive accuracy of the models, revealing a substantial alignment of most data points along the equality line. This alignment indicates a commendable fit between the measured and predicted values, demonstrating the efficacy of the models in capturing the inherent data patterns. While minor deviations from the equality line are observed, signifying occasional disparities, the scatter diagrams collectively affirm the overall effectiveness of the selected machine learning techniques in approximating the observed data. Notably, the scatter diagrams highlight GPR models as consistently excelling in both NWP and WP scenarios, displaying the most favorable scatter patterns among the top-performing models. This visual confirmation bolsters the quantitative findings and reinforces the conclusion that GPR models offer superior predictive performance for NWP and WP longitudinal cracking. The robust alignment of data points along the equality line in the GPR scatter diagrams underscores their reliability and accuracy, further emphasizing their potential as robust tools in pavement engineering applications.
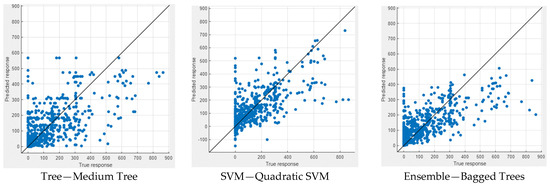
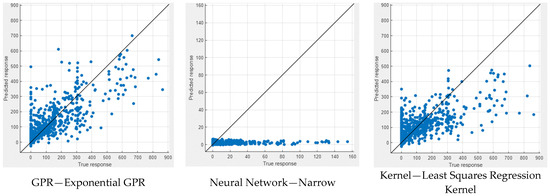
Figure 9.
Measured vs. predicted values of NWP.
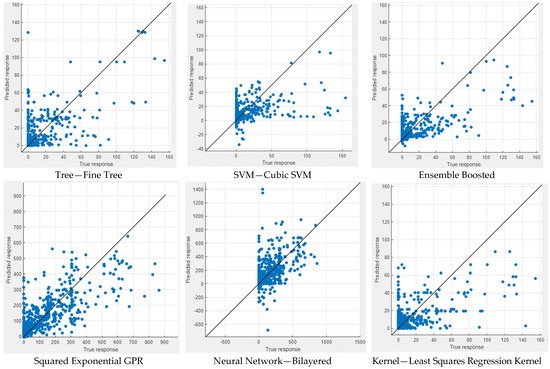
Figure 10.
Measured vs. predicted values of WP.
9. Comparison Analysis
9.1. Selection of the Models
In the comparative analysis, a meticulous selection of models was undertaken to provide a nuanced evaluation of longitudinal cracking prediction methodologies. The chosen models encompass a diverse range of approaches, each offering unique insights into the intricate dynamics of pavement distress. Here is an in-depth overview of the selected models:
- Gogoi, Dr. R. (2019) [47]:Longitudinal Cracking (m) = 0.24 × ESAL (msa) − 20.31
Gogoi’s model relies on the Equivalent Single-Axle Load (ESAL) as a fundamental predictor. The linear equation used in this model offers a straightforward yet insightful estimation of the longitudinal cracking magnitude, emphasizing the influence of load characteristics on pavement performance.
- 2.
- Radwan et al., 2020 [48]:
Radwan et al.’s 2020 model introduces a sophisticated blend of exponential and sinusoidal functions. By considering variables such as moisture content (MCb), resilient modulus (Mr), pavement age (PA), and the percentage passing the #200 sieve (P200), this model captures the nuanced interplay of environmental and material factors influencing longitudinal cracking under different conditions.
- 3.
- Radwan et al. 2022 [49]:
Longitudinal Cracking (m) = 4.562 − 0.129 × Age (years) + 0.181 P200
Radwan et al.’s 2022 model takes a linear approach, utilizing pavement age and the passing percentage of #200 sieve (P200) as predictors. This model delves into the temporal and material aspects of longitudinal cracking, offering valuable insights into how age and material characteristics contribute to pavement distress.
The deliberate inclusion of empirical, exponential, and linear models in this selection ensures a comprehensive and nuanced exploration of longitudinal cracking prediction. This approach allows for a detailed comparative analysis, shedding light on the strengths and limitations of each model in capturing the complexities of pavement distress in flexible pavements.
9.2. Comparative Results
Table 7 presents a detailed dataset for model comparison, encompassing various key attributes for different pavement sections across different states and climate regions. Each row corresponds to a specific pavement section, and the columns provide information on the climate region, MCb of base/sub-base courses, Mr of subgrade soil in MPa, PA in years, P200 of subgrade soil, and ESAL.
Table 7.
Data collected for model comparison.
Empirical models, such as those developed by Gogoi et al. [47]. and Radwan et al. [48,49], have significantly contributed to our understanding of pavement performance, particularly regarding longitudinal cracking. However, these models often operate under a set of simplified assumptions that may not fully encapsulate the complex dynamics influencing pavement deterioration. One notable limitation of these empirical approaches is their potential lack of adaptability to diverse environmental conditions, traffic patterns, and material characteristics, which can lead to predictive inaccuracies. Furthermore, empirical models are typically derived from specific datasets, which may limit their generalizability to other contexts or conditions not represented in the original data.
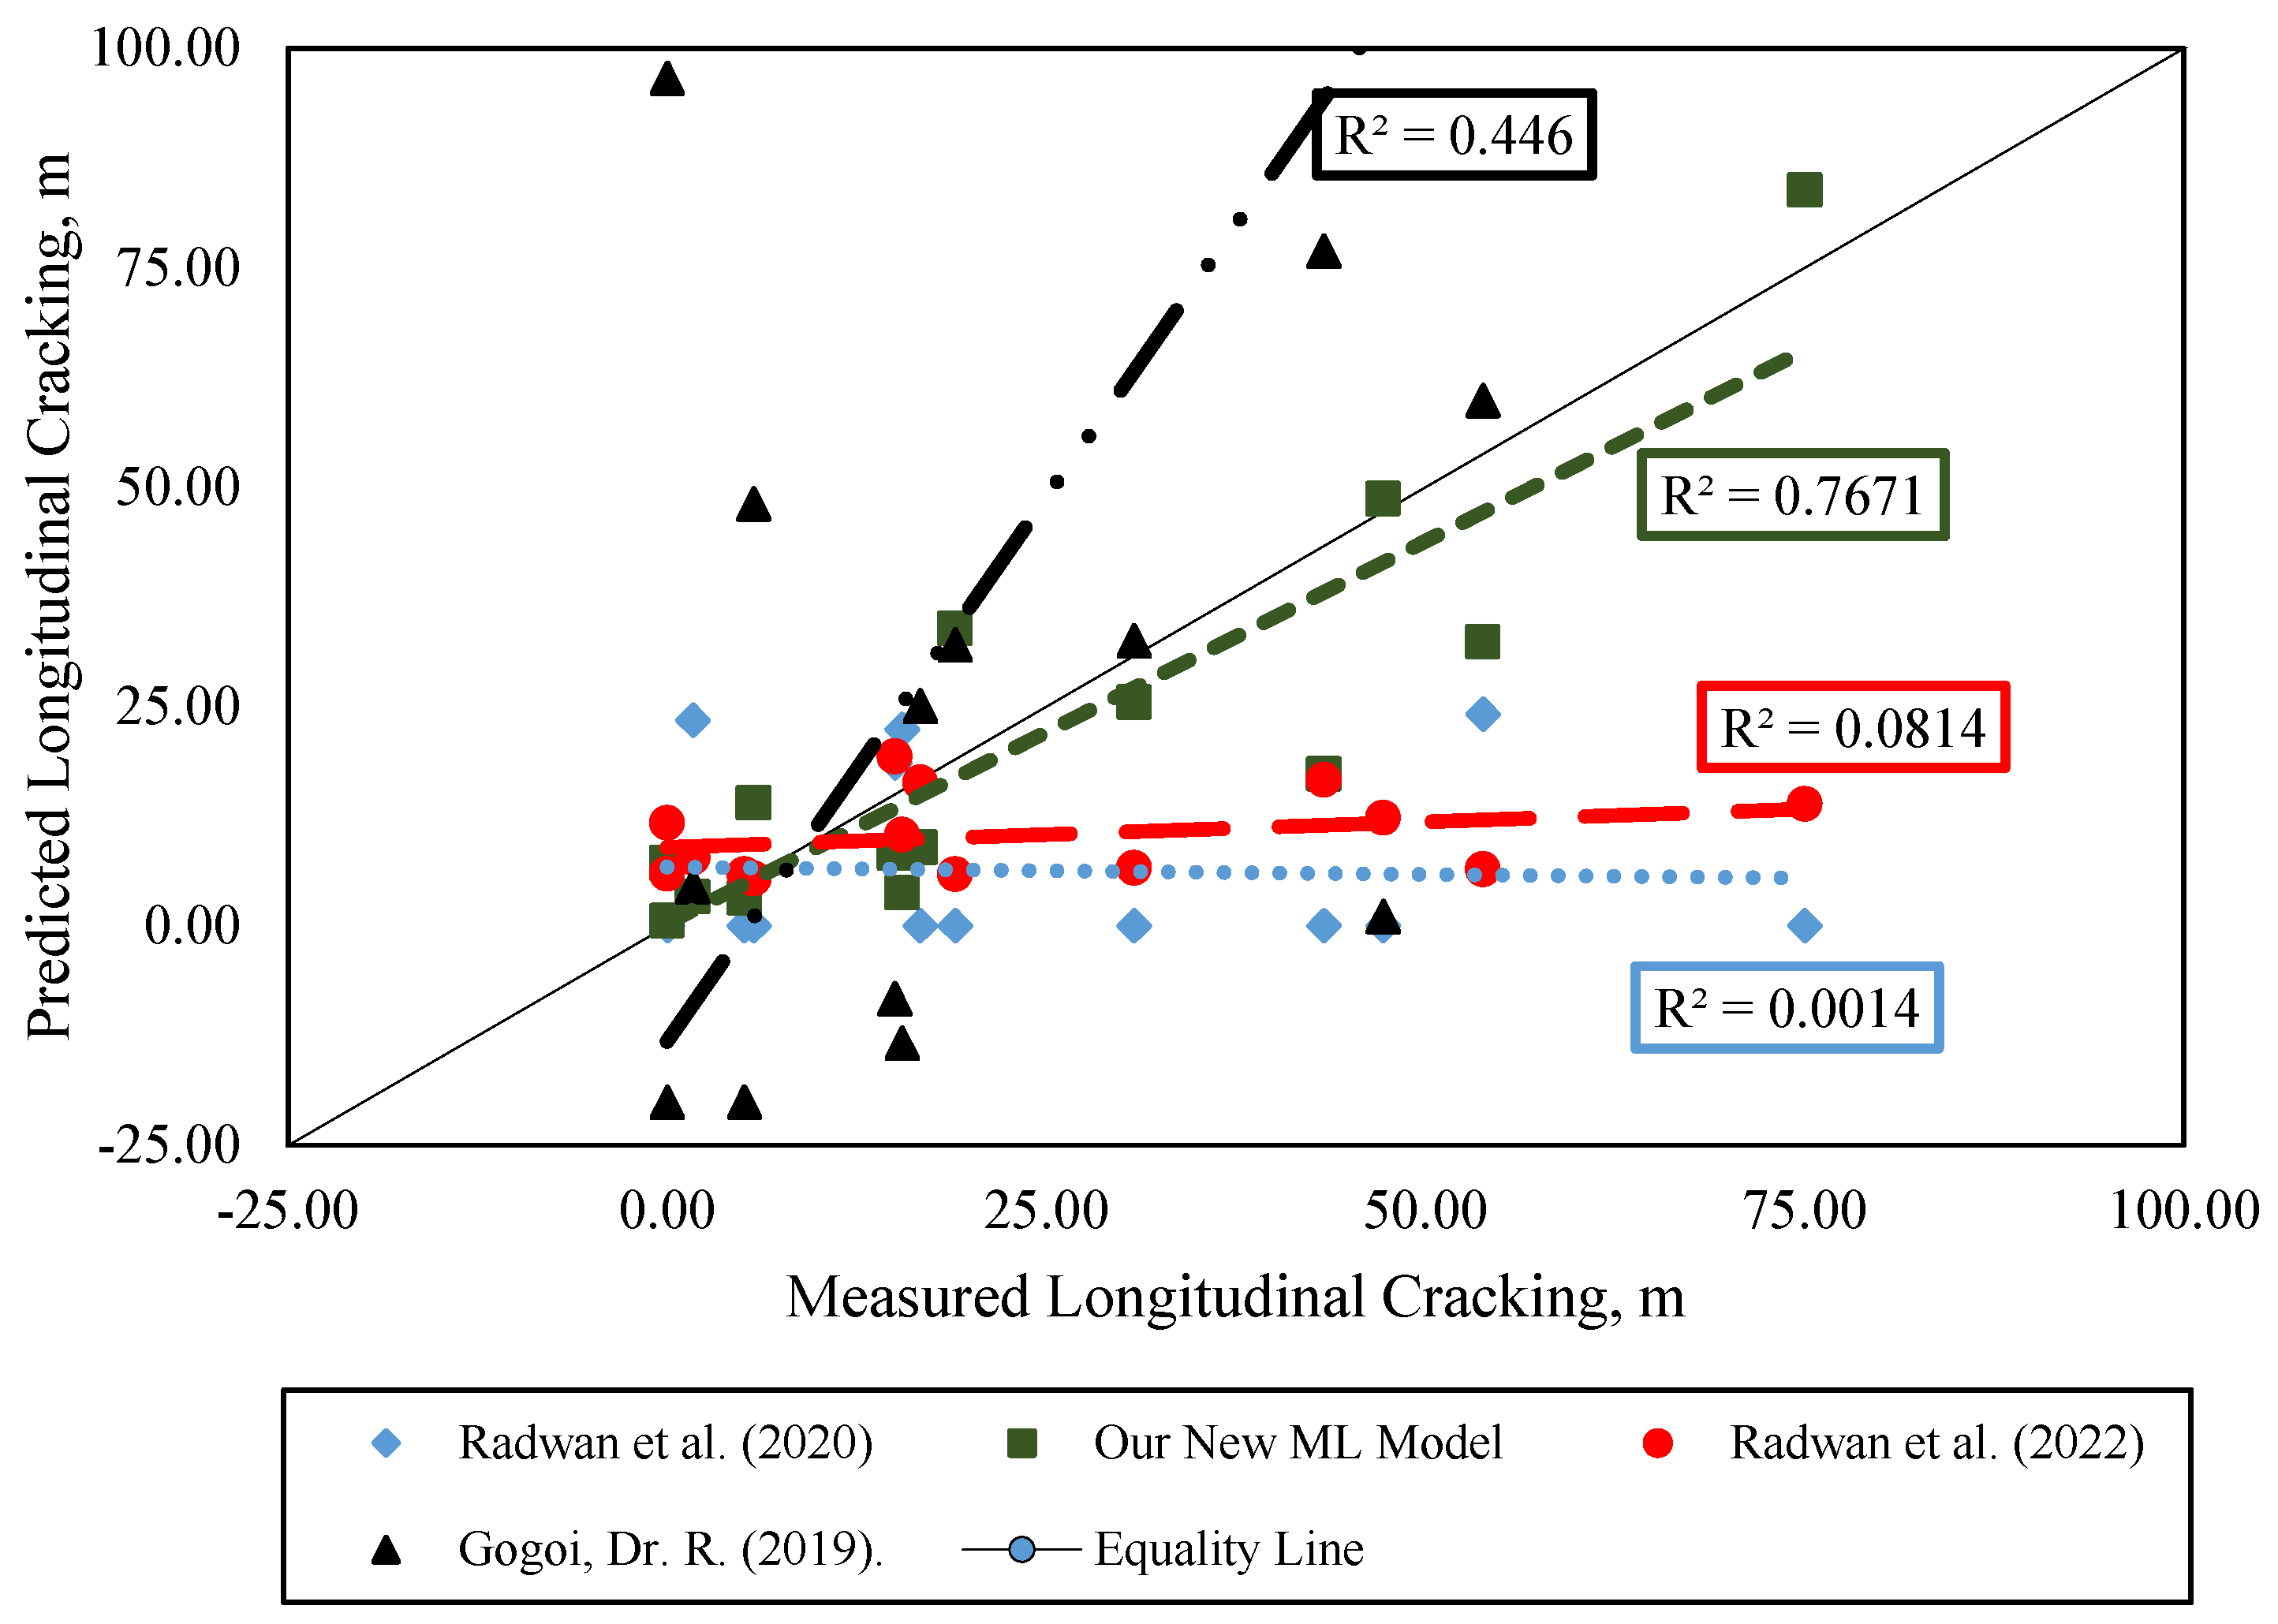
Contrastingly, our machine learning model exhibits a marked improvement in addressing these limitations. As detailed in Table 8 and Figure 11, our model achieves a significantly higher predictive accuracy, with an R-Squared value of 0.767. This compares favorably against the R-Squared values reported by Gogoi et al. [47] (0.446) and Radwan et al. in their 2020 [48] (0.0014) and 2022 [49] (0.0814) studies, respectively. The enhanced performance of our model can be attributed to its ability to discern and learn from the complex, non-linear interrelationships among a wide array of factors that contribute to longitudinal cracking. This capability is something that traditional empirical models, with their more linear and constrained formulations, inherently lack.
Table 8.
Comparison of analysis results.
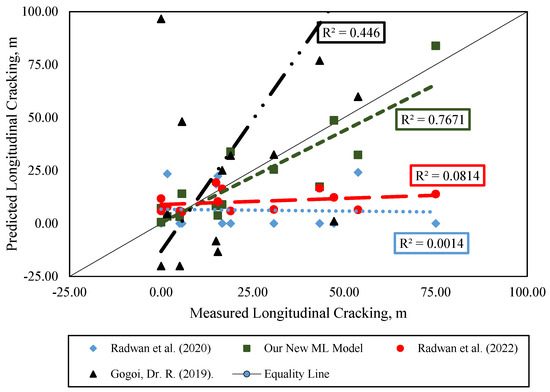
Figure 11.
Measured vs. predicted rutting values for different models [47,48,49].
Moreover, the machine learning approach we employed demonstrates remarkable generalizability and flexibility, making it applicable across a broad spectrum of pavement conditions, climates, and traffic scenarios. This adaptability is facilitated by the model’s advanced algorithms, which can process extensive datasets containing diverse variables, thereby ensuring the model’s relevance and applicability to a wide range of real-world conditions.
Additionally, our comparative analysis sheds light on the specific advantages of utilizing machine learning for pavement distress modeling, particularly its robustness in accurately predicting both wheel path and non-wheel path longitudinal cracking scenarios. This level of detail and predictive precision highlights the significant potential of machine learning techniques to offer deeper insights into pavement-deterioration mechanisms and to guide the development of more effective maintenance and rehabilitation strategies.
By integrating this comprehensive comparative analysis into our manuscript, we aim not only to highlight the limitations of existing empirical models but also to underscore the transformative potential of machine learning in the realm of pavement engineering. Our findings advocate for the adoption of sophisticated, data-driven approaches that enhance predictive accuracy and generalizability, thereby paving the way for advancements in research and practical applications within the field.
10. Conclusions
This paper deals with developing NWP and WP longitudinal cracking models utilizing multiple machine learning techniques using data extracted from the LTPP database. The findings of this study are summarized as follows:
- The mean values for NWP and WP longitudinal cracking, denoted as 15.57 m and 110.48 m, respectively, reveal substantial variability. This highlights the diverse nature of distress conditions across the pavement sections, emphasizing the need for accurate predictive models to address the distinct characteristics of WP and NWP longitudinal cracking.
- The correlation analysis indicates a robust positive correlation between pavement age and WP longitudinal cracking, signifying increased cracking with pavement aging and deterioration. Additionally, a notable positive correlation emerges between the initial IRI and NWP longitudinal cracking, suggesting that pavements with higher initial roughness are more susceptible to developing cracks in the NWP over time.
- Material characteristics (L1, L3, L2, L4), kinematic viscosity, pavement thickness, air voids, particle size distribution, pavement age, and asphalt content are the key factors influencing WP longitudinal cracking.
- Temperature, pavement age, KESAL, and asphalt-related properties such as bulk specific gravity and asphalt content significantly affect NWP longitudinal cracking.
- The exponential GPR emerges as the optimal model for predicting NWP longitudinal cracking, demonstrating the lowest RMSE (89.11) and MSE (7940.72) and highest R-Squared value (0.63).
- The most important result from the machine learning analysis for WP longitudinal cracking is the excellent performance of the squared exponential GPR model, which achieved the lowest RMSE of 12.00, MSE of 143.93, and highest R-Squared value of 0.62.
- GPR, specifically with the squared exponential kernel for WP longitudinal cracking and the matern 5/2 kernel for NWP longitudinal cracking, consistently outperformed other models, indicating its robustness and suitability for predicting both longitudinal cracking scenarios. This unified modeling approach demonstrates GPR’s versatility, applicability, and practicality across diverse pavement conditions.
- The comparative analysis underscores the limitations of empirical models like Gogoi et al. (2019) [47] and Radwan et al. (2020) [48] and Radwan et al. (2022) [49] in accurately predicting longitudinal cracking. Our newly proposed machine learning model consistently outperforms these models, highlighting its superior predictive accuracy. This signifies the potential of machine learning to enhance precision and adaptability in pavement distress prediction, supported by a comprehensive evaluation across diverse states and conditions.
11. Future Works
- Integrate the best machine learning models with explainable artificial intelligence (xAI) algorithms to try to investigate the influence of the input variables with respect to the outputs. In other words, try to illuminate the typical “black-box” feature of machine learning models.
- Although GPR achieved the best performance in our study, there is still room for model improvement. We can explore different kernel functions or optimize hyperparameters to enhance the predictive accuracy of GPR. Additionally, we can investigate other advanced regression techniques, such as deep learning models or gradient boosting, to potentially achieve better results.
- Investigate the use of ensemble methods specifically tailored for regression problems. Ensemble techniques, such as Random Forests or gradient boosting, can combine multiple models to improve prediction accuracy and handle non-linear relationships between features and the target variable.
- In future research, we aim to conduct external validation of our machine learning models using independent datasets from diverse geographic locations and pavement conditions. This step will significantly contribute to verifying the models’ generalizability and applicability across different settings, ensuring our findings are robust and widely applicable in the field of pavement engineering.
Author Contributions
Conceptualization, A.A., W.Z. and G.G.A.-K.; methodology, A.A., W.Z., G.G.A.-K. and M.A.; software, A.A.; validation, A.A., W.Z. and G.G.A.-K.; formal analysis, A.A., W.Z. and G.G.A.-K.; investigation, A.A., W.Z. and G.G.A.-K.; data curation, A.A.; writing—original draft preparation, A.A., W.Z., G.G.A.-K. and M.A.; writing—review and editing, A.A., W.Z., G.G.A.-K. and M.A.; visualization, A.A., W.Z. and G.G.A.-K.; supervision, W.Z., G.G.A.-K. and M.A.; All authors have read and agreed to the published version of the manuscript.
Funding
This research received no external funding.
Data Availability Statement
This dataset used in this study for control asphalt pavement sections without maintinance and rehabilitation can be downloaded from https://infopave.fhwa.dot.gov/.
Conflicts of Interest
The authors declare no conflict of interest.
References
- AASHTO. Pavement Management Guide, 2nd ed.; AASHTO: Washington, DC, USA, 2012. [Google Scholar]
- Vasquez, C.A. Pavement Management Systems on a Local Level. Master’s Thesis, Utah State University, Logan, UT, USA, 2011. [Google Scholar]
- Hassan, R.; Lin, O.; Thananjeyan, A. A comparison between three approaches for modelling deterioration of five pavement surfaces. Int. J. Pavement Eng. 2015, 18, 26–35. [Google Scholar] [CrossRef]
- Saha, P.; Ksaibati, K.; Atadero, R. Developing pavement distress deterioration models for pavement management system using markovian probabilistic process. Adv. Civ. Eng. 2017, 2017, 8292056. [Google Scholar] [CrossRef]
- Schorsch, M.R. Determining the Causes of Top-Down Cracks in Bituminous Pavements; No. RC-1440; Michigan State University: East Lansing, MI, USA, 2003. [Google Scholar]
- Harmelink, D.; Aschenbrener, T. Extent of Top-Down Cracking in Colorado; No. CDOT-DTD-R-2003-7; Colorado Department of Transportation Research Branch: Denver, CO, USA, 2003.
- Pellinen, T.; Rowe, G.; Biswas, K. Evaluation of Surface (Top Down) Longitudinal Wheel Path Cracking; Joint Transportation Research Program; Purdue University: West Lafayette, IN, USA, 2004; Volume 93. [Google Scholar]
- Matsuno, S.; Nishizawa, T. Mechanism of longitudinal surface cracking in asphalt pavement. In Proceedings of the International Conference on Asphalt Pavements, Nottingham, UK, 16–20 August 1992; Volume 2. [Google Scholar]
- Wambura, J.H.G.; Maina, J.; Smith, H.R. Kenya Bituminous Materials Study. Transp. Res. Rec. 1999, 1681, 129–137. [Google Scholar] [CrossRef]
- Hugo, F.; Kennedy, T.W. Surface cracking of asphalt mixtures in Southern Africa (With discussion). Assoc. Asph. Paving Technol. Proc. 1985, 54, 454–501. [Google Scholar]
- Dauzats, M.; Rampal, A. Mechanism of surface cracking in wearing courses. In Proceedings of the International Conference on the Structural Design of Asphalt Pavements, Ann Arbor, MI, USA, 13–17 July 1987. [Google Scholar]
- Gerritsen, A. Prediction and prevention of surface cracking in asphaltic pavements. In Proceedings of the International Conference on the Structural Design of Asphalt Pavements, Ann Arbor, MI, USA, 13–17 July 1987. [Google Scholar]
- Luo, X.; Gu, F.; Ling, M.; Lytton, R.L. Review of mechanistic-empirical modeling of top-down cracking in asphalt pavements. Constr. Build. Mater. 2018, 191, 1053–1070. [Google Scholar] [CrossRef]
- Ingrassia, L.P.; Spinelli, P.; Paoloni, G.; Canestrari, F. Top-down cracking in Italian motorway pavements: A case study. Case Stud. Constr. Mater. 2020, 13, e00442. [Google Scholar] [CrossRef]
- Labi, S.; Sinha, K.C. Measures of short-term effectiveness of highway pavement maintenance. J. Transp. Eng. 2003, 129, 673–683. [Google Scholar] [CrossRef]
- Wang, Y.; Wang, G.; Mastin, N. Costs and effectiveness of flexible pavement treatments: Experience and evidence. J. Perform. Constr. Facil. 2012, 26, 516–525. [Google Scholar] [CrossRef]
- Nazzal, M.D.; Mohammad, L.N. Estimation of resilient modulus of subgrade soils for design of pavement structures. J. Mater. Civ. Eng. 2010, 22, 726–734. [Google Scholar] [CrossRef]
- Wang, Y. The effects of using reclaimed asphalt pavements (rap) on the longterm performance of asphalt concrete overlays. Constr. Build. Mater. 2016, 120, 335–348. [Google Scholar] [CrossRef]
- Ahmed, A.; Labi, S.; Li, Z.; Shields, T. Aggregate and disaggregate statistical evaluation of the performance-based effectiveness of long-term pavement performance specific pavement study-5 (ltpp sps-5) flexible pavement rehabilitation treatments. Struct. Infrastruct. Eng. 2013, 9, 172–187. [Google Scholar] [CrossRef]
- Wang, Y. Ordinal logistic regression model for predicting ac overlay cracking. J. Perform. Constr. Facil. 2012, 27, 346–353. [Google Scholar] [CrossRef]
- Labi, S.; Sinha, K.C. Effectiveness of highway pavement seal coating treatments. J. Transp. Eng. 2004, 130, 14–23. [Google Scholar] [CrossRef]
- Gong, H.; Dong, Q.; Huang, B.; Jia, X. Effectiveness analyses of flexible pavement preventive maintenance treatments with LTPP SPS-3 experiment data. J. Transp. Eng. 2015, 142, 04015045. [Google Scholar] [CrossRef]
- Gong, H.; Huang, B.; Shu, X. Field performance evaluation of asphalt mixtures containing high percentage of RAP using LTPP data. Constr. Build. Mater. 2018, 176, 118–128. [Google Scholar] [CrossRef]
- Wang, Y.; Mahboub, K.C.; Hancher, D.E. Survival analysis of fatigue cracking for flexible pavements based on long-term pavement performance data. J. Transp. Eng. 2005, 131, 608–616. [Google Scholar] [CrossRef]
- El-Basyouny, M.M.; Witczak, M. Part 2: Flexible pavements: Calibration of alligator fatigue cracking model for design guide. Transp. Res. Rec. J. Transp. Res. Board 2005, 1919, 76–86. [Google Scholar] [CrossRef]
- Kim, Y.R.; Jadoun, F.M.; Hou, T.; Muthadi, N. Local Calibration of the MEPDG for Flexible Pavement Design; North Carolina State University: Raleigh, NC, USA, 2007. [Google Scholar]
- Gong, H.; Sun, Y.; Mei, Z.; Huang, B. Improving accuracy of rutting prediction for mechanistic-empirical pavement design guide with deep neural networks. Constr. Build. Mater. 2018, 190, 710–718. [Google Scholar] [CrossRef]
- Chan, W.T.; Fwa, T.F.; Hoque, K.Z. Constraint handling methods in pavement maintenance programming. Transp. Res. Part C Emerging Technol. 2001, 9, 175–190. [Google Scholar] [CrossRef]
- Lamptey, G.; Labi, S.; Li, Z. Decision support for optimal scheduling of highway pavement preventive maintenance within resurfacing cycle. Decis. Support Syst. 2008, 46, 376–387. [Google Scholar] [CrossRef]
- Alnaqbi, A.J.; Zeiada, W.; Al-Khateeb, G.G.; Hamad, K.; Barakat, S. Creating Rutting Prediction Models through Machine Learning Techniques Utilizing the Long-Term Pavement Performance Database. Sustainability 2023, 15, 13653. [Google Scholar] [CrossRef]
- Zeiada, W.; Dabous, S.A.; Hamad, K.; Al-Ruzouq, R.; Khalil, M.A. Machine learning for pavement performance modelling in warm climate regions. Arab. J. Sci. Eng. 2020, 45, 4091–4109. [Google Scholar] [CrossRef]
- Hamad, K.; Al-Ruzouq, R.; Zeiada, W.; Abu Dabous, S.; Khalil, M.A. Predicting incident duration using random forests. Transp. A Transp. Sci. 2020, 16, 1269–1293. [Google Scholar] [CrossRef]
- Zeiada, W.; Hamad, K.; Omar, M.; Underwood, B.S.; Khalil, M.A.; Karzad, A.S. Investigation and modelling of asphalt pavement performance in cold regions. Int. J. Pavement Eng. 2019, 20, 986–997. [Google Scholar] [CrossRef]
- Justo-Silva, R.; Ferreira, A.; Flintsch, G. Review on machine learning techniques for developing pavement performance prediction models. Sustainability 2021, 13, 5248. [Google Scholar] [CrossRef]
- Marcelino, P.; de Lurdes Antunes, M.; Fortunato, E.; Gomes, M.C. Machine learning approach for pavement performance prediction. Int. J. Pavement Eng. 2021, 22, 341–354. [Google Scholar] [CrossRef]
- Mirou, S.M.; Elawady, A.T.; Ashour, A.G.; Zeiada, W.; Abuzwidah, M. Visibility Prediction through Machine Learning: Exploring the Role of Meteorological Factors. In Proceedings of the 2023 Advances in Science and Engineering Technology International Conferences (ASET), Dubai, United Arab Emirates, 20–23 February 2023; pp. 1–6. [Google Scholar]
- Soni, J.; Gujar, R.; Shah, D.; Parmar, P. A Review on Strategic Pavement Maintenance with Machine Learning Techniques. In Intelligent Infrastructure in Transportation and Management, Proceedings of the i-TRAM, Ahmedabad, India, 10–11 July 2021; Springer: Singapore, 2022; pp. 141–151. [Google Scholar]
- Isied, M.M.; Souliman, M.I.; Zeiada, W.A.; Bastola, N.R. Predictive Artificial Neural Network Laboratory Fatigue Endurance Limit Model for Asphalt Concrete Pavements Based on the Volumetric Properties and Loading Conditions. Transp. Res. Rec. 2021, 2675, 630–642. [Google Scholar] [CrossRef]
- Sati, A.S.; Dabous, S.A.; Zeiada, W. Pavement deterioration model using Markov chain and international roughness index. IOP Conf. Ser. Mater. Sci. Eng. 2020, 812, 012012. [Google Scholar]
- Paterson, W. A transferable causal model for predicting roughness progression in flexible pavements. Transp. Res. Rec. 1989, 1215, 70–84. [Google Scholar]
- Choi, J.H.; Adams, T.M.; Bahia, H.U. Pavement roughness modeling using backpropagation neural networks. Comput.-Aided Civ. Infrastruct. Eng. 2004, 19, 295–303. [Google Scholar] [CrossRef]
- Lin, J.D.; Yau, J.T.; Hsiao, L.H. Correlation analysis between international roughness index (IRI) and pavement distress by neural network. In Proceedings of the 82nd Annual Meeting of the Transportation Research Board, Washington, DC, USA, 12–16 January 2003. [Google Scholar]
- Karlaftis, A.G.; Badr, A. Predicting asphalt pavement crack initiation following rehabilitation treatments. Transp. Res. Part C Emerg. Technol. 2015, 55, 510–517. [Google Scholar] [CrossRef]
- Owusu-Ababio, S. Effect of neural network topology on flexible pavement cracking prediction. Comput.-Aided Civ. Infrastruct. Eng. 1998, 13, 349–355. [Google Scholar] [CrossRef]
- Attoh-Okine, N.O. Analysis of learning rate and momentum term in backpropagation neural network algorithm trained to predict pavement performance. Adv. Eng. Softw. 1999, 30, 291–302. [Google Scholar] [CrossRef]
- Attoh-Okine, N.O.; Cooger, K.; Mensah, S. Multivariate adaptive regression (MARS) and hinged hyperplanes (HHP) for doweled pavement performance modeling. Constr. Build. Mater. 2009, 23, 3020–3023. [Google Scholar] [CrossRef]
- Gogoi, R. Prediction of Longitudinal Cracking of Asphalt Pavements. Blue Eyes Intelligence Engineering and Sciences Engineering and Sciences Publication—BEIESP. Int. J. Recent Technol. Eng. 2019, 8, 2310–2313. [Google Scholar] [CrossRef]
- Radwan, M.; Mostafa, A.H.; Hashem, M.; Faheem, H. Modeling pavement performance based on LTPP database for flexible pavements. Tek. Dergi 2020, 31, 10127–10146. [Google Scholar] [CrossRef]
- Radwan, M.M.; Abo-Hashema, M.A.; Hashem, M.D.; Faheem, H.B. Development of Distress Prediction Models for Flexible Pavements Using LTPP for Main Roads in Egypt. 2022. [Google Scholar]
- Afzal, S.; Ghani, S.; Hittawe, M.M.; Rashid, S.F.; Knio, O.M.; Hadwiger, M.; Hoteit, I. Visualization and Visual Analytics Approaches for Image and Video Datasets: A Survey. ACM Trans. Interact. Intell. Syst. 2023, 13, 1–41. [Google Scholar] [CrossRef]
- Breiman, L. Random Forests. Mach. Learn. 2001, 45, 5–32. [Google Scholar] [CrossRef]
- Breiman, L. Classification and Regression Trees; Routledge: New York, NY, USA, 1984. [Google Scholar]
- Ziari, H.; Maghrebi, M.; Ayoubinejad, J.; Waller, S.T. Prediction of pavement performance: Application of support vector regression with different kernels. Transp. Res. Rec. J. Transp. Res. Board 2016, 2589, 135–145. [Google Scholar] [CrossRef]
- Cortes, C.; Vapnik, V. Support Vector Networks. Mach. Learn. 1995, 20, 273–297. [Google Scholar] [CrossRef]
- Kavousi-Fard, A.; Samet, H.; Marzbani, F. A New Hybrid Modified Firefly Algorithm and Support Vector Regression Model for Accurate Short Term Load Forecasting. Expert Syst. Appl. 2014, 41, 6047–6056. [Google Scholar] [CrossRef]
- Hittawe, M.M.; Sidibé, D.; Mériaudeau, F. Bag of words representation and SVM classifier for timber knots detection on color images. In Proceedings of the 2015 14th IAPR International Conference on Machine Vision Applications (MVA), Tokyo, Japan, 18–22 May 2015; pp. 287–290. [Google Scholar]
- Baker, L.; Ellison, D. The Wisdom of Crowds—Ensembles and Modules in Environmental Modelling. Geoderma 2008, 147, 1–7. [Google Scholar] [CrossRef]
- Yuan, J.; Wang, K.; Yu, T.; Fang, M. Reliable multi-objective optimization of high-speed WEDMprocess based on Gaussian process regression. Int. J. Mach. Tools Manuf. 2008, 48, 47–60. [Google Scholar] [CrossRef]
- Rasmussen, C.; Williams, C. Gaussian Processes for Machine Learning; MIT Press: Cambridge, MA, USA, 2006. [Google Scholar]
- Alexander, D.L.J.; Tropsha, A.; Winkler, D.A. Beware of R2: Simple, unambiguous assessment of the prediction accuracy of QSAR and QSPR models. J. Chem. Inf. Model. 2015, 55, 1316–1322. [Google Scholar] [CrossRef] [PubMed]
- Hittawe, M.; Langodan, S.; Beya, O.; Hoteit, I.; Knio, O. Efficient SST prediction in the Red Sea using hybrid deep learning-based approach. In Proceedings of the 2022 IEEE 20th International Conference on Industrial Informatics (INDIN), Perth, Australia, 25–28 July 2022. [Google Scholar] [CrossRef]
- Anderson, J.A. An Introduction to Neural Networks; MIT Press: Cambridge, MA, USA, 1995. [Google Scholar]


Disclaimer/Publisher’s Note: The statements, opinions and data contained in all publications are solely those of the individual author(s) and contributor(s) and not of MDPI and/or the editor(s). MDPI and/or the editor(s) disclaim responsibility for any injury to people or property resulting from any ideas, methods, instructions or products referred to in the content. |
© 2024 by the authors. Licensee MDPI, Basel, Switzerland. This article is an open access article distributed under the terms and conditions of the Creative Commons Attribution (CC BY) license (https://creativecommons.org/licenses/by/4.0/).