Abstract
Hot working environment not only affects work efficiency, but also poses a potential threat to the physical and mental health of staff. The current common method for dealing with high temperatures is spray-only or ventilation-only. To investigate the impact of different spray and ventilation modes on indoor high-temperature environments, this study examined their effects on indoor environmental parameters, average skin temperature, and psychological indicators. By establishing an experimental platform for high-temperature thermal environments, a spray ventilation cooling system was implemented, and its cooling efficacy in the indoor thermal environment was analyzed. The environmental classification of the high-temperature working environment under experimental conditions is provided based on the experimental data. A comparison and analysis of environmental parameters and physiological and psychological indicators between moderate and high-temperature environments were conducted. The combination of spray and ventilation modes resulted in a 5.3 °C reduction in air temperature, a 24.1% increase in average relative humidity, and a 3.3 °C reduction in average Wet-bulb Globe Temperature (WBGT). The cooling effect was increased by 2.3 °C and the average relative humidity was increased by 10.8% compared to spray-only and ventilation-only modes. In spray and ventilation mode, when the spray volume is increased by 15 mL/min, the air temperature is reduced by 8.2 °C, the average relative humidity is increased by 31.9%, and the average WBGT is reduced by 5.1 °C. This study has guiding significance for finding a reasonable cooling scheme to cope with indoor high-temperature environments.
1. Introduction
The increasing emphasis on the safety and well-being of individuals working under high temperatures is driven by heightened safety awareness and improvements in living standards. Studies indicate that engagement in activities within high-temperature thermal settings can adversely affect human work efficiency. According to occupational hygiene standards, an individual working in an environment with an average Wet-bulb Globe Temperature (WBGT) index of ≥25 °C is classified as involved in hot operation [1]. Natural high-temperature environments exhibit diverse effects and influences, and such high temperatures are commonly encountered in various industrial settings, including metal smelting workshops, forging, and casting workshops. These workshops share common meteorological characteristics, such as air temperature (AT) and heat radiation, leading to a significantly dry and hot environment due to low relative humidity (RH) [2].
Scholars both domestically and internationally have extensively investigated human physiological reactions in high-temperature work environments. In 1998, Moran et al. [3] introduced a physiological strain index based on rectal temperature and heart rate (HR). The consequences of working in high-temperature environments extend beyond affecting work efficiency, but also present a potential risk to the physical health and safety of personnel [4]. In such conditions, the human body is more susceptible to fatigue sensation (FS), leading to a significant increase in the occurrence of individual errors during work. The accumulation of fatigue sensation further renders the human body prone to conditions such as motion sickness, dehydration, heat, and other symptoms. The heightened fatigue sensation can result in a decline in the operator’s attention induce, anxiety, and contribute to unauthorized operations or even accidents [5]. In 2020, Zheng et al. [6] chose four indicators, namely, systolic blood pressure (SBP), skin temperature, heart rate, and rectal temperature. They established a comprehensive evaluation system to measure the physiological state of individuals in high-temperature environments. Utilizing the weight-variation theory, they derived a comprehensive evaluation score to quantify the physiological condition of human beings. Wang Shugang et al. [7] provide the calculation and analysis of the subjective thermal stress indexes, such as the average skin temperature (AST), perspiration rate, skin humidity, and upper limit of working time under the condition of thermal balance, show that the upper limit of dry bulb temperature can be relaxed to 28 under certain ambient humidity conditions. In addition, the thermal comfort zone map is divided into non-working zones, comfort zones, and forbidden working zones, according to the average skin temperature curve of miners engaged in certain labor intensities, by using the human heat balance model and the measured data. Akhlish D. A. et al.’s [8] study is based on the physiology and psychology of the provided environment by observing the productivity of workers, derived from the physiology of recording the subject’s skin temperature and heart rate, to break down the relationship between the environment and the body. The results showed that air temperature was the most significant factor affecting human skin temperature and heart rate, followed by air concentration. Jinggang Zhang et al. [9], in order to study the influence of high-temperature and high-humidity environments on the physiology and psychology of underground workers selected 60 miners and 5 students as subjects. The psychological and physiological changes of miners under high temperatures and high humidity were comprehensively and systematically tested and analyzed. The test results showed that with the increase in temperature and humidity, human attention, reaction ability, and cognitive ability declined. The high-temperature and high-humidity environment makes people more tired and the error rate of operation increases remarkably. The temperature of 37 and the humidity of 80% are the critical values of miners’ tolerance.
Research on spray or ventilation systems in thermal environments includes Farnham et al.’s [10] study investigating outdoor spray cooling systems, wherein they measured the changes in pedestrians’ skin temperature and thermal sensation (TS) before and after exposure to the spray system. This study contributes significantly to establishing a solid theoretical foundation for modeling human thermal sensation in spray ventilation systems. Initially introduced in the agricultural sector, spray cooling technology subsequently transitioned to urban cooling, evolving into high-pressure spray ventilation systems [11]. In recent years, cooling methods employing spray cooling technology have gained widespread usage across various fields, attributed to their high efficiency, low cost, and environmental sustainability [12]. Tomonori S. et al.’s [13] study sought to expand the empirical WBGT index to a reasonable heat index based on the body’s thermal balance. The results show that the natural wet bulb and black globe temperature coefficients in the WBGT coincide with the heat balance equation for a human body with a fixed skin wittedness of approximately 0.45 at a fixed skin temperature, and (2) the WBGT can be interpreted as the environmental potential to increase skin temperature rather than the heat storage rate of a human body.Liu Chun and Wu Chenyang [14] et al. analyzed the influence of humidity on temperature equalization time and cooling rate. A temperature-time relationship model is established, which can analyze the relationship between time and spray effect and predict the cooling capacity of spray cooling device, and the calculation method of the cooling range of spray cooling device is proposed.
In summary, the existing studies only use a single cooling mode of spray only or ventilation only, and the cooling effect can still be improved. In this paper, the effects of a spray cooling system on environmental temperature changes were studied by building a high-temperature thermal environment experimental platform, and the changes in indoor thermal environment parameters, average skin temperature, and subjective thermal perception under four different spray-ventilated modes were compared and analyzed, and their effects on human physiological and psychological indicators were further studied.
2. Methods
2.1. Ventilated Spray Platform
This study was conducted in the safety engineering laboratory at Xi’an University of Architecture and Technology. The laboratory had been equipped with an experimental platform designed for simulating indoor high-temperature environments and a spray ventilation system. The laboratory dimensions measure 7 m × 6 m × 2.6 m.
To create a high-temperature indoor simulation environment for warming purposes, an infrared radiation high-temperature electric heating plate was utilized. The effective heating dimensions of the plate measure 1.7 m × 0.38 m. The infrared radiation high-temperature electric heating plate was equipped with a silicon-controlled variable power converter and a temperature controller. Researchers can employ these features to adjust the surface temperature, thereby raising the indoor ambient temperature and generating a high-temperature indoor thermal environment. For this experiment, the surface temperature of the infrared radiation high-temperature heating plate was set at 175 °C.
The spray ventilation system consists of various components, mainly including spray equipment tanks, pumps, hoses, nozzles, valves, and a ventilation fan. A micro high-pressure pump served as the water pump, and three sections of fast plug-type atomizing nozzles were employed. These nozzles were positioned within a filter to ensure uniform distribution of droplets. The spray configuration took the form of atomization with a solid cone, and the resulting spray droplets had a particle size ranging from 20 μm to 30 μm. The experimental nozzles were set at a height of 2 m above the ground and generated a spray area of approximately 1 m2 per individual nozzle. The ventilation equipment utilizes a circular rotary fan positioned at a height that directs airflow to the chest of the subject. The fan is directed toward the subject’s fixed position, placed at a 45 ° angle, and set at a distance of 1 m from the subject. Operating at its maximum wind speed, the fan generates a wind speed at the specific location of a single subject, as is shown in Figure 1. The average wind speed measured at the subject’s chest location is approximately 1.9 m/s. Figure 1 depicts the wind speed at the location of an individual subject, with the fan operating at its highest speed.

Figure 1.
Air velocity of ventilation.
To maintain the relative stability of indoor environmental parameters throughout the experiment, during the experiment, the doors and windows were kept closed. It is noteworthy that wind speed can influence both the heat transfer coefficient of the human skin surface and the convective heat transfer coefficient [15]. The Table 1 lists the models and functions of the experimental equipment

Table 1.
Experimental equipment and functions.
2.2. Location of Measurement Points and Experimental Arrangement
A horizontal measurement point was established for environmental parameters, adhering to the high-temperature measurement method [16]. In the sitting position, the measurement height was set at 1.1 m. Positioned 1.5 m away from the thermal radiation heating plate, the measurement point aligned with the center of the parallel line of the heating plate, situated midway between the two test subjects. At this measurement point, a multi-function tester JT2020 was deployed to capture data on air temperature, relative humidity, and WBGT.
Each subject’s seat was placed 1.5 m away from the thermal radiation heating plate, with the two positions spaced 0.8 m apart, resulting in a spatial separation of 0.8 m between subjects during the experiment.
The nozzles of the spray ventilation system were situated 1.2 m from the thermal radiation heating plate, and the two nozzles were separated by a distance of 0.8 m. The fans were placed at an angular distance of 45° from each subject, positioned 1 m away. This angular distance from each subject was also 1 m.
The experimental layout and the locations of measurement points are shown in Figure 2.

Figure 2.
Test bed. (a) Schematic diagram of laboratory layout. (b) Laboratory photograph of experiment.
2.3. Experimental Sample
In both the domestic and international literature on experiments, the typical number of subjects ranges from 8 to 16 [17,18,19]. Participants were recruited from undergraduate students at Xi’an University of Architecture and Technology, all of whom volunteered for the experiment. Ultimately, 8 subjects were selected, evenly divided between male and female participants. The subjects’ ages ranged from 21 to 22 years, mitigating the potential influence of age on the experimental results. Each participant exhibited a moderate body mass index, was in good health on the day of the experiment, refrained from strenuous exercise prior to the experiment, and displayed normal physiological indicators. Table 2 provides the basic information of the subjects. The participants were consistently dressed in short-sleeved tops and ventilated pants, with the clothing’s thermal resistance approximately measuring 0.7 clo [20]. The eight subjects were divided into four groups, with each group comprising two peers.
Table 2.
Basic information about the participant.
2.4. Experimental Design
This experiment uses a one-way within-subjects experimental design, wherein each participant undergoes treatment across all levels of the independent variable. This design offers distinct advantages, including the ability to isolate individual differences, minimize experimental errors, enhance statistical sensitivity, demand a smaller subject pool, and render the experimental design more economical and efficient. The independent variable in this study pertains to the working conditions of the spray ventilation cooling system, encompassing four distinct conditions, or experimental treatment levels. The detailed parameters for each working condition are outlined in Table 3.
Table 3.
Modes of the spray cooling system’s working conditions.
The experiment’s dependent variables comprised three categories: indoor environmental parameters, subjects’ physiological indicators, and subjects’ subjective psychological indicators. Notably, indoor environmental parameters encompass air temperature, relative humidity, and WBGT. When it comes to subjects’ physiological indicators, it comprises body temperature, heart rate, and blood pressure. Meanwhile, subjective psychological indicators included evaluations of thermal sensation, thermal comfort, and fatigue sensation.
The contents of the questionnaire in this study are shown in Table 4. The main content of the questionnaire is the basic anthropological data of the subjects. In addition, the Thermal Sensation Vote (TSV) Thermal Perception Scale and the Fatigue Sensation Perception Test are also included to allow participants to make individual subjective evaluations. The questionnaire is guided and practiced without the participants carrying out the experiment, and they are filled in on time and according to the requirements during the experiment.
Table 4.
Questionnaire.
In this paper, a subjective questionnaire was used to assess the thermal and fatigue sensations experienced by individuals in a hot working environment. The aim was to investigate the impact of a high-temperature working environment on subjective psychological indicators. Prolonged exposure to a high-humidity environment can inhibit sweat evaporation, leading to an increased heat sensation in the human body under high-temperature conditions [21].
In this study, TSVs were obtained from participants to further assess the impact of a hot environment on human thermal sensation. TSVs serve as a valuable indicator, effectively representing thermal sensory parameters experienced by the majority of individuals working in the same spatial environment. Previous research has indicated that unfavorable thermal conditions can result in decreased productivity, compromised health, and diminished thermal comfort in the human body [22]. Additional studies [23] have analyzed the relationship between outdoor activity, heat stress, and heat index, considering factors such as wet-bulb temperature, physiologically equivalent temperature, general thermal climate temperature, and environmental parameters.
As shown in Table 5, seven rating levels were used for the thermal sensation evaluation index, namely, very cold (−3), cold (−2), slightly cold (−1), moderate (0), slightly hot (1), hot (2), and very hot (3).
Table 5.
Thermal sensation evaluation indicators [22].
The evaluation indexes for fatigue sensation in this study are presented in Table 6, utilizing four scoring levels: normal state (0), somewhat fatigued (1), fatigued (2), and very fatigued (3). In the existing literature, Russell et al. [24] suggest that fatigue sensation may accumulate as a potential effect of activity.
Table 6.
Fatigue sensation evaluation indicators [24].
2.5. Experimental Procedure
In this experiment, each participant is required to complete four experimental trials, each encompassing three stages: the outdoor rest stage, the operational stage in a high-temperature and hot environment, and the operational stage under the cooling system. The environmental parameters during the two stages, as well as the physiological parameters and subjective psychological assessments of the participants, were recorded independently. The specific experimental process is outlined as follows:
The electric heater is activated 60 min prior to the start of the experiment to ensure the stabilization of the laboratory-simulated high-temperature indoor environment. The working conditions of the spray ventilation system are set accordingly. Participants took a 5 min rest outside the laboratory without officially starting the experiment, providing the requisite basic information. Physiological and psychological indicators of the participants are recorded, establishing their baseline levels in the natural environment. Ambient temperature and relative humidity outside the laboratory are also documented. Participants enter the thermal environment at the official start of the experiment, occupying a seated position in the laboratory’s simulated high-temperature working conditions, and engaging in light labor simulation. The spray air cooling system is activated for 15 min at the start of the experiment, running for an additional 15 min, thus completing a total of 30 min for each experimental trial.
Environmental parameters were recorded every minute throughout the experiment, resulting in 30 parameter values for each environmental factor (indoor temperature, relative humidity, WBGT) in each experimental trial. Physiological parameters were recorded at 5 min intervals during the experiment, yielding 6 values for each participant in a single experimental trial (skin temperature, pulse, and blood pressure).
The experimenters were divided into 4 groups, with 2 participants in each group. Each participant filled out 24 questionnaires, resulting in a cumulative total of 192 questionnaires.
3. Effect of Cooling Systems on Indoor Environment
3.1. Original Environmental Parameters
The experiment initiated the simulation of a high-temperature indoor environment through the application of infrared radiation in high-temperature electric heating panels. Measurement of air temperature, relative humidity, and the WBGT index was conducted to assess the high-temperature operating environment.
Table 7 displays the environmental parameters during the initial 10 to 25 min of the experiment, without the activation of the cooling system. These parameters yielded respective averages of 33.5 °C for air temperature, 44.8% for relative humidity, and 28.6 °C for the WBGT index in the high-temperature operating environment.
Table 7.
Environmental parameters without cooling system (10–25 min time period).
In the classification of high-temperature work, the average WBGT in the operating environment, as specified during the individuals’ process of operation, is considered high-temperature work if it equals or exceeds 25 °C [1]. Based on the classification of high-temperature work, the experimental working environment falls under working condition I. Additionally, light labor under an air temperature of 33.5 °C should not be allowed to exceed 60 min.
3.2. Effect of Cooling Systems on Environmental Parameters
The variation of air temperature under different spray ventilation cooling conditions in the experiment is shown in Figure 3. As observed from the figure, the rate of air temperature drop is more pronounced within the first 10 min with cooling system is activated. Across various working conditions, the impact of different ventilation spray cooling conditions on air temperature can be seen in Figure 3. The highest cooling efficiency was achieved under working conditions I and IV (combined spray and ventilation), followed by working conditions II (spray only), while the air-cooling effect was least effective under working conditions III (ventilation only). In Figure 3, the solid line represents the average air temperature before the spray ventilation system is turned on, and the dashed line represents the minimum air temperature after the spray ventilation system is turned on.
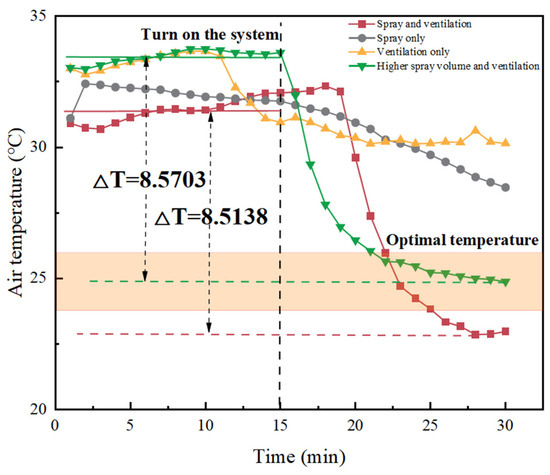
Figure 3.
Air temperature changes under different working conditions.
To quantitatively analyze the impact of the cooling system on indoor air temperature, the cooling system’s opening time (15 min) is considered a critical point. The spraying system is activated without and with this crucial point, and descriptive statistics of indoor air temperature are compiled, encompassing the average values without and with cooling, along with their differences, as shown in Table 8. The table reveals that under the working condition I (20 mL/min spray volume and 1.9 m/s wind speed), the average air temperature can be reduced by 5.3 °C. Moreover, under working condition IV (35 mL/minute spray volume and 1.9 m/s wind speed), the average air temperature reduction is more significant at 8.2 °C. A significant cooling effect is observed in working condition IV compared to condition I, with no statistically insignificant cooling difference due to air saturation. This discrepancy may arise from variations in initial temperature and other potential errors. Additionally, in working conditions II and III, where spray-only and ventilation-only modes were employed, the average air temperature experienced a decrease of 3.9 °C and 2.5 °C, respectively. These effects were comparatively less impactful on ambient air temperature than the combined mode of ventilation and spray.
Table 8.
Environmental parameters without and with cooling.
The trends in relative humidity under different spray-ventilated modes are shown in Figure 4. The graph illustrates that relative humidity experiences the most substantial increase within the initial 5 min with the activation of the cooling system. Following this initial period, the increase persists but at a decelerating rate. Notably, the rate of relative humidity increase is most pronounced in working conditions I and IV (spray and ventilation combined), followed by working condition II (spray only). Conversely, the change in relative humidity is not significant under working condition III (ventilation only). In Figure 4, the solid line represents the average relative humidity before the spray ventilation system is turned on, and the dashed line represents the maximum relative humidity after the spray ventilation system is turned on.
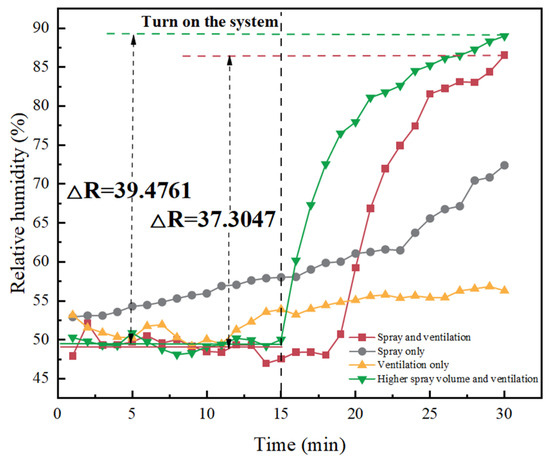
Figure 4.
Variation of relative humidity under different working conditions.
For a quantitative analysis of the relationship between the cooling system and relative humidity changes, using the cooling system activation time (15 min) as a benchmark, indoor relative humidity without and with the initiation of the spraying system was subjected to descriptive statistical analysis. This encompassed determining the average relative humidity without and with cooling system activation, along with its standard deviation. As indicated in Table 8, under working condition I (20 mL/minute spray volume and 1.9 m/s wind speed), there was a noteworthy 24.1% increase in average relative humidity. In contrast, under working condition IV (35 mL/minute spray volume and 1.9 m/s wind speed), the average relative humidity exhibited a more substantial increase of 31.9%. This difference was statistically significant, emphasizing the increased impact of working condition IV on relative humidity compared to working condition I. Under working condition II (spray only), the average relative humidity increased by 14.3%, a significantly smaller increment than working condition I, indicating that ventilation significantly influences relative humidity. Conversely, the change in relative humidity in working condition III (ventilation only) was relatively small.
The WBGT trends for different spray ventilation modes are shown in Figure 5. As observed, the air temperature experiences a rapid decline within the first 10 min with spraying, and then the decline slows down. In some conditions, a slight recovery occurs within 15 min. The influence of different spray-ventilated modes on the WBGT is discernible in Figure 5, with the most substantial decrease observed under working conditions I and IV (spray and ventilation combined). This is followed by working condition II (spray only), and the WBGT decreases most gradually under working condition III (ventilation only). In Figure 5, the solid line represents the average WBGT value before the spray ventilation system is turned on, and the dashed line represents the minimum WBGT value after the spray ventilation system is turned on.
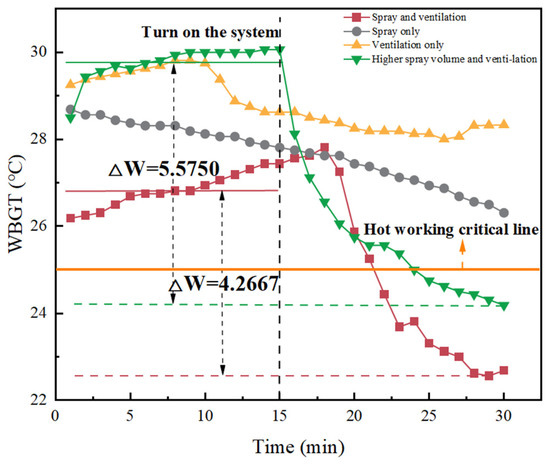
Figure 5.
Variation of WBGT under different operating conditions.
In order to quantitatively analyze the effect of the cooling system on WBGT, descriptive statistical calculations were performed on WBGT without and with activating the spraying system, using the opening time of the cooling system (15 min) as the threshold. The average values without and with cooling and their differences were determined, as shown in Table 8. Table 8 reveals that under working condition I a combination of a spray volume of 20 mL/minute and an ventilation speed of 1.9 m/s resulted in an average WBGT decrease of 3.3 °C, while under working condition IV, a spray volume of 35 mL/min combined with an ventilation speed of 1.9 m/s led to an average WBGT decrease of 5.1 °C. Similar to the air temperature, the WBGT in condition IV exhibited a significant cooling effect compared to condition I, reducing the WBGT value to an average of 23.6 °C, eliminating the high-temperature operation scenario. Additionally, in working conditions II and III, where spray-only or ventilation-only mode was applied, the average WBGT decreased by 2.5 °C and 1.4 °C, respectively. However, the effect of these two conditions on WBGT was smaller than that observed in the combined mode of spray and ventilation.
4. Effect of Cooling Systems on Physiological Indicators
4.1. Physiological Indicators
In the experiment, three physiological parameters, namely, skin surface temperature, heart rate, and blood pressure, were measured and analyzed to investigate the human body’s response in a high-temperature working environment.
The subjects’ physiological parameters were measured during the pre-experiment phase (0–10 min time period) to establish baseline levels in the relevant environmental conditions, AST, HR, SBP, and diastolic blood pressures (DBP) data for both genders, as shown in Table 9.
Table 9.
Baseline levels of physiologic parameters (0–10 min time period).
The physiological parameters of the working human body without the activation of the cooling system in the experiment (10–25 min time period) are presented in Table 10. The average skin temperature, heart rate, and blood pressure of the human body in a hot working environment are displayed. Specifically, the average skin temperature of individuals working in the hot environment increased from 33.05 °C to 34.8 °C, the heart rate decreased from 96.25 bpm to 94.9 bpm, and the systolic and diastolic blood pressures decreased by 9.9 mmHg and 10.1 mmHg, respectively, compared to the measurements without the experiment started.
Table 10.
Physiological parameters of the human body and individual subjective psychological indicators during high-temperature operation (10–25 min time period).
The subjective psychological indicators of the individuals during the period without the cooling system activated in the experiment (10–25 min time period) are depicted in Table 10. This table displays the average thermal and fatigue sensations experienced by the human body in the high-temperature operating environment. The subjects’ thermal sensation increased from 0.125 (nearly moderate) to 1.85 (nearly hot) without the experiment, while fatigue sensation increased from 0 (normal state) to values between 1 (somewhat fatigued) and 2 (fatigued). It is evident that both the thermal and fatigue sensations of individuals operating in a high-temperature thermal environment significantly differ from those in a comfortable environment. Research has indicated that working in both colder and hotter environments contributes to the development of fatigue sensation [25].
Each psychological index was measured during the pre-experiment phase (0–10 min time period) to establish baseline levels in the relevant environment without the subjects starting the experiment, as shown in Table 11.
Table 11.
Baseline levels of subjective psychological indicators (0–10 min time period).
To investigate the physiological response of the human body without and with cooling in a high-temperature working environment, three physiological parameters were measured and analyzed, namely, skin surface temperature, heart rate, and blood pressure. This study aims to examine the effects of the cooling system and its different spray-ventilated conditions on the physiological parameters of operators.
4.2. Effect of Cooling Systems on Skin Surface Temperature
Average skin temperature provides a comprehensive representation of an individual’s sensation of warmth or coldness and serves as a key physiological indicator in the analysis of heat exchange between the body and the environment.
As indicated by the average skin temperature measurements in Figure 6, the skin temperatures of both men and women exhibited a rapid increase around 5 min with the start of the experiment, followed by a gradual stabilization. The rate of change in skin temperature initially increased and then decreased during the course of the experiment. To maintain a dynamic balance between heat production and dissipation in a high-temperature environment, individuals must regulate the heat transferred from the body’s core to the skin’s surface through their circulatory system and enhance body cooling through sweat evaporation. In this context, men’s average skin temperature was slightly higher than that of women. Upon exposure to the high-temperature indoor thermal environment, the change in women’s skin surface temperature was more significant than that in men, indicating increased thermal sensitivity among female subjects. Additionally, from Figure 6, it is evident that the magnitude of the change in skin surface temperature was greater for female subjects than for male subjects.
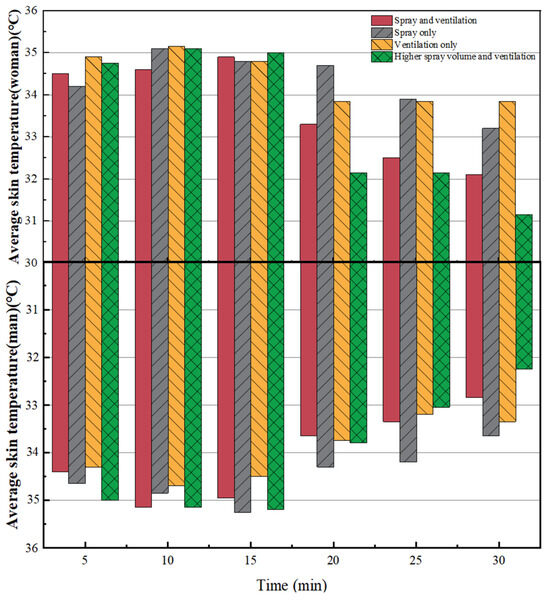
Figure 6.
Trend of average skin temperature under different working conditions.
The impact of the cooling system on the subjects’ skin temperature was quantitatively analyzed, and the average skin temperature was recorded both without and with the activation of the cooling system under different working conditions. Based on data presented in Table 12, the average skin temperature can decrease by 1.8 °C under working condition I (20 mL/minute spraying volume and 1.9 m/s wind speed), over 2 °C under condition IV (35 mL/minute spraying volume and 1.9 m/s wind speed), and over 1.1 °C under both condition II (spray only) and condition III (ventilation only).
Table 12.
Physiological and psychological indicators without and with cooling.
4.3. Effect of Cooling Systems on Heart Rate
When an individual works in a hot environment, the body accelerates the heart rate to enhance blood circulation, facilitating heat reduction. Therefore, the heart rate levels serve as indicators of heat stress on the human body. In this experiment, the changes in human heart rate in various thermal environments were measured without and with activating the cooling system.
The results of the average heart rate measurements in Figure 7 reveal that, within the initial 5 min of the experiment, the average heart rate of the subjects did not significantly differ from the average heart rate value without the start of the experiment. However, the magnitude of the change varied across different trials. In contrast, there was a noticeable increase in heart rate from 5 to 15 min into the experiment. The baseline heart rate level was higher in male subjects, and the rate of increase was greater for males upon entering the hot indoor thermal environment. As depicted in Figure 7, the average heart rate of the subjects decreased with activating the cooling system compared to the previous period. The effects of different working conditions on the skin surface temperature of male and female subjects exhibited variations, possibly due to a significant experimental error.
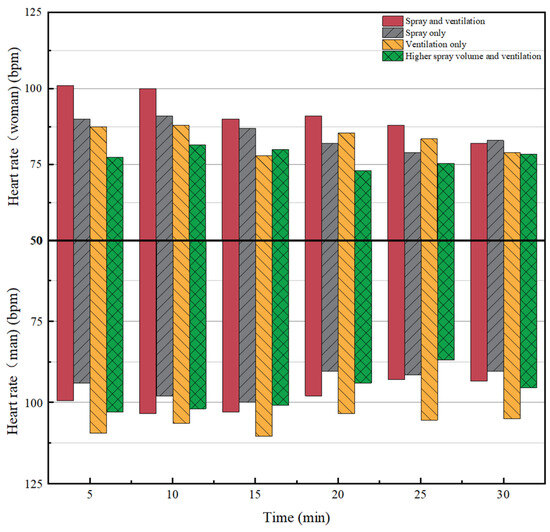
Figure 7.
Trend of heart rate under different working conditions.
The impact of the cooling system on the subjects’ heart rate was quantitatively assessed by recording the average heart rate of the subjects without and with the activation of the cooling system under different working conditions. Based on data in Table 12, the average heart rate decreased by 7.8 bpm under working condition I (20 mL/minute spray volume and 1.9 m/s wind speed), 5.3 bpm under working condition II (spray only), 3.5 bpm under working condition III (ventilation only), and 8.5 bpm under working condition IV (35 mL/minute spray volume and 1.9 m/s wind speed).
The changes in the mean heart rate of the subjects corresponded to their environmental parameters and aligned with the patterns of changes observed in mean air temperature and WBGT values. The data demonstrated that the mean heart rate of the subjects increased as the mean air temperature and WBGT values decreased, and, conversely, they decreased as these increased.
4.4. Effect of Cooling Systems on Blood Pressure
According to the blood pressure grade classification outlined in the Chinese Guidelines for the Prevention and Treatment of Hypertension (2018 Revised Edition) [26], changes in the external thermal environment trigger various vascular reactions in the human body, leading to changes in blood pressure. Consequently, this study utilizes blood pressure as one of the indicators to assess heat stress in a high-temperature environment.
The changes in systolic and diastolic blood pressure observed without and with the activation of the cooling system under various working conditions in the experiment are presented in Table 12. Systolic and diastolic blood pressure values were significantly lower when without cooling compared to the cooling system was turned on. The results of the experiment indicate that the greatest difference between systolic and diastolic blood pressure occurs under working condition I.
5. Effect of Cooling Systems on Psychological Indicators
As the direct measurement is impractical for assessing the subjective psychological feelings of the human body in a hot thermal environment, this study utilizes a subjective questionnaire to obtain the thermal and fatigue sensation perceptions of the subjects without and with cooling down in the operating environment.
5.1. Effect of Cooling Systems on Individual Thermal Sensation
Without and with the activation of the cooling system under different working conditions, the thermal sensation trends of subjects of different genders are depicted in Figure 8, revealing gender-based distinctions in thermal perception. Overall, female subjects tended to experience slightly lower thermal sensations than male subjects in the hot environment. The thermal sensation exhibited greater variability in working conditions I and IV (a combination of spraying and ventilation). Within 5 min after the cooling system was activated, the thermal sensation of the subjects decreased at the highest rate, reaching approximately −1 (slightly cooler) within 15 min. In working condition II (spray only), the rate of thermal sensation decrease was slower, eventually averaging near 0 (moderate) for male subjects and about −1 (slightly cold) for female subjects. The results of this study highlight gender differences in thermal sensation changes, indicating that the impact of spraying on female subjects’ thermal sensation is more pronounced than that of males. Working condition III (ventilation only), exhibiting a similar decreasing trend to the combined ventilation and spray condition, witnessed a higher rate of mean thermal sensation decrease within the first 5 min of cooling system activation, followed by a gradual slowdown, with the mean thermal sensation stabilizing around 0 (moderate) with 15 min of cooling system activation.
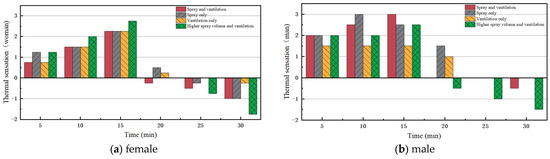
Figure 8.
Trend of subjective thermal sensation of human body under different working conditions.
To quantitatively analyze the subjective psychological thermal sensation of the subjects, the average subjective thermal sensation was recorded without and with the activation of the cooling system under different working conditions. Examining the data presented in Table 12, it is evident that the average thermal sensation of the subjects decreased by 2.6 under working condition I (20 mL/minute spray volume and 1.9 m/s air velocity), 2.7 under working condition IV (35 mL/minute spray volume and 1.9 m/s air velocity), 1.7 under working condition II (spray only), and 1 under working condition III (ventilation only). The results of the study suggest that spraying has a greater effect on individual thermal sensation compared to air circulation.
5.2. Effect of Cooling System on Individual Fatigue Sensation Perception
Fatigue sensation is a normal physiological process in the human body and plays a crucial role in sustaining operational abilities. Therefore, investigating fatigue sensation is crucial for understanding its effects on the human body in hot environments and its thermal comfort.
Figure 9 shows the trend of thermal sensation in men and women without and with the activation of the cooling system under various working conditions. The subjects’ fatigue sensation was recorded on a scale from the normal state (0), somewhat fatigued (1), fatigued (2), and very fatigued (3). Overall, male subjects experienced slightly higher fatigue sensations than female subjects in the hot thermal environment. The figure indicates that individuals reached peak fatigue sensation 15 min after entering the high-temperature thermal environment, with a general decrease observed with the cooling system was activated. Fatigue sensations were more affected by working conditions I and IV, involving the combination of spraying and ventilation. Fatigue sensation decreased rapidly within 5 min with the cooling system was activated, eventually reaching approximately 0 (normal state). In working condition II (spray only) and working condition III (ventilation only), the fatigue sensation of the subjects decreased slightly more slowly than in the combined ventilation and spray conditions. Eventually, the fatigue sensation of male subjects reached 0 (normal state), while the fatigue sensation of the female subjects rebounded slightly, reaching 0, and eventually reaching about 1 (somewhat fatigued). This result suggests that female subjects were more likely to experience fatigue sensation with increasing operating time in the spray-only and air-only modes.
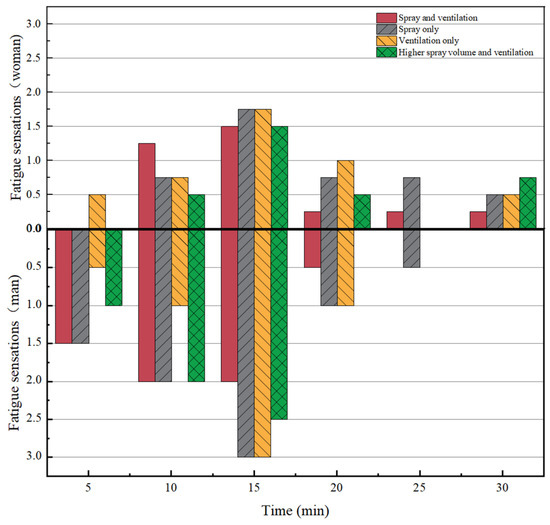
Figure 9.
Trend of fatigue sensation of subjects under different working conditions.
To quantitatively analyze the subjective psychological sensation of fatigue sensation among the subjects, the average level of fatigue sensation without and with the activation of the cooling system under different working conditions was recorded. Based on the data in Table 12, the average fatigue sensation of the subjects decreased by 1.3 under working condition I (20 mL/minute spray volume and 1.9 m/s wind speed), 1.4 under working condition IV (35 mL/minute spray volume and 1.9 m/s wind speed), 1.2 under working condition II (spray only), and 0.5 under working condition III (ventilation only). Specifically, the decrease in fatigue sensation in conditions II and III was the smallest, indicating that the presence or absence of spraying has a significant impact on the fatigue sensation of individuals.
6. Conclusions and Prospects
6.1. Conclusions
In this study, the effects of ventilation and spraying systems under various working conditions on the indoor thermal environment, as well as on human physiology and psychology, were investigated through experiments conducted in an indoor setting with a cooling system. The conclusions drawn from these experiments are as follows:
- Among the various working conditions of the spray cooling system, the most effective cooling was achieved in the combined mode of spraying and ventilation (conditions I and IV), followed by the spray-only mode (condition II), with the least effective cooling observed in the ventilation-only mode (condition III). Under condition I (20 mL/min spray volume and 1.9 m/s wind speed), use spray ventilation cooling systems resulted in a 5.3 °C reduction in air temperature, a 24.1% increase in average relative humidity, and a 3.3 °C reduction in average Wet-bulb Globe Temperature (WBGT). The cooling effect was increased by 2.3 °C and the average relative humidity was increased by 10.8% compared to spray-only and ventilation-only modes. In addition, when the spray volume is increased by 15 mL/min, the air temperature is reduced by 8.2 °C, the average relative humidity is increased by 31.9%, and the average WBGT is reduced by 5.1 °C.
- In a high-temperature environment, individuals rely on skin evaporation of sweat to facilitate body cooling. The spraying and ventilation mode accelerates the removal of heat generated by sweat evaporation, leading to a more rapid reduction in skin surface temperature.
- Gender differences contribute to variations in body resistance, resulting in different impacts of the spray cooling system on physiological and psychological indicators based on gender in hot environments. The thermal and fatigue sensations of male subjects in the hot environment are slightly higher than those of female subjects, with female subjects showing greater sensitivity to spraying mode than males. Between 25 °C and 30 °C, the test subjects were in a relatively comfortable working state. At around 29 °C, the fatigue was moderate.
6.2. Limitations and Prospects
Due to the limitations of research conditions and time, there are still many deficiencies in the experimental design and result analysis that need to be further improved, and the following aspects should be paid attention to in the follow-up research:
- The number of subjects selected in the experiment in this paper is small, and the follow-up study should increase the number of samples and expand the capacity of each data to improve the accuracy and reliability of the experimental data and better control the random error in the experimental process.
- The results of this paper show that there are gender differences in the effects of cooling systems on human physiological and psychological indicators. However, the reasons for the differences and the significance of such differences in the real operating environment still need to be further studied.
Author Contributions
Conceptualization, Y.C.; Methodology, Y.C., H.L. and H.Y.; Writing—review & editing, Y.C.; Validation, X.M. and J.W.; Investigation, D.L.; Formal analysis, X.Z.; Software, A.L. All authors have read and agreed to the published version of the manuscript.
Funding
This work was funded by “National Natural Science Foundation of China (Grant No. 52308115)”, and “Natural Science Basic Research Program of Shaanxi Province (Grant No. 2022JQ-406) and (2024JC-YBQN-0453)”.
Data Availability Statement
Dataset available on request from the corresponding author.
Conflicts of Interest
The authors declare no conflict of interest.
References
- GB/T 17244-1998; Hot Environments—Estimation of the Heat Stress on Working Man based on the WBGT-Index (Wet-Bulb Globe Temperature). China Standard Press: Beijing, China, 1998.
- Liu, G.; Chen, H.; Yuan, Y.; Song, C. Indoor thermal environment and human health: A systematic review. Renew. Sustain. Energy Rev. 2024, 191, 114164. [Google Scholar] [CrossRef]
- Moran, D.S.; Shitzer, A.; Pandolf, K.B. A physiological strain index to evaluate heat stress. Am. J. Physiol. 1998, 275, 129–134. [Google Scholar] [CrossRef]
- Xu, P.; Xu, Z.; Peng, D. The Influence of Photovoltaic Light and Heat Environment of Ceramic Studio on Making Technology and Human Health. J. Phys. Conf. Ser. 2023, 2562, 012087. [Google Scholar] [CrossRef]
- Zhu, H.; Zhang, C.; Tang, S.; Xing, J. Research on the effect of different physical labor intensity on cardiovascular load index in high temperature environment. China Saf. Prod. Sci. Technol. 2015, 11, 70–76. (In Chinese) [Google Scholar]
- Zheng, G.; Wang, Y.; Li, C.; Wang, X. Real-time quantification of human physiological state in high temperature environments based on variable weight theory. J. Therm. Biol. 2020, 89, 102531. [Google Scholar] [CrossRef]
- Wang, S.; Xu, Z.; Zhang, T. Human thermal comfort for mine environment. J. China Coal Soc. 2010, 35, 97–100. (In Chinese) [Google Scholar]
- Aziiz, A.D.; Koerniawan, M.D.; Kawakami, R.I.S.A.; Hasebe, H.; Rhamadana, V. Thermal Comfort of Workers in Hot-Humid Climate: An Early Consistency Study for Physiology and Psychology Measurements. Adv. Sci. Technol. 2020, 103, 71–81. [Google Scholar]
- Zhang, J.; Yang, S.; Suo, C. Research on effects of high temperature and high humidity environment on miners’ physiology and psychology. China Saf. Sci. J. 2015, 25, 23–28. (In Chinese) [Google Scholar]
- Farnham, C.; Emura, K.; Mizuno, T. Evaluation of cooling effects: Outdoor water mist fan. Build. Res. Inf. 2015, 43, 334–345. [Google Scholar] [CrossRef]
- Yang, X.; He, Z.; Chen, Z. The exploration and practice of summer hot weather spray to improve human comfor. Meteorol. Disaster Prev. 2017, 24, 20–25. [Google Scholar]
- He, Y.; Fu, X.; Xiao, Y.; Zhou, J.; Zhong, X. Discussion on cooling technology for underground railway air conditioning system. HVAC 2008, 3, 46–48. (In Chinese) [Google Scholar]
- Sakoi, T.; Mochida, T.; Kurazumi, Y.; Kuwabara, K.; Horiba, Y.; Sawada, S.I. Heat balance model for a human body in the form of wet bulb globe temperature indices. J. Therm. Biol. 2018, 71, 1–9. [Google Scholar] [CrossRef]
- Liu, C.; Wu, C.; Zhang, F. Modeling and analysis of the outdoor space influenced by spray cooling. J. Xi’an Univ. Archit. Technol. (Nat. Sci. Ed.) 2013, 45, 324–329. [Google Scholar]
- Zhang, S.; Zhu, N.; Lu, S. Responses of human perception and skin temperature to directed thermal radiation in hot environments. Build. Environ. 2021, 197, 107857. [Google Scholar] [CrossRef]
- ASHRAE.ANSI/ASHRAE Standard 55-2017; Thermal Environmental Conditions for Human Occupancy. American Society of Heating, Refrigerating and Air-Conditioning Engineers, Inc.: Atlanta, GA, USA, 2017.
- Périard, J.D.; Wilson, M.G.; Tebeck, S.T.; Gilmore, J.B.; Stanley, J.; Girard, O. Influence of the Thermal Environment on Work Rate and Physiological Strain during a UCI World Tour Multistage Cycling Race. Med. Sci. Sports Exerc. 2022, 55, 32–45. [Google Scholar] [CrossRef]
- Zhao, P.; Zhu, N.; Chong, D.; Hou, Y. Developing a new heat strain evaluation index to classify and predict human thermal risk in hot and humid environments. Sustain. Cities Soc. 2022, 76, 103440. [Google Scholar] [CrossRef]
- Zheng, G.; Li, K.; Bu, W.; Wang, Y. Fuzzy comprehensive evaluation of human physiological state in indoor high temperature environments. Build. Environ. 2019, 150, 108–118. [Google Scholar] [CrossRef]
- Oh, W.; Ooka, R.; Nakano, J.; Kikumoto, H.; Ogawa, O. Evaluation of mist-spraying environment on thermal sensations, thermal environment, and skin temperature under different operation modes. Build. Environ. 2019, 168, 106484. [Google Scholar] [CrossRef]
- Huda, L.N. The thermal environment effect on the comfort of electronic factory worker. In Proceedings of the IOP Conference Series: Earth and Environmental Science, Medan, Indonesia, 11–12 October 2017; Volume 126, p. 012143. [Google Scholar]
- Park, D.Y.; Chang, S. Numerical investigation of thermal comfort and transport of expiratory contaminants in a ventilated office with an air curtain system. Indoor Built Environ. 2018, 28, 1420326X1877023. [Google Scholar] [CrossRef]
- Li, J.; Liu, N. The perception, optimization strategies and prospects of outdoor thermal comfort in China: A review. Build. Environ. 2020, 170, 106614. [Google Scholar] [CrossRef]
- Russell, S.; Jenkins, D.; Smith, M.; Halson, S.; Kelly, V. The application of mental fatigue research to elite team sport performance: New perspectives. J. Sci. Med. Sport 2019, 22, 723–728. [Google Scholar] [CrossRef] [PubMed]
- Xiao, Y.; Gao, Y.; Wang, Y.; Meng, X. Effects of solar radiation on thermal sensation and physical fatigue the human body under heavy-load exercise. Indoor Built Environ. 2022, 31, 7–16. [Google Scholar] [CrossRef]
- Wrighting Group of Chinese Guide lines for the Management of Hypertension (Revision Committee of the Guidelines for the Prevention and Treatment of Hypertension in China). 2018 Chinese guidelines for the management of hyper tension. Prev. Treat. Cardio Cereb. Vasc. Dis. 2019, 19, 1–44. [Google Scholar]
Disclaimer/Publisher’s Note: The statements, opinions and data contained in all publications are solely those of the individual author(s) and contributor(s) and not of MDPI and/or the editor(s). MDPI and/or the editor(s) disclaim responsibility for any injury to people or property resulting from any ideas, methods, instructions or products referred to in the content. |
© 2024 by the authors. Licensee MDPI, Basel, Switzerland. This article is an open access article distributed under the terms and conditions of the Creative Commons Attribution (CC BY) license (https://creativecommons.org/licenses/by/4.0/).