1. Introduction
Over the past five decades, probabilistic models for numerical simulations of concrete have attracted significant attention from various researchers seeking more realistic methods to simulate structural behavior in distinct ways. Shinozuka introduced an early probabilistic model compatible with finite element analysis, taking into account the spatial variation of concrete strength to capture statistical size effects [
1]. Van Mier et al., developed a lattice model within a three-phase particle composite structure similar to concrete [
2]. Benkemoun et al., created a mesoscale model for failure representation using 3D finite elements with embedded discontinuities [
3]. Tang et al. incorporated concrete heterogeneity using the Weibull distribution law and a mesoscale mesh of finite elements [
4]. Sellier and Millard addressed the random nature of tensile strength, along with softening behavior, through a variant of the Weibull theory. In this variant, the classical weakest link theory was reformulated in a non-local form, allowing for a second gradient implementation [
5].
In this paper, special focus is placed on the probabilistic cracking model (PCM), which has been under development at IFSTTAR (formerly LCPC) since 1987. Initially proposed by Rossi [
6] and subsequently refined by Tailhan et al. [
7], this model has been extended to encompass reinforced concrete [
8], fiber-reinforced [
9], concrete cracking [
10] and ultra-high-performance fibre-reinforced concrete (UHPFRC) [
11]. It has been the subject of extensive collaboration between Gustave Eiffel University (formerly LCPC) and COPPE (Federal University of Rio de Janeiro) since the early 1990s, with advancements in probabilistic finite elements analysis [
12], inverse analysis, and artificial neural networks [
13] combined with computational optimization.
The PCM contributes to a more realistic structural design, offering economic and sustainability advantages through the dual effect of utilizing materials at their maximum efficiency and enhancing their durability. In this context, since 2012 in Aix-en-Provence, studies employing PCM have featured prominently among the flagships at the Numerical Modeling Strategies for Sustainable Concrete Structures (SSCSs) conferences [
14].
The PCM characterizes the behavior of concrete based on two fundamental attributes: heterogeneity and sensitivity to scale effects [
15]. It has been thoroughly validated for structures subjected to quasi-static loads and for mature concrete no longer of an early age. Here, we adopt the definition from the RILEM TC-254 State of the Art Report [
16] that considers early-age concrete as that in the period following the percolation threshold, characterized by rapid changes in material properties influenced by hydration. The underlying principles of PCM can be summarized as follows: (i) concrete’s heterogeneity stems from its composition, with local mechanical properties such as tensile strength (
) and shear strength (
) being randomly distributed; (ii) scale effects arise from material heterogeneity, meaning that the mechanical response is directly influenced by the volume of material under stress; (iii) the cracking process is governed by defects in the cement paste, material heterogeneity, and the development of tensile stress gradients. The model is formulated within the framework of the finite element method and incorporates the following physical considerations [
7,
8]: (i) each element corresponds to a specific volume of heterogeneous material; (ii) the tensile strength is stochastically distributed across all elements of the mesh using a Weibull distribution function, the parameters of which are contingent upon the ratio between the volume of the finite element and the volume of the largest aggregate, as well as the compressive strength, which serves as a reliable indicator of the quality of the cement paste. It is important to note that concrete is treated in the PCM as linear elastic within volume elements, while cracks are represented using interface elements with a fully brittle constitutive relationship. Consequently, at the elemental level, tensile strength becomes a probabilistic variable, and fracture energy remains unaccounted for. Macroscopic tensile strength and crack energy emerge as structural properties reliant on the sample or structure size, as demonstrated in [
12]. This way, the size effect on macroscopic tensile strength (
) and specific fracture energy (Gf) manifests in the PCM as macroscopic properties that are dependent on the size of the analyzed structure, as experimentally verified. Rossi et al. studied the size effect of
in direct tension tests for specimens with diameters ranging from 20 mm to 300 mm and a slenderness ratio of 2 [
15]. Bazant and Kazemi [
17] and Wittmann et al. [
18] analyzed the size effect on Gf obtained via the RILEM three-point bending test. Therefore, this paper does not explore the specific fracture energy (Gf) in terms of its variability with hydration. A comprehensive examination of the evolution of Gf during the early stages is available in the recent RILEM State of the Art Report [
16], which reveals only a limited number of references addressing this topic. Notably, the formulas suggested by De Schutter and Taerwe [
19] for concretes with a degree of reaction exceeding 0.8 are highlighted. Another formulation, proposed by Bassam et al. [
20], considers the thermo-activation phenomenon based on the maturity concept, finding support in references [
21,
22].
When the focus shifts to analyzing the cracking process during the early age of the concrete, additional parameters are required to characterize the material’s heterogeneity. While the development of concrete properties in relation to the hydration reaction during its early age has been extensively studied [
16,
19,
23,
24], there is a notable absence of references regarding the evolution of the variability of the properties that are essential for probabilistic models, such as compressive and tensile strengths.
To address this knowledge gap, an experimental study was conducted to investigate the evolution of heterogeneity in compressive strength, Young’s modulus, and flexural tensile strength during the early stages of hydration. The findings revealed that the dispersion coefficient of these mechanical properties diminished as hydration progressed. This suggests that, during its early age, the structure of hardened concrete exhibits greater heterogeneity compared with more advanced stages of hydration.
3. Experimental Methods
3.1. Coupled Calorimetry/Cure Chamber
Among the various methods available for assessing concrete’s hydration evolution [
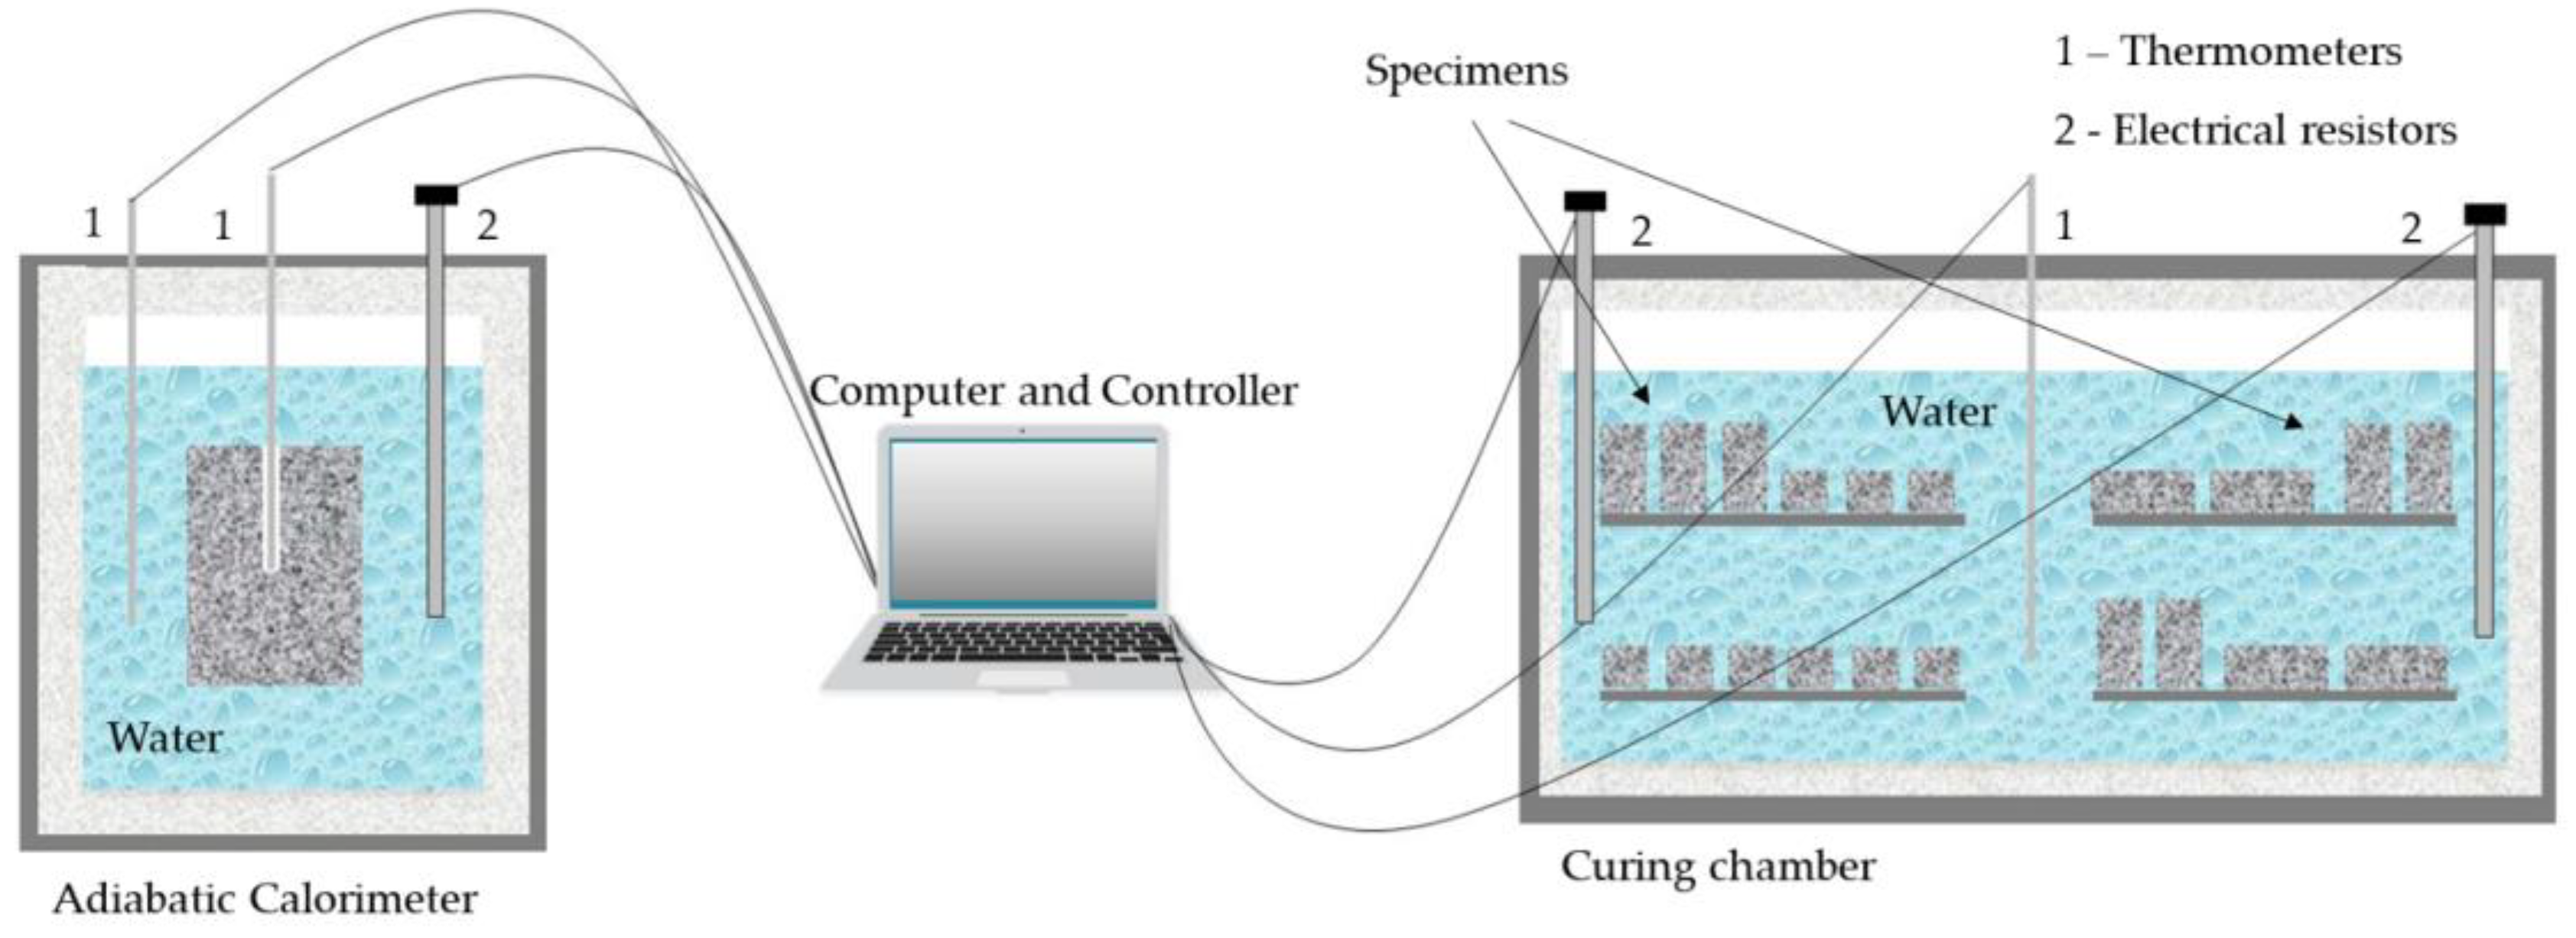
16], we chose adiabatic calorimetry for its capacity to continuously measure heat development, thereby reflecting hydration evolution. Additionally, by regulating the temperature of the curing chamber to match that of the adiabatic calorimeter, we ensured that the samples in the chamber shared the same hydration history as those inside the calorimeter. Hence, the microstructural properties of the samples in the curing chamber, including porosity, can be assumed to mirror those of the samples inside the calorimeter.
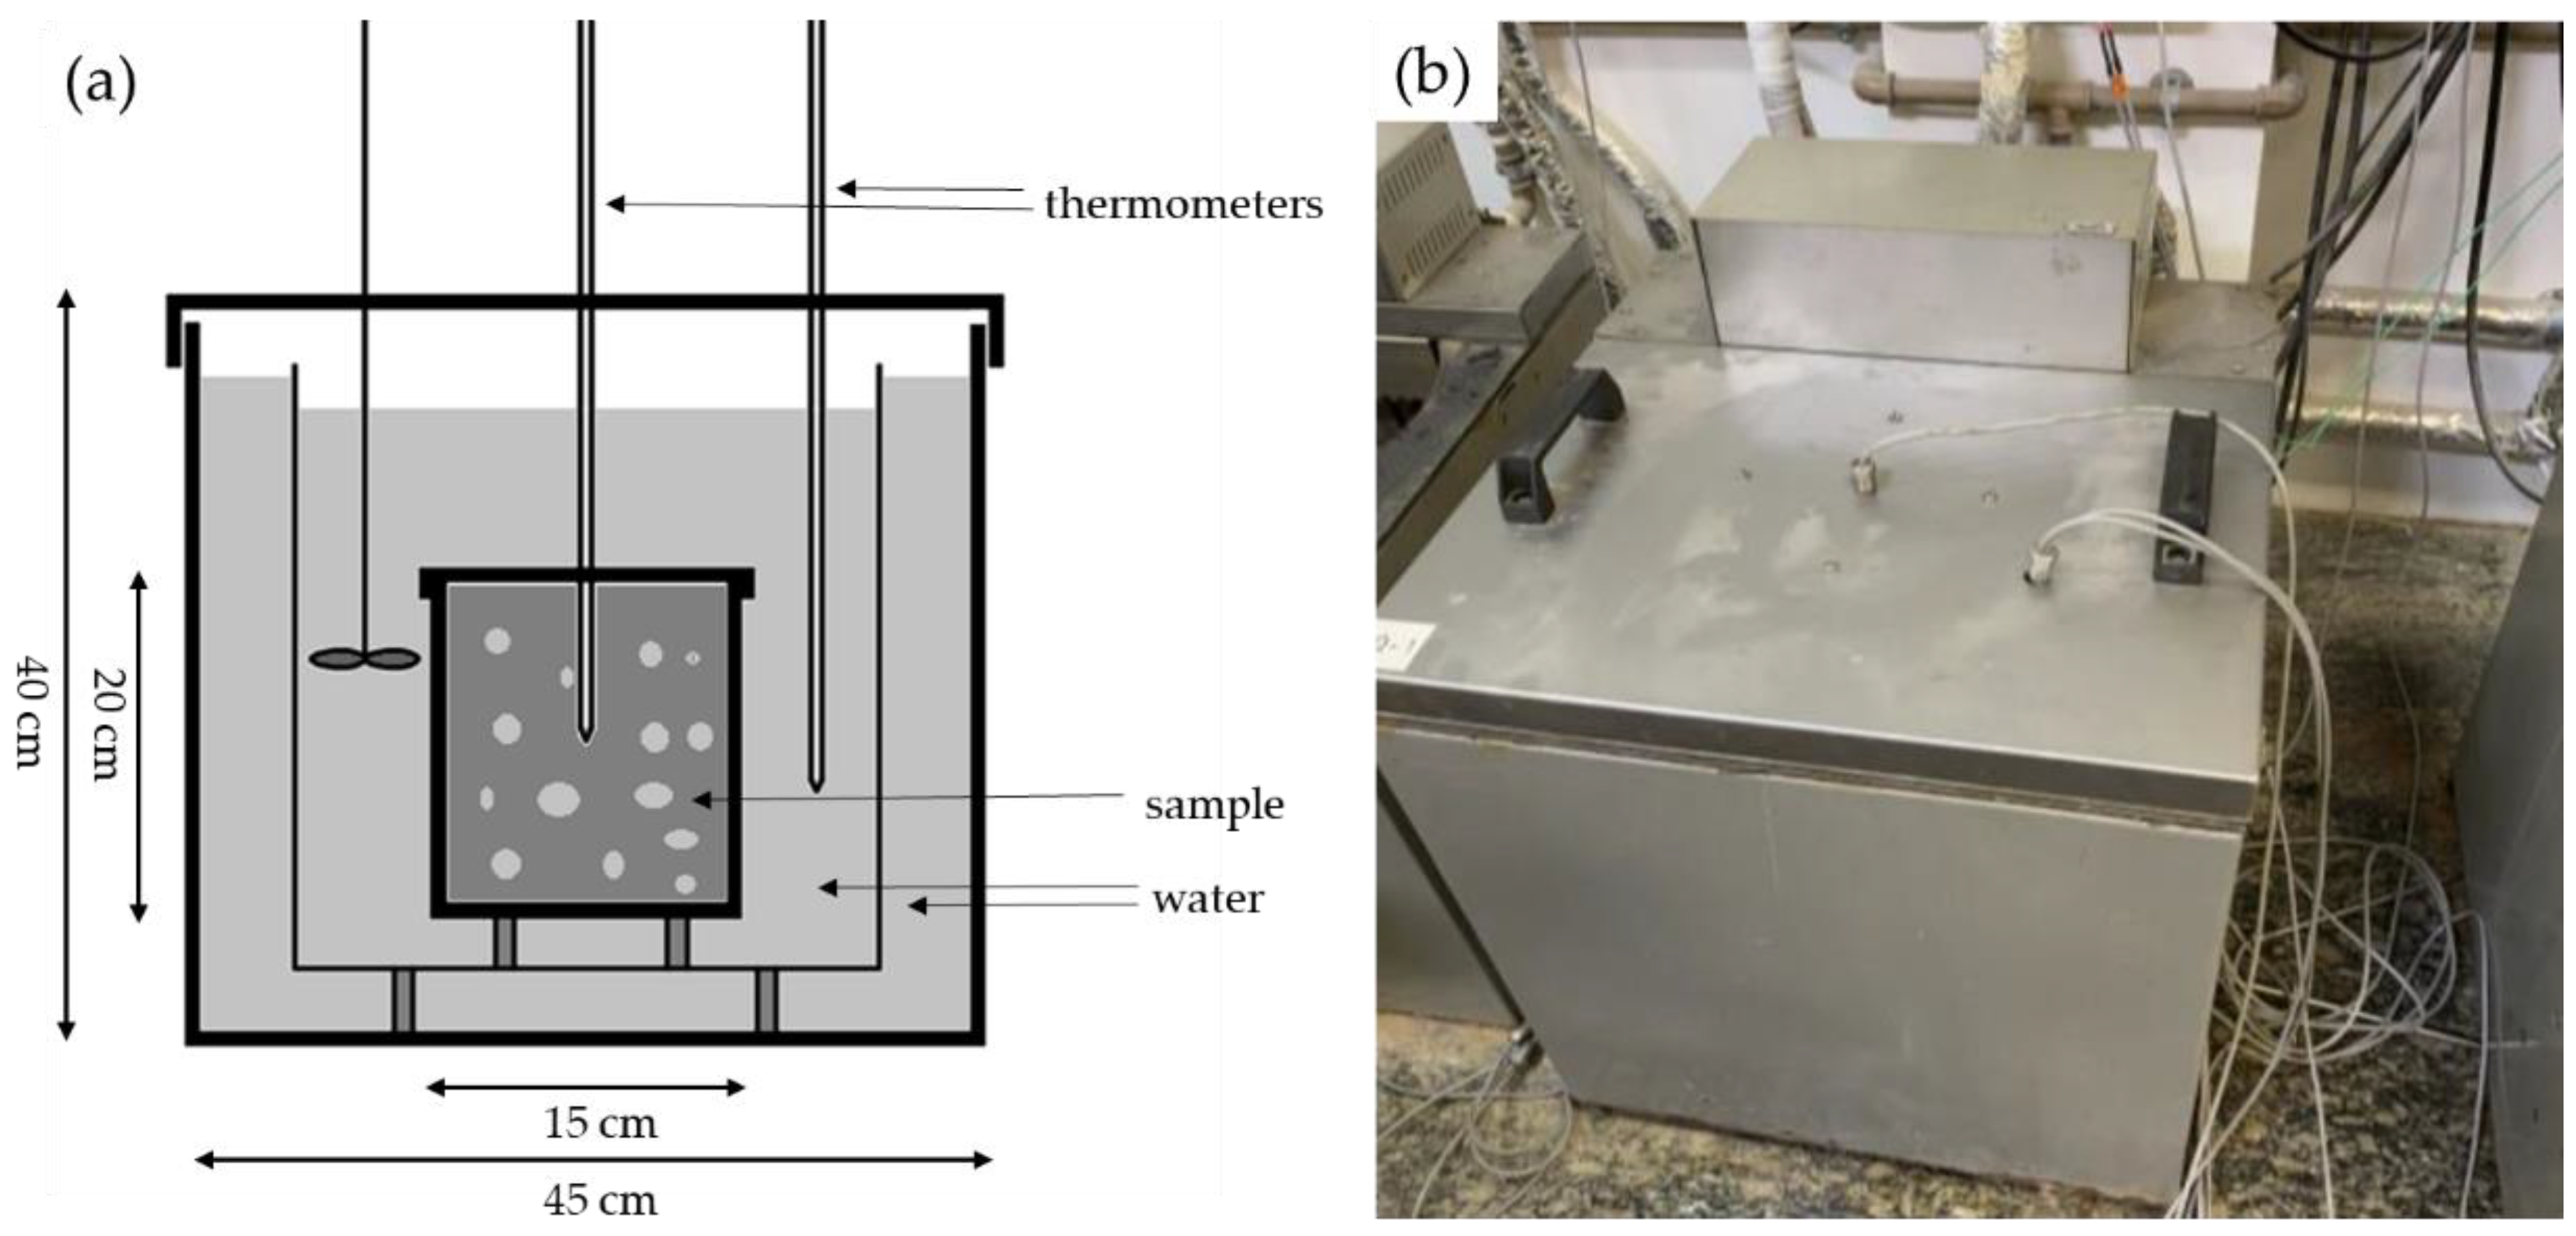
The adiabatic calorimeter comprised a 2 L concrete sample immersed in a constantly circulating water bath. Initially, both the water and concrete were in thermal equilibrium. As the temperature of the concrete sample increased by 0.1 °C due to the exothermic reactions, the water bath’s temperature increased via electrical resistors controlled by an electronic control unit. This method ensured that the water temperature matched that of the concrete sample throughout the hydration reaction.
Figure 2 presents a schematic representation of the adiabatic calorimeter, along with a photograph of the specific apparatus utilized in this study.
In the mixing process, first, the coarse and fine aggregates were mixed with approximately one-third of the water for 30 s in a concrete mixer. Next, the cement was added to the mixture along with an additional one-third of the total water, and mixing continued for another 30 s in the concrete mixer. Finally, the remaining water was added, and the concrete was mixed for an additional 5 min until achieving homogeneity.
After mixing, the concrete was introduced into the inner chamber of the adiabatic calorimeter. A thin layer of expanded polystyrene previously immersed in oil was utilized to line the chamber, facilitating the subsequent removal process. A robust plastic bag was positioned within the sheet, to contain the concrete. The pouring procedure was conducted in two stages. Initially, a layer weighing 2 kg was deposited and subjected to 30 s of vibration, followed by an additional layer weighing 1.74 kg that underwent an additional 30 s of vibration.
At the end of the vibration, a sealed iron tube was positioned at the center of the concrete mass. A thermometer was inserted into this iron tube, which had previously been filled with oil to enhance the conduction of the heat released by the concrete. Subsequent to the initial temperature measurement of the concrete, the water temperature was adjusted to match that of the material by incorporating either cold or hot water. This adjustment was made to prevent any interference with the thermal activation of the concrete. The thermometers had a sensitivity of 0.1 °C and acquired the temperature of both the water and the samples throughout the duration of the test. The temperature readings were recorded every minute for the purpose of constructing the temperature graph.
The aim was to perform mechanical tests on concrete with different known hydration histories in its early stages. To achieve this, a temperature-regulated water chamber was integrated with the adiabatic calorimeter. The chamber was equipped with a controller that synchronized its water temperature with that of the outer chamber bath of the adiabatic calorimeter. Consequently, the specimens within the curing chamber experienced an identical temperature profile and, therefore, the same hydration history as the specimen within the calorimeter.
Figure 3 provides a schematic illustration of this process.
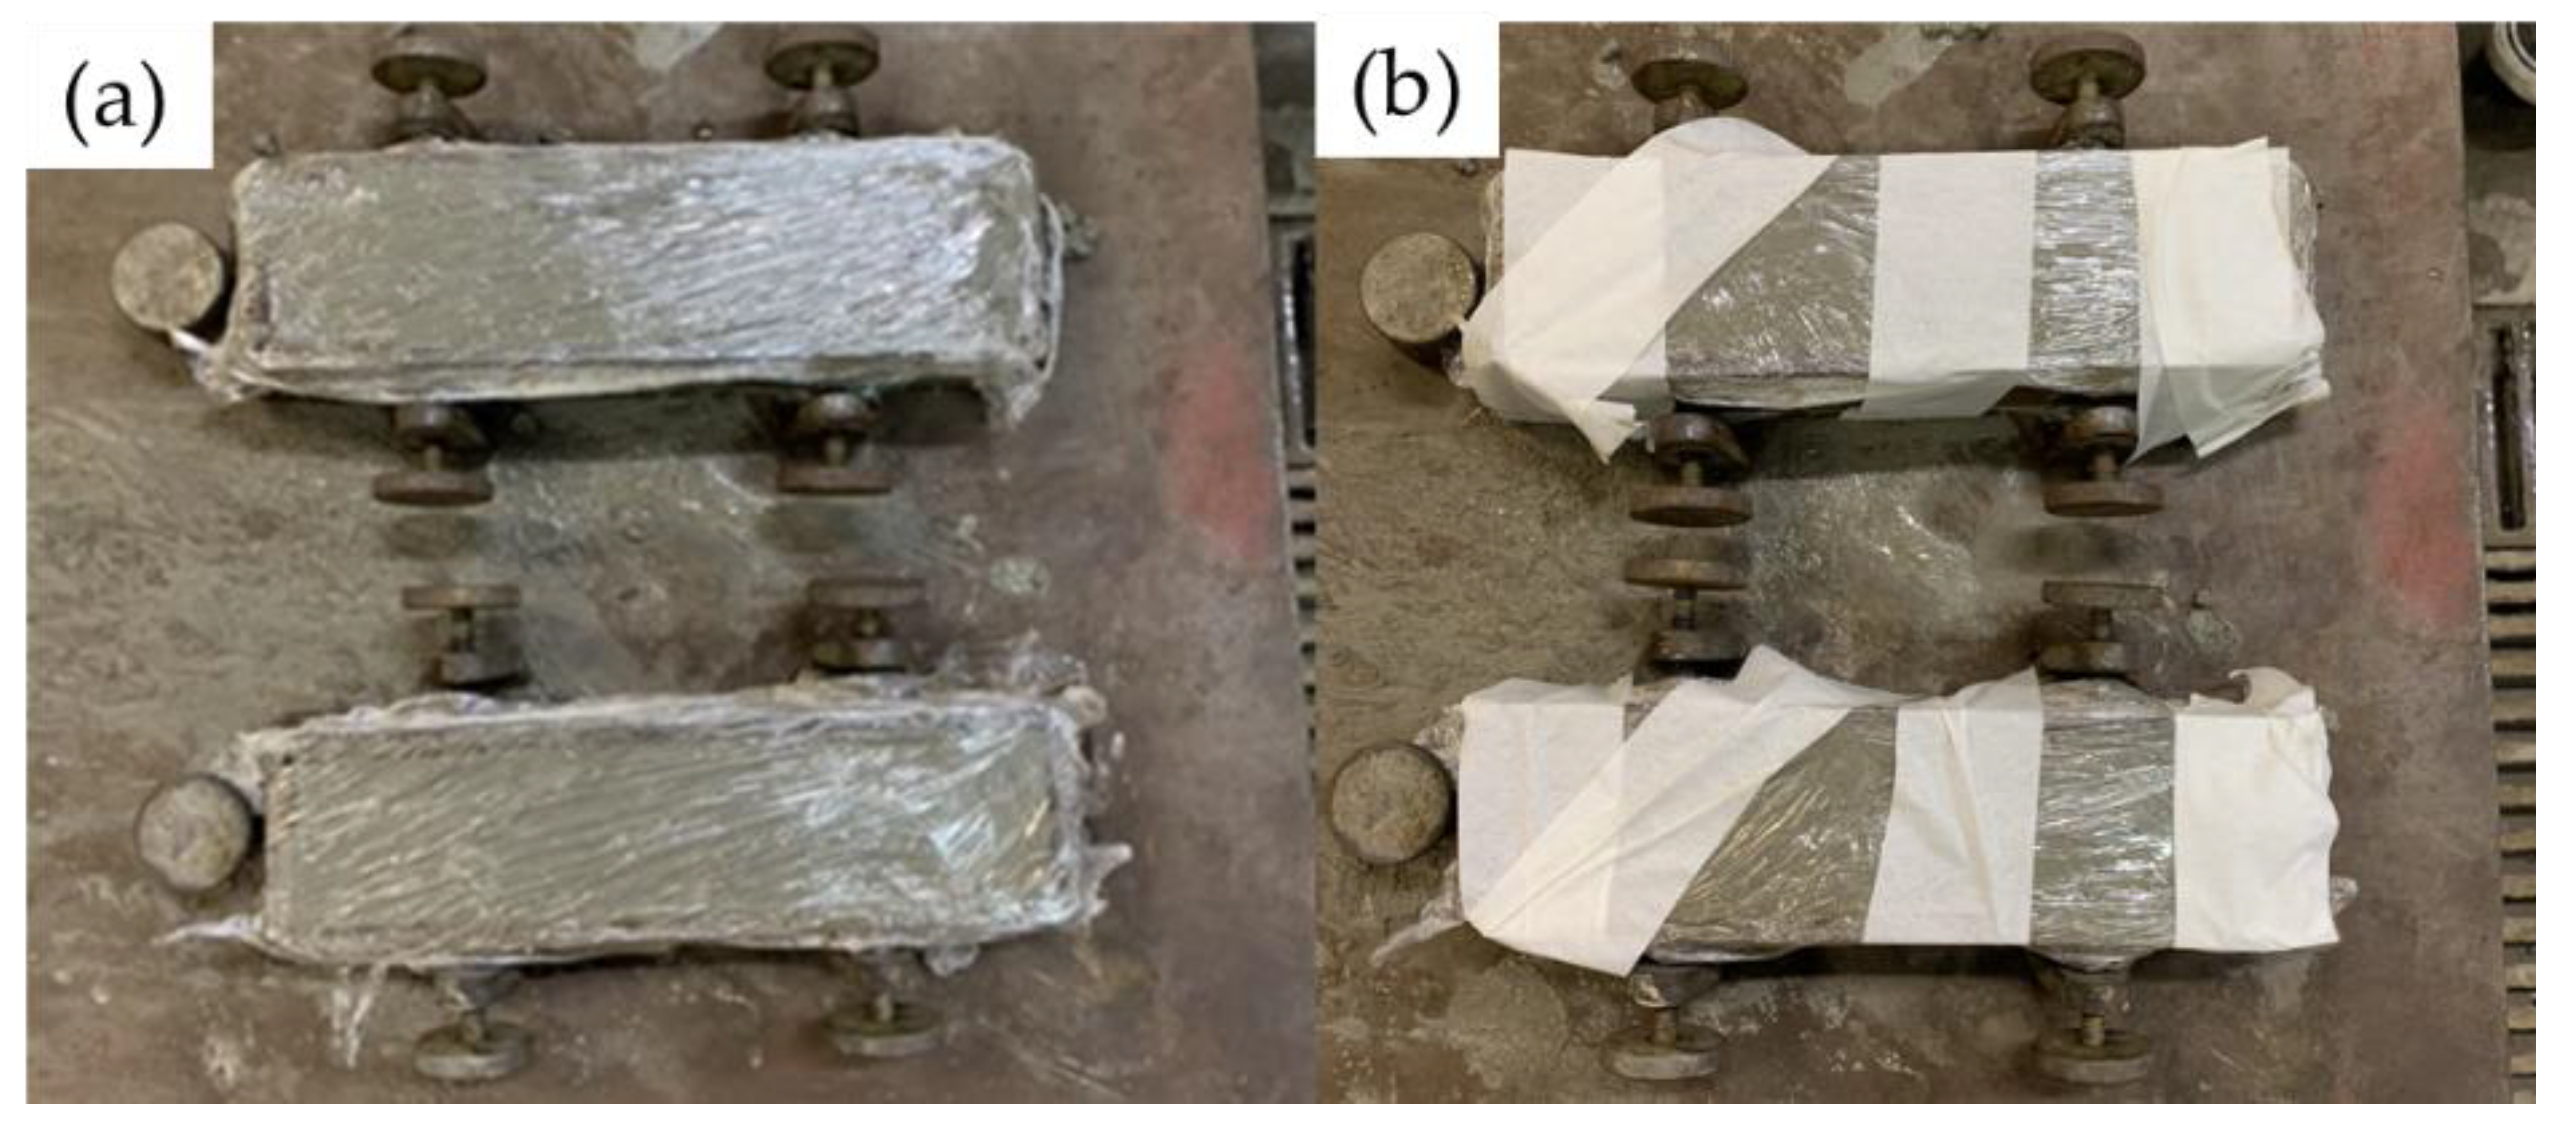
To prevent leaching, a water-resistant marine grease was applied to all the specimens, and the top of the mold was covered with a layer of plastic film, which was then secured in place using masking tape, as illustrated in
Figure 4. In this process, we aimed to realistically simulate conventional concrete curing and operational conditions.
Within the framework of the experiments outlined in this paper, the degree of heat development (
) described by Fairbairn and Azenha [
16] was used to characterize the progression of the hydration reaction in the early stages until the stabilization of the measurements within the adiabatic calorimeter:
In Equation (1), and are, respectively, the heat of the hydration released and the adiabatic temperature at a time . is the total heat of the hydration measured by the calorimeter and is the adiabatic temperature corresponding to the end of the calorimetric test when variations of are no longer measured within the sensitivity limits of the calorimeter.
Although the temperatures within the adiabatic experiments ceased to vary after 90 h, the experiment was extended for 7 days. Then, the specimens were removed from the curing chamber at different temperatures for mechanical tests to be performed following several degrees of heat development.
We employed the normalized parameter
as a measure of hydration evolution during the early stages, alongside normalized values of mechanical properties. This approach allowed us to establish relationships between these parameters in the early stages, independent of the concrete mixes. This method aligns with the consensus reported in various references, such as [
16,
34].
3.2. Compression Tests
The compression tests were carried out on cylindrical specimens of 75 mm diameter and 150 mm height, using a 1000 kN Shimadzu testing machine with an axial displacement rate of 0.3 mm/min. The Young’s modulus was measured with two 5 mm LVDTs positioned on opposing sides of a 10 cm length support centrally positioned within the cylinder. In the test for , 18 specimens were used, chosen for the normalization of results. For other values of , between 6 and 13 specimens were employed.
3.3. Bending Tests
The flexural tensile strength () was determined using 4-point bending tests conducted on 50 × 50 × 230 mm beams.
The span length (L) was 160 mm, and two loads (P) were applied via two rollers at a distance of
c = 50 mm from the supports. The tests were carried out using a 100 kN Shimadzu universal machine with a deflection rate of 0.3 mm/min, applied to the center of the lower face of the specimen. The flexural tensile strength
was calculated in the usual way using the following relationship:
where
is the maximum load reached by the beam,
.
In the test for , 13 specimens were used, chosen for the normalization of results. For other values of , between 5 and 6 specimens were employed.
3.4. Ultrasonic Pulse Measurement
The percolation threshold, which signifies the point when the cementitious material transitions into a solid state, was identified via the ultrasonic pulse measurement method, using an ultrasonic cement analyzer (UCA). A 5265 SGSA UCA model of the Chandler Engineering brand was used. The test was programmed to maintain a temperature of 23.5 °C and a pressure of 1 atm over a duration of one week. The percolation threshold was defined in accordance with the methodology established by Rocha [
35]. According to the author, the timing of the percolation threshold is calculated at the moment when the ultrasonic speed presents a significant increase due to the appearance of a crystalline structure in the concrete.
3.5. Statistical Analysis
The heterogeneity of the compressive strength (
), the Young´s modulus (
), and the flexural tensile strength (
) were analyzed. These properties are generically named as
. To ensure consistency in the analyses, they were normalized with respect to the mean values obtained for a degree of heat development equal to 1:
where
represents an individual sample,
stands for mean,
is the number of samples of property
that has the degree of heat development
.
The analysis of the mechanical tests was conducted in two phases. At first, the function
was fitted to the experimental values. Subsequently, for a given property
, samples were classified within clusters generically denominated as
, where
kcl is the number of the cluster, defined for values of
within the range
. Here,
represents a generic
i value of
of the property
p for the cluster numbered
kcl of this property, while
inf and
sup indexes are the lower and upper values of
for this cluster. The clusters were selected to be as narrow as possible while ensuring an adequate number of samples, thereby allowing meaningful statistical analysis. Therefore, a generic cluster
with
samples encompasses the degrees of heat development
, having the mean degree of heat development:
For all normalized properties and for each cluster, the mean (
), the standard deviation (
), and the dispersion coefficient (
) were determined via the following expressions:
Although the standard deviation was presented for several clusters, the dispersion coefficient was chosen as the primary parameter to characterize the heterogeneity of a cluster, given its consideration of the extent of variability concerning the mean of the cluster population.
It is important to note that for clusters with a mean degree of heat development equal to 1, the standard deviation is equivalent to the coefficient of variation, as expected, given that the mean value of the normalized properties for is .
4. Results and Discussion
4.1. Adiabatic Temperature Rise
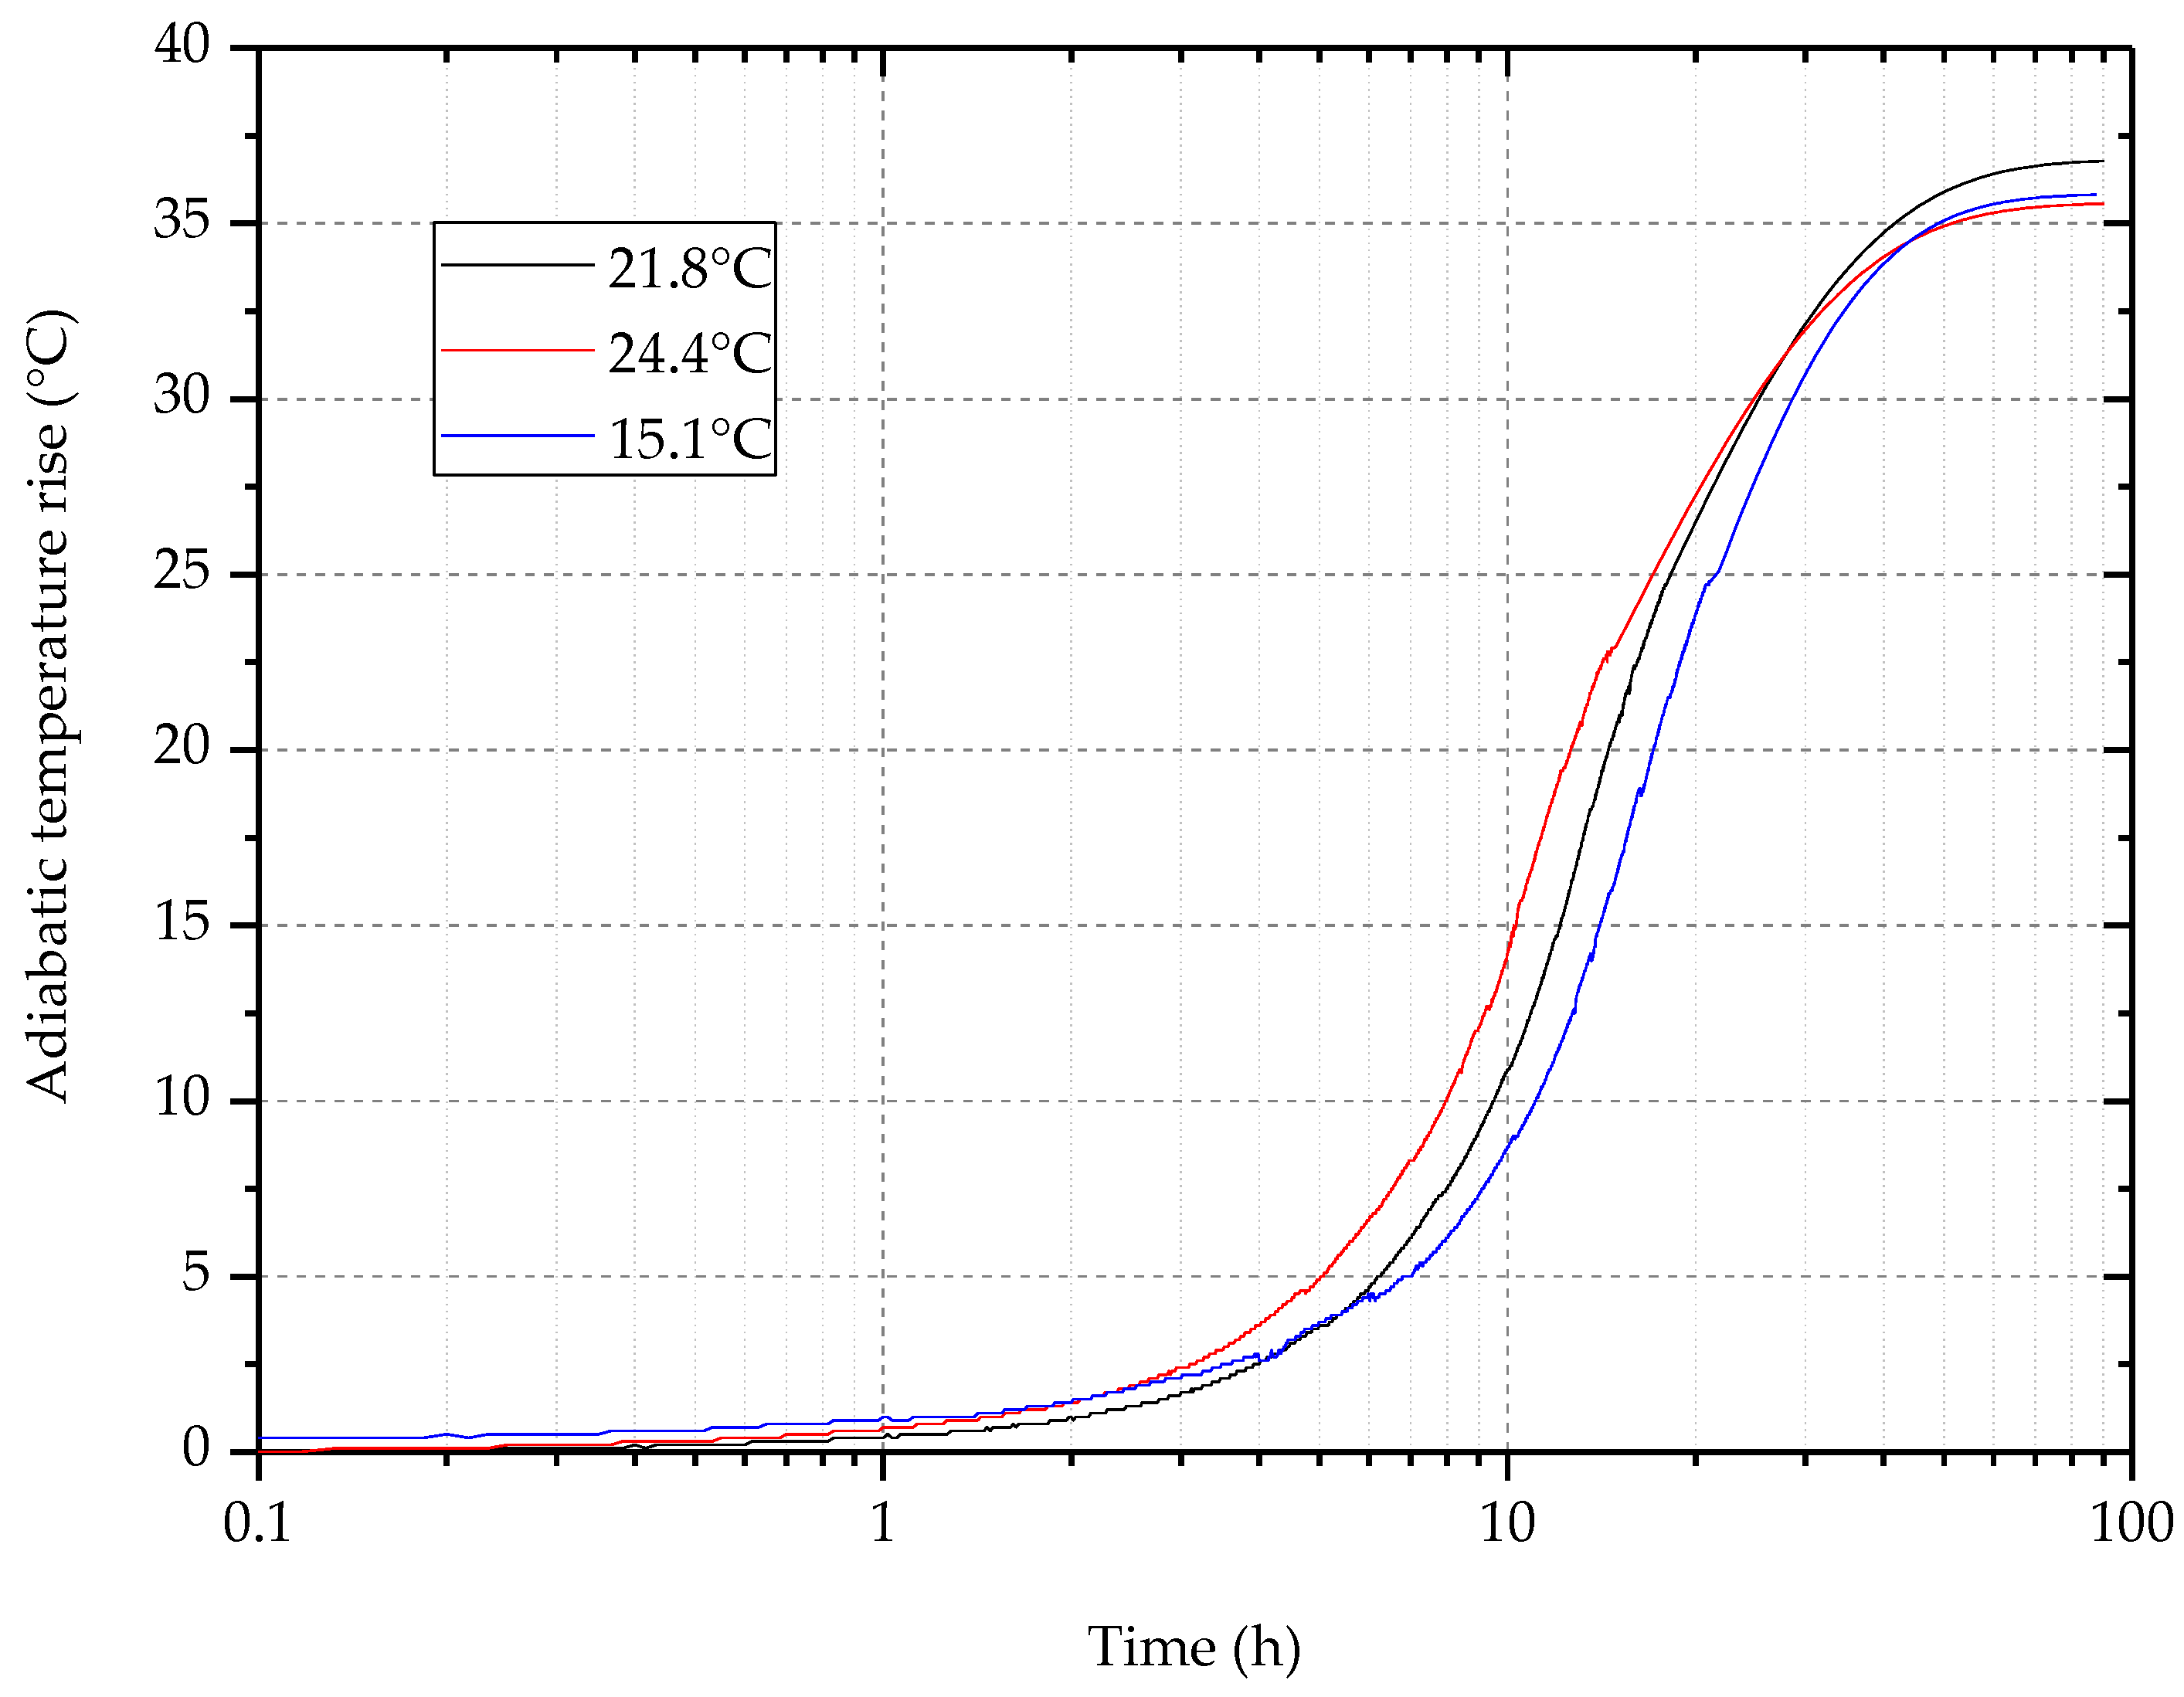
Initial temperatures of the calorimetric tests, as well as the curing process, were used within the range of 15 °C to 25 °C to ensure the same
values despite different temperature histories.
Figure 5 shows the adiabatic temperature rise in a semi-log scale for some typical tests. These curves illustrate that, as anticipated, the magnitudes of the temperature rises were nearly identical, differing by only 5% across the different tests. Furthermore, the results highlight the well-established thermo-activation phenomenon.
The temperatures measured in the curing chamber corresponded to those in the calorimeter. Therefore, by using Equation (1), it is possible to determine the degree of heat development at any time of the adiabatic experiment provided that is known. Given the impracticality of conducting mechanical tests for numerous samples at precisely the same , it was decided to create clusters gathering samples that can be reported to a single averaged degree of heat development. This concept is further elucidated in the subsequent analysis of the results detailed in the following paragraphs.
4.2. Evolution of the Properties with the Degree of Heat Development
Figure 6,
Figure 7 and
Figure 8 present the progression of the normalized properties, specifically the compressive strength
, Young´s modulus
, and flexural tensile strength
, generically named
, as described in
Section 3.5. This normalization was performed by dividing the individual values of the properties (
) by the average for the degree of heat development
, given by Formula (4). The average values of compressive strength, tensile strength, and Young’s modulus for a degree of heat development equal to 1 are, respectively, 34.3 MPa, 4.04 MPa, and 22.38 GPa. The patterns of the evolution of these properties with the degree of heat development are similar to those in other studies presented in the literature (see, for instance, the several models presented by Fairbairn and Azenha [
16]): the compressive strength is concave downward, the flexural tensile strength is practically linear, and the Young´s modulus is lightly concave upward [
36]. The results were adjusted with twofold models, considering the absence of mechanical properties prior to the percolation threshold, which denotes the specific degree of heat development (
) when the material becomes solid. Consequently, following an initial set of values fitted with a straight line, the subsequent values are represented by a non-linear function, as presented by Kraus and Hariri [
24] and used by Fairbairn et al. [
37] with some minor adaptations.
In Equation (9), the values were used; the value of was approximated based on a UCA test carried out in a w/c = 0.38 cement paste produced with the same cement as used in the present research, and described in part 3.4. These curves have the coefficient of determination .
4.3. Statistical Analysis of Compressive Strength and Young´s Modulus
Given that the compressive strength tests and the Young’s modulus tests were conducted on the same samples and at the same time, virtually identical clusters (as defined in
Section 3.5) were employed for both properties. An exception was made for the first cluster because the modulus of elasticity for low values of
could not be determined, due to experimental difficulties. In this way, the samples were gathered for analysis of the compression tests within 4 clusters, as presented in
Table 4, where the main statistical indicators are also presented. For each cluster, the curing state of the sample group is indicated by the average
, reflecting the mean hydration development of the samples associated with that particular cluster. The standard deviation had an evolution trend contrary to the dispersion coefficient, highlighting the importance of characterizing the heterogeneity of the cluster relative to the mean value of the property within the cluster.
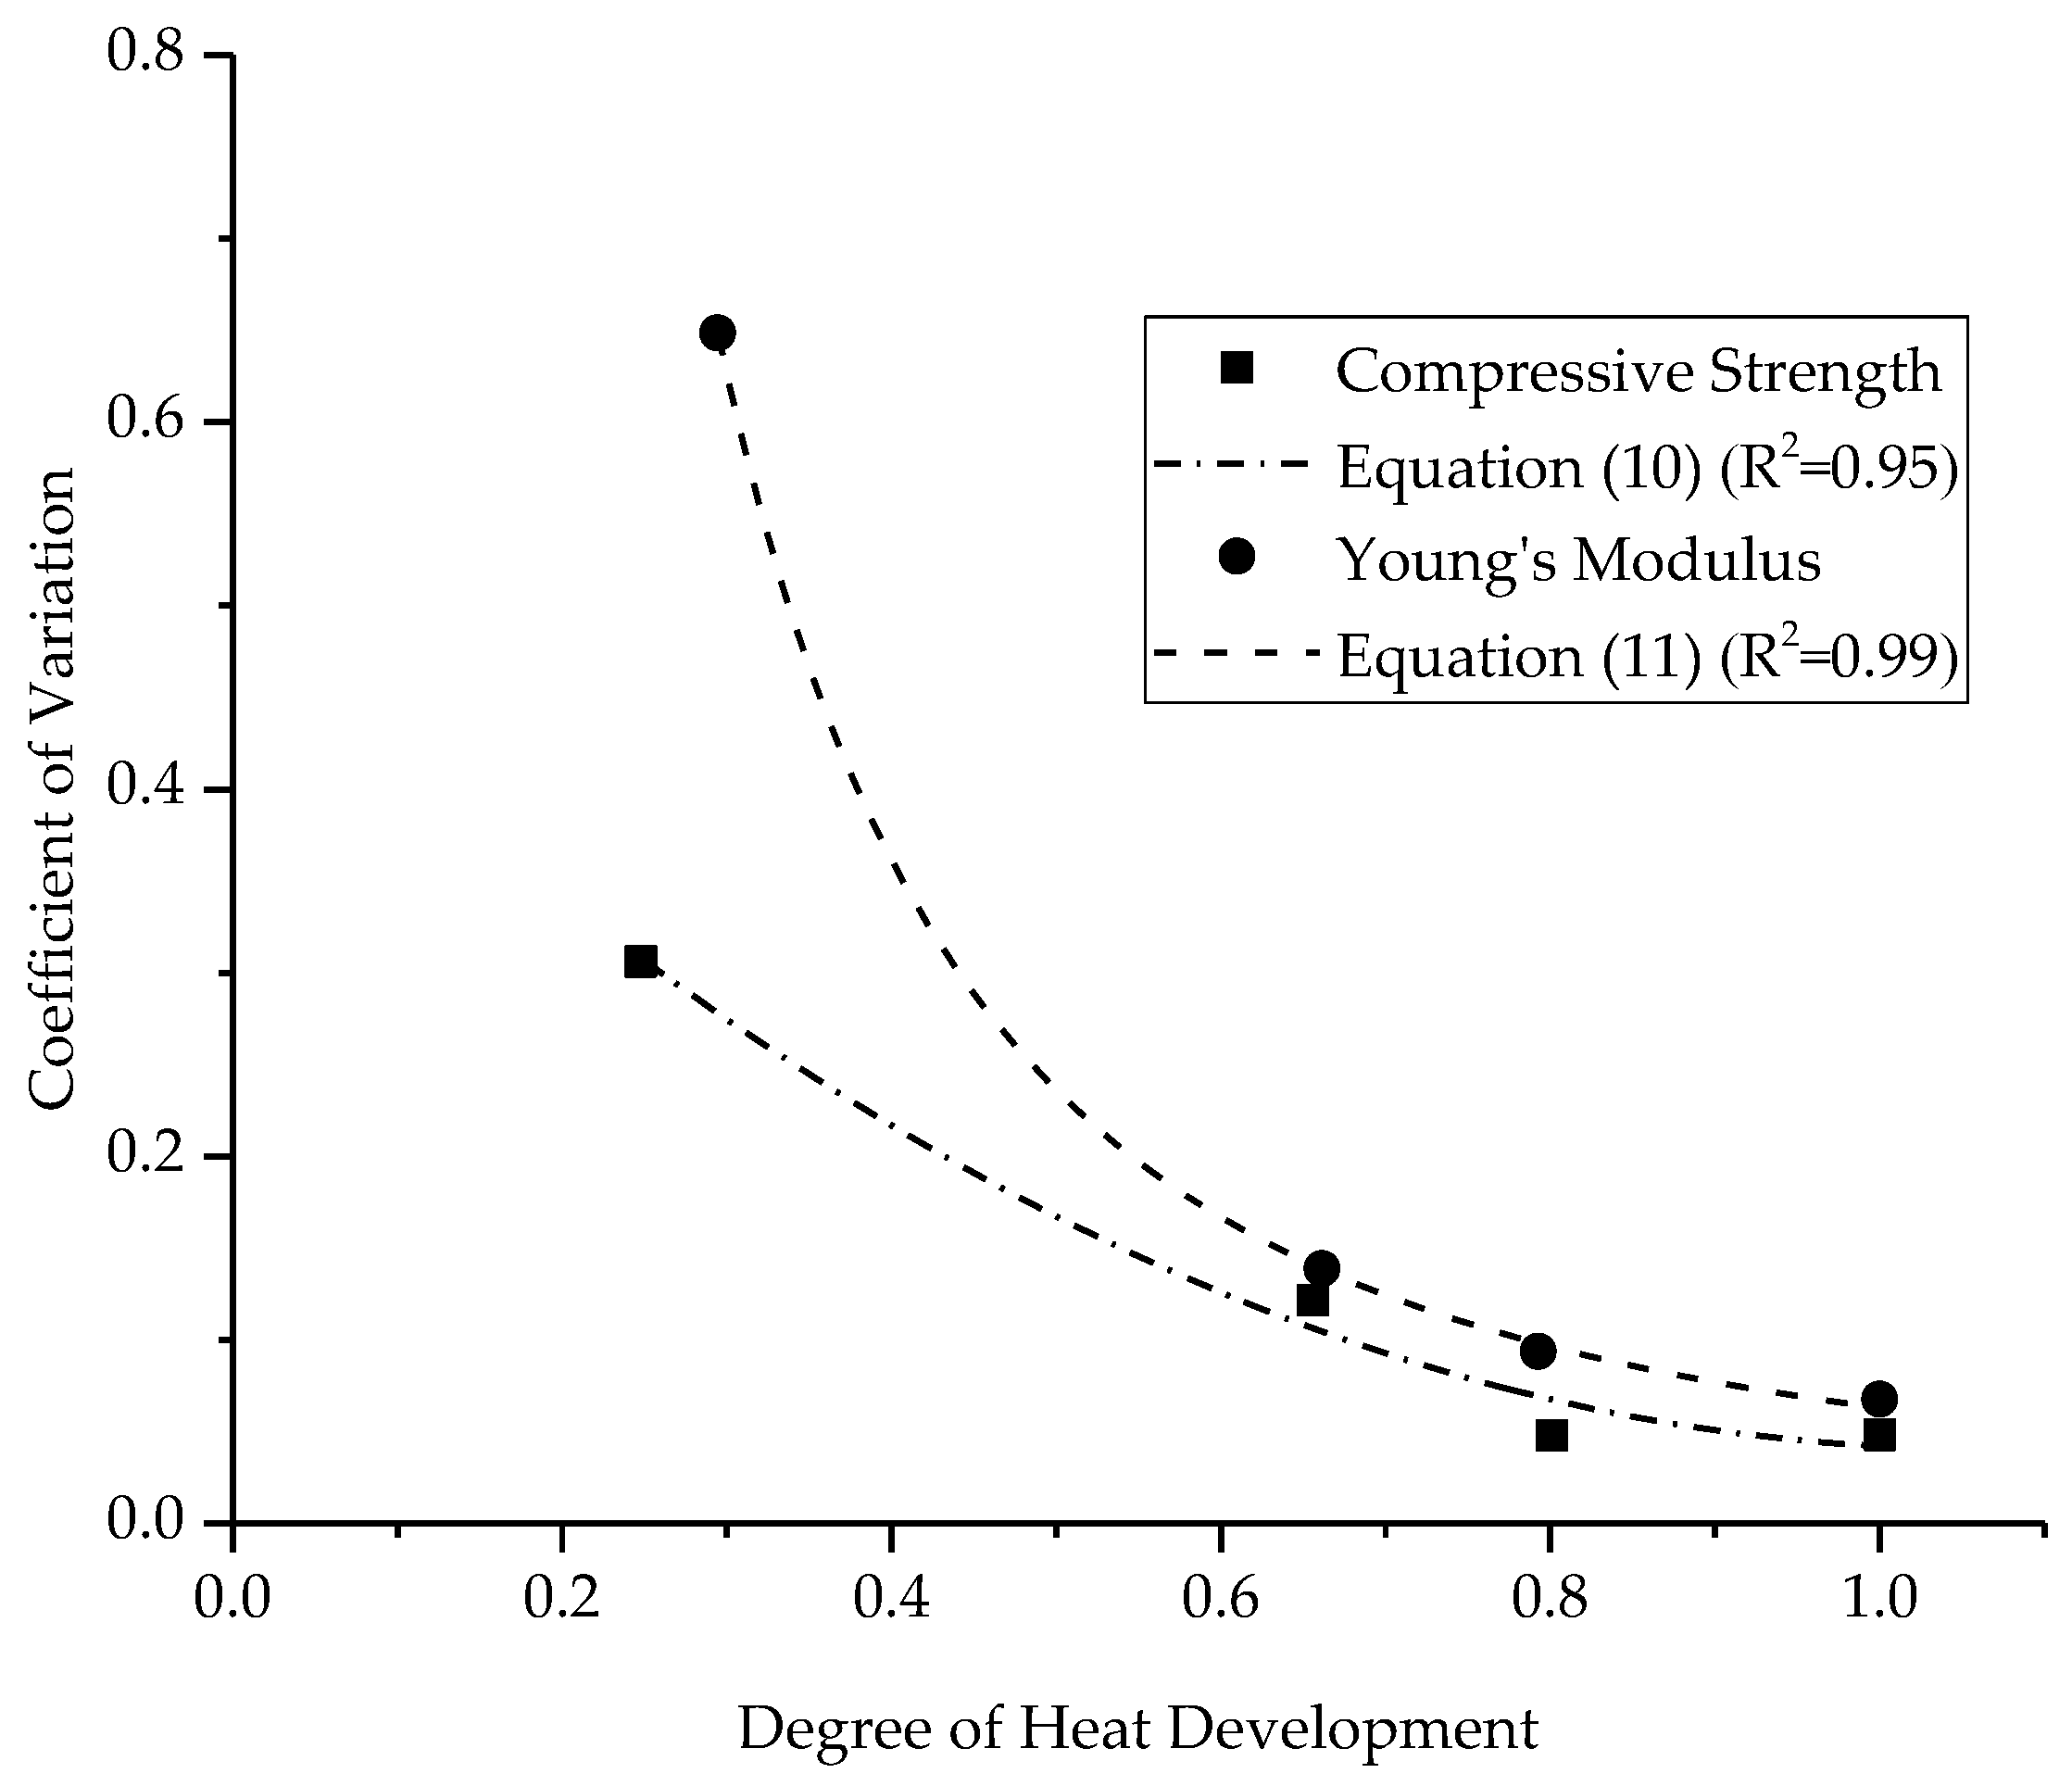
Figure 9 shows the graphs of
and of
adjusted via Functions (10) and (11), respectively, that best fit the values of the coefficient of variation. Their coefficients of determination (R
2) are, respectively, 0.95 and 0.99:
As expected, the heterogeneity of the initial stages of the modulus of elasticity was higher than that of the compressive strength, possibly attributed to the challenges encountered during the test, particularly concerning the positioning and sensitivity of the sensors.
4.4. Statistical Analysis of Flexural Tensile Strength
The samples were gathered for the analysis of the flexural tensile strength within 5 clusters, as presented in
Table 5, which also provides the principal statistical indicators. Similar to the compressive tests, the coefficient of variation, in contrast to the standard deviation, was higher for the lower degrees of heat development.
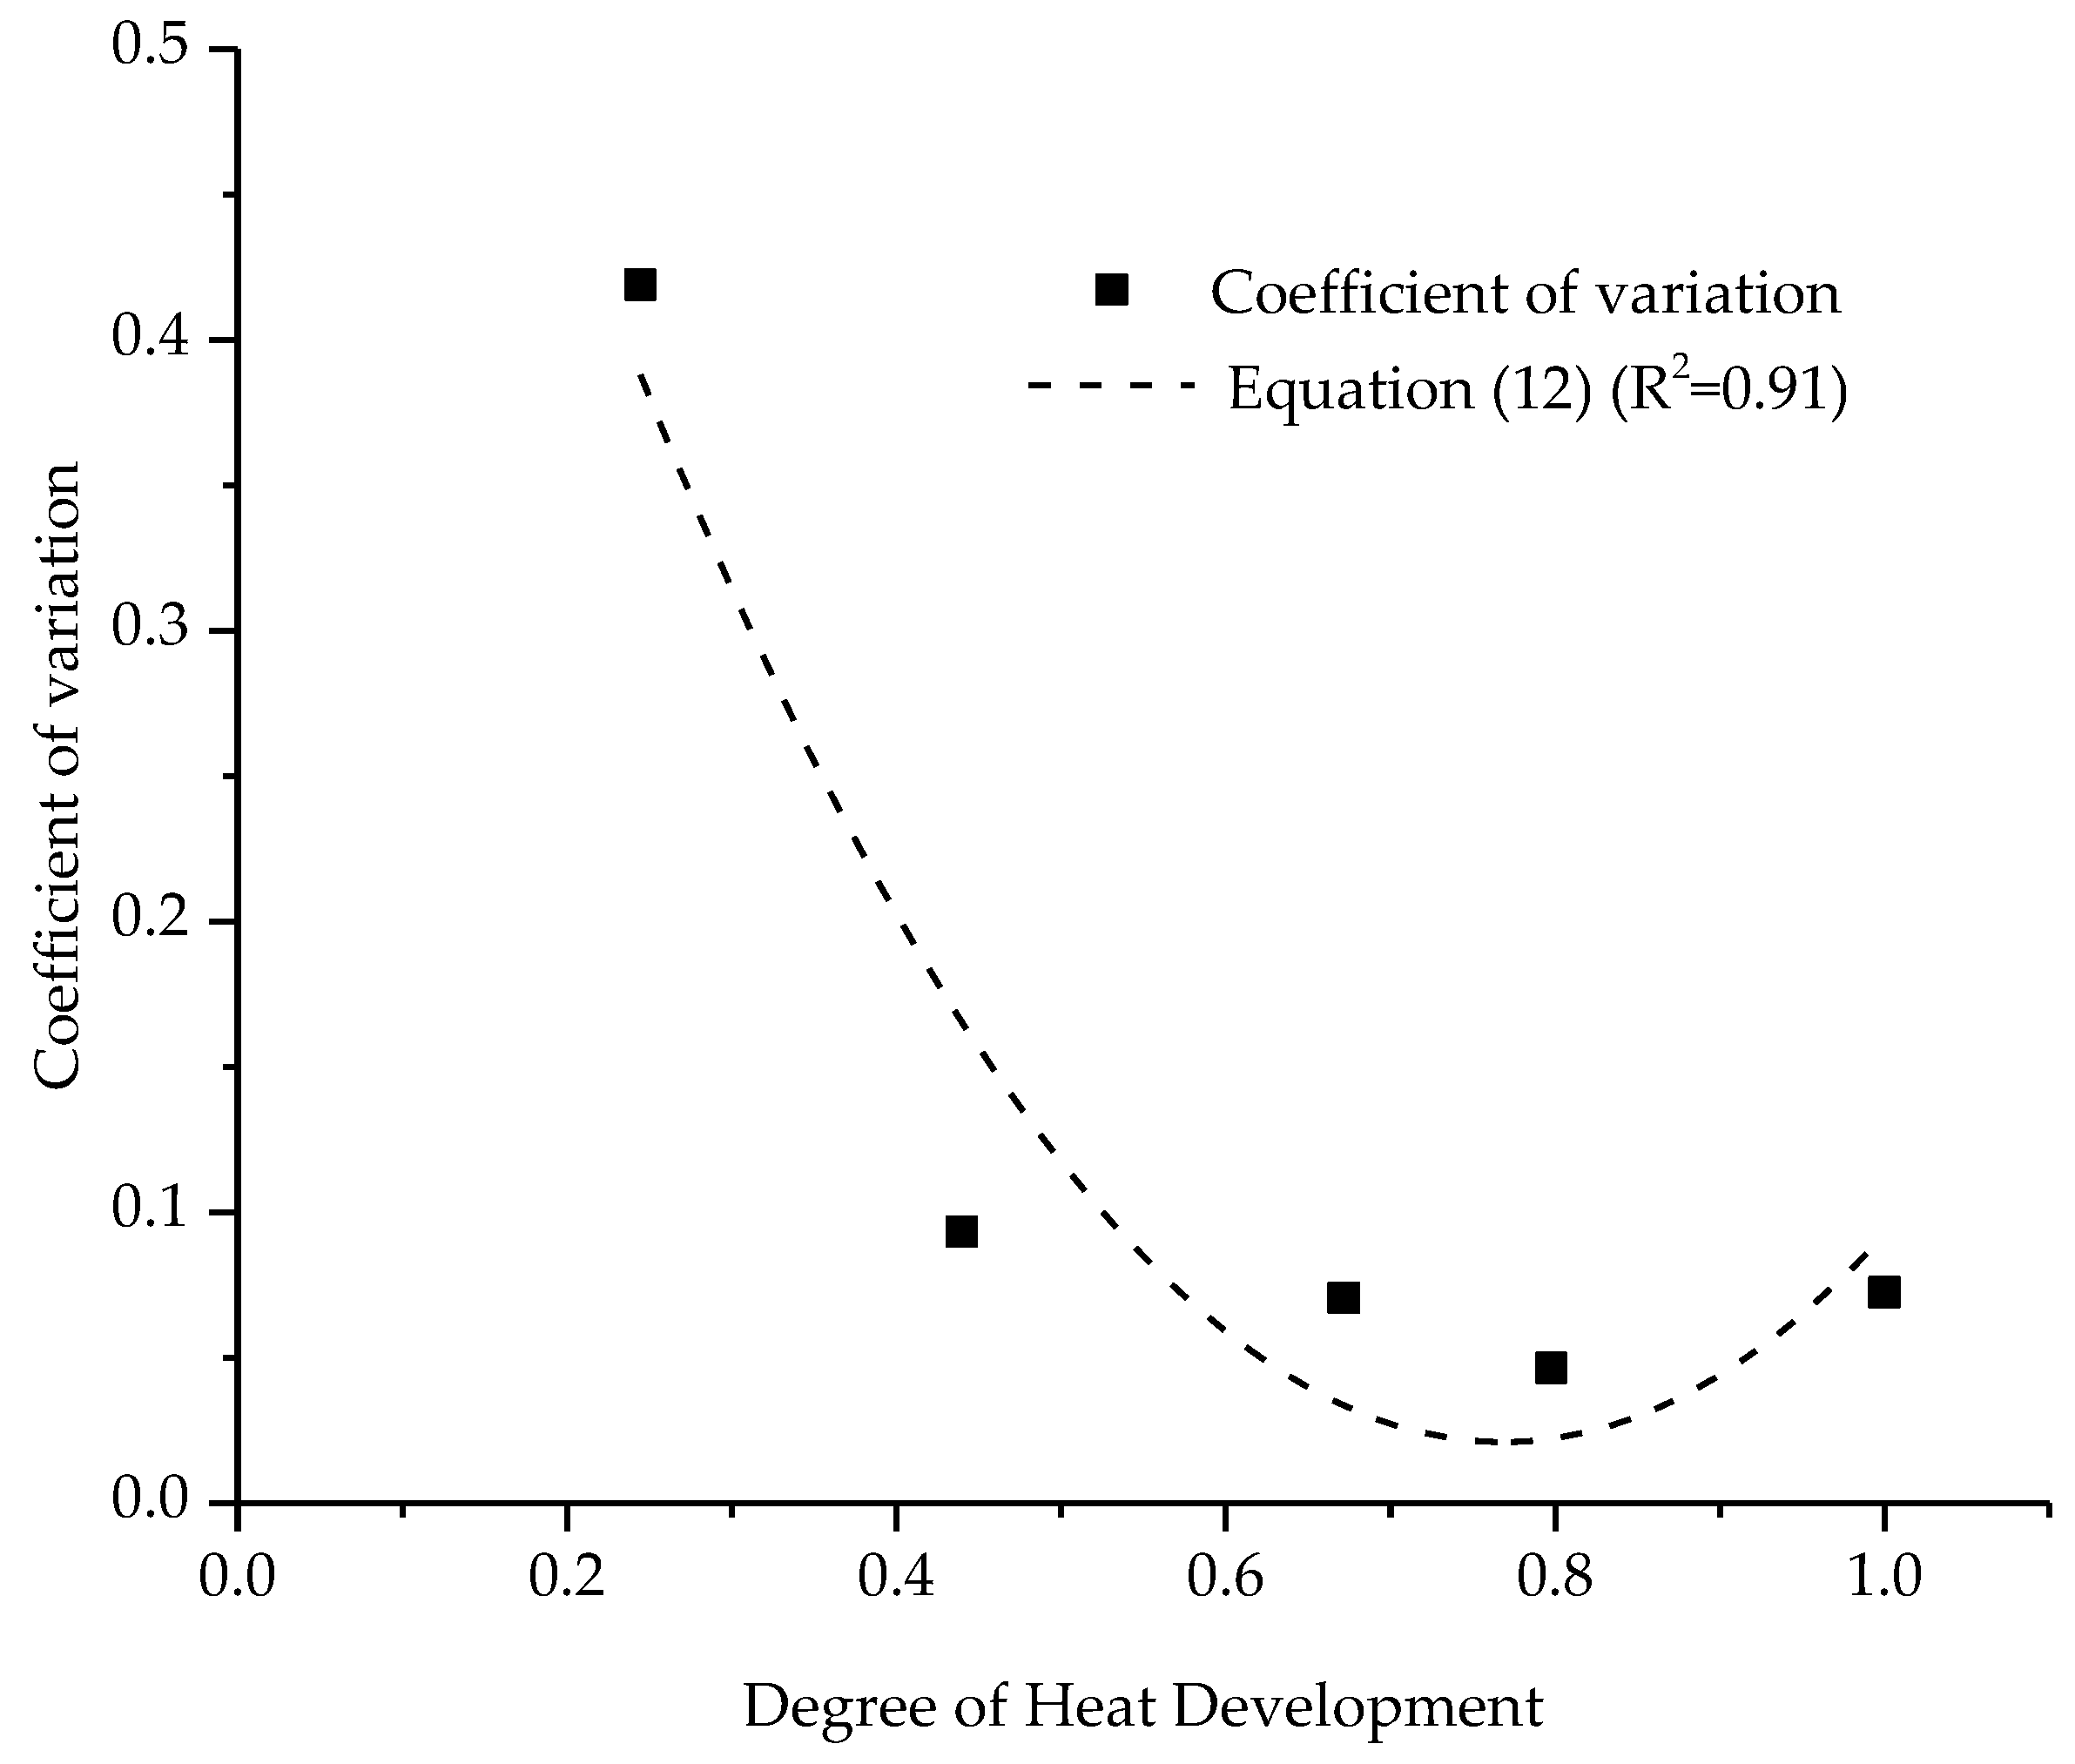
Figure 10 shows the graph of
adjusted via parabolic Function (12), which fits the values of the dispersion coefficient (R
2 = 0.91), focusing on increasing these values at the end of the curve:
When we closely observe the experimental results, we see that, for :
continues to decrease;
remains almost constant;
increases.
This is due to the existence of diffuse microcracks in the cement paste for this threshold value of 0.8. This diffuse microcracking, which contributes to the heterogeneity within the cement paste, is closely linked to the self-desiccation shrinkage of the paste surrounding the aggregates. While this microcracking has minimal effect or negligible impact on the heterogeneity of the Young’s modulus (E) and its temporal evolution associated with the formation of new hydrates, it significantly influences the tensile cracking process of the paste. The heterogeneity induced by this diffuse microcracking has a more pronounced effect than the homogenization resulting from the ongoing hydration process. For this reason, the values of were adjusted by the parabolic function given in Equation (12).
5. Concluding Remarks
This paper presents experimental research that aims to establish a connection between the heterogeneity of mechanical properties and the progression of the hydration reaction. It is essential to emphasize that previous research [
38] on the heterogeneity of concretes has indicated that for standard tests conducted appropriately, the variability is not notably significant in comparison to the material’s inherent heterogeneity.
The main finding of the present research lies in the observed trend of the coefficient of variation of the mechanical parameters under study (compressive strength, Young’s modulus, and tensile strength) with respect to hydration. The alterations in these statistical measures in conjunction with the progression of hydration support the intuition that the material at an early age exhibits a more heterogeneous structure characterized by a higher content of non-hydrated cement and free water.
Nevertheless, upon reaching a particular threshold of hydration (in this case characterized by ), the heterogeneity linked to the studied properties demonstrated distinct behaviors. This disparity arose due to microcracking and its varied impact on the mechanical properties.
The functions proposed for the evolution of heterogeneity with hydration are not intended to be universally applicable, and the authors acknowledge that a more extensive dataset is required to establish predictive models for the random behavior of concrete of an early age. Nevertheless, these functions are a first attempt to establish formulas that can help the modeling of concrete when probabilistic models are used to consider the scattering of its mechanical properties from an early age.
The probabilistic model on which this research is focused does not directly depend on the microstructural characteristics of the material. It primarily relies on relationships between the volume of specimens and the size of aggregates, a relationship that translates, in terms of numerical modeling, into relationships between the volume of finite elements and the maximum diameter of aggregates. Therefore, the future development of this research will be directed towards specimens and aggregates of different sizes, aiming at the determination of formulas that cover a larger number of concrete types. The four-point bending tests as well as the splitting test provide indirect values of tensile strength. However, such tests, especially the bending test, allow easier manipulation for conducting tests at early ages corresponding to lower degrees of hydration. A possible extension of this research could therefore be the performance of direct tension tests to confirm the results obtained here.


