Abstract
Basaltic rocks are the main source of local crushed rock aggregate for concrete in their region. Basaltic rocks are also potential rocks for alkali–silica reaction (ASR). ASR is a complex mechanism that deteriorates concrete via creating volumetric expansion over time between the reactive silica in the aggregate and the alkali components in Portland cement. However, due to the multi-scale nature of this long-term phenomenon, understanding its mechanism in concrete structures remains difficult to assess. In this study, the morphology and analytical composition of three groups of concrete prepared with basalt aggregate, basalt aggregate with 20% fly ash substitution of cement, and limestone aggregate were analyzed using scanning electron microscopy (SEM) and energy-dispersive X-ray spectrometry (EDX); it was characterized using X-ray diffraction (XRD), Fourier transform infrared spectroscopy (FT-IR), thermogravimetric analysis (TGA), and differential thermal analysis (DTA) and compared with the ASR structure. The (Na + K)/Si and Ca/Si ratios in SEM/EDX analysis and the water peaks in FT-IR and TGA analyses will help to determine the footprint of ASR.
1. Introduction
The alkali–aggregate reaction has been the subject of research since the mid-1930s, following the discovery of the alkali–silica reaction (ASR) by Thomas Stanton of the California Highway Department. However, the fact that ASR products are both amorphous and crystalline has led to a lack of understanding of reaction mechanisms, test methods, prediction, and diagnosis [1]. The primary cause is the ASR product’s inadequate characterization. Energy-dispersive X-ray spectroscopy (EDS) in a scanning electron microscope (SEM) can be used to easily analyze its chemical composition [2,3,4]. However, structural analysis of ASR products formed in aggregates is very difficult due to their small volumes. Numerous studies [3,5,6] examined the chemical makeup of the crystalline ASR products that formed in aggregates. On the other hand, there are not many data on how the composition of crystalline and amorphous ASR products formed in aggregates differs. There have been multiple attempts to use chemical composition or XRD pattern comparison to connect the crystalline ASR product’s structure to known minerals [7,8].
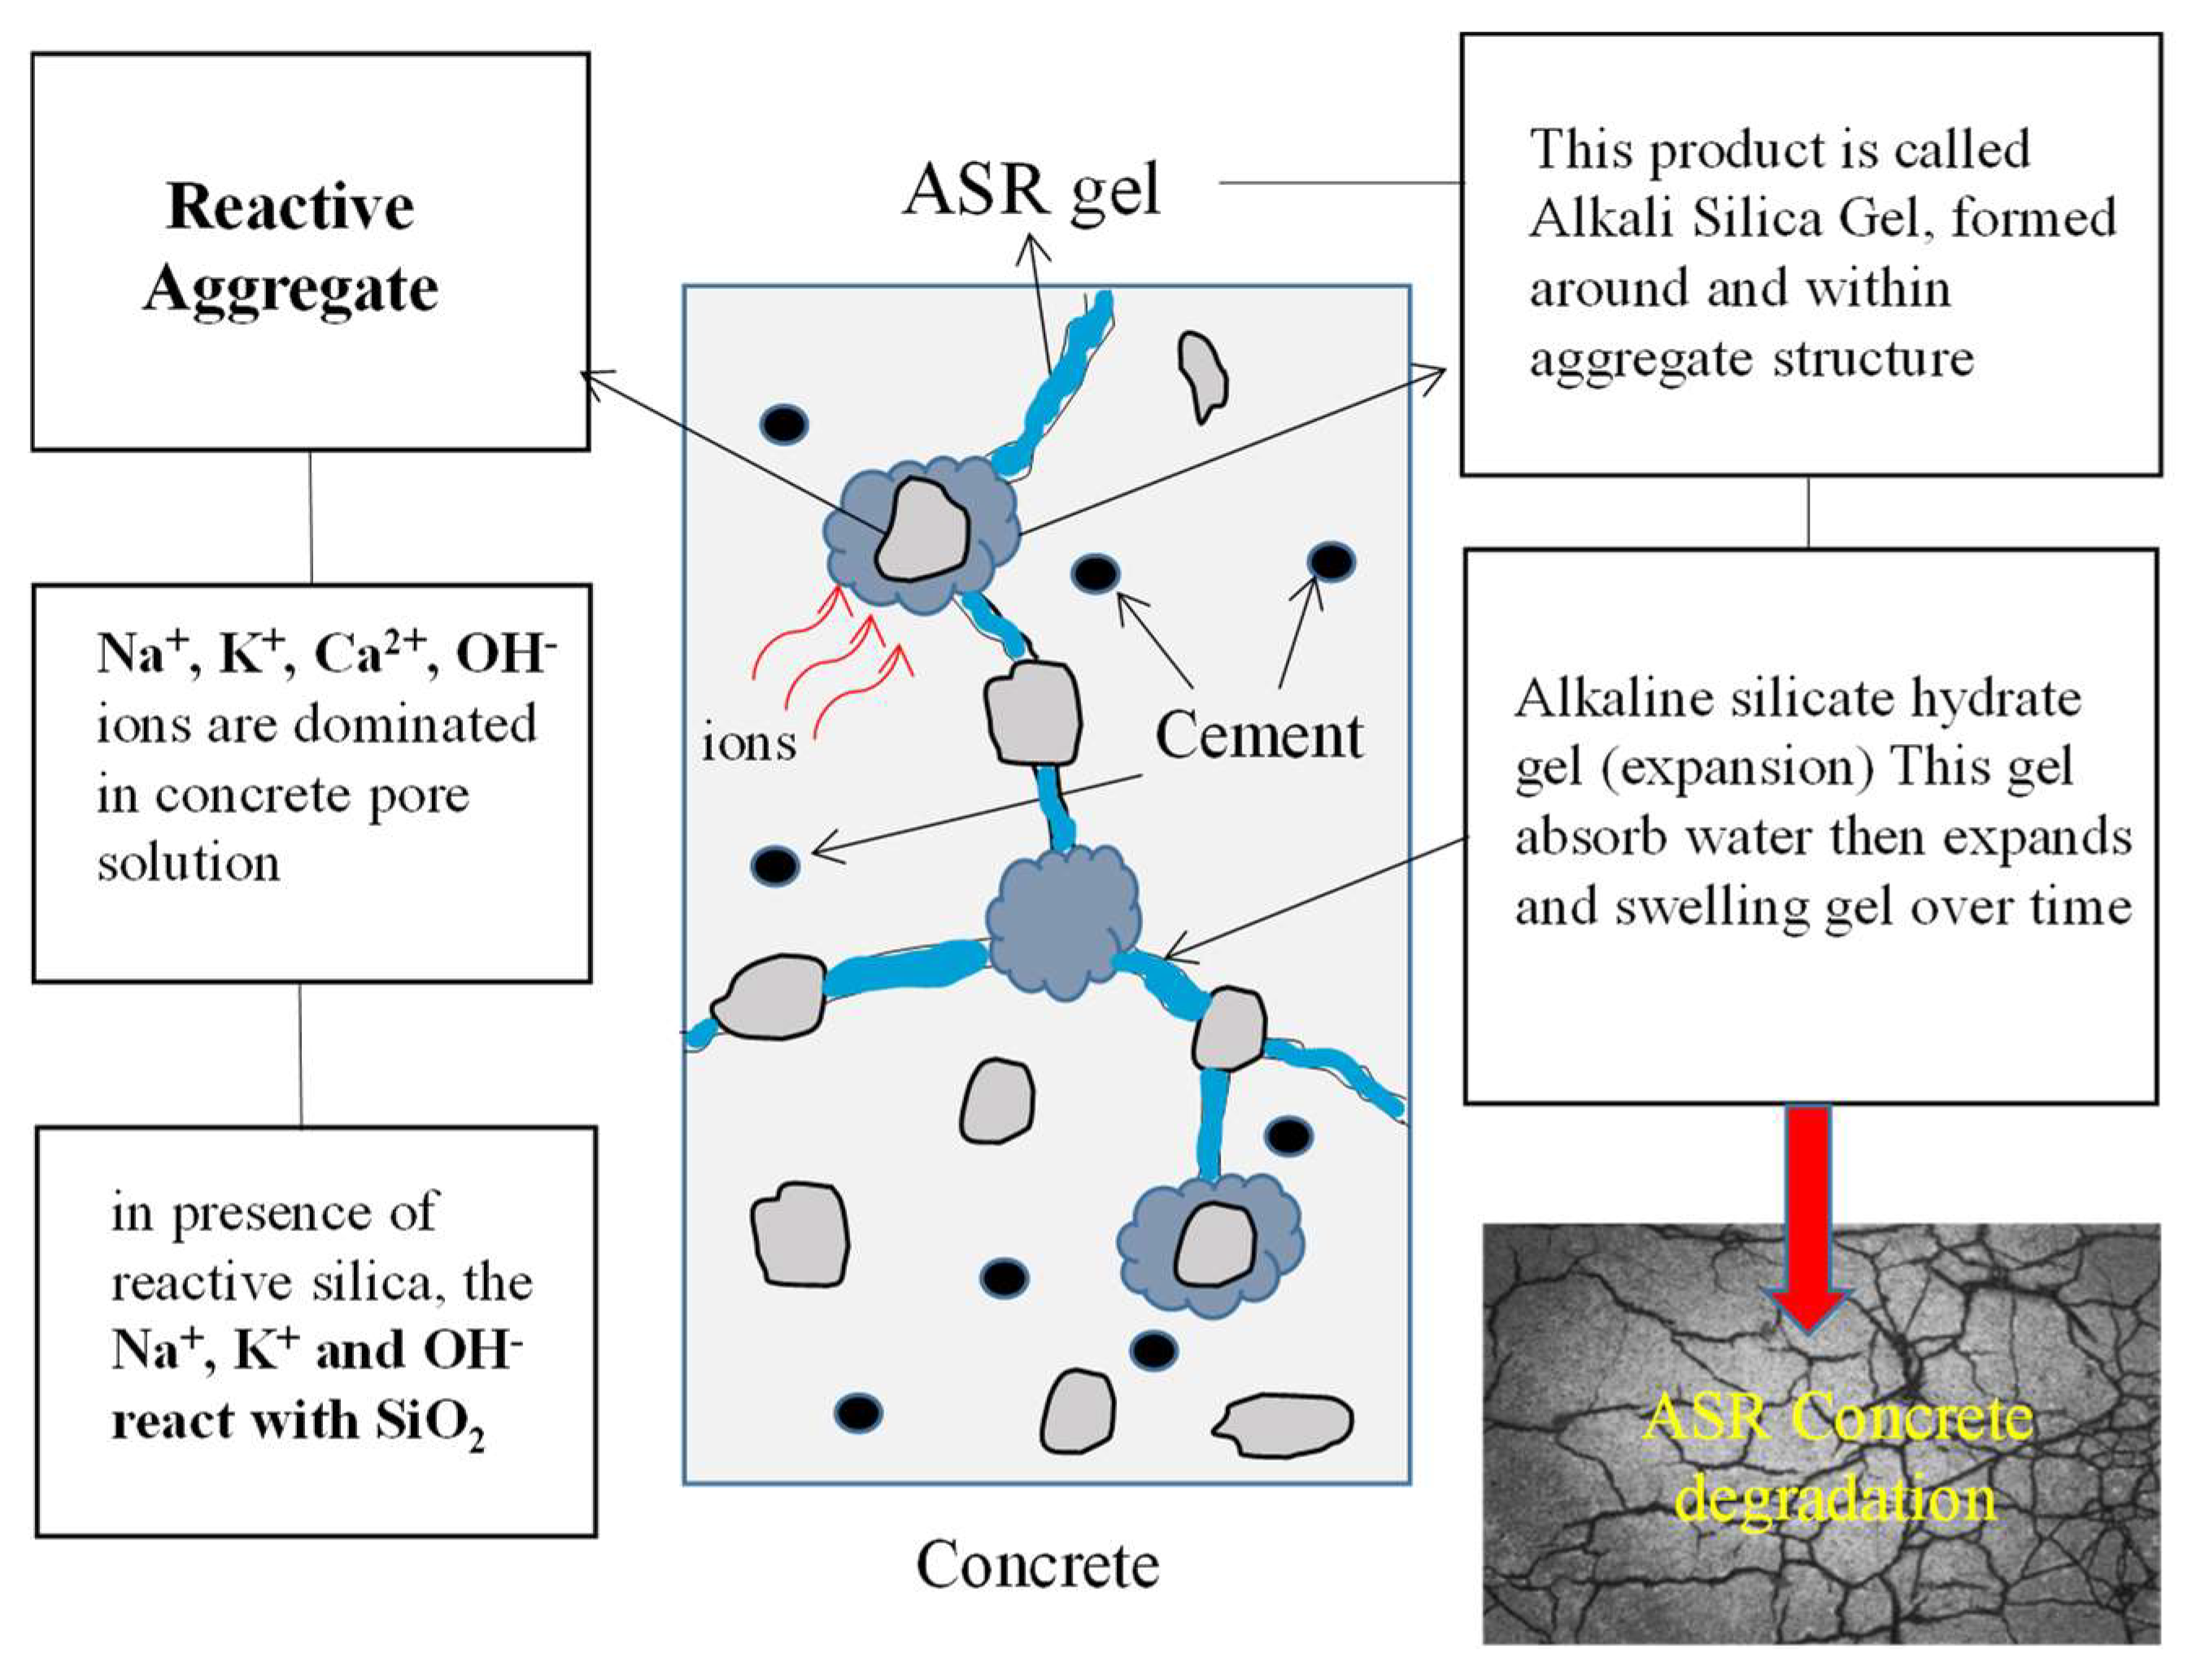
The gelatinous structure formed as a result of alkali–aggregate reaction creates significant cracks and reduces the strength and durability of concrete. ASR gel can cause slow but severe internal degradation in concrete structures. Alkali–silica reaction is a form of concrete deterioration that occurs as a result of the reaction of the SiO2 in the reactive aggregate present in the aggregates used in concrete with the Na2O and K2O (alkali) components that make up the cement. The formation of ASR gel has been reported to increase the volumetric expansion in the concrete and create superficial cracks, thus reducing the strength and durability of the concrete (Figure 1). It has been determined that the use of mineral additives such as fly ash and silica fume reduces the formation of cracks due to ASR and increases the strength and durability of concrete [9,10,11,12,13,14,15,16,17,18]. The general chemical formula of an ASR product or gel is [17,19].
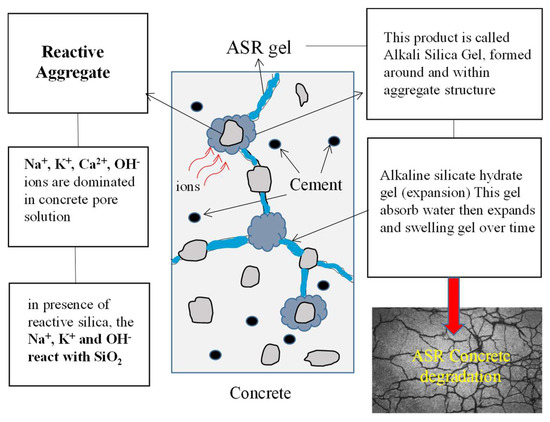
Figure 1.
The ASR mechanism schematic for concrete structures.
In the previous study [20], it was found that the use of basalt aggregate, silica fume, and fly ash increased sulfate resistance via reducing the volumetric expansion of concrete [20,21]. Fly ash can be used instead of cement due to the closeness of its Blaine value to the cement and its content of SiO2, Al2O3, and Fe2O3, which are chemical components of the cement. The high amount of silica (SiO2) in pozzolans such as fly ash reacts with calcium hydroxide (CH) to form calcium-silicate-hydrate (C-S-H), which creates strength. Recent research has shown that the substitution of 20% of fly ash for cement can reduce sulfate-induced expansion via reducing the amount of CH and C3A in the binder, reduce the CaO/SiO2 ratio and alkali content, and strengthen the resistance of concrete to ASR-induced expansion disorders [20,21,22]. In the studies conducted to reduce the harmful effect of ASR gels, it was reported that the substitution of fly ash and silica fume adsorbed alkali ions via forming hydration products with lower Ca/Si ratios, thus reducing the volumetric expansion rates [23].
An accelerated test method such as ASTMC 1260 is one of the methods applied to evaluate the reactivity of the aggregate to ASR [4,24]. In addition, the observation of microstructure with scanning electron microscope with SEM/EDX and elemental changes in concrete specimens are the methods used to understand ASR [20,25,26].
Kazemi et al. [27] investigated ASR in concrete produced from Portland cement and different aggregates such as granite, rhyodacite, limestone, and dolomite by applying ASTM C1260 and ASTM C1293 test methods followed by optical microscope, SEM, EDX, and XRD characterization methods and found that rhyodacite specimens have higher alkali-reactivity potential than granite specimens.
Cores extracted from the ASR-exposed old concrete structure were characterized using quantitative energy-dispersive X-ray spectrometry (EDX) and X-ray diffraction (XRD). The ASR gel was found to originate from quartz-rich metasedimentary coarse aggregate and high alkali levels in the cement [7].
This study aims to discuss the mechanisms of ASR-related products using characterization analyses such as SEM-EDS, XRD, FT-IR, and TGA-DTA after applying the conventional accelerated mortar bar testing (AMBT) method to determine the ASR reactivity of silicate-containing concrete aggregate and Portland cement. This study is important, as it demonstrates the influence of FA substitution and aggregate type on concrete strength and durability.
2. Materials and Methods
2.1. Materials
CEM I 42.5 N Portland cement (ASTM C type I) with a density of 3.15 g/cm3 and a Blaine specific surface of 387 m2/kg and Class C fly ash (FA) with a density of 2.20 g/cm3 and a Blaine specific surface of 217 m2/kg were used in the experiment. The specific surface areas of the materials were measured in accordance with EN 196:6 and ASTM C 204 standards [28,29]. The analysis results of fly ash and Portland cement were conducted at the Limak Kurtalan Cement Plant (Limak Holdings Inc., Ankara, Türkiye). Table 1 shows the chemical composition of Portland cement, FA, and basalt aggregate (from our previous study [30]). Table 2 shows the mineralogical composition of Type 1 Portland cement. Table 3 shows the physical and mechanical properties of used aggregate.

Table 1.
Chemical composition by XRF of the materials (wt.%).
Table 2.
Mineralogical composition of Type 1 Portland cement (wt.%).
Table 3.
Properties of the coarse basalt aggregate.
The temperature at which the fly ash burns and the cooling rate determine how the particles will appear [35]. Most of the particles observed in this study were solid spheres ranging in size from about 1 to 100 μm. The SEM image of fly ash and Portland cement is given in Figure 2, and XRD analysis is given in Figure 3.
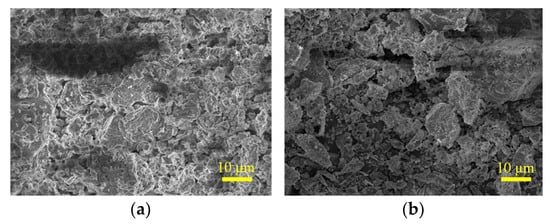
Figure 2.
(a) Fly ash and (b) Portland cement SEM image.
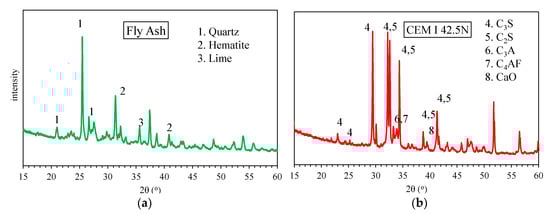
Figure 3.
(a) Fly ash and (b) Portland cement XRD analyses.
Regarding fly ash, the absence of a hump or “halo” around the sharp broad peak centered at approximately 25.49° 2θ in the diffractogram indicates that the fly ash is Class C [36]. Class C fly ash is normally produced from lignite and lower bituminous coals and usually contains significant amounts of calcium hydroxide or lime [37]. In the XRD analysis of Portland cement, C3S, C2S, C3A, and C4AF were detected as the main components, and it is seen that the XRD pattern of the cement has a crystalline structure suitable for a typical Portland cement.
Class C fly ash differs from Class F fly ash primarily by having a higher calcium content. Previous studies have noted that much of the literature is on the activation of low-calcium fly ashes, where calcium is primarily considered to be a contaminant that produces various hydrate [38,39] assemblages that can cause a decrease in strength [40] and a slowing of the reaction rate [41]. However, some studies have revealed that Class C fly ash has both pozzolanic and cementitious qualities [37].
To counteract ASR, highly reactive rocks should only be used in combination with low-alkaline cements [16,18,25,26,42,43,44]. Although cement contains various alkali metals, sodium Na+ and potassium K+ ions play an important role in ASR concrete deterioration [18,25,26,43]. According to ASTM C150-07, the formula used to calculate the alkali content of cement is presented below [45].
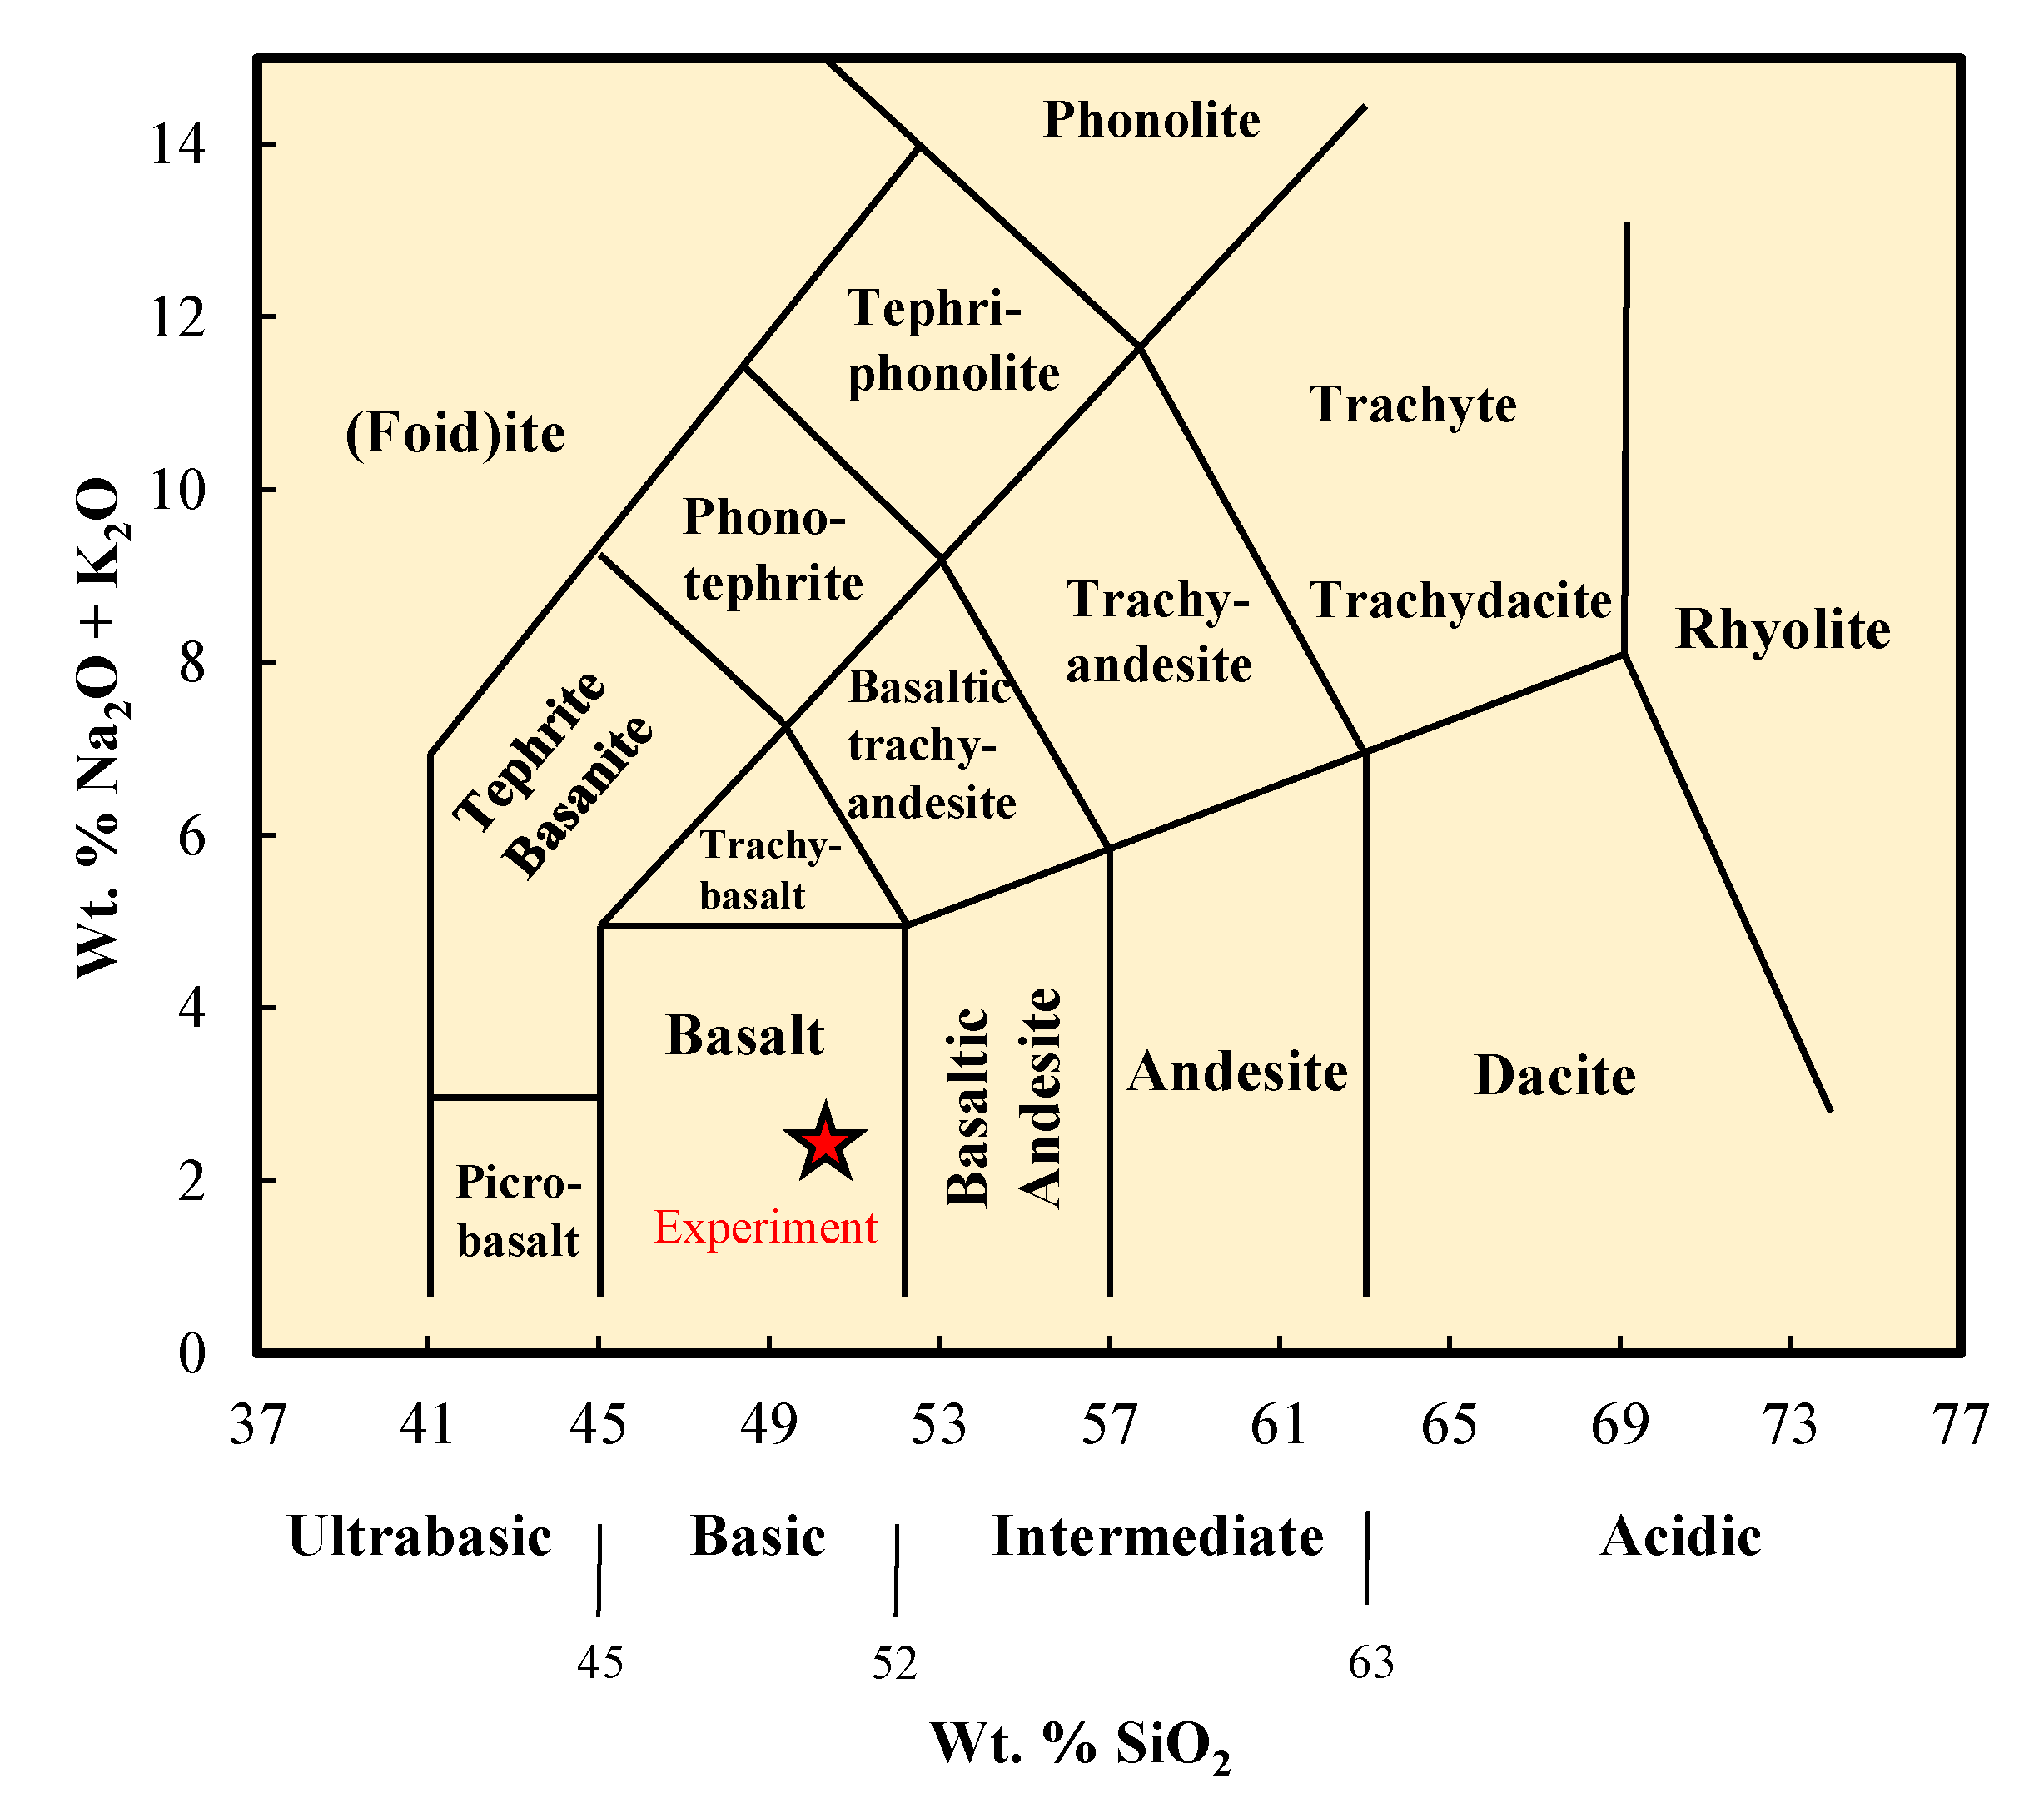
Since aggregates such as basalt, andesite, dacite, rhyolite, and basaltic andesite contain reactive silica, when used in concrete, together with high amounts of alkali (Na2O, K2O) and moisture in the cement paste, they can cause an alkaline aggregate reaction. On the other hand, rocks such as dolomite, limestone, chalcedony, and quartz can cause alkali–carbonate reaction (ACR) expansion, not ASR [46]. Therefore, if reactive aggregates are used in concrete, the total alkali content in cement should be limited to 0.60% as shown in Equation (1). The classification of volcanic rocks is given in Figure 4 [47]. According to studies investigating the reactivity of basalt rocks for ASR, basalts with a SiO2 content of more than 50% have the potential to be reactive for ASR [48,49,50].

Figure 4.
Classification of volcanic rocks (SiO2 – [Na2O + K2O] TAS diagram) [47].
In order to classify igneous rocks, samples were taken from the central parts of Cizre, Şırnak (southeast of Türkiye), and all samples shared the same fundamental features [47]. The mineralogy, petrography, and petrology of the volcanics of the Cizre region used in the experiment, the X-ray fluorescence (XRF) analysis of which is given in Table 1, were determined as basalt according to Figure 4. According to Table 1, due to its low SiO2 concentration, which is less than 51%, the chemical studies of the Cizre basalt specimens demonstrate that it is basic and unlikely to be a reactive aggregate to ASR [18].
2.2. Preparation of Specimens
Basalt was used as aggregate, with Portland cement and fly ash as the binder. For comparison, limestone aggregate was used in LC (plain) mortar. The mix design of the test specimens is given in Table 4 in the proportions specified by ASTM 1260 [51].
Table 4.
Mortar mixture.
For AMBT testing, 25 × 25 × 285 mm (1 × 1 × 11.25 in) of mortar specimens were manufactured to ASTM C150 standard aggregate gradation. After 24 h of hardening and 24 h of curing of the mortar bars, the first measurement of the length was taken. As part of the test protocol, the specimens were fully immersed in 1 M NaOH solution for 14 days at 80 °C (176 °F). Specimens prepared in accordance with ASTMC 1260 [51] standards were tested in the construction laboratory of TSI (Turkish Standards Institute), and the elongation of the mortar rods was determined.
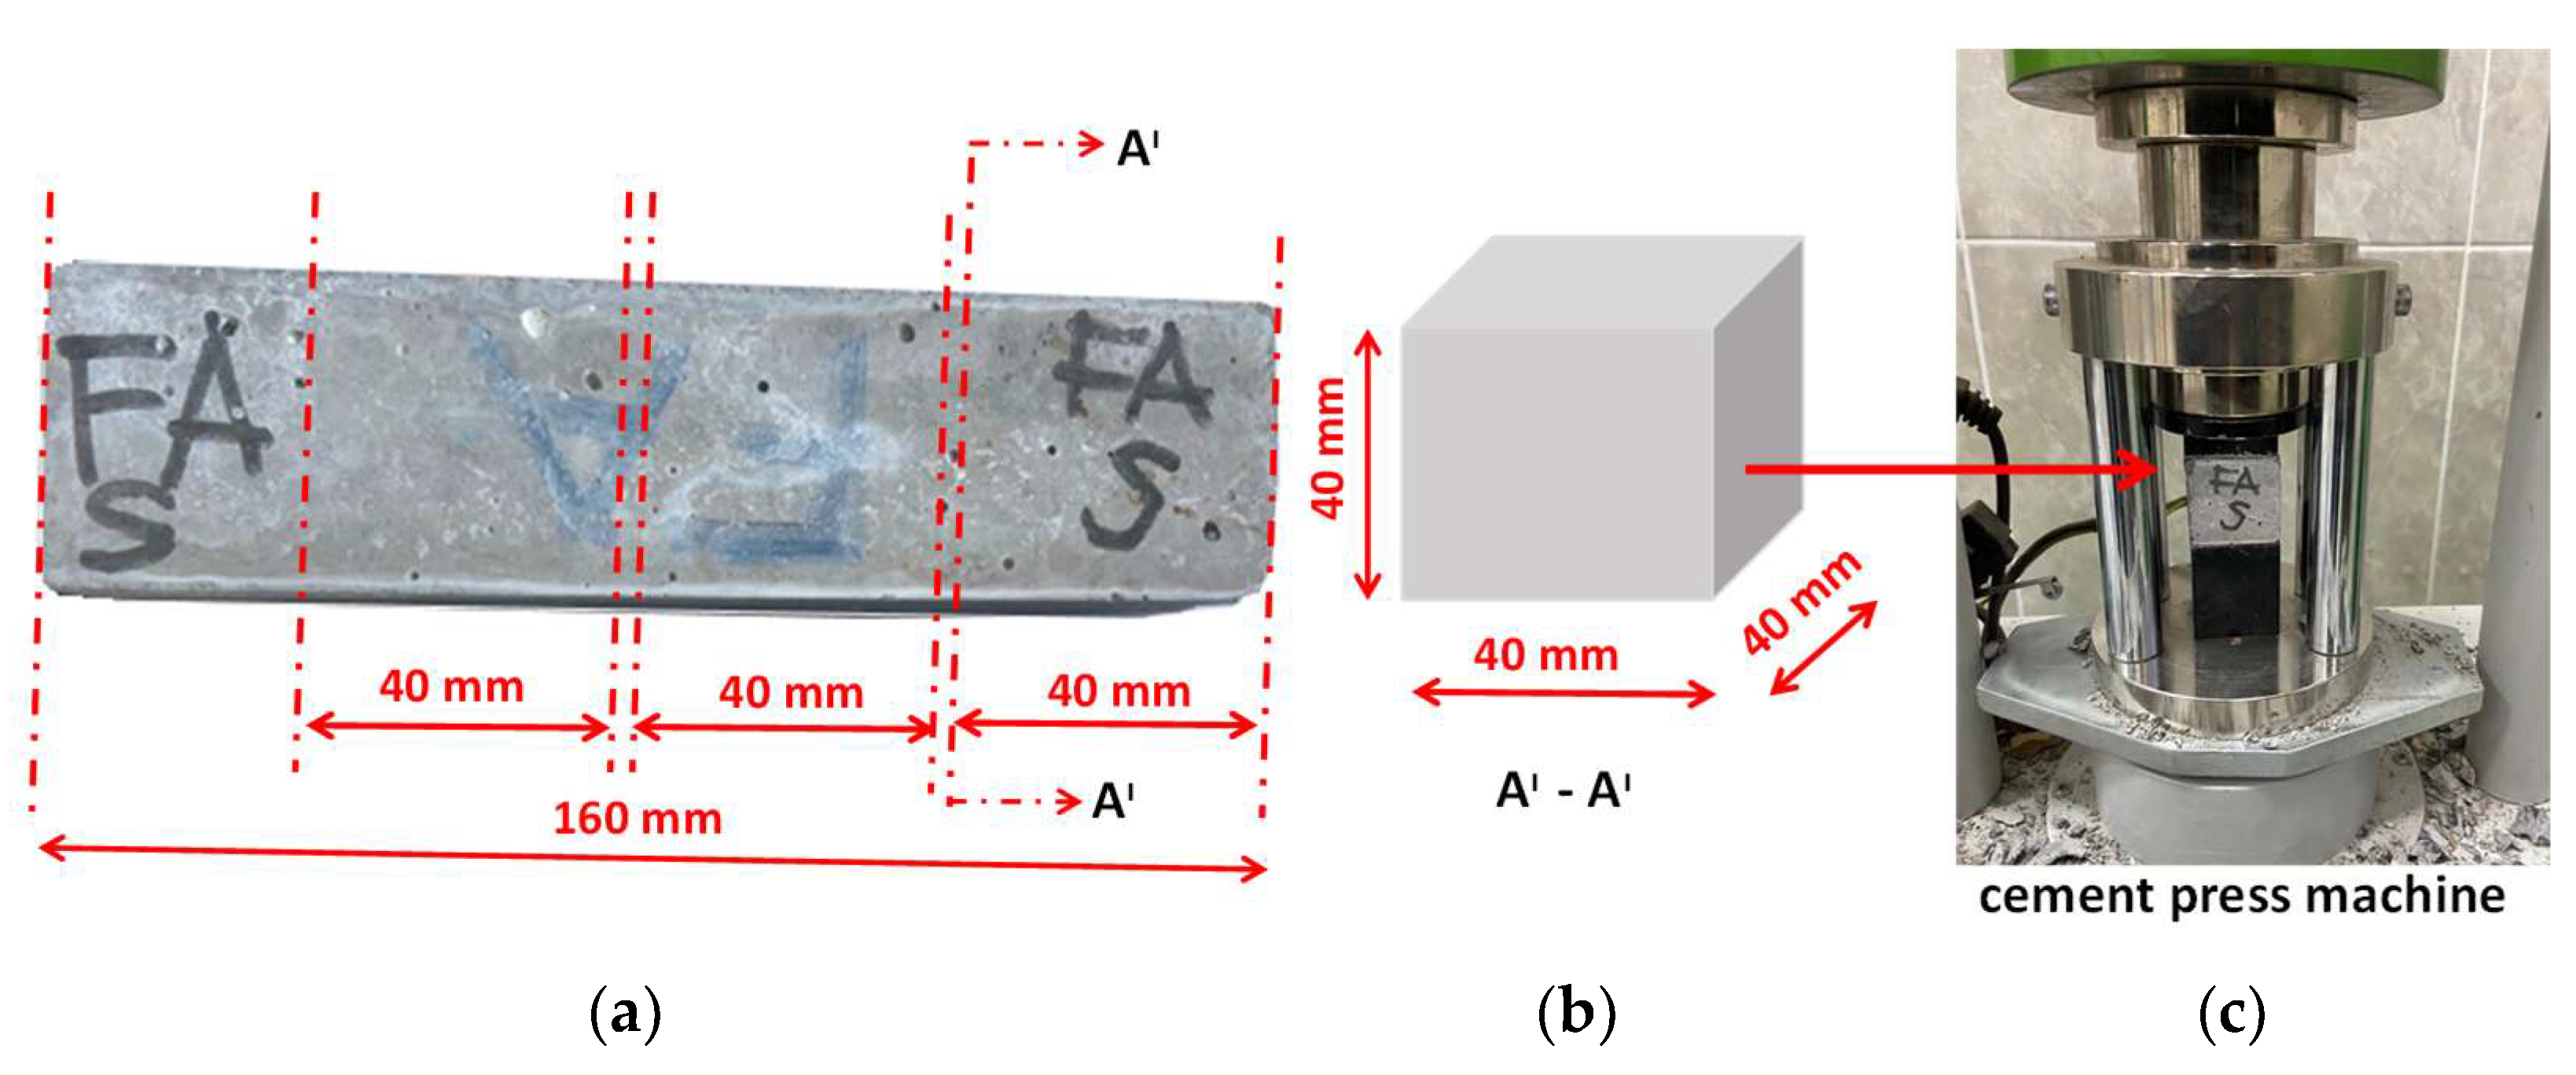
For compressive strength, a 40 × 40 × 160 mm mortar bar was prepared Figure 5a. After water-curing the mortar specimens for 28 days, one group of mortar bars was exposed to water curing (T = 20 ± 2 °C and R.H. ≈ 95%) and the other group was exposed to ASTMC 1260 test conditions (1M NaOH, 80 °C) for 14 days. The mortar bars were cut with a mortar cutting saw to obtain 40 mm cm cube specimens (Figure 5b) which were then crushed in a cement press to determine the compressive strength values (Figure 5c).

Figure 5.
(a) Cutting 40 mm × 40 mm × 160 mm prismatic specimens, (b) obtaining 40 mm cube specimens, and (c) determination of compressive strength of cube specimens.
In order to better understand the changes in hydration products after AMBT and the effect of fly ash on mortar, the specimens were made into a form suitable for the characterization methods. They were compared with the results obtained from ASR concrete and ASR gel by other authors.
2.3. Mechanical Properties
Compressive strength values were calculated via breaking in a YKM-CM106 model press machine calibrated by TURKAK (Turkish Accreditation Agency, Ankara, Türkiye) in the construction laboratory of Siirt University (Türkiye). A total of 50 N/s were loaded at a fast rate. To confirm the accuracy of the findings, three specimens of each mortar type were analyzed and averaged.
2.4. Mineralogical and Chemical Characterization
For mineralogical and chemical characterization, samples were taken from limestone-based mortars kept in water curing for 28 days and basalt-based mortars exposed to AMBT conditions for 14 days. The microstructural structure of the mortars is the structure that occurs at the binder/aggregate intersection, and the reactions under SEM can be examined [52]. After confirming existing knowledge, specimens were obtained from the outer edge of each broken specimen for SEM examination to assist in understanding the mechanisms underlying the strength disparities. The specimens were brought to a suitable form for the SEM device. In order to take images, the surface to be imaged was made conductive with the help of an Au coating device. We placed our specimens in the chamber part of our SEM device. We started our process. SEM analyses were performed at room temperature. Surface morphologies of the specimens were characterized with scanning electron microscopy SEM and LEO-EVO 40 (Cambridge, England) at various scales. For the scanned regions, energy-dispersive X-ray spectroscopy (EDX) using a Bruker-125 eV (Berlin, Germany) was used. A Rigaku RINT-2000 diffractometer was used to record the products’ X-ray diffraction patterns. Cu-Kα radiation was applied to the specimens at a voltage of 40 kV and a current of 15 mA. Furthermore, XRD analyses were performed at a wavelength of 1.5406 (λ) between 10° and 90°, scanning at a rate of 2° per minute and with a step speed of 0.02°. The Origin Jasco FT-IR spectrometer was used to recognize the mineralogical characteristics of the mortars; the infrared spectra of mortars specimen was recorded in the region of 400–4000 cm−1. The resolution of the instrument is 0.001 cm−1, and the accuracy is 74 cm−1. Thermogravimetric analysis (TGA) and differential thermal analysis (DTA) were carried out in a nitrogen atmosphere with a heating rate of 10 °C/min using Shimadzu DTG60 AH (Shimadzu DSC 60 A) thermal analyzers. A sample size of 19–22 mg was used.
3. Results and Discussion
3.1. Accelerated Mortar Bar Testing (AMBT) ASTM C1260
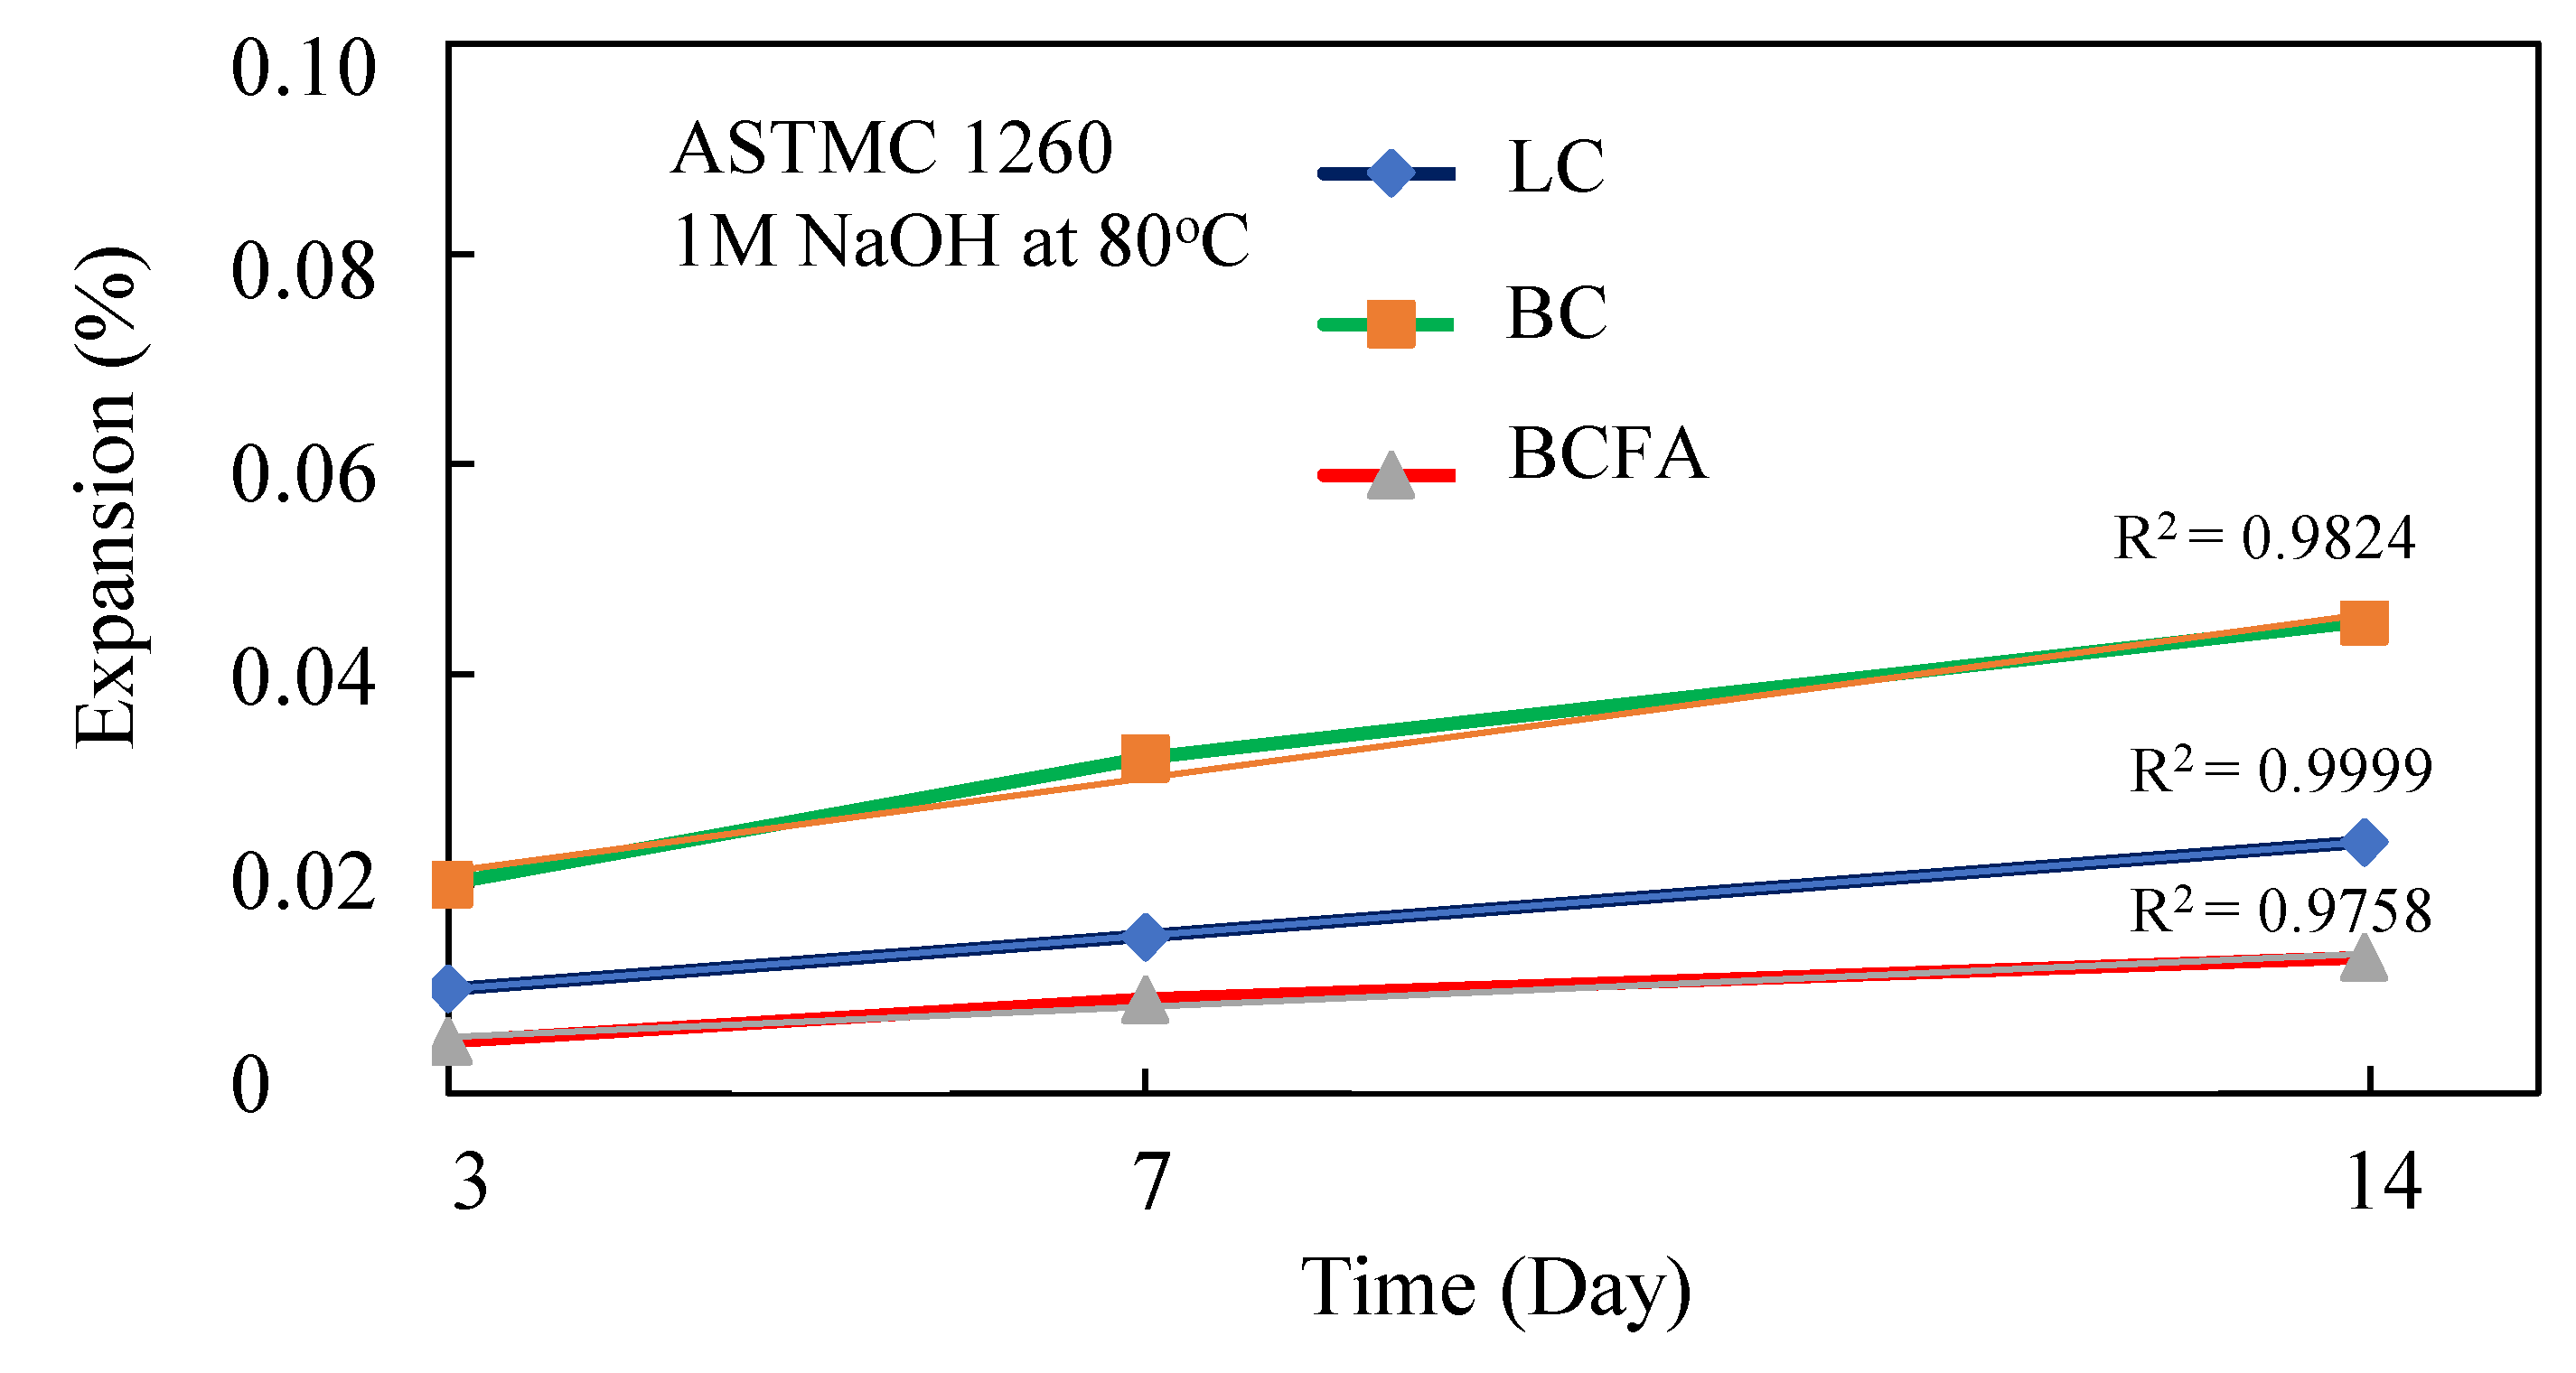
According to ASTMC 1260 [51], the average elongation rate of mortar rods < 0.10% non-hazardous aggregate in terms of alkali–silica reactivity, 0.10% < mean elongation < 0.20% potentially hazardous aggregates, and mean elongation rate > 0.20% are considered hazardous aggregates [51].
AMBT was carried out using the method of accelerated expansion of mortar bars of the alkali–silica reactivity of aggregates. Length change measurements were made at the end of 3, 7, and 14 days. Equation (2) was used to determine the percentages of change in unit length:
where L is the length change at age “x” days (%), Lo is the initial comparator reading of the specimen less the initial comparator reading of the reference bar (mm), G is the nominal gauge length (285 mm), and Ln is the comparator reading of the specimen at age “x” minus the comparator reading of the reference bar at age “x” (mm). Figure 6 displays changes in length based on ASTM C 1260 standards [51].
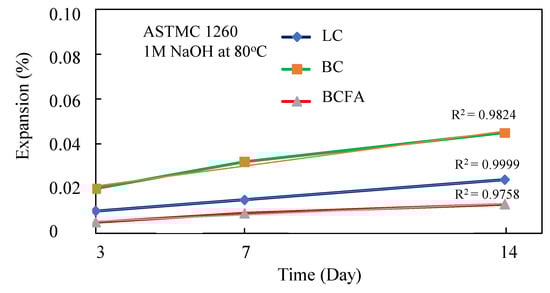
Figure 6.
Expansion amounts of specimens according to ASTMC 1260.
The volumetric expansion of basalt aggregate samples at the end of 14 days (BC = 0.045%) was higher than that of limestone aggregate samples (LC = 0.024%), although within the limits of ASTM C 1260 [51], but it can be seen that the substitution of 20% of fly ash for cement significantly reduced the expansion of basalt aggregate (by 71%) (BCFA = 0.013%) (Figure 6). In the AMBT analysis for volcanic rocks, the volumetric expansion of basaltic aggregates can reach 0.020%, andesite aggregates 0.290%, and dacite aggregates 0.420% after 14 days [49].
According to Figure 7, when the macro image of the specimens kept in the NaOH solution is examined, the spills on their surfaces are visible to the naked eye (Figure 7b).
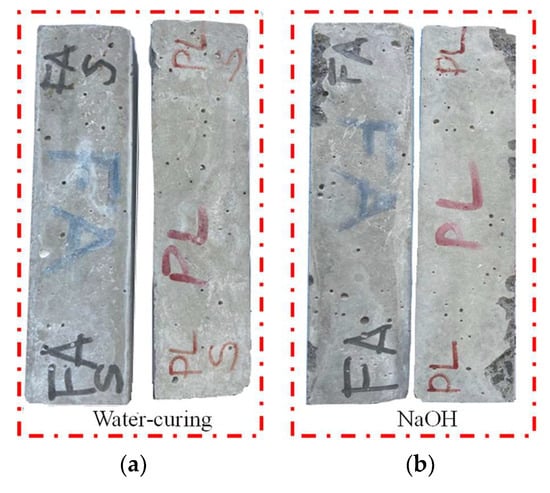
Figure 7.
Macro images of BBC (PL) and BCFA (FA) bar specimens with curing conditions in (a) water and (b) 1M NaOH at 80 °C.
3.2. Compressive Strength
Mortar specimens (40 × 40 × 160 mm) taken from the water curing and NaOH solution were dried in a drying oven at 105 °C for 4 h (Figure 5a). They were formed into 40 mm cubes as shown in Figure 5b. The compressive strength values of the mortars were determined via crushing in the cement press shown in Figure 5c. The change in compressive strength was determined using Equation (3):
where CSN is the compressive strength (MPa) of mortar specimens exposed to 1M NaOH solution, CSPL is the compressive strength (MPa) of water cured mortar specimens, and CSL is the percentage loss in compressive strength of the specimen. As a result, the specimens’ alkali resistance was determined by measuring their rate of strength loss; a high rate of strength loss indicates poor alkali resistance, whereas a low rate of strength loss indicates good alkali resistance. Compressive strength values of 6-week specimens exposed to different curing conditions are shown in Figure 8.

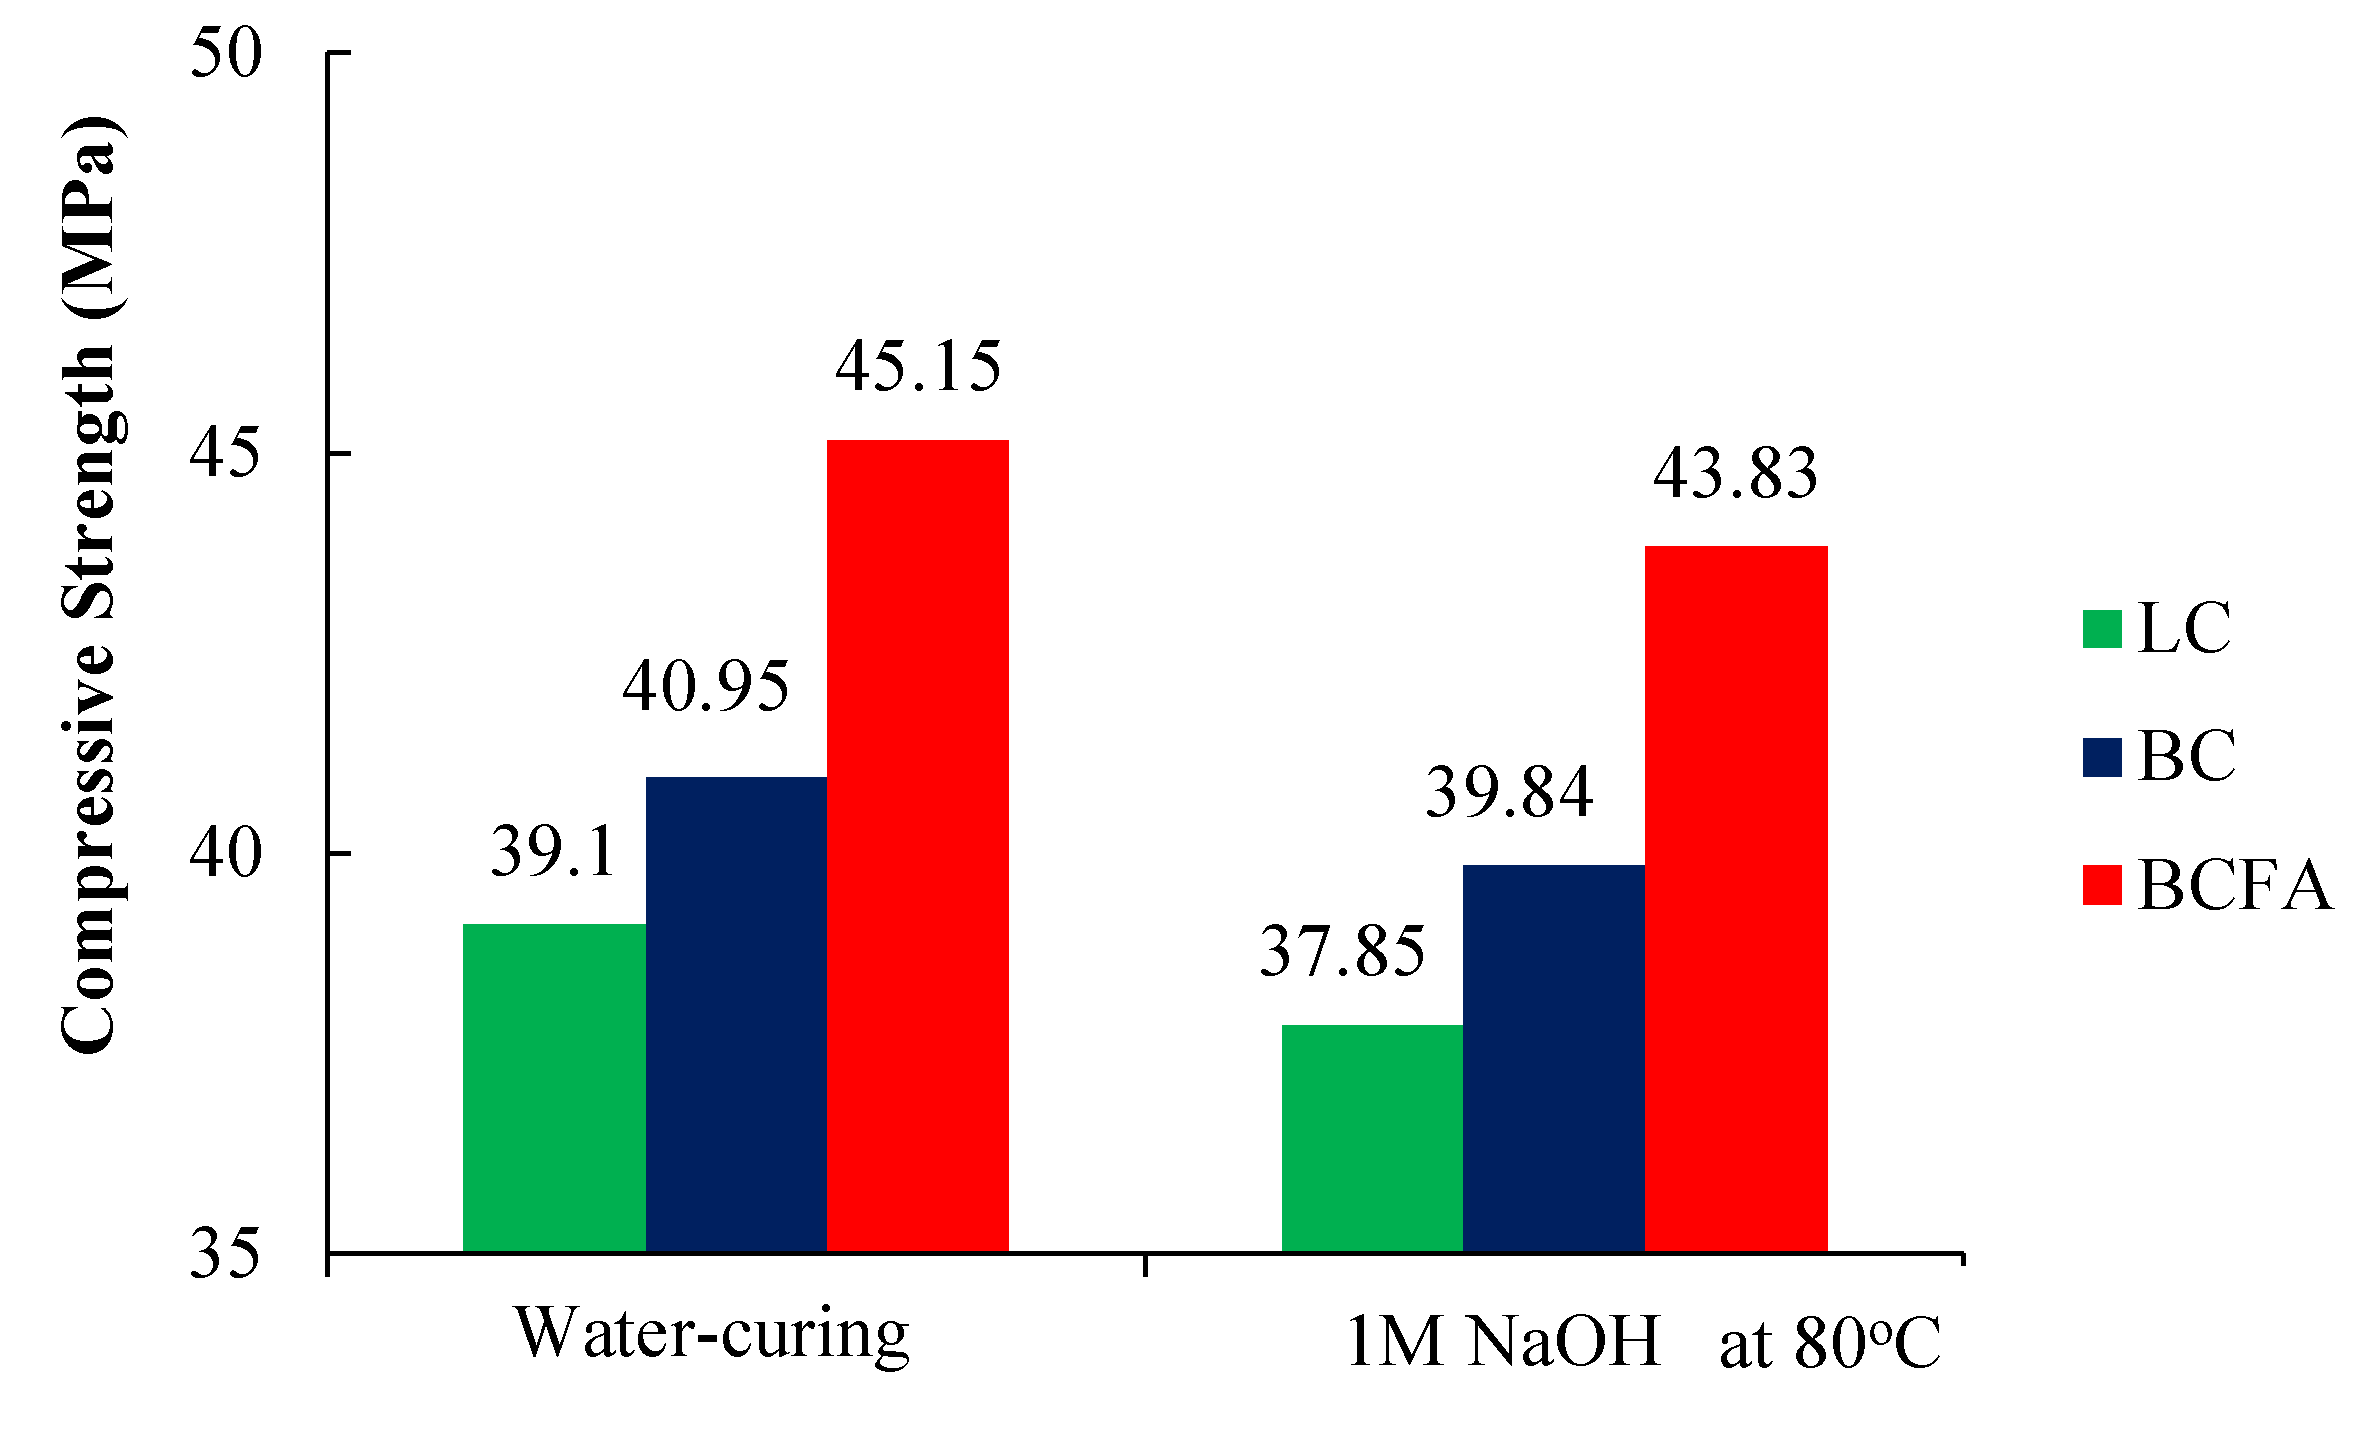
Figure 8.
Compressive strength values.
Figure 8 clearly shows that the NaOH-solution-treated FA can increase the compressive strength of basalt aggregate mortar. FA replacement provided more than a 10% increase in strength in both cure conditions. In addition, NaOH solution caused a 3.19%, 2.79%, and 3.01% strength loss in LC, BC, and BCFA specimens, respectively (Table 5).
Table 5.
Compressive strength values and strength losses.
3.3. SEM-EDX Analysis
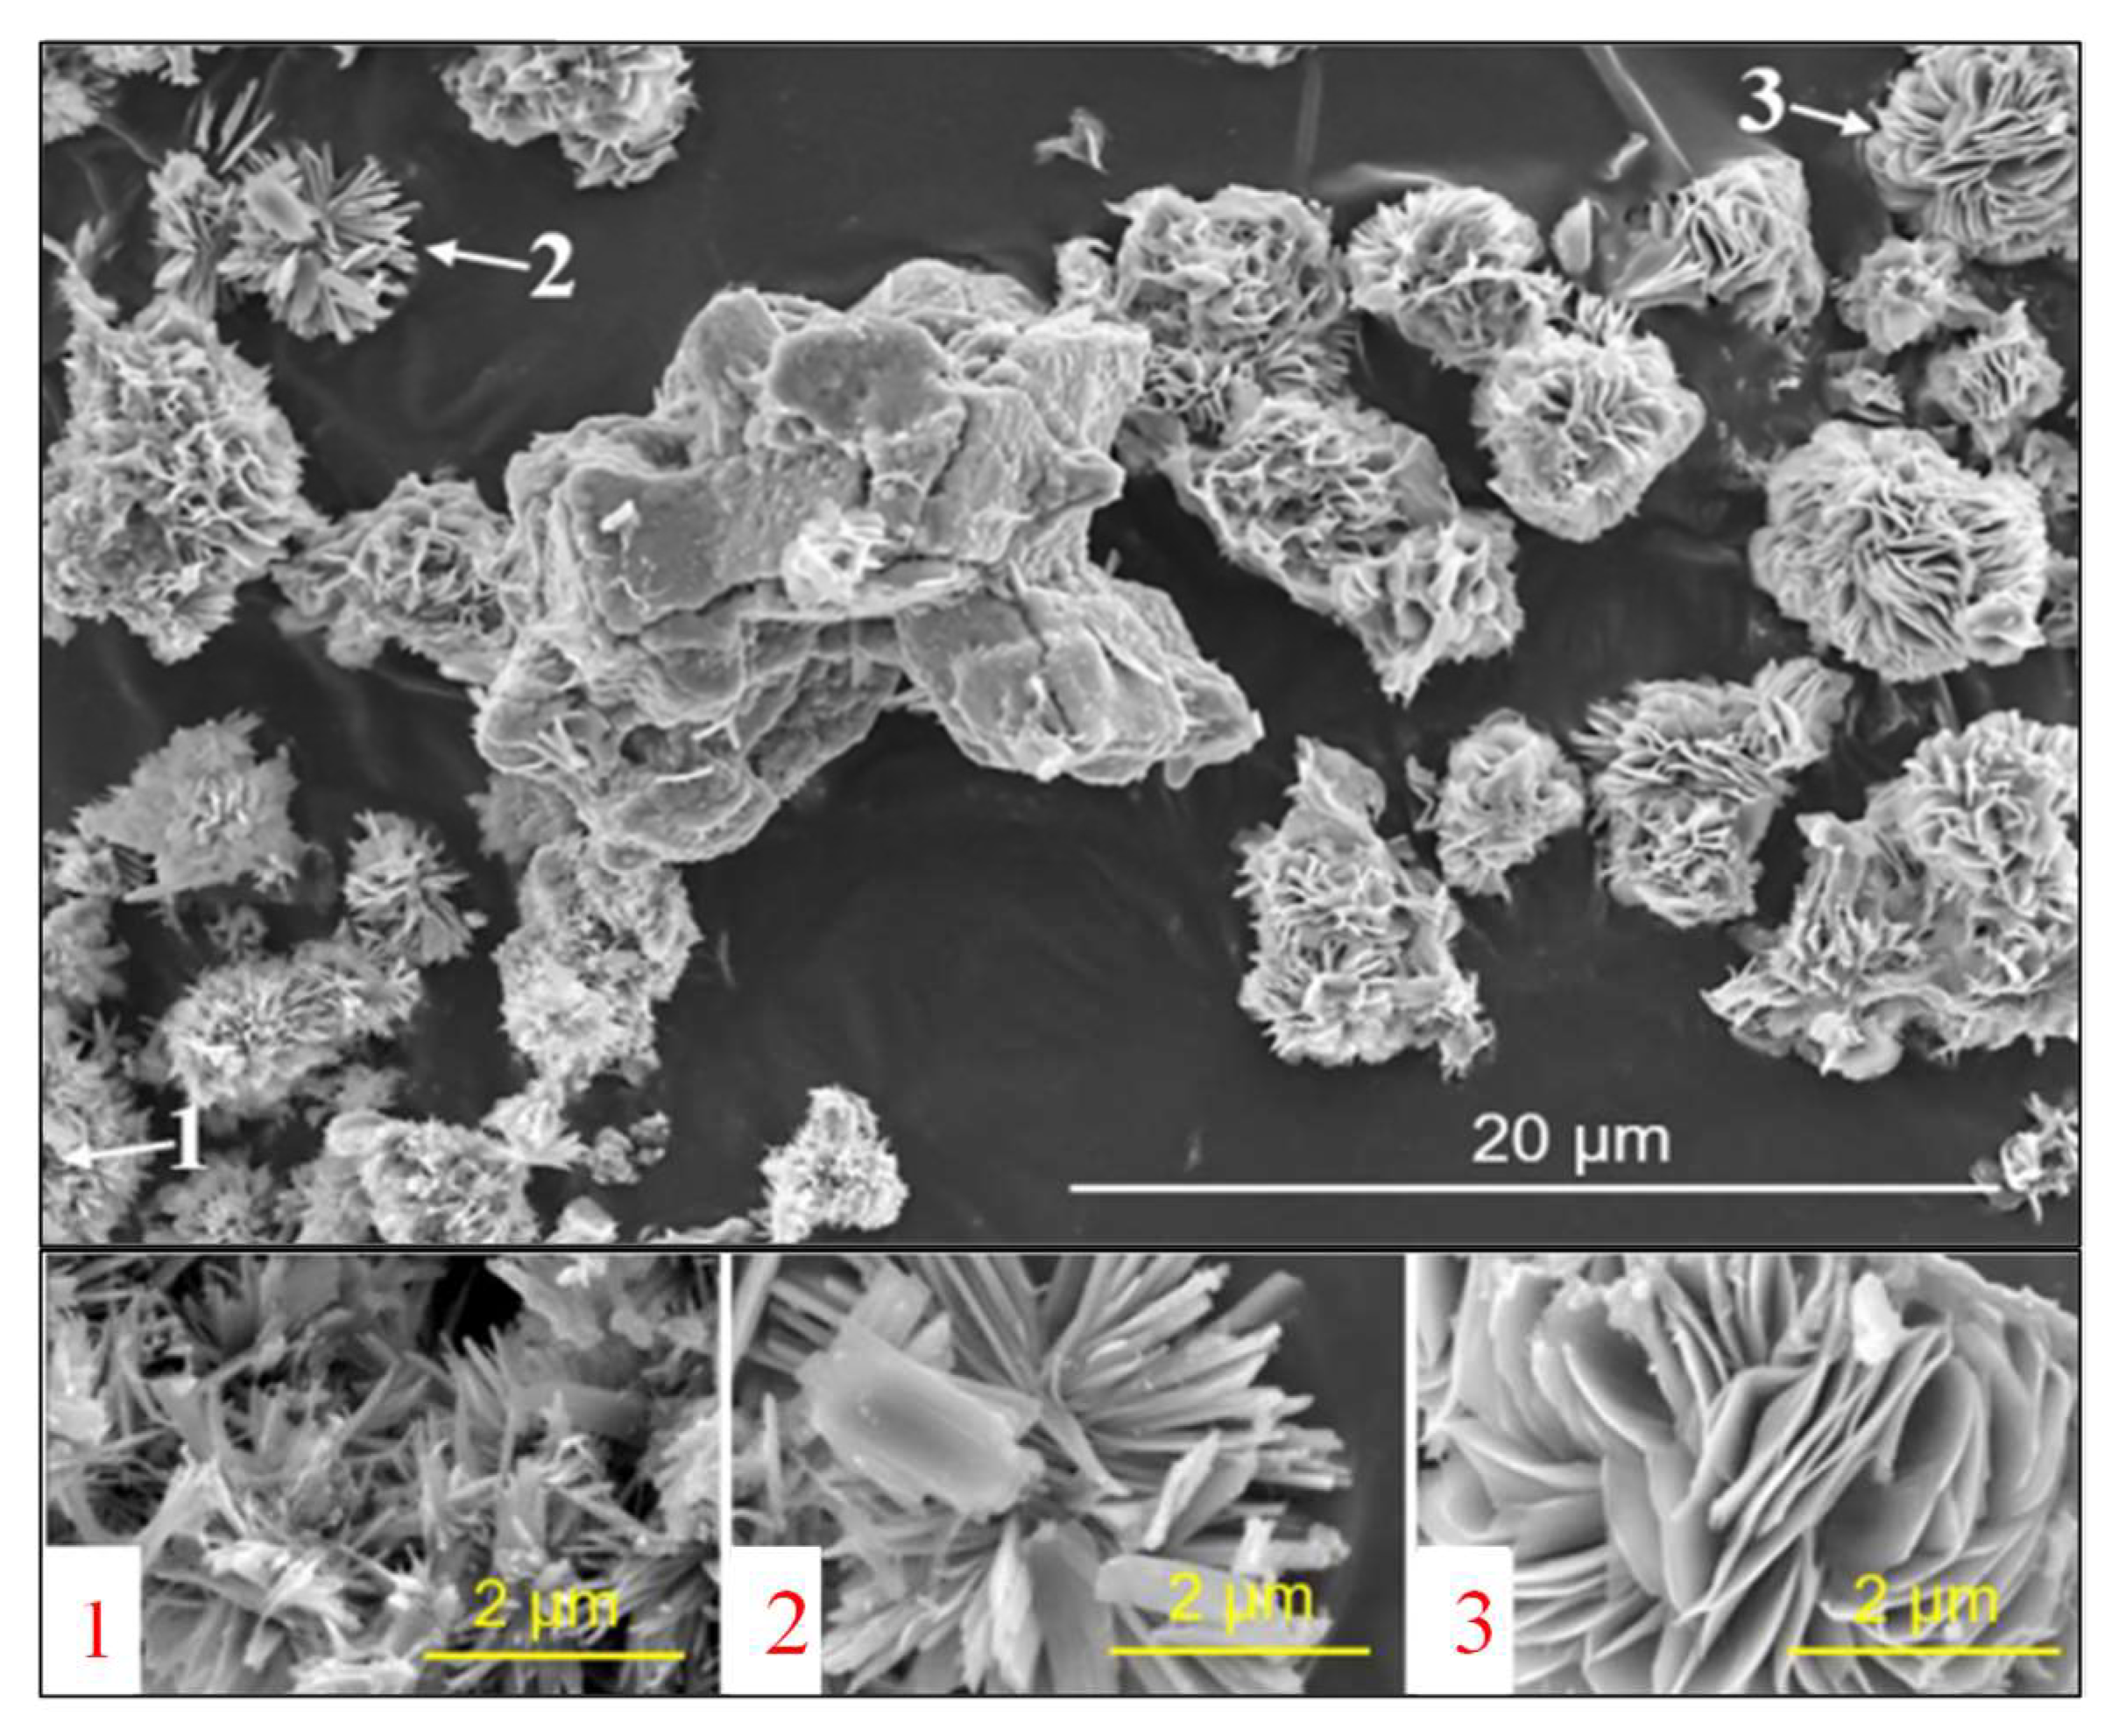
According to SEM/EDX, silicon, alkalis, and calcium constitute the majority of ASR products formed in aggregates, characterized by atomic ratios of (Na + K)/Si ≈ 0.25 and Ca/Si ≈ 0.25 [2,48]. ASR products were synthesized at 40 °C to gain a better understanding of the structure, expansion behavior, and formation conditions of ASR products formed in field concrete. In 100 mL rigid polyethylene (PE-HD) bottles, specimens were prepared by combining 6.008 g hydrophilic silica, 1.402 g freshly burned CaO, 2.805 g analytical KOH (≥85% KOH base), and 50 mL Milli-Q water. After 160 and 210 days of storage at 40 °C, the specimens underwent filtering and drying. In addition to the usual rosette or plate-like morphology, the SEM image acquired for the vacuum-dried specimen in Figure 9 displays ASR products with narrower plate-like and even rod-like morphologies [53].
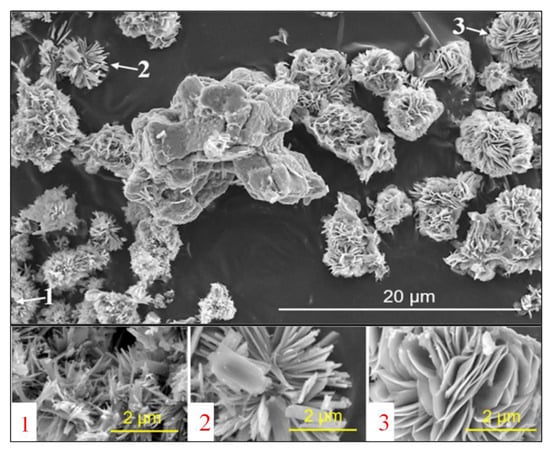
Figure 9.
SEM image of ASR product synthesized after 160 days at 40 °C, images 1, 2, 3 crystalline ASR product [53].
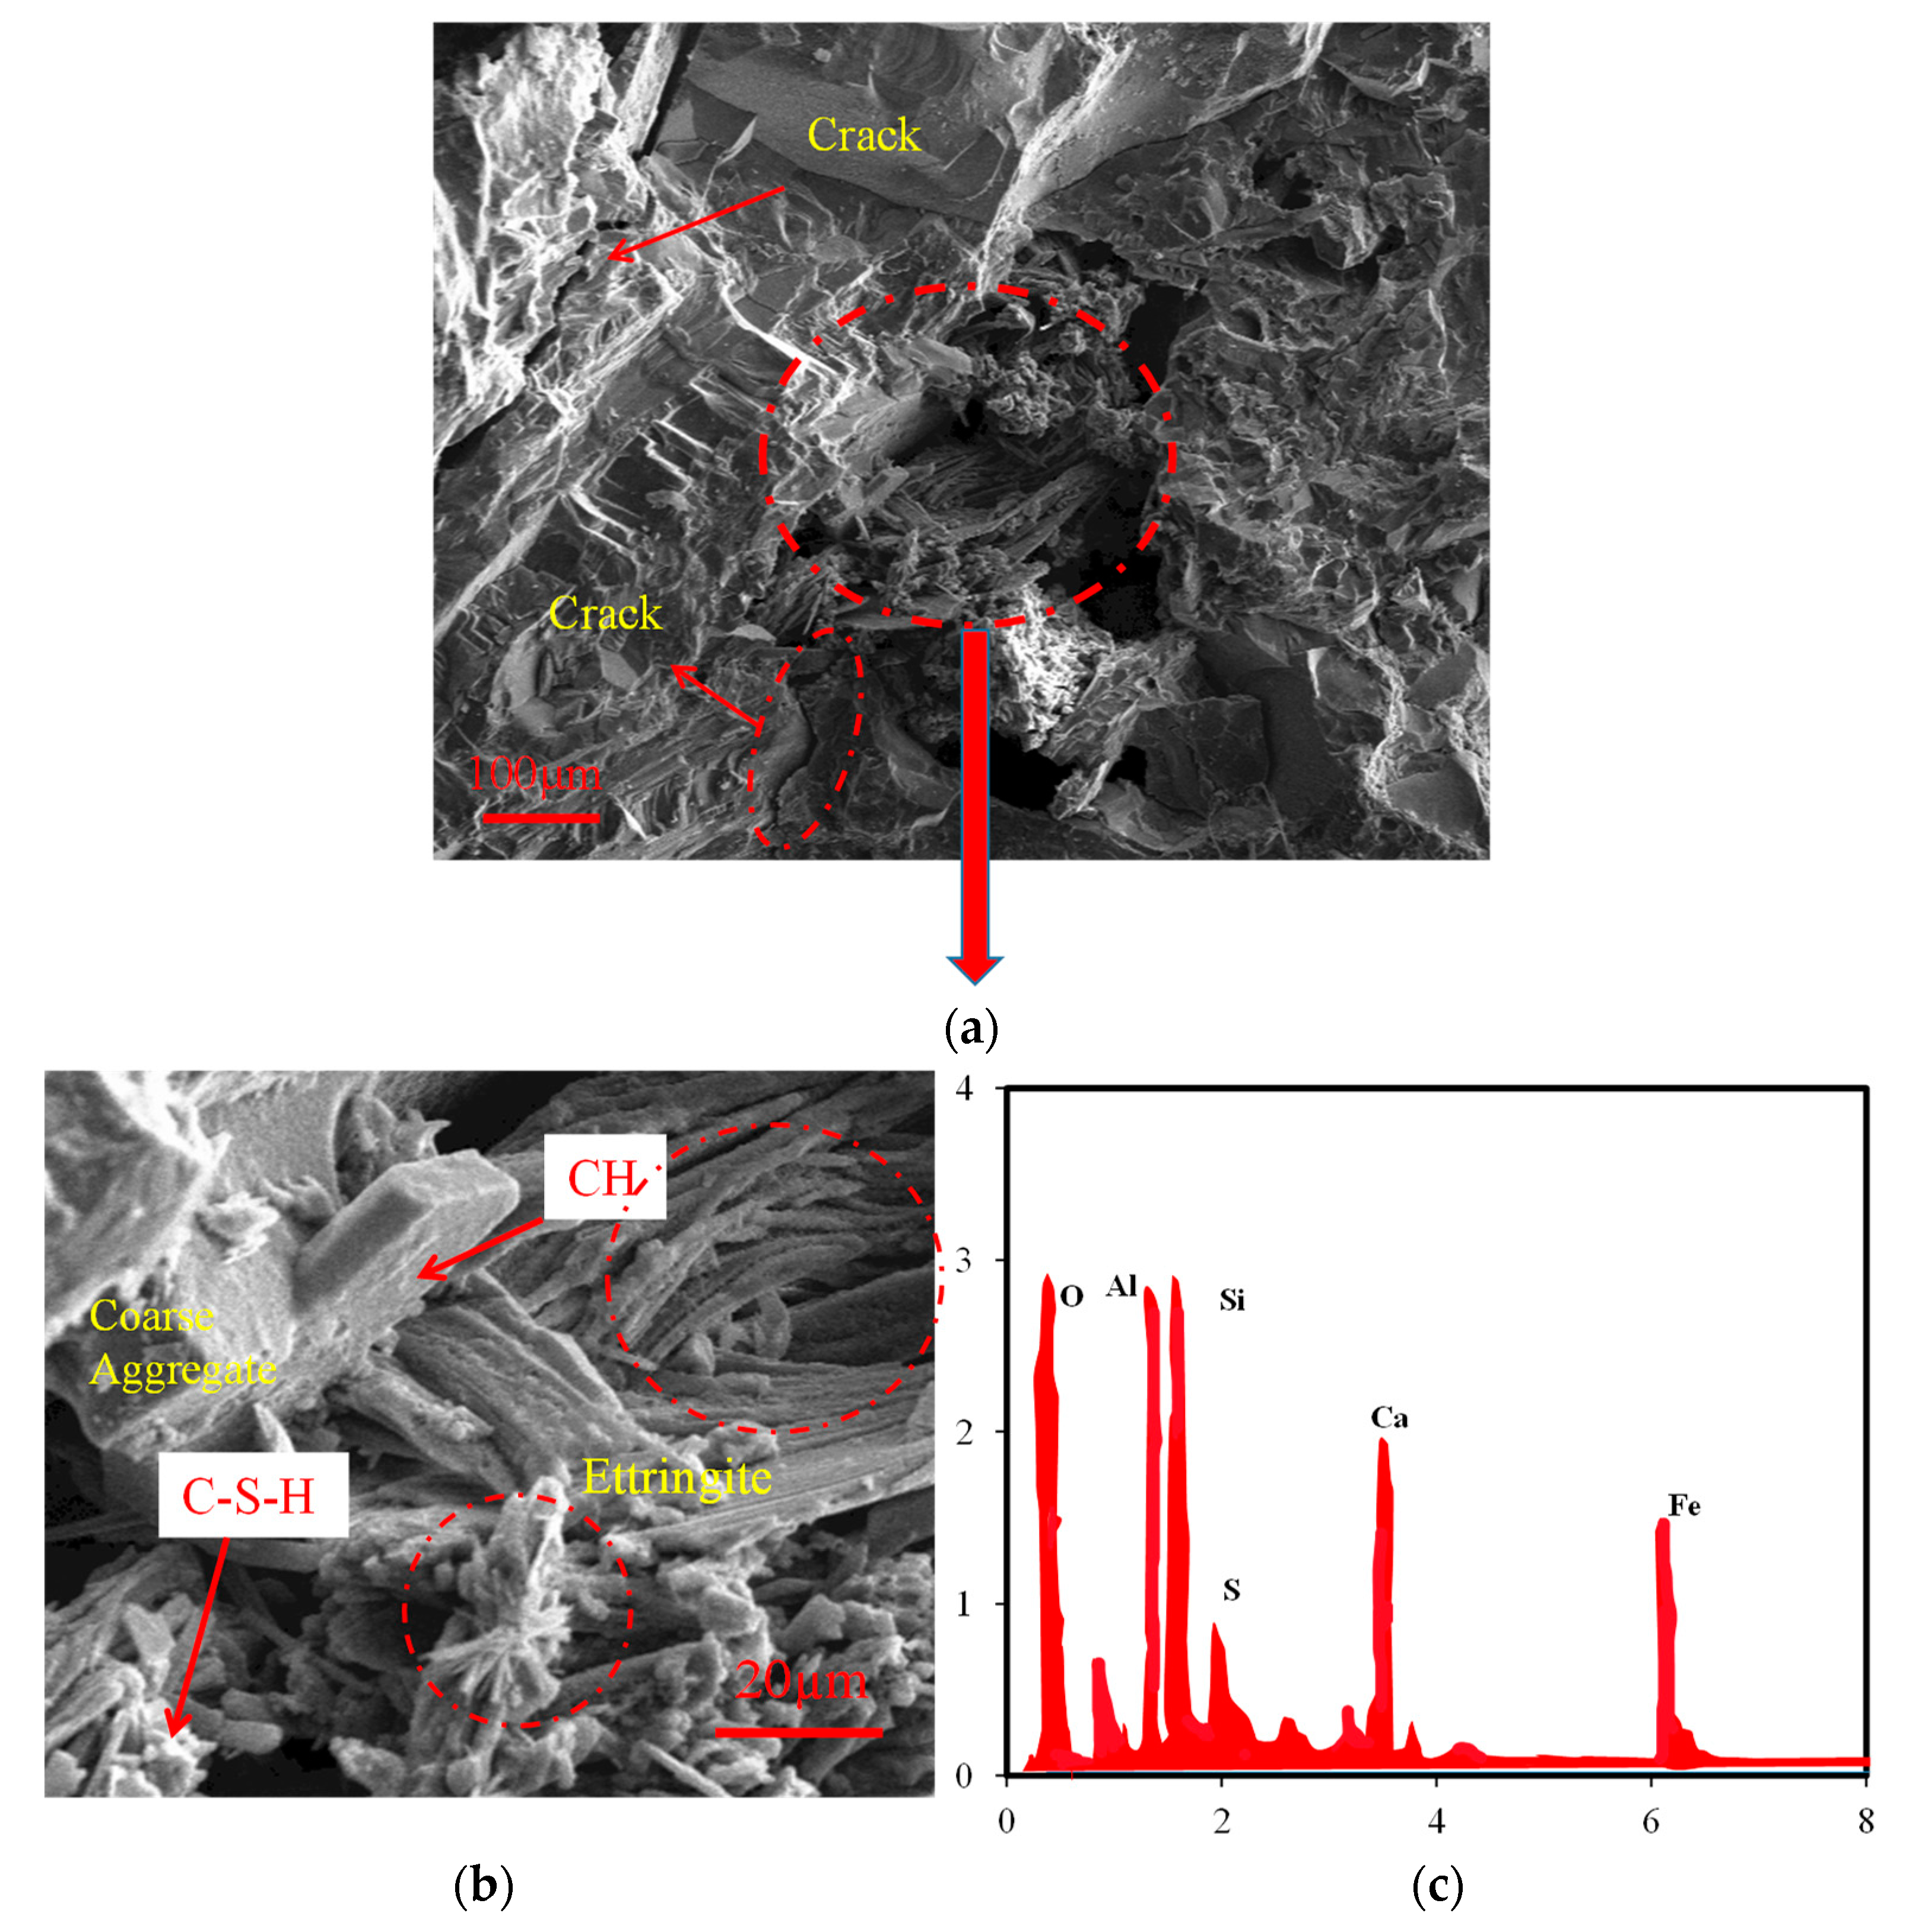
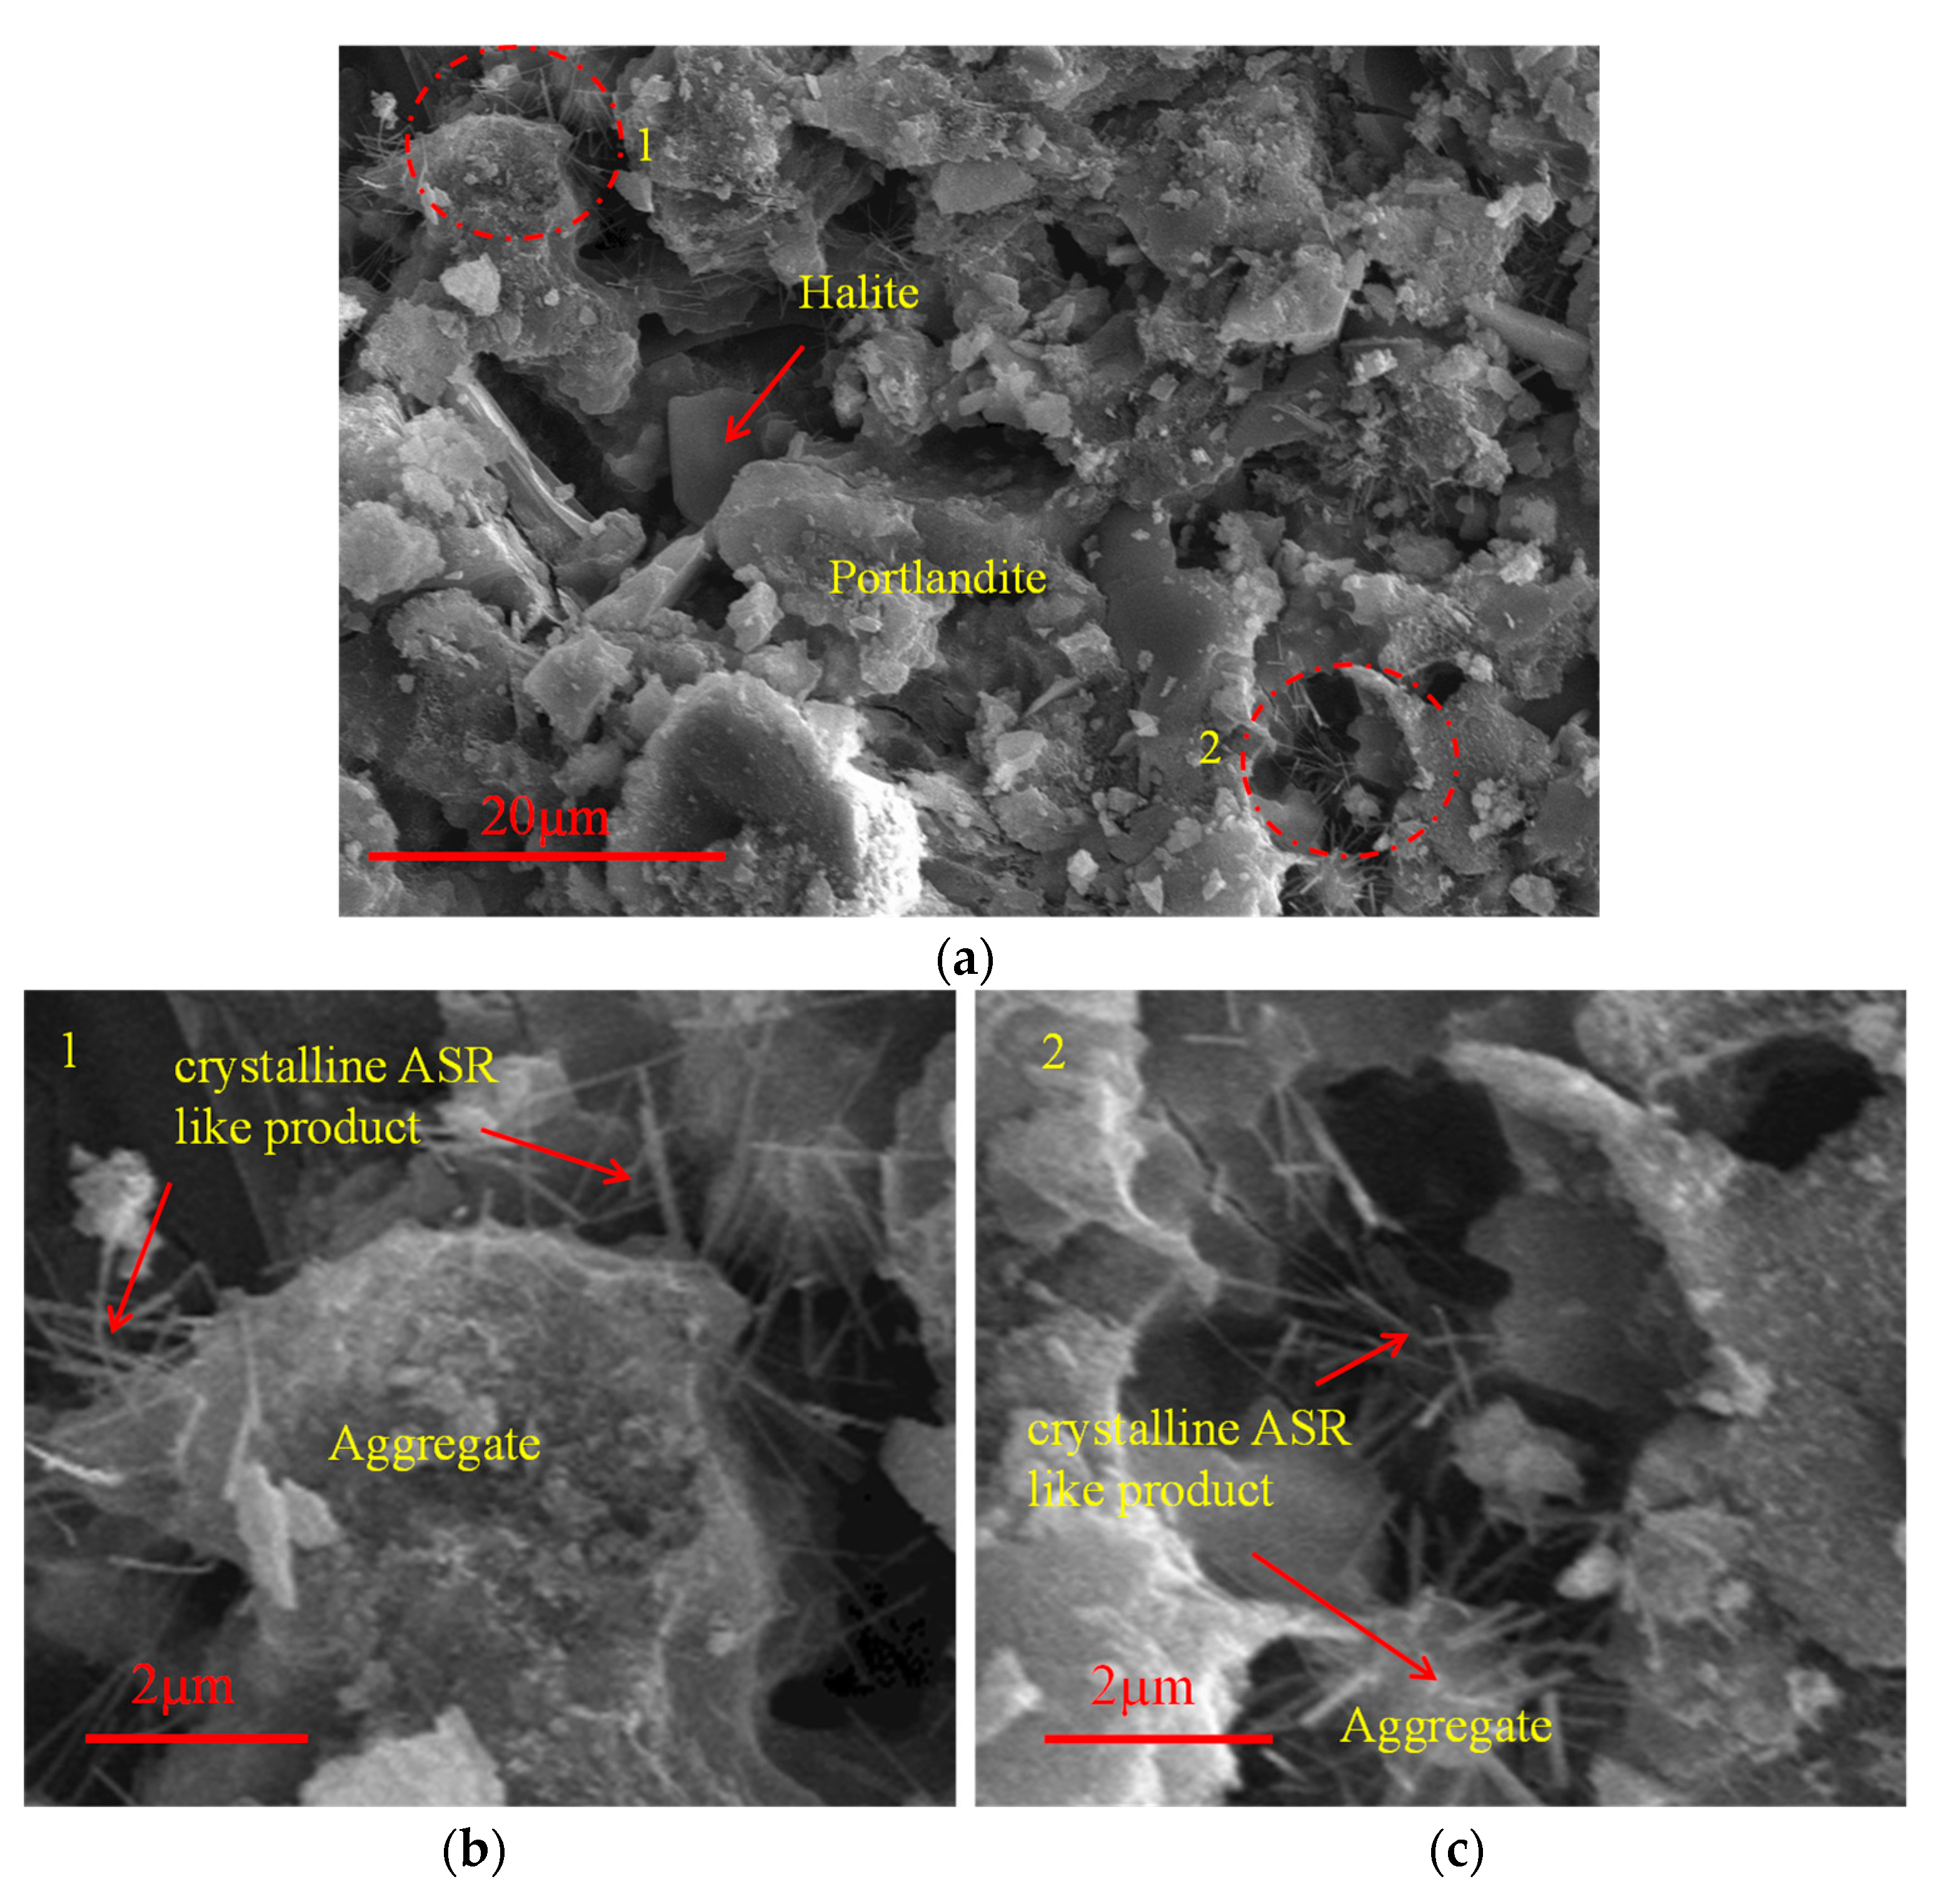
After testing the compressive strength of the specimens exposed to the ASTM C 1260 test, the remaining parts were brought into a suitable form for the examination of their microstructures. SEM/EDX analysis clearly shows the usual hydration products such as C-S-H, portlandite, and ettringite [30] formed in the BCFA sample Figure 10; ASR-like products with crystalline structure around the aggregate in the BC sample are observed in the samples in Figure 11. These needle-like products are similar to the crystalline ASR product shown in Figure 9 [53].

Figure 10.
BCFA specimens of (a) Macro crack SEM images, (b) hydration products that cause macro-crack SEM images, and (c) EDX analysis.
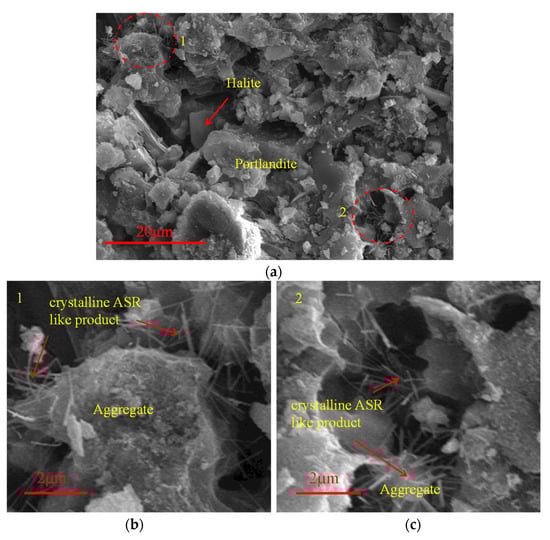
Figure 11.
(a) General image of BC sample and (b,c) SEM image of crystalline ASR-like products around the aggregates in BC samples.
Expansion occurs when high levels of calcium (Ca2+) are present in the hydration products. Expansion is caused by the development of calcium-rich gels. Furthermore, calcium increases the viscosity of the formed gel, causing it to grow [54,55]. In contrast, several investigations have indicated that adding CaO to concretes containing FA or silica fume lowers expansion [54,56]. It has been determined that the decrease in sodium (Na+) and potassium (K+) content decreases the volumetric expansion [57]. The chemical formations of the test specimens were determined using EDX, and their results are shown in Table 6.
Table 6.
EDX results of test specimens and ASR concrete (% by weight). Mean values with standard deviations.
According to Table 6, (Na + K)/Si ratios are 0.24 and 0.21 and Ca/Si ratios are 1.72 and 1.76 for limestone-based (LC) and basalt-based (BC), respectively. Substitution of FA for Portland cement in basalt-based mortars (BCFA) decreased the amount of calcium, sodium, and potassium but increased the amount of aluminum. In this case, it is possible to say that FA substitution reduces volumetric expansion and related cracks. Both crystalline and amorphous ASR products have a very similar average Ca/Si ratio. The ratio of (Na + K) to Si may differ for both types of products. However, the main distinction in chemical composition is found in the Na/K ratio, where amorphous materials (0.46–0.76) have larger values than crystalline materials (0.10–0.27) [8]. When the EDX analysis results were compared to the ASR concrete specimens in the study of Leeman et al. [44], the fact that the ratio of total alkali amount to silicate (Na + K)/Si of the test specimens is low and the calcium–silicate ratio is high in Ca/Si indicates that ASR products are not formed. In addition, the dramatic decrease in the Ca/Si ratio from 1.76 to 0.45 with FA substitution adsorbs alkali ions and thus reduces the expansion rates [23]. Sodium analysis with EDX is unreliable due to evaporation, but there is no significant sodium. The low Na content of BCFA indicates low permeability of the NaOH solution of the FA.
According to Leeman et al. [54], ASR products contain low levels of Mg, Al, and Fe elements. The Ca/Si ratio is <0.4. Generally, Ca increases as the alkali (Na, K) content in cement paste decreases. It varies according to the aggregate type in the crack area filled with such products, increasing the Ca/Si ratio. The approximate proportions of amorphous ASR products formed in concrete aggregates range from (Na + K)/Si = 0.26 − 0.40, to Ca /Si = 0.07 − 0.33, and Na/K = 0.62 − 1.41 [58]. Thomas [56] compared the composition of ASR gels identified in 7-year-old laboratory concrete and a 55-year-old concrete dam with the composition of calcium-silicate hydrate (C-S-H) in the dam concrete. The composition is diverse, although there appears to be a decent link between the alkali and calcium amounts (i.e., as the calcium content increases, the alkali content decreases). The EDX result of BC and BCFA specimens was compared with the results of ASR concretes [54,56]. Comparison of (Na + K)/Si ratios and Ca/Si ratios of BCFA and BC specimens with ASR concretes are given in Figure 12.
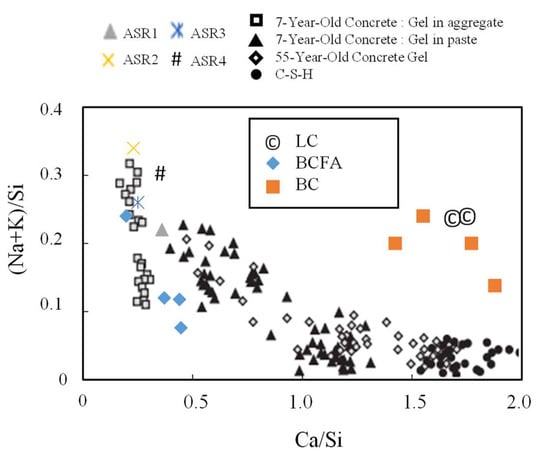
Figure 12.
(Na + K)/Si-ratio of mortars LC; BC; BCFA; and ASR1, ASR2, ASR3 [54], and ASR4 concretes [27]; ●, ▲, ◊, □ samples [56] as a function of their Ca/Si ratio.
According to Figure 12, which shows the atomic data of the test mortars, aged dam concretes, ASR concretes, and the C-S-H product, the effect of increasing the alkali concentration on the ASR products is shown. However, it is possible to say that the low Ca/Si ratio in the aggregate increases the viscosity and contributes to the formation of ASR. It also shows how the process progresses gradually as the concrete ages, and the composition of the ASR product eventually becomes similar to C-S-H.
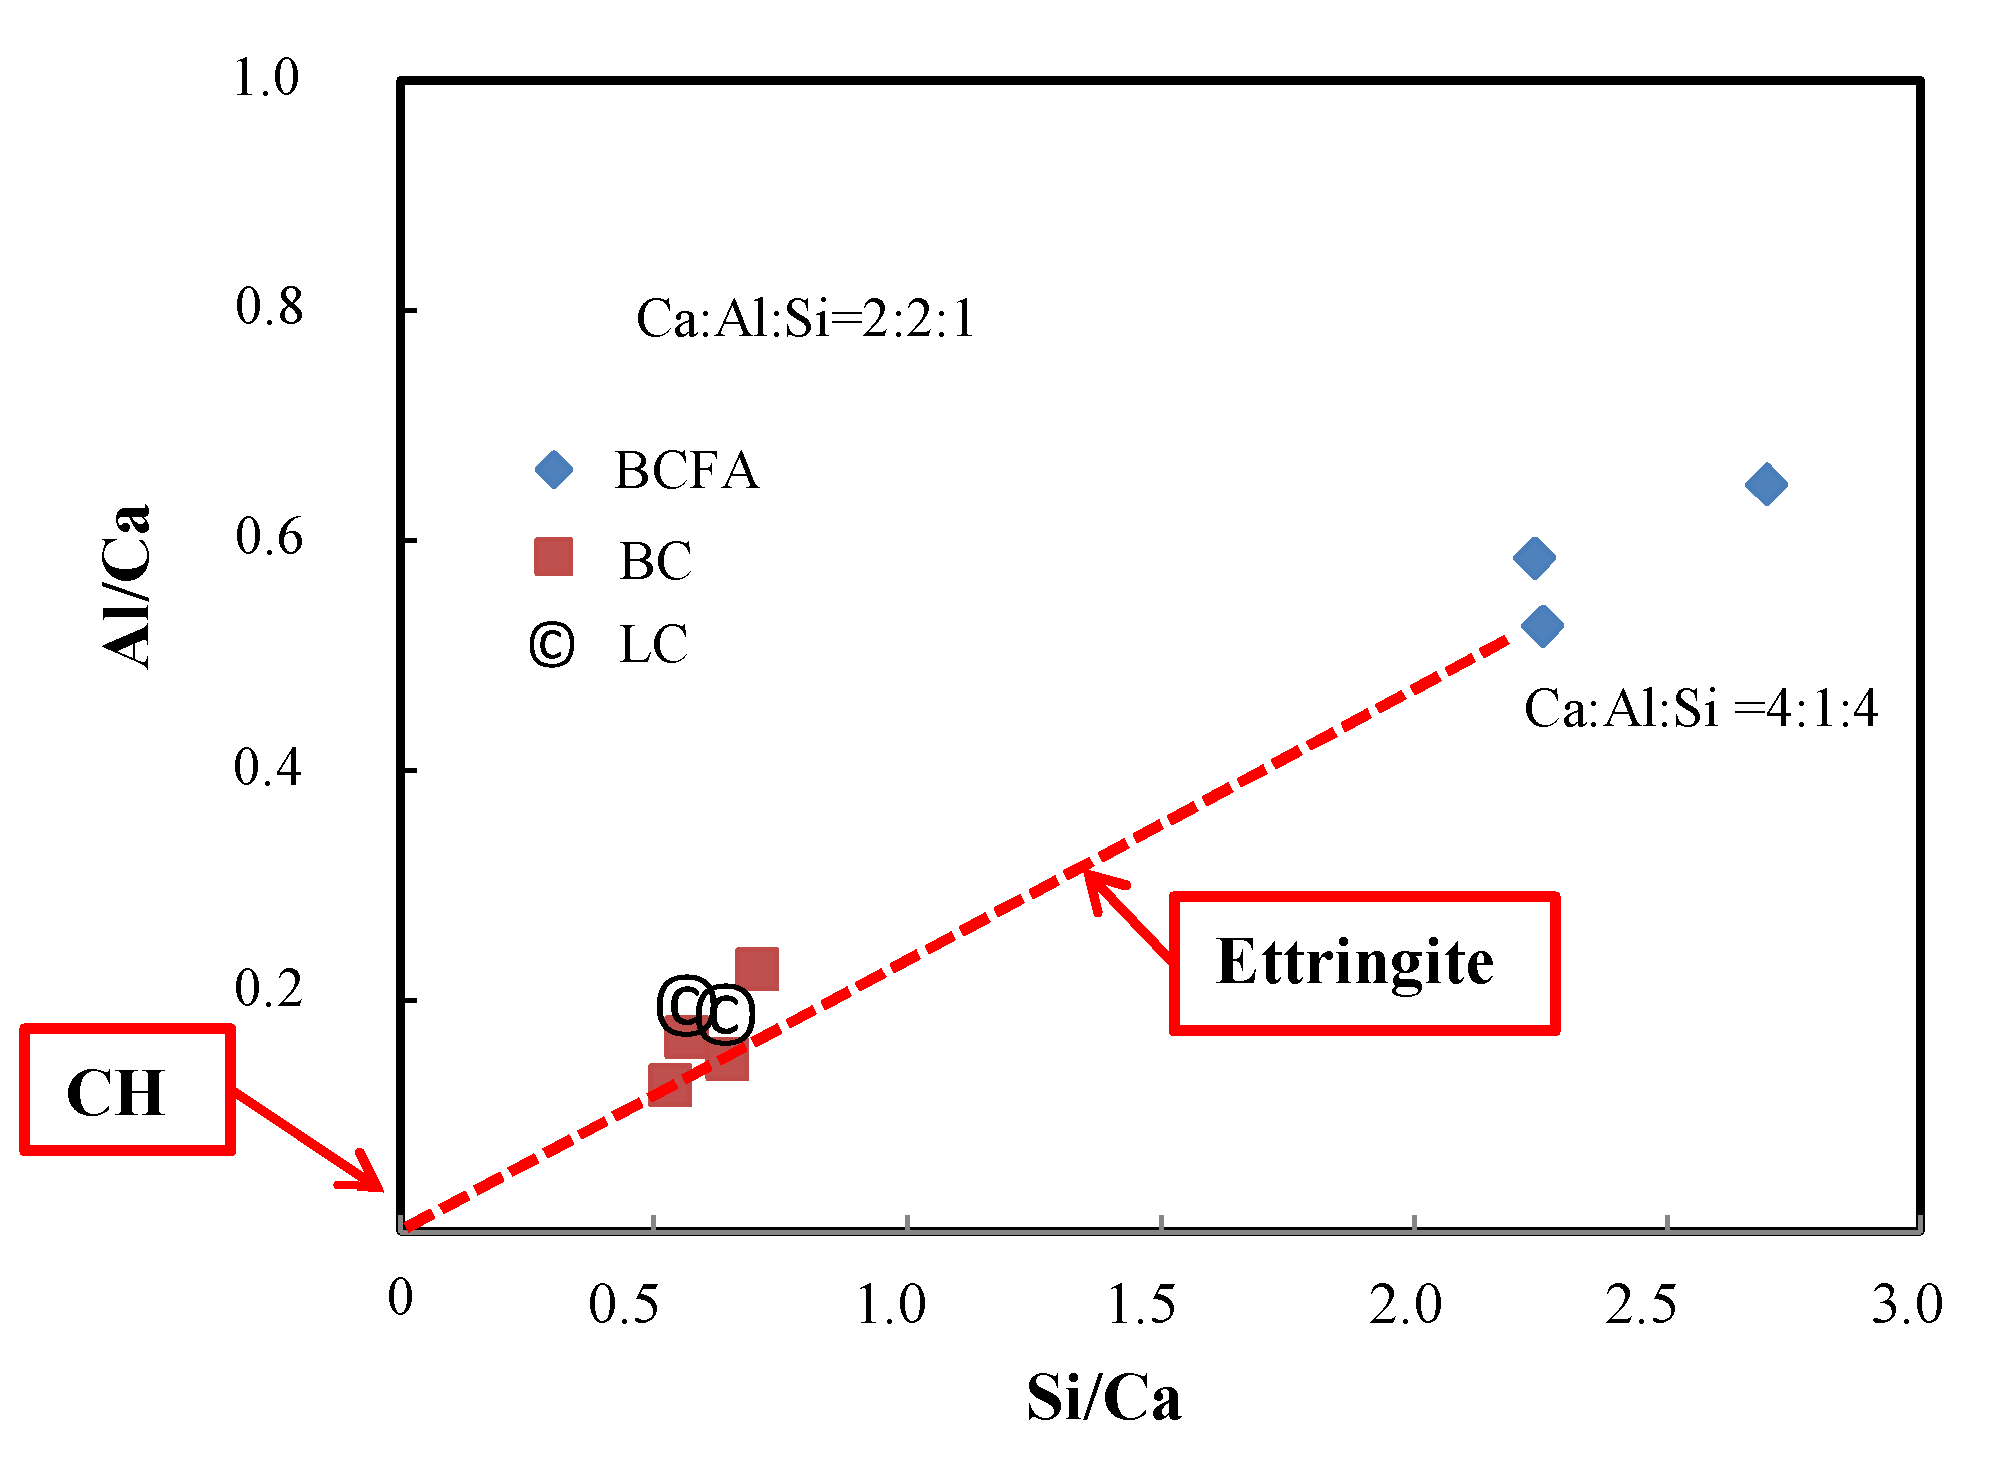
C-A-S-H phases supported by Si and Al in the environment from the cement matrix show that the distance from the portlandite (CH) near the origin in the Al/Ca-Si/Ca diagram shows that it is transformed into C-S-H by consuming CH (Figure 13). The highest Si/Ca group is attributed to C-S-H; the lowest Si/Ca group is attributed to portlandite (CH) [59].
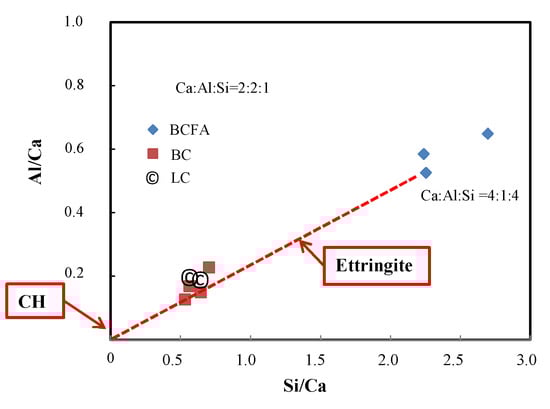
Figure 13.
Atomic ratios of Al/Ca and Si/Ca for the EDX tests of C-A-S-H.
Figure 13 shows that the substitution of FA for Portland cement causes an increase in the content of the C-S-H phase, and the mechanical analysis results support the increase in strength with FA substitution.
3.3.1. X-ray Diffraction (XRD)
XRD analysis of the Cizre basalt-based samples used in the experiment presents a very rich phase diversity. XRD analysis showed that the aggregate used was igneous rock, supporting the chemical analysis. Albite (NaAlSi3O8) with high silica content [60]; diopside (MgCaSi2O6) found in high silica basic and ultrabasic igneous rocks [60,61]; microcline (KAlSi3O8), an important igneous rock common in granites and pegmatites [62]; alabandite (MnS); and beryllium (Be) and anortite (CaAl2Si2O8), which are rare on earth [63,64]. According to the results of XRD phase analyses, peaks belonging to sodium sulfate hydrate and accordingly halite (H) salts were also observed in the samples subjected to AMBT analysis. The observation of halite salts indicates that NaOH solution penetrated into the mortars. The mortars also contain peaks of portlandite (P), calcite (C), ettringite (E), and quartz (Q) belonging to ordinary hydration products.
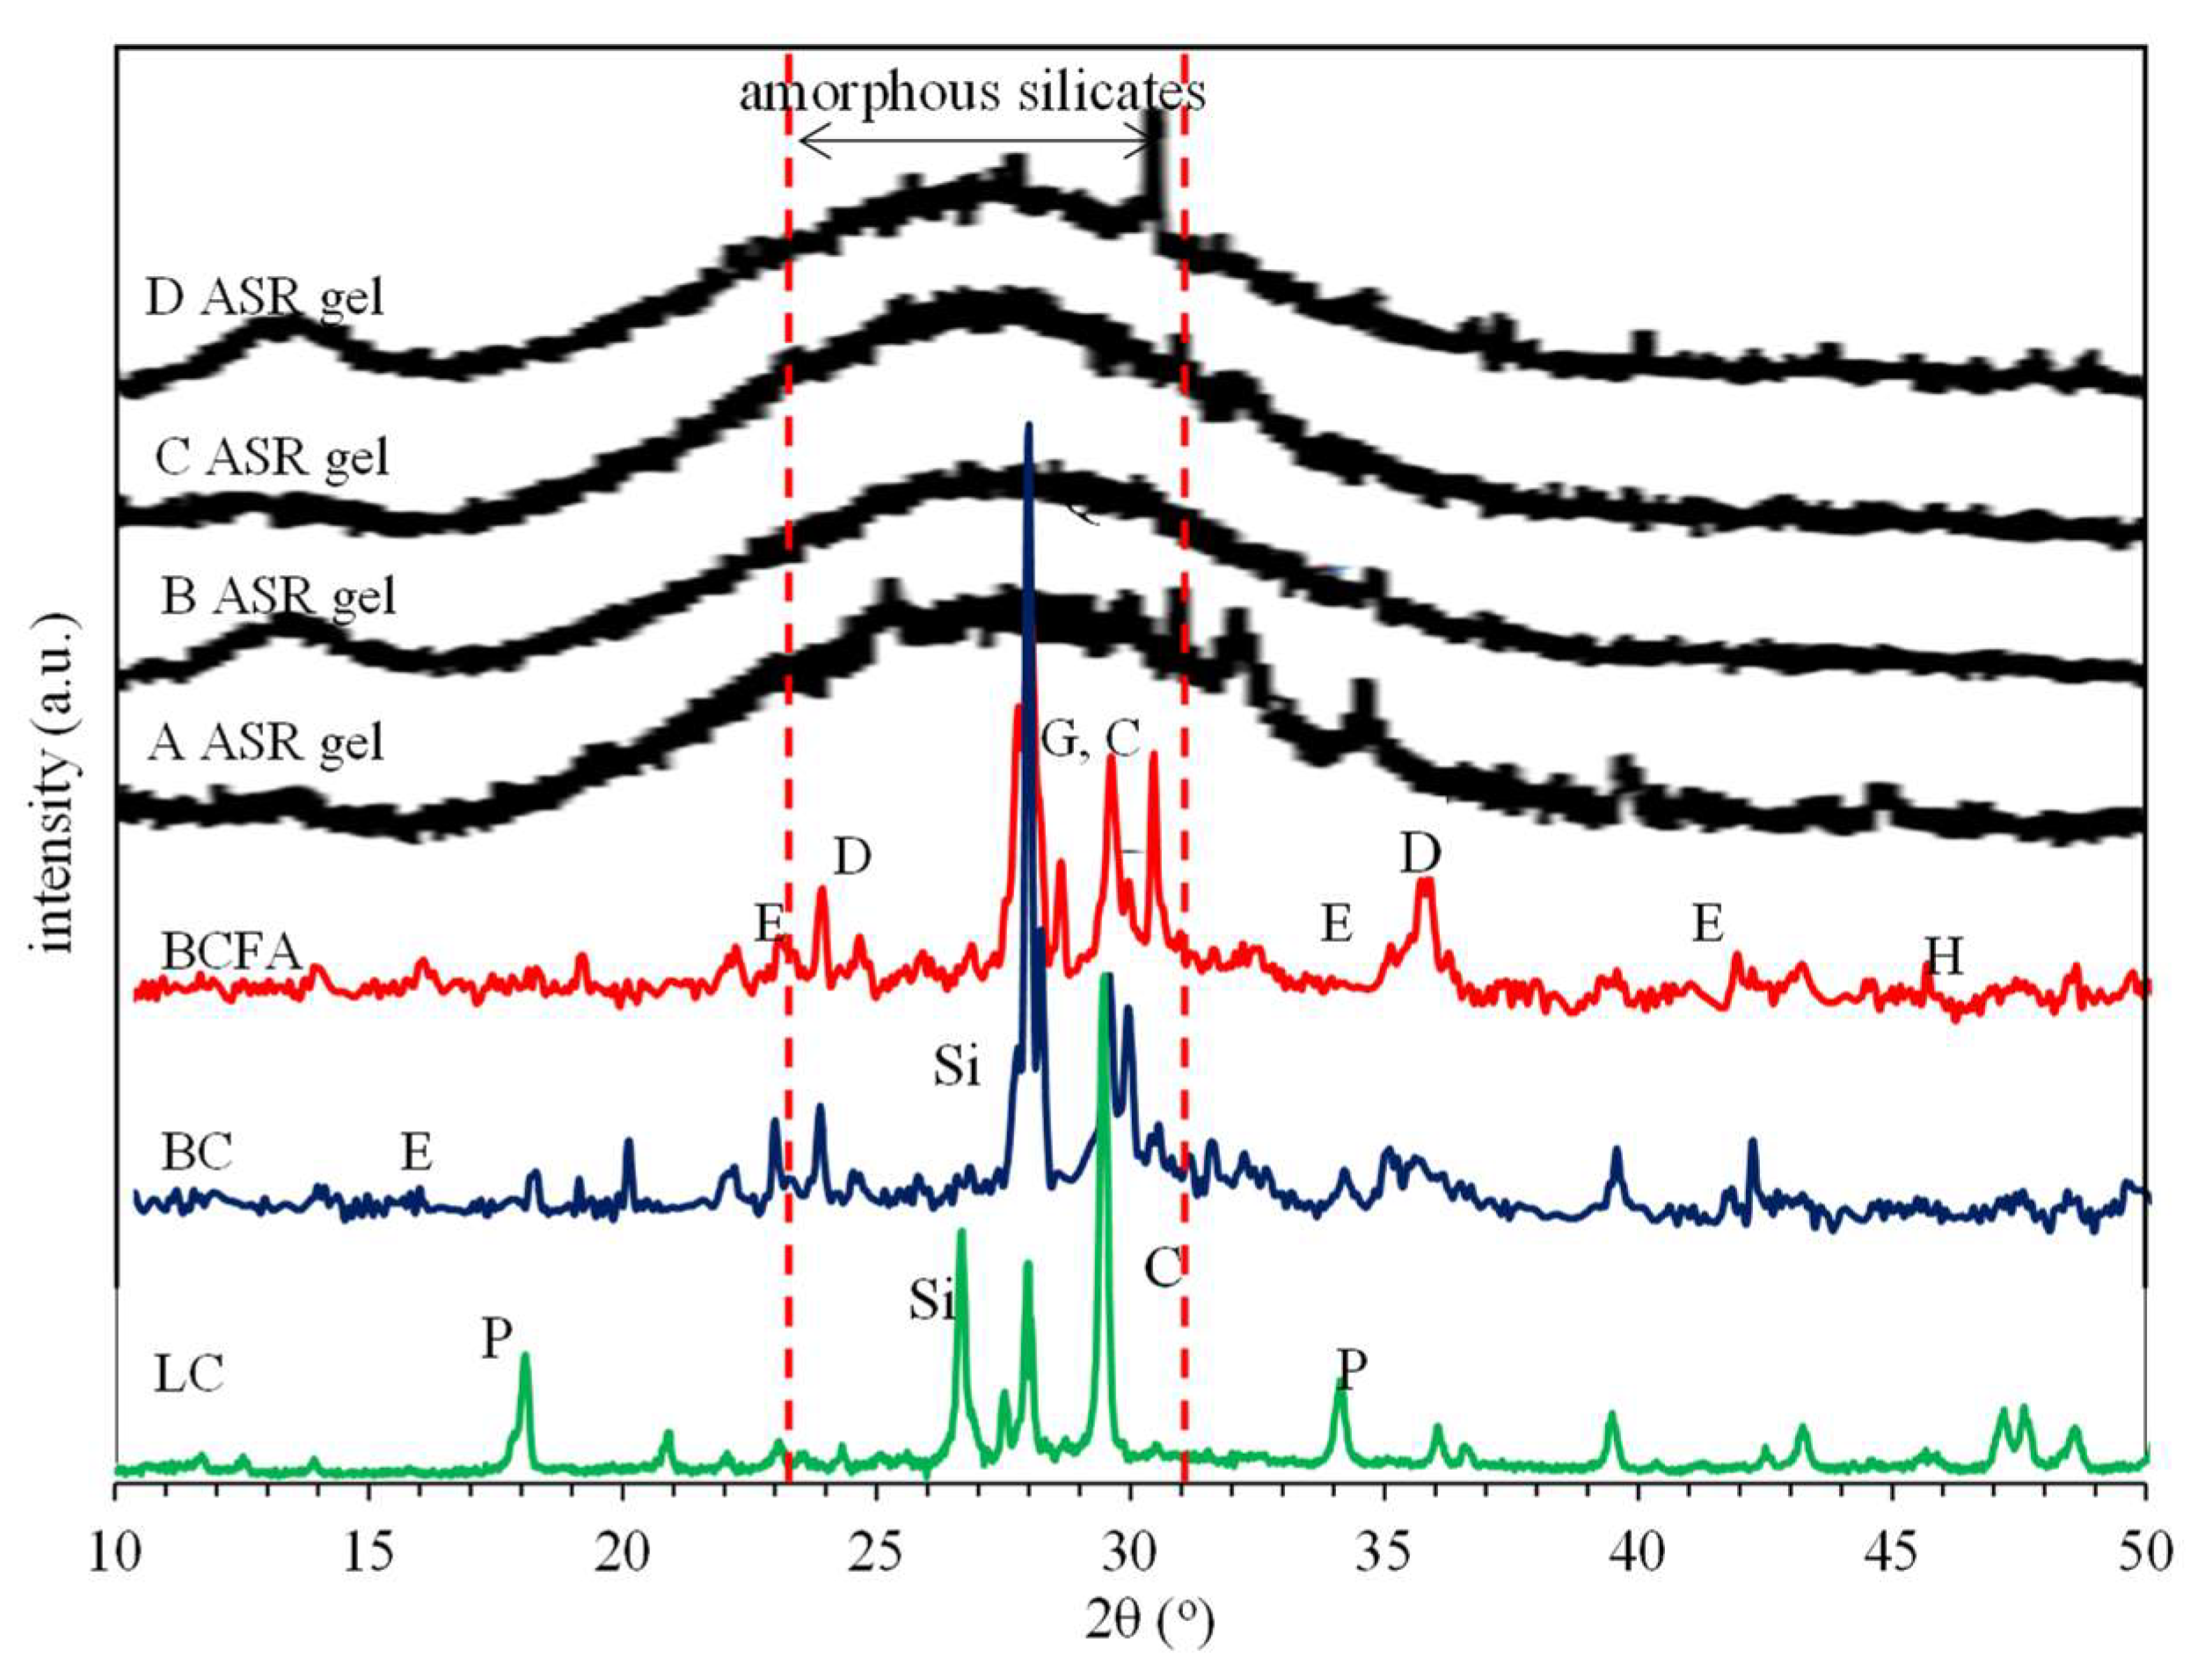
The crystal structure of the ASR product can be determined despite the poor clarity of the diffraction patterns caused by the comparatively low crystallinity of nano-sized ASR particles. According to each crystal phase’s particular atomic arrangement, the chemical alteration of each crystal phase was examined using the X-ray diffraction method (XRD) on the basis of X-rays diffracting in a distinctive order [53]. ASR products developed in the field and synthetically produced gels have similar formations [65]. XRD analysis of cement-based mortars has a halo with a maximum at 2θ ≈ 26°, which is typical for amorphous silica (a-SiO2) [65,66,67]. After ASR, this halo is still visible, but as ASR goes on, it is observed that the maximum halo is shifting towards higher 2θ values. The XRD shift of the maximum halos is a valuable fingerprint for tracking the a-SiO2 ASR [66]. The XRD pattern for four gel samples is displayed in Figure 14. XRD traces of four ASR gels [65] were compared with the samples used in this study.
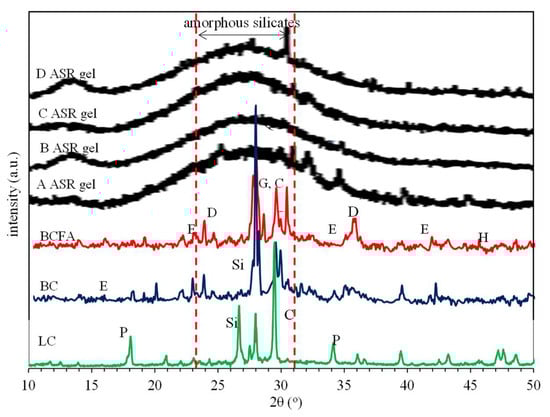
Figure 14.
X-ray diffraction patterns of the four kinds of ASR gel: A, B, C, D [65] and LC, BC, BCFA (C = calcite, D = diopside, G = gypsum, E = ettringite, H = halite, P = portlandite, Si = silicon dioxide).
3.3.2. FT-IR
FT-IR spectroscopy is a useful, simple application for detecting chemical bonds and determining chemical combinations within any material. BC and BCFA prepared with basalt aggregate were compared with the ASR gel product in the study of Tambelli et al. [65] using FT-IR analysis.
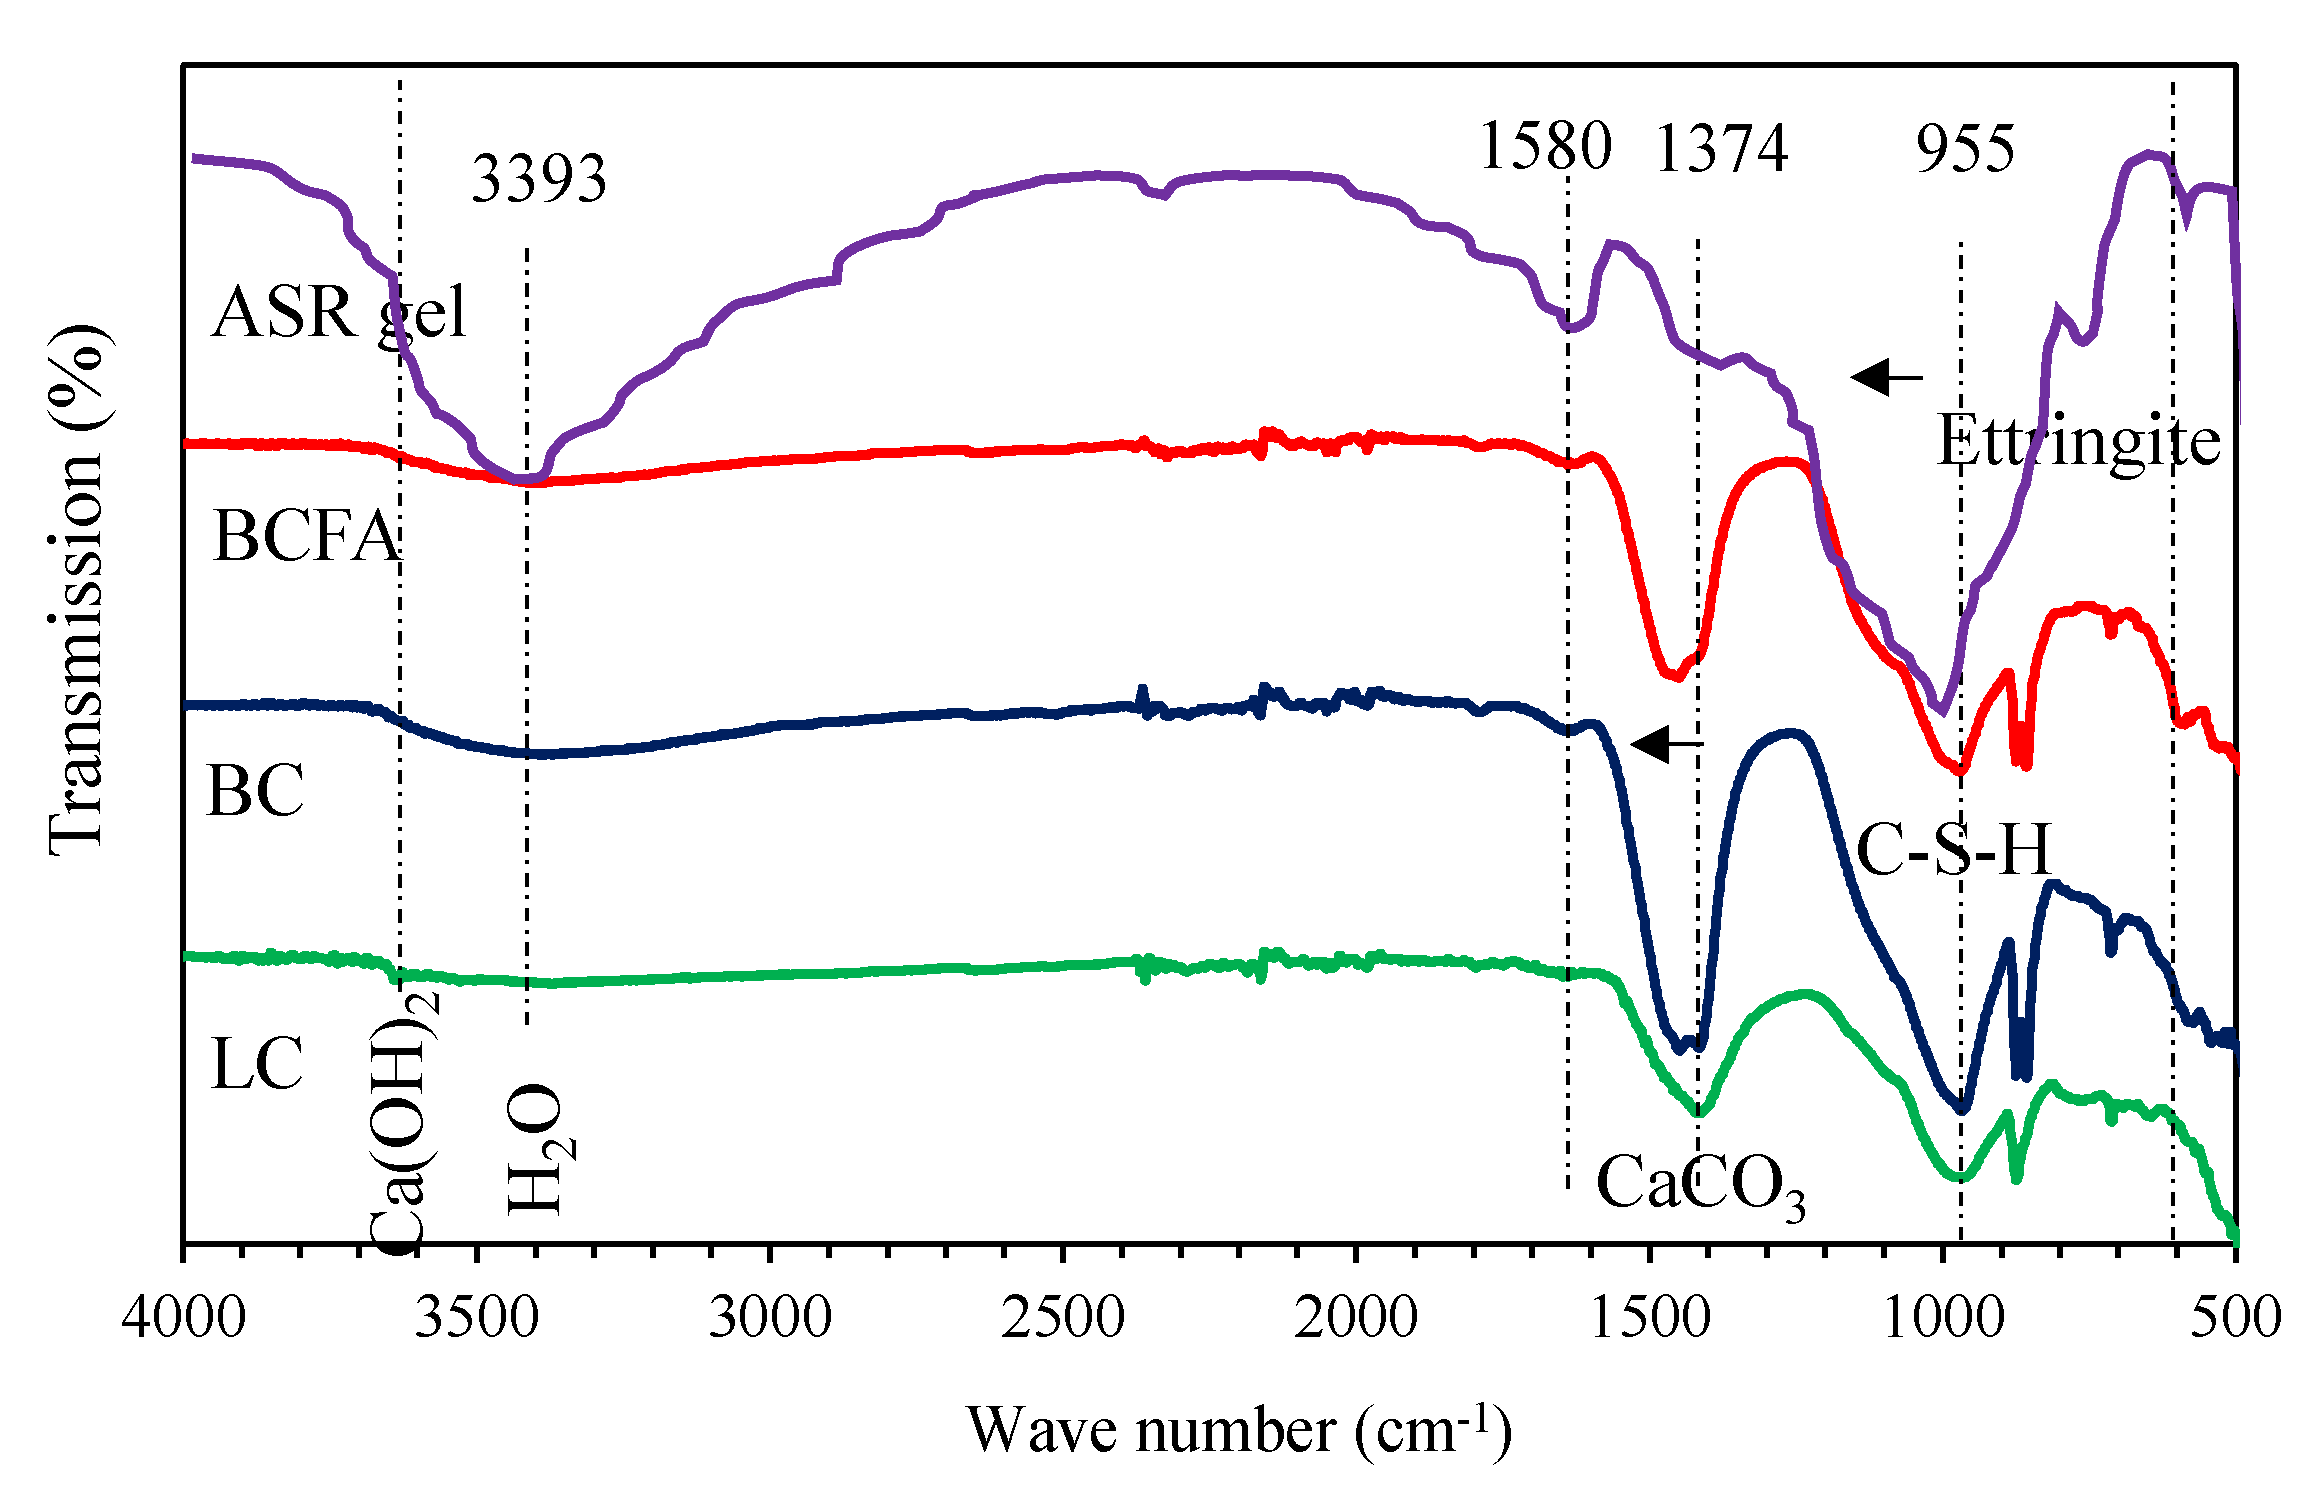
The ASR-caused cracks in the Furnas hydroelectric Rio Grande dam (Minas Gerais, Brazil) are where the ASR gel specimens were taken from. Over the course of several years, the gel specimens spontaneously emerged from the drain gallery walls and formed hard pieces with typical volumes of around 1 cm3 [65]. FT-IR analysis of the ASR gel [65] and LC, BC, and BCFA from the Furnas hydroelectric dam is shown comparatively in Figure 15.
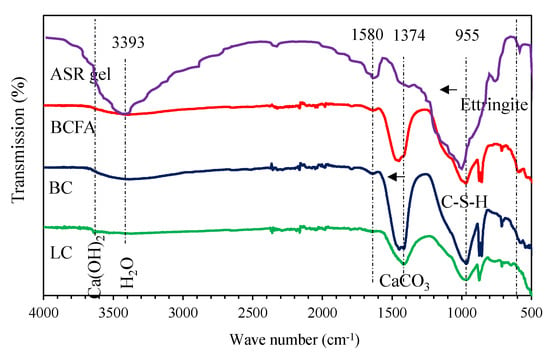
Figure 15.
FT-IR analysis of LC, BC, BCFA, and ASR gel [65].
According to the FI-IR spectrum (Figure 15), the ASR gel peaks are very different from the mortar samples. ASR gel retains a high amount of water in the O-H-O band at 3393 and 1580 cm−1, supporting that ASR matures in humid ambient temperatures. In the ASR gel, the 955 cm−1 band representing C-S-H appears to shift to a higher band. The calcite peak at 1374 cm−1 is shifted to a higher band in volcanic aggregate than in limestone. It also showed that the use of FA and volcanic aggregates in mortar caused a significant increase in calcite and C-S-H peaks.
Data from the literature can be used to attribute the detected bands. Numerous bands are connected to the amorphous silica: Si-O-X stretching where X = K or Na (955 cm−1), as well as asymmetric and symmetric stretch Si-O (1154 and 1037 cm−1, respectively), O-Si-O bending (457–600 cm−1), and symmetric stretch (783 cm−1) [68,69,70]. The bending of H2O in the band from 1642 to 1660 cm−1 indicates the presence of molecular water. Additionally, stretching of X-OH, where X = H or Si, is linked to the broad band that spans 2300–3700 cm−1, suggesting that there are a significant number of OH groups present in the silica matrix [65,71]. However, the band at 1470 cm−1 indicates the existence of carbonates because it corresponds to CO32 anions [72]. FT-IR analysis of Fig. 15 is summarized in Table 7.
Table 7.
Summarized data of Figure 15.
3.3.3. Thermogravimetric and Differential Thermal Analysis (TGA/DTA)
The free water still present in the specimens is transported up to approximately 100 °C. Water loss occurs in concrete between 100–250 °C (Peak1). It should be mentioned that the water in concrete is composed of three different types: chemically bonded water found in calcium hydroxide (CH), calcium-silicate-hydrate (C-S-H), and capillary water. Capillary water and physically absorbed water occupy most of the weight of the cement paste, and most of the C-S-H origin water is expelled from the concrete via evaporation when the ambient temperature is above 250 °C. In synthetically produced ASR-Na-silicate gels, water loss is noticeable from about 100 °C. As the alkali/Si ratio increases, the total water loss also increases: 13% for Na/Si = 0.30 gel, 16% for Na/Si = 0.52 gel, and 30% for Na/Si = 0.74 gel. As might be expected, these water losses are greater than the water losses attributed to equilibration at 0% RH [80]. The (Na + K)/Si ratio of the ASR product obtained at Furnas hydroelectric dam, mentioned in the previous section, is 0.40 [65]. Total weight losses due to total alkali–silica ratio and water in LC, BC, and BCFA were 5.63% for (Na + K)/Si = 0.24, 5.27% for (Na + K)/Si = 0.21, and 4.84% for (Na + K)/Si = 0.12, respectively. No large water losses were observed in the ASR product in the test samples, ranging from 13–30% as shown in Figure 16. TGA analysis is another indication that the ASR gel develops in a humid environment.
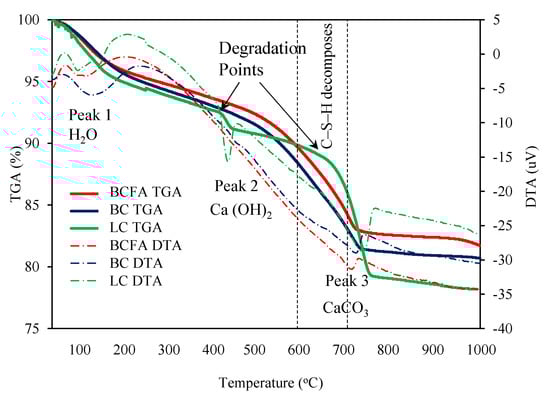
Figure 16.
Thermogravimetric analysis (TGA and DTA) of specimens heated at various temperatures.
Additionally, the CH transformation at 450 °C causes a significant mass loss. Between 450 and 550 °C, portlandite decomposes into free lime (dehydration) (Peak 2) [81,82,83]. A weak endothermic peak at 650 °C is attributed to the decomposition of calcite. Platret [83] found that between 600 and 700 °C, C-S-H decomposes to form β-C2S in his study. The specimen heated at 750 °C shows the complete conversion of CH and CaCO3 to CaO (Peak 3) [84,85].
According to recent studies, the use of FA and fine volcanic aggregates in mortar increases the production of calcite, secondary C-S-H, and C-S-A-H, which improves the matrix microstructure and increases the compressive strength [20,86,87,88,89].
According to Figure 16, mass losses due to Ca (OH)2 and CaCO3 were evident in the limestone-based sample, while no sharp peaks were observed in the basalt-based samples. The mass losses were found to be 19.31, 18.29, and 21.80% for the BC, BCFA, and LC samples, respectively. This result indicates that basalt aggregate and FA contribute to C-S-H formation in the strength process.
4. Conclusions
- As discussed above, the three indispensable factors for ASR are sufficient reactive silica, sufficient alkali metals, and sufficient moisture. However, ASR is difficult to understand due to its multifaceted complexity. Therefore, AMBT analysis alone may not be sufficient. Characterization studies such as SEM/EDX, XRD, FT-IR, and TGA can provide an understanding of ASR formation.
- The alkali–silica density in the medium as shown by the [(Na + K)/Si] − [Ca/Si] ratio in SEM/EDX analysis may provide some insight into the formation of ASR; however, it should be noted that this process is slow to proceed as the concrete ages and that the reaction product’s composition may eventually resemble C-S-H.
- Because of the well-known moisture retention characteristic resulting from the ASR maturation mechanism, the ASR footprint can be identified by the formation of noticeable water-induced peaks in TGA and FT-IR analyses.
- In the test conducted in accordance with ASTM C 1260 standards, it was determined that the volumetric expansion of basalt aggregate with basic petrographic structure in mortar was within the limit values, and no ASR gels were found in micro analysis. According to XRD analysis, it was determined that there was a decrease in ettringite and CH phases and an increase in C-S-H formation with the substitution of fly ash instead of cement. Therefore, it is possible to say that the substitution of basalt aggregate and fly ash increases the strength and durability of mortar.
- According to the results of the analyses, the addition of fly ash (FA) to mortars increased the strength and durability by increasing the amount of C-S-H gel. According to mechanical tests, 20% fly ash substitution instead of cement increased the compressive strength value up to 10%. However, AMBT analysis (1 M NaOH solution, 80 °C) showed a strength loss of about 3% in specimens kept for 14 days. In AMBT analysis, the volumetric expansion of basalt-based mortars decreased by 71% when 20% of fly ash was substituted for cement.
- It was concluded that igneous rocks showing basaltic properties in petrographic analysis can be used in the concrete industry since they are not reactive against ASR. In case reactive aggregates are used in concrete, it is possible to say that 20% fly ash replacement can be used as a measure against ASR.
Funding
This research received no external funding.
Data Availability Statement
The raw data supporting the conclusions of this article will be made available by the authors on request.
Conflicts of Interest
The author declares no conflict of interest.
References
- Stanton, T.E. Influence of cement and aggregate on concrete expansion. Eng. News-Rec. 1940, 124, 171–173. [Google Scholar]
- Leemann, A.; Lura, P. E-modulus of the alkali-silica-reaction product determined by micro-indentation. Constr. Build. Mater. 2013, 44, 221–227. [Google Scholar] [CrossRef]
- Leemann, A. Raman microscopy of alkali-silica reaction (ASR) products formed in concrete. Cem. Concr. Res. 2017, 102, 41–47. [Google Scholar] [CrossRef]
- Shin, J.H.; Struble, L.J.; Kirkpatrick, R.J. Microstructural changes due to alkali-silica reaction during standard mortar test. Materials 2015, 8, 8292–8303. [Google Scholar] [CrossRef]
- Katayama, T. ASR gels and theır crystallıne phases ın concrete-universal products ın alkali-silica, alkali-silicate and alkali-carbonate reactions. In Proceedings of the 14th International Conference on Alkali-Aggregate Reaction (ICAAR), Austin, Texas, USA, 20–25 May 2012; pp. 20–25. [Google Scholar]
- Thaulow, N.; Jakobsen, U.H.; Clark, B. Composition of alkali silica gel and ettrıngıte ın concrete railroad ties: SEM-EDX and X-ray diffraction analyses. Cem. Concr. Res. 1996, 26, 309–318. [Google Scholar] [CrossRef]
- Peterson, K.; Gress, D.; Van Dam, T.; Sutter, L. Crystallized alkali-silica gel in concrete from the late 1890s. Cem. Concr. Res. 2006, 36, 1523–1532. [Google Scholar] [CrossRef]
- Leemann, A.; Shi, Z.; Lindgård, J. Characterization of amorphous and crystalline ASR products formed in concrete aggregates. Cem. Concr. Res. 2020, 137, 106190. [Google Scholar] [CrossRef]
- Mohammadi, A.; Ghiasvand, E.; Nili, M. Relation between mechanical properties of concrete and alkali-silica reaction (ASR); a review. Constr. Build. Mater. 2020, 258, 119567. [Google Scholar] [CrossRef]
- Fournier, B.; Bérubé, M.A.; Folliard, K.J.; Thomas, M. Report on the Diagnosis, Prognosis, and Mitigation of Alkali-Silica Reaction (ASR) in Transportation Structures (No. FHWA-HIF-09-004); Federal Highway Administration, Office of Pavement Technology: Cleveland, OH, USA, 2010.
- Bérubé, M.A.; Tremblay, C.; Fournier, B.; Thomas, M.D.; Stokes, D.B. Influence of lithium-based products proposed for counteracting ASR on the chemistry of pore solution and cement hydrates. Cem. Concr. Res. 2004, 34, 1645–1660. [Google Scholar] [CrossRef]
- Poyet, S.; Sellier, A.; Capra, B.; Foray, G.; Torrenti, J.M.; Cognon, H.; Bourdarot, E. Chemical modelling of Alkali Silica reaction: Influence of the reactive aggregate size distribution. Mater. Struct. Mater. Et Constr. 2007, 40, 229–239. [Google Scholar] [CrossRef]
- Mohammad Shahidul Islam, S.A. A Critical Assessment to the Performance of Alkali-Silica Reaction (ASR) in Concrete. Can. Chem. Trans. 2013, 1, 253–266. [Google Scholar] [CrossRef]
- Kawamura, M.; Fuwa, H. Effects of lithium salts on ASR gel composition and expansion of mortars. Cem. Concr. Res. 2003, 33, 913–919. [Google Scholar] [CrossRef]
- Hobbs, D.W. Alkali–Silica Reaction in Concrete. In Structure and Performance of Cement; Thomas Telford Publishing: London, UK, 2002; pp. 265–281. [Google Scholar]
- Ichikawa, T.; Miura, M. Modified model of alkali-silica reaction. Cem. Concr. Res. 2007, 37, 1291–1297. [Google Scholar] [CrossRef]
- Fanijo, E.O.; Kolawole, J.T.; Almakrab, A. Alkali-silica reaction (ASR) in concrete structures: Mechanisms, effects and evaluation test methods adopted in the United States. Case Stud. Constr. Mater. 2021, 15, e00563. [Google Scholar] [CrossRef]
- Katayama, T. Alkali Aggregate Reaction in The Vicinity of İzmir, Western Turkey, Alkali Aggregate Reaction In Concrete. In Proceedings of the 11th International Conference, Montréal, QC, Canada, 19–22 July 2000. [Google Scholar]
- Ma, P.; Liao, W.; Zhuo, Y.; Ma, H.; Zhu, Y.; Chen, G. Characterization of alkali-silica reaction (ASR) products and C-S-H using SWIR spectroscopy for nondestructive detection of ASR. Constr. Build. Mater. 2024, 416, 135207. [Google Scholar] [CrossRef]
- Karasin, A.; Hadzima-Nyarko, M.; Işık, E.; Doğruyol, M.; Karasin, I.B.; Czarnecki, S. The Effect of Basalt Aggregates and Mineral Admixtures on the Mechanical Properties of Concrete Exposed to Sulphate Attacks. Materials 2022, 15, 1581. [Google Scholar] [CrossRef]
- Shehata, M.H.; Thomas, M.D.A.; Bleszynski, R.F. The effects of fly ash composition on the chemistry of pore solution in hydrated cement pastes. Cem. Concr. Res. 1999, 29, 1915–1920. [Google Scholar] [CrossRef]
- Mehta, P.K.; Monteiro, P.J. Concrete: Microstructure, Properties, and Materials, 4th ed.; McGraw-Hill Companies: New York, NY, USA, 2014. [Google Scholar]
- Wen, J.; Dong, J.; Chang, C.; Xiao, X.; Zheng, W. Alkali−Silica Activity and Inhibition Measures of Concrete Aggregate in Northwest China. Crystals 2022, 12, 1013. [Google Scholar] [CrossRef]
- Šachlová, Š.; Kuchařová, A.; Pertold, Z.; Přikryl, R. Mıcroscopıc and Chemıcal Characterısatıon of ASR Induced by Quartz-Rıch Aggregates. In Proceedings of the 15th Euroseminar on Microscopy Applied to Building Materials, Delft, The Netherland, 16–19 June 2014. [Google Scholar]
- Andiç-Çakır, Ö. Investigation of Test Methods on Alkali Aggregate Reaction; Ege University Institute of Science: Bornova, Türkiye, 2007. [Google Scholar]
- Kambiz, R. Alkali-silica reaction in concrete a review. In Proceedings of the 2013 Ready Concrete Congress, İstanbul, Türkiye, 21–23 February 2013; pp. 289–311. [Google Scholar]
- Kazemi, P.; Nikudel, M.R.; Khamehchiyan, M.; Giri, P.; Taheri, S.; Clark, S.M. Assessment of Alkali–Silica Reaction Potential in Aggregates from Iran and Australia Using Thin-Section Petrography and Expansion Testing. Materials 2022, 15, 4289. [Google Scholar] [CrossRef]
- BS EN 196-6: 2018; Methods of testing cement is classified in these ICS categories: 91.100.10 Cement. Gypsum. Lime. Mortar. The British Standards Institution: London, UK, 2018.
- ASTM 204; Standard Test Methods for Fineness of Hydraulic Cement by Air-Permeability Apparatus. American Association State Highway and Transportation Officials Standard: Washington, DC, USA, 2013.
- Doğruyol, M.; Değer, M.K. Investigation of Basalt Rocks of Cizre Region in terms of Alkaline Silica (ASR). In Proceedings of the 1st International Conference on Scientific and Academic Research, Konya, Turkey, 10–13 December 2022. [Google Scholar]
- Değer, M.K.; Şırnak, T.C. The Effect of Basalt Aggregate of Cizre and Surroundings on Concrete Performance Compared to Dolomite Aggregate. Master’s Thesis, University Graduate School of Graduate Studies, Şırnak, Türkiye, 2023. [Google Scholar]
- BS 8007; Design of concrete structures for retaining aqueous liquids. BSI: London, UK, 1987.
- ASTM (American Society for Testing and Materials) Standards. Standard Test Method for the Resistance to Degradation of Small-Size Coarse Aggregates by Abrasion and Impact in the Los Angeles Machine, C131–03, v. 04.02; American Society for Testing and Materials: West Conshohocken, PA, USA, 2006. [Google Scholar]
- ASTM Standard. Test Method for Tensile Strength of Monolithic Advanced Ceramics at Ambient Temperatures, C 1273-05. Annual Book of ASTM Standards, Vol. 15.01; American Society of Testing and Materials: West Conshohocken, PA, USA, 2005. [Google Scholar]
- Kutchko, B.G.; Kim, A.G. Fly ash characterization by SEM-EDS. Fuel 2006, 85, 2537–2544. [Google Scholar] [CrossRef]
- Chancey, R.T.; Stutzman, P.; Juenger, M.C.G.; Fowler, D.W. Comprehensive phase characterization of crystalline and amorphous phases of a Class F fly ash. Cem. Concr. Res. 2010, 40, 146–156. [Google Scholar] [CrossRef]
- Li, X.; Ma, X.; Zhang, S.; Zheng, E. Mechanical properties and microstructure of class C fly ash-based geopolymer paste and mortar. Materials 2013, 6, 1485–1495. [Google Scholar] [CrossRef] [PubMed]
- Duxson, P.; Fernández-Jiménez, A.; Provis, J.L.; Lukey, G.C.; Palomo, A.; Van Deventer, J.S.J. Geopolymer technology: The current state of the art. J. Mater. Sci. 2007, 42, 2917–2933. [Google Scholar] [CrossRef]
- Granizo, M.L.; Alonso, S.; Blanco-Varela, M.T.; Palomo, A. Alkaline activation of metakaolin: Effect of calcium hydroxide in the products of reaction. J. Am. Ceram. Soc. Am. Ceram. Soc. 2002, 85, 225–231. [Google Scholar] [CrossRef]
- Yip, C.K.; Van Deventer, J.S.J. Microanalysis of calcium silicate hydrate gel formed within a geopolymeric binder. J. Mater. Sci. 2003, 38, 3851–3860. [Google Scholar] [CrossRef]
- Wang, S.D.; Scrivener, K.L.; Pratt, P.L. 0008-8846(94) 00046-8 Factors Affecting the Strength of Alkali-Activated Slag. Cem. Concr. Res. 1994, 24, 1033–1043. [Google Scholar] [CrossRef]
- Erdoğan, Y.E. Materials of Construction; M.E.T.U. Press: Ankara, Türkiye, 2002. [Google Scholar]
- Katayama, T. A Crıtıcal Revıew of Carbonate Rock Reactıons-Is Theır Reactıvıty Useful or Harmful. In Proceeding of the 9th International AAR Conference, London, UK, 27–31 July 1992; pp. 508–518. [Google Scholar]
- Rajabipour, F.; Giannini, E.; Dunant, C.; Ideker, J.H.; Thomas, M.D.A. Alkali-silica reaction: Current understanding of the reaction mechanisms and the knowledge gaps. Cem. Concr. Res. 2015, 75, 130–146. [Google Scholar] [CrossRef]
- ASTM C150-07; Standard Specification for Portland Cement. ASTM Standards: West Conshohocken, PA, USA, 2007.
- Tremblay, C.; Bérubé, M.A.; Fournier, B.; Thomas, M.D.; Folliard, K.J. Experimental investigation of the mechanisms by which LiNO3 is effective against ASR. Cem. Concr. Res. 2010, 40, 583–597. [Google Scholar] [CrossRef]
- le Maitre, R.W. A Classification of Igneous Rocks and Glossary of Terms; Blackwell Scientific Publ.: Oxford, UK, 1989. [Google Scholar]
- Katayama, T. Petrographic Study of the Alkali-aggregate Reactions in Concrete; University of Tokyo: Tokyo, Japan, 2012. [Google Scholar]
- Tapan, M. Alkali-silica reactivity of alkali volcanic rocks. Eur. J. Environ. Civ. Eng. 2015, 19, 94–108. [Google Scholar] [CrossRef]
- Korkanç, M.; Tuǧrul, A. Evaluation of selected basalts from the point of alkali-silica reactivity. Cem. Concr. Res. 2005, 35, 505–512. [Google Scholar] [CrossRef]
- ASTM C 1260; Standart Test Method for Potential Alkali Reactivity of Aggregates (Mortar-Bar Method). Annual Book of ASTM Standards: Philadelphia, PA, USA, 2007.
- Middendorf, B.; Hughes, J.J.; Callebaut, K.; Baronio, G.; Papayianni, I. Investigative methods for the characterisation of historic mortars - Part 1: Mineralogical characterization. Mater. Struct. Mater. Et Constr. 2005, 38, 761–769. [Google Scholar] [CrossRef]
- Shi, Z.; Leemann, A.; Rentsch, D.; Lothenbach, B. Synthesis of alkali-silica reaction product structurally identical to that formed in field concrete. Mater. Des. 2020, 190, 108562. [Google Scholar] [CrossRef]
- Leemann, A.; le Saout, G.; Winnefeld, F.; Rentsch, D.; Lothenbach, B. Alkali-Silica reaction: The Influence of calcium on silica dissolution and the formation of reaction products. J. Am. Ceram. Soc. 2011, 94, 1243–1249. [Google Scholar] [CrossRef]
- Wang, W.; Noguchi, T. Alkali-silica reaction (ASR) in the alkali-activated cement (AAC) system: A state-of-the-art review. Constr. Build. Mater. 2020, 252, 119105. [Google Scholar] [CrossRef]
- Thomas, M. The role of calcium hydroxide in alkali recycling in concrete. In Materials Science of Concrete Special Volume on Calcium Hydroxide in Concrete; Skalny, J., Gebauer, J., Odler, I., Eds.; American Ceramic Society: Westerville, OH, USA, 2001; pp. 269–280. [Google Scholar]
- Urhan, S. Alkali silica and pozzolanic reactions in concrete. Part 1: Interpretation of published results and an hypothesis concerning the mechanism. Cem. Concr. Res. 1987, 17, 141–152. [Google Scholar] [CrossRef]
- Hünger, K.J. The contribution of quartz and the role of aluminum for understanding the AAR with greywacke. Cem. Concr. Res. 2007, 37, 1193–1205. [Google Scholar] [CrossRef]
- García Lodeiro, I.; Fernández-Jimenez, A.; Palomo, A.; Macphee, D.E. Effect on fresh C-S-H gels of the simultaneous addition of alkali and aluminium. Cem. Concr. Res. 2010, 40, 27–32. [Google Scholar] [CrossRef]
- MTA. General Directorate of Mineral Research and Exploration; MTA: Ankara, Turkey, 1998. [Google Scholar]
- Smedskjaer, M.M.; Jensen, M.; Yue, Y.-Z. Theoretical calculation and measurement of the hardness of diopside. J. Am. Ceram. Soc. 2008, 91, 514–518. [Google Scholar] [CrossRef]
- Warr, L.N. IMA–CNMNC approved mineral symbols. Mineral. Mag. 2021, 85, 291–320. [Google Scholar] [CrossRef]
- Puchta, R. A brighter beryllium. Nat. Chem. 2011, 3, 416. [Google Scholar] [CrossRef] [PubMed]
- Deer, W.; Howie, R.; Zussman, J. An Introduction to the Rock Forming Minerals; Mineralogical Society of Great Britain and Ireland: Twickenham, UK, 1966; ISBN 0-582-44210-9. [Google Scholar]
- Tambelli, C.E.; Schneider, J.F.; Hasparyk, N.P.; Monteiro, P.J.M. Study of the structure of alkali-silica reaction gel by high-resolution NMR spectroscopy. J. Non-Cryst. Solids 2006, 352, 3429–3436. [Google Scholar] [CrossRef]
- Hamoudi, A.; Khouchaf, L.; Depecker, C.; Revel, B.; Montagne, L.; Cordier, P. Microstructural evolution of amorphous silica following alkali-silica reaction. J. Non-Cryst. Solids 2008, 354, 5074–5078. [Google Scholar] [CrossRef]
- Imaoka, M.; Hasegawa, H.; Yasui, I. X-ray diffraction study of the structure of silicate glasses. II: Alkali Disilicate Glasses. Pascal Francis Bibliogr. Databases 1983, 24, 72–78. [Google Scholar]
- Serra, J.; González, P.; Liste, S.; Serra, C.; Chiussi, S.; León, B.; Pérez-Amor, M.; Ylänen, H.O.; Hupa, M. FTIR and XPS studies of bioactive silica based glasses. J. Non-Cryst. Solids 2003, 332, 20–27. [Google Scholar] [CrossRef]
- Takadama, H.; Kim, H.M.; Kokubo, T.; Nakamura, T. Mechanism of biomineralization of apatite on a sodium silicate glass: TEM-EDX study in vitro. Chem. Mater. 2001, 13, 1108–1113. [Google Scholar] [CrossRef]
- Uchino, T.; Sakka, T.; Hotta, K.; Lwasaki, M. Attenuated Total Reflectance Fourier-Transform Infrared Spectra of a Hydrated Sodium Silicate Glass. J. Am. Ceram. Soc. 1989, 72, 2173–2175. [Google Scholar] [CrossRef]
- Webster, F.X.; Kiemle, D.J. Spectrometric Identification of Organic Compounds; John Wiley & Sons: Hoboken, NJ, USA, 2005. [Google Scholar]
- Ricol, S.; Vernaz, E.; Barboux, P. Synthesis of Gels in the System Na20-ZrO2-SiO2; Kluwer Academic Publishers: Alphen aan den Rijn, The Netherlands, 1997. [Google Scholar]
- Ping, Y.; Kirkpatrick, R.J.; Brent, P.; McMillan, P.F.; Cong, X. Structure of calcium silicate hydrate (C-S-H): Near-, mid-, and far-infrared spectroscopy. J. Am. Ceram. Soc. 1999, 82, 742–748. [Google Scholar] [CrossRef]
- Singh, M.; Waghmare, S.; Kumar, S.V. Characterization of lime plasters used in 16th century Mughal monument. J. Archaeol. Sci. 2014, 42, 430–434. [Google Scholar] [CrossRef]
- Choudhary, R.; Gupta, R.; Nagar, R. Impact on fresh, mechanical, and microstructural properties of high strength self-compacting concrete by marble cutting slurry waste, fly ash, and silica fume. Constr. Build. Mater. 2020, 239, 117888. [Google Scholar] [CrossRef]
- Chollet, M.; Horgnies, M. Analyses of the surfaces of concrete by Raman and FT-IR spectroscopies: Comparative study of hardened samples after demoulding and after organic post-treatment. Surf. Interface Anal. 2011, 43, 714–725. [Google Scholar] [CrossRef]
- Horgnies, M.; Willieme, P.; Gabet, O. Influence of the surface properties of concrete on the adhesion of coating: Characterization of the interface by peel test and FT-IR spectroscopy. Prog. Org. Coat. 2011, 72, 360–379. [Google Scholar] [CrossRef]
- Bhat, P.A.; Debnath, N.C. Theoretical and experimental study of structures and properties of cement paste: The nanostructural aspects of CSH. J. Phys. Chem. Solids 2011, 72, 920–933. [Google Scholar] [CrossRef]
- Horgnies, M.; Chen, J.J.; Bouillon, C. Overview about the Use of Fourier Transform Infrared Spectroscopy to Study Cementitious Materials; WIT Transactions on Engineering Sciences: London, UK, 2013. [Google Scholar]
- Hou, X.; Struble, L.J.; Kirkpatrick, R.J. Kanemite as a Model for ASR gel. In Proceeding of the 12th International Conference on Alkali Aggregate in Concrete (ICAAR), Beijing, China, 15–19 October 2004. [Google Scholar]
- Bažant, Z.P.; Kaplan, M.F. Concrete at High Temperatures: Material Properties and Mathematical Models; Longman Group Limited google schola: London, UK, 1996. [Google Scholar]
- Noumowe, A. Effet de Hautes Températures (20–600 C) Sur le Béton: Cas Particulier du Béton a Hautes Performances. Doctoral Dissertation, INSA, New Delhi, India, 1995. [Google Scholar]
- Platret, G. Suivi de l’hydratation du ciment et de l’évolution des phases solides dans les bétons par analyse thermique, caractéristiques microstructurales et propriétés relativesa la durabilité des bétons. Méthode D’essai 2002, 58. [Google Scholar]
- Zhang, B. Effects of moisture evaporation (weight loss) on fracture properties of high performance concrete subjected to high temperatures. Fire Saf. J. 2011, 46, 543–549. [Google Scholar] [CrossRef]
- Savva, A.; Manita, P.; Sideris, K.K. Influence of elevated temperatures on the mechanical properties of blended cement concretes prepared with limestone and siliceous aggregates. Cem. Concr. Compos. 2005, 27, 239–248. [Google Scholar] [CrossRef]
- Moon, J.; Bae, S.; Celik, K.; Yoon, S.; Kim, K.H.; Kim, K.S.; Monteiro, P.J.M. Characterization of natural pozzolan-based geopolymeric binders. Cem. Concr. Compos. 2014, 53, 97–104. [Google Scholar] [CrossRef]
- Kupwade-Patil, K.; Palkovic, S.D.; Bumajdad, A.; Soriano, C.O. Büyüköztürk, Use of silica fume and natural volcanic ash as a replacement to Portland cement: Micro and pore structural investigation using NMR, XRD, FTIR and X-ray microtomography. Constr. Build. Mater. 2018, 158, 574–590. [Google Scholar] [CrossRef]
- Annaba, K.; El Mendili, Y.; Stout, H.; Ech-chebab, A.; Ouaki, B.; Cherkaoui, M. Florence, Mechanical, electrochemical (EIS), and microstructural characterization of reinforced concrete incorporating natural volcanic pozzolan. Case Stud. Constr. Mater. 2023, 19, e02620. [Google Scholar] [CrossRef]
- Karaşin, A.; Doğruyol, M. An experimental study on strength and durability for utilization of fly ash in concrete mix. Adv. Mater. Sci. Eng. 2014, 2014, 417514. [Google Scholar] [CrossRef]


Disclaimer/Publisher’s Note: The statements, opinions and data contained in all publications are solely those of the individual author(s) and contributor(s) and not of MDPI and/or the editor(s). MDPI and/or the editor(s) disclaim responsibility for any injury to people or property resulting from any ideas, methods, instructions or products referred to in the content. |
© 2024 by the author. Licensee MDPI, Basel, Switzerland. This article is an open access article distributed under the terms and conditions of the Creative Commons Attribution (CC BY) license (https://creativecommons.org/licenses/by/4.0/).