1. Introduction
Overloading, corrosion, blasts, earthquakes, and environmental hazards contribute to structural damage to highway bridges. Over time, these factors develop cracks and defects in bridge structures. In some cases, the development of cracks can serve as an early indicator of more severe problems that start with localized damage and progress through a chain reaction mechanism that can ultimately lead to structural failure [
1,
2,
3]. Detecting defects during their initial stages is critical for diagnosing damage and facilitating timely repairs and retrofitting operations [
4]. Consequently, there has been a growing emphasis on the importance of steel highway bridge design and health monitoring, particularly following the well-known catastrophic bridge collapse events, such as the collapse of Silver Bridge in the USA in 1967 [
5] and the I-35W bridge collapse in Minnesota, in 2007 [
6].
Numerous studies have contributed to the understanding of bridge collapse mechanisms through the analysis of highway bridge failures. The fracture of a single structural member can potentially lead to the complete collapse of an entire bridge. These specific members are commonly referred to as “fracture critical members” (FCMs), according to AASHTO, which defines them as “a steel member in tension, or with an element in tension, whose failure would likely result in a portion or the entire bridge collapsing”. While the design and construction of bridges with FCMs are allowed, the National Bridge Inspection Standards (NBIS) mandate routine inspections, typically conducted every two years (FHWA and US DOT 2017) [
7]. Sophisticated inspection and monitoring programs are imperative for larger bridges, particularly those with multiple and continuous spans or those featuring more intricate designs and construction details [
8]. These structures demand efficient monitoring approaches to identify localized damage and evaluate their overall structural health effectively [
9]. However, it is worth noting that conducting fracture-critical bridge inspections demands significant labor, which can be financially burdensome.
Currently, all girder bridges, in general, are categorized as bridges containing FCMs. Fatigue cracking in these bridges, frequently resulting from out-of-plane distortion at the intersections of transverse bracing and longitudinal girders, poses a significant risk, potentially leading to the full-depth fracture of steel girder bridges, specifically within the region of positive bending moments in steel girders. The vulnerability of bottom flanges to fatigue cracking designates them as fracture-critical components, with the extent of this classification depending on factors such as the number of girders and the overall configuration of the bridge [
10,
11]. Nonetheless, there are several documented cases where girder bridges have managed to survive, even when one of the girders exhibited full-depth cracks. For instance, in 1977, the US 52 Bridge in Savanna, Illinois, experienced such a situation, where the damage remained unnoticed until inspections uncovered significant deflections [
12].
Similarly, on the Neville Island Bridge in Pittsburgh, Pennsylvania, in 1977, a complete girder fracture went unnoticed until a nearby boater spotted it [
13]. In an experimental study conducted by Van Pham et al. [
14] on a three-span steel box girder bridge, it was demonstrated that a complete fracture in one girder did not lead to the collapse of the entire bridge. In conjunction with the intact girder, the structure’s deck proved instrumental in providing stability and retaining the load-resisting capability to support applied loads. Despite these examples and previous analyses revealing some reserved bridge capacity, a common concern remains regarding the periodic monitoring of bridges. This concern arises from the fact that a bridge’s fracture-critical stability is not always definitively linked to the performance of its fracture-critical members.
Recent studies have increasingly emphasized bridge monitoring and damage detection for larger steel structures, focusing on employing vibration-based techniques for structural health monitoring (SHM) [
15]. In general, these techniques involve the assessment of changes in modal parameters. Numerous researchers have undertaken efforts to identify structural damage by observing alterations in natural frequencies [
16,
17] and mode shapes [
18,
19]. These changes indicate evolving physical properties within the structures, which may change over time, including parameters such as mass, stiffness, and damping [
20]. The influence of environmental conditions, such as variations in temperature and humidity, as well as other factors like traffic, can also contribute to these changes. In severe cases, these environmental effects can even result in structural damage [
21,
22]. Moreover, the development of SHM techniques will enable the accurate evaluation of the maintenance states of existing bridges over time, including vibration-based and non-destructive testing-based damage identification methods [
23].
Much research has explored the application of vibration-based techniques in SHM for bridges. In these studies, researchers developed detailed finite element models of damaged bridges and used field tests and the available experimental data to validate them. For instance, a noteworthy example of the application of ambient vibration testing is the examination of the Ponte delle Torri during the Italy earthquakes [
24], where a noticeable decrease in modal frequencies occurred after seismic activity. The comparison of the calibrated finite element numerical tensile damage with the damage observed in the field resulted in a very close agreement.
In the case of the Diefenbaker Bridge, in 2011, a significant crack was identified near the mid-span of the fourth span in the southbound structure—this bridge spans the North Saskatchewan River in Canada and consists of parallel continuous two-girder bridges. The observed crack extended from the bottom flange through the web and nearly reached the full height of the girder. Engineers conducted field tests to assess the structure redundancy levels in its damaged state. The structure was determined to have sufficient redundancy to prevent a complete collapse. The repair team adopted a finite element analysis model of the structure to address the situation and avoid a catastrophic failure [
25].
On the other hand, to analyze responses from real-world damaged structures using vibration-based techniques, it is crucial to have powerful signal processing tools to extract subtle changes in the vibration signal to detect damage. While most methods use fast Fourier transformation (FFT) for analyzing vibration characteristics in the frequency domain, it is an inadequate tool to depict the changes in natural frequencies over time, which is fundamental in SHM. However, the continuous wavelet transform (CWT) has become well-liked for its robust signal analysis capabilities, describing frequency content in the time–frequency plane [
26]. In a different study by Cantero et al. [
27], researchers used the modified Littlewood Paley (MPL) basis function in continuous wavelet transform (CWL) to analyze a bridge’s modal properties during vehicle passage. Two case studies on different bridges showed that short-span bridges with a high vehicle–bridge mass ratio experience changes in frequency, damping, and mode shape as the vehicle passes. A further study by Cantero et al. [
28] extended the research, revealing that natural frequencies in various vehicle–bridge systems vary with the vehicle position. They found that the mechanical properties of the vehicle and added mass influenced system frequencies and frequency shifts depending on the vehicle-to-bridge frequency ratio, validated through lab testing of a coupled vehicle–bridge model.
Recently, in 2021, Abedin and Mehrabi [
29] conducted a study on modal analysis, demonstrating its suitability for evaluating the capacity of such bridges to withstand substantial damage while still supporting significant live loads. They analyzed a three-span steel bridge with twin box girders and compared their results to full-scale load test results from a simple span bridge [
30,
31,
32]. Their findings indicated that modal sensitivities can effectively detect anticipated damage in simple and continuous span bridges, especially in cases where the frequency change method may not offer sufficient sensitivity.
Connor et al. [
10] proposed a method for determining the FC status of a steel bridge system based on factors such as loads, material properties, and bridge configurations. Their motivation arose from the fact that existing FC-designated bridges may increase maintenance inspection costs and pose potential structural issues. They could reduce or eliminate their concerns by re-evaluating the FC designation and reclassifying bridges. They felt justified in assessing the consequences of assuming a member failure rather than simply considering the number of girders.
However, the public may not notice significant damage in large structures during standard inspection periods. Consequently, bridges of this nature require affordable and accurate damage detection methods to detect damage early between inspection periods. Regrettably, insufficient studies specifically focus on multi-span box girder highway bridges. In light of this gap, the research presented in this paper serves as a benchmark, aiming to assess the performance of a seven-span box girder bridge, the Szapáry Bridge, and evaluate its sensitivity to various damage scenarios at critical locations. The study examines a series of static and dynamic load field tests and ambient vibration tests performed on the bridge before the opening to service. It validates the FE model to verify the bridge’s structural behavior. For the latter, a series of analytical tests have been conducted on the detailed FE model to detect the bridge sensitivity to damage and its relative effect on bridge performance based on the resulting changes in bridge modal parameters. The analysis also provides engineers with a solid benchmarked methodology to increase the effectiveness and efficiency of inspection for steel bridges.
2. Background of Project
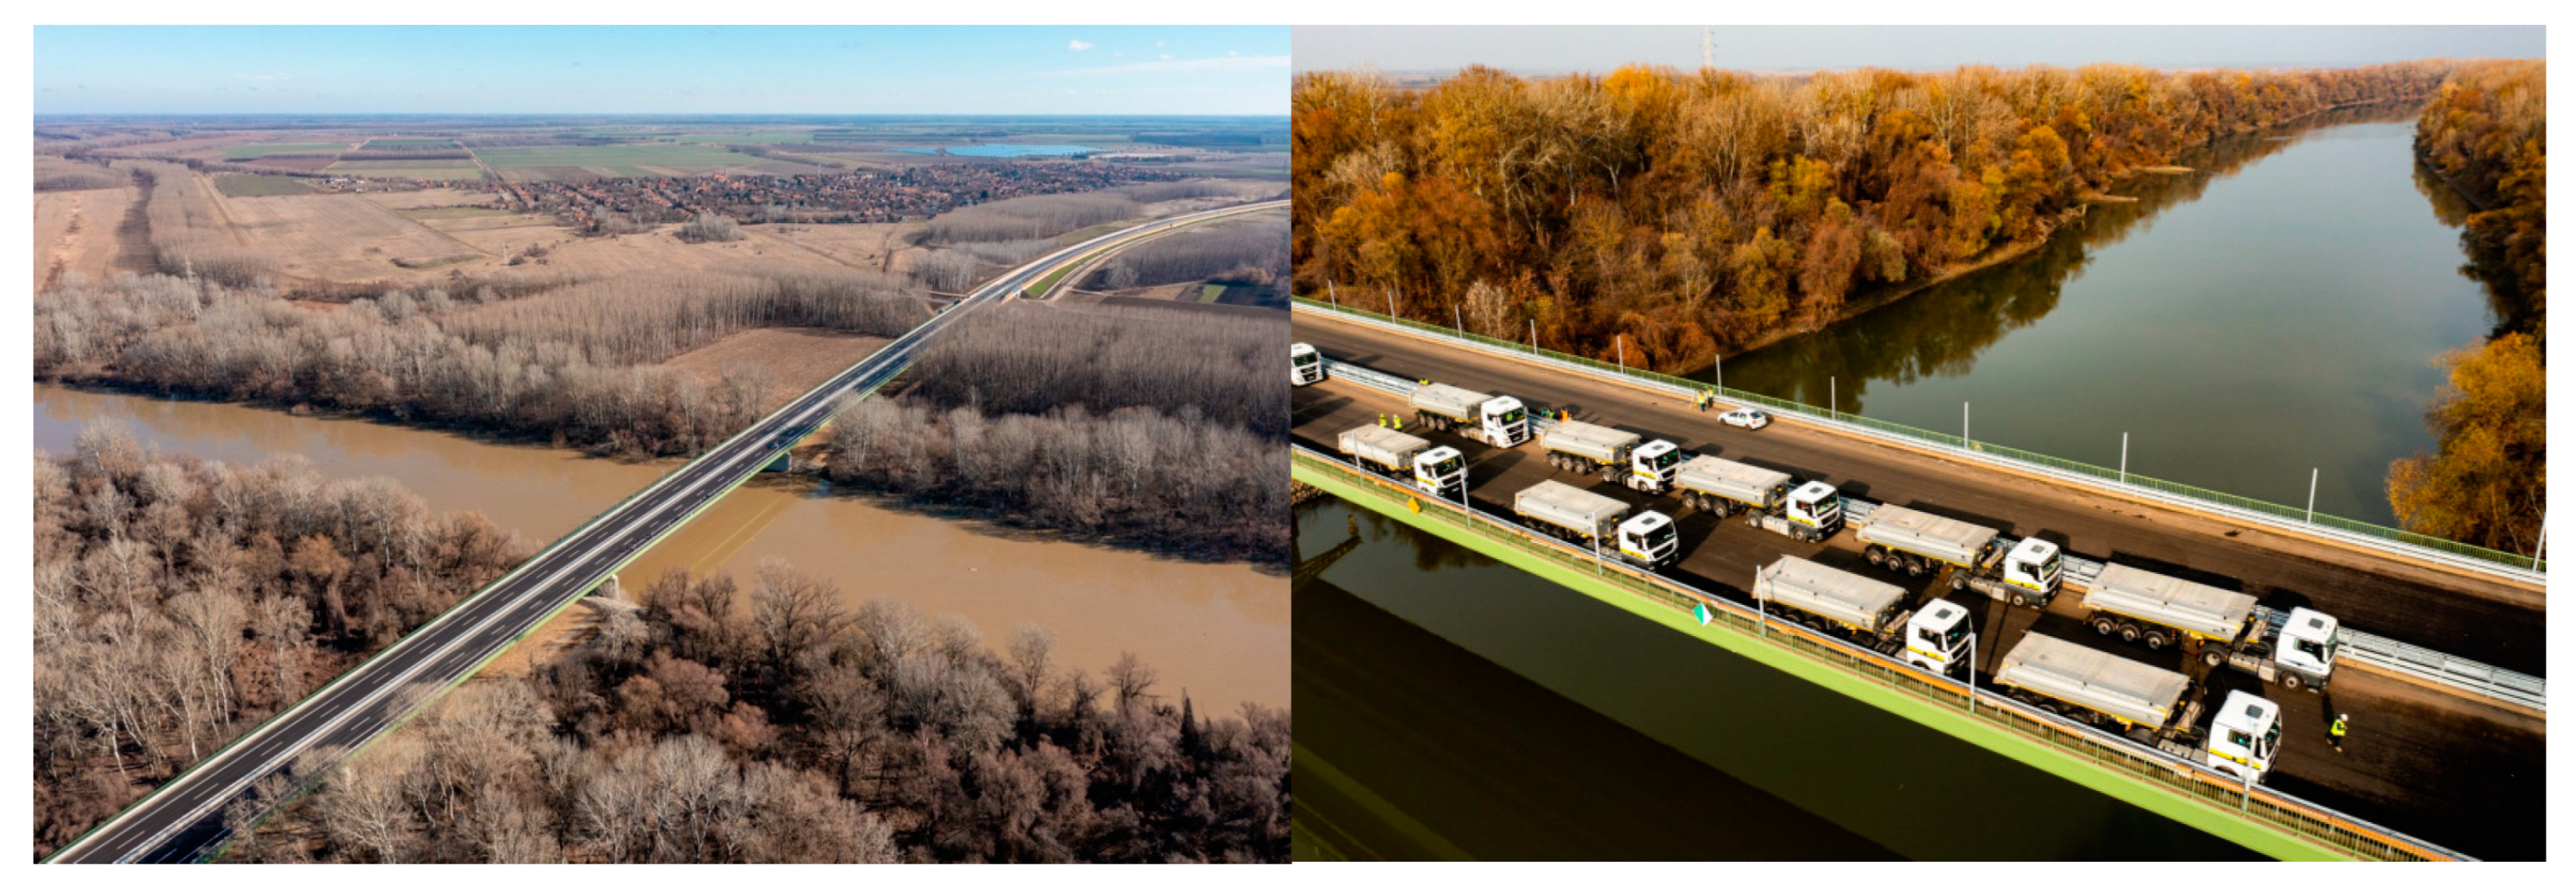
The Szapáry Bridge is a newly built bridge that crosses the Tisza River in East-Central Hungary (
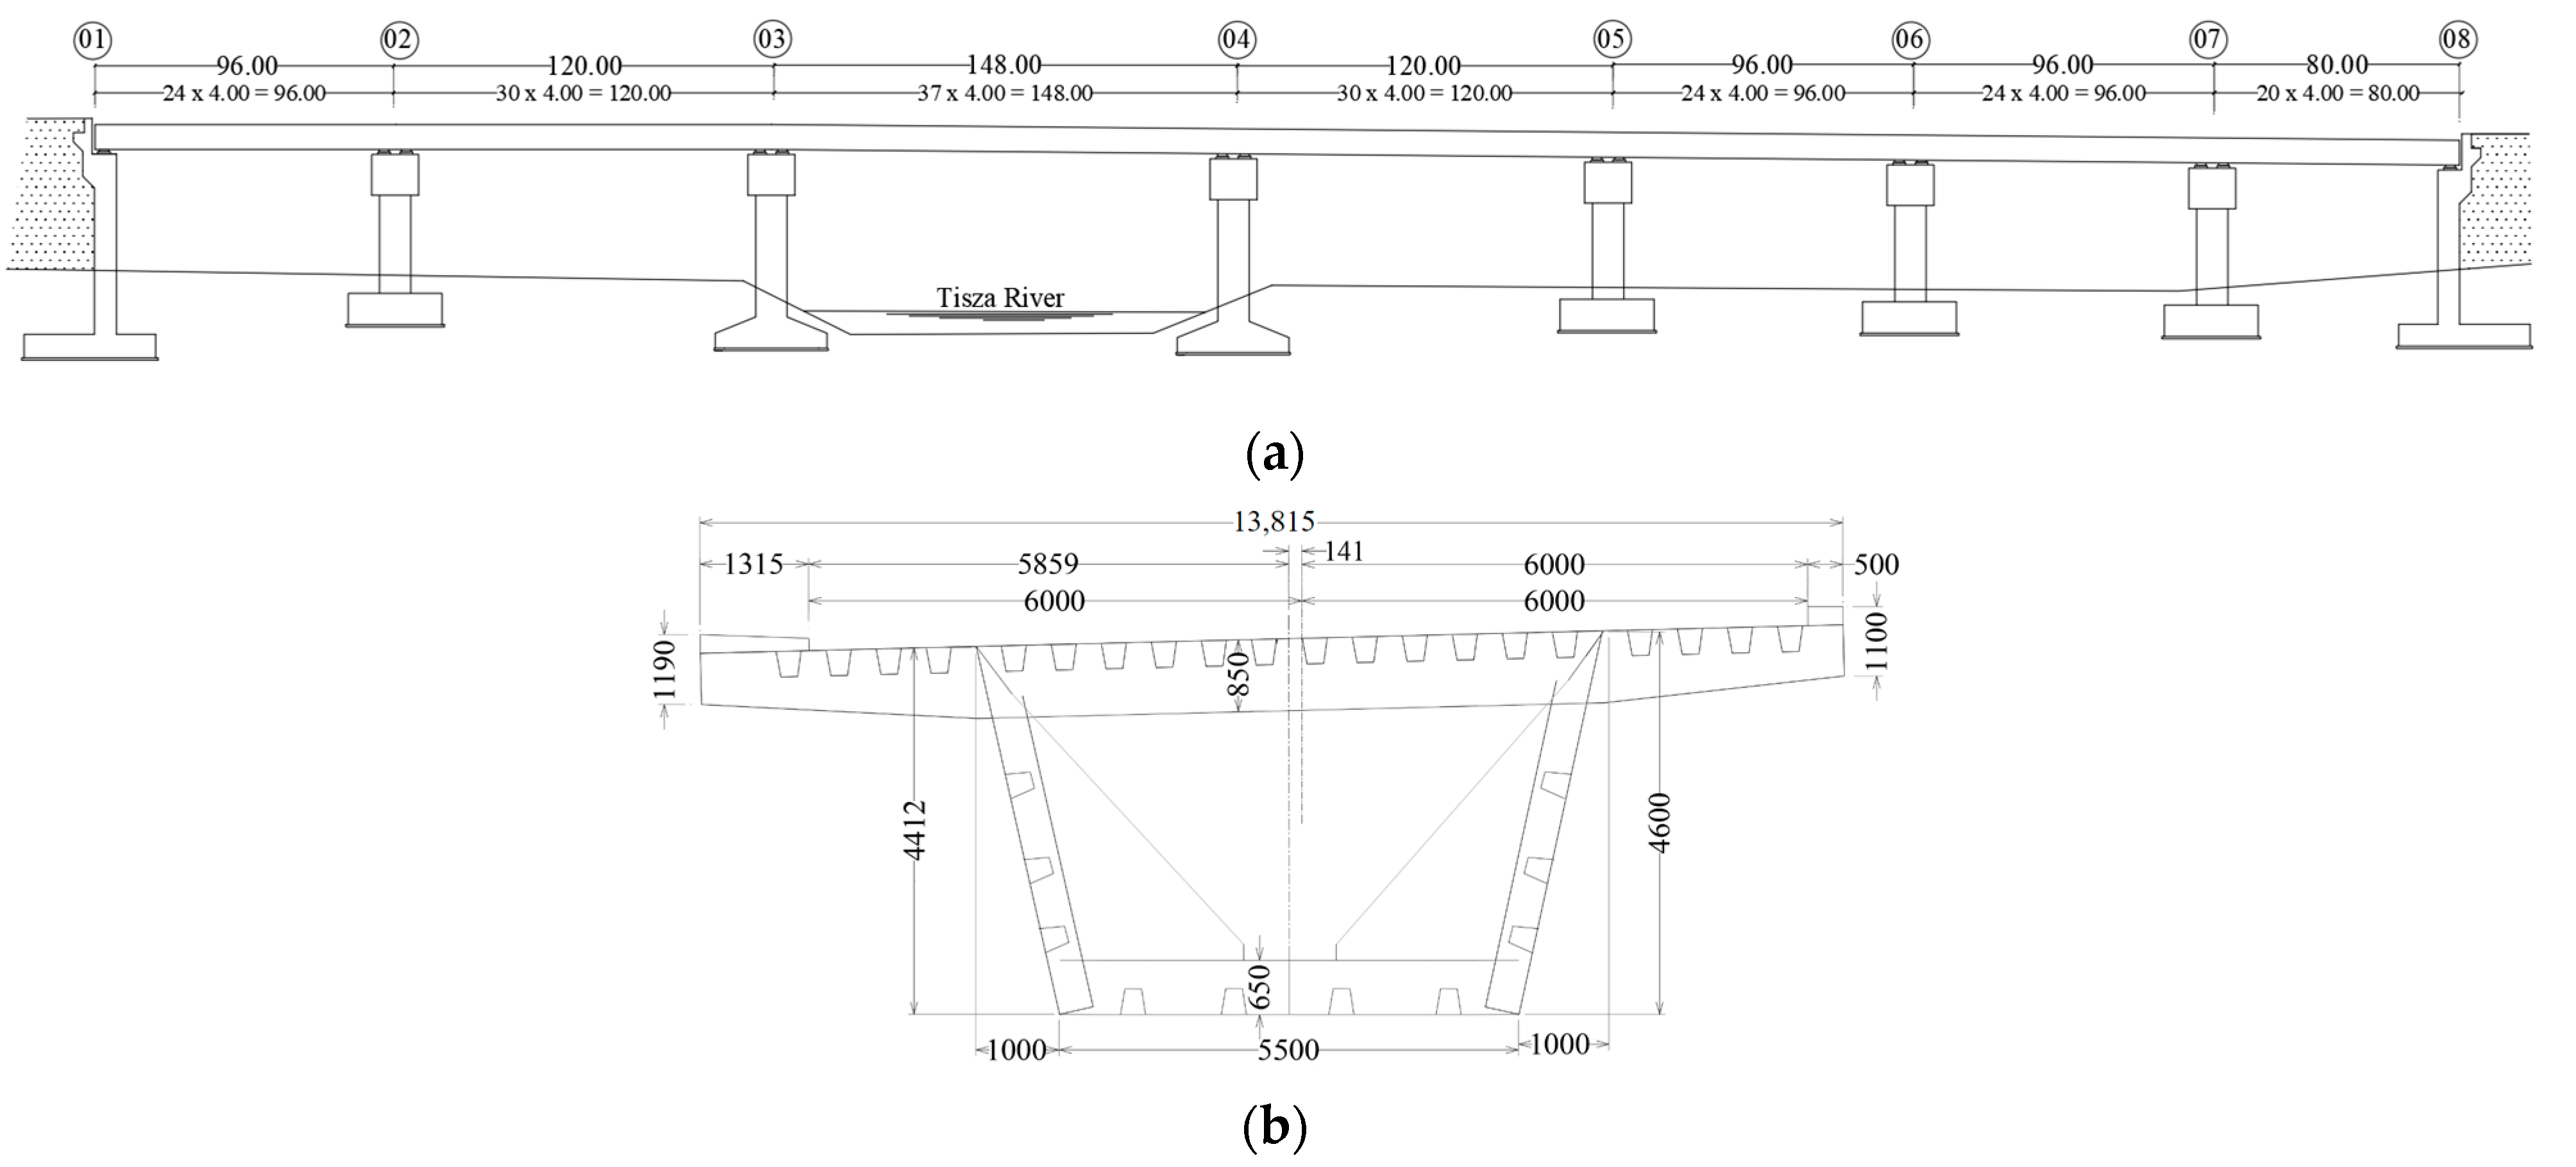
Figure 1). This bridge, completed in 2021, measures 756 m long and is supported on seven spans. It stands as an exemplar of continuous steel box girder bridges. The bridge design incorporates two independent parallel decks, each 13.815 m wide and carrying two traffic lanes. A single box girder supports a single deck (
Figure 2). Both decks have unequal continuous spans, with lengths totaling (96 + 120 + 148 + 120 + 96 + 96 + 96 + 96 + 80) m. The bridge’s superstructure includes a plate slab deck, intermediate diaphragms, and horizontal and vertical bracing elements, all contributing to its overall stability. Pile foundations support the bridge pillars, which act independently except at the river crossing and end abutments. Contractors built the bridge deck using prefabricated welded girders comprising 189 segments, each measuring 4 m long. As illustrated in
Figure 2b, the trapezoidal box girder has a height of 4.60 m on the right side (centerline), gradually decreasing to 4.412 m on the left side. S355 steel with a density of 76.9 kN/m
3 provided the base material for fabrication.
Dynamic testing of the bridge established baseline characteristics such as natural frequencies, displacements, and stress levels. This initial assessment provides a vital reference for future dynamic evaluations and long-term monitoring, enabling ongoing analysis of the Szapáry Bridge dynamic changes over time. The collected data will contribute to a thorough structural identification of the bridge, facilitating informed maintenance and management strategies based on real-time structural dynamics.
3. Ambient Vibration Test
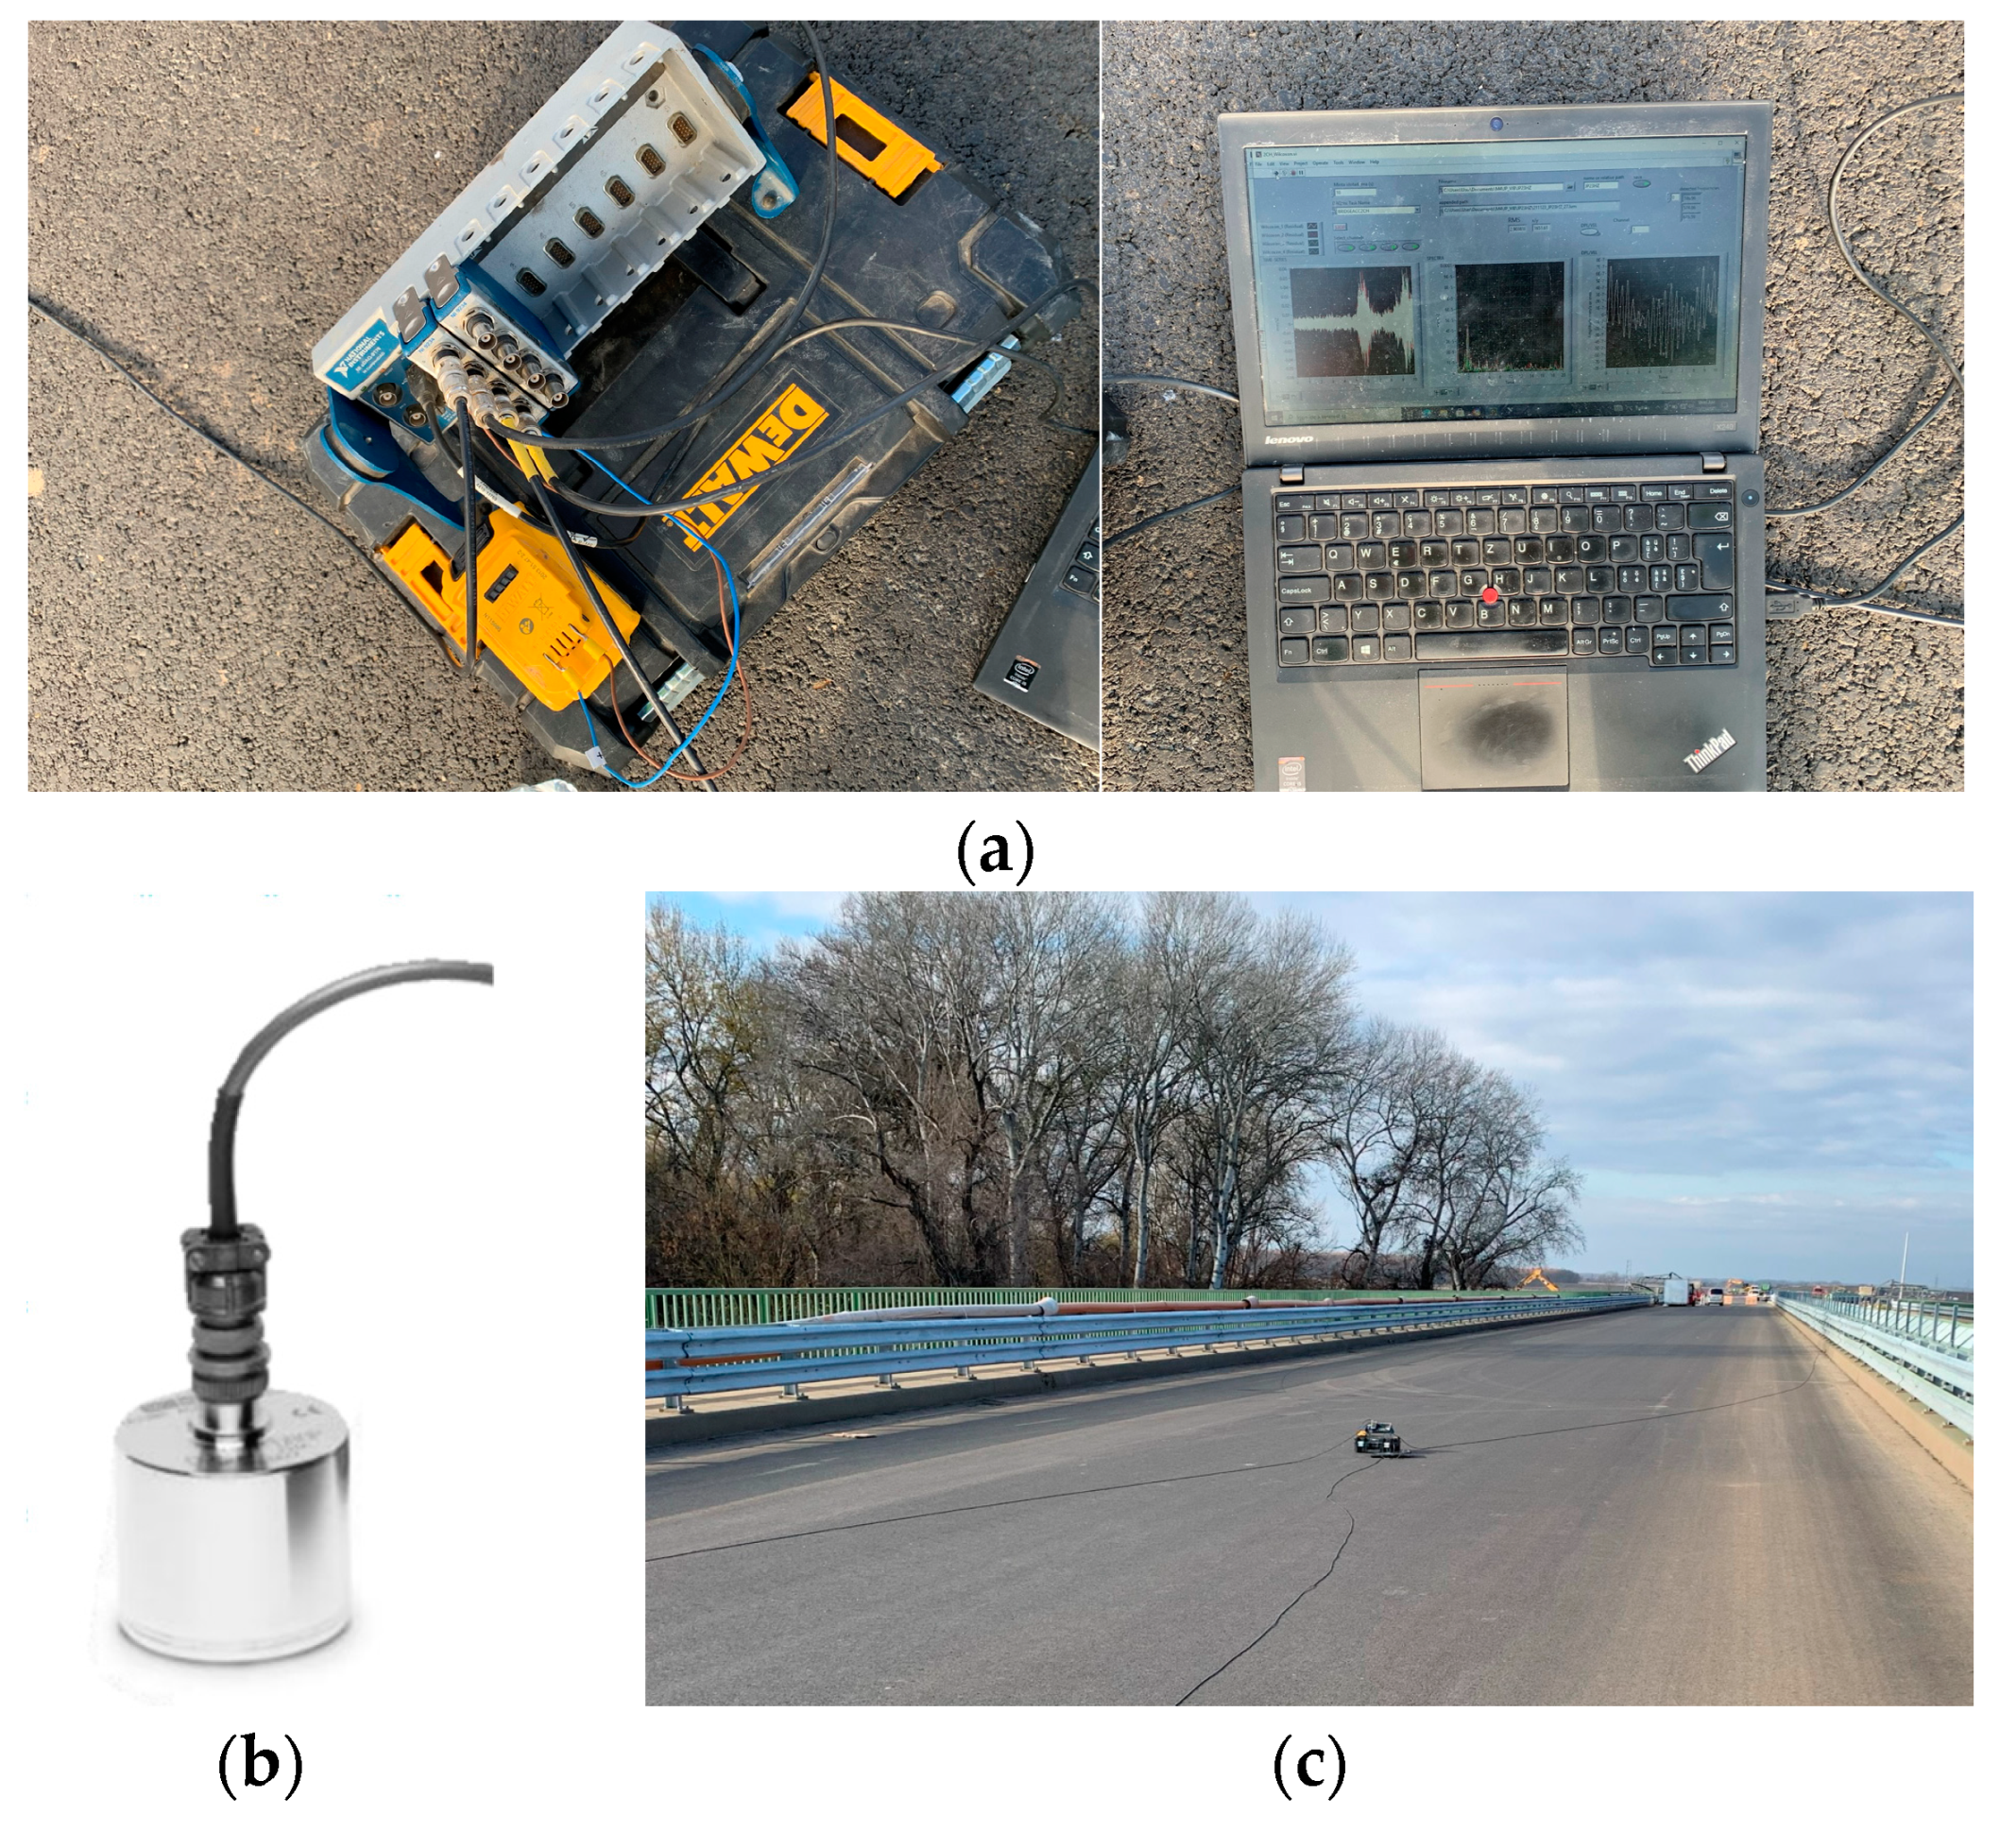
The natural vibrations of the newly built seven-span continuous bridge were captured on the eastbound lane using wired piezoelectric accelerometers IEPE type (
Figure 3b) for bridge health monitoring and validating the finite element model of the bridge. For this purpose, four piezoelectric accelerometers per setup were connected to the data acquisition system (DAQ) center using coaxial cables (
Figure 3c) and moved on the spans without traffic loading on the bridge under ambient vibrations. The dynamic–static signal acquisition instruments are illustrated in
Figure 3a. Magnetic mounting stands held the sensors along the edge of the roadway at the center span of the adjacent spans. Sensors were measured simultaneously, first vertically and then horizontally on the edges. The sensor arrangements used in each measurement setup on the bridge deck appear in the schematic sketch in
Figure 4. Each color represents one measurement setup of four accelerometers.
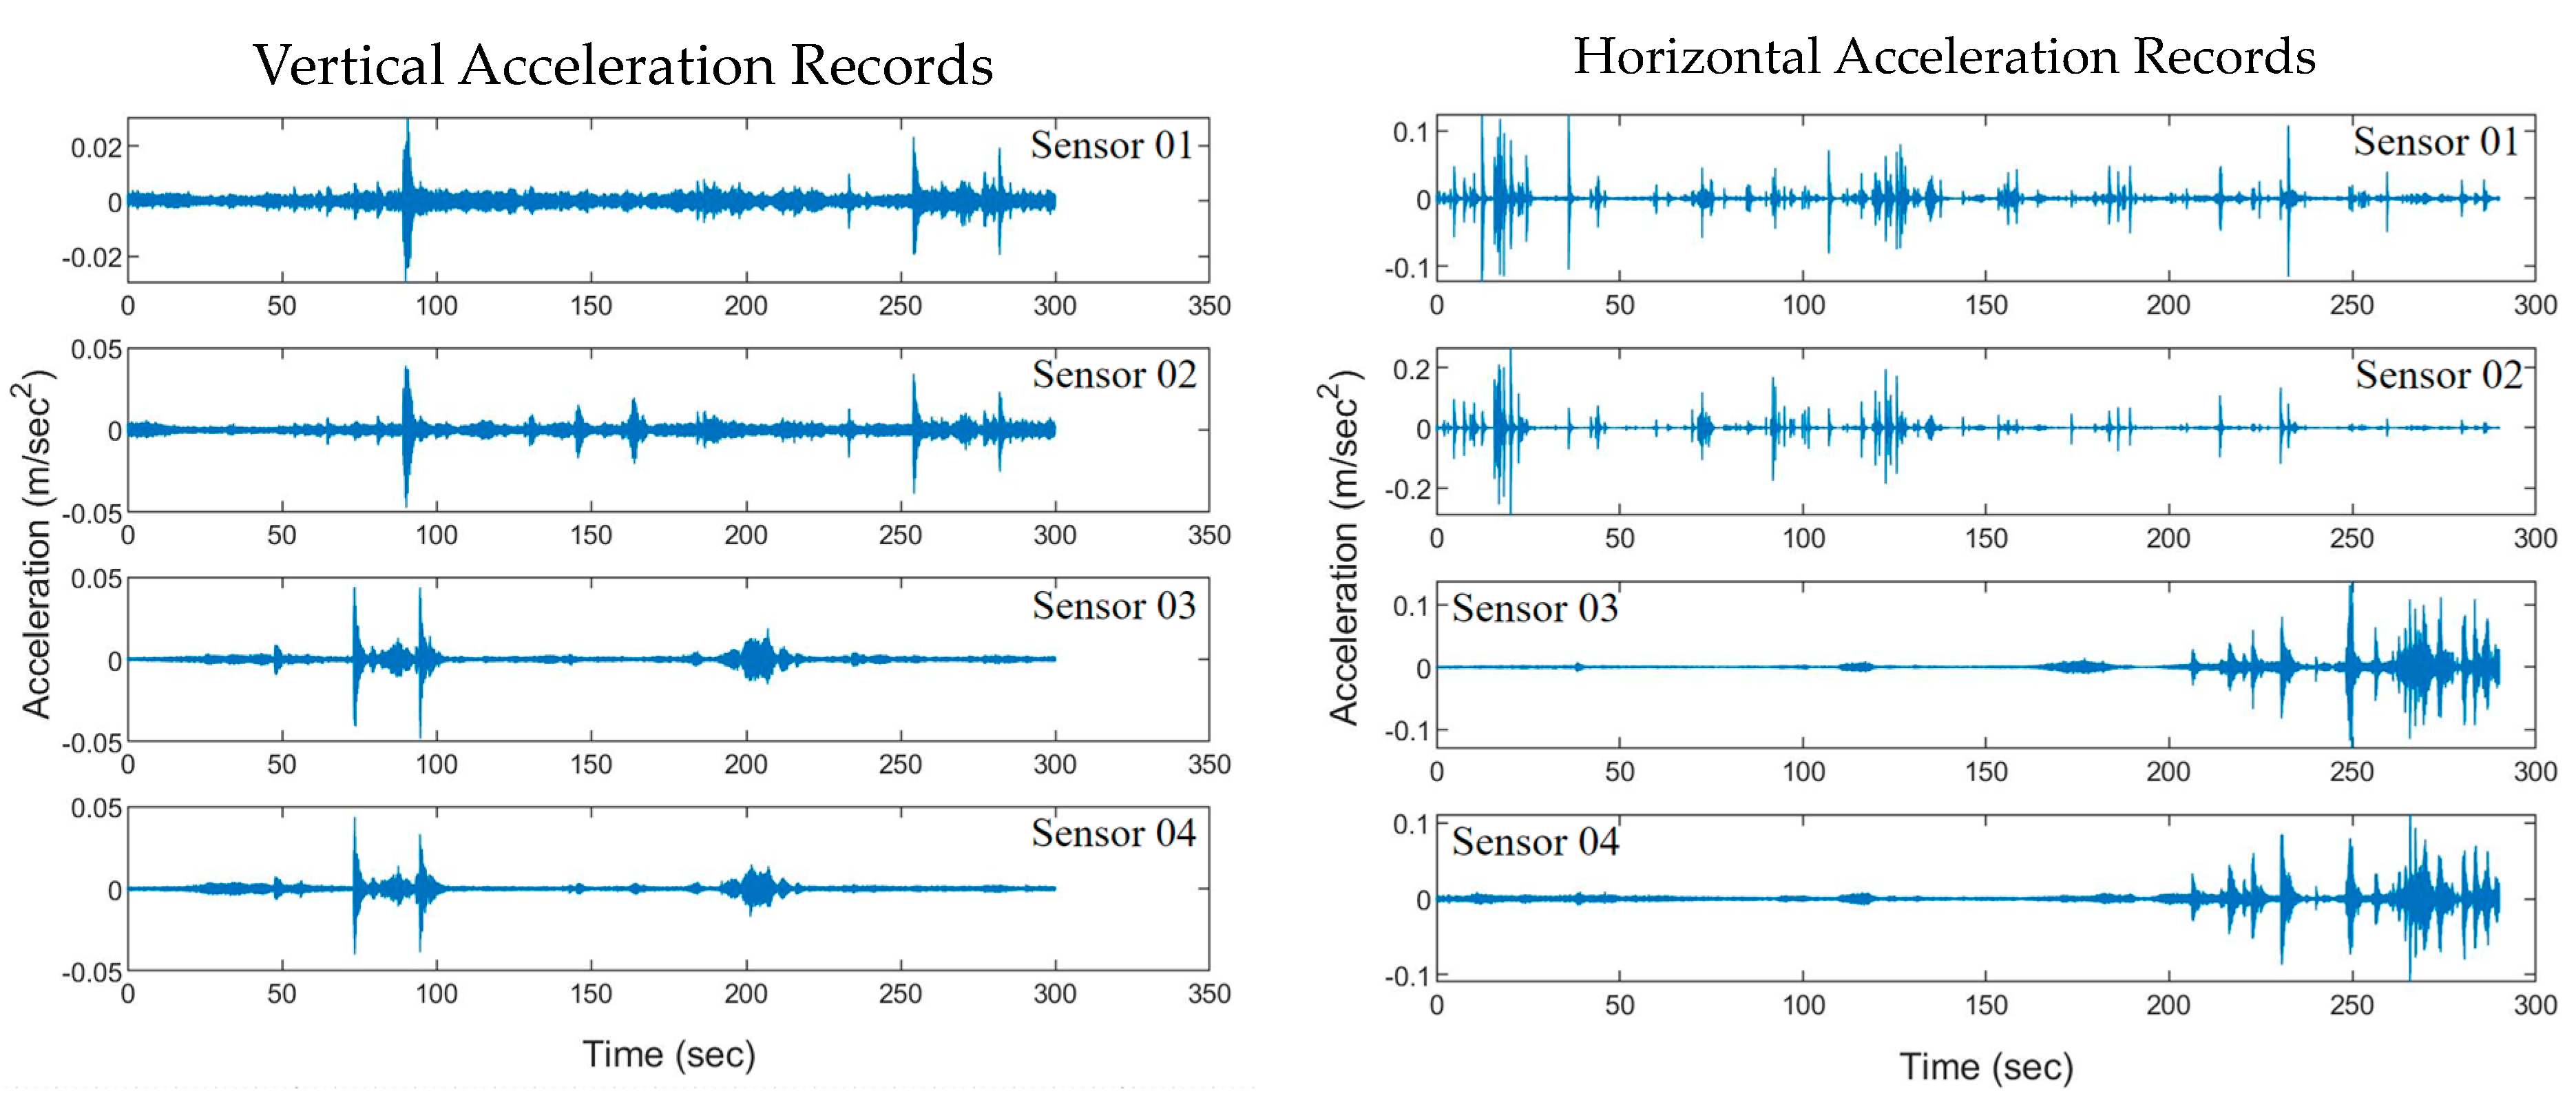
The data acquisition system measured acceleration data using at least 30 individual 10 s windows in each position. The system filtered input signals using a digital 0.1 Hz high-pass filter to eliminate the effects of environmental noise.
Figure 5 presents an example of recorded data from the longest span (Setup 3).
The frequency domain decomposition method (FDD) [
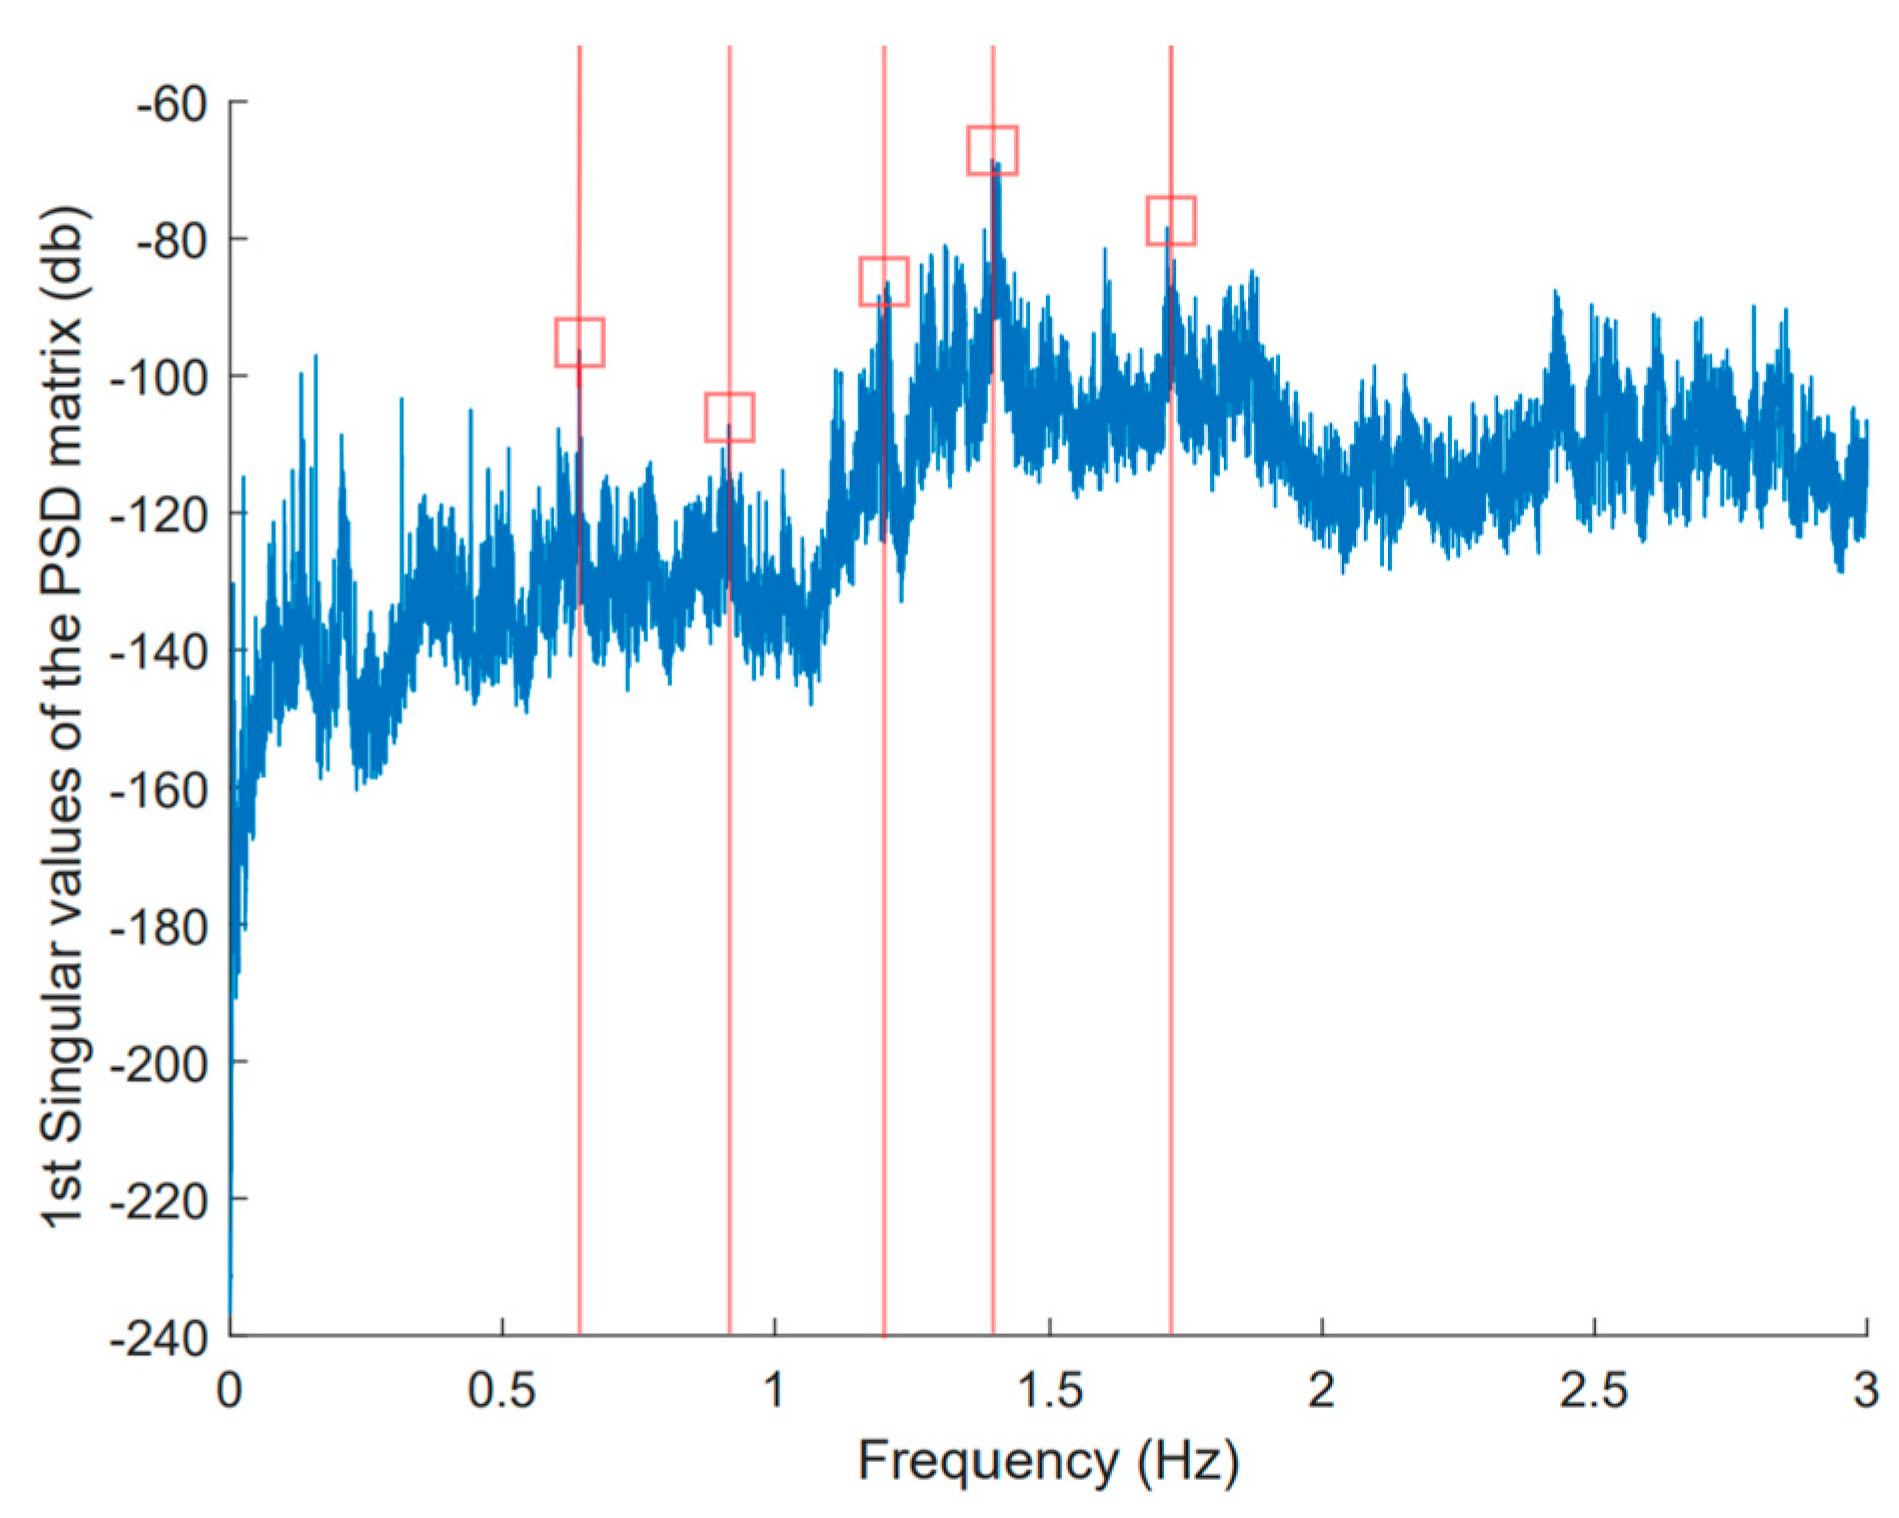
33] identified the structural modal parameters of the bridge. From the filtered data, the singular decomposition curves of the acceleration response power spectra for the intact seven-span bridge appear in
Figure 6. The analysis identified singular maximum peak points representing the corresponding modal frequencies of the bridge as 0.64, 0.91,1.21,1.40, and 1.71 Hz.
Detecting damage within large-scale bridges poses a challenging task due to the huge amount of collected data and the severe noise levels in the data. Nevertheless, the application of wavelet transform (WT) has proven a successful tool in signal processing and structural health monitoring (SHM) of large bridges [
26].
The extensively collected nonstationary signals underwent analysis using continuous wavelet transform (CWT) to establish a benchmark for the healthy status of the seven-span bridge. Initially, the random decrement method (RDT) was employed to convert the filtered signals into decay functions. The RDT proved to effectively and accurately estimate dynamic parameters within the correlation function identification system [
34]. The resultant decayed signal, generated for the longest span (Setup 3) when the bridge was in a healthy state, is illustrated in
Figure 7. The random decrement method was applied with sub-segments of 20 s to facilitate the decay of the nonstationary signal.
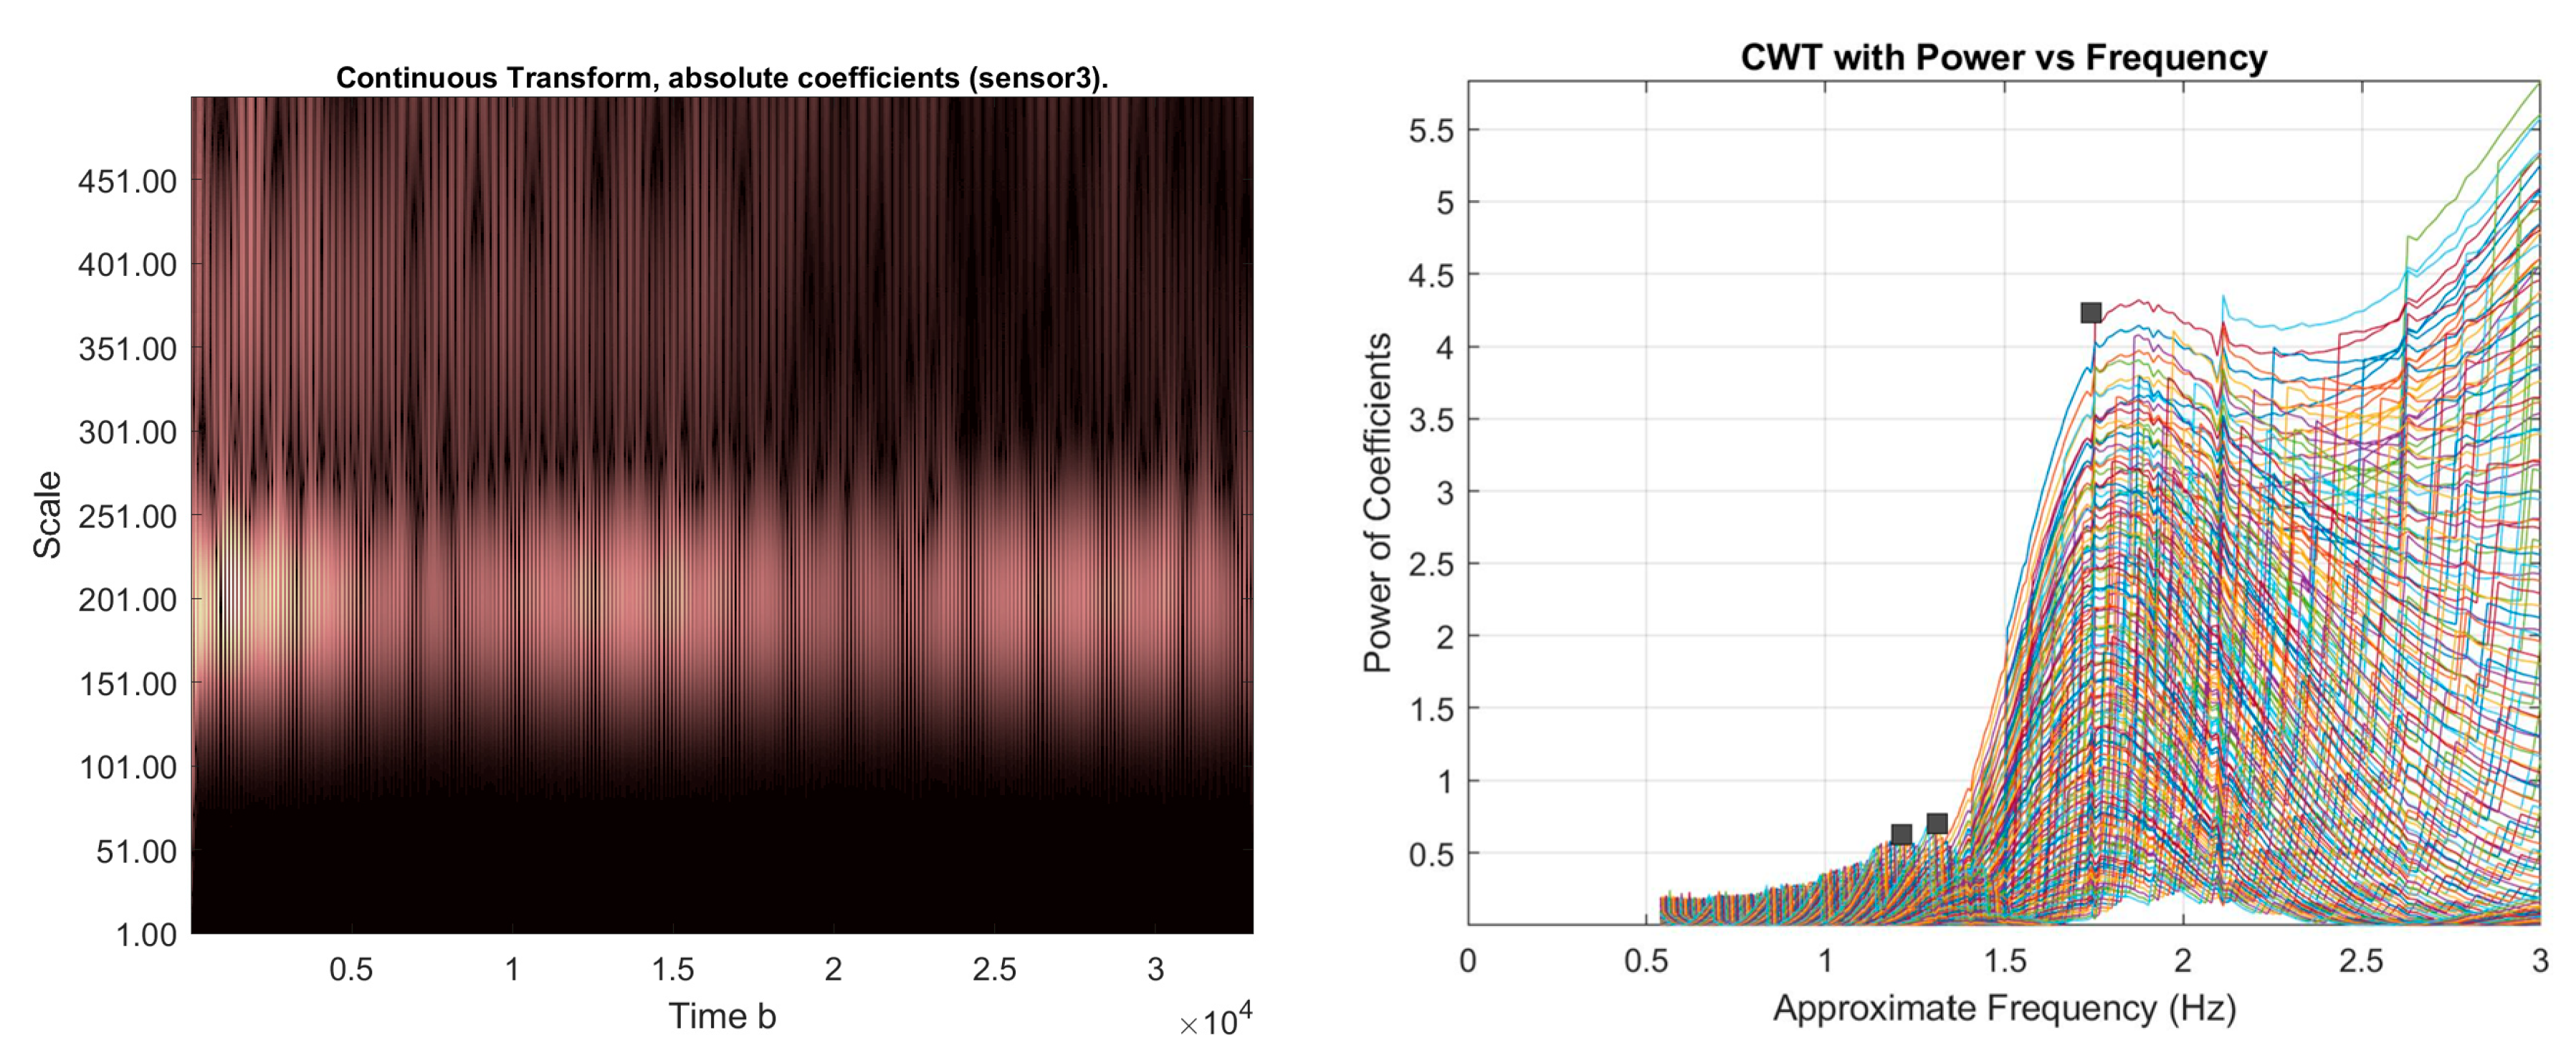
Figure 8 shows the time–frequency distribution of wavelet transform coefficients derived from the decay acceleration signal of the No. 3 sensor in the longest span in the Szapary bridge (
Figure 7), utilizing CWT with the Morlet mother wavelet. The color intensities in the figure represent variations in the amplitude of wavelet coefficients across both time and scale. Within the figure, the highest brightness corresponds to the maximum value of the wavelet transform modulus. The wavelet transform modulus varies across sensor locations for the multi-span bridge. The frequency spectrum obtained from the third sensor using CWT clearly shows the three modal frequencies between 1.30 Hz and 1.72 Hz, which agreed with the values obtained by FDD.
The 2D scalograms presented in
Figure 8 reveal distinct ridges in various scale ranges for each sensor location. According to Melhem and Kim [
35], damage induced decreases in natural frequencies and increases in clear ridges. Therefore, establishing a database for each sensor configuration in the multi-span bridge is crucial for precise monitoring of future changes and potential occurrences of damage.
5. Dynamic Characteristics in Response to Damage Scenarios
The above sections present the effectiveness of the generalized damage detection methods. In the event of damage, however, “Can the bridge adequately support its weight and expected live load?” remains the critical question. So, this study analyzed the bridge behavior following various damage scenarios on a single girder, specifically under moving truck loading. Vehicle load excitation produced a higher signal-to-noise ratio than ambient excitation, providing a more explicit response to local damage [
22]. Some studies showed that simple span bridges face more significant challenges and have more critical behavior than continuous span bridges due to their lack of girder continuity when damaged [
29,
38].
For the analysis, the validated finite element model simulating the seven-span box steel bridge was used to investigate the bridge’s dynamic behavior after damage. The analysis considered three different damage scenarios according to the characteristics of the bridge (
Figure 11): damage 1 (DMG1): fracture of the bottom flange, damage 2 (DMG2): fracture of the bottom flange and partial web, and damage 3 (DMG3): fracture of bottom flange and entire web.
Fatigue cracks in steel bridges often occur at welded connections due to local stress concentrations and cyclic stresses induced by traffic loads [
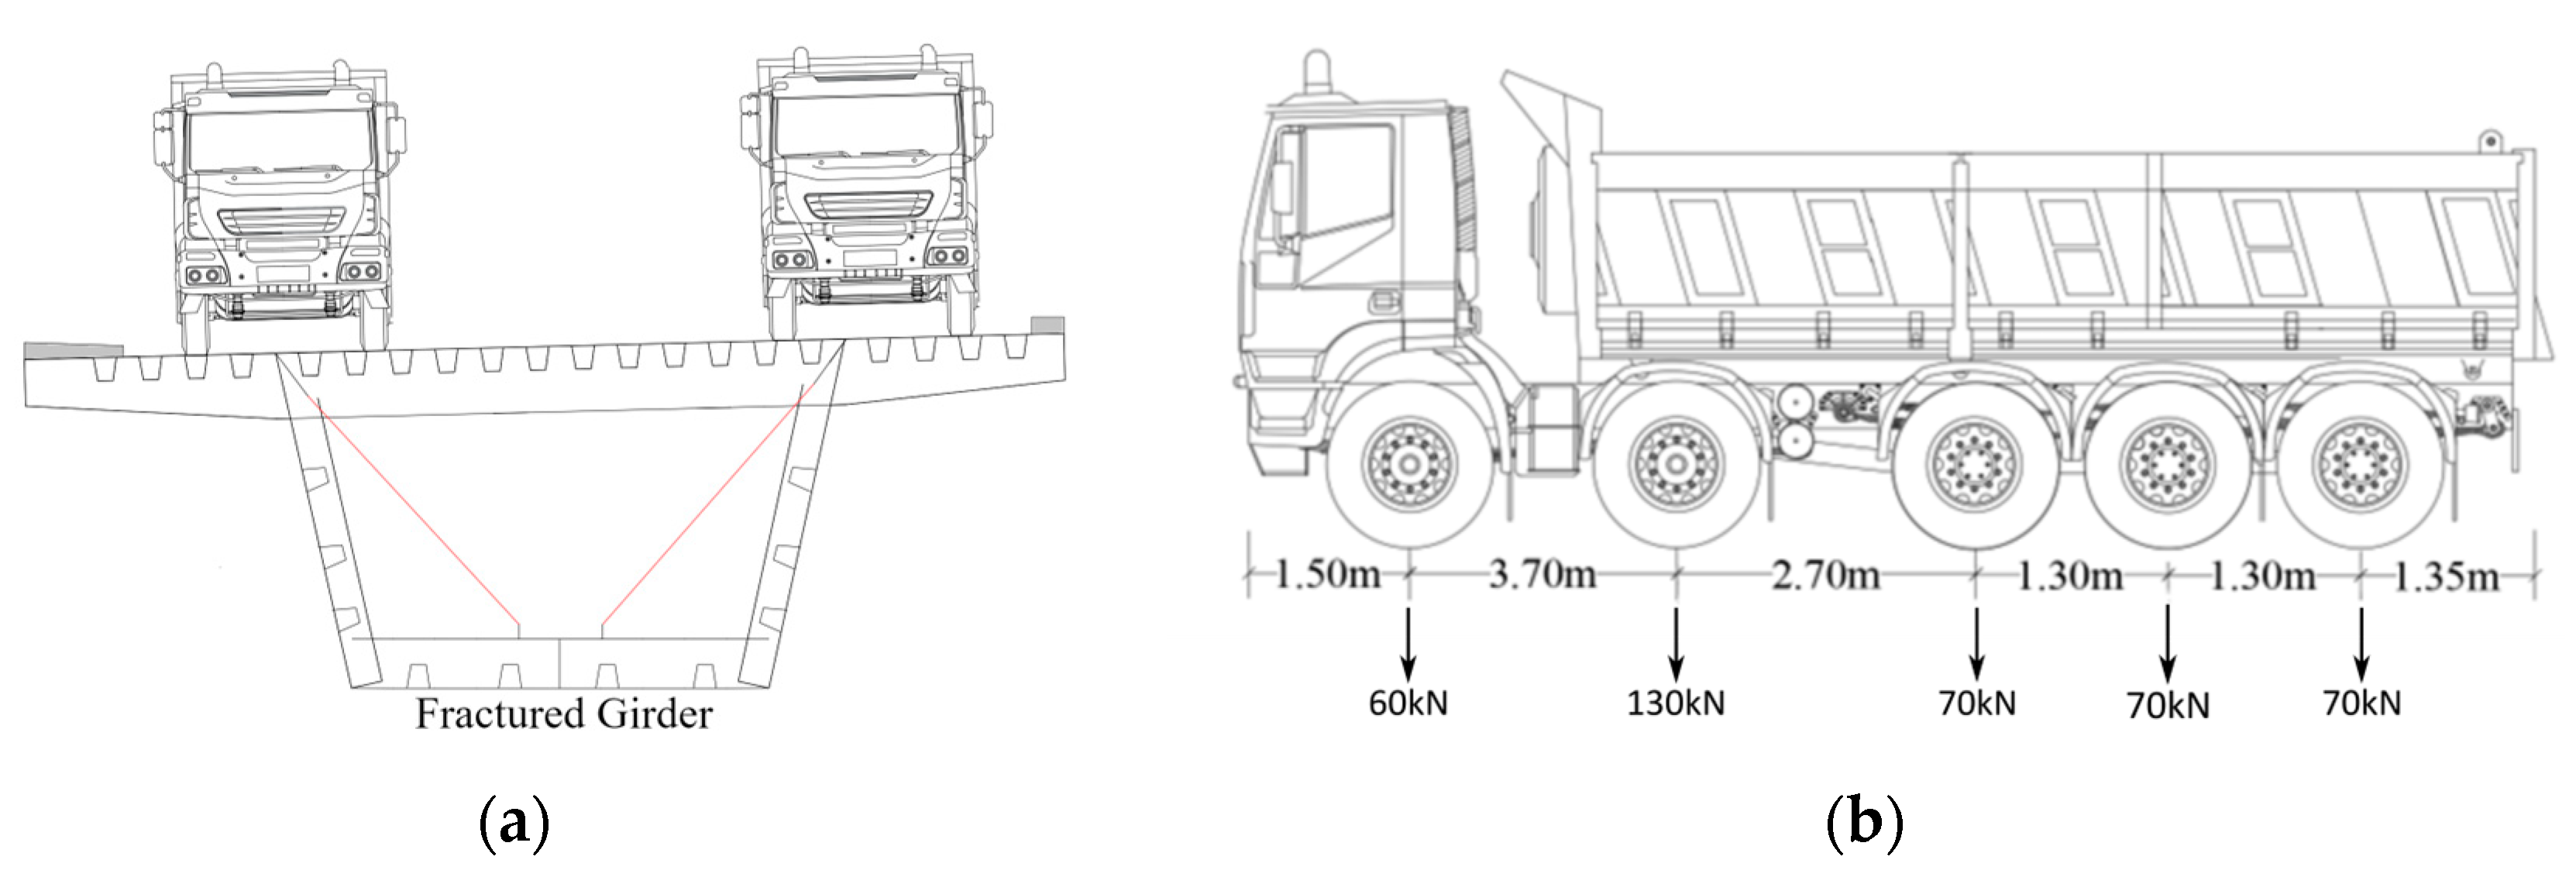
39]. Welded sections, connecting beams, and plate elements were removed to model girder fracture in finite element (FE) simulations. In DMG1, representing minor bridge damage, the bottom flange plate section connected to the intermediate bracing element at the span’s midpoint was removed. In DMG2, where half of the girder was fractured, the removed section from DMG1 extended up to the middle height of the web. This scenario mimicked bridge behavior prior to full girder fracture. DMG3 represented the worst damage scenario. Here, a similar procedure to DMG2 was followed, with the entire section connecting the web plate to the bracing element removed from one girder at the midpoint of each span because this location represented the maximum positive bending moment caused by a moving truck on a simple supported bridge. The two side-by-side moving trucks (
Figure 12a) apply 2 × 400 kN loads (
Figure 12b) as they move the entire length of the bridge over the damaged sections at a speed of 90 km/h.
This study selected bridge modal frequency and mode shapes as the sensitivity modal indexes. The damage scenarios were applied to the FEM for each case separately. The analysis extracted frequency and modes for each case, then post-analysis sorted the sensitivity of the selected parameters and compared them to the multi-span bridge undamaged condition.
5.1. FEA for Evaluating Bridge Dynamic Characteristic Sensitivity: Frequency
Dynamic analysis results correspond to the three damage scenarios of the analytical model, presented in
Figure 13. The analytical results provided in this section will focus on only the steel box girder frequency changes. Results compare the first five bridge frequencies in undamaged and damaged conditions in each span. Modes 1 and 5 correspond to horizontal bridge bending, and Modes 2–4 are related to vertical bending. It is important to note that the damage locations reported here are applied to each mid-span girder separately.
5.1.1. Frequency Sensitivity to DMG 1: Bottom Flange Fracture
The first damage simulation mimics the failure of the girder’s bottom flange by fracturing. It is worth noting that standard design practice considers the bottom flange a fracture-critical member of the girder bridge system. The minor damage was simulated by completely removing the bottom flange of the steel girder connected to the bracing at the middle of the span along its width and through its depth, as presented in
Figure 13.
Table 2 compares the first five bridge frequencies due to the DMG 1 of the girder in each span with the undamaged condition. The results show that minor damage to the structural system has a negligible effect on the bridge’s dynamic response. In this case, the bottom flange fracture at mid-span has a maximum decrease in the vertical bending frequency (Mode 3) of 3.05% and the horizontal bending frequency (Mode 5) by only 0.62%, as shown in
Table 3.
5.1.2. Frequency Sensitivity to DMG 2: Bottom Flange and Partial Web Fracture
The second bridge analysis investigated whether the continuous seven-span bridge could sustain a simulated dynamic loading following a nearly full-depth fracture of the girder. For the analysis setup, the fracture from the first bridge test (DMG 1) extended up to the middle height of the web.
Comparison results in
Table 4 reveal that the girder’s bottom flange and partial web fracture could change the bridge’s natural frequencies. The vertical bending frequencies decreased after such damage due to a noticeable change in the bridge stiffness. According to frequency changes in
Table 5, the second bending mode decreased by 5.49%, the third mode by 6.11%, and the fourth mode by 3.92% after the girder fracture. Horizontal modes changed only slightly, up to 1.23%.
5.1.3. Frequency Sensitivity to DMG3: Bottom Flange and Full Web Fracture
The third analysis determined the bridge’s behavior in a seriously damaged state. The web crack from DMG2 extended to the full height of the web. Accordingly, the rigid links no longer connected elements to the top flange for the third bridge test simulation.
Comparing the results in
Table 6, the full fracture of the girder could significantly change the natural frequencies. The FE results indicate that vertical bending frequencies decreased significantly by about 23%, 16%, and 7%, respectively. Horizontal modes exhibited a maximum decrease of about 2.5% (Mode 5), as shown in
Table 7.
Table 3,
Table 4,
Table 5,
Table 6 and
Table 7 above compare the modal frequencies between the undamaged model and the three damage scenarios of the target bridge. The results indicate a different pattern in the frequency changes for each damage scenario. Comparing the degree of change in the corresponding bridge frequencies can identify the severity of the girder damage. For example, the frequency changes in vertical bending modes (Modes 2–4) after DMG2 in Span 01 equals about half that due to DMG3. The frequency changes in Span 02 and 06 from DMG1 equal half that from DMG2.
Horizontal bending (Modes 1 and 5) frequencies show no change due to damage. While they do not exhibit any changes under the applied loads, higher modes (not presented) revealed damage.
5.2. Modal Sensitivity to DMG 1–3
Changes in mode shape present an alternative for damage detection by overcoming the low-sensitivity problem from the frequency approach. Mode shapes are considerably more sensitive to local damage when compared to natural frequencies. Using the previous damage scenarios, FEA produced mode shapes that revealed damaged locations. Mode shapes from damage scenarios exhibited notable differences compared to the undamaged shapes.
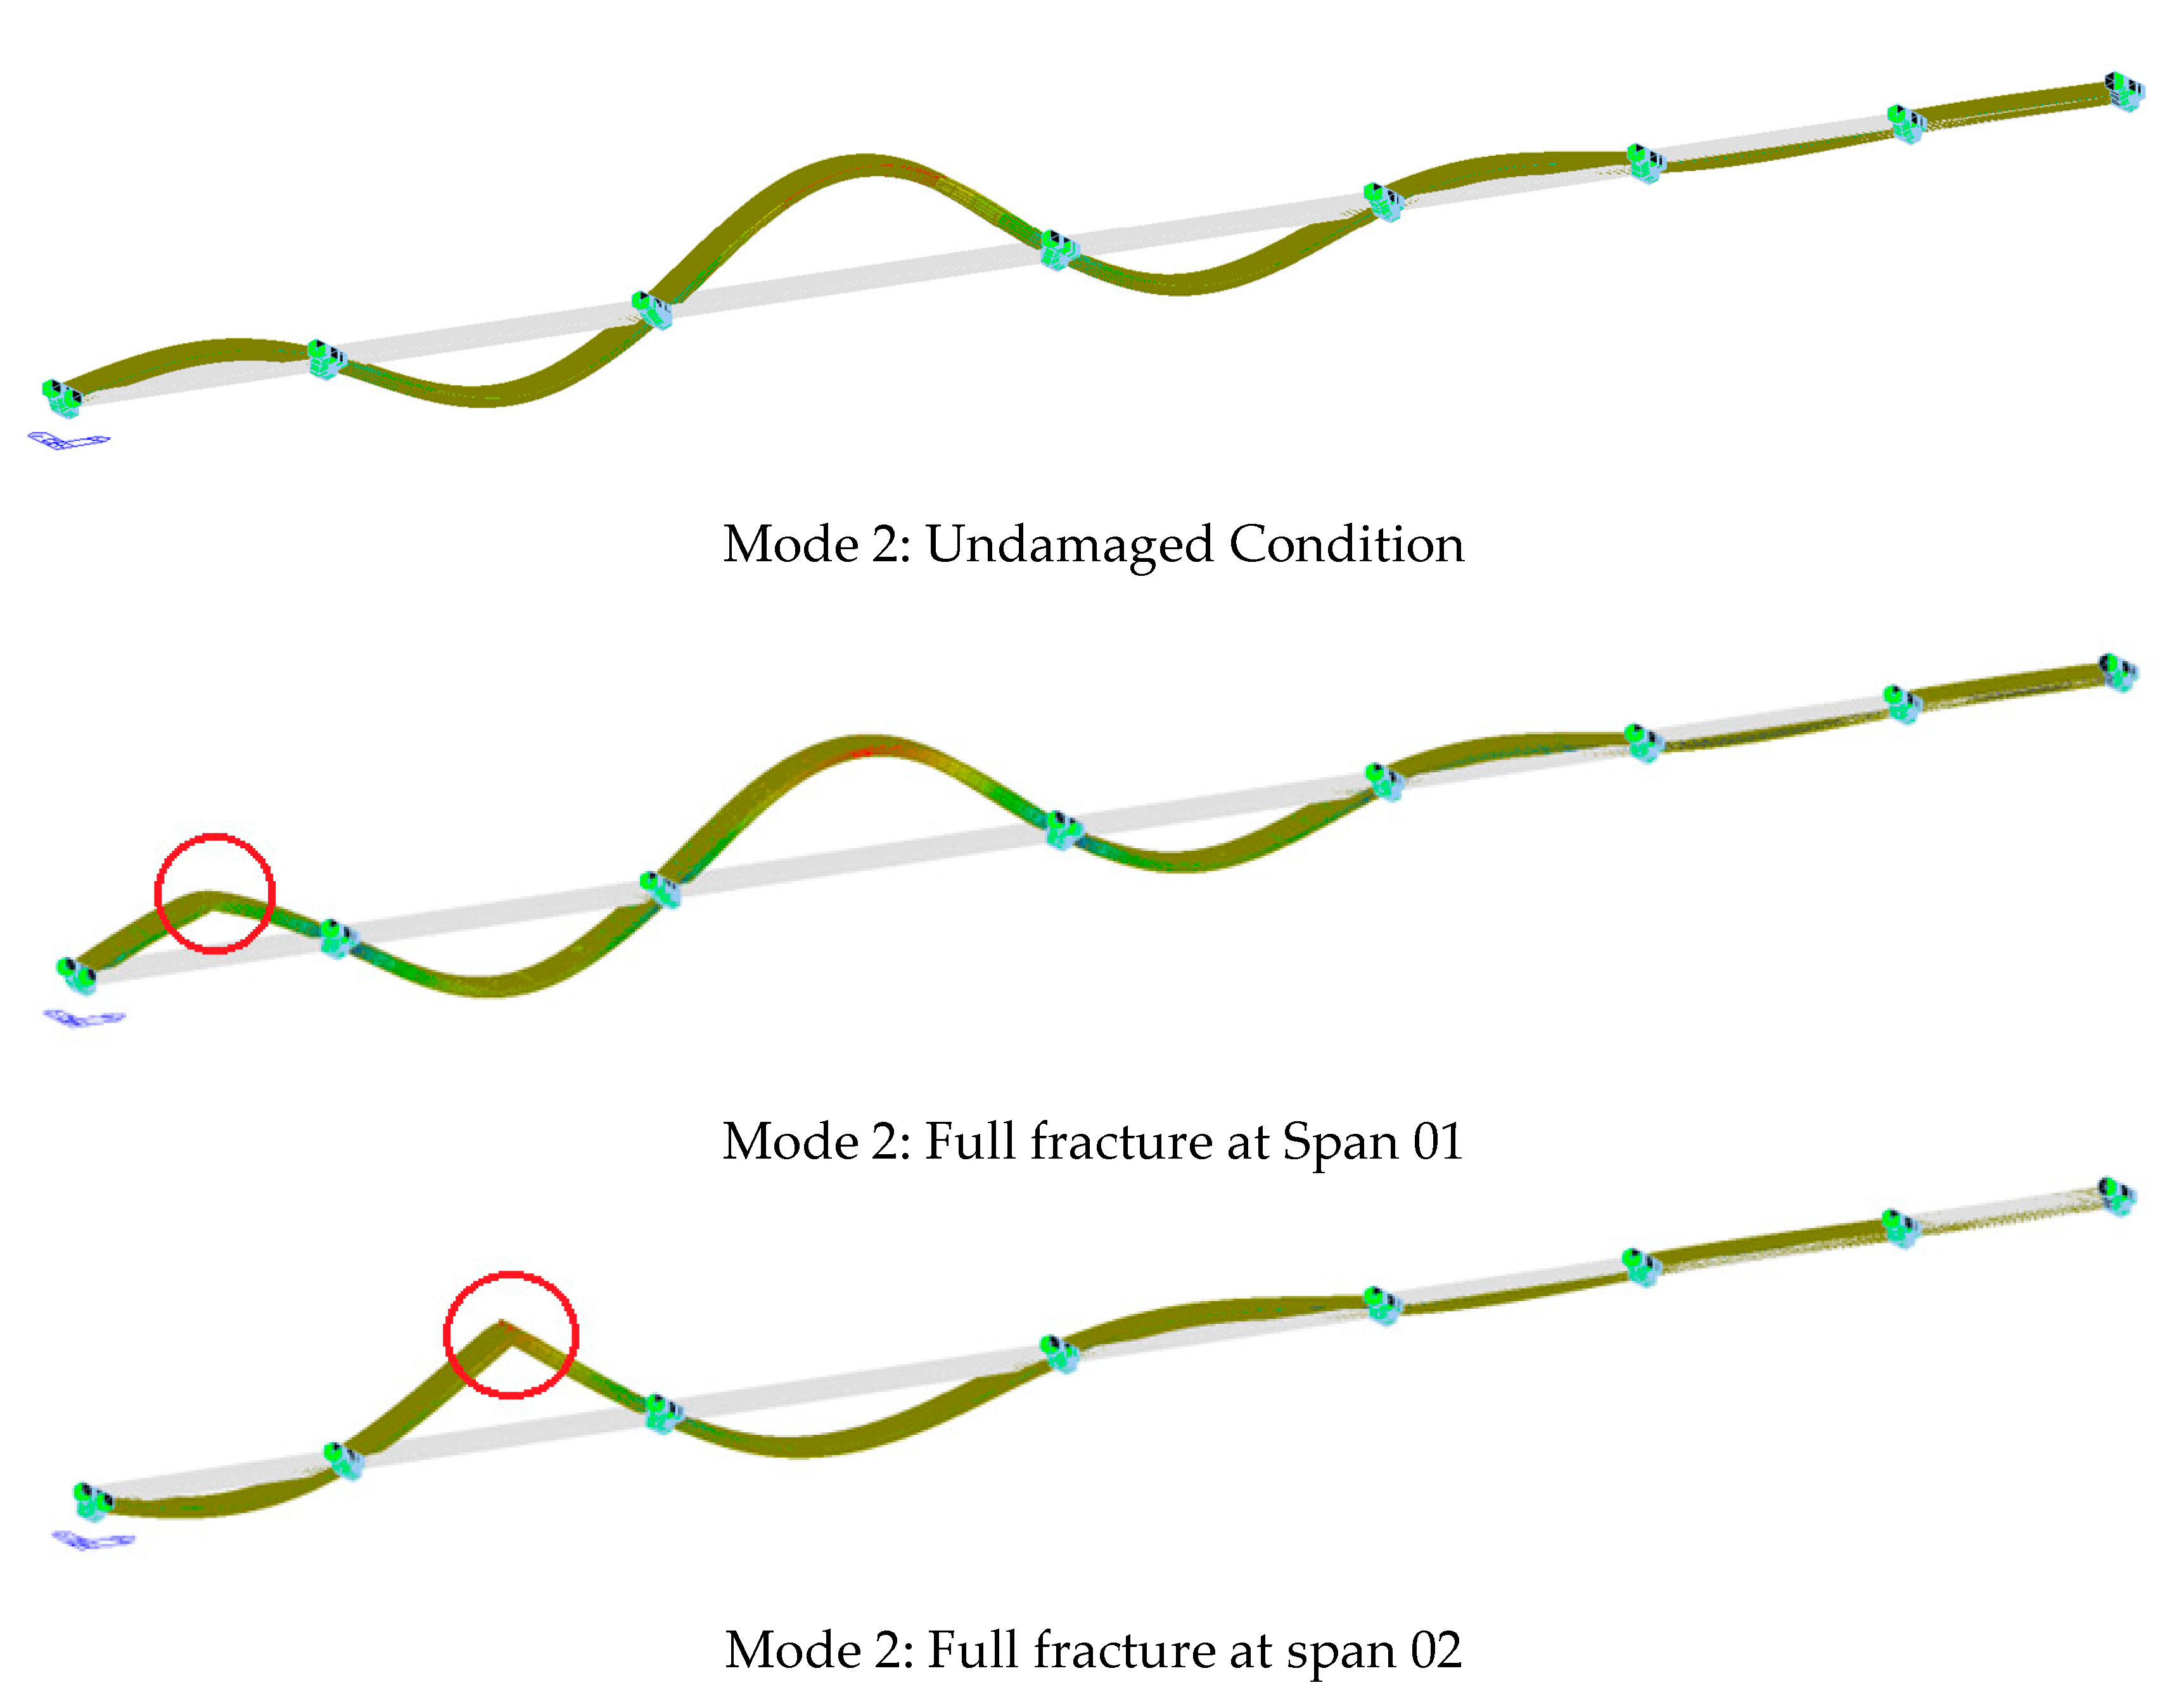
Figure 14 illustrates two mode shape changes due to a complete girder fracture (DMG3) in the middle of Spans 01 and 02.
Figure 13 and
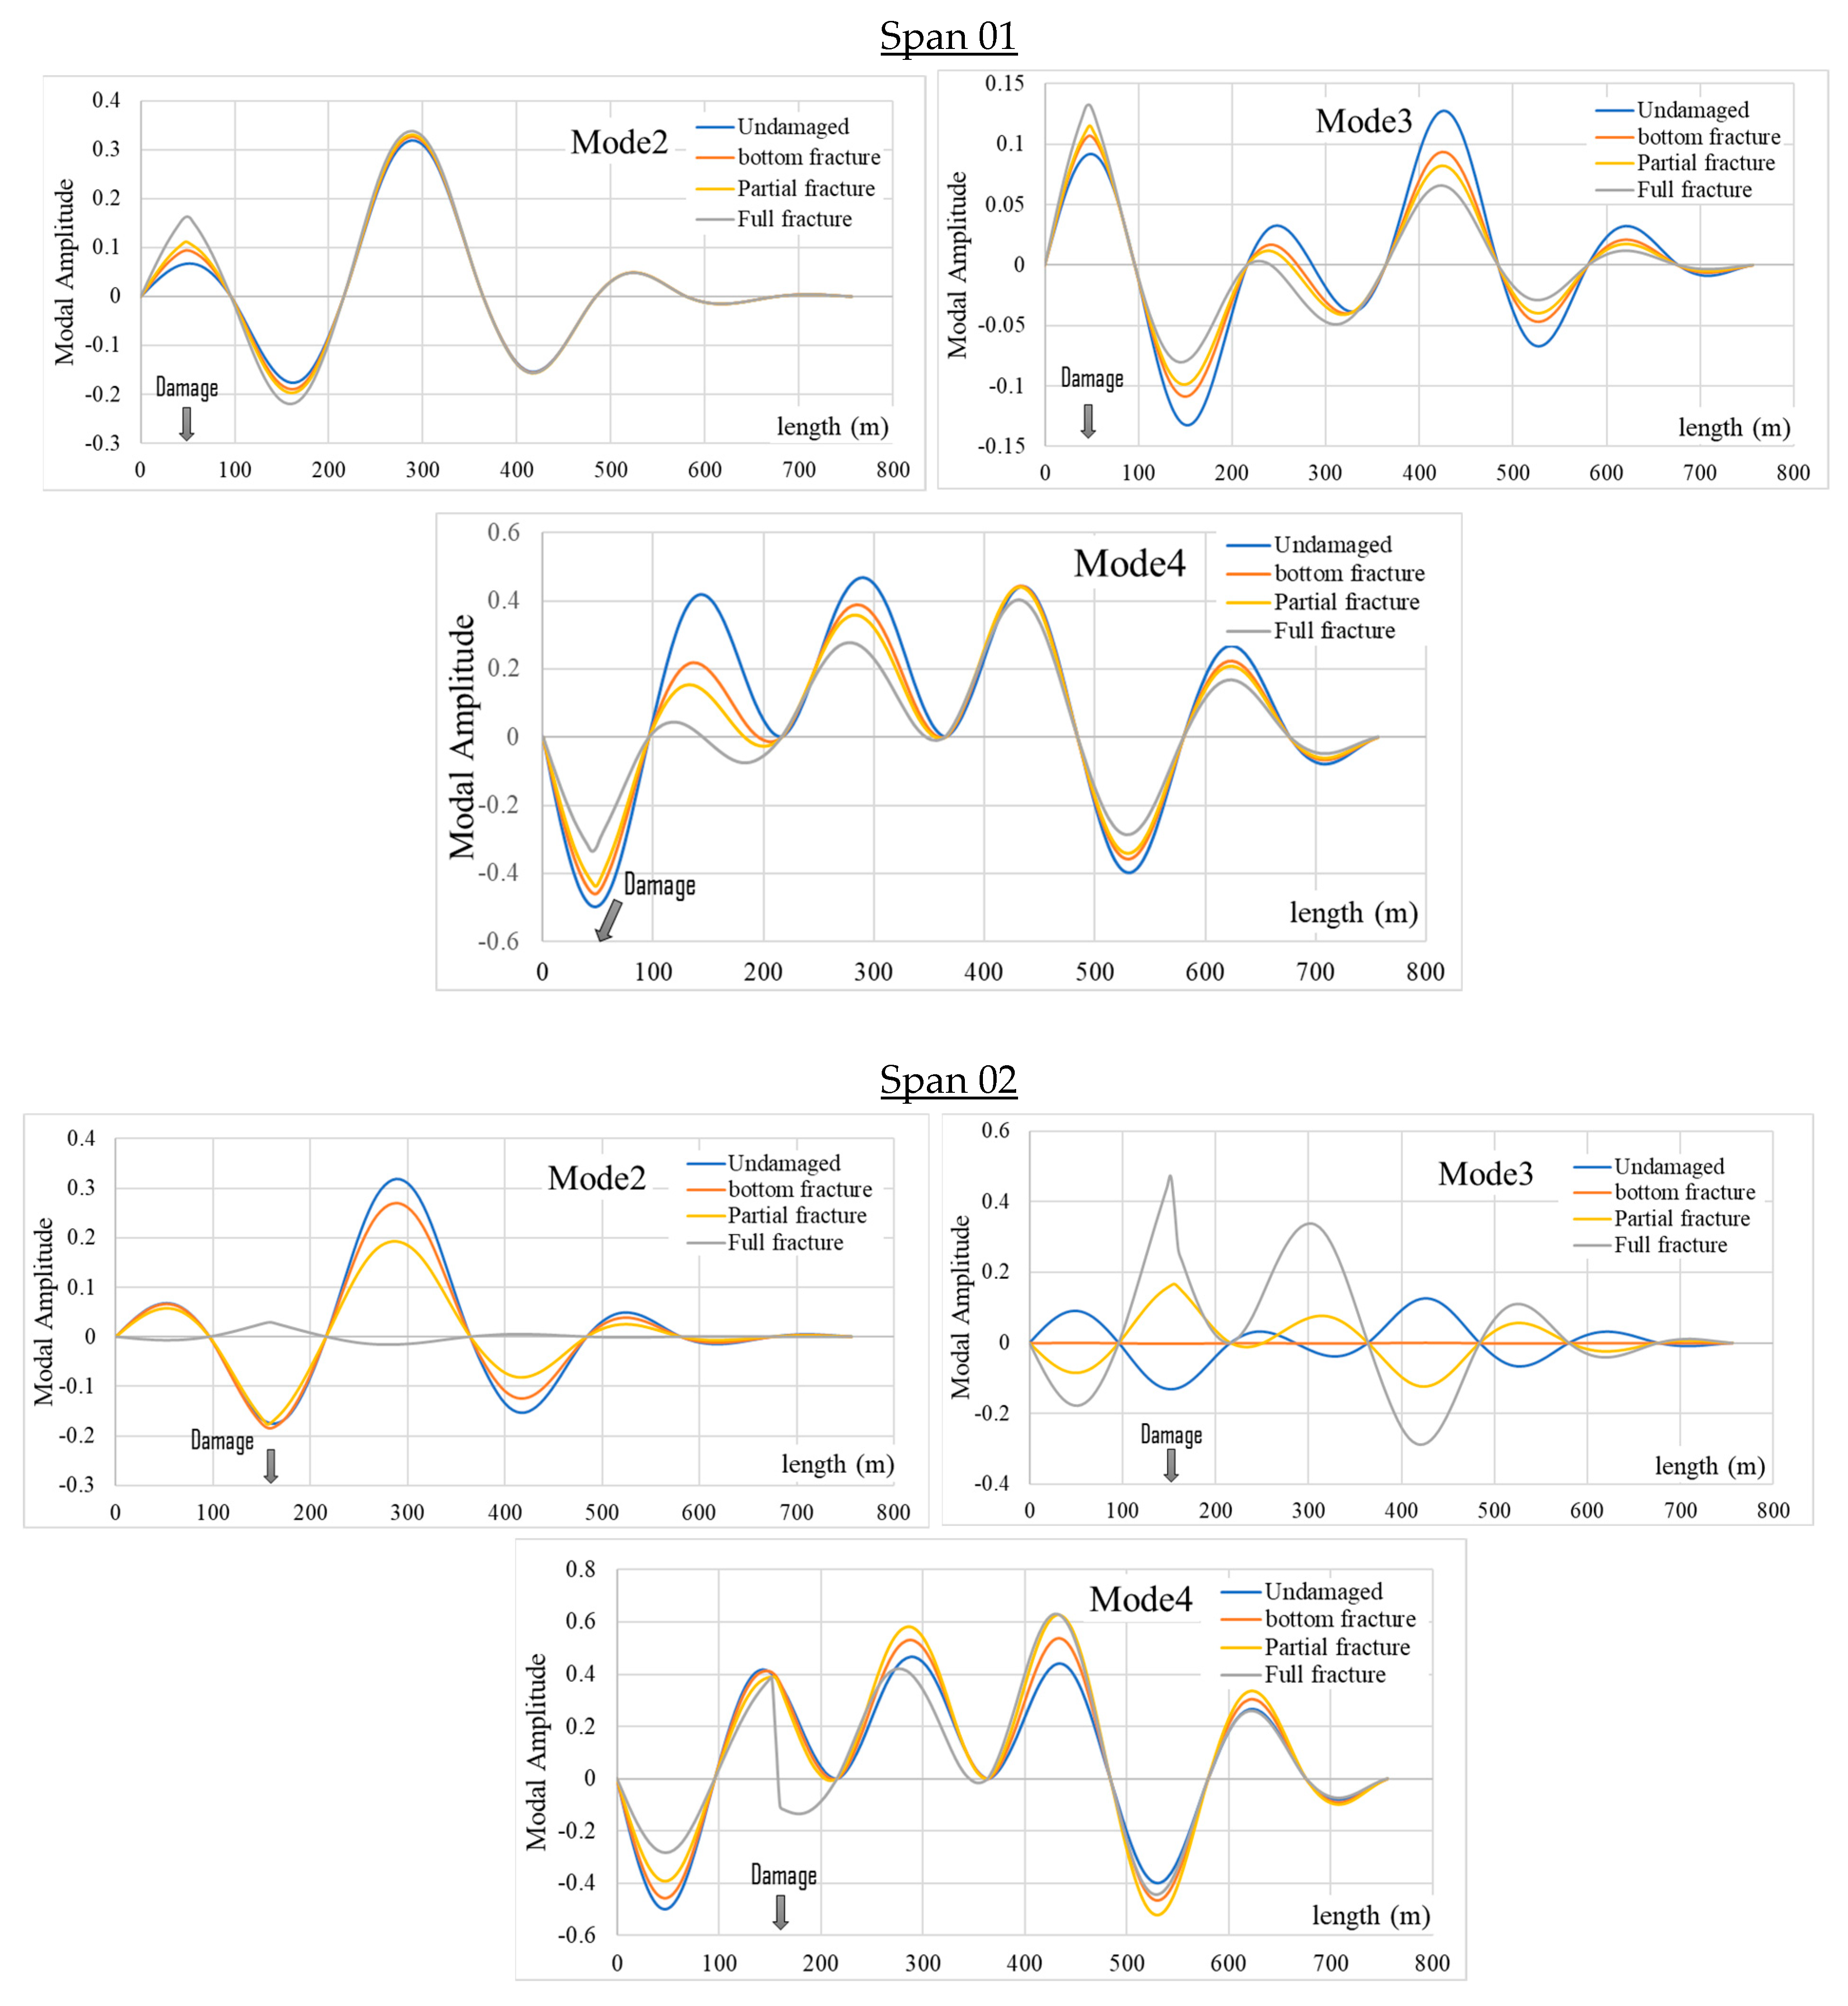
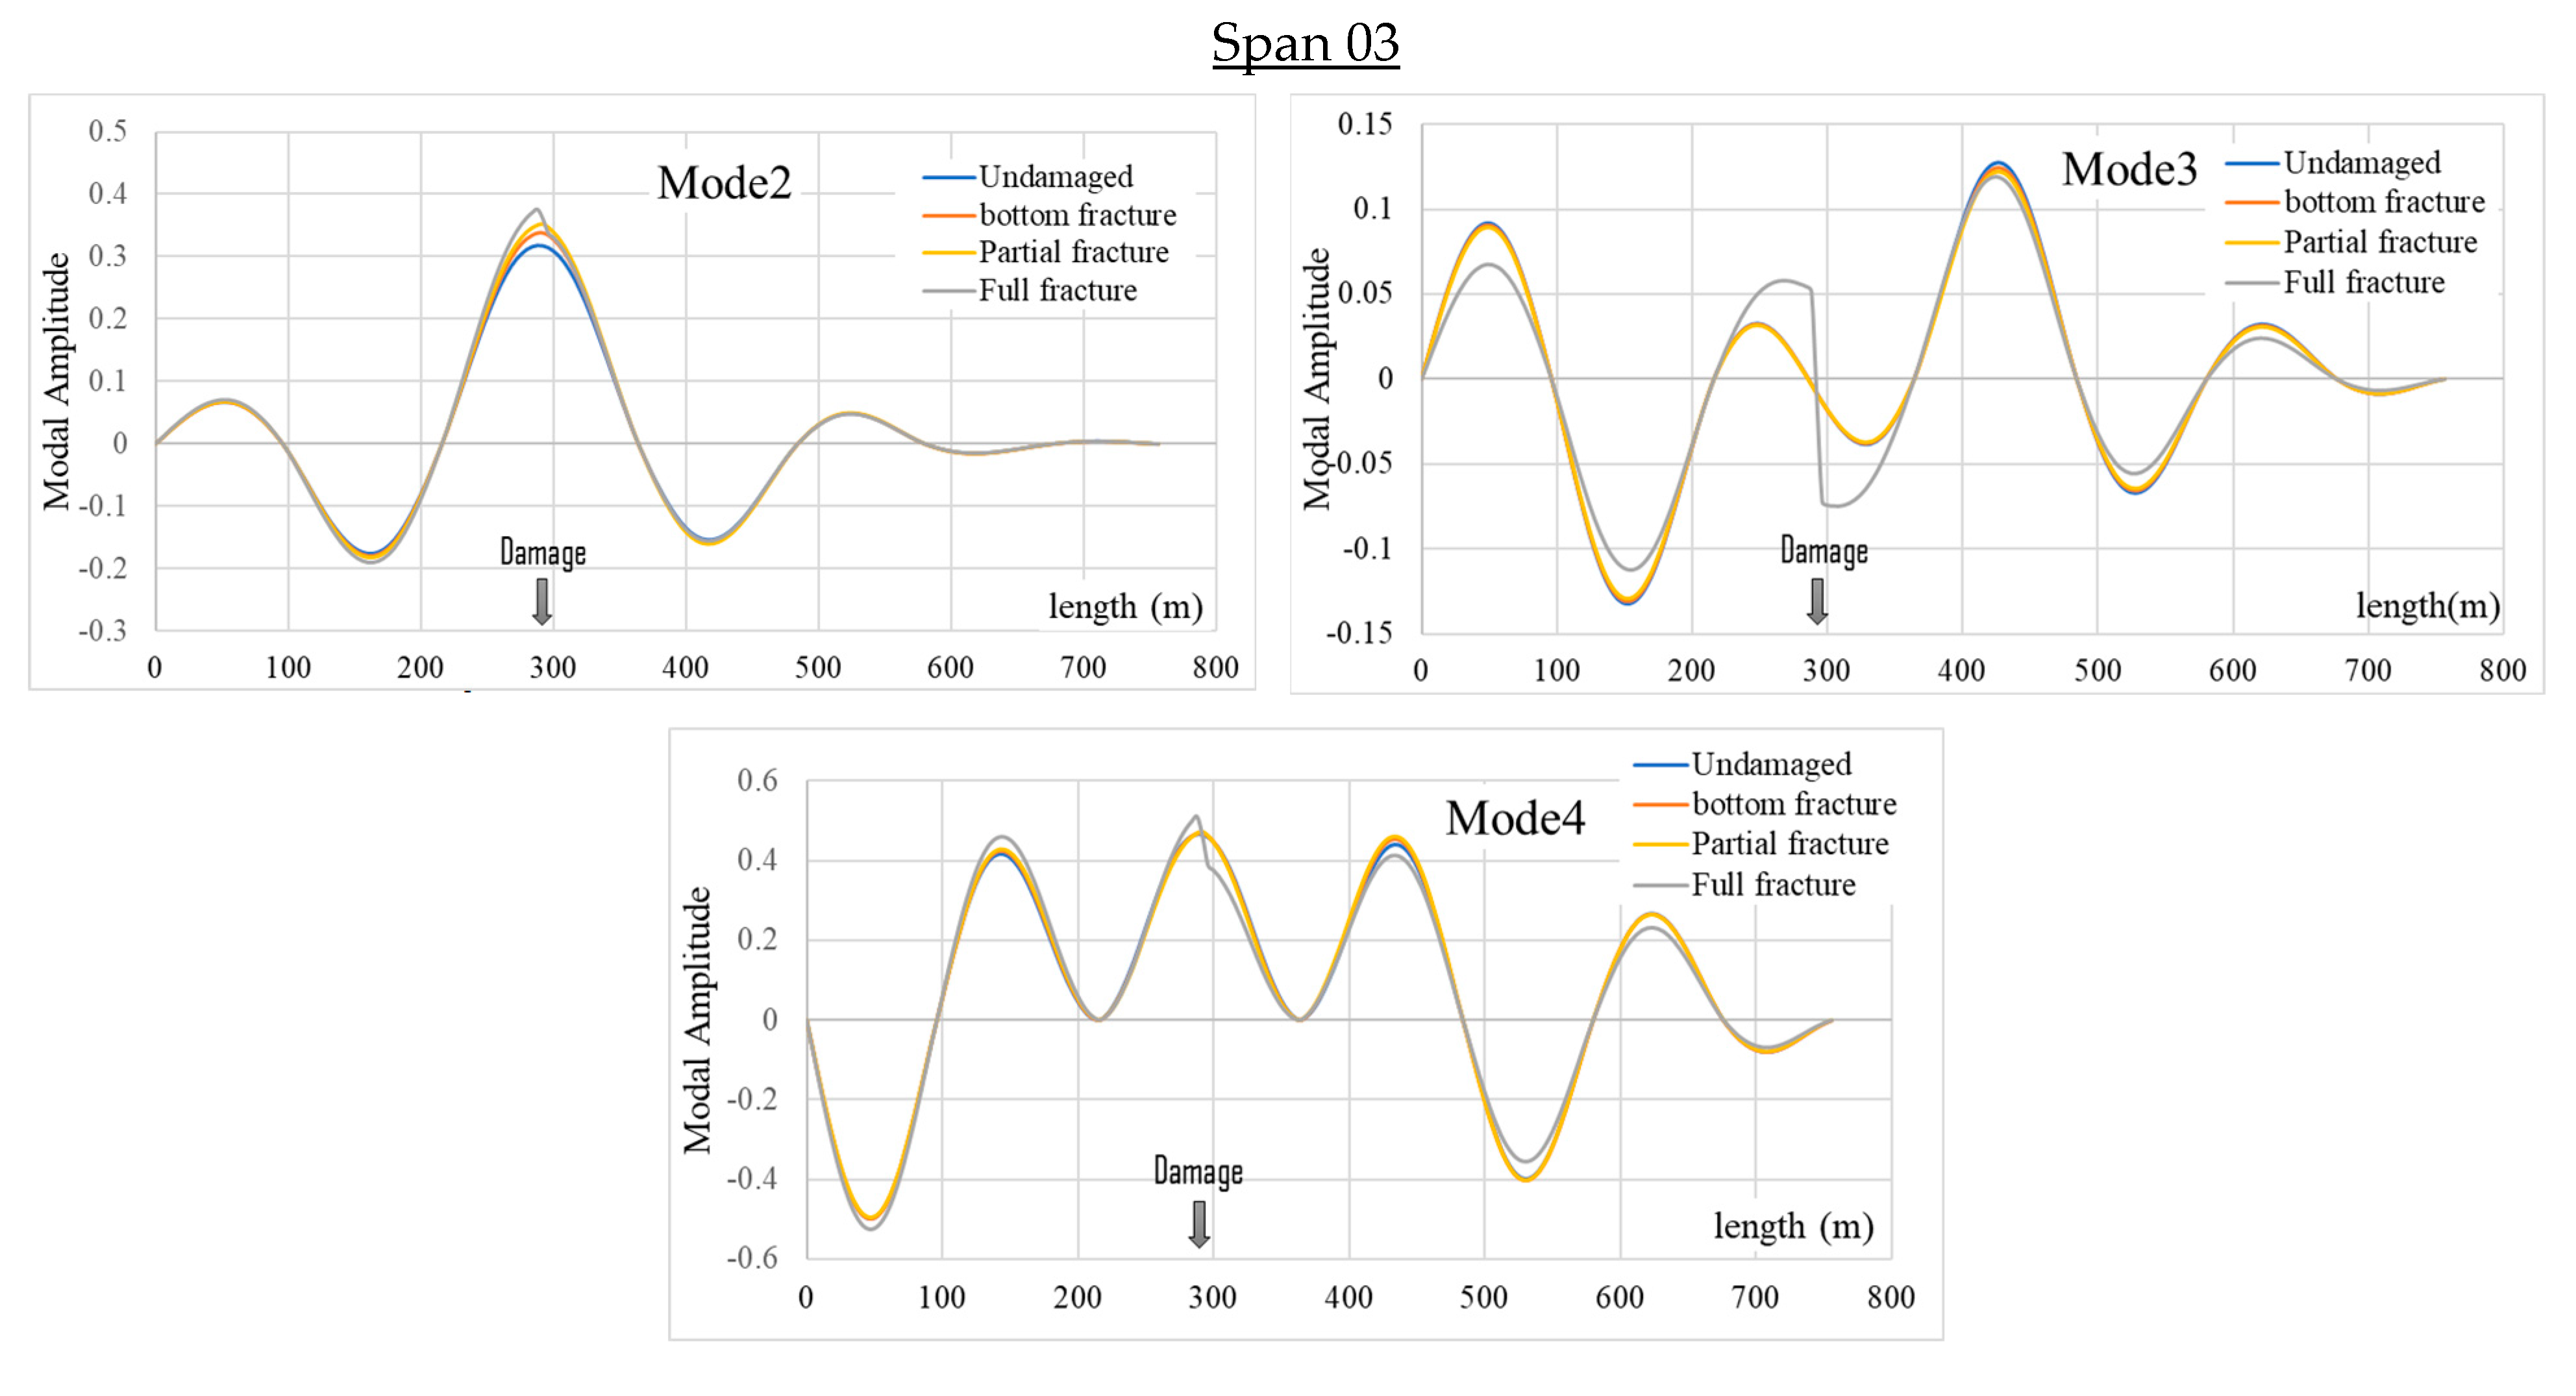
Figure 14 show comparisons of intact and damaged mode shapes. The figures showed that the amplitude changes in the mode shapes are sensitive enough to detect damage at the inflicted locations. These changes are more pronounced for a complete and partial fracture (DMG 2 and 3) at the middle of the span and less for minor damage such as bottom flange fracture (DMG1).
Figure 15 illustrates amplitude curves of the vertical modes (Modes 2–4), where peaks are discernible at damaged locations with varying intensity. Notably, the mode shapes demonstrate a heightened sensitivity, making them effective in monitoring significant damage in the continuous steel girder. This sensitivity is more pronounced than frequency changes, as evidenced by the minimal alterations in bridge natural frequencies, as detailed in
Table 2,
Table 4, and
Table 6. Similar to the frequency results, the amplitude curves of the horizontal modes (Modes 1 and 5) exhibited no variation.
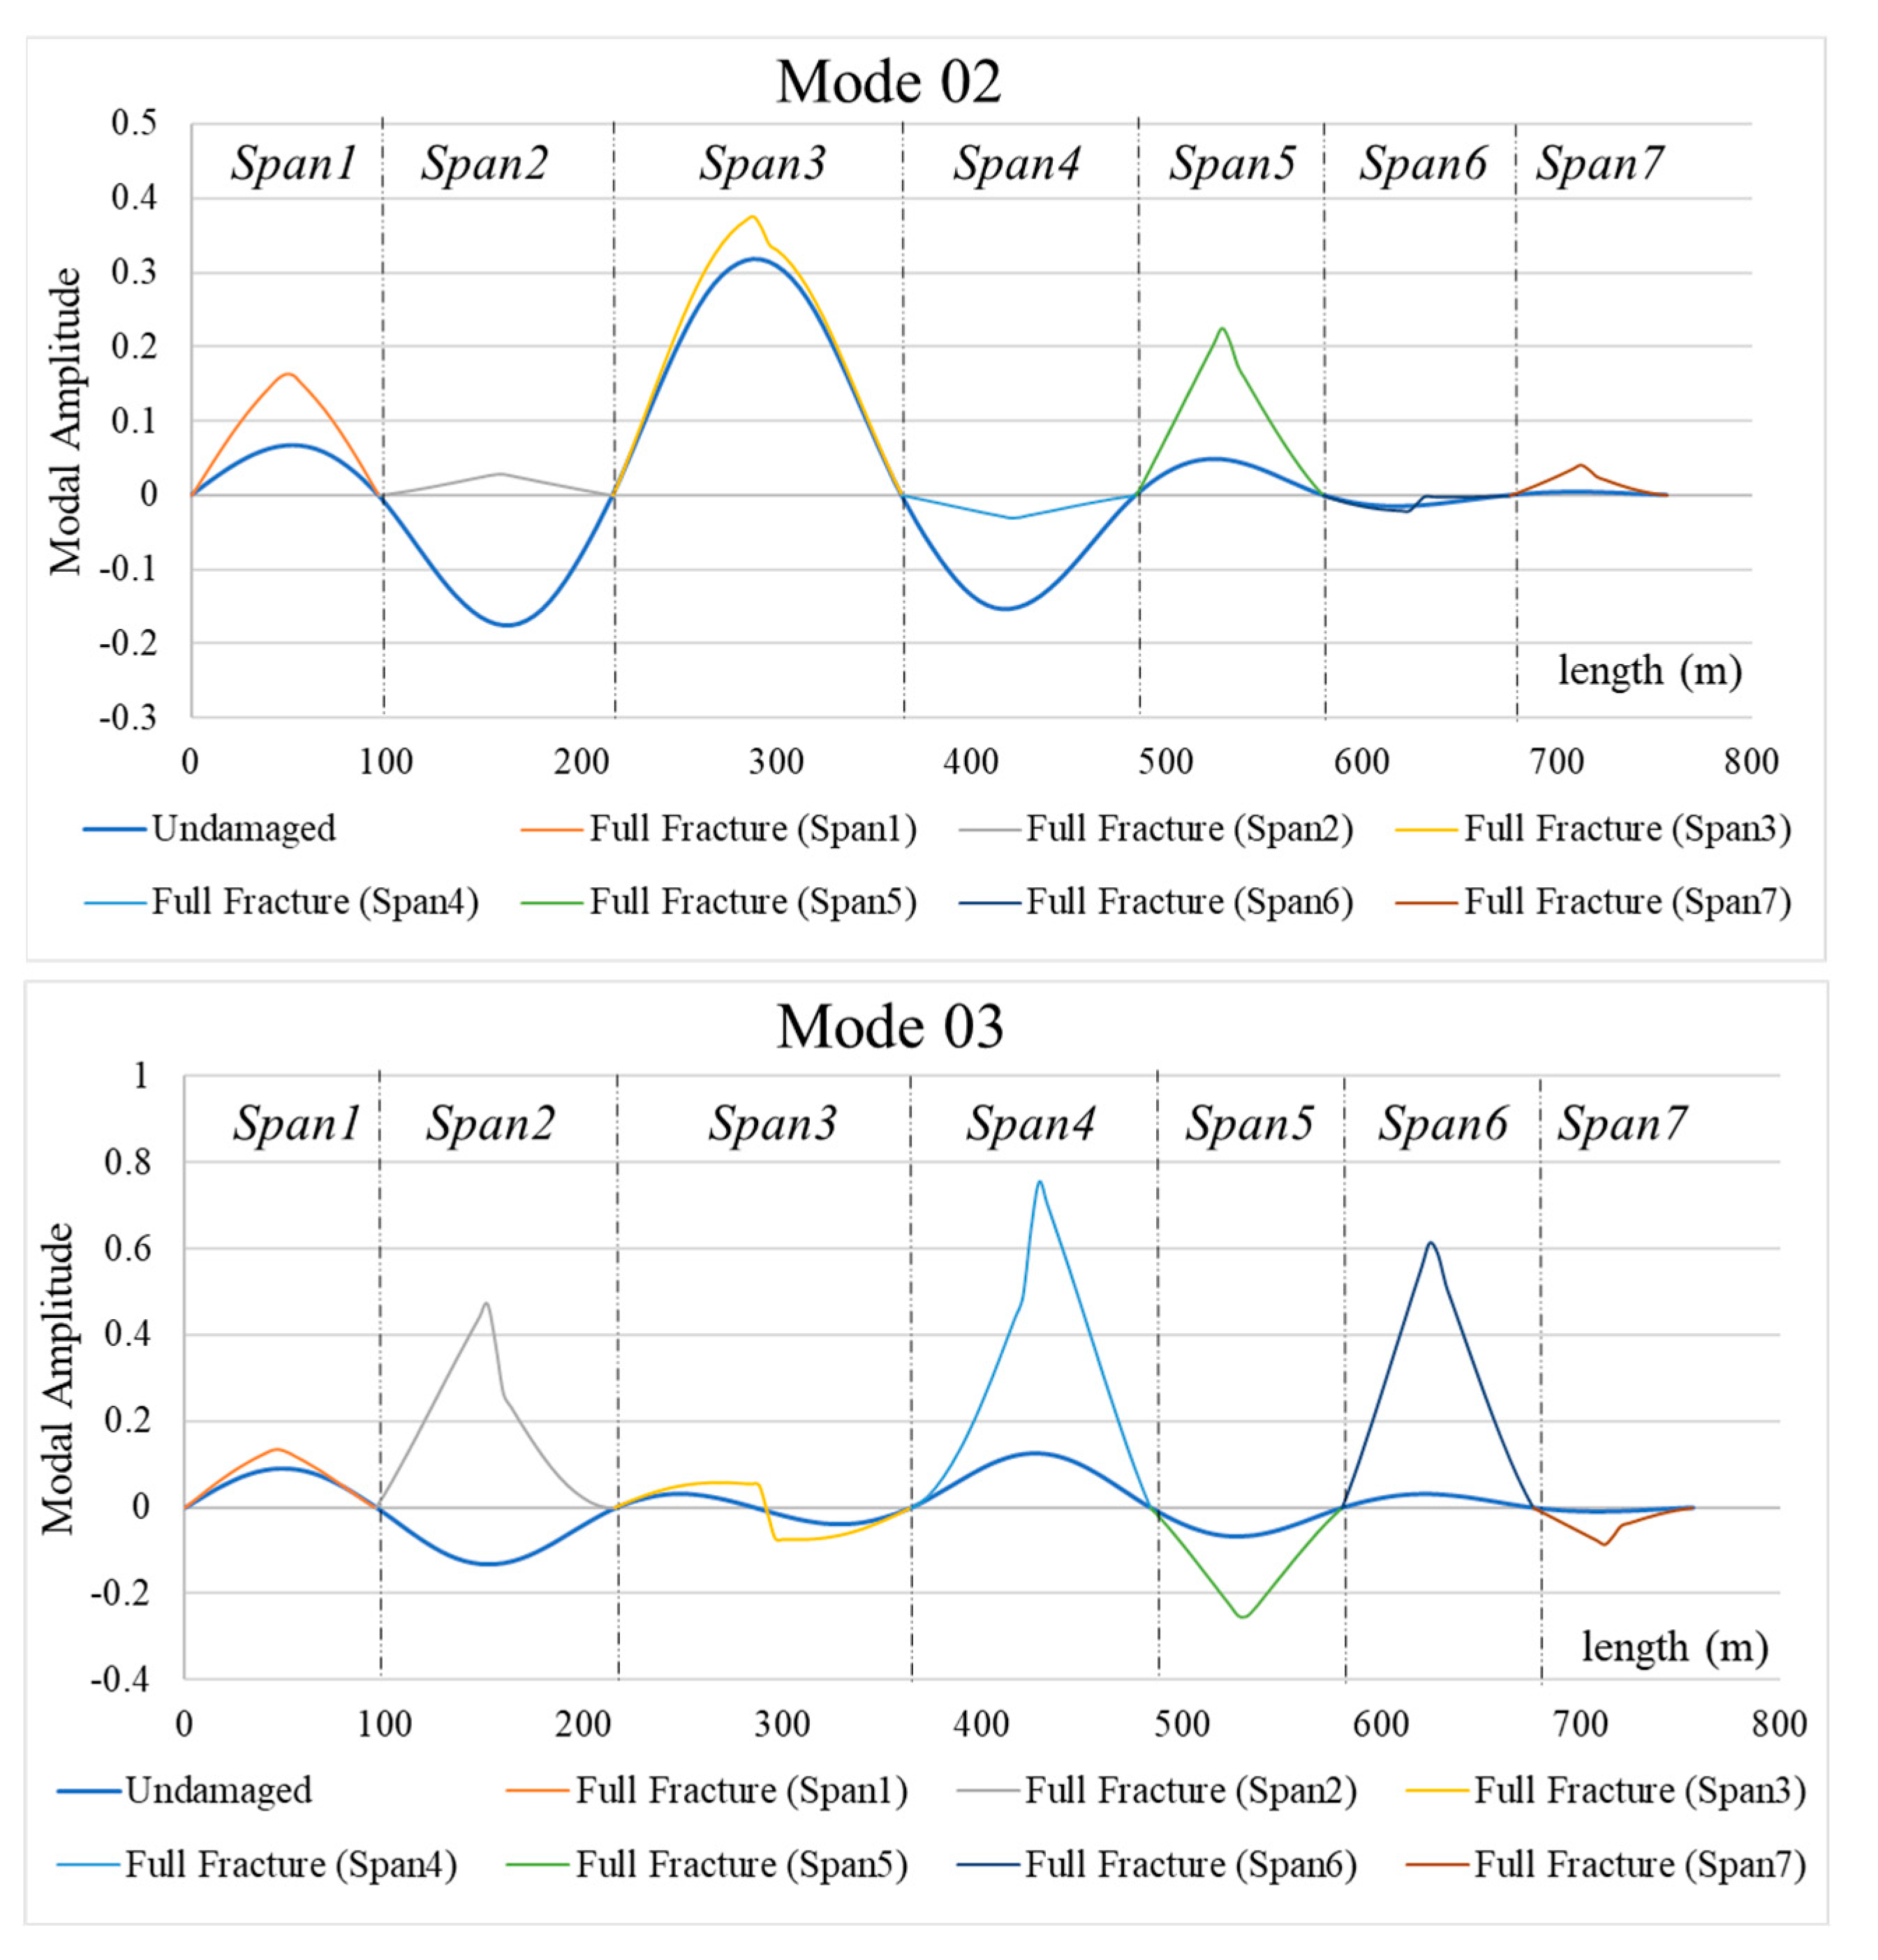
Figure 16 compares the first two vertical mode shapes of the continuous seven-span bridge in an undamaged state and the scenario involving a complete fracture at the middle of each span. The fractured shapes are a composite graph showing only the affected span for every full fracture scenario. This visual analysis reveals that damage occurring at various locations along the bridge induces different amplitude changes in the mode shape. Similar results occur on the other spans. These variations in amplitude offer a valuable means to localize and identify the specific areas of damage along the bridge structure.
Modal Assurance Criterion (MAC)
MAC [
40], among other indicators, is used as a sensitivity indicator for damage detection based on mode shape changes. The MAC is a quantitative measure related to the degree of consistency between two mode shape set vectors used to compare mode shapes in undamaged and damaged conditions directly, defined as,
where ψ
A and ψ
B correlate to the undamaged and the damaged mode shape vectors, respectively, at approximately the same frequency. The result from Equation (1) is a scalar value ranging from zero to one. A value close to one indicates similar modes, while a value close to zero suggests a weak correlation between the two mode shapes, which can indicate the existence of damage (reduction in stiffness). For this analysis, the sensitivity calculation uses the difference between both sets of vectors from the analytical data.
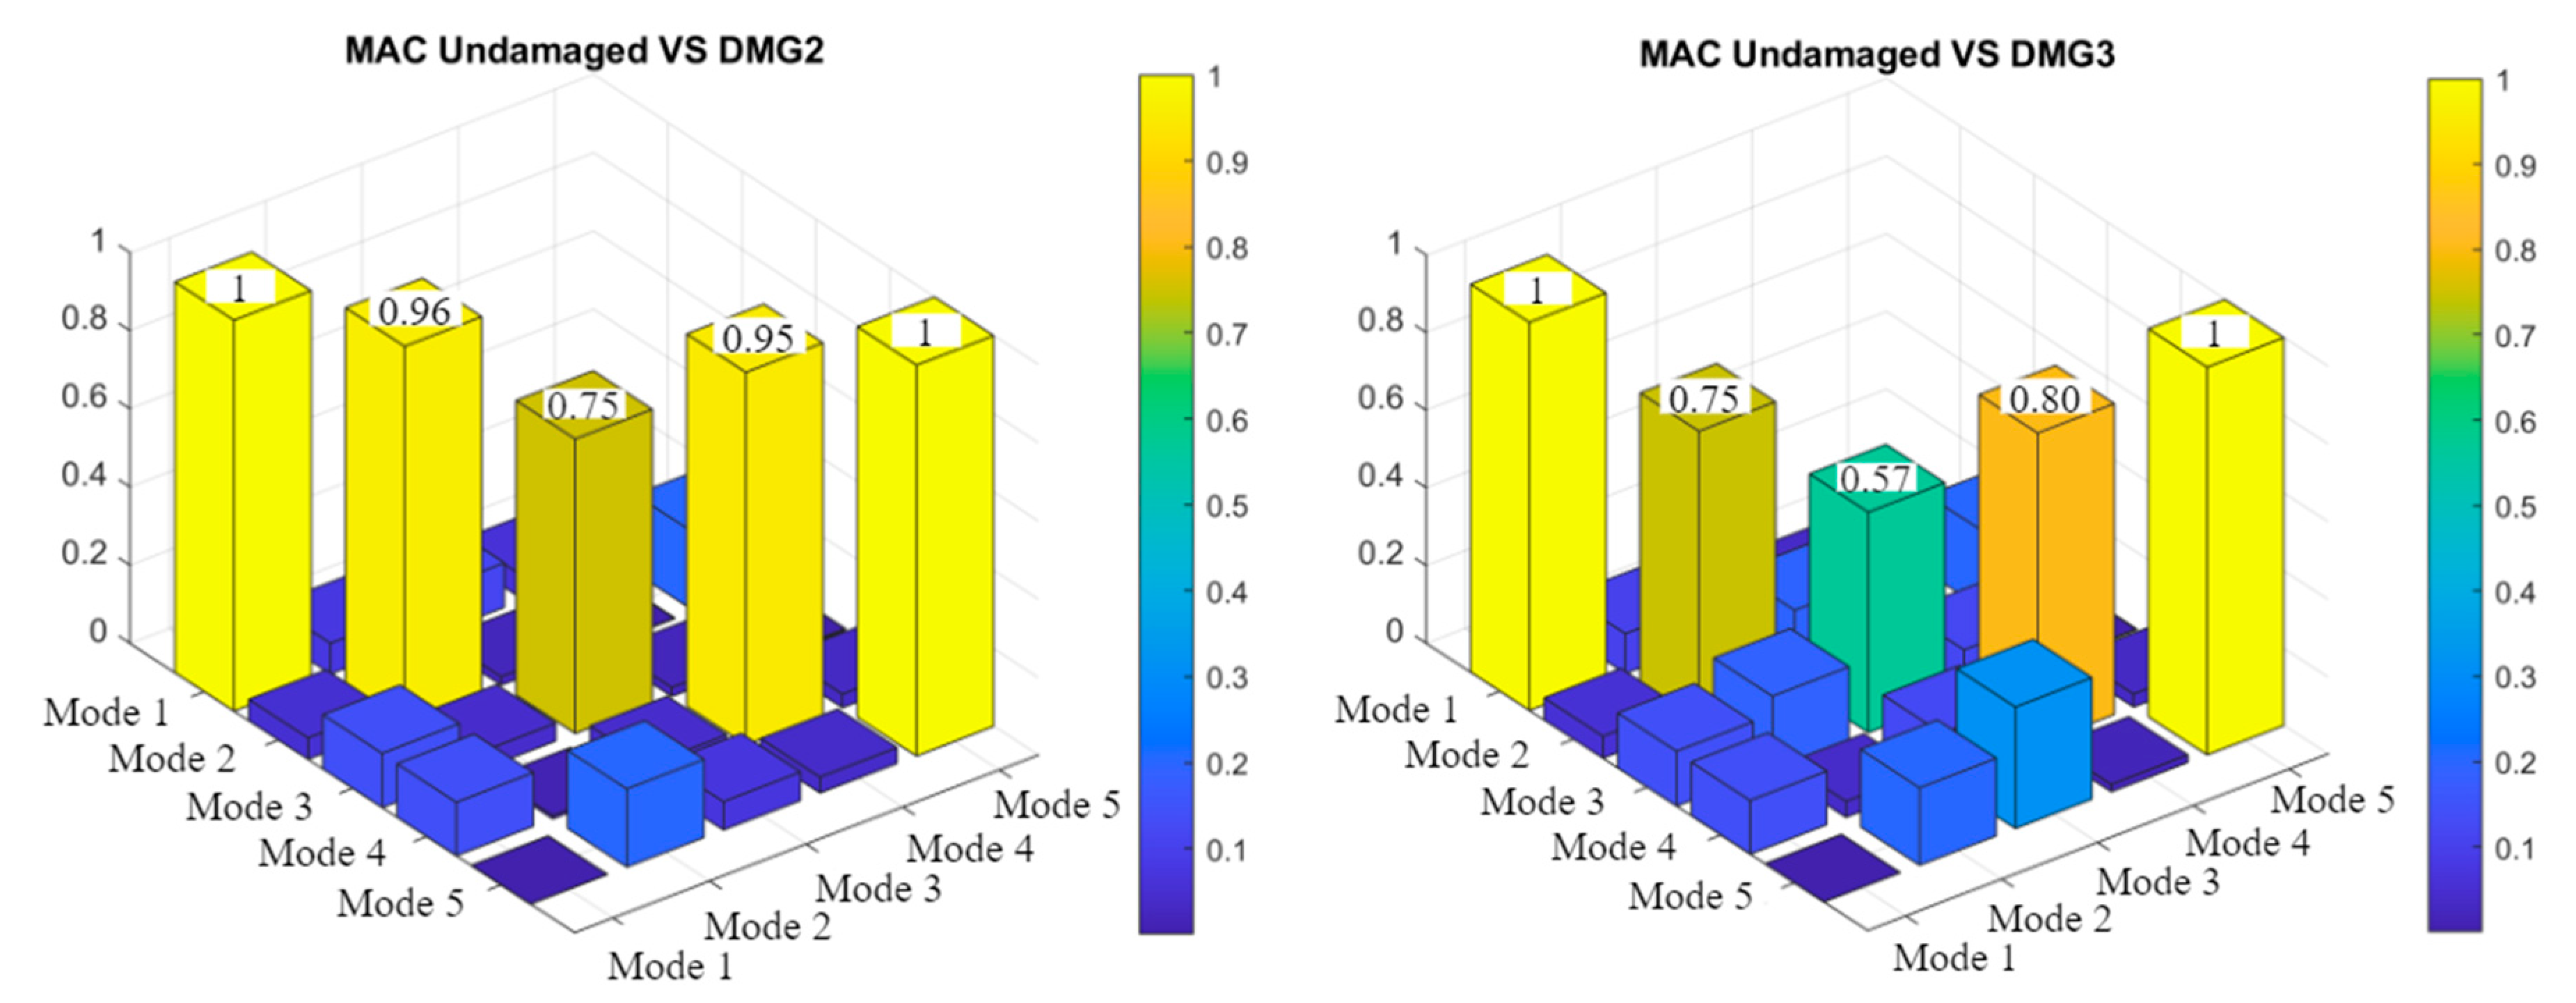
Table 8 displays the MAC values corresponding to the first five modes following three damage scenarios for the first three spans. Across all five modes, the average MAC changes according to the damage level, with a progressive decrease in MAC as the severity of damage increases.
In
Figure 17, the MAC graphs for the most sensitive span, span 02, are presented. The comparison of bending modal shapes between undamaged and damaged modes provides a clear visual representation of the severity of damage.
5.3. Comparative Analysis of Sensitive Factors
A vibration-based monitoring system was employed to address damage detection challenges using the dynamic response of the bridge. Simple measurement methods at several locations within the structure helped define the dynamic properties governing the bridge’s global behavior. Vibration-based monitoring is vital because structural damage mechanisms, such as localized, flexural, and bending cracking, induce stiffness loss, leading to changes in dynamic properties, including natural frequencies, mode shapes, and damping ratios. While damping ratios are highly sensitive to structural damage, their accurate calculation becomes more complex [
41].
The ideal identification parameters were determined as the basis of sensitivity analysis by evaluating their effectiveness in damage detection for various locations and degrees on the Szapáry seven-span bridge. The modal frequency was first evaluated as a fundamental design parameter for damage detection. This parameter effectively reflected the extent of significant damages (DMG 2 and 3) but exhibited limitations in capturing minor damage (DMG 1).
The second evaluation focused on the relationship between the modal amplitude curve and the damage location. The modal amplitude curve exhibited a minor peak value in the section with structural damage. The damage had a discernible impact on the overall modal curve, with the sensitivity to damage varying based on the amplitude participation of each span. The identification results in
Figure 13 and
Figure 14 highlight the method’s advantage in accurately pinpointing the damaged section. Consequently, the modal curve proved to be a suitable parameter for structural damage identification. Furthermore, the MAC undergoes significant changes with increasing damage severity. A notable decrease in MAC values between undamaged and damaged mode shapes signifies the occurrence of damage. Lower MAC values indicate a reduced similarity between mode shapes, indicating more significant structural alteration.
In summary, the mode shape emerged as the most effective damage detection indicator, consistently outperforming other indexes in terms of type, severity, and location. The results of FEA underscore the mode shape’s reliability in detecting damage along the bridge, particularly in fracture-critical members.
6. Conclusions
This study investigated the application of various vibration-based damage detection methods on the Szapáry seven-span box girder bridge. The analysis employed different damage scenarios and computed modal frequency, mode shapes, and modal assurance criterion sensitivity parameters. The scenarios simulated damage at multiple positions and degrees of severity, focusing on fracture-critical elements of the bridge girder. The objective was to assess the methods’ robustness in detecting damage induced by truck loading.
Post-damage dynamic analysis revealed subtle changes in natural frequencies, often falling within measurement resolution and accuracy constraints, potentially making them undetectable. However, substantial changes in mode shapes succeeded in highlighting their ability to detect damage at specific locations, surpassing frequency changes in many cases. The changes in modal amplitude can serve as a valuable indicator to point out the precise locations of damage along the bridge structure. Changes in bending stiffness can explain the changes that significantly alter the amplitude curve of the continuous multi-span bridge. The modal curve variation and the identified peaks in the curves will directly offer a valuable means to localize and identify the specific areas of damage along the bridge structure.
Additionally, the study examined the MAC index for modal sensitivities. While indicative for most locations throughout the span, it is crucial to note that MAC signifies only consistency, not validity or orthogonality, between compared mode shapes.
A benchmark of the wavelet scalograms of the healthy Szapáry Bridge is necessary as a reference for continuously monitoring progressively developing damage and its effect on the structural response. The methodologies presented, encompassing approach, field testing, and numerical techniques, hold potential for broader applications in investigations into structural performance and multi-span bridge monitoring, ensuring their long-term safety and reliability.
