
Retrofit Measures for Achieving NZE Single-Family Houses in a Tropical Climate via Multi-Objective Optimization


Abstract
1. Introduction
Objective
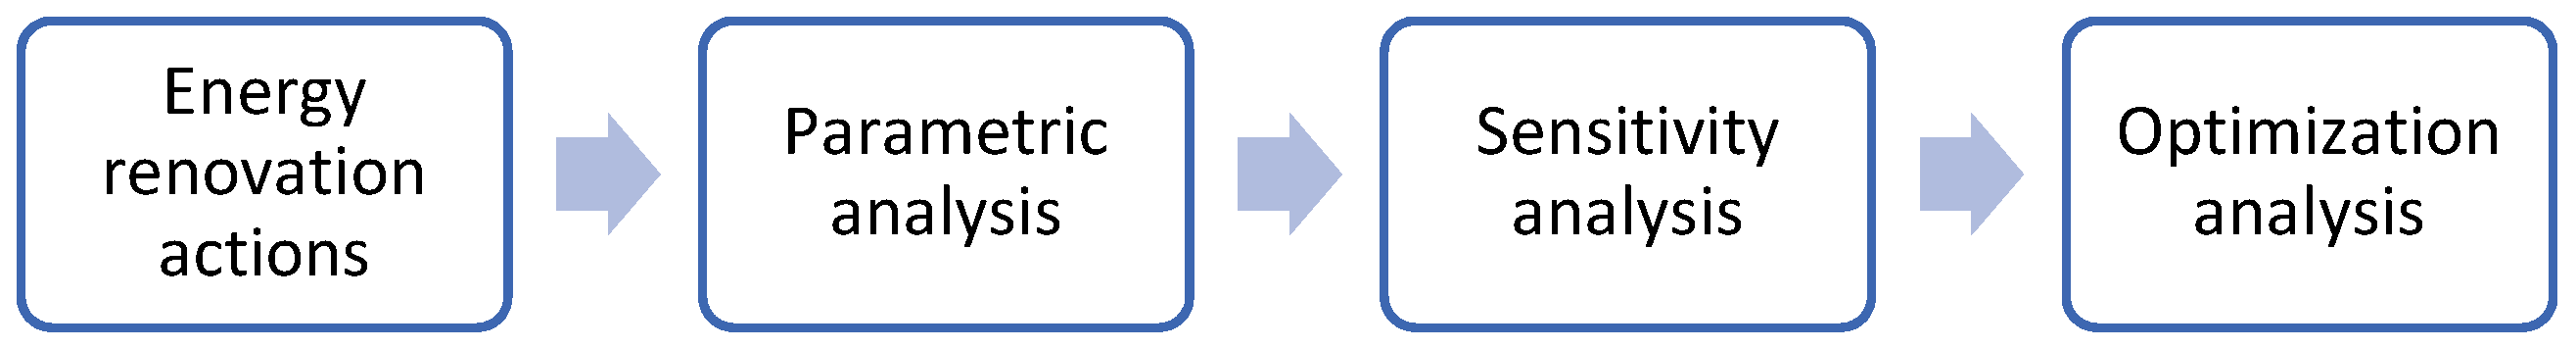
2. Methodology
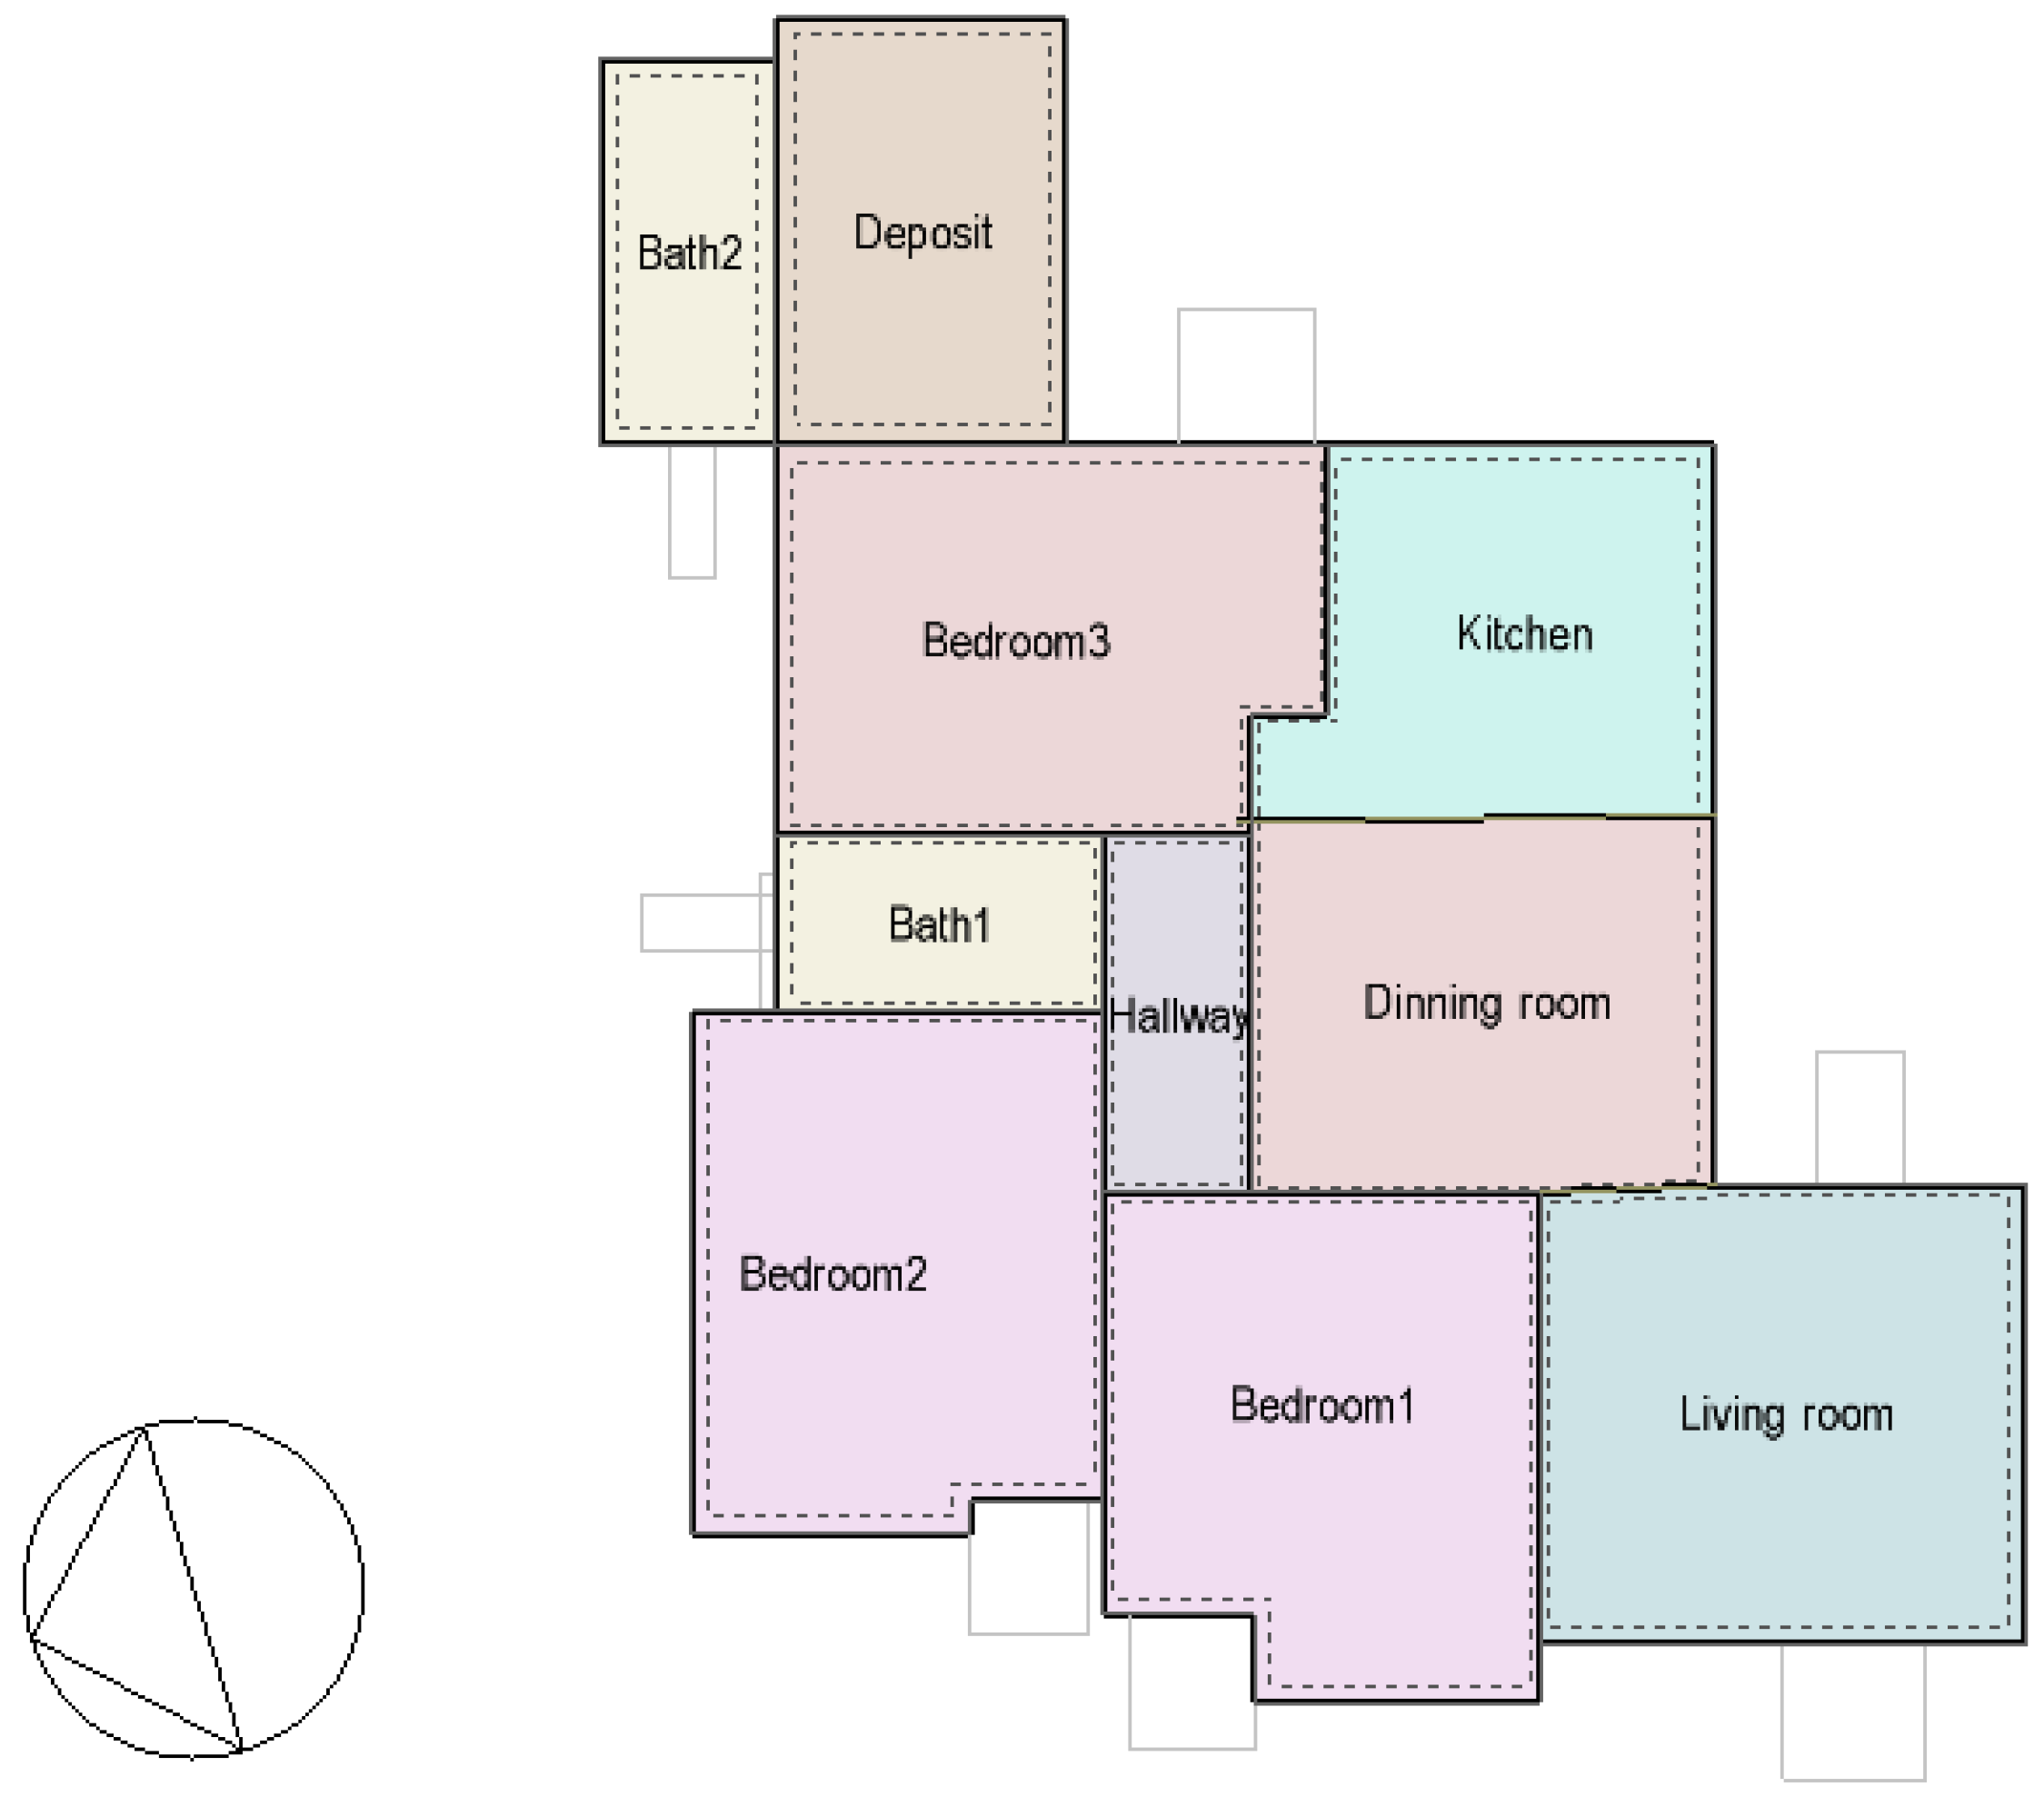
2.1. Case Study Description
- The natural ventilation was set up as “calculated” in the software, which refers to the airflows at each opening, estimated via the airflow network method, which are already integrated in the software. This is implemented as the default by the software.
- Solar distribution modelling was set as the complete exterior.
- The Conduction Transfer Function (CTF) was left as default as the heat transfer solution algorithm with constant thermal properties, with no consideration of humidity movement.
- A constant infiltration rate of 0.7 ach was considered always available, considering the good crack state.
- Thermal bridges were not considered.
- The ground thermal behavior modeling was set by default because this study is interested in the comparison of designs where the ground modelling remains the same, among other characteristics. Any differences that are found are a result of the renovations only.
2.2. Retrofitting Actions
2.3. Modelling of the Design Variables
3. Results
3.1. Energy Consumption at Current State
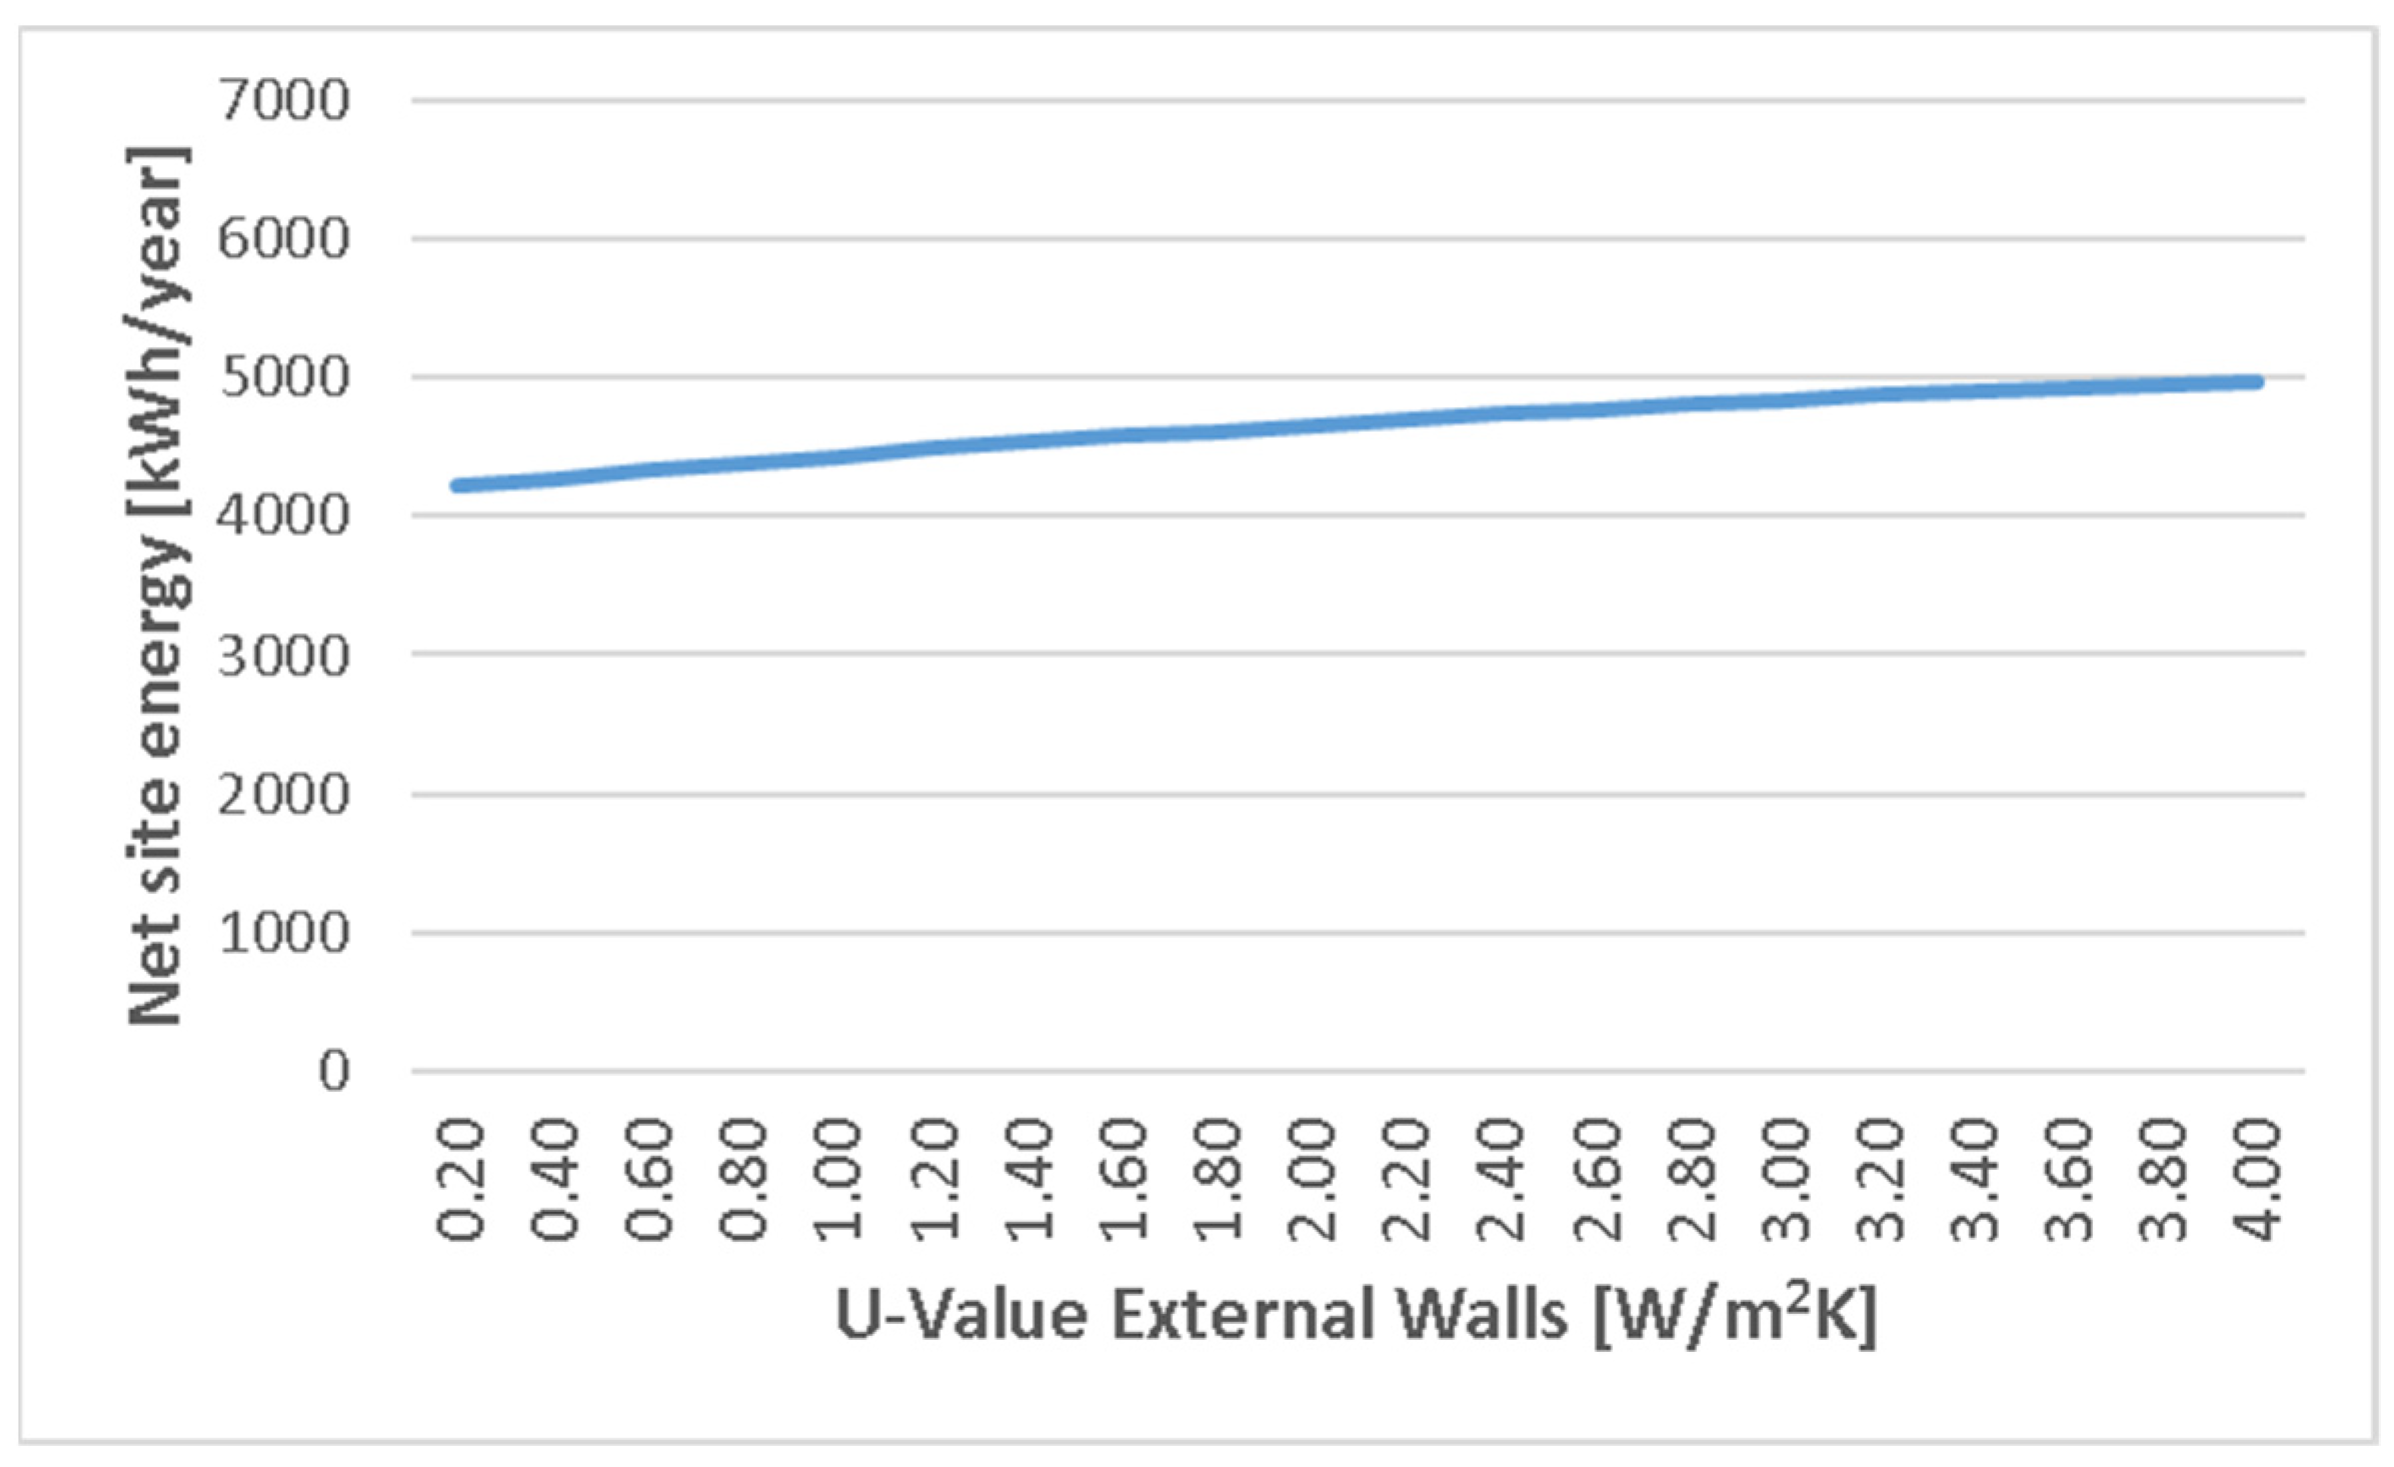
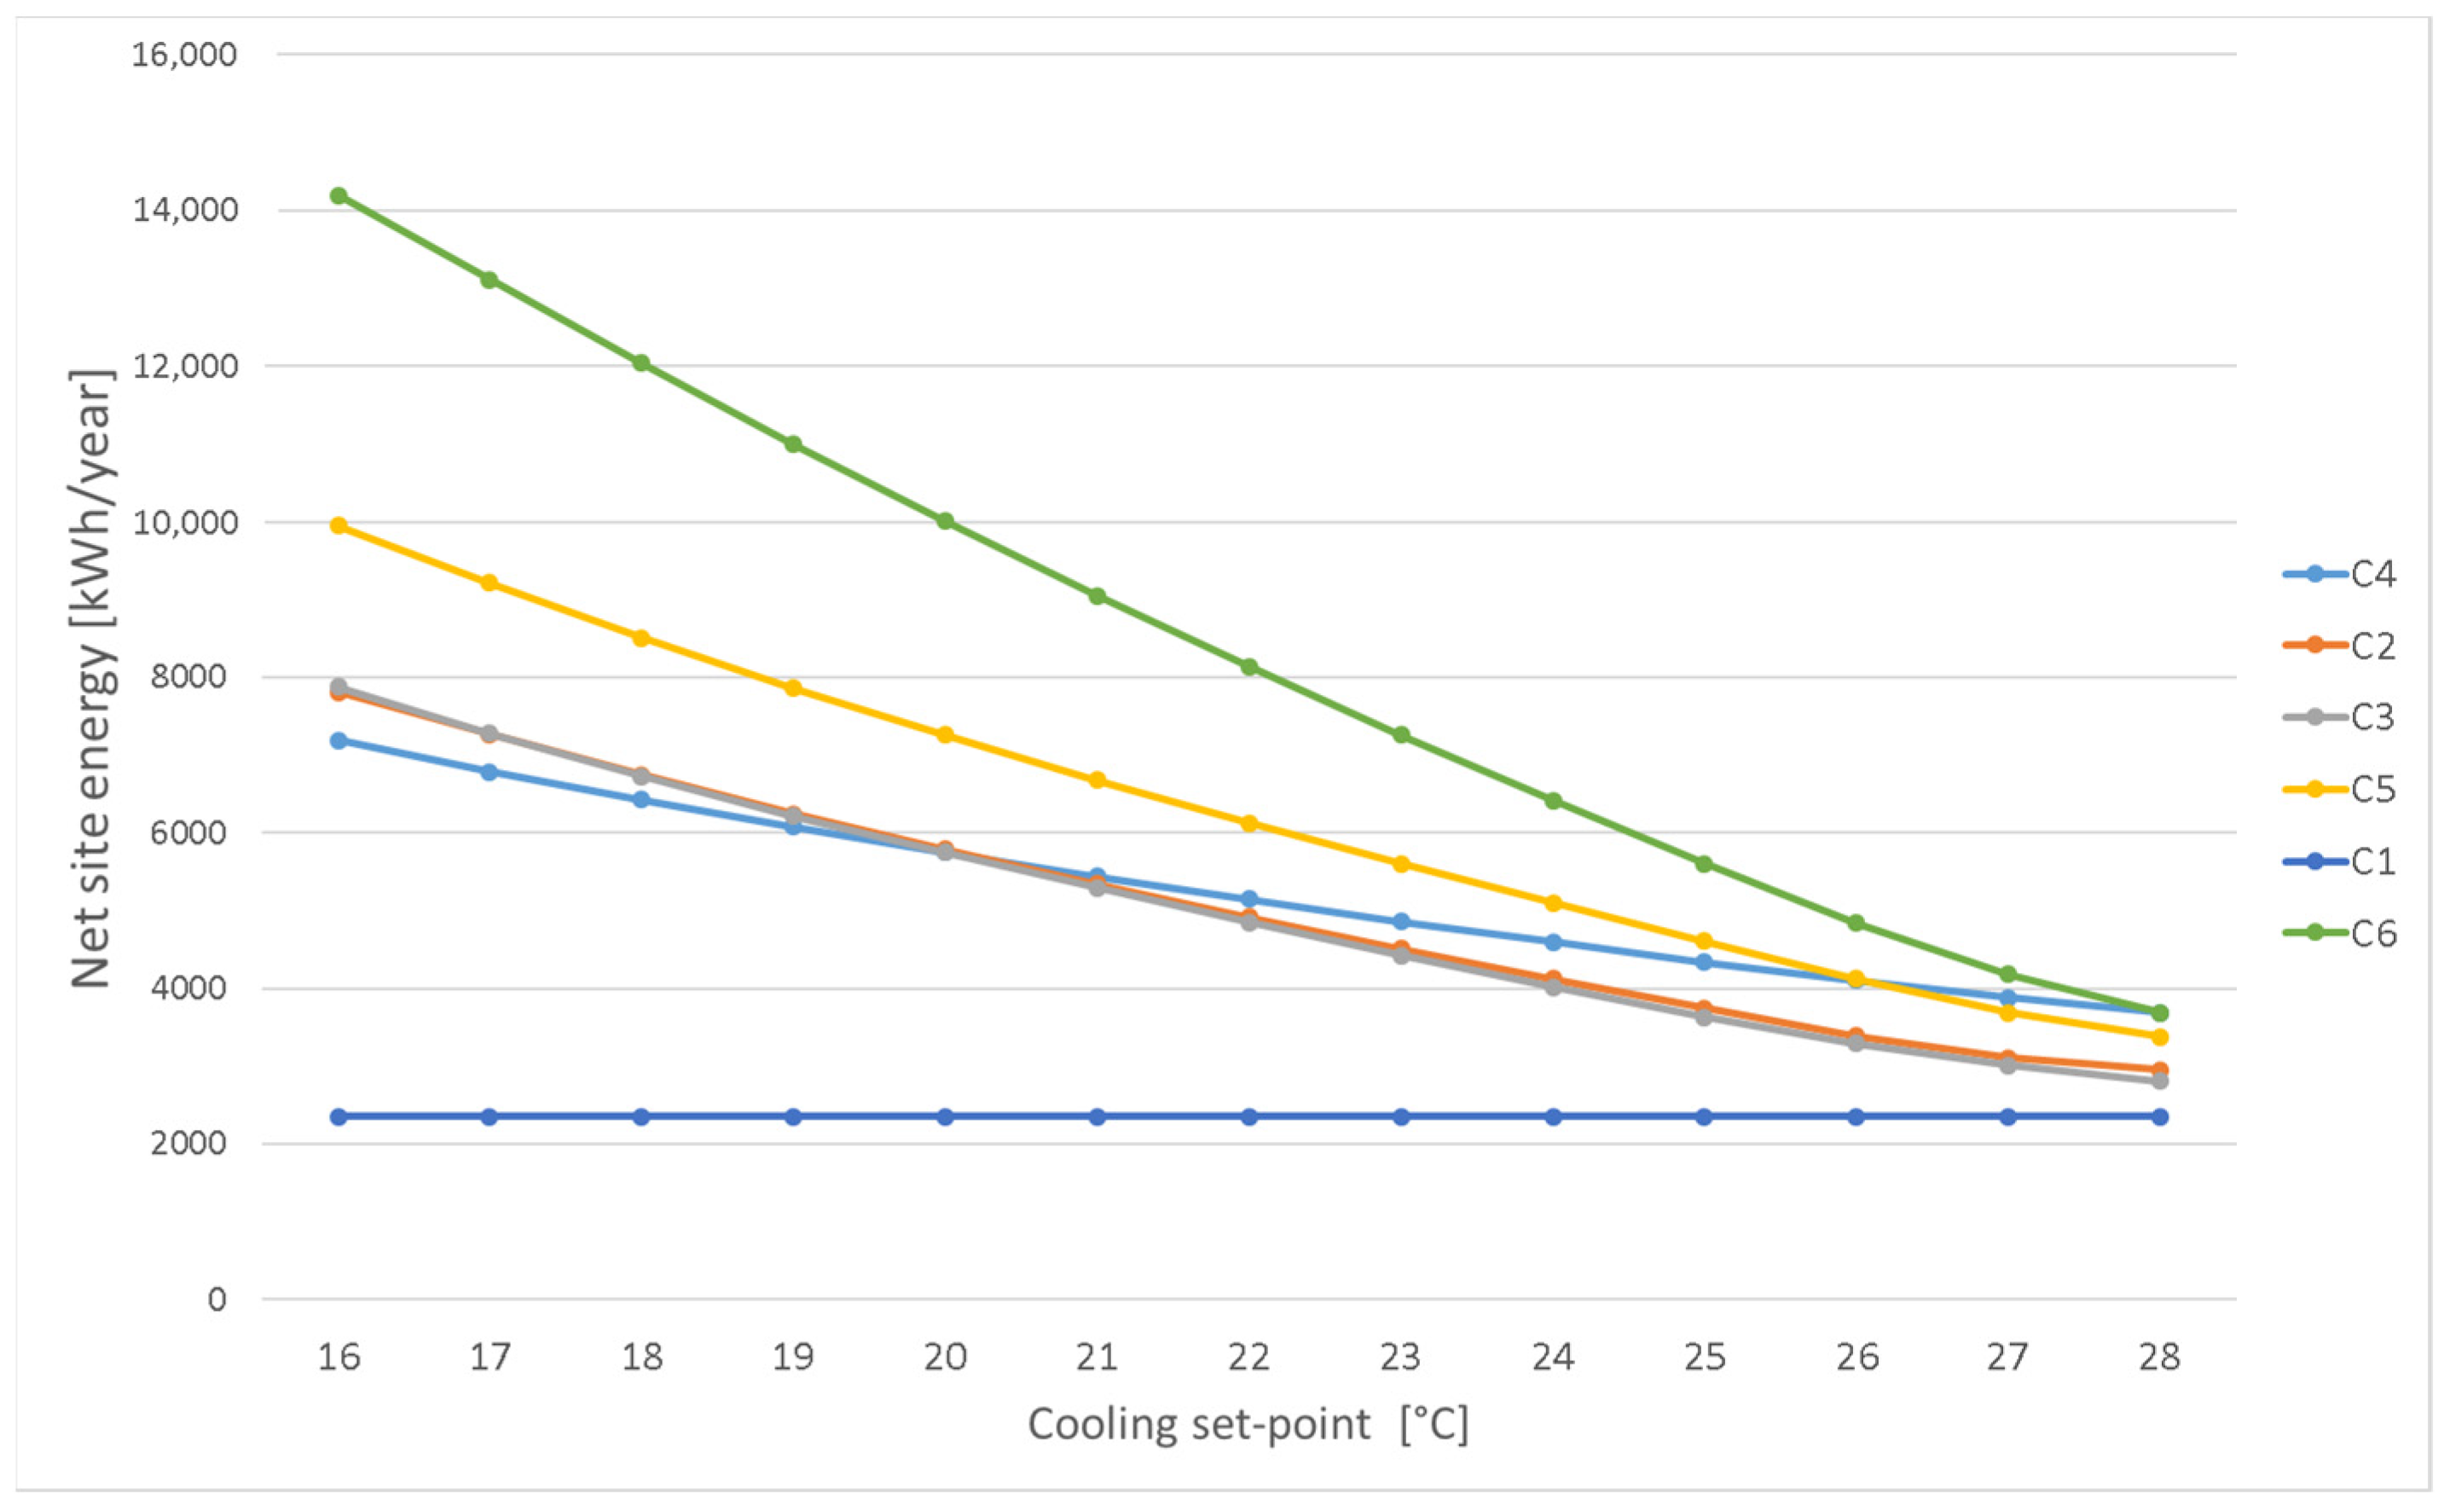
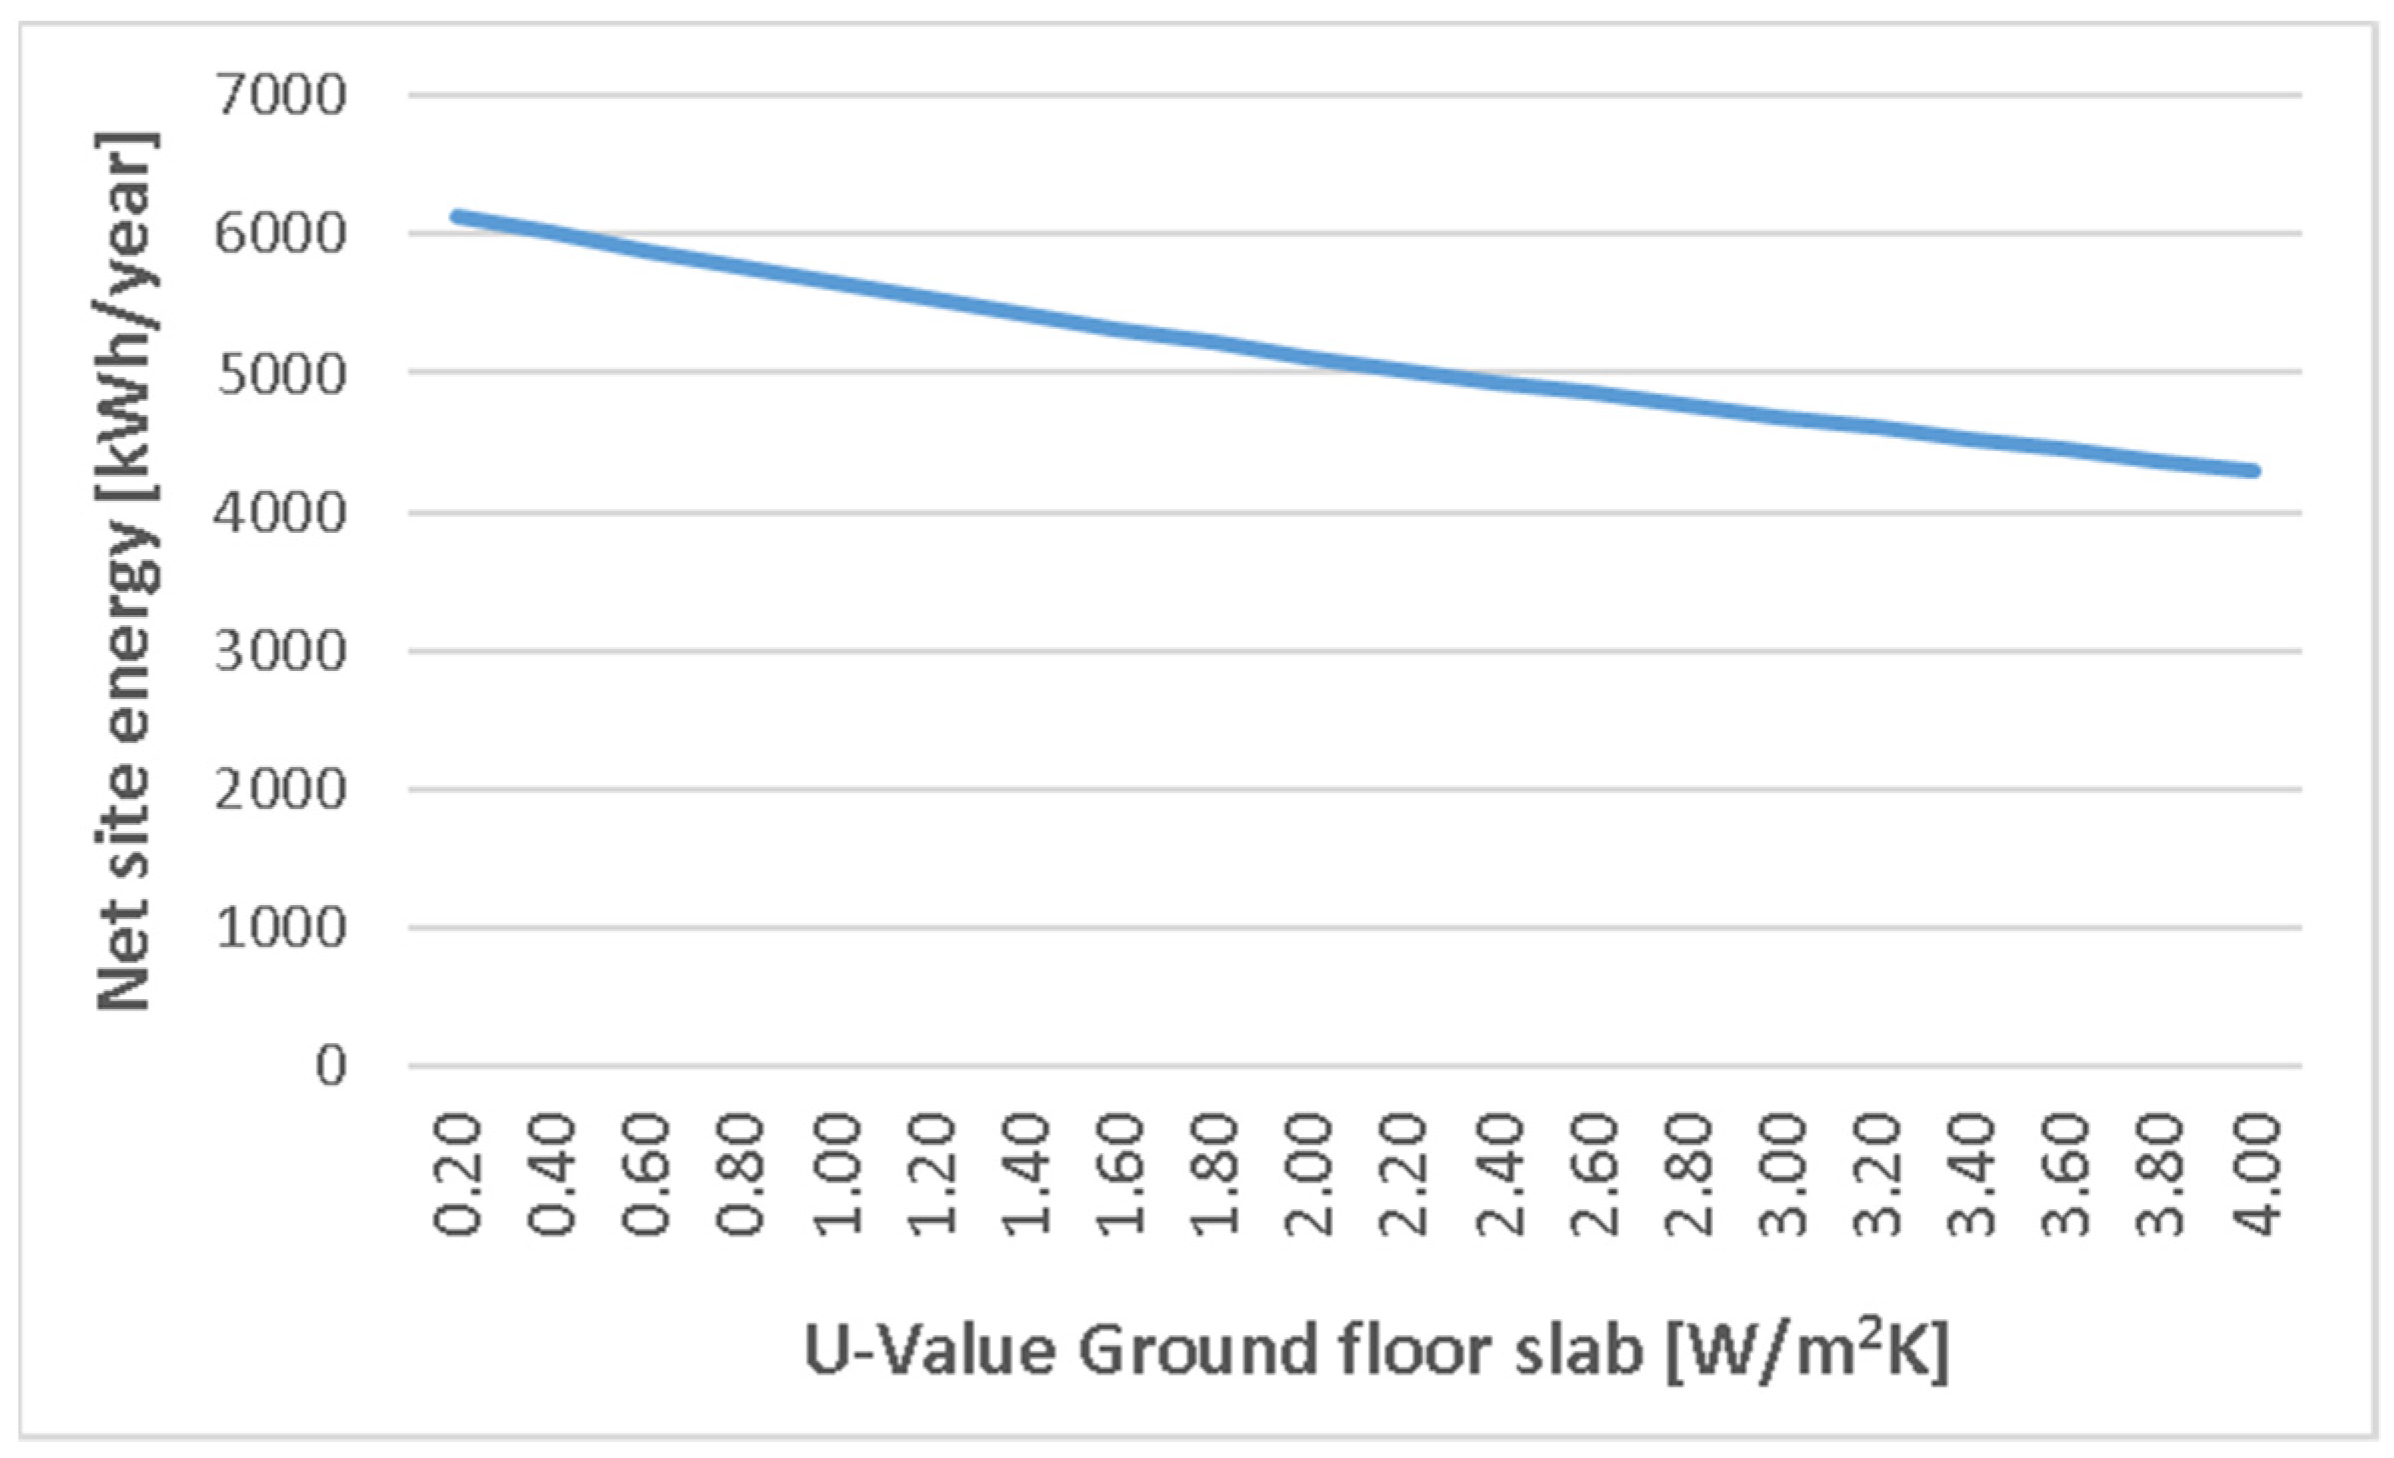
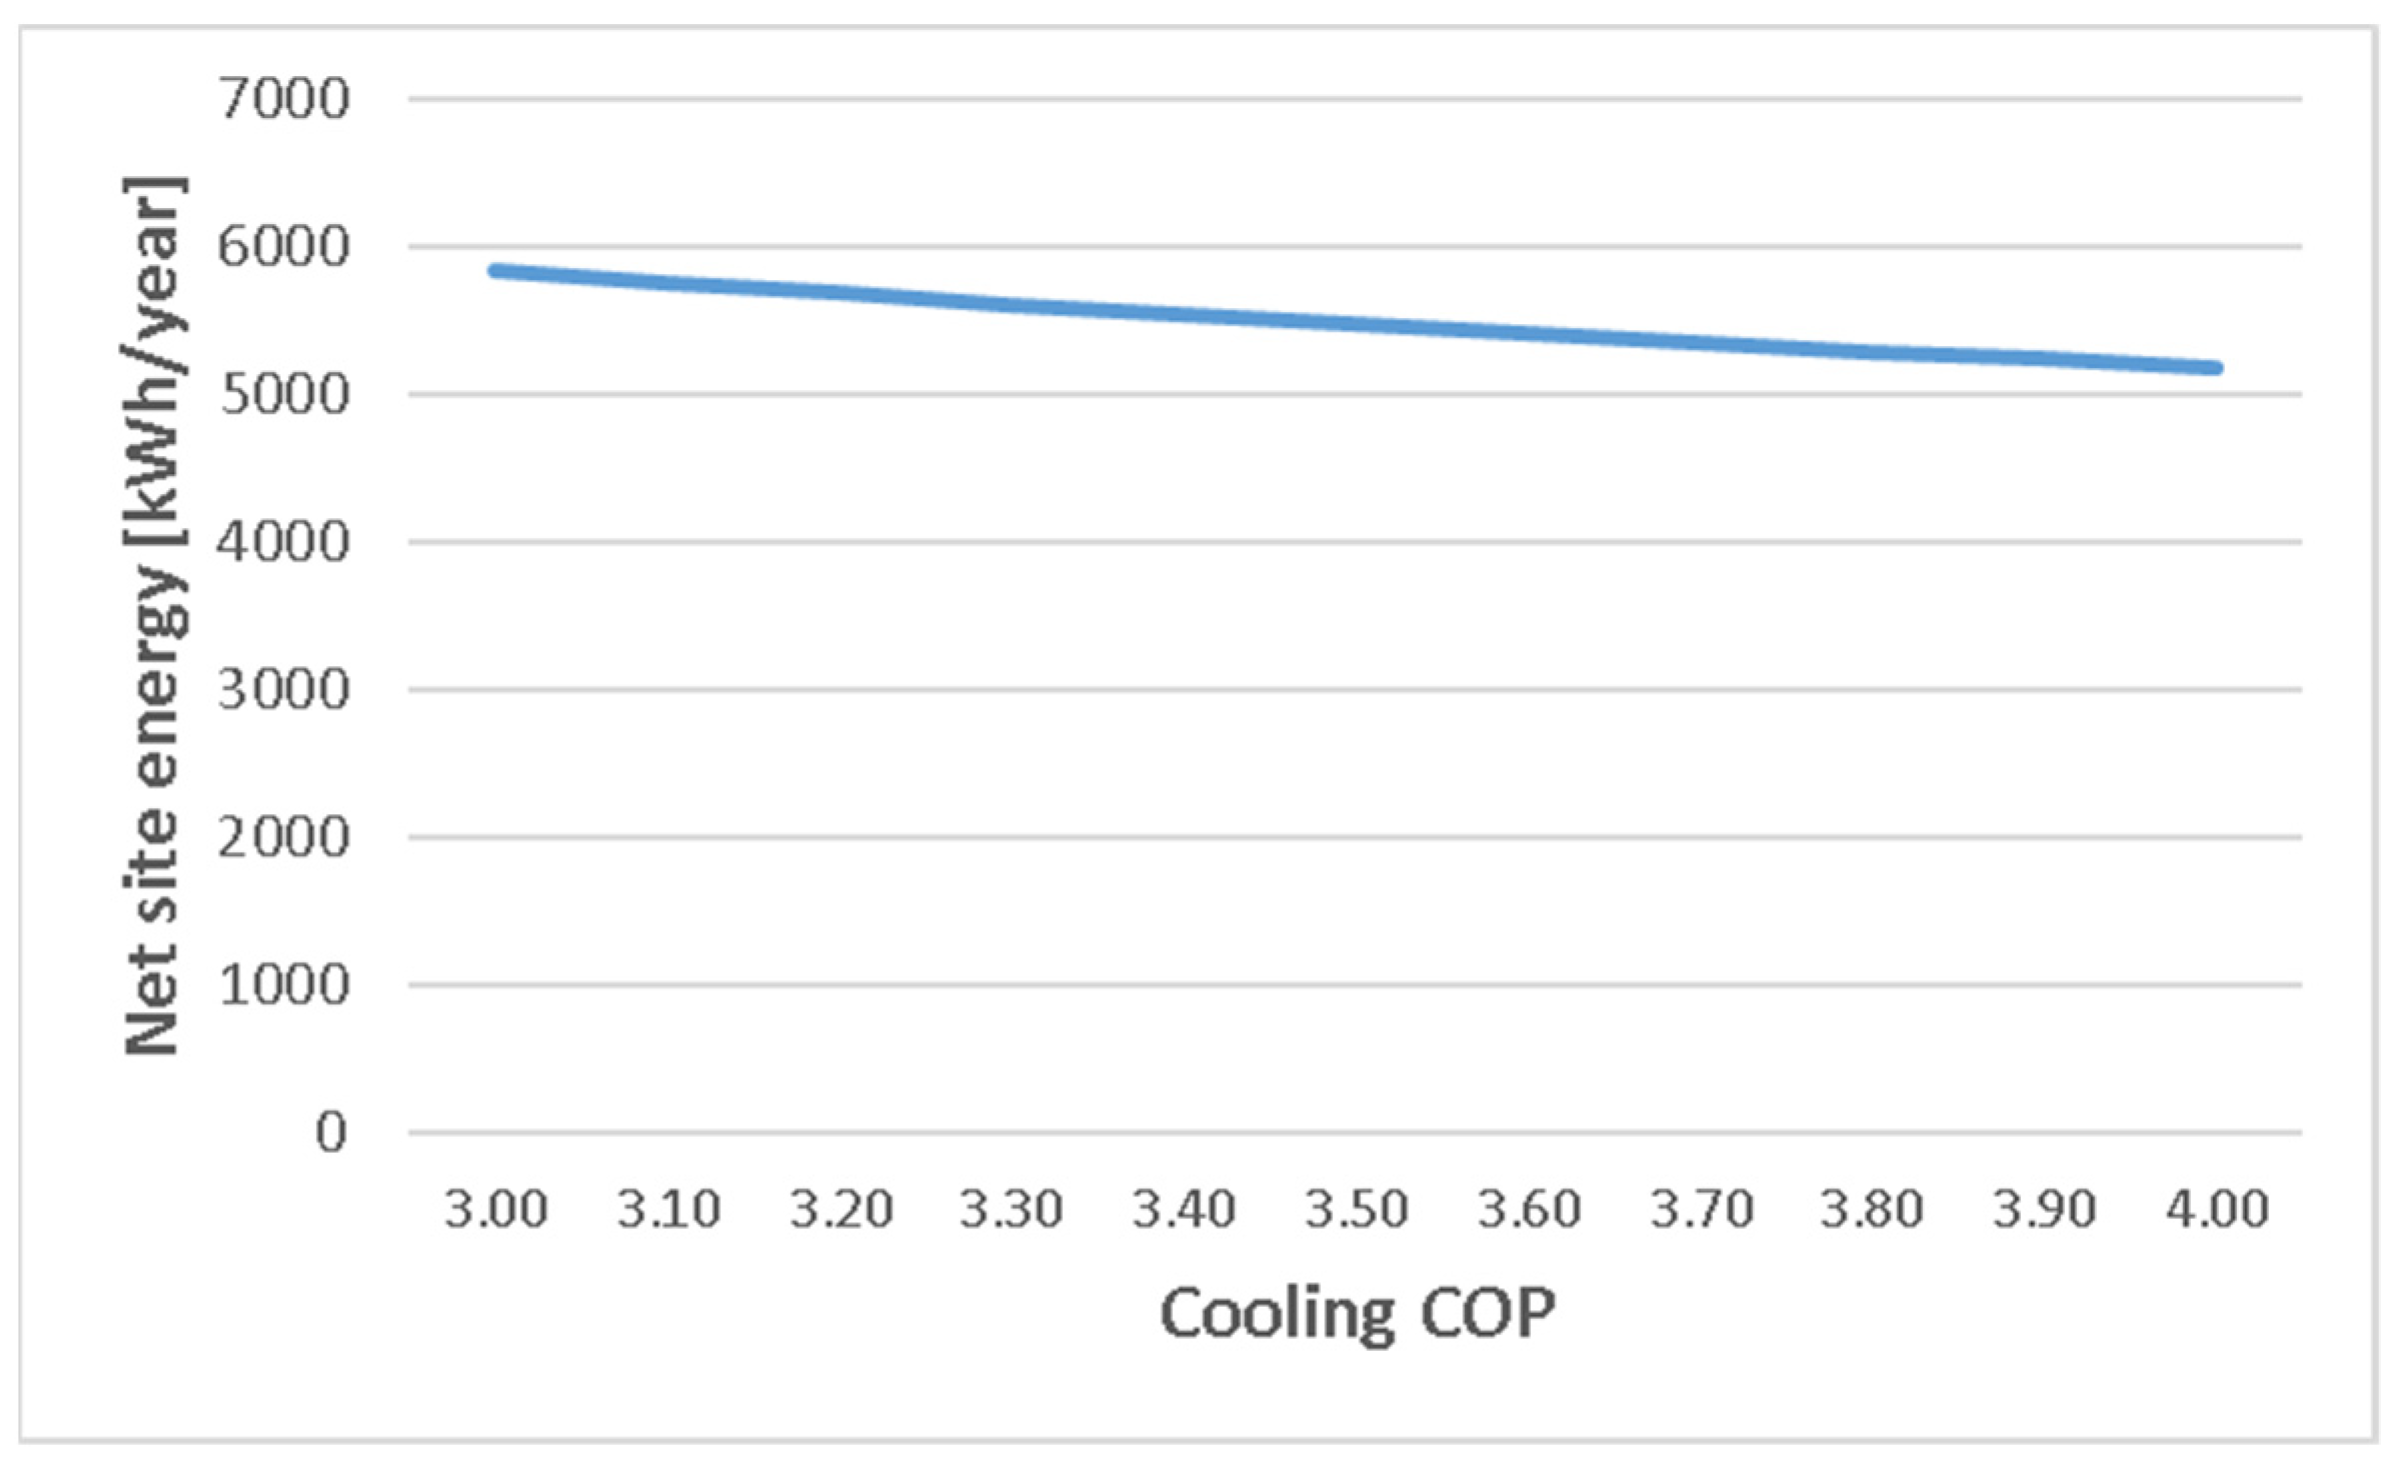
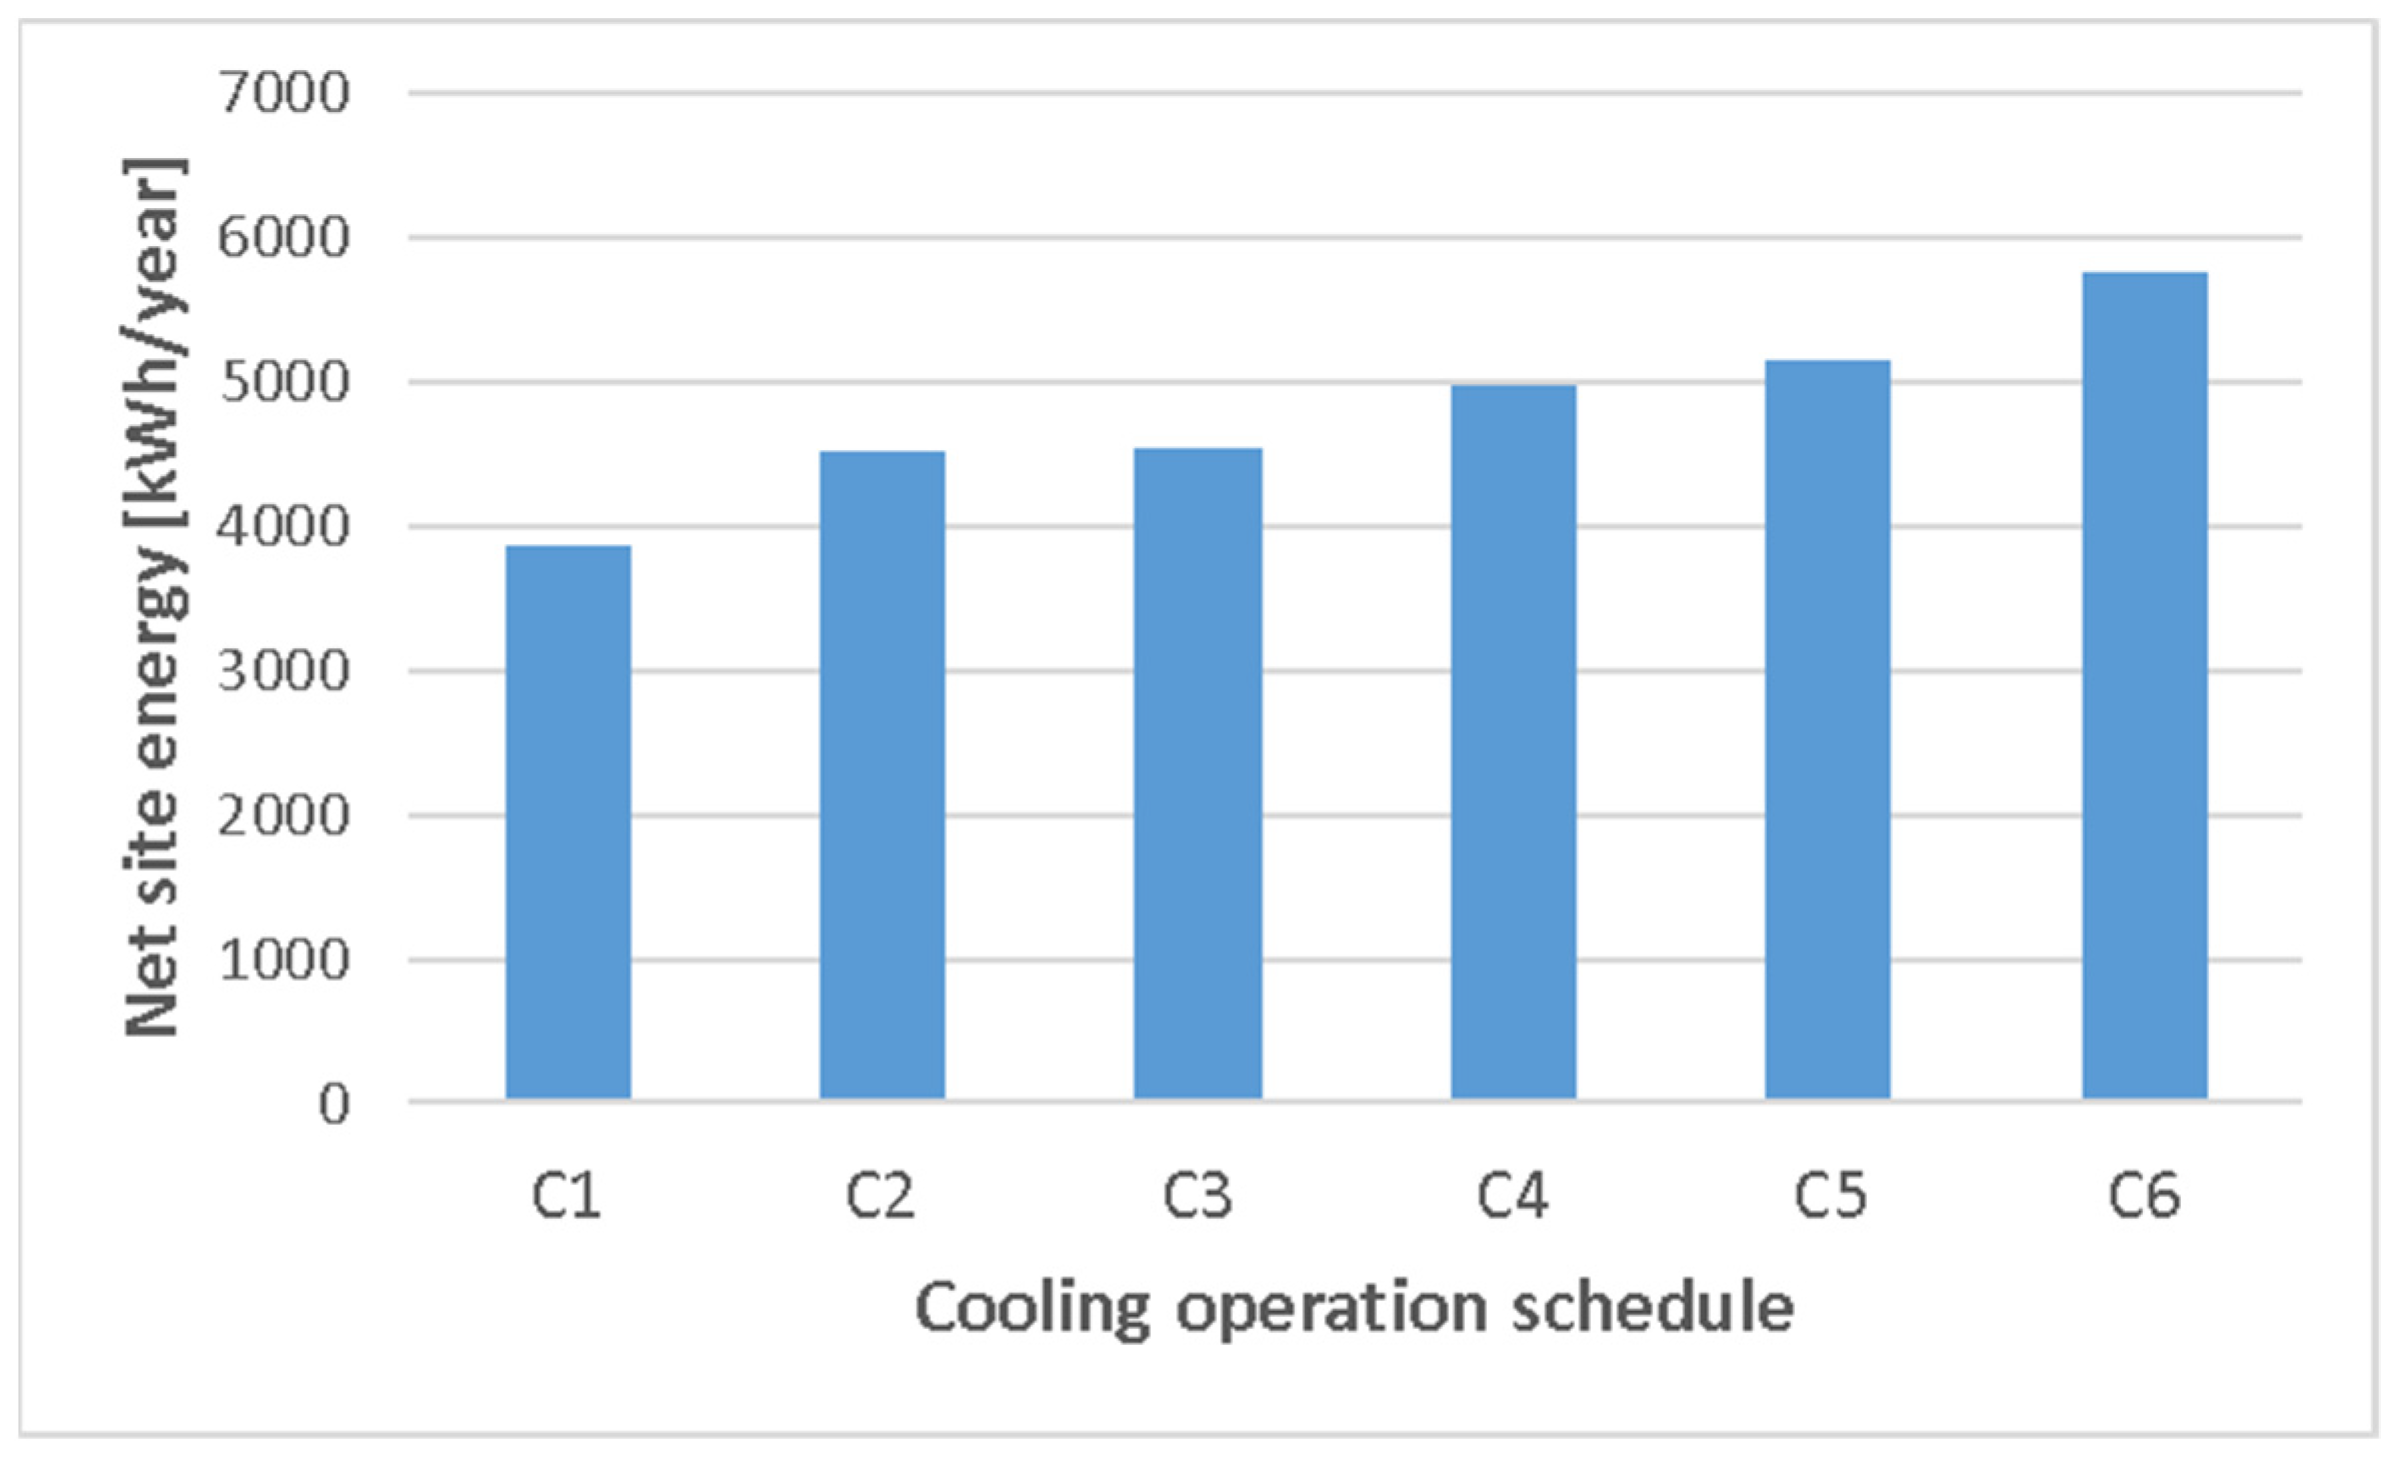
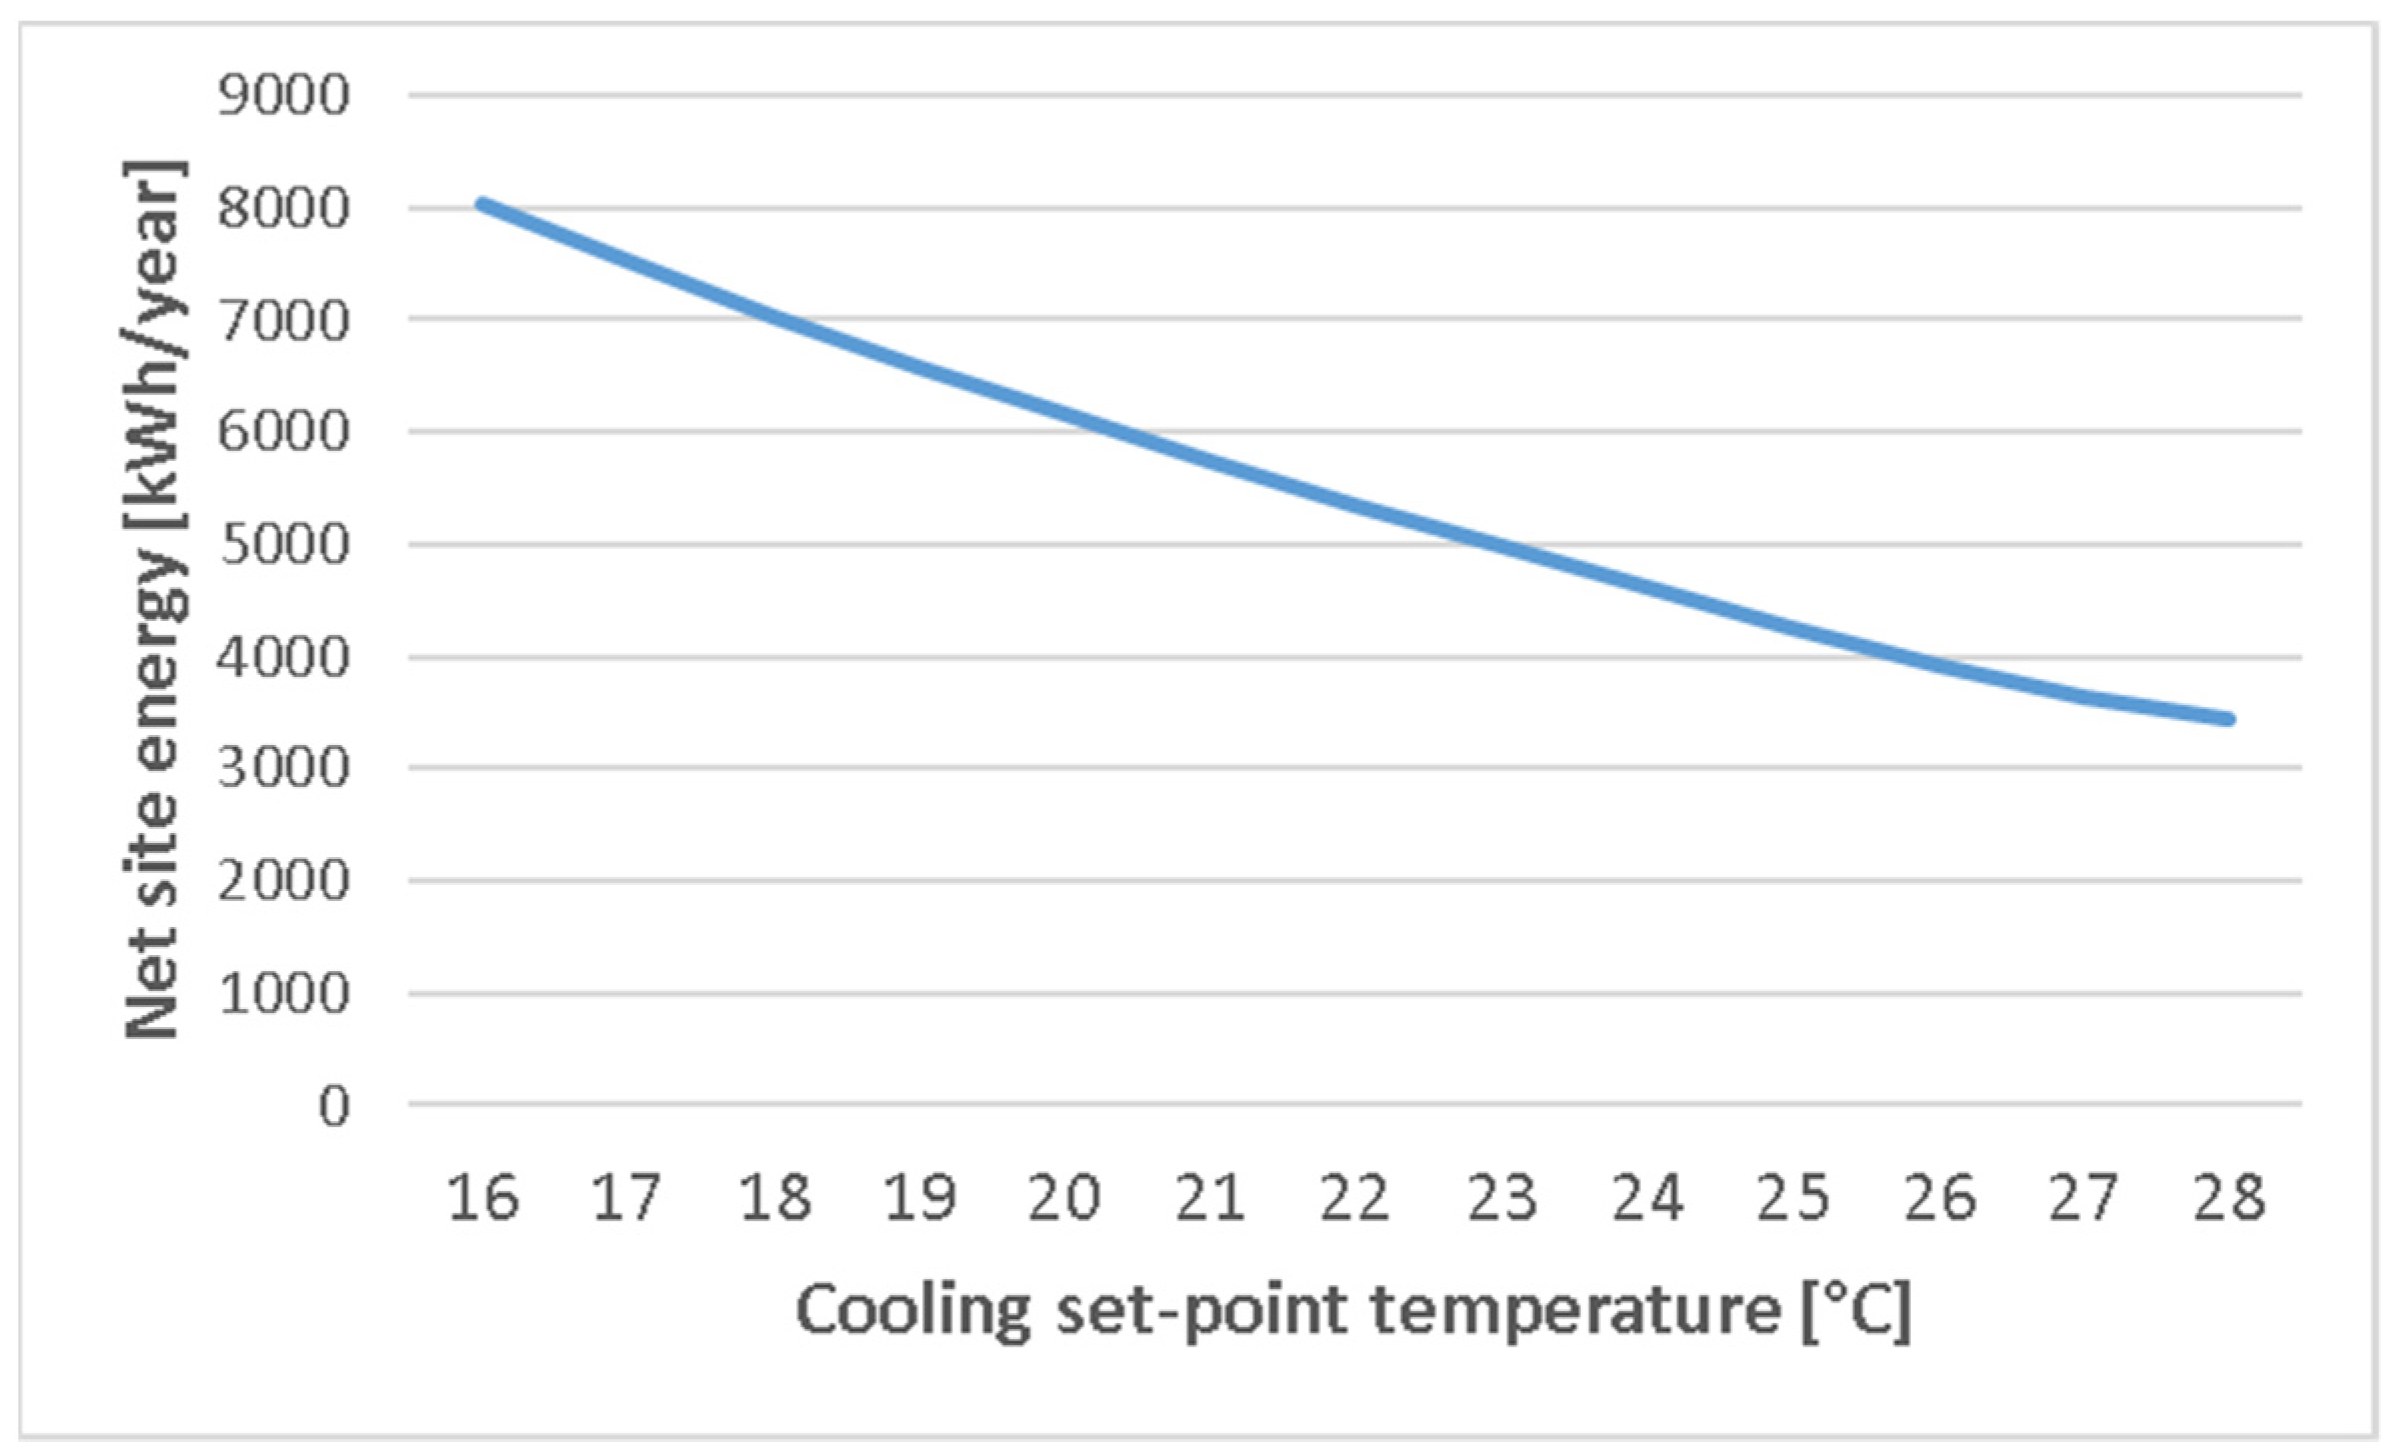
3.2. Parametric Analysis
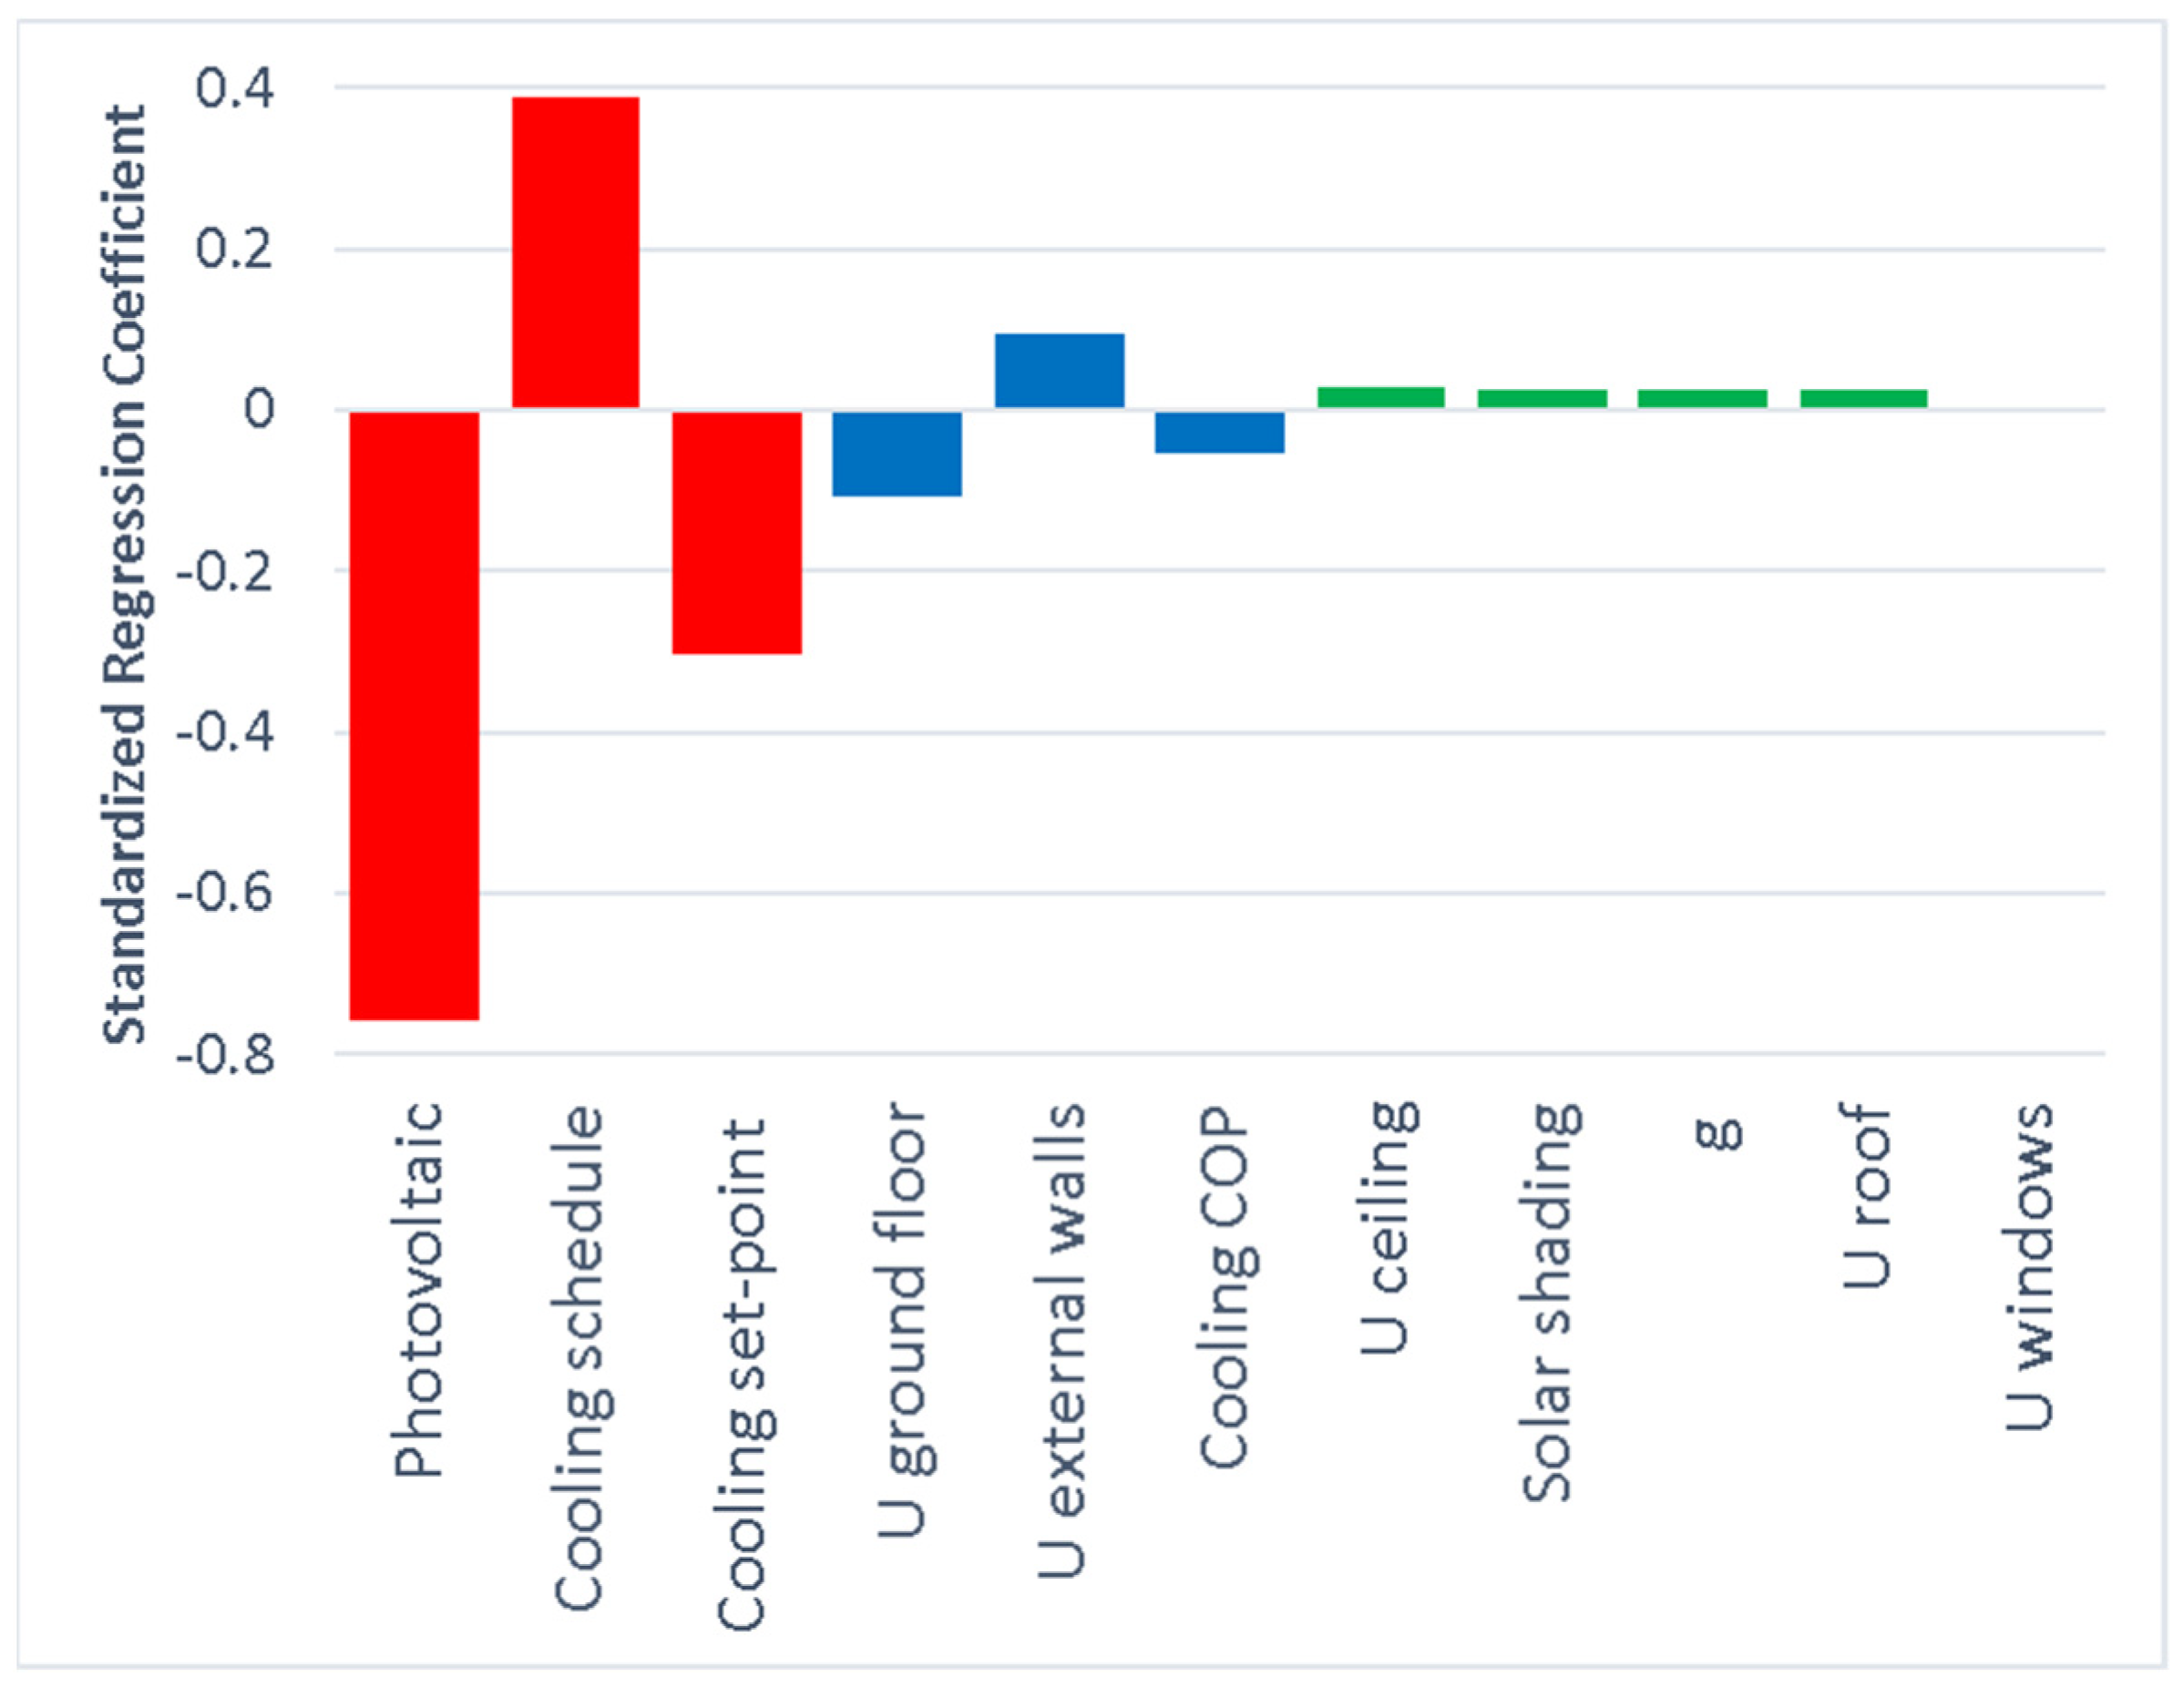
3.3. Sensitivity Analysis
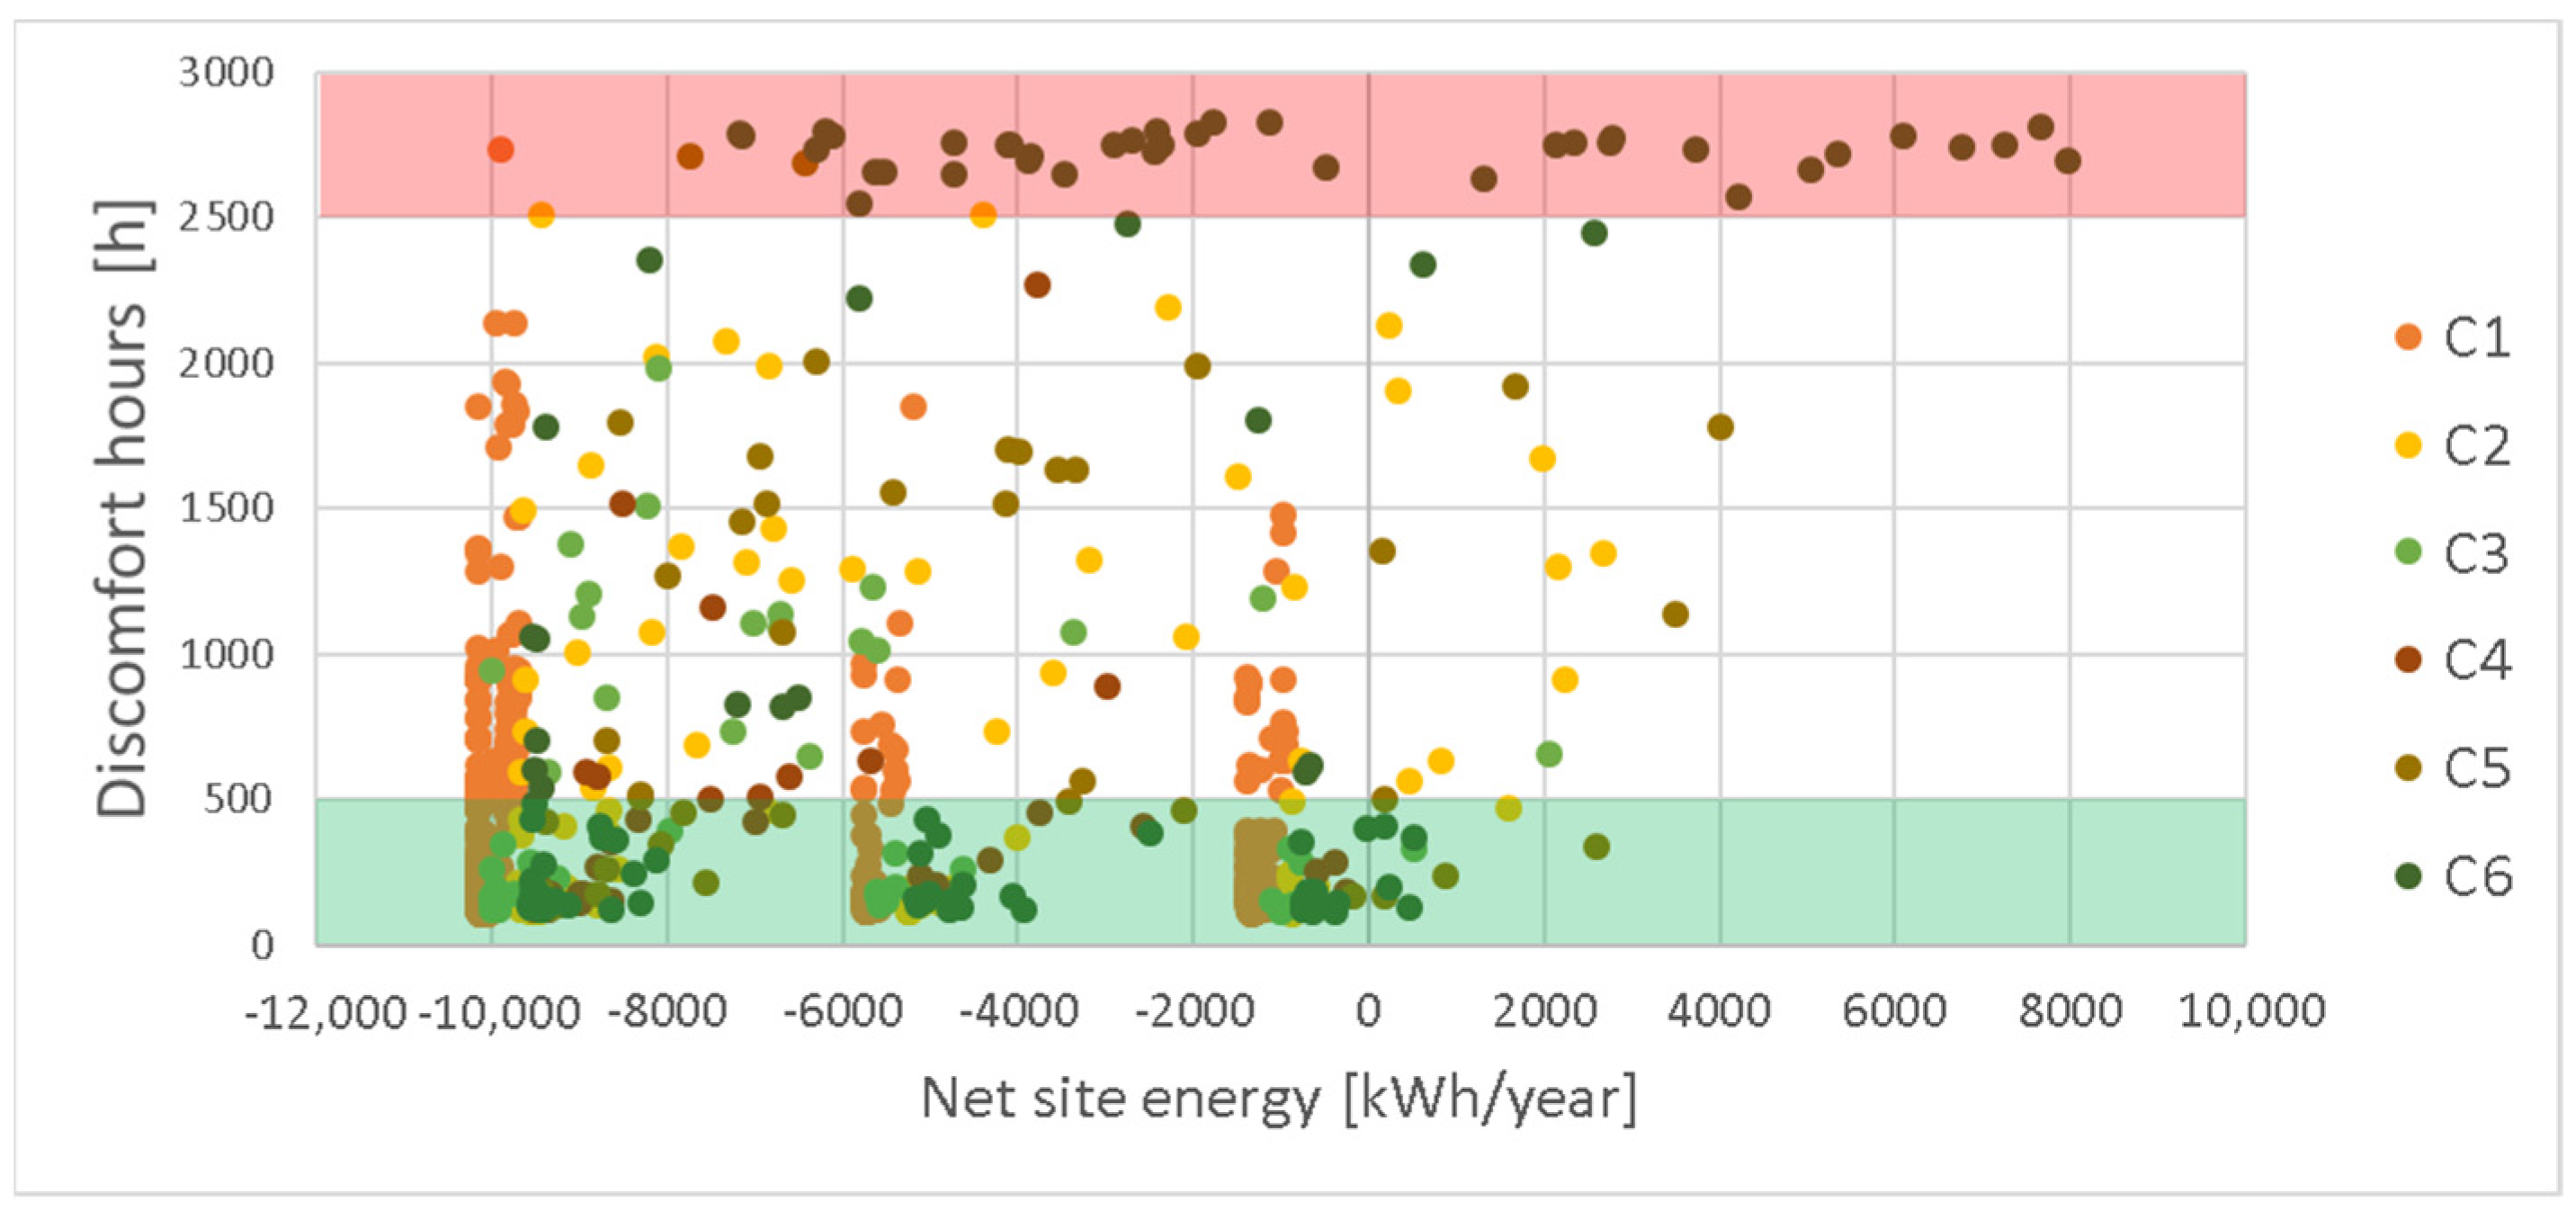
3.4. Optimization Analysis
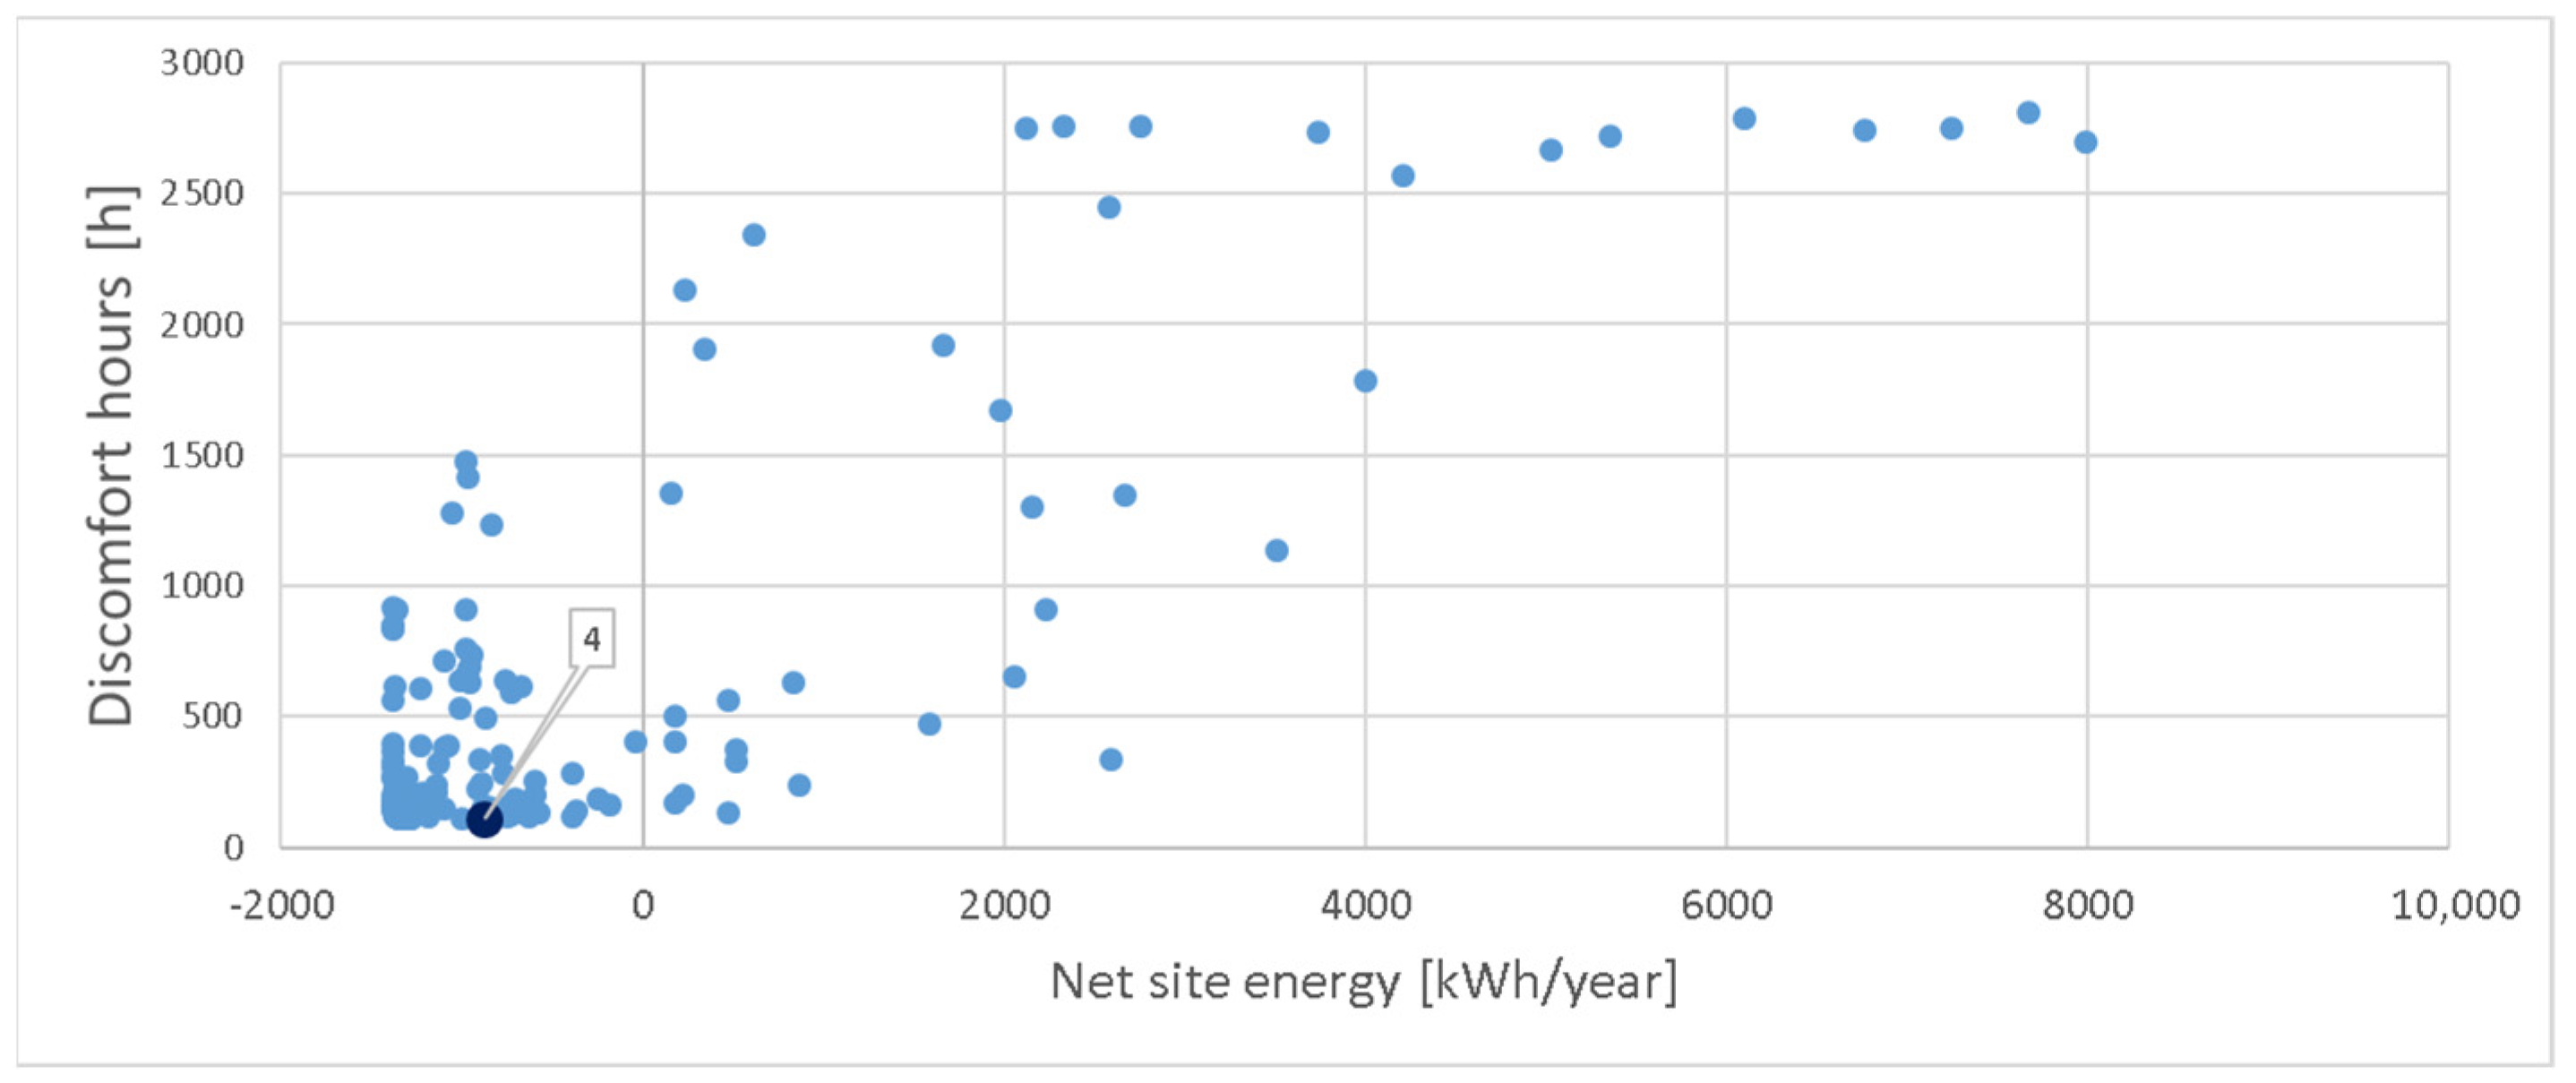
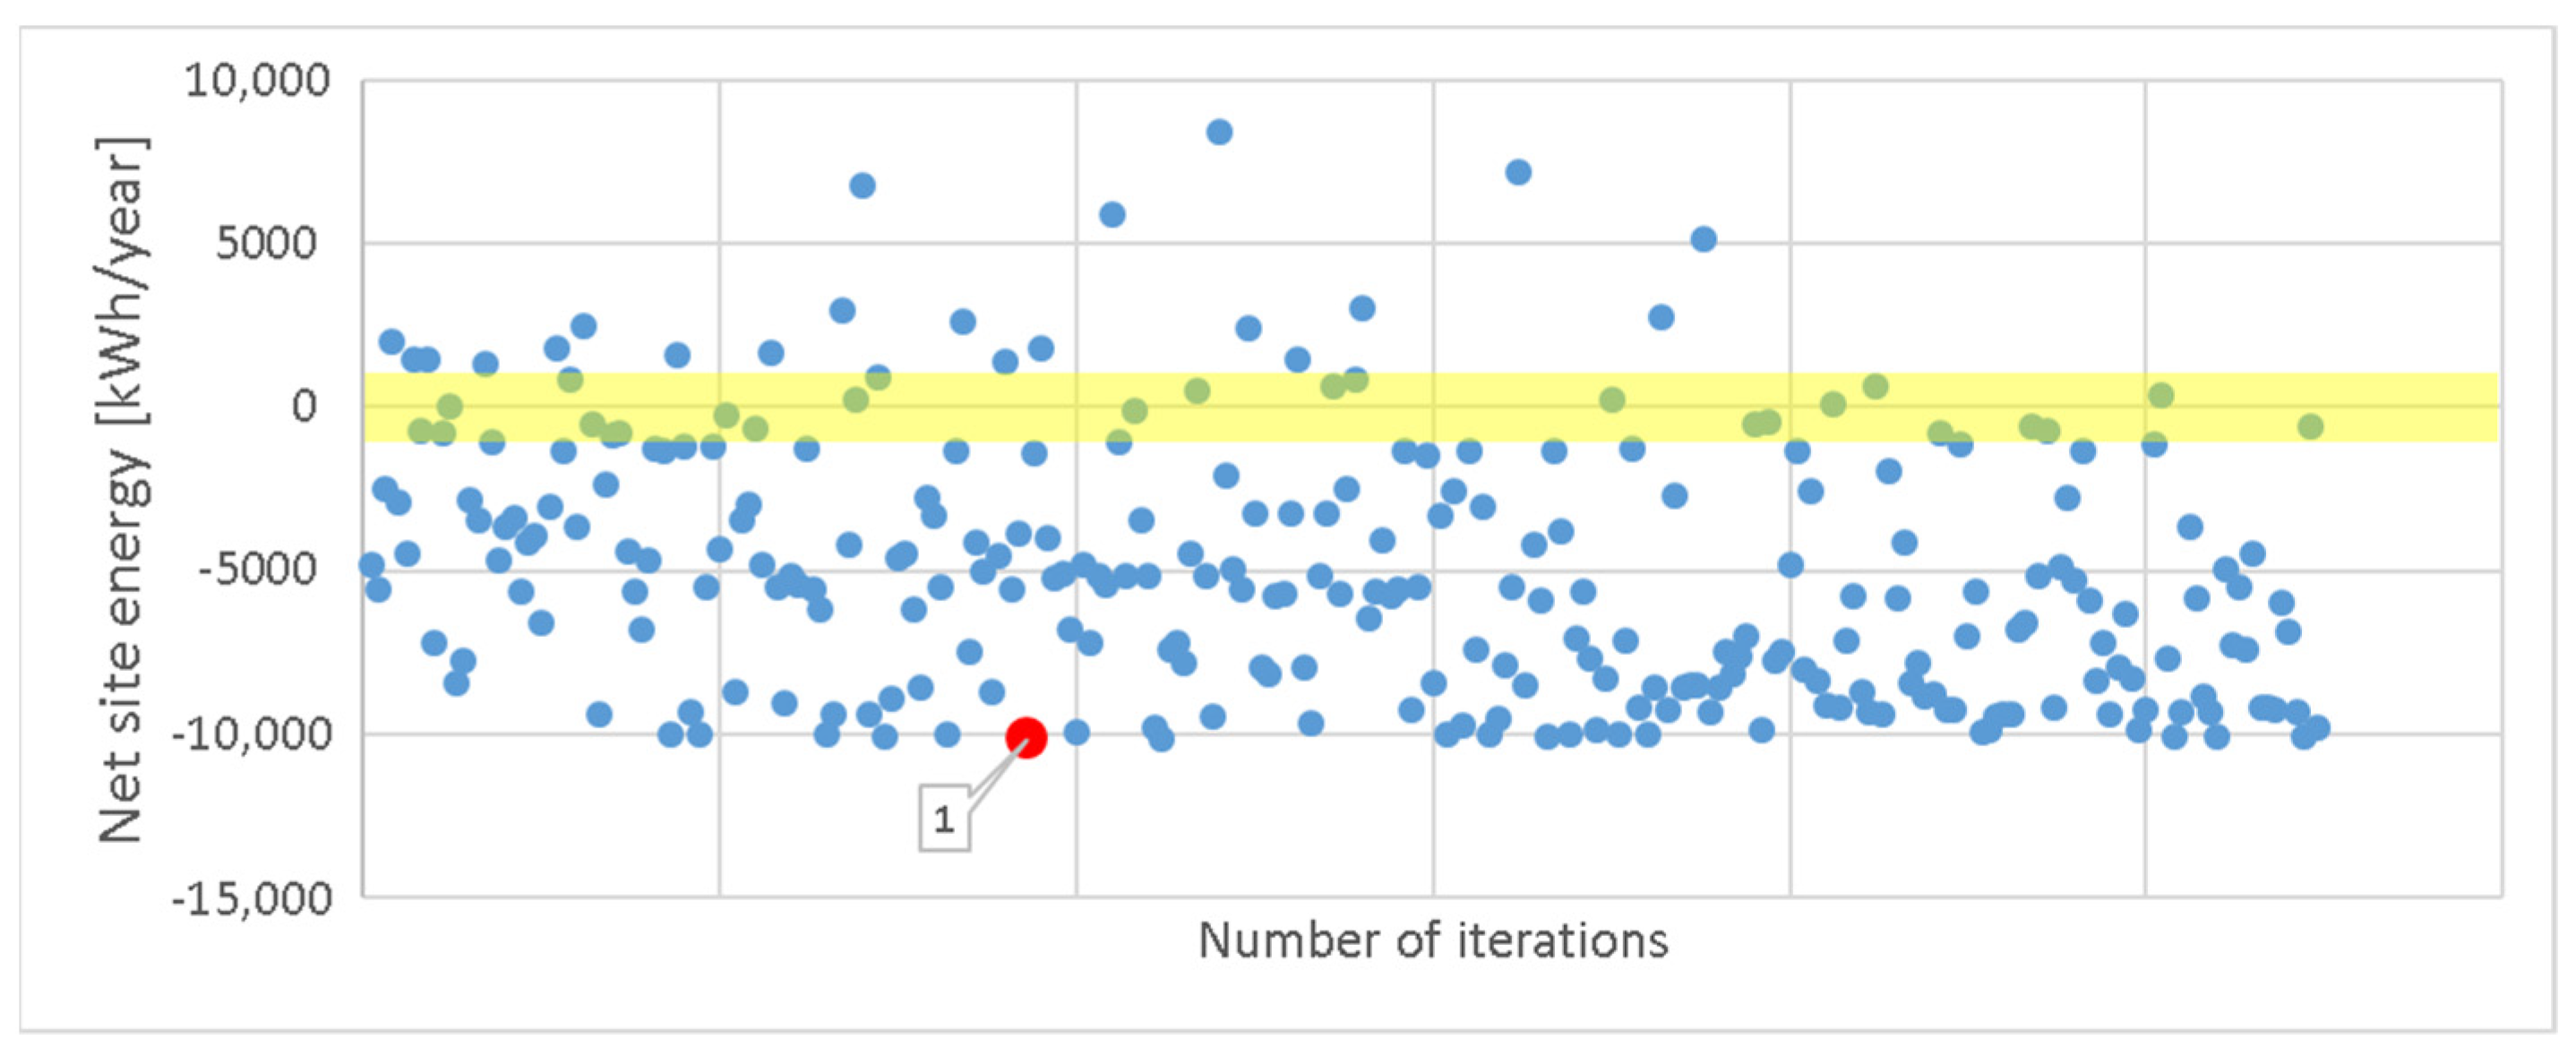
3.4.1. Optimization of Net Site Energy
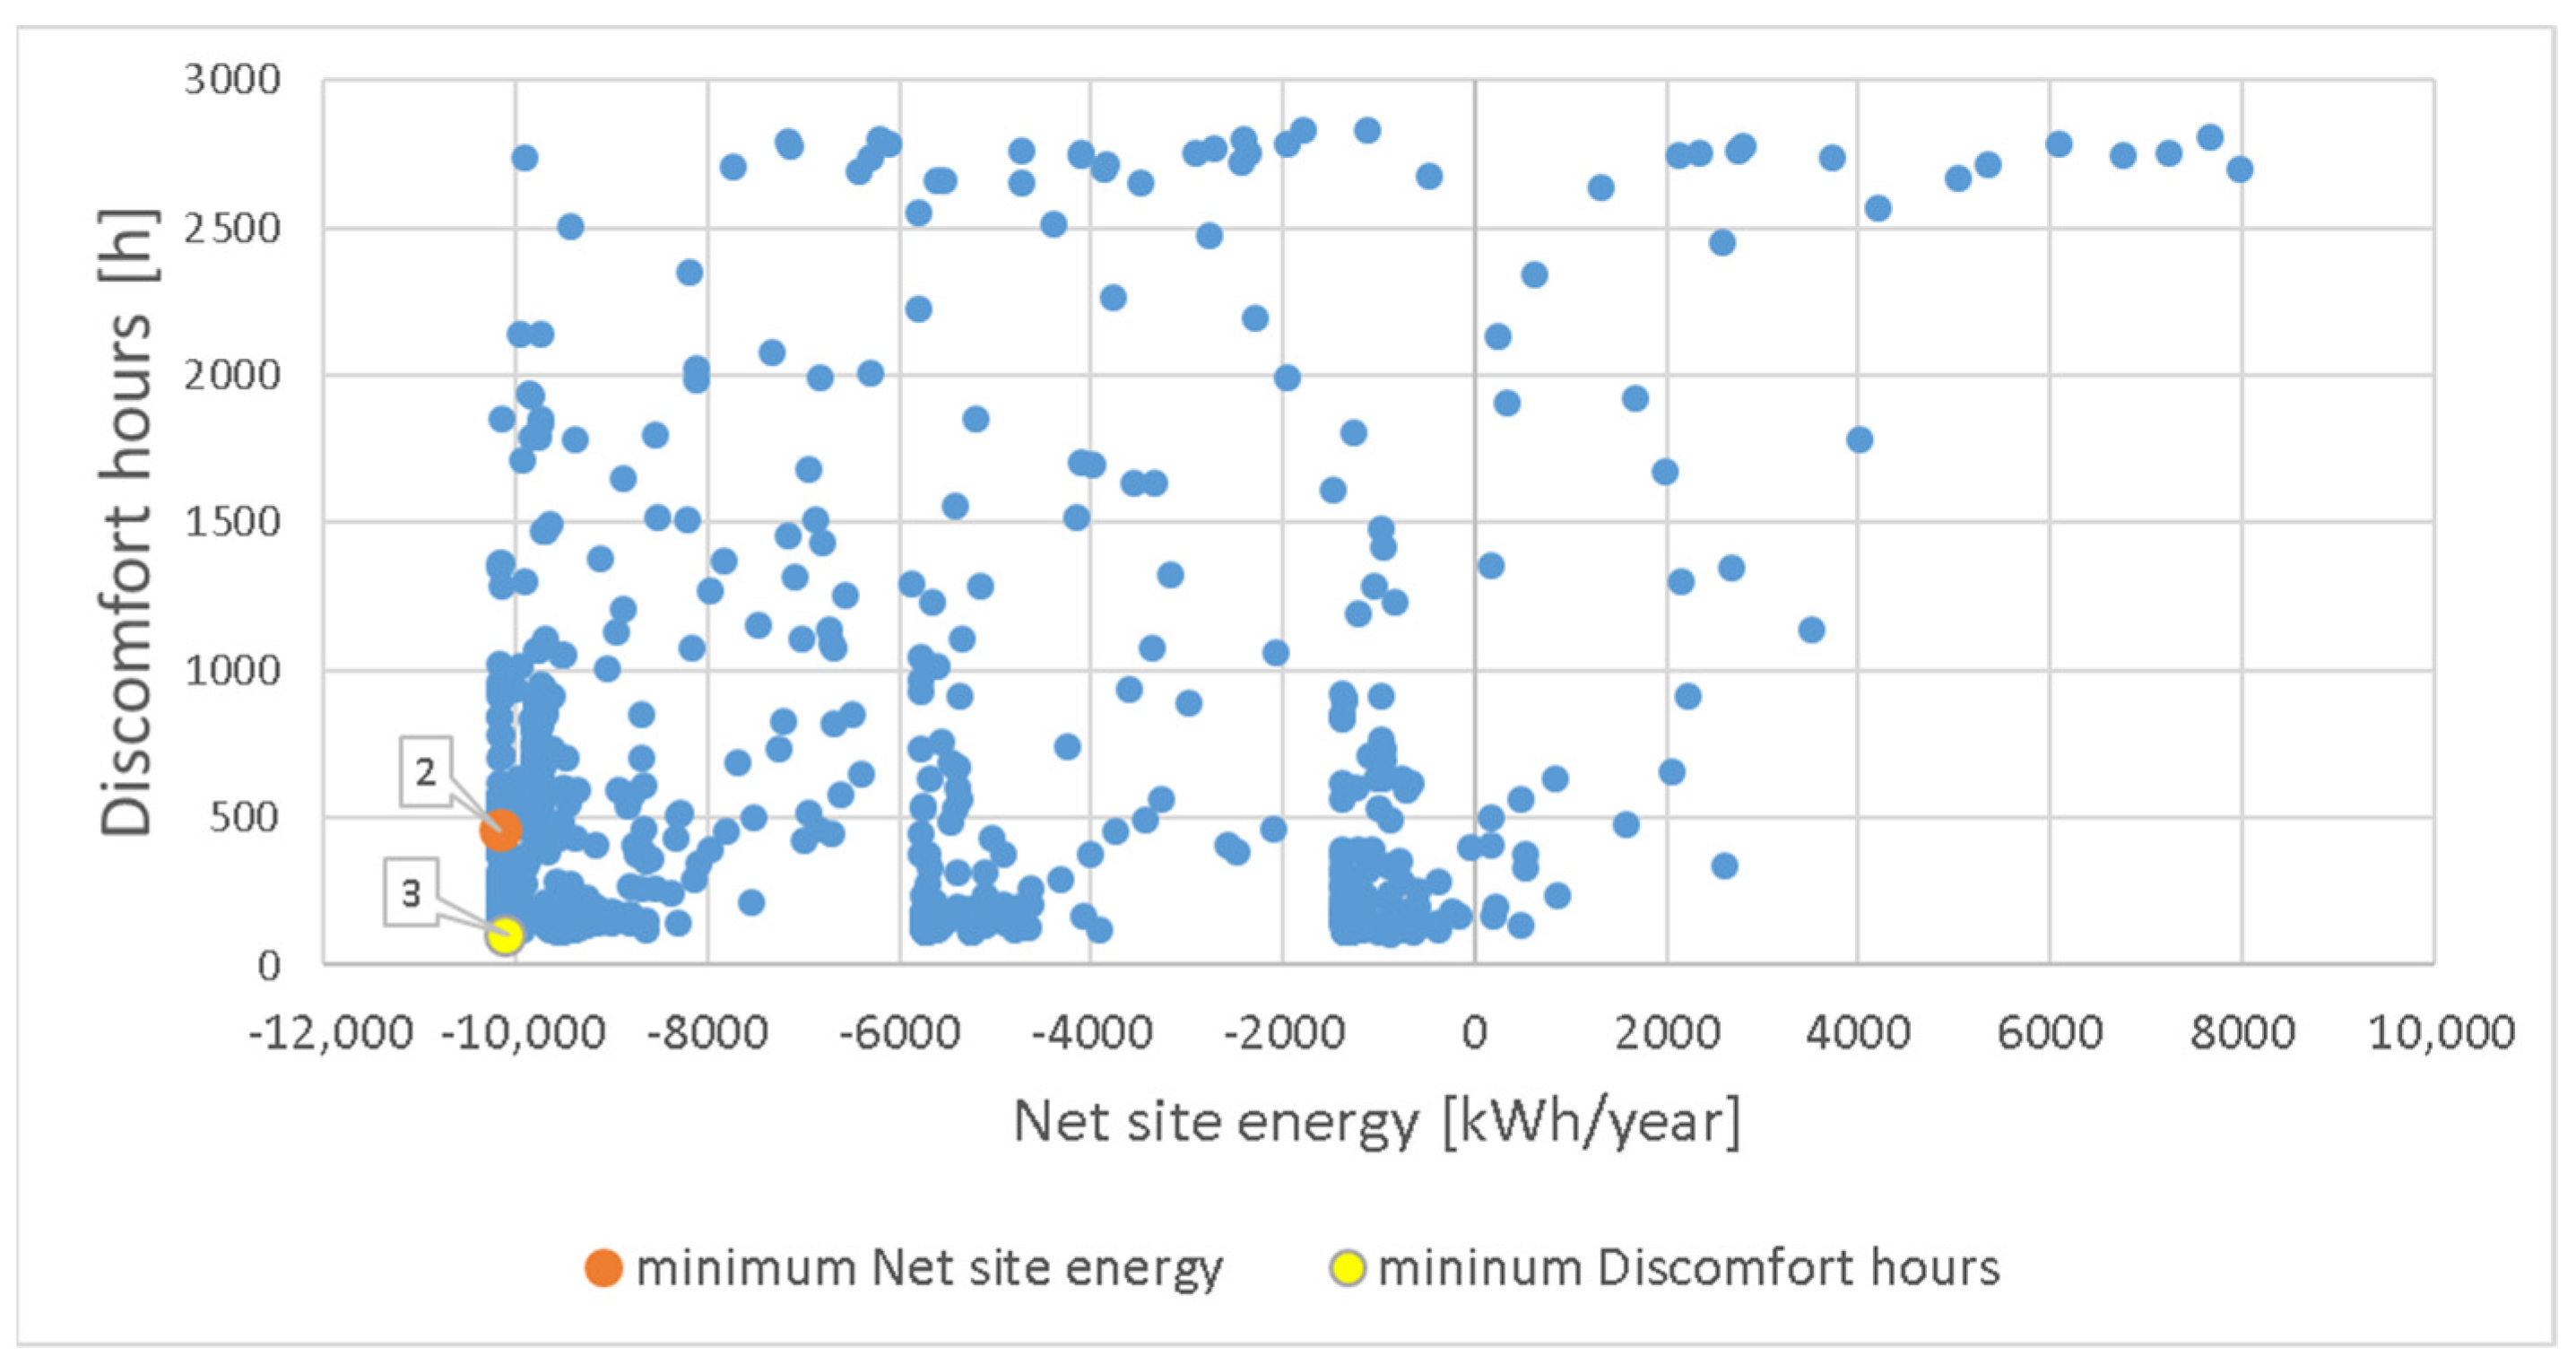
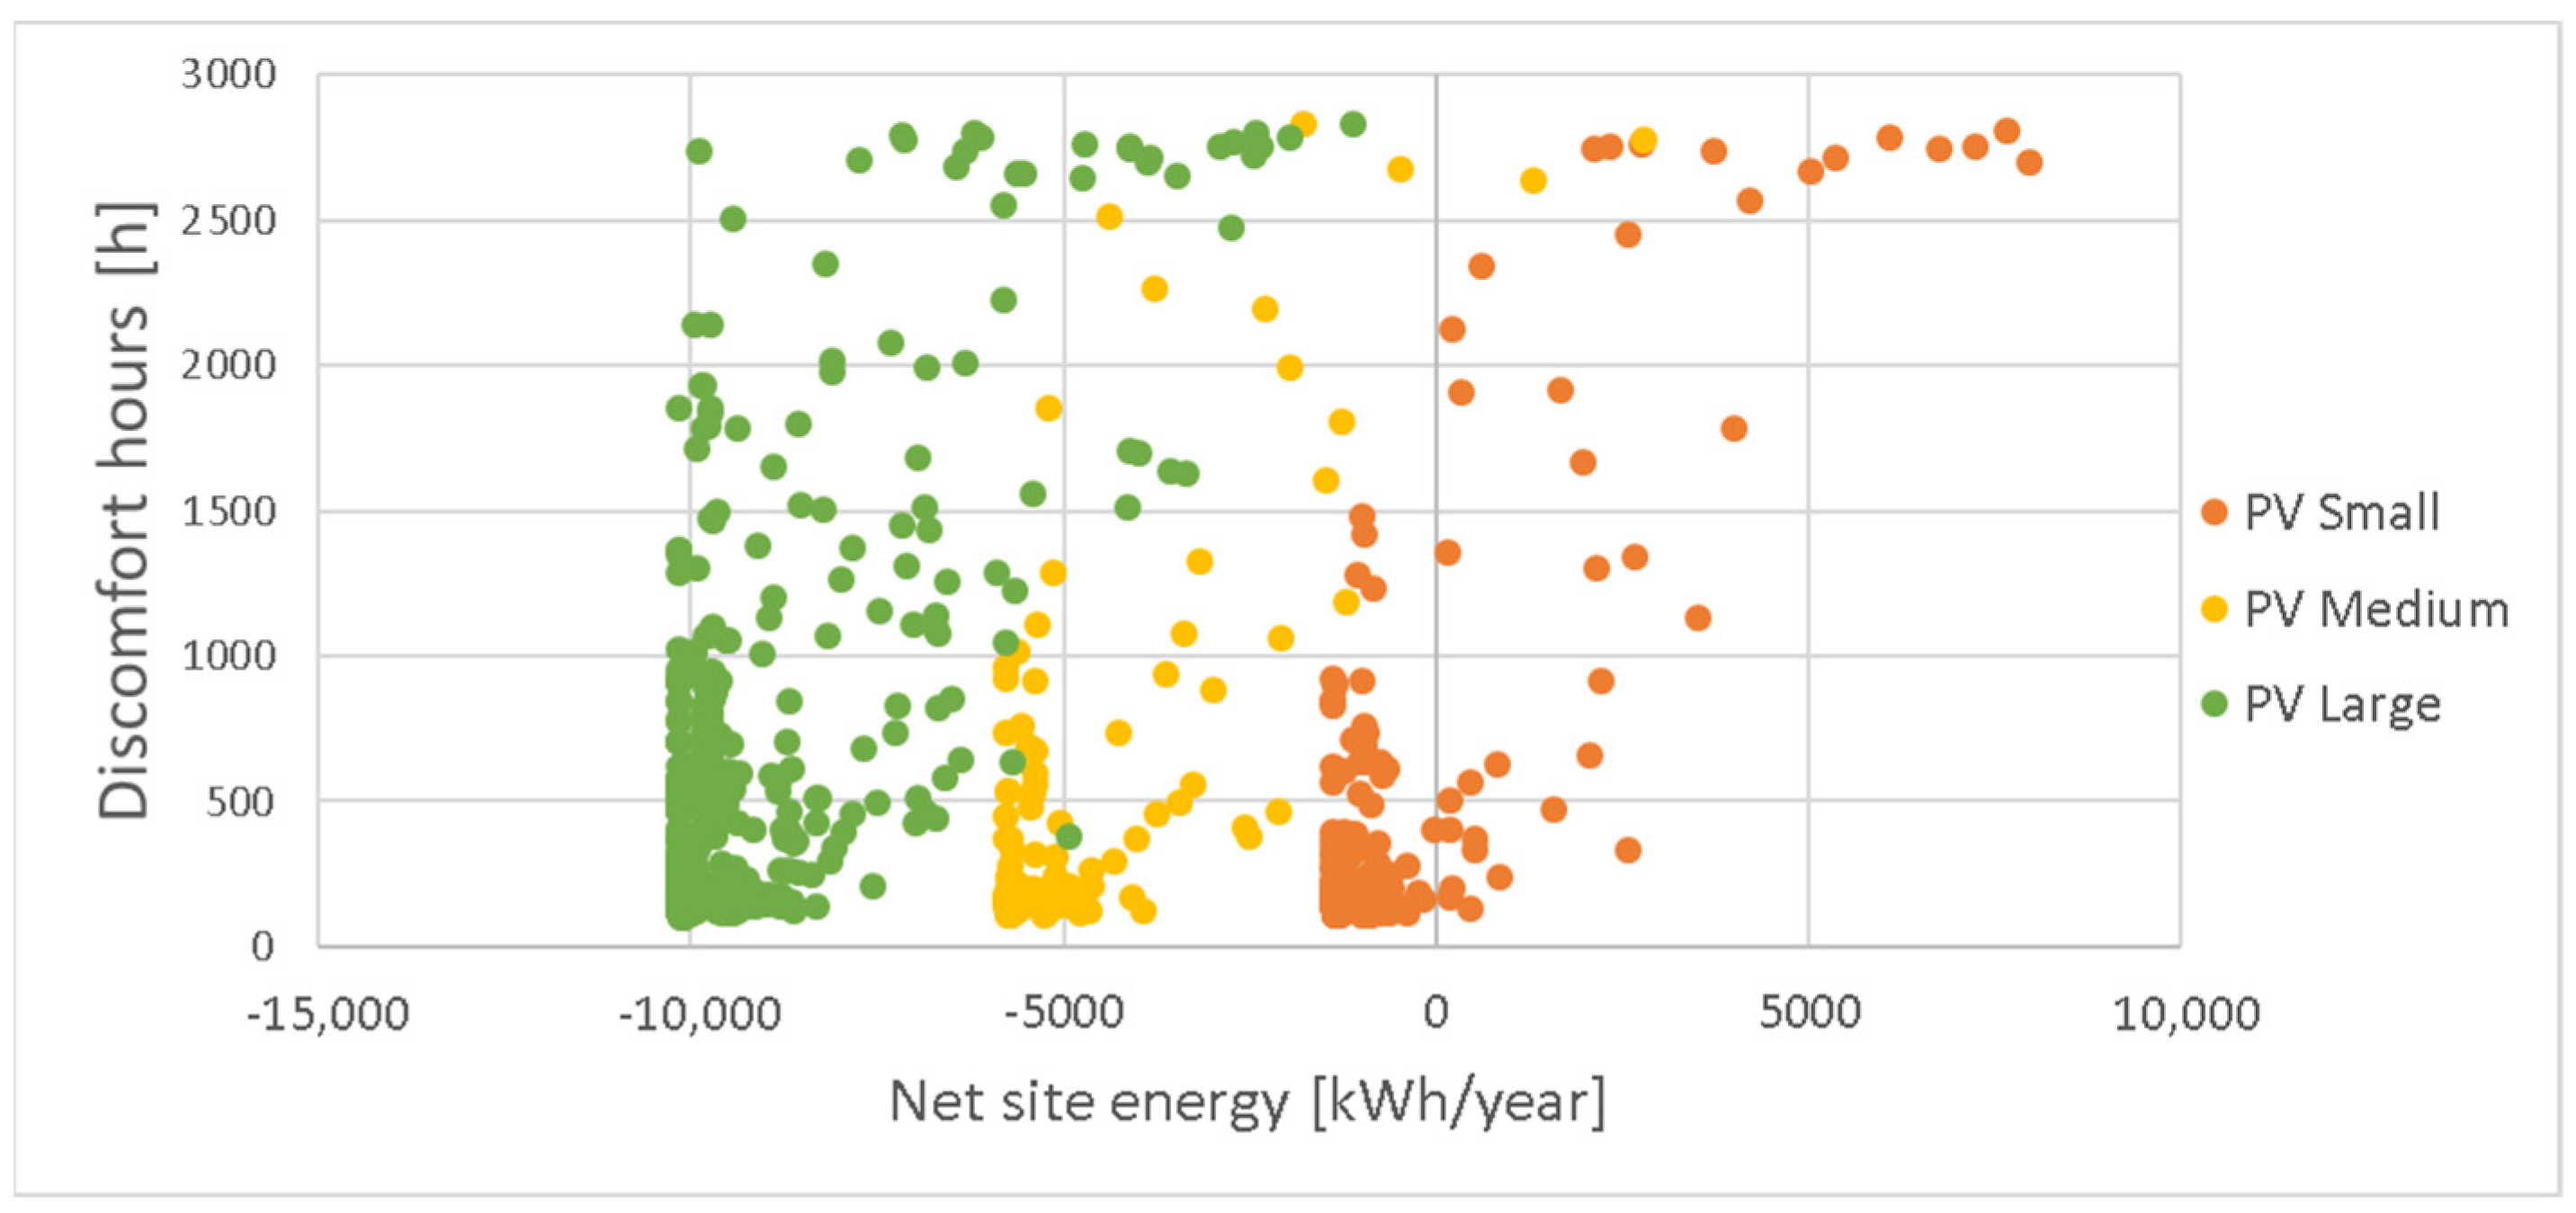
3.4.2. Optimization of Net Site Energy and Discomfort ASHRAE 80% Acceptability
4. Discussion
5. Conclusions
Author Contributions
Funding
Data Availability Statement
Conflicts of Interest
References
- López-Ochoa, L.M.; Las-Heras-Casas, J.; Olasolo-Alonso, P.; López-González, L.M. Towards nearly zero-energy buildings in Mediterranean countries: Fifteen years of implementing the Energy Performance of Buildings Directive in Spain (2006–2020). J. Build. Eng. 2021, 44, 102962. [Google Scholar] [CrossRef]
- Economidou, M.; Todeschi, V.; Bertoldi, P.; D’Agostino, D.; Zangheri, P.; Castellazzi, L. Review of 50 years of EU energy efficiency policies for buildings. Energy Build. 2020, 225, 110322. [Google Scholar] [CrossRef]
- European Union. Directive 2010/31/EU of the European Parliament and of the Council of 19 May 2010 on the energy performance of buildings (recast). Off. J. Eur. Union 2010, 53, 13–35. [Google Scholar] [CrossRef]
- Attia, S.; Kurnitski, J.; Kosiński, P.; Borodiņecs, A.; Belafi, Z.D.; István, K.; Krstić, H.; Moldovan, M.; Visa, I.; Mihailov, N.; et al. Overview and future challenges of nearly zero-energy building (nZEB) design in Eastern Europe. Energy Build. 2022, 267, 112165. [Google Scholar] [CrossRef]
- Moran, P.; O’Connell, J.; Goggins, J. Sustainable energy efficiency retrofits as residenial buildings move towards nearly zero energy building (NZEB) standards. Energy Build. 2020, 211, 109816. [Google Scholar] [CrossRef]
- Tang, F.; Chen, J.; Li, J.; Rodriguez, D. Energy saving actions toward NZEBs with multiple-criteria optimization in current residential buildings. Energy Rep. 2020, 6, 3008–3022. [Google Scholar] [CrossRef]
- D’Agostino, D.; Mazzarella, L. What is a Nearly zero energy building? Overview, implementation and comparison of definitions. J. Build. Eng. 2019, 21, 200–212. [Google Scholar] [CrossRef]
- Austin, M.C.; Carpino, C.; Mora, D.; Arcuri, N. A Methodology to identify appropriate refurbishment strategies towards zero energy buildings in a hot and humid climate. J. Phys. Conf. Ser. 2022, 2385, 012020. [Google Scholar] [CrossRef]
- Sami, S.; Gholizadeh, M.; Dadpour, D.; Deymi-Dashtebayaz, M. Design and optimization of a CCHDP system integrated with NZEB from energy, exergy and exergoeconomic perspectives. Energy Convers. Manag. 2022, 271, 116347. [Google Scholar] [CrossRef]
- Aste, N.; Adhikari, R.; Del Pero, C.; Leonforte, F. Multi-functional Integrated System for Energy Retrofit of Existing Buildings: A Solution Towards nZEB Standards. Energy Procedia 2017, 105, 2811–2817. [Google Scholar] [CrossRef]
- García-Ballano, C.J.; Ruiz-Varona, A.; Bailo, C.M.; Matud, C.C. Monitoring of housing blocks in Zaragoza (Spain) to validate the energy savings calculation method for the renovation of nZEB dwellings. Energy Build. 2021, 256, 111737. [Google Scholar] [CrossRef]
- Harkouss, F.; Fardoun, F.; Biwole, P.H. Optimization approaches and climates investigations in NZEB—A review. Build. Simul. 2018, 11, 923–952. [Google Scholar] [CrossRef]
- Jaysawal, R.K.; Chakraborty, S.; Elangovan, D.; Padmanaban, S. Concept of net zero energy buildings (NZEB)—A literature review. Clean. Eng. Technol. 2022, 11, 100582. [Google Scholar] [CrossRef]
- D’Agostino, D.; Tzeiranaki, S.T.; Zangheri, P.; Bertoldi, P. Assessing Nearly Zero Energy Buildings (NZEBs) development in Europe. Energy Strat. Rev. 2021, 36, 100680. [Google Scholar] [CrossRef]
- Colclough, S.; Hegarty, R.O.; Murray, M.; Lennon, D.; Rieux, E.; Colclough, M.; Kinnane, O. Post occupancy evaluation of 12 retrofit nZEB dwellings: The impact of occupants and high in-use interior temperatures on the predictive accuracy of the nZEB energy standard. Energy Build. 2022, 254, 111563. [Google Scholar] [CrossRef]
- Buonomano, A.; De Luca, G.; Montanaro, U.; Palombo, A. Innovative technologies for NZEBs: An energy and economic analysis tool and a case study of a non-residential building for the Mediterranean climate. Energy Build. 2016, 121, 318–343. [Google Scholar] [CrossRef]
- Abdou, N.; EL Mghouchi, Y.; Hamdaoui, S.; EL Asri, N.; Mouqallid, M. Multi-objective optimization of passive energy efficiency measures for net-zero energy building in Morocco. J. Affect. Disord. 2021, 204, 108141. [Google Scholar] [CrossRef]
- Khani, A.; Khakzand, M.; Faizi, M. Multi-objective optimization for energy consumption, visual and thermal comfort performance of educational building (case study: Qeshm Island, Iran). Sustain. Energy Technol. Assessments 2022, 54, 102872. [Google Scholar] [CrossRef]
- Chung-Camargo, K.; Bencid, M.; Mora, D.; Chen-Austin, M.A. Low-consumption techniques in tropical climates for energy and water savings in buildings: A review on experimental studies. Technol. RD J. 2022, 18, 5–18. [Google Scholar] [CrossRef]
- De Luca, G.; Ballarini, I.; Lorenzati, A.; Corrado, V. Renovation of a social house into a NZEB: Use of renewable energy sources and economic implications. Renew. Energy 2020, 159, 356–370. [Google Scholar] [CrossRef]
- Izadi, A.; Shahafve, M.; Ahmadi, P. Neural network genetic algorithm optimization of a transient hybrid renewable energy system with solar/wind and hydrogen storage system for zero energy buildings at various climate conditions. Energy Convers. Manag. 2022, 260, 115593. [Google Scholar] [CrossRef]
- Vujnović, N.; Dović, D. Cost-optimal energy performance calculations of a new nZEB hotel building using dynamic simulations and optimization algorithms. J. Build. Eng. 2020, 39, 102272. [Google Scholar] [CrossRef]
- Acar, U.; Kaska, O. Energy and economical optimal of Nzeb design under different climate conditions of Türkiye. J. Build. Eng. 2022, 60, 105103. [Google Scholar] [CrossRef]
- Liu, Z.; Fan, G.; Sun, D.; Wu, D.; Guo, J.; Zhang, S.; Yang, X.; Lin, X.; Ai, L. A novel distributed energy system combining hybrid energy storage and a multi-objective optimization method for nearly zero-energy communities and buildings. Energy 2022, 239, 122577. [Google Scholar] [CrossRef]
- Huang, P.; Sun, Y. A robust control of nZEBs for performance optimization at cluster level under demand prediction uncertainty. Renew. Energy 2019, 134, 215–227. [Google Scholar] [CrossRef]
- Liu, J.; Zhou, Y.; Yang, H.; Wu, H. Net-zero energy management and optimization of commercial building sectors with hybrid renewable energy systems integrated with energy storage of pumped hydro and hydrogen taxis. Appl. Energy 2022, 321, 119312. [Google Scholar] [CrossRef]
- Adeyemo, A.A.; Amusan, O.T. Modelling and multi-objective optimization of hybrid energy storage solution for photovoltaic powered off-grid net zero energy building. J. Energy Storage 2022, 55, 105273. [Google Scholar] [CrossRef]
- Madathil, D.; Pandi, R.V.; Nair, M.G.; Jamasb, T.; Thakur, T. Consumer-focused solar-grid net zero energy buildings: A multi-objective weighted sum optimization and application for India. Sustain. Prod. Consum. 2021, 27, 2101–2111. [Google Scholar] [CrossRef]
- Zhang, W.; Yan, C.; Xu, Y.; Fang, J.; Pan, Y. A critical review of the performance evaluation and optimization of grid interactions between zero-energy buildings and power grids. Sustain. Cities Soc. 2022, 86, 104123. [Google Scholar] [CrossRef]
- Belussi, L.; Barozzi, B.; Bellazzi, A.; Danza, L.; Devitofrancesco, A.; Fanciulli, C.; Ghellere, M.; Guazzi, G.; Meroni, I.; Salamone, F.; et al. A review of performance of zero energy buildings and energy efficiency solutions. J. Build. Eng. 2019, 25, 100772. [Google Scholar] [CrossRef]
- Ferrara, M.; Della Santa, F.; Bilardo, M.; De Gregorio, A.; Mastropietro, A.; Fugacci, U.; Vaccarino, F.; Fabrizio, E. Design optimization of renewable energy systems for NZEBs based on deep residual learning. Renew. Energy 2021, 176, 590–605. [Google Scholar] [CrossRef]
- Wang, Z.; Tao, H.; Cai, W.; Duan, Y.; Wu, D.; Zhang, L. Study on the multitime scale rolling optimization operation of a near-zero energy building energy supply system. Energy Convers. Manag. 2022, 270, 116255. [Google Scholar] [CrossRef]
- D’Agostino, D.; Mazzella, S.; Minelli, F.; Minichiello, F. Obtaining the NZEB target by using photovoltaic systems on the roof for multi-storey buildings. Energy Build. 2022, 267, 112147. [Google Scholar] [CrossRef]
- Costa, J.F.W.; Amorim, C.N.D.; Silva, J.C.R. Retrofit guidelines towards the achievement of net zero energy buildings for office buildings in Brasilia. J. Build. Eng. 2020, 32, 101680. [Google Scholar] [CrossRef]
- Al-Saadi, S.N.; Al-Jabri, K.S. Optimization of envelope design for housing in hot climates using a genetic algorithm (GA) computational approach. J. Build. Eng. 2020, 32, 101712. [Google Scholar] [CrossRef]
- Monzón-Chavarrías, M.; López-Mesa, B.; Resende, J.; Corvacho, H. The nZEB concept and its requirements for residential buildings renovation in Southern Europe: The case of multi-family buildings from 1961 to 1980 in Portugal and Spain. J. Build. Eng. 2021, 34, 101918. [Google Scholar] [CrossRef]
- Cerezo-Narváez, A.; Piñero-Vilela, J.-M.; Rodríguez-Jara, E.; Otero-Mateo, M.; Pastor-Fernández, A.; Ballesteros-Pérez, P. Energy, emissions and economic impact of the new nZEB regulatory framework on residential buildings renovation: Case study in southern Spain. J. Build. Eng. 2021, 42, 103054. [Google Scholar] [CrossRef]
- Austin, M.C.; Chung-Camargo, K.; Mora, D. Review of Zero Energy Building Concept-Definition and Developments in Latin America: A Framework Definition for Application in Panama. Energies 2021, 14, 5647. [Google Scholar] [CrossRef]
- Kitagawa, H.; Asawa, T.; Kubota, T.; Trihamdani, A.R.; Sakurada, K.; Mori, H. Optimization of window design for ventilative cooling with radiant floor cooling systems in the hot and humid climate of Indonesia. J. Affect. Disord. 2021, 188, 107483. [Google Scholar] [CrossRef]
- Berardi, U.; Manca, M.; Casaldaliga, P.; Pich-Aguilera, F. From high-energy demands to nZEB: The retrofit of a school in Catalonia, Spain. Energy Procedia 2017, 140, 141–150. [Google Scholar] [CrossRef]
- Ohene, E.; Hsu, S.-C.; Chan, A.P. Feasibility and retrofit guidelines towards net-zero energy buildings in tropical climates: A case of Ghana. Energy Build. 2022, 269, 112252. [Google Scholar] [CrossRef]
- Hamburg, A.; Kuusk, K.; Mikola, A.; Kalamees, T. Realisation of energy performance targets of an old apartment building renovated to nZEB. Energy 2020, 194, 116874. [Google Scholar] [CrossRef]
- Wu, X.; Feng, Z.; Chen, H.; Qin, Y.; Zheng, S.; Wang, L.; Liu, Y.; Skibniewski, M.J. Intelligent optimization framework of near zero energy consumption building performance based on a hybrid machine learning algorithm. Renew. Sustain. Energy Rev. 2022, 167, 112703. [Google Scholar] [CrossRef]
- Zhu, N.; Liu, X.; Dong, Q.; Rodriguez, D. Optimization of zero-energy building by multi-criteria optimization method: A case study. J. Build. Eng. 2021, 44, 102969. [Google Scholar] [CrossRef]
- Delač, B.; Pavković, B.; Lenić, K.; Mađerić, D. Integrated optimization of the building envelope and the HVAC system in nZEB refurbishment. Appl. Therm. Eng. 2022, 211, 118442. [Google Scholar] [CrossRef]
- Leman, A.M.; Sharif, H.Z.; Krizou, A.N.; A Al-Tarawne, M.T.; Subbiah, M.; Al Farsi, M.; Irfan, A.R. Single Objective Optimization of Net Zero Energy Residential Building in Tropical Climate. IOP Conf. Ser. Mater. Sci. Eng. 2020, 864, 012015. [Google Scholar] [CrossRef]
- Huo, H.; Xu, W.; Li, A.; Lv, Y.; Liu, C. Analysis and optimization of external venetian blind shading for nearly zero-energy buildings in different climate regions of China. Sol. Energy 2021, 223, 54–71. [Google Scholar] [CrossRef]
- Ascione, F.; De Masi, R.F.; Festa, V.; Mauro, G.M.; Vanoli, G.P. Optimizing space cooling of a nearly zero energy building via model predictive control: Energy cost vs comfort. Energy Build. 2023, 278, 112664. [Google Scholar] [CrossRef]
- Usman, M.; Ali, M.; Rashid, T.U.; Ali, H.M.; Frey, G. Towards zero energy solar households—A model-based simulation and optimization analysis for a humid subtropical climate. Sustain. Energy Technol. Assessments 2021, 48, 101574. [Google Scholar] [CrossRef]
- Li, H.; Wang, S. Coordinated optimal design of zero/low energy buildings and their energy systems based on multi-stage design optimization. Energy 2019, 189, 116202. [Google Scholar] [CrossRef]
- Harkouss, F.; Fardoun, F.; Biwole, P.H. Passive design optimization of low energy buildings in different climates. Energy 2018, 165, 591–613. [Google Scholar] [CrossRef]
- ASHRAE Standard 55-2004; Thermal Environmental Conditions for Human Occupancy. American Society of Heating, Refrigerating and Air Conditioning Engineers: Atlanta, GA, USA, 2004.
- Peel, M.C.; Finlayson, B.L.; McMahon, T.A. Updated world map of the Köppen-Geiger climate classification. Hydrol. Earth Syst. Sci. 2007, 11, 1633–1644. [Google Scholar] [CrossRef]
- González, J.; Mora, D.; Austin, M.C. Energy Consumption Difference Found between Typical and Standard Occupancy in Residential Buildings in a Tropical Developing Country. Buildings 2023, 13, 2235. [Google Scholar] [CrossRef]
- Republic of Panama Ministry of Public Works Technical Board of Engineering and Architecture. Resolución de La JTIA No.002 de 13 de Enero de 2023; Republic of Panama Ministry of Public Works Technical Board of Engineering and Architecture: Panama City, Panama, 2023. [Google Scholar]
- Austin, M.C.; Arnedo, L.; Yuil, O.; Mora, D. Energy consumption influenced by occupant behavior: A study in residential buildings in Panama. In Proceedings of the 19th LACCEI International Multi-Conference for Engineering, Education and Technology: “Prospective and Trends in Technology and Skills for Sustainable Social Development. Leveraging Emerging Technologies to Construct the Future”, Virtual, 19–23 July 2021; Volume 1. [Google Scholar] [CrossRef]
- ASHRAE—American Society of Heating, Refrigerating and Air-Conditioning Engineers. Measurement of Energy and Demand and Savings. In ASHRAE Guideline 14 2002; ASHRAE: Atlanta, GA, USA, 2002; ISSN 1049-894X. [Google Scholar]
- Boutet, M.; Hernández, A.; Jacobo, G. Thermo—Lighting optimization proposal for school buildings in subtropical hot—Humid climates: Monitoring and computer simulation on autumn period. Energy Build. 2016, 128, 785–797. [Google Scholar] [CrossRef]
- Chen, X.; Yang, H. Sensitivity analysis and optimization of a typical passively designed residential building with hybrid ventilation in hot and humid climates. Energy Procedia 2017, 142, 1781–1786. [Google Scholar] [CrossRef]
- Rabani, M.; Madessa, H.B.; Nord, N. Achieving zero-energy building performance with thermal and visual comfort enhancement through optimization of fenestration, envelope, shading device, and energy supply system. Sustain. Energy Technol. Assessments 2021, 44, 101020. [Google Scholar] [CrossRef]
- Giouri, E.D.; Tenpierik, M.; Turrin, M. Zero energy potential of a high-rise office building in a Mediterranean climate: Using multi-objective optimization to understand the impact of design decisions towards zero-energy high-rise buildings. Energy Build. 2020, 209, 109666. [Google Scholar] [CrossRef]
- Chacón, L.; Austin, M.C.; Castaño, C. A Multiobjective Optimization Approach for Retrofitting Decision-Making towards Achieving Net-Zero Energy Districts: A Numerical Case Study in a Tropical Climate. Smart Cities 2022, 5, 405–432. [Google Scholar] [CrossRef]
- Chen, R.; Tsay, Y.-S.; Ni, S. An integrated framework for multi-objective optimization of building performance: Carbon emissions, thermal comfort, and global cost. J. Clean. Prod. 2022, 359, 131978. [Google Scholar] [CrossRef]
- Chen, X.; Yang, H.; Zhang, W. Simulation-based approach to optimize passively designed buildings: A case study on a typical architectural form in hot and humid climates. Renew. Sustain. Energy Rev. 2018, 82, 1712–1725. [Google Scholar] [CrossRef]
- Gou, S.; Nik, V.M.; Scartezzini, J.-L.; Zhao, Q.; Li, Z. Passive design optimization of newly-built residential buildings in Shanghai for improving indoor thermal comfort while reducing building energy demand. Energy Build. 2018, 169, 484–506. [Google Scholar] [CrossRef]
- Hwang, R.-L.; Liao, W.-J.; Chen, W.-A. Optimization of energy use and academic performance for educational environments in hot-humid climates. J. Affect. Disord. 2022, 222, 109434. [Google Scholar] [CrossRef]
- Chai, J.; Huang, P.; Sun, Y. Differential evolution—Based system design optimization for net zero energy buildings under climate change. Sustain. Cities Soc. 2020, 55, 102037. [Google Scholar] [CrossRef]


| Building Element | Thermal Transmittance Value [W/m2 K] |
|---|---|
| External walls | 4.02 |
| Roof | 7.14 |
| Dispersing ceiling | 4.54 |
| Ground floor | 2.30 |
| Windows | 5.80 |
| External walls U-value [W/m2 K] | 0.8 |
| Windows U-value [W/m2 K] g-value (SHGC) | |
| 5.80 | |
| 0.60 | |
| Exterior window shade Projection factor | 0.30 |
| South and West | |
| Window-to-wall ratio | 40% |
| Roof U-value [W/m2 K] | 1.04 |
| HVAC COP | 3.0 |
| Design Variable | Regulation Target Value (with Variant nº3) | Min | Max | Step |
|---|---|---|---|---|
| U external walls [W/m2 K] | 0.8 | 0.2 | 4 | 0.2 |
| U windows [W/m2 K] | 5.8 | 1.8 | 5.8 | 0.2 |
| U roof [W/m2 K] | 1.04 | 0.2 | 7 | 0.2 |
| U ground floor [W/m2 K] | - | 0.2 | 4 | 0.2 |
| U ceiling [W/m2 K] | - | 0.2 | 4.6 | 0.2 |
| g-value [-] | 0.6 | 0.35 | 0.6 | 0.025 |
| Solar shading [%] of lit area | 0.3 | 0 | 1 | - |
| Cooling COP [-] | 3 | 3 | 4 | 0.1 |
| Photovoltaic [kWp] | - | 3 | 9 | 3 |
| Cooling schedule | - | Off/24 | On/24 | - |
| Cooling set-point [°C] | [23.5–28.5] | 16 | 28 | 1 |
| Cooling Operation Schedule | Operation Hours | Description |
|---|---|---|
| C1 | Always “Off” | Always “Off” 24/7 |
| C2 | “On” from 23:00 to 7:00 | “On” eight hours during the night |
| C3 | “On” from 8:00 to 17:00 | “On” nine hours during the day |
| C4 | “On” from 19:00 to 24:00 | “On” five hours during the night |
| C5 | “On” from 19:00 to 6:00 | “On” eleven hours during the night |
| C6 | Always “On” | Always “On” 24/7 |
| Design Variables | Standardized Regression Coefficient | Standard Error | p-Value |
|---|---|---|---|
| Photovoltaic | −0.7587 | 97.5714 | 0.0000 |
| Cooling schedule | 0.3867 | 70.7853 | 0.0000 |
| Cooling set-point | −0.3046 | 21.1847 | 0.0000 |
| U ground floor | −0.1084 | 13.9192 | 0.0000 |
| U external walls | 0.0949 | 14.0195 | 0.0000 |
| Cooling COP | −0.0543 | 25.4718 | 0.0019 |
| U ceiling | 0.0283 | 11.9863 | 0.0984 |
| Solar shading | 0.025 | 71.5164 | 0.1476 |
| G | 0.0237 | 25.1695 | 0.1672 |
| U roof | 0.0235 | 7.8552 | 0.1700 |
| U windows | −0.0037 | 13.1753 | 0.8283 |
| Optimal Point | n° | 1 |
|---|---|---|
| Net site energy | [kWh/m2 year] | −154.18 * |
| U-value external walls | [W/m2 K] | 0.8 |
| U-value roof | [W/m2 K] | 7.0 |
| U-value ground floor slab | [W/m2 K] | 3.8 |
| U-value semi-exposed ceiling | [W/m2 K] | 0.8 |
| U-value windows | [W/m2 K] | 3.0 |
| g-value windows | [-] | 0.35 |
| Shadings | [%] of lit area | 50 |
| Cooling set-point temperature | [°C] | 26 |
| Cooling operation schedule | [-] | C1 |
| Photovoltaic size | [kWp] | Large |
| Cooling COP | [-] | 3.5 |
| Optimal Point | n° | 1 | 2 |
|---|---|---|---|
| Net site energy | [kWh/m2 year] | −154.50 | −153.80 |
| Discomfort hours | [h/year] | 462.6 | 101.9 |
| U-value external walls | [W/m2 K] | 0.4 | 2.4 |
| U-value roof | [W/m2 K] | 0.2 | 0.2 |
| U-value ground floor slab | [W/m2 K] | 3.2 | 3.8 |
| U-value semi-exposed ceiling | [W/m2 K] | 3.8 | 4.4 |
| U-value windows | [W/m2 K] | 3.0 | 3.2 |
| g-value windows | [-] | 0.4 | 0.375 |
| Shadings | [%] of lit area | 30 | 30 |
| Cooling set-point temperature | [°C] | 27 | 26 |
| Cooling operation schedule | [-] | C1 | C1 |
| Photovoltaic size | [kWp] | Large | Large |
| Optimal Point | n° | 4 |
|---|---|---|
| Net site energy | [kWh/m2 year] | −13.36 |
| Discomfort hours | [h/year] | 105.6 |
| U-value external walls | [W/m2 K] | 2.2 |
| U-value roof | [W/m2 K] | 0.4 |
| U-value ground floor slab | [W/m2 K] | 3.8 |
| U-value semi-exposed ceiling | [W/m2 K] | 4.0 |
| U-value windows | [W/m2 K] | 3.0 |
| g-value windows | [-] | 0.375 |
| Shadings | [%] of lit area | 0 |
| Cooling set-point temperature | [°C] | 28 |
| Cooling operation schedule | [-] | C2 |
| Photovoltaic size | [kWp] | small |
| Cooling COP | [-] | 3.8 |
Disclaimer/Publisher’s Note: The statements, opinions and data contained in all publications are solely those of the individual author(s) and contributor(s) and not of MDPI and/or the editor(s). MDPI and/or the editor(s) disclaim responsibility for any injury to people or property resulting from any ideas, methods, instructions or products referred to in the content. |
© 2024 by the authors. Licensee MDPI, Basel, Switzerland. This article is an open access article distributed under the terms and conditions of the Creative Commons Attribution (CC BY) license (https://creativecommons.org/licenses/by/4.0/).
Share and Cite
Carpino, C.; Chen Austin, M.; Mora, D.; Arcuri, N. Retrofit Measures for Achieving NZE Single-Family Houses in a Tropical Climate via Multi-Objective Optimization. Buildings 2024, 14, 566. https://doi.org/10.3390/buildings14030566
Carpino C, Chen Austin M, Mora D, Arcuri N. Retrofit Measures for Achieving NZE Single-Family Houses in a Tropical Climate via Multi-Objective Optimization. Buildings. 2024; 14(3):566. https://doi.org/10.3390/buildings14030566
Chicago/Turabian StyleCarpino, Cristina, Miguel Chen Austin, Dafni Mora, and Natale Arcuri. 2024. "Retrofit Measures for Achieving NZE Single-Family Houses in a Tropical Climate via Multi-Objective Optimization" Buildings 14, no. 3: 566. https://doi.org/10.3390/buildings14030566
APA StyleCarpino, C., Chen Austin, M., Mora, D., & Arcuri, N. (2024). Retrofit Measures for Achieving NZE Single-Family Houses in a Tropical Climate via Multi-Objective Optimization. Buildings, 14(3), 566. https://doi.org/10.3390/buildings14030566