Article

The Impact of China’s New Infrastructure Development on Urban Innovation Quality—A Quasi-Natural Experiment of Smart City Pilots

1
School of Civil Engineering and Architecture, Wuhan Institute of Technology, Wuhan 430074, China
2
Wuhan Shiny Technology Co., Ltd., Wuhan 430075, China
*
Author to whom correspondence should be addressed.
Buildings 2024, 14(2), 548; https://doi.org/10.3390/buildings14020548
Submission received: 26 January 2024 / Revised: 13 February 2024 / Accepted: 15 February 2024 / Published: 19 February 2024
(This article belongs to the Section Construction Management, and Computers & Digitization)

Abstract

:
Currently, human society is in the era of the digital economy, driven by a new wave of digital technology revolution. Against this backdrop, China actively draws on global development concepts, accelerating the advancement of new infrastructure construction. This initiative aims to stabilize current economic demands while laying a material foundation for long-term development. Therefore, the efficient implementation of this new infrastructure has become a pressing issue for China, as unlocking its empowering role in the national economy is of paramount importance. This study, based on balanced panel data from China’s initial smart city pilot projects from 2008 to 2018, employs both two-way fixed effects and mediation effect models to empirically examine the impact of new infrastructure construction on urban innovation quality, considering endogeneity issues. The research findings reveal that new infrastructure construction enhances urban innovation quality by expediting industrial structural upgrades and enhancing total factor productivity. Furthermore, due to variations in geographical location and population density, there is heterogeneity in the impact of new infrastructure on urban innovation quality, with investments in new infrastructure exerting a more pronounced positive effect in cities with high population density.

1. Introduction

At the 20th National Congress of the Communist Party of China in October 2022, it was proposed to accelerate the development of the digital economy [1]. The construction of new infrastructure serves as the cornerstone of the digital economy, providing critical support for its development and gradually ascending to the national strategic level. Guided by the new development concept and propelled by technological innovation, this infrastructure system, built on information networks, caters to the needs of high-quality development, offering services for digital transformation, intelligent upgrades, and integrated innovation [2]. The construction of new infrastructure holds significant implications for guiding cities to enhance their innovative capabilities and advancing the construction of an innovative nation. Therefore, can new infrastructure influence the quality of innovation in urban environments? What are the key mechanisms through which new infrastructure impacts the quality of urban innovation? What are the potential challenges and obstacles to maximizing the positive impact of infrastructure on urban innovation quality? Can policy makers, urban planners, and stakeholders draw lessons from this study to make informed decisions regarding infrastructure investment and innovation initiatives?
New infrastructure construction is a technology-driven basic measure. By implementing bottom-up technology promotion, innovation platform mobilization and industrial integration, it can effectively promote the integration and development of digital economy and industry, thus accelerating the transformation of intelligent manufacturing [3,4]. The existing literature predominantly focuses on the unilateral impact of certain types of new infrastructure construction on technological innovation in urban development, primarily centered around high-speed railways, widespread internet access, and their significant influence on green urban development through technological innovation [5], resource optimization [6], and industrial structure enhancement [7,8]. Moreover, new infrastructure construction, supported by digitization and intelligence, contributes to enhancing governance efficiency in government [7], economic systems [8], social governance systems [9,10], energy systems [11], and public health safety systems [12], unveiling new urban spatial organizational trends and enhancing urban development quality in areas like urban transportation [13], industrial development, intelligence, and environmental protection [14].
Smart cities integrate new technologies such as artificial intelligence, Internet, big data, and Internet of Things [4], and enhance the connectivity and intelligence of infrastructure components such as transportation and information transmission, as well as public services such as medical care and education, thus improving the welfare of all members of society. It can be seen that the artificial intelligence, Internet, and big data involved in the smart city pilot project are highly coincident with the content of new infrastructure construction. At the same time, the construction of new infrastructure improves its efficiency and sustainability through intelligent means, thus contributing to the development of smart cities. Therefore, the smart city pilot is also regarded as an exploration of and attempt at new infrastructure construction.
Most scholars explore innovation quality from two main perspectives: the first category of the literature extensively discusses the connotation of innovation quality, defining it as the essence of all innovation outcomes [15]. Innovation quality manifests in the efficiency and returns of input–output for innovations [16]. Regarding the innovation process, innovation quality serves as a standard for evaluating innovation value, reflecting the entire process of innovation value generation. From the perspectives of innovation value generation, diffusion, and transformation, innovation quality is divided into quality in innovation generation, diffusion, and transformation [17]. The second category of the literature primarily investigates the factors influencing innovation quality. Tan et al. explore the advantages of foreign direct investment (FDI) in promoting technological innovation for enterprises, with results indicating that regional FDI innovation quality significantly impacts local enterprise innovation quality [18]. To achieve peak carbon emissions and carbon neutrality, the Chinese government has enacted various regulations to curb carbon emissions. Studies show that a reasonable utilization of market-based emission reduction regulations can significantly achieve Porter effects, enhancing innovation quality [19]. Based on a matching perspective, Li et al. establish an analysis framework encompassing external search strategies, organizational improvisation, and structural flexibility. Results demonstrate that market information search has a positive impact on innovation quality and speed [20].
The theoretical background of new infrastructure and urban innovation quality lies in the interaction and promotion between digital transformation and intelligent development. The construction of new infrastructure promotes the digital transformation and intelligent development of the city, and provides more convenient and efficient conditions for innovation. The application of digital and intelligent technology has improved the operation efficiency and service quality of the city, and promoted innovative activities in various fields. At the same time, digital transformation also provides rich data resources and analysis tools for urban innovation, and provides more possibilities for the discovery and application of innovation.
The marginal contributions of this paper are as follows: firstly, on the research topic, we attach importance to the improvement of regional innovation quality, construct a quasi-natural experiment with the pilot policy of smart city, demonstrate the improvement effect of new infrastructure construction on China’s urban innovation quality, and shift the innovation effect of this policy from quantitative growth to quality improvement, which provides new empirical evidence for the research fields related to new infrastructure construction and innovation quality. Secondly, in terms of regional heterogeneity, on the basis of confirming the effectiveness of new infrastructure construction in improving the quality of urban innovation, we expand and analyze the heterogeneity effect, which provides more sufficient theoretical support for further implementing the pilot policy of smart cities and improving the quality of urban innovation.
The subsequent sections of this paper are organized as follows: Section 2 clearly lists the specific objectives of the study. Section 3 introduces the theoretical model and assumptions serving as the foundation of this research. In Section 4, the model is established, and detailed explanations of the variables are provided. Moving to Section 5, empirical tests are conducted, and the obtained results are analyzed, studying the impact of mediating effects. Finally, Section 6, the conclusion, summarizes the research findings, and Section 7, future work, presents policy recommendations based on the research impact.

2. Objectives

Although research results indicate that “new infrastructure” significantly enhances green productivity, technological upgrades, and digital transformation, its impact on urban innovation quality lacks exploration. As a natural extension of the existing literature, this paper aims to explore the influence of China’s new infrastructure construction in the context of high-quality development on innovation quality. This paper primarily encompasses the following aspects:
(1)
Utilizing balanced panel data from China’s first batch of smart city pilot cities from 2008 to 2018, in conjunction with patent application numbers from patent databases and data from provincial statistical yearbooks, conducting a difference-in-differences study on smart city pilots, aiming to provide valuable insights into the transformative potential of new infrastructure in shaping urban innovation.
(2)
Employing instrumental variable methods and conducting a series of robustness tests to reinforce the credibility and robustness of our conclusions.
(3)
Delving into the research to explore heterogeneity changes arising from geographical location and population density.

3. Hypothesis

As the new wave of technological revolution and industrial transformation continues to advance, the distinctive characteristics of new infrastructure, including strong permeability and high integrative capacity, have accelerated the deep integration between emerging technologies and the real economy, offering a viable pathway for urban innovation development. The fusion of new infrastructure with traditional industries can improve the input combination of different production factors within the real economy, reducing the probability of factor mismatches [21] and facilitating the efficient allocation and utilization of resources. This, in turn, maximizes the impetus for innovative entrepreneurial activities. Moreover, the rapid development of new infrastructure has led to an increased demand for high-skilled, composite talents engaged in digital technology development and application [22], resulting in a surge of technology talent influx and fostering the accumulation of regional technological human capital. As high-quality human capital integrates into the innovation process, it effectively enhances the operational efficiency of enterprise economic activities, encouraging the production and provision of more diverse and higher-quality, innovative products and services. This consequently drives the upgrade of regional innovation. Based on these premises, this paper posits the following hypotheses:
Hypothesis 1.
New infrastructure construction contributes to the enhancement of urban innovation quality.
New infrastructure, through the introduction of new technologies, automation, and digital tools, enhances productivity and quality, thus providing stronger competitiveness in the market. Furthermore, upgrading industrial technology and efficiency assists in optimizing the urban industrial structure [23]. This implies that cities can better adapt to market demands and be more competitive. With the reduction in traditional industries, cities release resources originally used to support these industries, such as land, labor, and capital. These resources can be reallocated to support innovative activities, thereby driving the development of emerging industries. Simultaneously, the optimization of industrial structure and technological upgrades contribute to improving a city’s innovation environment, propelling more innovative resources and demand-driven activities, thereby enhancing the innovation quality of cities. Consequently, industrial upgrading and optimization play a positive role in the urban innovation ecosystem, enhancing urban innovation quality and global competitiveness. Based on these premises, this paper posits the following hypothesis:
Hypothesis 2.
New infrastructure construction accelerates industrial structural upgrading, fostering urban innovation quality.
New infrastructure construction signifies a comprehensive upgrade to urban infrastructure. More significantly, it paves the way for an entirely new approach to enhancing overall productivity. Through the utilization of digitalization, smart technology, and data integration, new infrastructure not only optimizes resource allocation but also significantly enhances production efficiency. This transformation establishes a broader and more robust foundation for elevating urban innovation quality. It injects greater vigor and support into innovation by providing cities with a more extensive and solid groundwork for progress. Based on these premises, this paper posits the following hypothesis:
Hypothesis 3.
New infrastructure construction enhances urban innovation quality by elevating total factor productivity.
Furthermore, the pioneering role of new infrastructure may also be affected by specific characteristics of individual cities [24], such as urban location and geographical positioning. On the one hand, the eastern regions have a higher level of economic development, but their industrial systems are often more mature. The compatibility of new infrastructure construction with the local industrial advantages remains dubious. The central and western regions are often lagging in infrastructure, but possess clear development space, and optimizing industrial structure adjustment may have lower costs. Therefore, they might have a “starting advantage” in constructing new infrastructure. On the other hand, population density, as a significant factor influencing urban characteristics and development, provides a rich theoretical basis for studying urban heterogeneity. From an economic perspective, cities with high population densities typically host more economic activities and market opportunities, fostering innovation and economic growth. The scale of a city is closely related to innovation; larger cities possess more resources and opportunities, attracting talents and innovative institutions, thereby influencing the quality of innovation within a city. Regions with higher population densities tend to facilitate social interactions and information dissemination, fostering knowledge collisions and innovative activities across various domains. Hence, population density stands as a crucial factor worth considering when assessing urban heterogeneity, especially concerning the quality of urban innovation. Examining innovation performance across different population densities aids in understanding the formation and impact of innovation disparities among different cities. This paper presents the following hypothesis:
Hypothesis 4.
Different geographical locations and population densities may lead to heterogeneous results in the impact of new infrastructure construction on urban innovation quality.

4. Research Methodology

4.1. Double-Difference Model

The specific model construction is as follows:
T ech it = α 0 + α 1 treat i × post t + α 2 X t + δ i + μ t + ε it
Here, in the equation, ‘Tech’ represents the quality of urban innovation, ‘treat’ stands for the virtual variable of smart city pilot areas, ‘post’ denotes the time variable at the start of the pilot, ‘X’ encompasses all control variables, δ represents individual fixed effects at the city level for smart city pilot areas, μ represents the fixed effects of the years when smart city pilots were initiated, and ε symbolizes the random disturbance term.

4.2. Mediation Model

To test the five hypotheses proposed earlier, we employ a mediation analysis model. Firstly, we introduce an intermediary variable, denoted as M, representing the upgrading of industrial structure and overall productivity. D stands for the construction of new infrastructure, while q represents urban innovation quality in this context. The mediation effect examination is reflected in the regression model as follows:
Herein, ‘c’ signifies the total effect of new infrastructure construction ‘D’ on the urban innovation quality ‘q’. Coefficient ‘a’ illustrates the impact of ‘D’ on the industrial structure and savings rate ‘M’. ‘b’ quantifies the effect of ‘M’ on ‘q’ after controlling for the influence of ‘D’, while ‘c1′ represents the direct effect of ‘D’ on ‘q’ after controlling for the impact of ‘M’.
From the above model, it is evident that a unit change in the independent variable results in: a change in ‘c1′ units in the dependent variable due to the direct effect; an alteration of ‘a’ units in the mediator ‘M’ due to the indirect effect; and consequently, a modification of ‘ab’ units in the dependent variable due to the influence passing through the mediator ‘M’.
The examination of the mediation effect entails assessing whether the product of coefficients ‘ab’ significantly differs from zero, thus testing the hypothesis H0: ab = 0. If the product ‘ab’ significantly differs from zero, it indicates that the impact of new infrastructure construction ‘D’ on the urban innovation quality ‘q’ is transmitted through the mediator ‘M’. Otherwise, no mediation effect exists.
q = c D + e 1
M = a D + e 2
q = c 1 D + b M + e 3
c = c 1 + a b

4.3. Variable Selection

4.3.1. Dependent Variable

The focal variable in this study is urban innovation quality (tech), gauged through four primary methods: the patent citation count method [25]; classification based on the first four digits of the IPC code [26]; the duration of patent annual fee payments [27]; patent authorization rate and duration [28]. Patent types encompass inventions, utility models, and design patents. Among these, invention patents denote higher technological complexity and research investment, signifying the highest patent quality. Greater proportions of design and utility model patents suggest a more pronounced “patent bubble”, correlating with lower regional innovation quality. Additionally, policies incentivizing patent applications often create an “innovation facade”, where quantity does not correlate with improved patent quality. Consequently, using patent application metrics tends to overstate city innovation levels, failing to precisely reflect urban innovation quality. Hence, this study adopts the ratio of authorized invention patents to total authorized patents as an indicator of urban innovation quality.

4.3.2. Independent Variable

Policy variables stem from the initial list of smart city pilot projects, designating cities like Shijiazhuang and Taiyuan as experimental groups for smart city development. Cities not part of the pilot program are assigned 0, while pilot cities are assigned 1. The time variable for policy implementation is set as follows: 0 before the smart city pilot and 1 during and after implementation. The key explanatory variable in this study is the interaction between policy variables and policy implementation time. Cities in various pilot program batches receive a value of 1 during and after the pilot policy implementation; otherwise, they receive 0.

4.3.3. Mediating Variables

Upgrading industrial structure: numerous studies suggest that the rapid development of the tertiary industry signifies an important aspect of upgrading the industrial structure. This study utilizes the industrial structure hierarchy coefficient to illustrate the level of industrial structure upgrade among provinces. The calculation involves assigning different weights to the primary, secondary, and tertiary industries to represent the level of industrial structure. The formula is as follows:
u p g r a d e = i = 1 3 q i × i = q 1 × 1 + q 2 × 2 + q 3 × 3
where qi represents the output proportion of the ith industry.
Total factor productivity (TFP): Total factor productivity measures the efficiency of a city in utilizing all production factors (such as labor, capital, technology, etc.). The calculation formula is as follows:
T = P W × C × L × E
Here, P represents the total output value, W stands for labor input, C represents capital input, L signifies land input, and E denotes energy input.

4.3.4. Control Variables

To control for other factors impacting urban innovation quality, the selected control variables are as follows:
Economic scale (gdp): logarithm of a city’s gross domestic product serves as the metric.
Degree of openness (fdi): ratio of the actual foreign investment utilized in a year to a city’s GDP for that year.
Technological subsidies (sci): proportion of technological expenditures in a city’s GDP.
Cultural level (cult): logarithm of the regional per capita public library book collection.
Human capital (hr): ratio of the number of undergraduate and above students to the total population of the city.

4.4. Data Sources

Data primarily originate from the “China Urban Statistical Yearbook”, “Science and Technology Statistical Yearbook”, and various provincial and municipal statistical bulletins. Table 1 illustrates the descriptive statistical analysis of all variables. The table reveals varying overall levels of the variables from 2008 to 2018: the mean of the dependent variable, urban innovation quality, stands at 0.1107 with a standard deviation of 0.0746. This suggests that, while the average level of urban innovation quality in the sample is not particularly high, there exists a certain level of variability or fluctuation. The mean of the explanatory variable ‘treated×time’ is 0.1520, with a relatively high standard deviation of 0.3591, indicating a wider distribution of this variable within the sample, potentially signaling significant differences. Among the mediating variables, the industrial structure upgrading index shows a mean of 227.16 with a standard deviation of 14.475, reflecting a relatively narrow distribution around the mean value. Regarding the control variables, there are considerable differences between the maximum and minimum values of variables related to openness to foreign trade, technological subsidies, cultural levels, and human capital. These results indicate noticeable disparities in urbanization and education levels across different regions.

5. Finding

The empirical results are segmented into four sections: baseline regression results; robustness of pilot policy effects; heterogeneity analysis; examination of the mediating mechanism of smart city pilot policy effects on industrial structure upgrade; and total factor productivity.

5.1. Baseline Regression Results

This study analyzes the relationship between the national smart city pilot policy as an exogenous shock and the urban innovation quality. Table 2 presents the baseline regression outcomes. Models (1) to (6), while controlling for both city and year fixed effects, progressively introduce five control variables. The policy coefficient slightly decreases from 0.0143 to 0.0137 as the control variables are added but remains significant. This suggests that the implementation of smart city pilot policies significantly and positively influences urban innovation quality, verifying Hypothesis 1.
The estimation results of control variables indicate consistent positive effects of the degree of openness, technological subsidies, cultural level, and human capital on enhancing urban innovation capability. Although the economic scale remains insignificant across multiple regressions, its inclusion as a control variable captures the differences between smart city policy pilots and new infrastructure construction, enhancing the accuracy of empirical analysis results. The negative impact of economic scale on urban innovation quality might stem from uneven resource allocation due to excessively large-scale economies, leading to insufficient investment in innovation activities, as well as the limitation of innovation development and quality due to restricted freedom and creative thinking under large-scale economic activities [29,30].

5.2. Robustness Checks

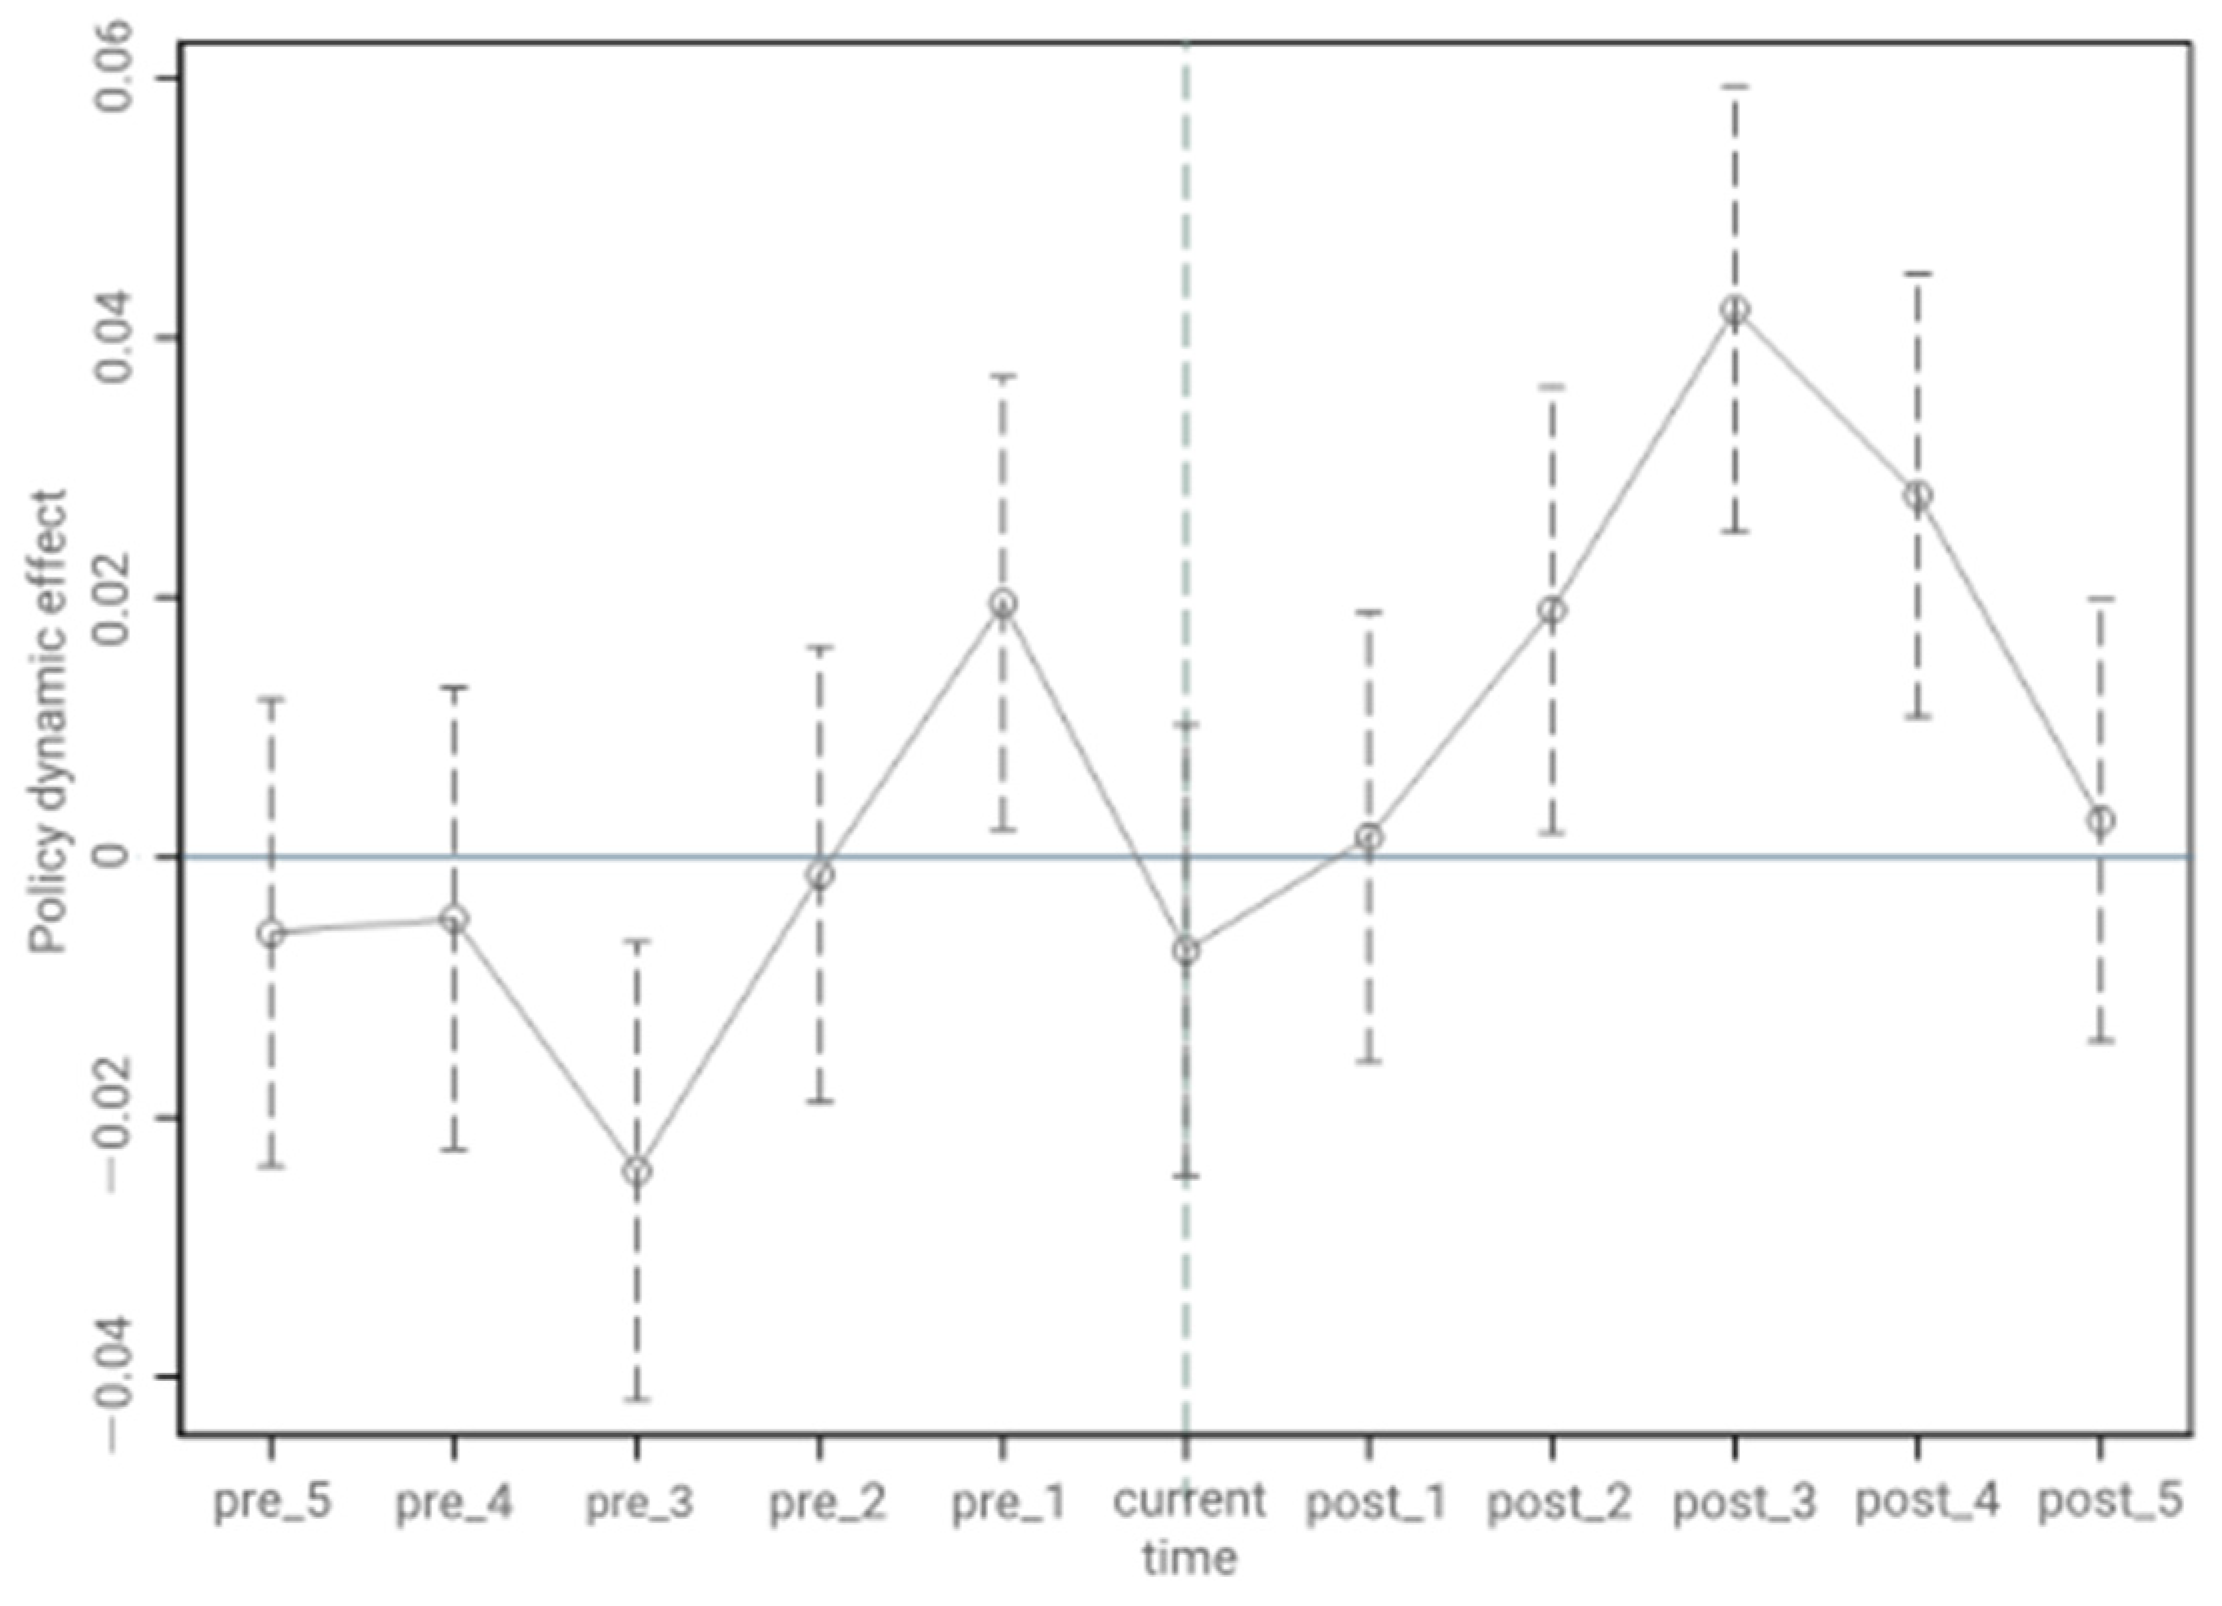
5.2.1. Parallel Trends Test

An essential premise for the quasi-natural experiment is that the experimental and control groups exhibit parallel trends before policy implementation. To ensure the robustness of the Double Difference Model (DID) conclusions, this study employs an event study method to evaluate parallel trends [31]:
D T it = _ cons + t = n m α t D t + α j C V s + λ + γ + θ + κ i t
where DT represents the annual dummy variable before and after policy implementation (DT = treated×time), signifying whether the experimental and control groups exhibit parallel trends before the implementation of the smart city pilot policy.
The results of the parallel trends test, depicted in Figure 1, show that in the four years preceding the smart city pilot policy, the coefficient fluctuates around 0. However, after policy implementation, the coefficient gradually exhibits significant variation. This indicates that before the smart city pilot policy, both the experimental and control groups had similar trends in innovation quality. Yet, post-policy implementation, there is a divergence in innovation quality trends between the experimental and control groups.
From a dynamic perspective, the coefficient becomes significantly positive from year T+1 and maintains this positive impact for a considerable time, suggesting that the policy incentive effect of smart city pilot policies on urban innovation quality has a certain long-term nature. These results indicate that to some extent, this model satisfies the assumption of parallel trends, further affirming that new infrastructure construction significantly promotes the improvement of urban innovation quality. As time progresses, the policy effect of the initial batch of smart city pilot cities begins to diminish, indicating that smart city policies exhibit temporal effects. Hence, implementing policies in different phases is advantageous for the development of urban innovation quality.

5.2.2. Robustness Checks

Before conducting robustness checks, considering that each pilot city may adjust its policies regarding smart cities, this study examines the influence of smart city pilot policies on urban innovation quality by considering the intensity of innovation policies as a control variable. It investigates the effects of different levels of implementation intensity on urban innovation capability.
As indicated in Table 3, coefficients at Q40, Q60, and Q80 are all significant. Additionally, as the implementation intensity increases, there is a slight growth in the regression coefficient for the policy variable. This demonstrates that the enhancement in the intensity of innovation policies positively impacts urban innovation quality, reaffirming the conclusion that increased intensity of innovation policies correlates with improved urban innovation quality. This finding adds robustness to the assessment of smart city pilot policy effects on urban innovation quality.
The next step involves conducting robustness checks.
(1)
Outlier exclusion: To mitigate the influence of outliers on the model results, this study conducts a 1% level truncation of the dependent variable and re-estimates the model. Table 4, Column (1), indicates that after removing outliers, the estimated coefficients remain statistically significant at the 1% level, aligning with the baseline regression results.
(2)
Dependent variable replacement: Upon replacing the dependent variable with logarithmically transformed patents per ten thousand people and the number of authorized patents, the estimation results remain significantly positive at the 1% level. This suggests that the implementation of smart city pilot policies continues to have a robust positive effect on improving urban innovation quality in pilot regions.
(3)
Control of province–time joint fixed effects: The baseline regression initially controlled for time and city fixed effects. However, the provinces involved in the first batch of smart city pilots may enact various policies to promote urban innovation and entrepreneurship activities across different years. Additionally, these provinces might have varying levels of emphasis on innovation in different years, potentially affecting the innovation quality of pilot cities. Thus, this study includes province–time joint fixed effects in the baseline regression model. As shown in Table 4, Column (3), the regression results remain significantly positive at the 1% level. This reaffirms that the establishment of smart city pilot policies significantly enhances the innovation quality of pilot cities, validating the robustness of the baseline regression results.
(4)
Excluding other policy interference: During the study period, the “Broadband China” pilot policy established in 2014 is closely related to this study [32]. Therefore, this study incorporates the “Broadband China” policy implementation variable. Results in Table 4, Column (5), demonstrate that the coefficient for the policy variable remains significantly positive at the 1% level. This indicates that smart cities significantly contribute to promoting the development of urban innovation quality, reinforcing the robustness of this study’s conclusions.
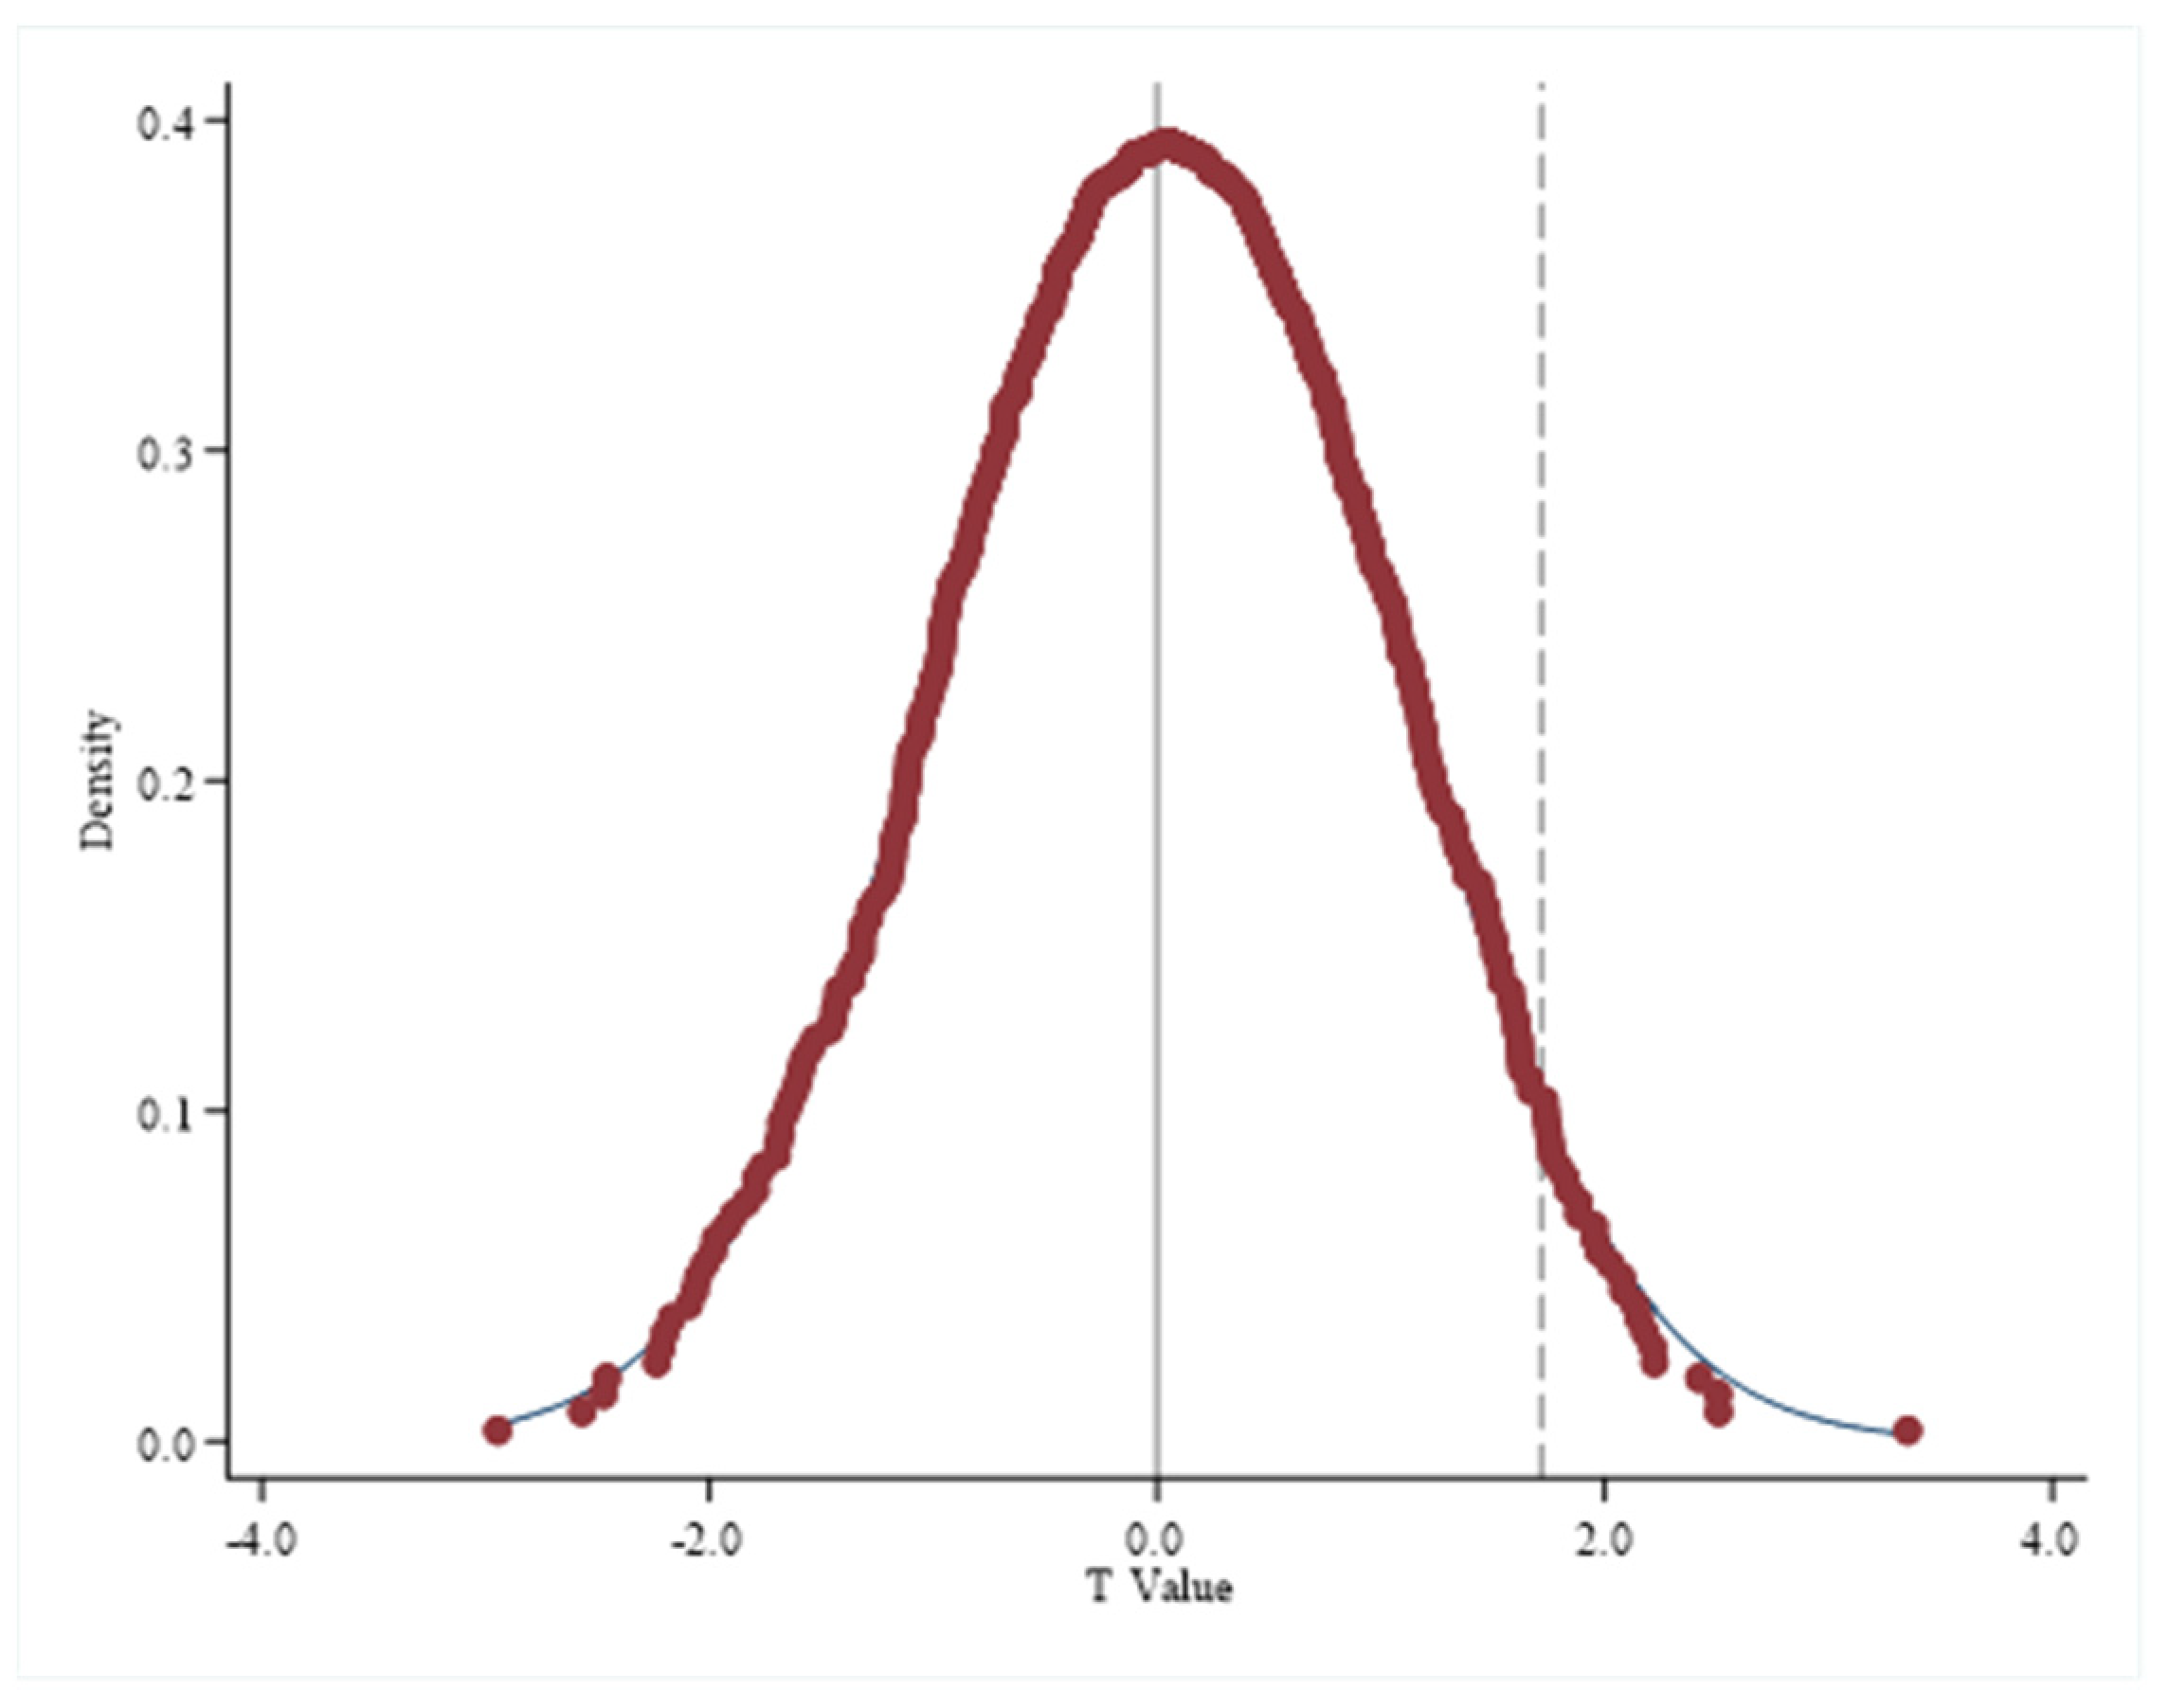
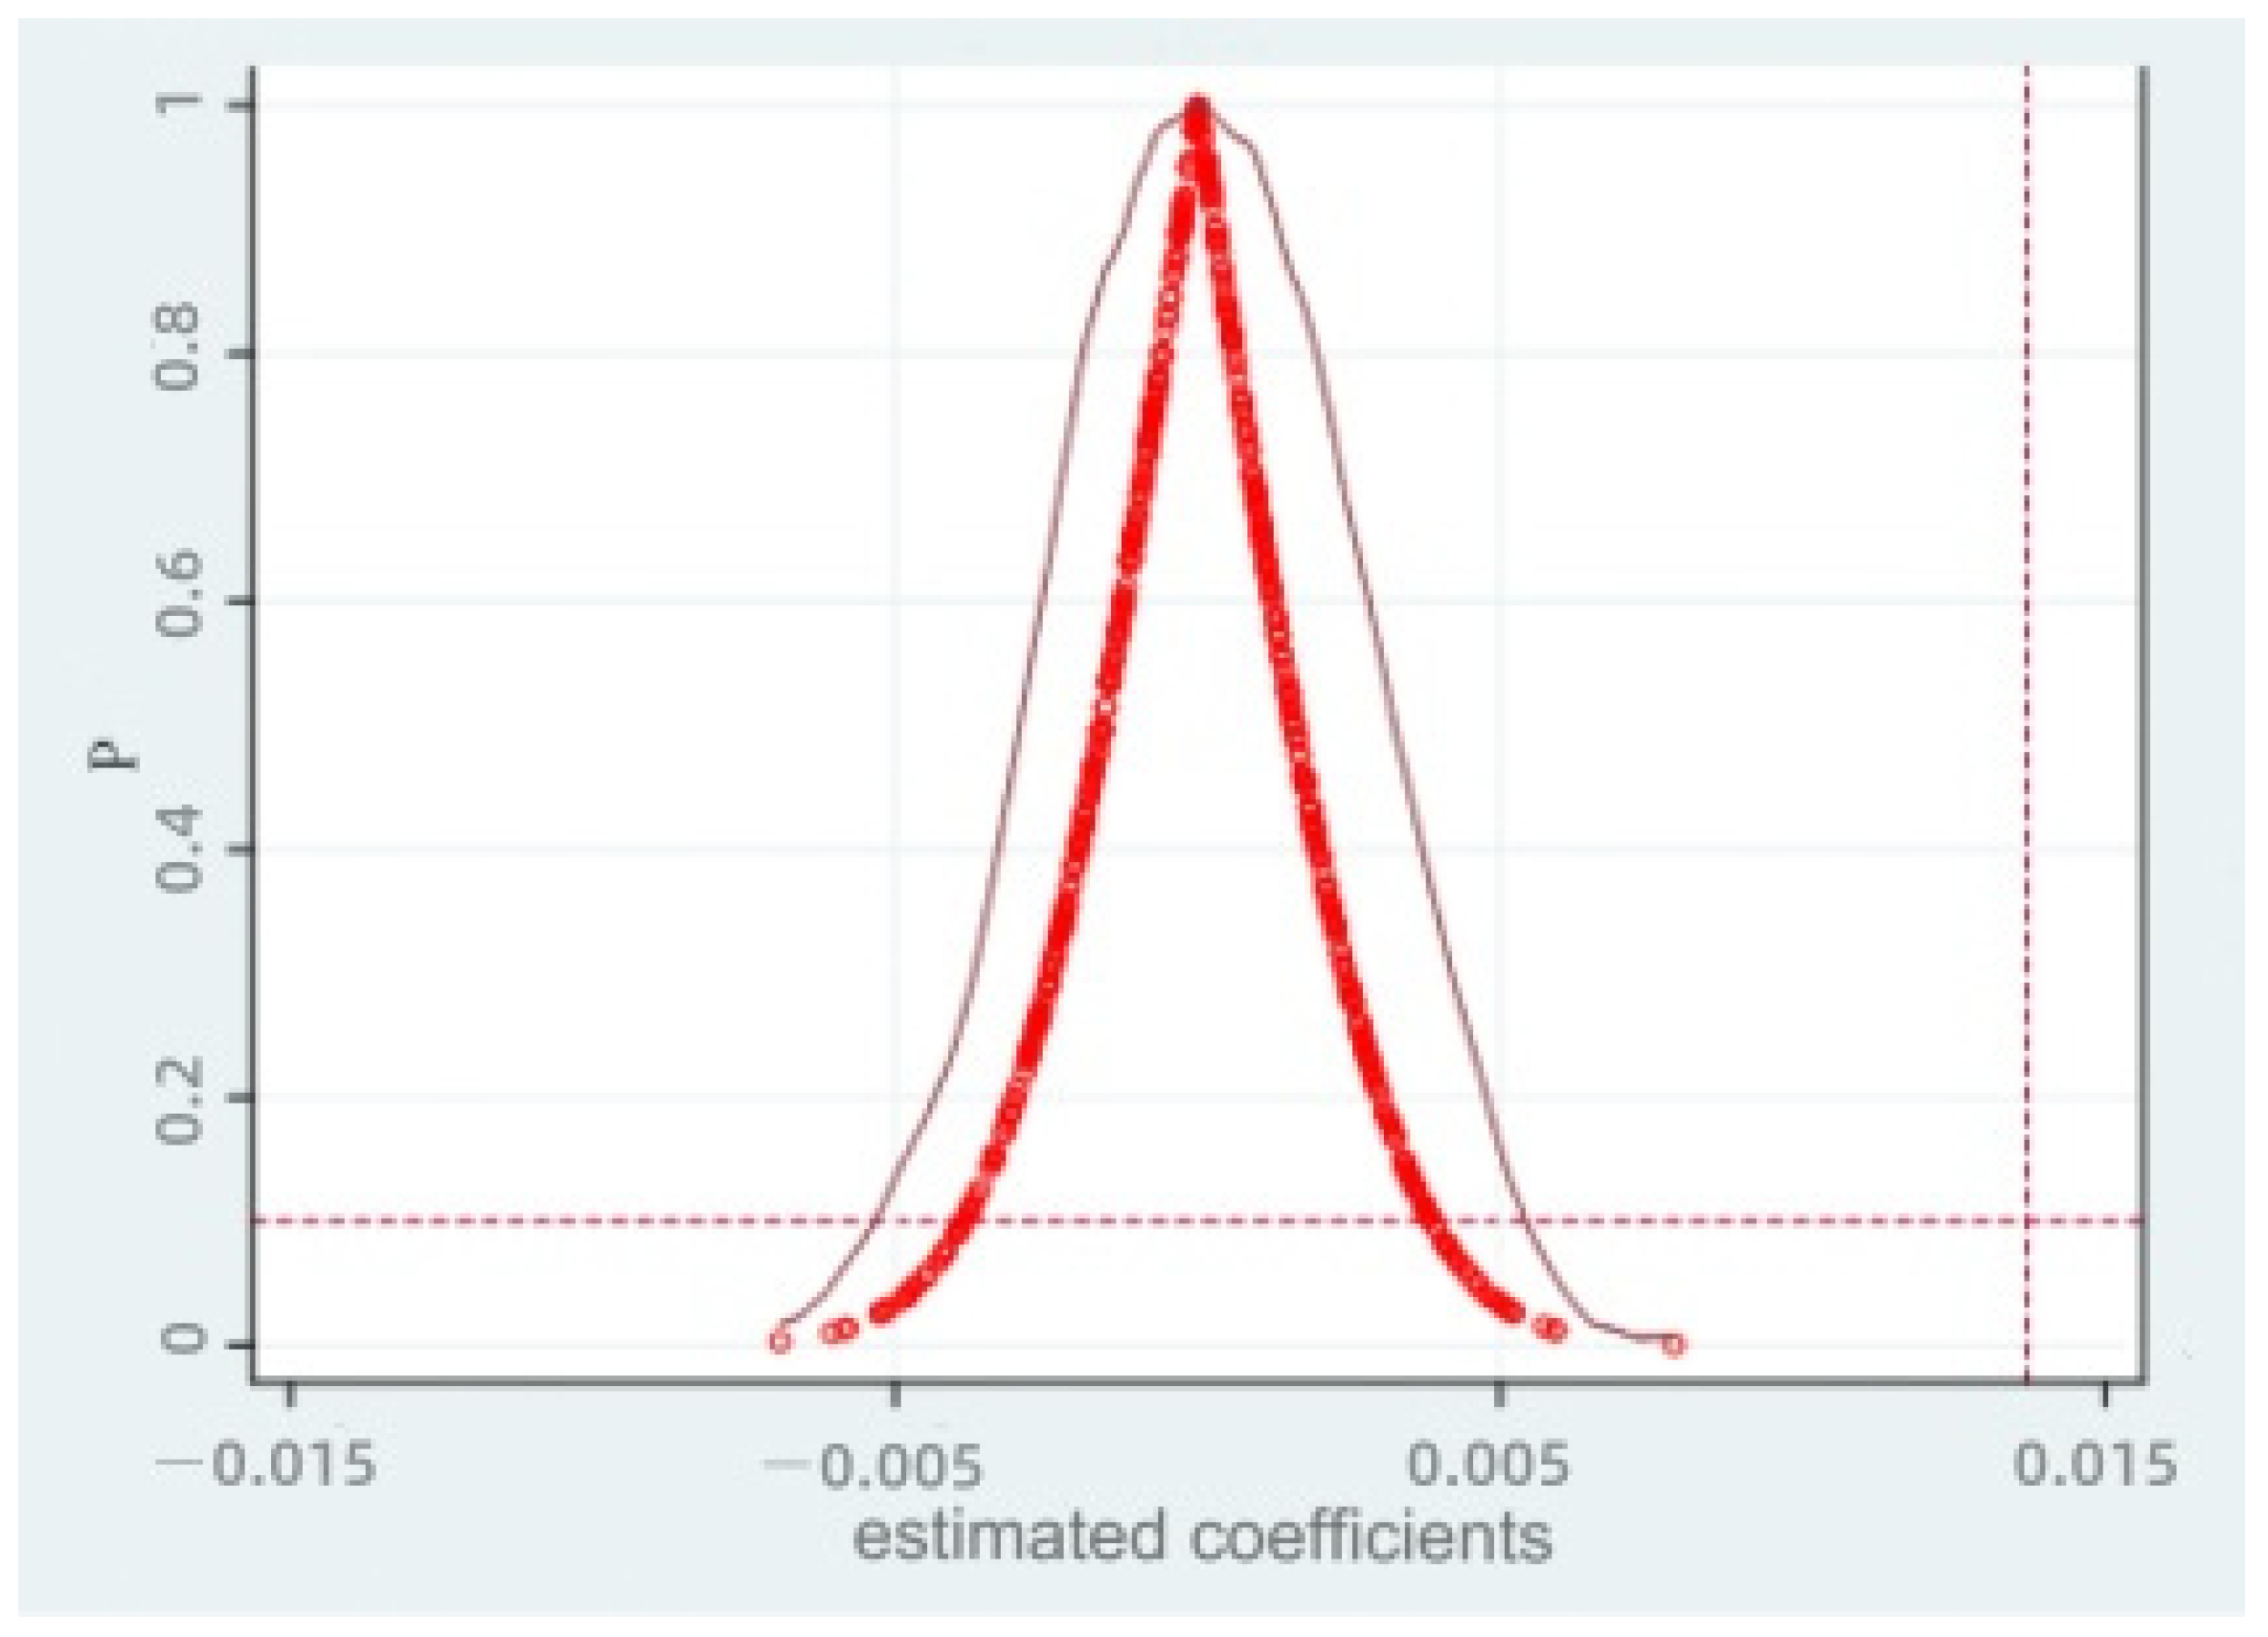
5.2.3. Placebo Test

In the baseline model and controlling for several variables that could potentially impact urban innovation quality, this study acknowledges the possibility of omitting essential explanatory variables. Failure to identify these variables might imply that the policy incentive effect of smart city pilots on urban innovation quality might not actually exist due to omitted variables, thus causing incomplete outcomes. To indirectly verify the issue of omitted variables, a placebo test through random sampling is conducted.
Initially, during the implementation of the smart city pilot construction policy, 20 cities were randomly selected from the data set as the treatment group and the rest as the control group. An interaction term (processing time) is constructed from this sample. Subsequently, this interaction term is included in the regression model. After repeating the above steps 500 times, the regression estimation coefficients are plotted as a kernel density map, as shown in Figure 2. The results show that the estimation coefficient is centered on zero and obeys normal distribution. In addition, most t values of the estimation coefficients exceed 0.1. This shows that the possibility that the baseline regression estimation results are influenced by unobservable factors is low, thus proving the robustness of the research results. Most scattered points in Figure 3 are located above the dotted line, that is, they are not significant at a level of 10% significance, which also illustrates the above research conclusions.

5.3. Heterogeneity Analysis

(1)
Population density heterogeneity: Differences in population density may lead to varying levels of new infrastructure stock [33]. Therefore, this study divides the research sample into cities with high and low population density using policy variables for separate validation. Table 5 reveals that the impact coefficients of new infrastructure construction on cities with both high and low population density are statistically significant and positive. This implies that new infrastructure development promotes the advancement of urban innovation quality. Notably, the coefficients for cities with high population density exhibit higher significance, indicating that investing in new infrastructure construction in these areas has a more pronounced positive effect on urban innovation quality and is more conducive to enhancing overall urban innovation levels.
(2)
Heterogeneity in urban location: Acknowledging differences in resource endowment and economic foundations across regions, both new infrastructure construction levels and urban innovation quality might exhibit locational heterogeneity [34]. This research divides the sample into eastern, central, and western regions, exploring the impact of new infrastructure construction on urban innovation quality under regional heterogeneity. Table 5 reveals that new infrastructure construction significantly and positively affects urban innovation quality in the eastern and central regions, with a more distinct impact observed in the central region compared to the eastern region. However, in the western region, the investment in new infrastructure construction suppresses the development of urban innovation quality. This phenomenon might be attributed to the already accumulated capital stock in the eastern and central regions, facilitating the flow and aggregation of information and knowledge, thereby demonstrating a positive impact on urban innovation quality [35]. One possible reason for the negative impact of new infrastructure construction on urban innovation quality in the western regions is that infrastructure development may be constrained by factors such as resource allocation, technological capabilities, and economic development. Given the relatively limited resource allocation in the western regions, governments may prioritize investment in traditional infrastructure, such as roads and water facilities, rather than innovative new infrastructure. This prioritization could result in insufficient development of new infrastructure projects. Additionally, lower technological capabilities and innovation capacities in the western regions may pose challenges during the implementation and operation of new infrastructure projects. Moreover, the lower level of economic development in these regions may lead to issues such as inadequate funding and insufficient market demand, further affecting the quality and effectiveness of new infrastructure construction.
These findings support the validity of Hypothesis 4.

5.4. Endogeneity Test

The double-difference method can mitigate endogeneity concerns by comparing treatment and control groups. However, its efficacy relies on the assumption that the selection of smart city pilot areas was random. If the treatment group exhibits notably superior innovation capabilities or has immense potential for urban innovation, leading to a higher likelihood of being selected as smart city pilots, bidirectional causality might reduce the persuasiveness and precision of the research conclusions.
To address endogeneity concerns, it is crucial to identify an appropriate instrumental variable to isolate the net effect of new infrastructure construction on urban innovation quality. Therefore, this study selects average city wind speed as the instrumental variable for smart city pilots [36].
Our choice of average urban wind speed as an instrumental variable is grounded in its relevance and exogeneity within the context of this study. Prior research has indicated a certain correlation between urban wind speed and the development of new infrastructure. However, urban wind speed itself should not be influenced by the construction of new infrastructure, thus possessing exogeneity. Furthermore, the direct association between average urban wind speed and urban innovation quality is relatively weak, which helps ensure that our instrumental variable does not confound the causal relationship we are interested in studying. By ensuring that average urban wind speed meets the requirements of exogeneity and relevance for instrumental variables, we can more accurately estimate the impact of new infrastructure development on urban innovation quality, thereby enhancing the internal validity and reliability of our study.
We utilized two-stage least squares (2SLS) regression analysis [37], and the results are presented in Table 6. According to Table 6, the estimated coefficient of new infrastructure development on urban innovation quality is significantly positive at a 1% level. The weak instrument test statistic, Cragg–Donald Wald F, has a value of 11.966, rejecting the null hypothesis of weak identification. This implies that average urban wind speed is unlikely to be influenced by endogeneity when explaining the impact of new infrastructure development on urban innovation quality. Additionally, the first-stage F-statistic of 16.38 exceeds 10, indicating the effectiveness and robustness of the instrumental variable. Thus, even after considering endogeneity issues, the smart city pilot policy still significantly promotes urban innovation quality, suggesting robustness of the baseline regression results. Moreover, the estimated coefficient of the baseline regression, 0.0137, is notably smaller than the estimated coefficient of the instrumental variable approach, 0.4302, indicating that endogeneity issues in the model may underestimate the promotion effect of the smart city pilot policy on urban innovation quality.
By conducting instrumental variable regression analysis, we have obtained the desired results indicating that new infrastructure development significantly enhances urban innovation quality. Therefore, we believe that average urban wind speed serves as an effective and exogenous instrumental variable in our study.

5.5. Further Analysis

5.5.1. Mediation Analysis

Controlling for time and individual fixed effects, the regression results using industrial structure upgrading as a mediator are presented in Models (1) to (2). In Model (1), prior to adding control variables, the policy coefficient stands at 0.306. After incorporating these variables, the coefficient significantly reduces to 0.0135 at a 1% significance level, indicating that smart city pilot policies foster the development of urban innovation quality. The mediation coefficient, at 0.000623 and significant at a 1% level, indicates a significant mediation effect of industrial structure upgrading. This implies that new infrastructure construction promotes urban innovation quality by enhancing urban industrial structure upgrading, thus validating Hypothesis 2.
The regression results displayed in Models (3) to (4) in Table 7 show the regression outcomes with total factor productivity acting as the mediating variable. Prior to incorporating control variables, the regression coefficient stands at −0.0193. Upon their inclusion, as demonstrated in Model (4), the coefficient for the policy is 0.0138, while the coefficient for the mediating variable is 0.00593, both significant at a 1% level. This suggests that following the establishment of smart city trials, with the increase in total factor productivity, there is a relative enhancement in regional innovation quality. Simultaneously, total factor productivity positively moderates the impact of new infrastructure construction on urban innovation quality: new infrastructure projects such as intelligent transportation and smart energy introduce more automated and intelligent technologies. The application of these technologies can enhance the efficiency of production processes and urban operations, thereby freeing up more time and resources for innovative activities. The implementation of new infrastructure not only enhances the efficiency of traditional infrastructure but also fosters new industries and business models. These emerging industries often center around innovation, bringing new innovative impetus to cities through the application and breakthroughs in technology. Thus, Hypothesis 3 is confirmed.

5.5.2. Policy Implementation Effectiveness Test

The Ministry of Housing and Urban-Rural Development announced the second and third batches of smart cities in May 2013 and 2014, respectively. However, this study selected only the first batch of pilot cities as the experimental group. The rationale behind this selection is twofold: Firstly, from the parallel trend chart, it is evident that the first batch of smart city construction showed initial results in 2013 and 2014, possibly gaining positive or negative experiences. The subsequent batches might have learned from these experiences, potentially improving the effectiveness of smart city construction. Secondly, the second and third batches of pilot cities had relatively shorter implementation periods compared to the first batch, which could lead to biased estimation results due to incomplete construction effects.
To validate the necessity of further promoting smart city pilots, a comparative regression analysis was conducted separately for the second batch, the third batch, and the combined second and third batch pilot cities. The marginal effect of multiple batches of smart city pilots on innovation quality tends to decrease over time. In Table 8, it is evident that the regression coefficients for these batches are not significant. Specifically, the coefficient for the combined second and third batches is 0.00697 at a 5% significance level, signifying that the phased implementation of pilot policies has an effect on innovation quality in pilot cities but with diminishing impact. Furthermore, as depicted in the previous parallel trend graph, the positive impact of smart city policies diminishes over time, indicating that these policies have a certain timeliness.
Several possible reasons account for this phenomenon:
(1)
Diminished initial enthusiasm and drive: Initially, pilot cities usually invest considerable resources and effort to expedite smart city construction. However, as time progresses, the novelty of the policy might wane, leading to a decline in enthusiasm from officials and society, thereby reducing execution capabilities.
(2)
Financial constraints: The construction of smart cities requires substantial funds and resources. Over time, the government may face resource shortages and fiscal constraints, making it challenging to sustain the initial investment levels, ultimately affecting innovation quality.
(3)
Technological and market changes: The tech industry is continuously evolving. New technologies and market trends might render existing pilot policies and projects outdated. The government may need to continually adjust policies to adapt to changing environments.
(4)
Management and execution issues: Government management and execution capabilities might be affected. While there could be initial passion and drive, issues like management rigidity could surface over time, reducing policy effectiveness.
(5)
Social feedback and engagement: Smart city pilot policies might generate social reactions and engagement. However, over time, societal resistance and protests might arise, leading the government into political dilemmas, hindering policy progression.
(6)
Learning curve: In the initial pilot phase, governments and relevant departments need time to learn how to effectively implement smart city policies. Once the government accumulates experience, execution efficiency might improve, but concurrently, policy effectiveness might gradually decline.

6. Conclusions and Recommendations

This study employs the implementation of the first batch of pilot cities under the smart city pilot policy as a quasi-natural experiment, utilizing balanced panel data from the first batch of smart city pilots in China from 2008 to 2018. It employs both fixed effects and mediation methods to empirically investigate the impact of new infrastructure construction on urban innovation quality. The findings indicate that the smart city policy significantly enhances the innovation quality of cities. By employing a difference-in-differences (DID) approach for empirical analysis and conducting parallel trend tests, removing special samples, and performing placebo tests on the replaced explanatory variables, the validity of the research conclusions is confirmed. The examination results reveal that the first batch of smart cities conforms to the attributes of quasi-natural experiments, and the DID method effectively evaluates the impact of new infrastructure construction on urban innovation quality.
Furthermore, through mechanism analysis, this study reveals that new infrastructure construction can promote urban innovation quality by enhancing industrial structure upgrading and increasing total factor productivity. Notably, the impact of new infrastructure construction on urban innovation quality varies depending on the location and population density of cities. In the central, eastern, and densely populated areas, the effects of smart city policies are more pronounced, indicating the crucial role of geographical location and population density in leveraging the advantages of new infrastructure construction. These regions also exhibit certain potential for industrial transformation and development. However, in the western regions, new infrastructure investments may hinder the development of urban innovation quality, ultimately leading to difficulties in achieving desired outcomes.
These research findings hold significant implications for urban development worldwide. Countries globally face similar challenges in urbanization and innovation, making the lessons and conclusions drawn from smart city construction invaluable for other nations’ and regions’ urban development. By understanding the impact mechanisms of smart city policies and regional differences, other countries can better formulate policy measures tailored to their own circumstances, promoting the enhancement of urban innovation capacity and development levels and fostering global urban sustainable development.
While this paper examines the relationship between new infrastructure construction and urban innovation quality using the DID method, there is still room for further development. Although this study has yielded some meaningful findings regarding the impact of new infrastructure construction on urban innovation quality, it is important to acknowledge its limitations. Firstly, the study primarily focuses on analyzing the influence of geographical location and population density on new infrastructure construction, without considering other factors that may affect urban innovation quality, such as urban governance, industrial structure, innovation capacity, and environmental quality. This implies that our study may not have fully captured all the factors influencing urban innovation quality, potentially leading to incomplete and biased results. Secondly, the sample used in this study consists of prefecture-level cities in China. Longitudinally, provincial and county-level samples were not considered, and horizontally, the study of other countries and regions was not sufficiently in-depth. Additionally, although the longitudinal time series data used in this paper is substantial, there is still room for further exploration in the use of methods. Therefore, future research could expand to other countries and regions, conduct multi-scale comparative studies in the same research field, and utilize dynamic panel analysis to establish long-term relationships between indicators.

7. Future Work

In the future, cities face numerous challenges and opportunities, including population growth, resource constraints, environmental pollution, and more. New infrastructure construction can provide cities with smarter, more efficient, and sustainable solutions, helping them better tackle future challenges and seize opportunities. Therefore, researching the impact of new infrastructure construction on urban innovation quality holds significant guiding and strategic importance for the development of future cities. Based on these research conclusions, the following policy insights were derived:
(1)
Increase investment in new infrastructure: New infrastructure construction plays a crucial role in fostering urban innovation quality. Leveraging new infrastructure to support and propel urban innovation development can focus on initiatives like high-speed broadband internet, data centers, and IoT facilities, which form a robust foundation for digitized economies and technological innovations, thereby enhancing urban innovative capabilities. Additionally, developing and applying smart city solutions, such as intelligent transportation systems, smart energy management, and urban planning, can improve efficiency, sustainability, quality of life, and create more opportunities for innovation.
(2)
Actively promote the formation of industrial clusters in specific innovation fields: To expedite industrial structural upgrades and economic diversification, governments can implement various measures, including improved financial support, policy adjustments to meet new demands, enhanced management and execution mechanisms, encouraging social participation, strengthening supervision, and feedback mechanisms. Moreover, fostering innovation and technological progress, establishing ecosystems supporting startups, including incubators, venture capital, and entrepreneurial training, and providing tax incentives can maintain the momentum and vitality of smart city construction.
(3)
Prioritize investment in smart infrastructure projects that integrate advanced technologies and innovation-driven solutions: Focusing on such projects can effectively enhance productivity and stimulate innovation activities within cities. Measures such as elevating total factor productivity, nurturing talents, integrating cutting-edge technologies, and optimizing resource allocation can improve the efficiency and quality of urban innovation activities. Additionally, periodic evaluation and adjustment of regulatory frameworks are crucial. These frameworks should possess sufficient flexibility to adapt to evolving technologies, ensuring alignment with urban innovation goals while safeguarding public interests.
(4)
Implement differentiated new infrastructure policy arrangements and distinct target orientations: For resource-rich western regions, encouraging investments in green and sustainable infrastructure, such as clean and renewable energy facilities and intelligent transportation systems, can reduce urban carbon footprints, elevate environmental quality, and create innovative opportunities. In contrast, in the relatively developed eastern and central regions, the government can encourage the establishment of research and innovation hubs, offering venues and resources to facilitate technological innovation and industrial upgrades. These centers can serve as hubs for cooperation and knowledge sharing across different industries.

Author Contributions

Methodology, Z.W.; writing—original draft, Z.L.; writing—review and editing, S.X. All authors have read and agreed to the published version of the manuscript.

Funding

This research was funded by the Science Research Foundation of Wuhan Institute of Technology (grant number K202020). Graduate Education and Teaching Reform Project of Wuhan Institute of Technology (grant number 2021JYXM03).

Data Availability Statement

All data supporting the findings of this study are provided in this manuscript.

Conflicts of Interest

Author Zhe Wei was employed by the company Wuhan Shiny Technology Co., Ltd. The remaining authors declare that the research was conducted in the absence of any commercial or financial relationships that could be construed as a potential conflict of interest.

References

  1. Pan, W.; Xie, T.; Wang, Z.; Ma, L. Digital economy: An innovation driver for total factor productivity. J. Bus. Res. 2022, 139, 311. [Google Scholar] [CrossRef]
  2. Zhang, T.; Shi, Z.-Z.; Shi, Y.-R.; Chen, N.-J. Enterprise digital transformation and production efficiency: Mechanism analysis and empirical research. Econ. Res. Ekon. Istraživanja 2022, 35, 2792. [Google Scholar] [CrossRef]
  3. Wang, S.; Sun, X.; Cong, X.; Gao, Y. Input Efficiency Measurement and Improvement Strategies of New Infrastructure under High-Quality Development. System 2023, 11, 243. [Google Scholar] [CrossRef]
  4. Zhang, W.; Meng, F. Digital Economy and Intelligent Manufacturing Coupling Coordination: Evidence from China. Systems 2023, 11, 521. [Google Scholar] [CrossRef]
  5. Mohamed, M.M.A.; Liu, P.F.; Nie, G.H. Are Technological Innovation and Foreign Direct Investment a Way to Boost Economic Growth? An Egyptian Case Study Using the Autoregressive Distributed Lag (ARDL) Model. Sustainability 2021, 13, 3265. [Google Scholar] [CrossRef]
  6. Lin, X.; Zhou, X.; Wang, P. Spatial differentiation and influencing factors of industrial resource and environmental pressures in China. Environ. Dev. Sustain. 2023, 25, 9991. [Google Scholar] [CrossRef]
  7. Wang, S.L.; Chen, F.W.; Liao, B.; Zhang, C.J. Foreign Trade, FDI and the Upgrading of Regional Industrial Structure in China: Based on Spatial Econometric Model. Sustainability 2020, 12, 815. [Google Scholar] [CrossRef]
  8. Huang, M.; Ding, R.J.; Xin, C.H. Impact of Technological Innovation and Industrial-Structure Upgrades on Ecological Efficiency in China in Terms of Spatial Spillover and the Threshold Effect. Integr. Environ. Asses. 2021, 17, 865. [Google Scholar] [CrossRef]
  9. Gao, C.X.; Tao, S.M.; He, Y.Y.; Su, B.; Sun, M.; Mensah, I.A. Effect of population migration on spatial carbon emission transfers in China. Energy Policy 2021, 156, 112450. [Google Scholar] [CrossRef]
  10. Wang, T.T.; Wu, K.; Yao, C.Y.; Liu, X.X. Complex Pathways to Population Shrinkage: Case Study of Hegang City, China. Chin. Geogr. Sci. 2022, 32, 437. [Google Scholar] [CrossRef]
  11. Huang, C.; Qu, Y.; Huang, L.F.; Meng, X.; Chen, Y.L.; Pan, P. Quantifying the Impact of Urban Form and Socio-Economic Development on China’s Carbon Emissions. Int. J. Environ. Res. Public Health 2022, 19, 2976. [Google Scholar] [CrossRef]
  12. Xu, C.; Du, Y.; Qi, L.; Li, R.; Yang, Z. Assessing the Potential for Developing Innovation Districts at the City Scale by Adapting a New Sustainable Entrepreneurial Ecosystems Method. Buildings 2023, 13, 2572. [Google Scholar] [CrossRef]
  13. Rosik, P.; Wójcik, J. Transport Infrastructure and Regional Development: A Survey of Literature on Wider Economic and Spatial Impacts. Sustainability 2023, 15, 548. [Google Scholar] [CrossRef]
  14. Du, X.; Zhang, H.M.; Han, Y.W. How Does New Infrastructure Investment Affect Economic Growth Quality? Empirical Evidence from China. Sustainability 2022, 14, 3511. [Google Scholar] [CrossRef]
  15. Dervitsiotis, K.N. The challenge of adaptation through innovation based on the quality of the innovation process. Total Qual. Manag. Bus. Excell. 2011, 22, 566. [Google Scholar] [CrossRef]
  16. Wang, D.; Zhao, X.; Zhang, Z. The Time Lags Effects of Innovation Input on Output in National Innovation Systems: The Case of China. Discret. Dyn. Nat. Soc. 2016, 2016, 1963815. [Google Scholar] [CrossRef]
  17. Bourke, J.; Roper, S. Innovation, quality management and learning: Short-term and longer-term effects. Res. Policy 2017, 46, 1518. [Google Scholar] [CrossRef]
  18. Tan, J.; Zhang, Y.; Cao, H. The FDI-spawned technological spillover effects on innovation quality of local enterprises: Evidence from industrial firms and the patents in China. Appl. Econ. 2023, 55, 5800–5815. [Google Scholar] [CrossRef]
  19. Yang, Z.C.; Wu, Y.X.; Wang, F.F.; Chen, A.C.; Wang, Y.X. Spatial-temporal differences and influencing factors of coupling coordination between urban quality and technology innovation in the Guangdong-Hong Kong-Macao Greater Bay Area. PLoS ONE 2023, 18, e0289988. [Google Scholar] [CrossRef] [PubMed]
  20. Li, Z.R.; Zhang, K.Y.; Dang, J.; Zheng, S.Q.; Wang, R.; Wang, Z.R. Research on the Influence of External Search Strategy on Enterprise Innovation. Ecol. Chem. Eng. S 2023, 30, 111–116. [Google Scholar] [CrossRef]
  21. Wang, J.; He, D. Sustainable urban development in China: Challenges and achievements. Mitig. Adapt. Strateg. Glob. Change 2015, 20, 682. [Google Scholar] [CrossRef]
  22. Li, C.; Song, Y.; Chen, Y. Infrastructure Development and Urbanization in China; Springer: Singapore, 2017; pp. 91–107. [Google Scholar]
  23. Cheng, Z.; Li, L.; Liu, J. Industrial structure, technical progress and carbon intensity in China’s provinces. Renew. Sustain. Energy Rev. 2018, 81, 2946. [Google Scholar] [CrossRef]
  24. Chen, M.X.; Moore, M.O. Location decision of heterogeneous multinational firms. J. Int. Econ. 2010, 80, 199. [Google Scholar] [CrossRef]
  25. Sharma, P.; Tripathi, R.C. Patent citation: A technique for measuring the knowledge flow of information and innovation. World Pat. Inf. 2017, 51, 42. [Google Scholar] [CrossRef]
  26. Leydesdorff, L.; Kushnir, D.; Rafols, I. Interactive overlay maps for US patent (USPTO) data based on International Patent Classification (IPC). Scientometrics 2014, 98, 1583–1599. [Google Scholar] [CrossRef]
  27. Tong, T.W.; Zhang, K.; He, Z.-L.; Zhang, Y. What determines the duration of patent examination in China? An outcome-specific duration analysis of invention patent applications at SIPO. Res. Policy 2018, 47, 591. [Google Scholar] [CrossRef]
  28. Dang, J.; Motohashi, K. Patent statistics: A good indicator for innovation in China? Patent subsidy program impacts on patent quality. China Econ. Rev. 2015, 35, 155. [Google Scholar] [CrossRef]
  29. Pan, Y.; Luo, L. The Impact of Infrastructure Investment on High-quality Economic Development: Mechanisms and Heterogeneity Research. Reform 2020, 33, 100–113. [Google Scholar]
  30. Koc, T.; Bozdag, E. Measuring the degree of novelty of innovation based on Porter’s value chain approach. Eur. J. Oper. Res. 2017, 257, 567. [Google Scholar] [CrossRef]
  31. Ryan, A.M.; Kontopantelis, E.; Linden, A.; Burgess, J.F. Now trending: Coping with non-parallel trends in difference-in-differences analysis. Stat. Methods Med. Res. 2018, 28, 3711. [Google Scholar] [CrossRef]
  32. Kong, D.; Li, J.; Jin, Z. Can Digital Economy Drive Income Level Growth in the Context of Sustainable Development? Fresh Evidence from “Broadband China”. Sustainability 2023, 15, 13170. [Google Scholar] [CrossRef]
  33. Xu, S.-C.; Miao, Y.-M.; Gao, C.; Long, R.-Y.; Chen, H.; Zhao, B.; Wang, S.-X. Regional differences in impacts of economic growth and urbanization on air pollutants in China based on provincial panel estimation. J. Clean. Prod. 2019, 208, 352. [Google Scholar] [CrossRef]
  34. Kang, Y. Regulatory institutions, natural resource endowment and location choice of emerging-market FDI: A dynamic panel data analysis. J. Multinatl. Financ. Manag. 2018, 45, 14. [Google Scholar] [CrossRef]
  35. Regan, M. Capital Markets, Infrastructure Investment and Growth in the Asia Pacific Region. Int. J. Financ. Stud. 2017, 5, 5. [Google Scholar] [CrossRef]
  36. Kleibergen, F.; Zivot, E. Bayesian and classical approaches to instrumental variable regression. J. Econom. 2003, 114, 72. [Google Scholar] [CrossRef]
  37. Wu, W.; Ji, Z.; Liang, H. The Impact of New infrastructure Construction on Optimization and Upgrading of Industrial Structure. Buildings 2023, 13, 2580. [Google Scholar] [CrossRef]
Figure 1. Parallel effect test results.
Buildings 14 00548 g001
Figure 2. Kernel density estimation plot for t value.
Buildings 14 00548 g002
Figure 3. Scatterplot of p-values.
Buildings 14 00548 g003
Table 1. Basic statistical description of the related variables.
VariablesSampleAverageSdMinMax
tech34200.11070.07460.00000.4686
treated×time34200.15200.35910.00001.0000
upgrade 3420227.1614.475183.12283.20
Total factor productivity34207.78731.8534−0.383313.306
lngdp34207.18630.96534.328010.5494
fdi34201.67581.80340.000017.8338
sci34200.24960.23680.01284.2646
lncult3420−7.84240.8779−10.9563−3.8294
hr34201.79822.33830.005114.6375
Table 2. Benchmark regression.
(1)(2)(3)(4)(5)(6)
treated × time0.0143 ***0.0140 ***0.0139 ***0.0140 ***0.0138 ***0.0137 *
(0.00391)(0.00391)(0.00391)(0.00390)(0.00391)(0.00798)
lngdp −0.00869−0.00897−0.0134 *−0.0133 *−0.0136
(0.00698)(0.00700)(0.00710)(0.00710)(0.0131)
fdi 0.0004410.0002400.0002350.000268
(0.000844)(0.000844)(0.000844)(0.00151)
sci 0.0224 ***0.0223 ***0.0221 *
(0.00623)(0.00623)(0.0120)
lncult 0.002670.00266
(0.00264)(0.00401)
hr 0.000986
(0.00373)
_cons0.0918 ***0.161 ***0.162 ***0.189 ***0.210 ***0.210 **
(0.00280)(0.0475)(0.0476)(0.0480)(0.0524)(0.0934)
Time/city effectYESYESYESYESYESYES
R20.1340.1380.1380.1410.1420.142
Observations342034203420342034203420
(Note: Standard errors are shown in parentheses; *, **, *** indicate significance at the 10%, 5%, and 1% levels).
Table 3. Panel data quantile.
Q20Q40Q60Q80
treated×time0.004530.00970 ***0.0106 ***0.0110 *
(0.00311)(0.00251)(0.00344)(0.00662)
ControlYESYESYESYES
Double fixedYESYESYESYES
_cons0.465 ***0.531 ***0.560 ***0.542 ***
(0.0684)(0.0553)(0.0757)(0.146)
N3420342034203420
(Note: Standard errors are shown in parentheses; *, *** indicate significance at the 10% and 1% levels).
Table 4. The robustness test.
Exclusion of OutliersReplacement by the Explanatory VariableCombined Effect Other Policies Are Excluded
Trapped Tail 1%ln (the Number of Patents per Ten Thousand People)Number of Patents LogarithmProvincial × Time Interaction Item Is AddedBroadband China
treated×time0.0139 ***0.110 ***0.0550 ***0.0134 ***0.0130 ***
(0.00379)(0.0161)(0.0331)(0.00390)(0.00393)
ControlYESYESYESYESYES
Double fixedYESYESYESYESYES
combined effect NONONOYESNO
_cons0.200 ***−0.464 **0.5004.286 ***0.221 ***
(0.0520)(0.215)(0.444)(1.035)(0.0526)
R20.1440.5660.8120.1460.143
N34203420342034203420
(Note: Standard errors are shown in parentheses; **, *** indicate significance at the 5% and 1% levels).
Table 5. Test of heterogeneity.
Remove the CityThree PlatesLevel of Economic Development
Excluding Municipalities, Provincial Capital and Sub-Provincial LevelEast MiddleWestHigh Population Density CitiesLow Population Density Cities
treated×time0.0135 ***0.0210 ***0.0425 ***−0.0204 **0.0169 ***0.0152 ***
(0.00392)(0.00511)(0.00605)(0.00885)(0.00616)(0.00489)
ControlYESYESYESYESYESYES
Double fixedYESYESYESYESYESYES
combined effect NONONONONONO
_cons0.222 ***0.0838−0.003850.339 ***0.02850.216 ***
(0.0527)(0.0668)(0.121)(0.110)(0.0860)(0.0648)
R20.1430.1980.2970.1340.2550.142
N33721440960102013562064
(Note: Standard errors are shown in parentheses; **, *** indicate significance at the 5% and 1% levels.).
Table 6. Regression of the instrumental variables.
Wind
Stage Ⅰ Stage 2
Treated×TimeTech
IV0.4302 ***
(0.0018)
Inter 0.0168 ***
(0.0040)
_cons−0.2337 ***0.0304
(0.0382)(0.0372)
Kleibergen-Paap rk LM
Cragg-Donald Wald F
F statistic
0.000
11.966
>(16.38)
R20.95210.0639
(Note: Standard errors are shown in parentheses; *** indicate significance at the 1% levels).
Table 7. Intermediary effect test.
Upgrade IndustriesTotal Factor Productivity
(1)(2)(3)(4)
treated×time0.3060.0135 ***−0.01930.0138 ***
(0.250)(0.00391)(0.0367)(0.00391)
metavariable 0.000623 ** 0.00593 ***
(0.000280) (0.00191)
_cons198.1 ***0.086611.00 ***0.145 **
(3.347)(0.0763)(0.491)(0.0564)
R20.8060.1430.7690.144
N3420342034203420
(Note: Standard errors are shown in parentheses; **, *** indicate significance at the 5% and 1% levels).
Table 8. Three pilot cities are compared and returned.
Second BatchThird BatchThree Batches
(Culling the First Batch)(Eliminate the First and Second Batches)
treated×time0.00750−0.007700.00697 **
(0.0124)(0.00611)(0.00346)
ControlYESYESYES
Double fixedYESYESYES
_cons0.269 ***0.264 ***0.218 ***
(0.0593)(0.0601)(0.0524)
R20.1370.1340.139
N264025803420
(Note: Standard errors are shown in parentheses; **, *** indicate significance at the 5% and 1% levels).
Disclaimer/Publisher’s Note: The statements, opinions and data contained in all publications are solely those of the individual author(s) and contributor(s) and not of MDPI and/or the editor(s). MDPI and/or the editor(s) disclaim responsibility for any injury to people or property resulting from any ideas, methods, instructions or products referred to in the content.

