Abstract
Mechanically stabilized earth (MSE) walls perform well under earthquake loads, and hence they are preferred in earthquake-prone regions. The multifaceted load transfer between the components of the MSE wall under seismic loads can be captured using numerical analysis. This study presents the results of a series of numerical analyses performed to investigate the effects of the frequency of the input ground motion on the seismic response of MSE walls. MSE wall design configurations were prepared using various reinforcement designs (length, vertical spacing, and stiffness). A frequent wall height of 8 m was selected for the analysis. Using two-dimensional finite element analysis, each MSE model was excited with seven (7) different input ground motion accelerograms with equal Arias Intensity, but with different frequencies ranging between 1 Hz and 8 Hz. The results of the numerical analyses indicated rotation at the top of the MSE wall in seismic conditions. The frequency versus acceleration plot for a point close to the top of the MSE wall indicated peaks for the excitations with frequencies = 1.5 Hz and = 4 Hz, which are close to the estimated natural frequency of the overall model (including the foundation soil) and the MSE wall, respectively. The highest normalized acceleration amplification factor solely within the MSE wall was recorded as 1.86 for the excitation with a frequency equivalent to its fundamental frequency (≅ 4 Hz). In this study, the 8 m high MSE wall models placed on a firm clayey foundation soil with the reinforcement parameters with length over height ratio in 0.5–1 range, axial stiffness in 600–1200 kPa range, and reinforcement vertical spacing in 0.4–0.6 m range performed satisfactorily under moderate seismic loads.
1. Introduction
The advancements in geosynthetics led to the widespread use of geotextiles and geogrids, making geosynthetic mechanically stabilized earth (MSE) walls very popular in the last decades. High-strength geogrids facilitated the construction of single-tiered or multi-tiered MSE walls [1]. Based on the life cycle assessment studies, the CO2 footprint of MSE walls is much lower than their traditional alternatives, and hence, they provide sustainable and environmentally friendly solutions [2,3]. The geosynthetic MSE walls are typically constructed with a vertical reinforcement spacing () in the 0.4~0.6 m range. Once geotextiles or geogrids are tightly placed (i.e., m), an enhanced reinforced soil structure, geosynthetic-reinforced soil (GRS) wall, is formed [4]. GRS walls are preferred for abutments directly placed on reinforced soil [5,6]. However, widely spaced reinforcements can reduce construction time and cost. Accordingly, MSE walls remain advantageous in transportation projects that mainly require the stabilization of a potential active wedge. The use of MSE wall systems in seismically active areas is especially beneficial as they can tolerate larger total vertical and differential settlements compared to rigid retaining systems [7,8] and perform satisfactorily in seismic events [9,10,11,12].
The seismic design of MSE walls under earthquake loading is typically performed using a pseudo-static approach per AASHTO/FHWA [13]. The total (i.e., sum of static and seismic) thrust (PAE) and the horizontal inertial forces (PIR) acting on the MSE wall system are calculated for external stability analysis [13]. The maximum acceleration () was originally defined with Equation (1) per allowable stress design (ASD) [14]:
Following the load and resistance factor design (LRFD) approach, can be derived utilizing the site-specific seismic parameters: peak ground acceleration (PGA), site class, and spectral accelerations (i.e., Ss and S1). Typically, the horizontal seismic coefficient () is assumed to be equal to , and the vertical seismic coefficient () is assumed to be equal to zero. The total active seismic thrust (PAE) is calculated using the Monobe–Okabe (M–O) dynamic earth pressure coefficient (KAE) for the active state. In the M–O method, when a surcharge is present on the MSE wall, the total seismic active thrust resulting from the surcharge is also calculated using KAE. A reduction factor, that is dependent on site-specific parameters and the height of the MSE wall, is applied to to obtain the within the reinforced zone. Per FHWA, PIR is calculated using Equation (2):
in which corresponds to the weight of the reinforced soil mass and permanent surcharges, including those from permanent slopes, within the limits of the reinforced soil mass. Lastly, sliding, eccentricity, and bearing capacity checks are performed on the MSE wall using the LRFD approach [13].
To perform internal stability checks considering the seismic activity, an internal dynamic force (Pi) is assumed to develop in the reinforced mass due to the active zone that is a triangular wedge for extensible reinforcements per AASHTO/FHWA [13]. The mass of this active zone is multiplied by to determine . This internal inertia force is distributed to each reinforcement as , and the total force ( on each reinforcement layer can be expressed using Equations (3) and (4) per FHWA [13]:
where = horizontal stress, = vertical reinforcement spacing, and n = number of reinforcement layers. The reinforcements are then designed to resist both (i) pullout and (ii) tensile strength failures, considering both the static and dynamic components of the load for the design life of the MSE wall.
The analysis of MSE walls using acceleration–time history requires significant computational effort. Accordingly, pseudo-static approaches are widely used in the design of MSE wall systems located in regions of low-to-moderate seismicity (i.e., for PGA ≤ 0.3 g) [15,16]. However, this type of simplified analysis cannot capture the multi-layered load transfer between the components of the MSE wall and its dynamic behavior. Also, the characteristics of the ground motion (i.e., duration and frequency) and the change in acceleration (amplification or de-amplification) in the foundation–fill–reinforcement system cannot be effectively simulated with this approach [11,17]. The pseudo-static analysis is also generally known to over-predict the seismic forces leading to a non-economical design [15,18,19,20]. Furthermore, the contemporary design of MSE walls requires satisfying the criteria for serviceability limit states along with the ultimate limit states. Using only limit equilibrium procedures coupled with the pseudo-static approach may be inadequate to complete the seismic design of MSE walls; the expected deformations cannot be estimated [21].
Several researchers utilized model shaking table tests to evaluate the seismic behavior of reinforced-earth wall systems [22,23,24,25,26,27,28]. Matsuo et al. [29] indicated that increasing the reinforcement length-to-wall height ratio from 0.4 to 0.7 can effectively reduce deformations based on the results of shaking table tests performed on reduced-scale 1 m high MSE walls. Based on the results of shaking table tests on reduced-scale 1 m high MSE walls, El-Emam and Bathurst [30] showed that the horizontal displacements decrease with an increase in , reinforcement axial stiffness (, and number of layers of reinforcements (n). Nonetheless, some discrepancies were observed between the predicted and measured values of earth pressures, backfill amplification factors, and connection loads in reinforced-earth walls [30]. The effect of natural frequency on the seismic behavior of the MSE walls has not been extensively studied using shaking table tests. The recent findings presented by Cai et al. [31] indicate that resonance may not be one of the fundamental factors that affect the seismic response of reinforced soil walls. On the contrary, results of other experimental studies indicate that the frequency of the ground motion can affect the dynamic increment of horizontal and vertical earth pressures and the behavior of MSE walls [32]. These discrepancies in the results indicate the need to better understand the effect of frequency on the seismic behavior of MSE walls.
The research studies that utilize the three-dimensional (3D) numerical modeling approaches generally focused on the static stability of MSE walls [33,34,35]. This is likely due to the fact that a very high computational effort is required for the dynamic analysis of a 3D MSE wall model. Several two-dimensional (2D) numerical studies (using either finite-element or finite-difference methods) have been utilized in the last decades to evaluate the seismic response of reinforced-earth wall systems [36,37,38,39,40,41]. Few researchers also studied the effects of reinforcement parameters (, and ) on the seismic behavior of MSE walls using numerical analysis. Bathurst and Hatami [42] numerically investigated the effect of (in 500–69,000 kN/m range) on the seismic behavior of MSE walls and reported that the total wall displacements reduced with an increasing , especially for values in the range of 500–2000 kN/m. Ling et al. [37] observed that acceleration amplification is not influenced significantly by the reinforcement layout, but displacements of the reinforcements were affected by the reinforcement length and arrangement. Ling et al. [38] investigated the effects of (0.2–1.0 m) and ratio (0.3–0.9) on the response of a 6 m high MSE wall under Kobe earthquake loading condition. These researchers reported that the magnitude of the reinforcement axial forces are mainly affected by the changes in and the horizontal displacements are significantly affected by both and [38].
Numerical analyses of MSE walls offer an opportunity to better understand the displacements along the height and the reinforcements axial loads caused by the coupled load transfer mechanism both in static and seismic conditions [33,43]. The significance of foundation soil characteristics on the behavior of GRS walls was highlighted in several previous numerical studies [44,45,46,47]. However, in the majority of the well-documented seismic research investigations performed to date, the excitation is applied just beneath the MSE wall model [37,38,42,48,49,50]. In practice, such a condition is rather scarce, and generally, the waves propagating from the bedrock pass through the foundation soil before reaching the bottom of the MSE wall. Accordingly, the response of the MSE structure is also affected by the foundation soil in addition to the characteristic of the input ground motion. However, the numerical studies that account for the effects of foundation soil on the seismic behavior of MSE walls are very limited [51,52,53]. In most of the recent studies, the effect of the foundation characteristics on the seismic response of MSE walls has not been considered [54]. One of the reasons for this is that there is no clear consensus on the methodologies to account for the foundation soil in the numerical analysis of seismically loaded MSE walls.
This paper presents the results of a series of numerical analyses performed using PLAXIS 2D on 8 m high geosynthetic MSE wall models constructed on a natural clayey soil to comprehend their seismic response in regions of low-to-moderate seismicity. The main objective of this parametric study is to evaluate the effect of frequency of the variable amplitude harmonic ground motion on the seismic response of 8 m high MSE walls constructed on a clayey foundation soil. To better model the soil deformation behavior, the hardening soil model was used for foundation soil, retained fill, and reinforced fill. MSE walls were modeled with various design configurations, and hence, the effect of length-to-wall height ratio , reinforcement vertical spacing (), and reinforcement axial stiffness () on wall displacements and reinforcement axial forces were also discussed for the range of input ground motion frequencies investigated. The natural frequencies of both the MSE wall and the overall FE model (including the MSE wall and the clayey foundation soil) were evaluated using various empirical methods present in the literature. The frequency range of the variable amplitude harmonic input ground motions was selected to bracket these natural frequency values. The deformed shape of the models in the static condition and at the end of the seismic excitation were compared together with axial forces in reinforcements in the context of a detailed evaluation of MSE wall behavior.
The main novelties of this paper include (i) the use of varying amplitude input ground motions with a range of frequency; (ii) the application of the input ground motion at the bedrock level below the clayey foundation soil; and (iii) the use of hardening soil model for fill and foundation soils. Additionally, this study presents a unique discussion of the MSE wall behavior based on several reinforcement design parameters (length, spacing, and stiffness), considering both the natural frequency of the MSE wall and the overall system (including the foundation soil and the MSE wall).
2. Numerical Approach
Considering the uniform cross-sectional geometry of the problem, 8 m high MSE wall models were prepared and analyzed using 2D FE software PLAXIS 2D.
2.1. FE Model Geometry and Material Properties
The general geometry of the MSE models analyzed in this study is shown in Figure 1. The left and right boundaries were normally fixed, and the bottom boundary was fully fixed. Viscous boundaries were also placed at the left and right edges of the model to avoid reflections of the seismic waves. Lysmer and Kuhlmeyer [55] originally introduced these viscous (absorbent) boundary conditions, which work as a damper to apply resistance at the boundaries in the horizontal and vertical directions. In the model, this resistance in the normal and tangential directions at the boundary is controlled with normal () and tangential () relaxation coefficients. In this study, both of these coefficients were assigned as 1.0 to provide standard absorption. In this way, an increase in stress on these boundaries and potential wave rebound were prevented.

Figure 1.
MSE wall model used in the parametric study: dimensions and FE mesh connectivity.
The mesh coarseness was selected carefully based on a mesh convergence analysis, adjusting the computational effort and the accuracy of the results. The maximum element size in the reinforced zone was optimized per the study by Kuhlmeyer and Lysmer [56]. A mesh ratio (i.e., the ratio of maximum element size to the wavelength) equal to or less than one-eighth of the smallest wavelength provides reliable results in dynamic applications. In this study, the mesh coarseness was adjusted by considering the maximum frequency applied in the models (i.e., 8 Hz) and the estimated shear wave velocity range in the retained backfill. The mesh quality of the reinforced zone was checked to ensure the harmonic excitation characteristics with the range of frequencies considered in this study could be reflected in the model. As a result, a fine mesh was generated for the whole model. The mesh size between the geogrids was further decreased to ensure that reinforcement layers were not tied to each other with single elements. Based on this, the reinforced soil zone and 1 m of granular soil behind the reinforced fill were all refined as a cluster, and a mesh coarseness factor of 0.5 (i.e., two times the overall mesh refinement of the model) was applied to the mesh of this region, as shown in Figure 2. The groundwater table is assumed to be very deep. MSE wall models were prepared with 0.5, 0.7, 1.0; and 0.4 m, 0.6 m. In this study, the length of reinforcement is considered as the full length of the reinforcement starting from the front of the facing. The foundation depth was selected as 25 m to account for the effect of the foundation soil on the seismic response of the MSE wall. Based on sensitivity analysis, this depth was deemed sufficient to represent the effect of earthquake waves transmitted to the ground surface from a thick natural foundation soil.
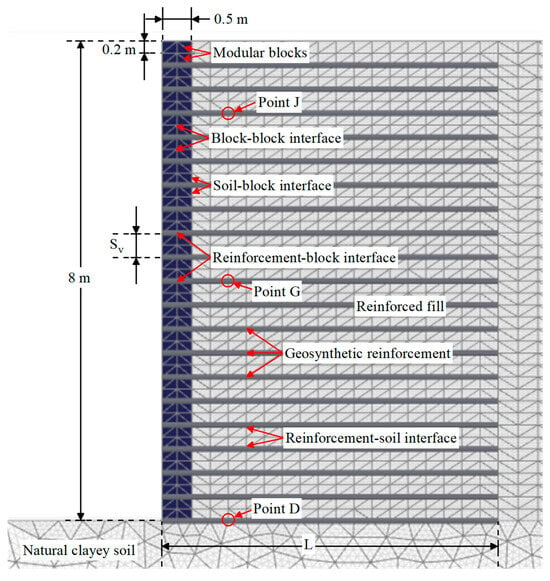
Figure 2.
Close-up view of the MSE wall model depicting FE mesh connectivity.
Retained backfill consisted of natural granular soils, and the same material was utilized in the reinforced-earth zone of the MSE wall model. The foundation soil consisted of a stiff natural clayey soil. The nonlinear and inelastic behavior of the soils were simulated by using a hardening soil (HS) constitutive model originally proposed by Schanz et al. [57] (see Table 1). The HS model was introduced by extending the hyperbolic stress–strain formulations of Kondner [58] and hypo-elastic Duncan and Chang [59] model to a multi-yield surface elasto-plastic formulation. The hyperbolic formulation with the Mohr–Coulomb failure criterion was defined in the model, and it was characterized as a hypo-elastic model as the nonlinearity was achieved by three stiffness moduli: the triaxial loading stiffness (, the triaxial unloading stiffness (, and the oedometer loading stiffness ). The nonlinear soil behavior was represented by two major plastic mechanisms (i.e., shear and compression hardening), as the yield surface was not fixed as opposed to elastic perfectly plastic models.

Table 1.
Soil properties used in the FE model.
Concrete modular blocks were modeled using linear elastic non-porous soil elements of 0.5 m width and 0.2 m height each, and a 0.5 m length of the geosynthetic reinforcements was placed between the concrete modular blocks (see Figure 2) to simulate the reinforcement-facing element connections in the field. Elastic modulus (), Poisson’s ratio (), and unit weight () of the modular blocks were defined as 4400 MPa, 0.17, and 21.8 kN/m3, respectively. The hollow portions of the concrete modular blocks were typically filled with granular materials [60,61,62]. The unit weight of the modular blocks was adopted to account for this application.
The reinforcement elements were modeled using elastic geogrids. To investigate the effect of reinforcement stiffness on the behavior of the MSE walls, two typical extruded uniaxial geogrids were selected and named UXG1 and UXG2. The ultimate tensile strength of UXG1 and UXG2 were 60 kN/m and 120 kN/m, respectively. The elastic behavior of the geogrid was defined by its axial stiffness at 5% strain denoted by , which is provided in Table 2. Elastic modulus was calculated using the tensile strength () that corresponds to 5% strain , as shown in Equation (5) [63]:

Table 2.
Geogrid properties used in the FE model.
Interfaces were defined to provide the proper soil–structure interaction in the MSE model. Strength was reduced at the interfaces between modular blocks, between the modular blocks and the soils, and between the geogrid and soils by applying an interface strength parameter (Rinter) of 0.7. The reinforced-earth zone of the MSE wall was modeled using 0.2 m thick backfill soil lifts to better reflect the construction stages. Duncan et al. [65] showed that the horizontal earth pressures of the soils adjacent to retaining structures tend to increase due to the loads imposed by the compaction equipment. To simulate the effect of compaction effort on the earth pressures in the field, a distributed load of 15 kPa was applied on each lift behind the back face of modular blocks along the reinforced zone of the model. This stress was applied and then removed before the placement of the next soil layer. Before the dynamic analysis, each 8 m high MSE wall was erected with 42 stages of elastic-plastic deformation analysis. Upon placement of all soil layers, a 12 kPa surcharge load was applied along a length of about 19.5 m from the back of the facing in the static condition. Several points were identified in the MSE wall model to investigate the force and deformations resulting from seismic loads. Some of the selected points are shown in Figure 2 as points D, G, and J.
This parametric study focused on the seismic behavior of MSE walls using FE analysis, with the main goal of understanding the deformations and reinforcement forces under earthquake loads. Before the FE analyses, internal and external stability analyses of the MSE models were also performed following the LRFD approach per AASHTO/FHWA [13]. Summaries of the external and internal stability checks performed for the 8 m high MSE wall models are presented in Table 3 and Table 4, respectively. In the LRFD approach, the main objective is to achieve factored resistances that are greater than the factored loads. The capacity demand ratio (CDR) is the ratio of factored resistances to factored loads. For external stability checks, capacity demand ratio for sliding and for bearing capacity () are expected to be greater than 1. FHWA also defines a limiting eccentricity ( for external stability. The eccentricity of the MSE wall should not exceed = in static condition and = in seismic condition, where is the width of the MSE wall, hence the length of the reinforcement. Additionally, to remain conservative, the length of the reinforcements was calculated from the back of the facing in stability calculations. For the internal stability checks, capacity demand ratios for tension failure ( and pullout failure (of each reinforcement are required to be greater than 1. For the MSE walls with = 0.5 configuration, the selected reinforcement lengths were lower than the typical minimum length ( to ) recommended by FHWA [13]. Accordingly, a few of the external and internal stability checks were not satisfied for the MSE wall configuration with = 0.5 (see Table 3 and Table 4). Even then, the results of the FE analysis for this configuration did not indicate any instabilities. Accordingly, the deformations and reinforcement axial forces obtained from the analysis of this configuration were also discussed in context of MSE wall seismic behavior.

Table 3.
External stability checks for MSE wall by LRFD approach.

Table 4.
Internal stability checks for MSE wall by LRFD approach.
2.2. Validation of the Numerical Approach
The FE approach used in this study was validated by the published results of instrumented full-scale physical model tests performed on a 3.6 m high reinforced soil wall at an indoor test facility [66,67]. The soil parameters provided in the previous numerical simulation efforts on these physical model tests [61,68,69] using the finite-difference method (i.e., using commercial FLAC software) were also utilized in this validation study.
The instrumented control wall (i.e., Wall 1) was selected for the numerical validation of this study [61,68]. Wall 1 is a geosynthetic-reinforced wall with 2.52 m long biaxial polypropylene geogrids (with = 115 kN/m) placed at 0.6 m vertical spacing. It was constructed with modular block-facing units (0.3 m × 0.2 m × 0.15 m) with a batter of 8 from the vertical axis on a rigid foundation. Wall 1 was modeled in PLAXIS 2D, as shown in Figure 3. In the model, concrete modular blocks were tied to a fixed-end anchor with the back-calculated axial stiffness of 4000 kPa at the toe of the wall (see Figure 3). The stress-dependent hyperbolic model proposed by Duncan et al. [70] was used in the study [61] to simulate the response of the sand (backfill) material based on triaxial and plane strain compression tests. Guler et al. [62] back-calculated the hardening soil parameters of the sand based on plane strain test results at effective confining stresses of 20, 30, and 80 kPa for FE analysis. The hardening soil constitutive soil parameters of the backfill were adopted based on the studies by Hatami and Bathurst [61] and Guler et al. [62]. These values were consistent with the data reported from the actual full-scale testing (see Table 5).

Figure 3.
MSE wall model used in FE validation study: problem geometry and mesh constructed using the data presented by Hatami and Bathurst (2005) [61].

Table 5.
Material properties used in the FE validation study (adapted from Guler et al. [62]).
The backfill material was placed in 0.15 m thick lifts, and a temporary surcharge load of 8 kPa was applied on each layer to simulate a light compactor. Six (6) layers of geogrids were enabled in the staged construction, and 0.3 m portion of each geogrid was placed between the modular blocks similar to the connection established in the laboratory. After the construction of the model, a uniform surcharge load of 40 kPa was also applied on the MSE wall to compare the results of the physical and numerical modeling tests [61,68].
The range of measured connection loads at the modular block-facing–geogrid interface for each reinforcement level during the construction phase of the full–scale physical model is shown in Figure 4a. The maximum and minimum measured loads were presented together with the mean of the measured data for each reinforcement. The connection loads computed from the FE analysis are also presented in Figure 4a. These computed loads fall within the measured range, and they follow the trend of the mean of the measured data along the wall height. Figure 4b presents the comparison of measured and computed normalized base pressures () in the zone of 6 m behind the wall facing. The normalized base pressure was obtained by dividing the vertical base pressure () by the pressure solely due to soil self-weight: height of the wall () multiplied by the unit weight of the soil () in the reinforced zone. The can be expressed by Equation (6):
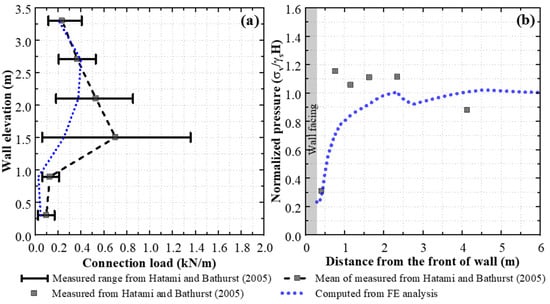
Figure 4.
FE validation study: (a) measured and computed connection loads and (b) distribution of measured and computed normalized base pressures. (Hatami and Bathurst (2005) [61]).
The measured and computed were the same just behind the wall at a distance of 0.41 m behind the facing. At a distance of 0.75 m to 2.35 m behind the facing, the measured was slightly higher than the computed . The opposite was valid; the measured value was slightly lower than the computed one at a distance of about 4 m behind the facing. The values produced by the numerical validation analysis are generally deemed comparable to the experimental data obtained from the earth pressure cells and the numerical results presented by Hatami and Bathurst [61]. Figure 5 presents the measured and computed relative horizontal displacements along the MSE wall. Displacements were recorded both after the placement of each fill layer and at the end of construction using potentiometers placed at each reinforcement elevation. The same approach was followed in FE analyses, and hence, predicted and measured horizontal displacements shown in Figure 5 are relative displacements that correspond to the difference between the horizontal displacements recorded at the time of fill placement and the end of construction. Generally, predicted relative displacements at each reinforcement elevation were close to the measured ones. With an increase in surcharge load, the discrepancy between the measured and predicted data at the top of the wall increased. Nonetheless, especially for the no-surcharge and 40 kPa surcharge loading cases, the measured and predicted data at the top of the wall were almost identical. The results of this validation analysis were deemed satisfactory to move on to the dynamic parametric analysis.

Figure 5.
Relative horizontal displacement along the wall height: computed in this study versus measured by Hatami and Bathurst (2005) [61].
3. Seismic Analysis
In this study, the effect of an input ground motion excitation (with a series of frequency values) on the seismic behavior of an MSE wall was investigated through FE analyses. A ground motion frequency that is equal to the fundamental frequency of a structure is likely to be the most detrimental. Therefore, before starting the seismic analysis, the fundamental frequencies of the MSE wall and the overall model (including the foundation soil) were estimated first. The input ground motion frequency range was selected to encompass both the fundamental frequencies of the MSE wall and the overall model in the dynamic analysis.
3.1. Natural Frequency of the MSE Wall
The equations proposed in the literature were utilized (see Table 6) to estimate the natural frequency () of the MSE wall modeled in PLAXIS 2D following the approach presented by Turkel et al. [71,72]. Several researchers proposed the calculation of the natural frequency of soil wall systems based on a multiplication of the frequency of infinitely long uniform soil () with a geometric factor [42,73,74,75]. The geometric factor is uniquely defined in each method, and is calculated using the Equation (7):
where shear modulus, density, and H = height of the model. In this equation, the shear modulus of sand was estimated using the correlations that utilize relative density and the reference documents that provide shear modulus value ranges for dense sands [76,77]. The empirical correlations that were developed specifically for the reinforced soil wall systems with metal strips, those directly dependent on the wall height, were also utilized to estimate the natural frequency of the MSE wall systems [78,79]. The first natural period () of the MSE wall was also calculated [80] by the relationship proposed based on the assumption of a plane strain cantilever shear deformation mode for the wall [21]. Based on the results obtained from all of the correlations utilized, of the MSE wall was estimated to be in the 3.7 Hz to 5.4 Hz range, with a calculated mean value of 4.62 Hz. The natural frequency of the overall model, including the MSE wall and the foundation soil, was estimated using DEEPSOIL V7.0 program [81] and the equation proposed by Kramer [82]. The shear wave velocity range of the foundation soil was assumed to be similar to that of site class D [83]. Consequently, the of the overall model, including the foundation soil and the MSE wall, was estimated as 1.20 Hz. For the dynamic analysis, a comprehensive approach was adopted; accordingly, a wide input ground motion frequency range of 1 Hz to 8 Hz was selected to include both 1.20 Hz and 4.62 Hz.

Table 6.
Estimated natural frequency of the 8 m high MSE wall and the overall model (modified after Turkel et al. [71]).
3.2. Input Ground Motion and Dynamic Parameters
For the dynamic analysis, variable amplitude harmonic input ground motion accelerograms were generated using Equation (8) proposed by Bathurst and Hatami [42]:
in which and were constant coefficients equal to 5.5, 55, and 12, respectively. f is the frequency in 1/s, and t is the time in seconds. PGA was 0.2 g = 2 m/s2 (i.e., 200 Gal), and the acceleration was applied with 0.005 s time intervals for an excitation duration of 5 s. Seven (7) separate accelerograms were generated using f = 1, 1.5, 2, 3, 4, 6, and 8 Hz for seismic loading. These frequency values were selected between 1 Hz and 8 Hz to cover the whole frequency spectrum around the estimated natural frequency of the MSE wall and the overall finite element model of the MSE wall–foundation soil system (see Table 6). The analysis using input ground motion at f = 10 Hz resulted in lower horizontal displacements and axial forces compared to the analysis performed at lower frequencies. For this reason, using input ground motion frequency values greater than 8 Hz was considered redundant. The accelerograms with a frequency of 2 Hz and 6 Hz are shown in Figure 6a,b, respectively. In order to evaluate the sole effect of frequency, PGA and the duration of the excitation were kept constant. Arias Intensity () is a widely used intensity parameter, calculated in units of length per time, that indicates the destructiveness of an earthquake [84]:
where t is time, is acceleration–time history, and g is the acceleration of gravity. was calculated approximately as 0.5 m/s by Equation (9) for all 5 s excitation for all accelerograms used in this study. Thus, each MSE model was excited with seven different accelerograms with similar values, each corresponding to a separate seismic analysis case. The seismic loading was applied at the bottom boundary of the model using prescribed displacements. The generated accelerograms were imported into software, and the dynamic signal was applied using the acceleration–time histories.
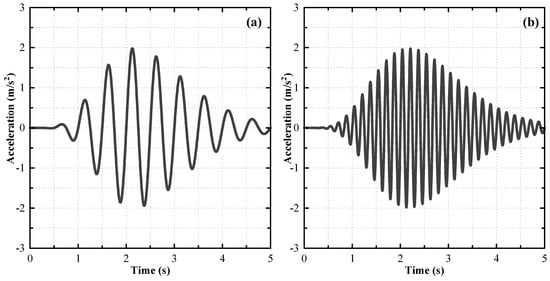
Figure 6.
Variable amplitude harmonic accelerograms used for seismic loading: (a) f = 2 Hz and (b) f = 6 Hz.
Burke [85] highlighted the importance of selecting damping parameters based on the PGA level and stiffness of the system in dynamic analysis. Several researchers discussed and proposed target damping ratio () and damping coefficients [86,87,88,89,90,91]. Material damping was introduced by Rayleigh damping in the model to supplement the constitutive model hysteretic damping. This additional damping was defined by using a damping ratio () of 10%. This ratio was selected per the computed shear strain levels in this study based on the previously published damping ratio variations with shear strains [77,86,92] and damping ratios used in the dynamic retaining wall and MSE wall studies in the literature [87,89,93]. In the model, Rayleigh damping was applied using the Rayleigh mass () and stiffness () proportional damping coefficients. Several methodologies [88,92,94,95] were proposed in the literature to determine these coefficients. These methodologies require the definition of two target frequencies to apply the Rayleigh damping in the model. In this study, Rayleigh and coefficients corresponding to a 10% damping ratio were estimated by defining these two target frequencies. The first target frequency was simply selected as the natural frequency of the entire soil profile (i.e., approximately 1.5 Hz) as proposed by several studies in the literature [88,95]. The second target frequency was estimated as five times the natural frequency of the soil profile (i.e., approximately 7.5 Hz) as proposed by Kwok et al. [88]. As a result, coefficients and were estimated as 2.011 and 0.00318, respectively.
3.3. Parametric Study
A total of 12 MSE wall model configurations (i.e., A, B, C, D, E, F, G, H, I, J, K, and L) were generated using different reinforcement design parameters (= 0.5, 0.7, and 1.0; = 0.4 m and 0.6 m; and EA = 600 kPa and 1200 kPa) in PLAXIS 2D. These configurations are summarized in Table 7. After completion of staged construction and the application of 12 kPa surcharge load, static displacements and the maximum axial forces in the reinforcements were recorded before the dynamic analysis. Each MSE wall configuration was excited with seven variable amplitude harmonic ground motions. Accordingly, a total of 12 static and 84 seismic cases were analyzed. The abbreviations used for each of these cases were selected to reflect the geometric configuration, reinforcement stiffness, and the frequency content of the input ground motion. As an example, dynamic case B3 corresponds to MSE wall reinforcement design configuration B ( = 0.4; = 0.7; EA = 1200 kPa), excited using a variable amplitude harmonic ground motion with a frequency of 3 Hz (see Table 7).

Table 7.
Seismic cases analyzed in the MSE wall parametric study.
4. Results of Numerical Analysis
Initially, the MSE wall response in static condition was investigated. Before the dynamic analysis (i.e., prior to the application of the seismic excitation), all displacements were reset to zero. After the completion of the dynamic analysis, the residual displacements, in essence, the permanent deformations that occur solely due to seismic loading, were recorded and reported. In static and seismic cases, all results presented along the MSE wall height, denoted by, are relative displacements with respect to the toe of the MSE wall. One exception to this is the displacements presented in Section 4.1 where the variation in the displacements along the whole reinforcement are given. These displacements along each reinforcement are absolute, and hence, they are not denoted by .
The reinforcements can fail at any moment during a seismic event. For this reason, the maximum reinforcement axial force generated along the reinforcement in the duration of the seismic event is the most critical value for the design of the reinforcement. Accordingly, the maximum reinforcement axial force () in each reinforcement was recorded from the force envelope distributions. In the FE analyses, the positive sign convention was used for tensile loads; the stresses calculated in the reinforcements were tensile.
4.1. Comparison of MSE Wall Deformed Shape in Static and Seismic Conditions
The horizontal displacements (scaled to 10) and the deformed shape (scaled to 10) of the MSE model—after completion of staged construction and the application of the surcharge load—in the static condition are shown in Figure 7a,b. MSE wall displacements and axial load distributions along the reinforcements were also investigated in the static condition. The static behavior of the wall is mainly dominated by the settlement of the reinforced fill and the engagement of the upper reinforcements to this movement. Generally, greater horizontal displacements were observed from the mid-length to the rear end of the reinforcements located closer to the top of the wall. From the top to the mid-height of the wall, the largest horizontal displacements along the reinforcement progressively shift toward their front end (see Figure 8a). The center sections of the uppermost layers moved down due to the settlement of the soil and outward movement at the top of the wall. The free end of the reinforcement was pulled causing higher displacements near their rear end. The axial loads were highest for reinforcements closest to the mid-height of the wall (see Figure 8b), at the location where the outward displacement was the most noticeable. The deformed shape also indicates that the reinforcement sections closer to the facing of the wall experienced changes similar to bending. This was due to the deformed shape of the wall and the downdrag behind the wall facing (see Figure 7b). The highest forces along the top four reinforcements were observed at about their connection points, resulting from the settlement of the fill at these locations. In the bottom two reinforcements, the location of the maximum force along their length shifted closer to the Rankine failure surface, as settlements were not dominant at the bottom of the wall.
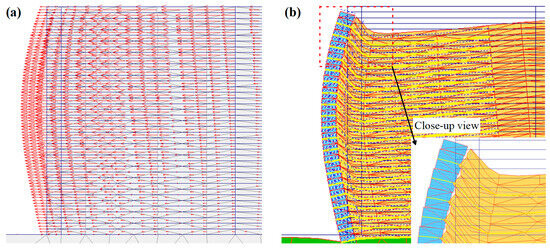
Figure 7.
MSE wall end-of-construction (static) condition: (a) horizontal displacement of the wall facing and the reinforced zone (scaled to 10) and (b) deformed shape (scaled to 10) and zoom-in view of the reinforcements at the top of the wall for configuration A.
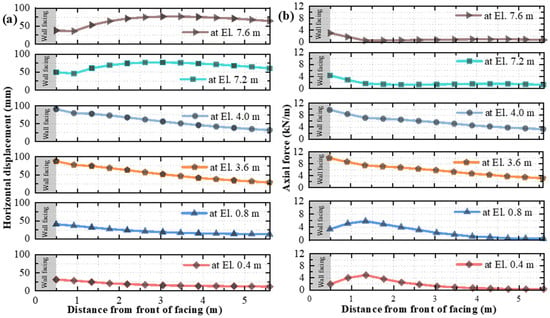
Figure 8.
MSE wall reinforcement response in static condition at various elevations: (a) horizontal displacement along the reinforcement length and (b) axial force (envelope) along the reinforcement length for configuration A.
The numerical results indicate that the seismic response of the analyzed MSE walls is different from their static response. Figure 9a shows the residual horizontal displacements (scaled to 10) of the MSE model analyzed for seismic case A1.5 (see Table 7). Seismic excitation caused an outward (rotational) movement of the wall. This movement is similar to that of a rigid rotation of a cantilever wall [96] and is also visible in the scaled deformed shape (scaled to 10) (see Figure 9b). Tall structures can undergo several modes of vibration, but the fundamental period or first mode is usually the most significant for structures with moderate height. Following this phenomenon, the deformed shape of the wall under earthquake loads indicates that the first mode of vibration is dominant on the dynamic response of the 8 m high MSE wall in this study. A similar wall displacement behavior was observed at all seismic frequencies (= 1, 1.5, 2, 3, 4, 6, and 8 Hz) investigated.
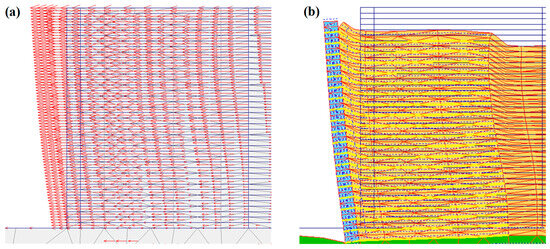
Figure 9.
MSE wall in seismic case A1.5: (a) residual horizontal displacement of the wall facing and the reinforced zone (scaled to 10) and (b) deformed shape (scaled to 10).
For seismic case A1.5, the directions and relative magnitudes of the residual horizontal displacements generated within and behind the reinforced zone are depicted with arrows in Figure 10a. As seen in Figure 10a, the directions of the arrows are reversed at a distance of about 3.4 m to 6.4 m behind the reinforced zone. With the effect of seismic excitation, the reinforced zone and the adjacent section of the retained fill tend to move to the left, and the remaining zone of the retained fill tends to move in the opposite direction.

Figure 10.
Response of MSE wall in seismic case A1.5: (a) distribution of residual horizontal displacement (scaled to 10) and (b) shear strain contours along the wall.
Shear strain contours can provide useful information about the seismic behavior of MSE walls indicating the critical zones in the soil-reinforcement system in numerical studies [97]. The shear strain contours shown in Figure 10b indicate that the shear strains concentrate around two locations. First, there is a shear strain concentration, ranging between 1 and 10%, between the facing blocks and the soil. This is a widely encountered behavior that takes place because of the differential vertical settlement between the blocks and the reinforced fill. The second area of shear stress concentration (up to 6%) is observed at the back of the reinforced zone. This is also not unexpected because both numerical analysis results [48] and physical shaking table test results [98] clearly indicate that the reinforced zone behaves like a coherent body under earthquake loading conditions. As can be seen in Figure 9b, the reinforced fill behaves like a solid body and does not undergo excessive settlements. However, the reinforced zone displaces toward the front as an elastic body, and a gap tends to open up between the reinforced and unreinforced soil. This causes a settlement at the unreinforced fill behind the reinforced zone. Therefore, large shear strains develop in this area. In this study, generally, a similar behavior was observed in the seismic cases analyzed. Nonetheless, this behavior was the most evident in seismic case A1.5. The overturning tendency of the wall and the corresponding horizontal displacements are likely to be the cause of the stronger stripping tendency of the reinforcement layers close to the top of the wall. The maximum horizontal displacements increased with wall elevation (Figure 11a). The maximum axial force along each reinforcement occurred close to the front of the wall in the vicinity of the connections between reinforcements and modular blocks in the seismic case (Figure 11b). Axial forces decreased toward the middle section of the geogrids.
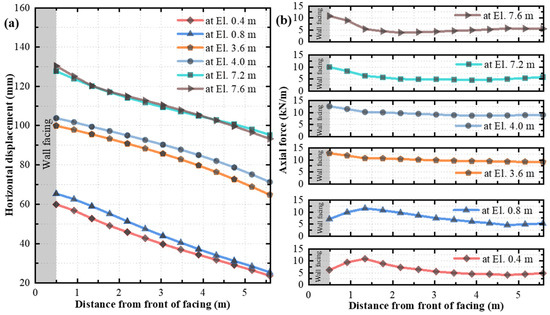
Figure 11.
MSE wall reinforcement response in seismic case A1.5 at various elevations: (a) residual horizontal displacement along reinforcement length and (b) axial force (envelope) along the reinforcement length.
4.2. Effects of the Input Ground Motion Frequency
In this study, the acceleration amplification factor (ap) is defined as the ratio of the maximum acceleration at a given elevation in the MSE wall model to the excitation (i.e., 0.2 g) applied at the bottom boundary of the FE model. Figure 12 shows the acceleration amplification factor versus elevation for all seismic loading cases (= 1, 1.5, 2, 3, 4, 6, and 8 Hz) with configuration A. Figure 12 shows the acceleration amplification factor versus elevation for all seismic loading cases (= 1, 1.5, 2, 3, 4, 6, and 8 Hz) with configuration A. Figure 12a shows that the seismic excitations were amplified in this study at the base of the MSE wall (i.e., at the top of the foundation soil) for input ground motions with a frequency of 1, 1.5, and 2 Hz and attenuated (de-amplified) above 2 Hz. This shows that acceleration amplification was the highest at the base of the model when the frequency of the seismic loading was closest to the natural frequency of the overall model (i.e., 1.2 Hz). The frequency obtained by fast Fourier transform (FFT) analysis at the bottom of the MSE wall is also given in Figure 12a. The frequency calculated for each motion at El. 0 m is almost identical to the frequency of the input ground motion applied at El. −25 m. This result shows that the frequency of the input wave does not change significantly within the foundation soil, and hence, input frequencies are preserved just underneath the MSE wall. This computational observation made the investigation of the effects of the frequency of the input ground motion on the seismic response of the MSE wall possible. Once the foundation soil and the MSE wall were considered as an overall system, the highest amplification factor was approximately 1.74 for the excitation with = 1.5 Hz. This was consistent with the estimated natural frequency of the overall model (i.e., = 1.20 Hz). Once the change in acceleration solely within the MSE wall (from the bottom to close to top) was considered (see Figure 12b), the highest normalized acceleration amplification factor was computed as 1.86 for the seismic excitation with = 4 Hz. In the tested frequency range, this frequency was the closest to the estimated mean natural frequency of the MSE wall model (i.e., = 4.62 Hz). In essence, at all frequencies except = 1 Hz, the normalized amplification factor within the wall in Figure 12b was computed at the top of the wall. This can be explained by the fact that this frequency was further away from the estimated mean natural frequency of the MSE wall (i.e., = 4.62 Hz). The acceleration amplification within the MSE wall was not significantly affected by the reinforcement configurations investigated in this study. Examples of computed acceleration–time histories at selected points D, G, and J within the analyzed configuration A4 ( = 4 Hz) are presented in Figure 12b. As seen in Figure 12b the acceleration amplified near the top of the wall. Following from Figure 12, it is again important to note that, in this study, horizontal displacements presented along the MSE walls are relative displacement values with respect to the toe of the MSE wall (), to eliminate the effects of wave propagation changes within the foundation soil.
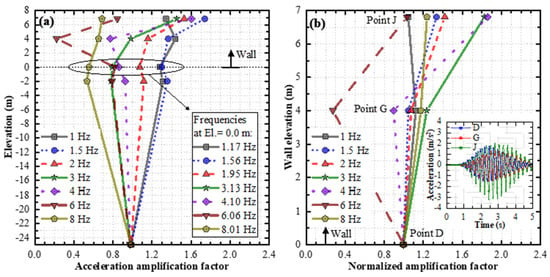
Figure 12.
Acceleration in all seismic cases with configuration A: (a) acceleration amplification factor versus elevation (with frequencies obtained from FFT at El. 0 m) and (b) normalized acceleration amplification factor with inset examples of acceleration–time histories at selected points D, G, and J with configuration A4 (f = 4 Hz).
Figure 13 presents the frequency versus acceleration at node J for all MSE wall configurations denoted as A through L. Node J is located close to the top of the MSE wall (see Figure 2); as such, the accelerations recorded at this point also include the change in acceleration within the foundation soil and most of the reinforced zone. Despite slight discrepancies, the overall trends of frequency versus acceleration plots for all MSE wall configurations were very similar to each other. As seen in Figure 13, two clear peaks are identified at= 1.5 Hz and = 4 Hz. These two frequencies, = 1.5 Hz and = 4 Hz, are close to the natural frequency of the overall model (MSE wall–foundation soil system) and the MSE wall, respectively.
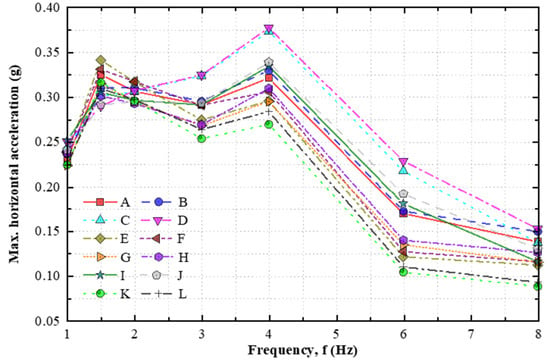
Figure 13.
Frequency versus maximum horizontal acceleration for all model configurations A, B, C, D, E, F, G, H, I, J, K, and L at Point J (shown in Figure 2).
Generally, the maximum relative horizontal displacements at all levels along the MSE wall height were recorded for the input ground motion with = 1.5 Hz. For MSE wall configuration A, the relative displacements at the top of the wall for the most and least critical seismic loading cases, with = 1.5 Hz and = 8 Hz, were approximately 76 mm and 9.5 mm, respectively (see Figure 14a). As can be seen in Figure 14a, the relative (residual) displacements increased as the frequency of the input ground motion approached the natural frequency of the overall model. This is reasonable because the highest acceleration underneath the MSE wall also corresponds to the input ground motion frequency of 1.5 Hz. This clearly shows the importance of seismic loading frequency on the residual displacements and overall behavior of the MSE wall.
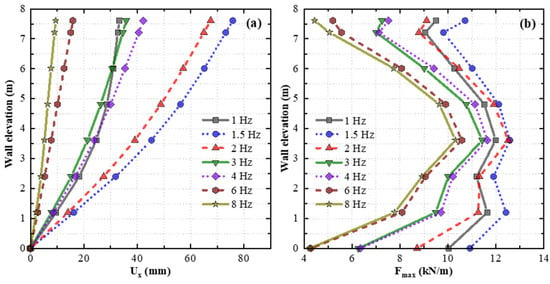
Figure 14.
The effects of input ground motion frequency for all seismic cases with configuration A: (a) relative (residual) horizontal displacement () versus wall elevation and (b) maximum reinforcement axial force ( from envelope) versus wall elevation.
Figure 14b presents the maximum reinforcement axial force () versus wall elevation for each frequency. The maximum reinforcement axial forces along the wall height were the highest for the critical seismic loading case with = 1.5 Hz. For each seismic loading frequency with configuration A, the reinforcements located at El. 3.6 m (about the mid-height of the MSE wall) generally experienced the maximum reinforcement axial forces.
4.3. Effect of Reinforcement Length at the Selected Seismic Frequencies
Figure 15 presents the effect of reinforcement length on relative horizontal displacements and the maximum reinforcement axial forces along the wall elevation in the static case for configurations B, D, and F. With the increase in ratio, horizontal displacements along the wall elevation are reduced very slightly (see Figure 15a). This effect is noticeable at the mid-height of the wall, and it almost diminishes at the top and the bottom of the MSE wall. On the other hand, the effect of on the maximum reinforcement axial forces along the wall elevation does not show a similar trend (see Figure 15b).
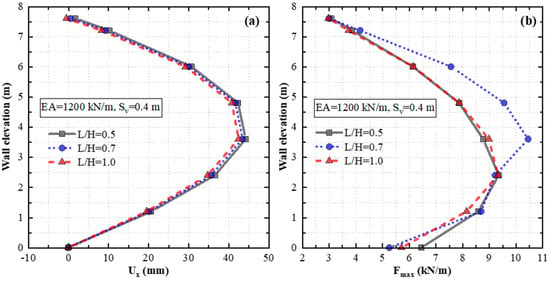
Figure 15.
The effects of in the static condition in configurations B, D, and F: (a) relative horizontal displacement () versus wall elevation and (b) maximum reinforcement axial force ( from envelope) versus wall elevation.
For all ratios investigated, the maximum reinforcement axial forces are similar to each other along the bottom one-third of the wall height (between El. 0 m and El. 2.5 m). Along the top two-thirds of the wall height, the maximum reinforcement axial forces are almost identical for and . In the wall with configuration , the maximum reinforcement axial force recorded for the reinforcement (at El. 3.6 m) is approximately 16–19% higher than the other two cases (see Figure 15b).
Figure 16a shows the input ground motion frequency versus horizontal displacements of the uppermost reinforcements (at El. 7.6 m) of the MSE wall for the seismic cases with configurations A, C, and E. Generally, the uppermost reinforcement at El. 7.6 m in the models with a higher ratio experienced lower displacements than those with a lower ratio. The largest reinforcement displacements were observed for seismic cases A1.5, C1.5, and E1.5 corresponding to the excitation with = 1.5 Hz. A minor second peak was observed at 4 Hz. The effect of on reinforcement displacements almost disappears for input ground motion frequencies larger than 6 Hz (see Figure 16a). The horizontal displacement versus wall elevation plots obtained from the results of seismic cases A1.5, C1.5, and E1.5 are shown in Figure 16b. The effect of reinforcement length on displacements along the MSE wall was more pronounced for the seismic cases compared to the static case. An increase in the ratio from 0.5 to 1.0 reduced the relative horizontal displacements of the wall by approximately 43% at the top of the wall for the most critical seismic case. This indicates that the ratio does not significantly affect the relative displacements of the facing as long as the ratio satisfies the stability condition in the static condition. However, the ratio has a significant influence on the displacements caused by seismic loads. Considering all reinforcement configurations analyzed at the most critical input motion frequency, the increase in from 0.7 to 1.0 decreased the relative horizontal displacements at El. 7.6 m (top of the wall) by about 22–36%.
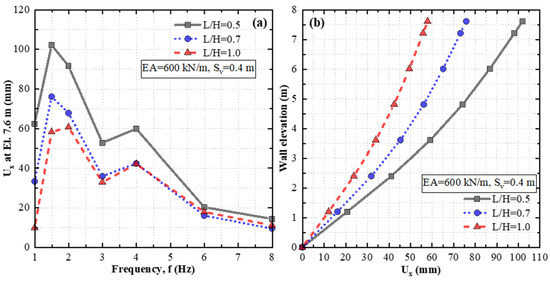
Figure 16.
The effect of on horizontal displacements in the seismic condition in configurations A, C, and E: (a) frequency versus relative (residual) horizontal displacement () at El. 7.6 m and (b) versus wall elevation for seismic cases A1.5, C1.5, and E1.5 (f = 1.5 Hz).
The frequency of the input ground motion (for all seismic cases with configurations A, C, and E) versus maximum axial force in the top reinforcement is presented in Figure 17a. The lines also merge toward 8 Hz, in essence, the effect of on the maximum axial force in the uppermost reinforcement almost diminished with the increase in frequency. Figure 17b presents the change in maximum axial forces in the uppermost reinforcement at El. 7.6 m with respect to an increase in in the MSE wall models for all seismic cases with configurations A, C, and E.
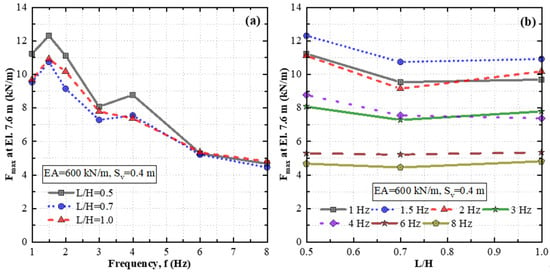
Figure 17.
The effect of on axial forces in reinforcement at El. 7.6 m in the seismic condition in configurations A, C, and E: (a) frequency versus maximum reinforcement axial force ( from envelope) and (b) versus .
Generally, the increase in the ratio caused only slight changes in the maximum axial forces in the reinforcement at El. 7.6 m. The effect is more visible when increases from 0.5 to 0.7, specifically for the seismic cases with lower input ground motion frequencies (i.e.,. As an example, when seismic cases A1.5 and E1.5 are considered (= 1.5 Hz), the maximum reinforcement axial force decreased approximately by 1.6 kN/m when increased from 0.5 to 0.7. The axial force remained almost constant with a further increase in from 0.7 to 1.0.
4.4. Effect of Vertical Reinforcement Spacing at the Selected Seismic Frequencies
MSE wall configurations A through F ( = 0.4 m) are compared with configurations G through L ( = 0.6 m) to evaluate the effect of vertical spacing on the MSE wall displacements and reinforcement forces. Figure 18 depicts the effect of reinforcement spacing on horizontal displacements and maximum reinforcement axial forces along the wall height for configurations B and H (= 1200 kN/m, = 0.7) in the static condition. The relative horizontal displacements of the MSE wall are reduced from 53.4 to 41.7 mm (i.e., 11.7 mm) at the mid-height of the wall when decreased from 0.6 m to 0.4 m (Figure 18a). Naturally, with an increase in , the horizontal displacements of the MSE wall and the reinforcement axial forces tend to increase. The effect of vertical spacing is more evident for the maximum axial forces in the reinforcements that were at about the mid-height of the wall. This is due to the fact that the wall displacements are maximum in this region. Considering all reinforcement configurations analyzed at the most critical input motion frequency, the axial forces in the reinforcement at El. 3.6 m (about mid-height of the wall) was reduced by 27–30% with a decrease in from 0.6 m to 0.4 m. The effect of spacing on the reinforcement axial forces becomes less noticeable at the top and the bottom of the wall (see Figure 18b).

Figure 18.
The effect of in the static condition in configurations B and H: (a) relative horizontal displacement () versus wall elevation and (b) maximum reinforcement axial force ( from envelope) versus wall elevation.
Figure 19a shows the input ground motion frequency versus horizontal displacements of the uppermost reinforcement at El. 7.6 m in the MSE wall for all seismic cases with configurations A and G. As seen in Figure 19a for both of the vertical reinforcement spacing cases investigated, the maximum displacements are achieved at = 1.5 Hz with a minor relative peak at f = 4 Hz. For = 1.5 Hz and = 2 Hz, the displacements are lower when vertical spacing = 0.4 m compared to that of the wider spacing (i.e., = 0.6 m). For the input ground motions with higher frequencies, distant from the fundamental frequencies of the MSE wall and the overall model, the loading becomes less critical and the difference in displacements diminishes. The relative horizontal displacements along the wall are further investigated for these two cases, A1.5 and G1.5, in Figure 19b. The horizontal displacements along the MSE wall model with = 0.6 m are slightly higher than that of the model with = 0.4 m (see Figure 19b). Unlike the static case, the relative horizontal displacements are the highest at the top of the wall for the seismic case. With the vertical spacing change, a maximum horizontal displacement difference of about 9.2 mm was observed between cases A1.5 and G1.5 (= 1.5 Hz) for the reinforcement at El. 7.6 m. This difference was much less for the reinforcements located at lower elevations.
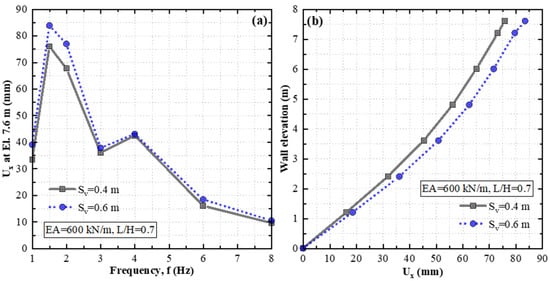
Figure 19.
The effect of on horizontal displacements in the seismic condition in configurations A and G: (a) frequency versus relative (residual) horizontal displacement () at El. 7.6 m and (b) versus wall elevation for seismic cases A1.5 and G1.5 (f = 1.5 Hz).
For all seismic cases with configurations A and G, the frequencies of the input ground motion versus maximum axial forces in the reinforcement at El. 7.6 m are shown in Figure 20a. For both configurations, the maximum reinforcement forces were observed for the input ground motion with a frequency of 1.5 Hz. A minor peak was observed at = 4 Hz for = 0.4 m, however, it was much less pronounced. For = 0.6 m, no peak is observed at f = 4 Hz. A maximum difference of about 2.6 kN/m was observed in the axial force in the reinforcement at El. 7.6 m at a frequency of 1.5 Hz, and the lines merged toward = 6 Hz.
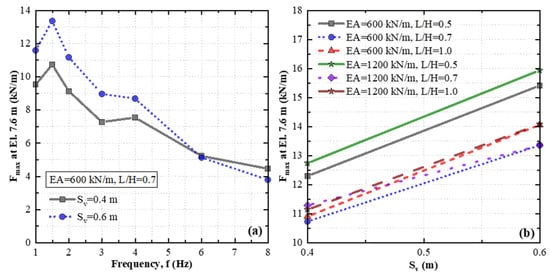
Figure 20.
The effect of on axial forces in reinforcement at El. 7.6 m in the seismic condition: (a) frequency versus maximum reinforcement axial force ( from envelope) in configurations A and G and (b) versus for seismic cases A1.5 through L1.5 (f = 1.5 Hz).
The effect of on the axial forces in the uppermost reinforcement at El. 7.6 m was also investigated for all configurations: A1.5 through L1.5 (= 1.5 Hz). Contrary to its minimal effect on MSE wall displacements, had a remarkable effect on reinforcement axial forces (Figure 20b). In the MSE wall models, the larger reinforcement spacing resulted in higher axial forces in the reinforcement at El. 7.6 m under seismic loading conditions. In all MSE wall configurations tested (i.e., A through L), the axial forces in the reinforcements at El. 7.6 m increased by 2.1–3.2 kN/m range with an increase in from 0.4 m to 0.6 m.
4.5. Effect of Reinforcement Stiffness at the Selected Seismic Frequencies
Similar to the effects of and , the effect of change (i.e., = 600 kN/m and 1200 kN/m) on the horizontal displacements is also most evident at about the mid-height of the MSE wall in the static case, as shown in Figure 21a. With the increase in , the relative horizontal displacement of the MSE wall was visibly reduced in the static case. Doubling the axial stiffness of the reinforcement reduced the maximum displacements by 35–39% at about the mid-section of the MSE wall. The axial forces experienced by the reinforcement layers located at the top one-fourth height of the MSE wall were generally not affected by the stiffness increase, the lower layers of reinforcements experienced this effect (see Figure 21b). This observation may be due to the fact that, in addition to the reinforcement stiffness, the horizontal displacements along each reinforcement and the engagement of each reinforcement determine the reinforcement axial force distribution along the MSE wall height. In the static condition, the lower layers of reinforcements are more engaged in the load transfer, inhibiting the failure surface, compared to the upper reinforcement layers that experience larger horizontal movements. An increase of 600 kN/m in reinforcement stiffness caused an increase of about 1.6 kN/m in axial force of the reinforcements located at El. 0 m in the static case.
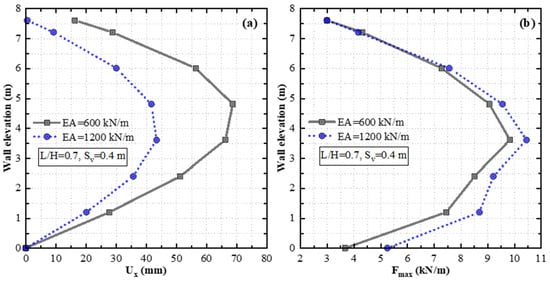
Figure 21.
The effect of in the static condition in configurations A and B: (a) relative horizontal displacement () versus wall elevation and (b) maximum reinforcement axial force ( from envelope) versus wall elevation.
In the seismic cases with configurations A and B, the effect of on the horizontal displacement at El. 7.6 m was the maximum for = 1.5 Hz (see Figure 22a). A second minor peak was also observed here at = 4 Hz. When seismic cases A1.5 with B1.5 were compared, the increase in caused a maximum relative displacement reduction of approximately 17 mm at the top of the wall (Figure 22b). At frequencies of 6 Hz and 8 Hz, the difference in displacements for the investigated stiffness range becomes minimal.

Figure 22.
The effect of on horizontal displacements in the seismic condition in configurations A and B: (a) frequency versus relative (residual) horizontal displacement () at El. 7.6 m and (b) versus wall elevation for seismic cases A1.5 and B1.5 (f = 1.5 Hz).
Axial forces in the uppermost reinforcement for all seismic cases with configurations A and B were very close to each other, indicating the effect of on the reinforcement at El. 7.6 m was not significant (Figure 23a–c). Figure 23d shows the variation in the maximum reinforcement axial forces along the wall height for seismic cases A1.5 and B1.5. When EA was doubled, in the reinforcement at El. 0 m, the maximum axial force increased by about 4.8 kN/m corresponding to an increase of about 44%. The effect of EA on the maximum reinforcement axial forces became significant toward the bottom of the MSE wall. As seen in Figure 23d, with an increase in EA, a visible increase was observed in the axial forces in the lower reinforcement levels.
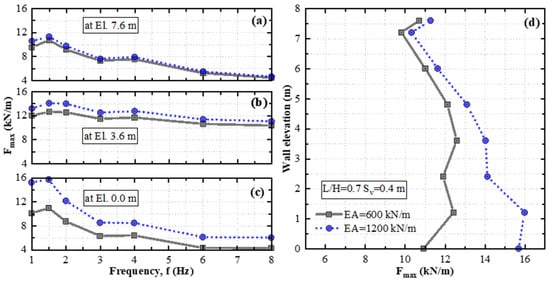
Figure 23.
The effect of on reinforcement axial forces in the seismic condition in configurations A and B: frequency versus maximum reinforcement axial force ( from envelope) at (a) El. 0.0 m, (b) El. 3.6 m, (c) El. 7.6 m, and (d) versus wall elevation for seismic cases A1.5 and B1.5 (f = 1.5 Hz).
A similar overall trend was observed in the seismic cases with other configurations. Generally, the maximum axial forces in the reinforcements located from the mid-height to the bottom of the wall were the highest in MSE walls with configurations using reinforcements that have higher axial stiffness (i.e., B, D, F, H, J, and L). Considering all configurations analyzed at the most critical input motion frequency, increasing EA from 600 kN/m to 1200 kN/m caused a 44–51% increase in the axial forces in the reinforcement at El. 0 m.
Table 8 presents the overall summary of the changes observed in relative horizontal displacements and axial forces in reinforcements located at El. 0 m, El. 3.6 m, and El. 7.6 m in MSE wall models with various reinforcement configurations for seismic cases = 1.5 Hz and = 4 Hz.

Table 8.
Percent changes in relative horizontal displacements and axial forces in reinforcements at El. 0 m, El. 3.6 m, and El. 7.6 m for seismic cases= 1.5 Hz and = 4 Hz.
5. Conclusions
This study investigated the effects of input ground motion frequency and reinforcement design parameters on the static and seismic behavior of 8 m high geosynthetic mechanically stabilized earth (MSE) walls using numerical analysis. Based on the results, the deformed shape of the MSE wall was mainly influenced by the settlement of the reinforced fill and the downdrag generated behind the facing units in the static condition. At the end of the construction phase, the highest reinforcement axial forces and relative horizontal displacements generally occurred at about the mid-height of the wall for all reinforcement design configurations. Seismic excitation caused an outward (rotational) movement with the maximum relative displacements at the top of the MSE wall. This observation indicates that the first mode of vibration was prevalent on the dynamic response of the 8 m high MSE wall. The results of this study show that the frequency of the input ground motion can significantly affect the seismic response (i.e., displacements and reinforcement axial forces) of the MSE wall. The displacements increased as the frequency of the input ground motion approached to the estimated mean natural frequency of the foundation soil–MSE wall system (i.e., = 1.20 Hz). The maximum acceleration amplification factor was recorded as 1.74 at the top of the wall for the input ground frequency 1.5 Hz. When the change in acceleration within the MSE wall was considered, the maximum normalized acceleration amplification factor was 1.86 corresponding to the seismic excitation with = 4 Hz, a value overlapping the estimated natural frequency of the MSE wall. Based on the numerical results, internal instabilities were not observed in the seismic analysis of the MSE models analyzed. The 8 m high MSE wall models placed on a firm clayey foundation soil with the reinforcement length-to-height ratio = 0.5–1 range, reinforcement axial stiffness EA = 600–1200 kPa range, and reinforcement vertical spacing = 0.4–0.6 m range performed satisfactorily under moderate seismic loads.
This research study was limited to the analysis of a very conventional 8 m high MSE wall. It is worthwhile to note that with an increase in MSE wall height, nonlinear effects become prevalent and the behavior is subject to change. Future research studies are required to better understand the effect of wall height on the seismic behavior of MSE walls. In this study, geogrids were modeled in two dimensions. A three-dimensional analysis of MSE walls can facilitate adequate modeling of interlocking effects in geogrids.
Author Contributions
Conceptualization, I.Z.Y. and E.G.; Methodology, I.Z.Y. and E.G.; Software, B.T.; Validation, I.Z.Y. and B.T.; Formal analysis, B.T.; Data curation, B.T.; Writing—original draft, B.T.; Writing—review & editing, I.Z.Y. and E.G.; Visualization, I.Z.Y.; Supervision, I.Z.Y. and E.G.; Project administration, E.G. All authors have read and agreed to the published version of the manuscript.
Funding
This research received no external funding.
Data Availability Statement
Some or all the data and images associated with the research are available from the corresponding author on reasonable request. The data is not publicly available as all major & original contributions of the study already appear in the published article, further inquiries can be directed to the corresponding author.
Conflicts of Interest
Author Berk Turkel was employed by the company Geosyntec Consultants, Inc. The remaining authors declare that the research was conducted in the absence of any commercial or financial relationships that could be construed as a potential conflict of interest.
References
- Stuedlein, A.W.; Bailey, M.; Lindquist, D.; Sankey, J.; Neely, W.J. Design and Performance of a 46-m-High MSE Wall. J. Geotech. Geoenviron. Eng. 2010, 136, 786–796. [Google Scholar] [CrossRef]
- Rafalko, S.D.; Sankey, J.E.; Freitag, N. Sustainability Measures for MSE Walls and Baseline Environmental Impact Evaluations. In Proceedings of the Earth Retention Conference 3; American Society of Civil Engineers: Bellevue, WA, USA, 2010; pp. 486–493. [Google Scholar]
- Damians, I.P.; Bathurst, R.J.; Adroguer, E.G.; Josa, A.; Lloret, A. Sustainability Assessment of Earth-Retaining Wall Structures. Environ. Geotech. 2018, 5, 187–203. [Google Scholar] [CrossRef]
- Adams, M.; Nicks, J.; Stabile, T.; Wu, J.T.H.; Schlatter, W.; Hartmann, J. Geosynthetic Reinforced Soil Integrated Bridge System, Synthesis Report (No. FHWA-HRT-11-027); Federal Highway Administration, Office of Infrastructure Research and Development: McLean, VA, USA, 2011.
- Ahmadi, H.; Hajialilue-Bonab, M. Experimental and Analytical Investigations on Bearing Capacity of Strip Footing in Reinforced Sand Backfills and Flexible Retaining Wall. Acta Geotech. 2012, 7, 357–373. [Google Scholar] [CrossRef]
- Wu, J.T.H.; Ooi, P.S.K. Synthesis of Geosynthetic Reinforced Soil (GRS) Design Topics (No. FHWA-HRT-14-094); Federal Highway Administration: Washington, DC, USA, 2015.
- AASHTO (American Association of State Highway and Transportation Officials). AASHTO LRFD Bridge Design Specifications, 7th ed.; Customary, U.S. Units; AASHTO: Washington, DC, USA, 2014; ISBN 978-1-61344-752-9. [Google Scholar]
- Grubb, M.A.; Wilson, K.E.; White, C.D.; Nickas, W.N.; National Highway Institute (U.S.). Load and Resistance Factor Design (LRFD) For Highway Bridge Superstructures—Reference Manual (No. FHWA-NHI-15-047); National Highway Institute (US): Arlington, VA, USA, 2015.
- Ling, H.I.; Leshchinsky, D.; Chou, N.N.S. Post-Earthquake Investigation on Several Geosynthetic-Reinforced Soil Retaining Walls and Slopes during the Ji-Ji Earthquake of Taiwan. Soil Dyn. Earthq. Eng. 2001, 21, 297–313. [Google Scholar] [CrossRef]
- Koseki, J.; Bathurst, R.; Guler, E.; Kuwano, J.; Maugeri, M. Seismic Stability of Reinforced Soil Walls. In Proceedings of the 8th International Conference of Geosynthetics, Yokohama, Japan, 18–22 September 2006. [Google Scholar]
- Wartman, J.; Rondinel-Oviedo, E.A.; Rodriguez-Marek, A. Performance and Analyses of Mechanically Stabilized Earth Walls in the Tecomán, Mexico Earthquake. J. Perform. Constr. Facil. 2006, 20, 287–299. [Google Scholar] [CrossRef]
- Adhikari, A.; Manjunath, D. Performance of Mechanically Stabilized Earth Structures in Seismic Conditions. In Proceedings of the Earthquakes and Structures: Select Proceedings of 7th ICRAGEE 2021; Sitharam, T.G., Kolathayar, S., Jakka, R., Eds.; Springer: Singapore, 2022; pp. 407–415. [Google Scholar]
- Berg, R.R.; Christopher, B.R.; Samtani, N.C.; (FHWA). Design and Construction of Mechanically Stabilized Earth Walls and Reinforced Soil Slopes; US Department of Transportation, Federal Highway Administration, National Highway Institute: Washington, DC, USA, 2009.
- Elias, V.; Christopher, B.R.; Berg, R.R.; Ryan, R.; Berg & Associates, Inc. Mechanically Stabilized Earth Walls and Reinforced Soil Slopes: Design and Construction Guidelines (Updated Version) (No. FHWA-NHI-00-043); Federal Highway Administration: Washington, DC, USA, 2001.
- Alhajj Chehade, H.; Dias, D.; Sadek, M.; Jenck, O.; Hage Chehade, F. Pseudo-Static Analysis of Reinforced Earth Retaining Walls. Acta Geotech. 2021, 16, 2275–2289. [Google Scholar] [CrossRef]
- Ruan, X.; Sun, S. External Seismic Stability of Vertical Geosynthetic-Reinforced Soil Walls Using Pseudo-Static Method. Acta Geotech. 2014, 9, 1085–1095. [Google Scholar] [CrossRef]
- El-Emam, M.M. Experimental Verification of Current Seismic Analysis Methods of Reinforced Soil Walls. Soil Dyn. Earthq. Eng. 2018, 113, 241–255. [Google Scholar] [CrossRef]
- Cai, Z.; Bathurst, R.J. Seismic-Induced Permanent Displacement of Geosynthetic-Reinforced Segmental Retaining Walls. Can. Geotech. J. 1995, 33, 937–955. [Google Scholar] [CrossRef]
- Vieira, C.S.; Lopes, M.d.L.; Caldeira, L.M. Earth Pressure Coefficients for Design of Geosynthetic Reinforced Soil Structures. Geotext. Geomembr. 2011, 29, 491–501. [Google Scholar] [CrossRef]
- Panah, A.K.; Yazdandoust, M.; Sadeghzadegan, R. Determination of MSE Wall Pseudo Static Coefficient Based on Seismic Performance. In Proceedings of the International Conference on Case Histories in Geotechnical Engineering, Chicago, IL, USA, 29 April–4 May 2013. [Google Scholar]
- Walthall, R.M.; Wang, J.; Kiousis, P.; Khan, A. Finite-Element Analyses of Mechanically Stabilized Earth Walls Subjected to Midlevel Seismic Loads. J. Perform. Constr. Facil. 2013, 27, 171–180. [Google Scholar] [CrossRef]
- Latha, G.M.; Krishna, A.M. Seismic Response of Reinforced Soil Retaining Wall Models: Influence of Backfill Relative Density. Geotext. Geomembr. 2008, 26, 335–349. [Google Scholar] [CrossRef]
- Anastasopoulos, I.; Georgarakos, T.; Georgiannou, V.; Drosos, V.; Kourkoulis, R. Seismic Performance of Bar-Mat Reinforced-Soil Retaining Wall: Shaking Table Testing Versus Numerical Analysis with Modified Kinematic Hardening Constitutive Model. Soil Dyn. Earthq. Eng. 2010, 30, 1089–1105. [Google Scholar] [CrossRef]
- Latha, G.M.; Santhanakumar, P. Seismic Response of Reduced-Scale Modular Block and Rigid Faced Reinforced Walls through Shaking Table Tests. Geotext. Geomembr. 2015, 43, 307–316. [Google Scholar] [CrossRef]
- Panah, A.K.; Yazdi, M.; Ghalandarzadeh, A. Shaking Table Tests on Soil Retaining Walls Reinforced by Polymeric Strips. Geotext. Geomembr. 2015, 43, 148–161. [Google Scholar] [CrossRef]
- Wang, L.; Chen, G.; Chen, S. Experimental Study on Seismic Response of Geogrid Reinforced Rigid Retaining Walls with Saturated Backfill Sand. Geotext. Geomembr. 2015, 43, 35–45. [Google Scholar] [CrossRef]
- Safaee, A.M.; Mahboubi, A.; Noorzad, A. Experimental Investigation on the Performance of Multi-Tiered Geogrid Mechanically Stabilized Earth (MSE) Walls with Wrap-around Facing Subjected to Earthquake Loading. Geotext. Geomembr. 2021, 49, 130–145. [Google Scholar] [CrossRef]
- Yünkül, K.; Gürbüz, A. Shaking Table Study on Seismic Behavior of MSE Wall with Inclined Backfill Soils Reinforced by Polymeric Geostrips. Geotext. Geomembr. 2022, 50, 116–136. [Google Scholar] [CrossRef]
- Matsuo, O.; Yokoyama, K.; Saito, Y. Shaking Table Tests and Analyses of Geosynthetic-Reinforced Soil Retaining Walls. Geosynth. Int. 1998, 5, 97–126. [Google Scholar] [CrossRef]
- El-Emam, M.M.; Bathurst, R.J. Influence of Reinforcement Parameters on the Seismic Response of Reduced-Scale Reinforced Soil Retaining Walls. Geotext. Geomembr. 2007, 25, 33–49. [Google Scholar] [CrossRef]
- Cai, X.; Li, S.; Xu, H.; Jing, L.; Huang, X.; Zhu, C. Shaking Table Study on the Seismic Performance of Geogrid Reinforced Soil Retaining Walls. Adv. Civ. Eng. 2021, 2021, 1–16. [Google Scholar] [CrossRef]
- Xu, P.; Hatami, K.; Jiang, G. Shaking Table Study on the Influence of Ground Motion Frequency on the Performance of MSE Walls. Soil Dyn. Earthq. Eng. 2021, 142, 106585. [Google Scholar] [CrossRef]
- Damians, I.P.; Bathurst, R.J.; Olivella, S.; Lloret, A.; Josa, A. 3D Modelling of Strip Reinforced MSE Walls. Acta Geotech. 2021, 16, 711–730. [Google Scholar] [CrossRef]
- Ho, D.K.H.; Smith, I.M. P4/6 Modelling of Reinforced Soil Wall: Construction by a 3-D Finite Element Method. In Performance of Reinforced Soil Structures; Conference Proceedings; Thomas Telford Publishing: London, UK, 1991; pp. 335–340. ISBN 978-0-7277-4854-6. [Google Scholar]
- Yoo, C.; Kim, S.-B. Performance of a Two-Tier Geosynthetic Reinforced Segmental Retaining Wall under a Surcharge Load: Full-Scale Load Test and 3D Finite Element Analysis. Geotext. Geomembr. 2008, 26, 460–472. [Google Scholar] [CrossRef]
- El-Emam, M.M.; Bathurst, R.J.; Hatami, K. Numerical Modeling of Reinforced Soil Retaining Walls Subjected to Base Acceleration. In Proceedings of the 13th World Conference on Earthquake Engineering, Vancouver, BC, Canada, 1–6 August 2004; pp. 1–6. [Google Scholar]
- Ling, H.I.; Liu, H.; Kaliakin, V.N.; Leshchinsky, D. Analyzing Dynamic Behavior of Geosynthetic-Reinforced Soil Retaining Walls. J. Eng. Mech. 2004, 130, 911–920. [Google Scholar] [CrossRef]
- Ling, H.I.; Liu, H.; Mohri, Y. Parametric Studies on the Behavior of Reinforced Soil Retaining Walls under Earthquake Loading. J. Eng. Mech. 2005, 131, 1056–1065. [Google Scholar] [CrossRef]
- Fakharian, K.; Attar, I.H. Static and Seismic Numerical Modeling of Geosynthetic-Reinforced Soil Segmental Bridge Abutments. Geosynth. Int. 2007, 14, 228–243. [Google Scholar] [CrossRef]
- Zarnani, S.; El-Emam, M.M.; Bathurst, R.J. Comparison of Numerical and Analytical Solutions for Reinforced Soil Wall Shaking Table Tests. Geomech. Eng. 2011, 3, 291–321. [Google Scholar] [CrossRef]
- Bhattacharjee, A.; Krishna, A.M. Strain Behavior of Backfill Soil in Rigid Faced Reinforced Soil Walls Subjected to Seismic Excitation. Int. J. Geosynth. Ground Eng. 2015, 1, 1–14. [Google Scholar] [CrossRef][Green Version]
- Bathurst, R.J.; Hatami, K. Seismic Response Analysis of a Geosynthetic-Reinforced Soil Retaining Wall. Geosynth. Int. 1998, 5, 127–166. [Google Scholar] [CrossRef]
- Ling, H.I.; Liu, H. Deformation Analysis of Reinforced Soil Retaining Walls—Simplistic versus Sophisticated Finite Element Analyses. Acta Geotech. 2009, 4, 203–213. [Google Scholar] [CrossRef]
- Skinner, G.D.; Rowe, R.K. Design and Behaviour of Geosynthetic-Reinforced Soil Walls Constructed on Yielding Foundations. Geosynth. Int. 2003, 10, 200–214. [Google Scholar] [CrossRef]
- Yoo, C.; Song, A.R. Effect of Foundation Yielding on Performance of Two-Tier Geosynthetic-Reinforced Segmental Retaining Walls: A Numerical Investigation. Geosynth. Int. 2006, 13, 181–194. [Google Scholar] [CrossRef]
- Damians, I.P.; Bathurst, R.J.; Josa, A.; Lloret, A. Numerical Study of the Influence of Foundation Compressibility and Reinforcement Stiffness on the Behavior of Reinforced Soil Walls. Int. J. Geotech. Eng. 2014, 8, 247–259. [Google Scholar] [CrossRef]
- Jiang, Y.; Guo, W.; Fox, P.J.; McCartney, J.S.; Zheng, Y. Numerical Study of the Influence of Foundation Soil on the Deformation Behavior of Geosynthetic Reinforced Soil-Integrated Bridge System under Service Load Conditions. Geo-Congress 2023, GSP 341 438–446. [Google Scholar] [CrossRef]
- Guler, E.; Cicek, E.; Demirkan, M.M.; Hamderi, M. Numerical Analysis of Reinforced Soil Walls with Granular and Cohesive Backfills under Cyclic Loads. Bull. Earthq. Eng. 2012, 10, 793–811. [Google Scholar] [CrossRef]
- Krishna, A.M.; Latha, G.M. Modeling the Dynamic Response of Wrap-Faced Reinforced Soil Retaining Walls. Int. J. Geomech. 2012, 12, 439–450. [Google Scholar] [CrossRef]
- Ren, F.; Zhang, F.; Xu, C.; Wang, G. Seismic Evaluation of Reinforced-Soil Segmental Retaining Walls. Geotext. Geomembr. 2016, 44, 604–614. [Google Scholar] [CrossRef]
- Guler, E.; Cengiz, C.; Kilic, I.E. A Finite Element Validation Approach to Full-Scale Testing of Modular Block Reinforced Soil Retaining Walls under Seismic Loads. In Proceedings of the Second European Conference on Earthquake Engineering and Seismology, Istanbul, Türkiye, 25–29 August 2014. [Google Scholar]
- Capilleri, P.P.; Massimino, M.R.; Motta, E.; Raciti, E.; Todaro, M.; Ferraiolo, F.; Bortolussi, A.; da Silva Duran, J. Numerical Analysis of a Full Scale Earth Reinforced Wall: Static and Seismic Behavior. Riv. Ital. Geotec. 2016, 60, 3–13. [Google Scholar]
- Krishna Chaitanya, C.; Karpurapu, R. Behavior of Two-Tiered MSE Walls Under Static and Seismic Loading. Int. J. Geosynth. Ground Eng. 2023, 9, 32. [Google Scholar] [CrossRef]
- Xu, P.; Zhong, Y.; Hatami, K.; Yang, G.; Liu, W.; Jiang, G. Influence of Reinforcement Design on Seismic Stability of Full-Height Panel MSE Walls. Soil Dyn. Earthq. Eng. 2023, 165, 107674. [Google Scholar] [CrossRef]
- Lysmer, J.; Kuhlemeyer, R.L. Finite Dynamic Model for Infinite Media. J. Eng. Mech. Div. 1969, 95, 859–877. [Google Scholar] [CrossRef]
- Kuhlmeyer, R.L.; Lysmer, J. Finite Element Method Accuracy for Wave Propagation Problems. J. Soil Mech. Found Div. 1973, 99, 421–427. [Google Scholar] [CrossRef]
- Schanz, T.; Vermeer, P.A.; Bonnier, P.G. The Hardening-Soil Model: Formulation and Verification. In Beyond 2000 in Computational Geotechnics; Balkema: Rotterdam, The Netherlands, 1999; pp. 281–290. ISBN 90 5809 040 X. [Google Scholar]
- Kondner, R.L. A Hyperbolic Stressstrain Formulation for Sands. In Proceeding of the Second Pan-American Conference on Soil Mechanics and Foundation Engineering, Rio de Janeiro, Brazil, 16–24 July 1963; Volume 1, pp. 289–324. [Google Scholar]
- Duncan, J.M.; Chang, C.Y. Nonlinear Analysis of Stress and Strain in Soil. J. Soil Mech. Found. Div. 1970, 96, 1629–1653. [Google Scholar] [CrossRef]
- Ling, H.I.; Mohri, Y.; Leshchinsky, D.; Burke, C.; Matsushima, K.; Liu, H. Large-Scale Shaking Table Tests on Modular-Block Reinforced Soil Retaining Walls. J. Geotech. Geoenviron. Eng. 2005, 131, 465–476. [Google Scholar] [CrossRef]
- Hatami, K.; Bathurst, R.J. Development and Verification of a Numerical Model for the Analysis of Geosynthetic-Reinforced Soil Segmental Walls under Working Stress Conditions. Can. Geotech. J. 2005, 42, 1066–1085. [Google Scholar] [CrossRef]
- Guler, E.; Hamderi, M.; Demirkan, M.M. Numerical Analysis of Reinforced Soil-Retaining Wall Structures with Cohesive and Granular Backfills. Geosynth. Int. 2007, 14, 330–345. [Google Scholar] [CrossRef]
- ISO 10319; Geosynthetics—Wide-Width Tensile Test. International Organization for Standardization ISO: Geneva, Switzerland, 2015.
- ASTM D. 6637; Standard Test Method for Determining Tensile Properties of Geogrids by the Single or Multi-Rib Tensile Method. American Society for Testing and Materials: West Conshohocken, PA, USA, 2015.
- Duncan, J.M.; Williams, G.W.; Sehn, A.L.; Seed, R.B. Estimation Earth Pressures Due to Compaction. J. Geotech. Eng. 1991, 117, 1833–1847. [Google Scholar] [CrossRef]
- Bathurst, R.J.; Walters, D.; Vlachopoulos, N.; Burgess, P.; Allen, T.M. Full Scale Testing of Geosynthetic Reinforced Walls. In Proceedings of the Advances in Transportation and Geoenvironmental Systems Using Geosynthetics; American Society of Civil Engineers: Denver, CO, USA,, 5–8 August 2000; pp. 201–217. [Google Scholar]
- Bathurst, R.J.; Walters, D.L.; Hatami, K.; Allen, T.M. Full-Scale Performance Testing and Numerical Modelling of Reinforced Soil Retaining Walls. In Proceedings of the 4th International Symposium on Earth Reinforcement, IS Kyushu 2001, Fukuoka, Japan, 14–16 November 2001; Ochiai, H., Otani, J., Yasufuku, N., Omine, K., Eds.; A.A. Balkema: Rotterdam, The Netherlands, 2001; Volume 2, pp. 777–799. [Google Scholar]
- Hatami, K.; Bathurst, R.J. Numerical Model for Reinforced Soil Segmental Walls under Surcharge Loading. J. Geotech. Geoenviron. Eng. 2006, 132, 673–684. [Google Scholar] [CrossRef]
- Lee, W.F. Internal Stability Analyses of Geosynthetic Reinforced Retaining Walls. Ph.D. Thesis, University of Washington, Seattle, WA, USA, 2000. [Google Scholar]
- Duncan, J.M.; Byrne, P.; Wong, K.S.; Mabry, P. Strength, Stress–Strain and Bulk Modulus Parameters for Finiteelement Analysis of Stresses and Movements in Soil Masses; Calif. Report No. UCB/GT/80-01; Department of Civil Engineering, University of California: Berkeley, CA, USA, 1980. [Google Scholar]
- Turkel, B.; Yildirim, I.Z.; Guler, E. The Effect of Natural Frequency on the Seismic Behavior of an 8 m High MSE Wall. In Proceedings of the Geo-Congress 2020: Engineering, Monitoring, and Management of Geotechnical Infrastructure, Reston, VA, USA, 25–28 February 2020; American Society of Civil Engineers: Minneapolis, MN, USA, 2020; pp. 406–415. [Google Scholar]
- Turkel, B.; Yildirim, I.Z.; Guler, E. Effect of Reinforcement Stiffness on a Seismically Loaded Mechanically Stabilized Earth Wall. In Proceedings of the Geosynthetics: Leading the Way to a Resilient Planet; CRC Press: Boca Raton, FL, USA, 2023; pp. 1184–1189. [Google Scholar]
- Matsuo, H.; Ohara, S. Lateral Earth Pressure and Stability of Quay Walls during Earthquakes. In Proceedings of the Second World Conference on Earthquake Engineering, Tokyo, Japan, 11–18 July 1960; Volume 1, pp. 165–181. [Google Scholar]
- Scott, R.F. Earthquake-Induced Pressures on Retaining Walls. In Proceedings of the 5th World Conference on Earthquake Engineering, Rome, Italy, 25–29 June 1973; Volume 2, pp. 1611–1620. [Google Scholar]
- Wu, G. Dynamic Soil-Structure Interaction: Pile Foundations and Retaining Structures. Ph.D. Thesis, University of British Columbia, Vancouver, BC, Canada, 1994; p. 212. [Google Scholar]
- Iwasaki, T.; Tatsuoka, F.; Takagi, Y. Shear Moduli of Sands under Cyclic Torsional Shear Loading. Soils Found. 1978, 18, 39–56. [Google Scholar] [CrossRef]
- Seed, H.B.; Idriss, I.M. Soil Moduli and Damping Factors for Dynamic Response Analyses; Earthquake Engineering Research Center: Berkeley, CA, USA, 1970; p. 41. [Google Scholar]
- Richardson, G.N.; Lee, K.L. Seismic Design of Reinforced Earth Walls. J. Geotech. Eng. Div. 1975, 101, 167–188. [Google Scholar] [CrossRef]
- Richardson, G.N. Earthquake Resistant Reinforced Earth Walls. Symp. Earth Reinf. ASCE, Pittsburg, PA, USA. April 24–28, 1978 1978, 664–684. [Google Scholar]
- Chopra, A.K. Dynamics of Structures; Pearson Education India: Upper Saddle River, NJ, USA, 2007. [Google Scholar]
- Hashash, Y.M.A.; Musgrove, M.I.; Harmon, J.A.; Ilhan, O.; Xing, G.; Numanoglu, O.; Groholski, D.R.; Phillips, C.A.; Park, D. DEEPSOIL 7.0, User Manual; Board of Trustees of University of Illinois at Urbana-Champaign: Urbana, IL, USA, 2020. [Google Scholar]
- Kramer, S.L. Geotechnical Earthquake Engineering; Prentice-Hall: Upper Saddle River, NJ, USA, 1996; ISBN 978-0-13-374943-4. [Google Scholar]
- International Building Code, IBC 2018; International Code Council: Washington, DC, USA, 2018.
- Arias, A. Measure of Earthquake Intensity. In Measure of Earthquake Intensity. Seismic Design for Nuclear Power Plants; Hansen Robert, J., Ed.; MIT Press: Cambridge, MA, USA, 1970; pp. 438–483. [Google Scholar]
- Burke, C.B. Full-Scale Shaking Table Tests and Finite Element Analysis of Reinforced Soil Retaining Walls. Ph.D. Thesis, Columbia University, Ann Arbor, MI, USA, 2003. [Google Scholar]
- Amorosi, A.; Boldini, D.; Elia, G. Parametric Study on Seismic Ground Response by Finite Element Modelling. Comput. Geotech. 2010, 37, 515–528. [Google Scholar] [CrossRef]
- Elgamal, A.-W.; Alampalli, S.; Laak, P.V. Forced Vibration of Full-Scale Wall-Backfill System. J. Geotech. Eng. 1996, 122, 849–858. [Google Scholar] [CrossRef]
- Kwok, A.O.L.; Stewart, J.P.; Hashash, Y.M.A.; Matasovic, N.; Pyke, R.; Wang, Z.; Yang, Z. Use of Exact Solutions of Wave Propagation Problems to Guide Implementation of Nonlinear Seismic Ground Response Analysis Procedures. J. Geotech. Geoenviron. Eng. 2007, 133, 1385–1398. [Google Scholar] [CrossRef]
- Ling, H.I.; Yang, S.; Leshchinsky, D.; Liu, H.; Burke, C. Finite-Element Simulations of Full-Scale Modular-Block Reinforced Soil Retaining Walls under Earthquake Loading. J. Eng. Mech. 2010, 136, 653–661. [Google Scholar] [CrossRef]
- Tsai, C.-C.; Park, D.; Chen, C.-W. Selection of the Optimal Frequencies of Viscous Damping Formulation in Nonlinear Time-Domain Site Response Analysis. Soil Dyn. Earthq. Eng. 2014, 67, 353–358. [Google Scholar] [CrossRef]
- Woodward, P.K.; Griffiths, D.V. Comparison of the Pseudo-Static and Dynamic Behaviour of Gravity Retaining Walls. Geotech. Geol. Eng. 1996, 14, 269–290. [Google Scholar] [CrossRef]
- Jia, J. Soil Dynamics and Foundation Modeling; Springer International Publishing: Cham, Switzerland, 2018; ISBN 978-3-319-40357-1. [Google Scholar]
- Burke, C.; Ling, H.I.; Liu, H. Seismic Response Analysis of Three Full-Scale Reinforced Soil Retaining Walls. In Geosynthetics and Geosynthetic-Engineered Soil Structures; Ling, H.I., Kaliakin, V.N., Leshchinsky, D., Eds.; Columbia Universit Press: New York, NY, USA, 2005; pp. 147–170. [Google Scholar]
- Hashash, Y.M.A.; Park, D. Viscous Damping Formulation and High Frequency Motion Propagation in Non-Linear Site Response Analysis. Soil Dyn. Earthq. Eng. 2002, 22, 611–624. [Google Scholar] [CrossRef]
- Hudson, M.; Idriss, I.M.; Beikae, M. QUAD4M—A Computer Program to Evaluate the Seismic Response of Soil Structures Using Finite Element Procedures Incorporating a Compliant Base; Center for Geotechnical Modeling, Department of Civil and Environmental Engineering, University of California: Davis, CA, USA, 1994. [Google Scholar]
- Hamdi, R.; Fattah, M.; Aswad, M. Studying The Settlement of Backfill Sandy Soil Behind Retaining Wall Under Dynamic Loads. Eng. Technol. J. 2020, 38, 992–1000. [Google Scholar] [CrossRef]
- Chen, F.-Q.; Chen, H.-B.; Wu, Y.-X.; Zhang, D.-B.; Lin, Y.-J. Numerical and Analytical Study on Active Earth Pressure against Inverted T-Type Retaining Walls Rotating about the Base. Acta Geotech. 2023, 18, 2195–2216. [Google Scholar] [CrossRef]
- Guler, E.; Selek, O. Geosynthetic-Reinforced Soil Wall Failure Encountered in Reduced Scale Shaking Table Testing. In Geosynthetics: Leading the Way to a Resilient Planet; CRC Press: Boca Raton, FL, USA, 2023; pp. 1137–1142. ISBN 978-1-00-338688-9. [Google Scholar]
Disclaimer/Publisher’s Note: The statements, opinions and data contained in all publications are solely those of the individual author(s) and contributor(s) and not of MDPI and/or the editor(s). MDPI and/or the editor(s) disclaim responsibility for any injury to people or property resulting from any ideas, methods, instructions or products referred to in the content. |
© 2024 by the authors. Licensee MDPI, Basel, Switzerland. This article is an open access article distributed under the terms and conditions of the Creative Commons Attribution (CC BY) license (https://creativecommons.org/licenses/by/4.0/).