
Influence of Joint Strengthening on the Seismic Performance of Non-Engineered Buildings


Abstract
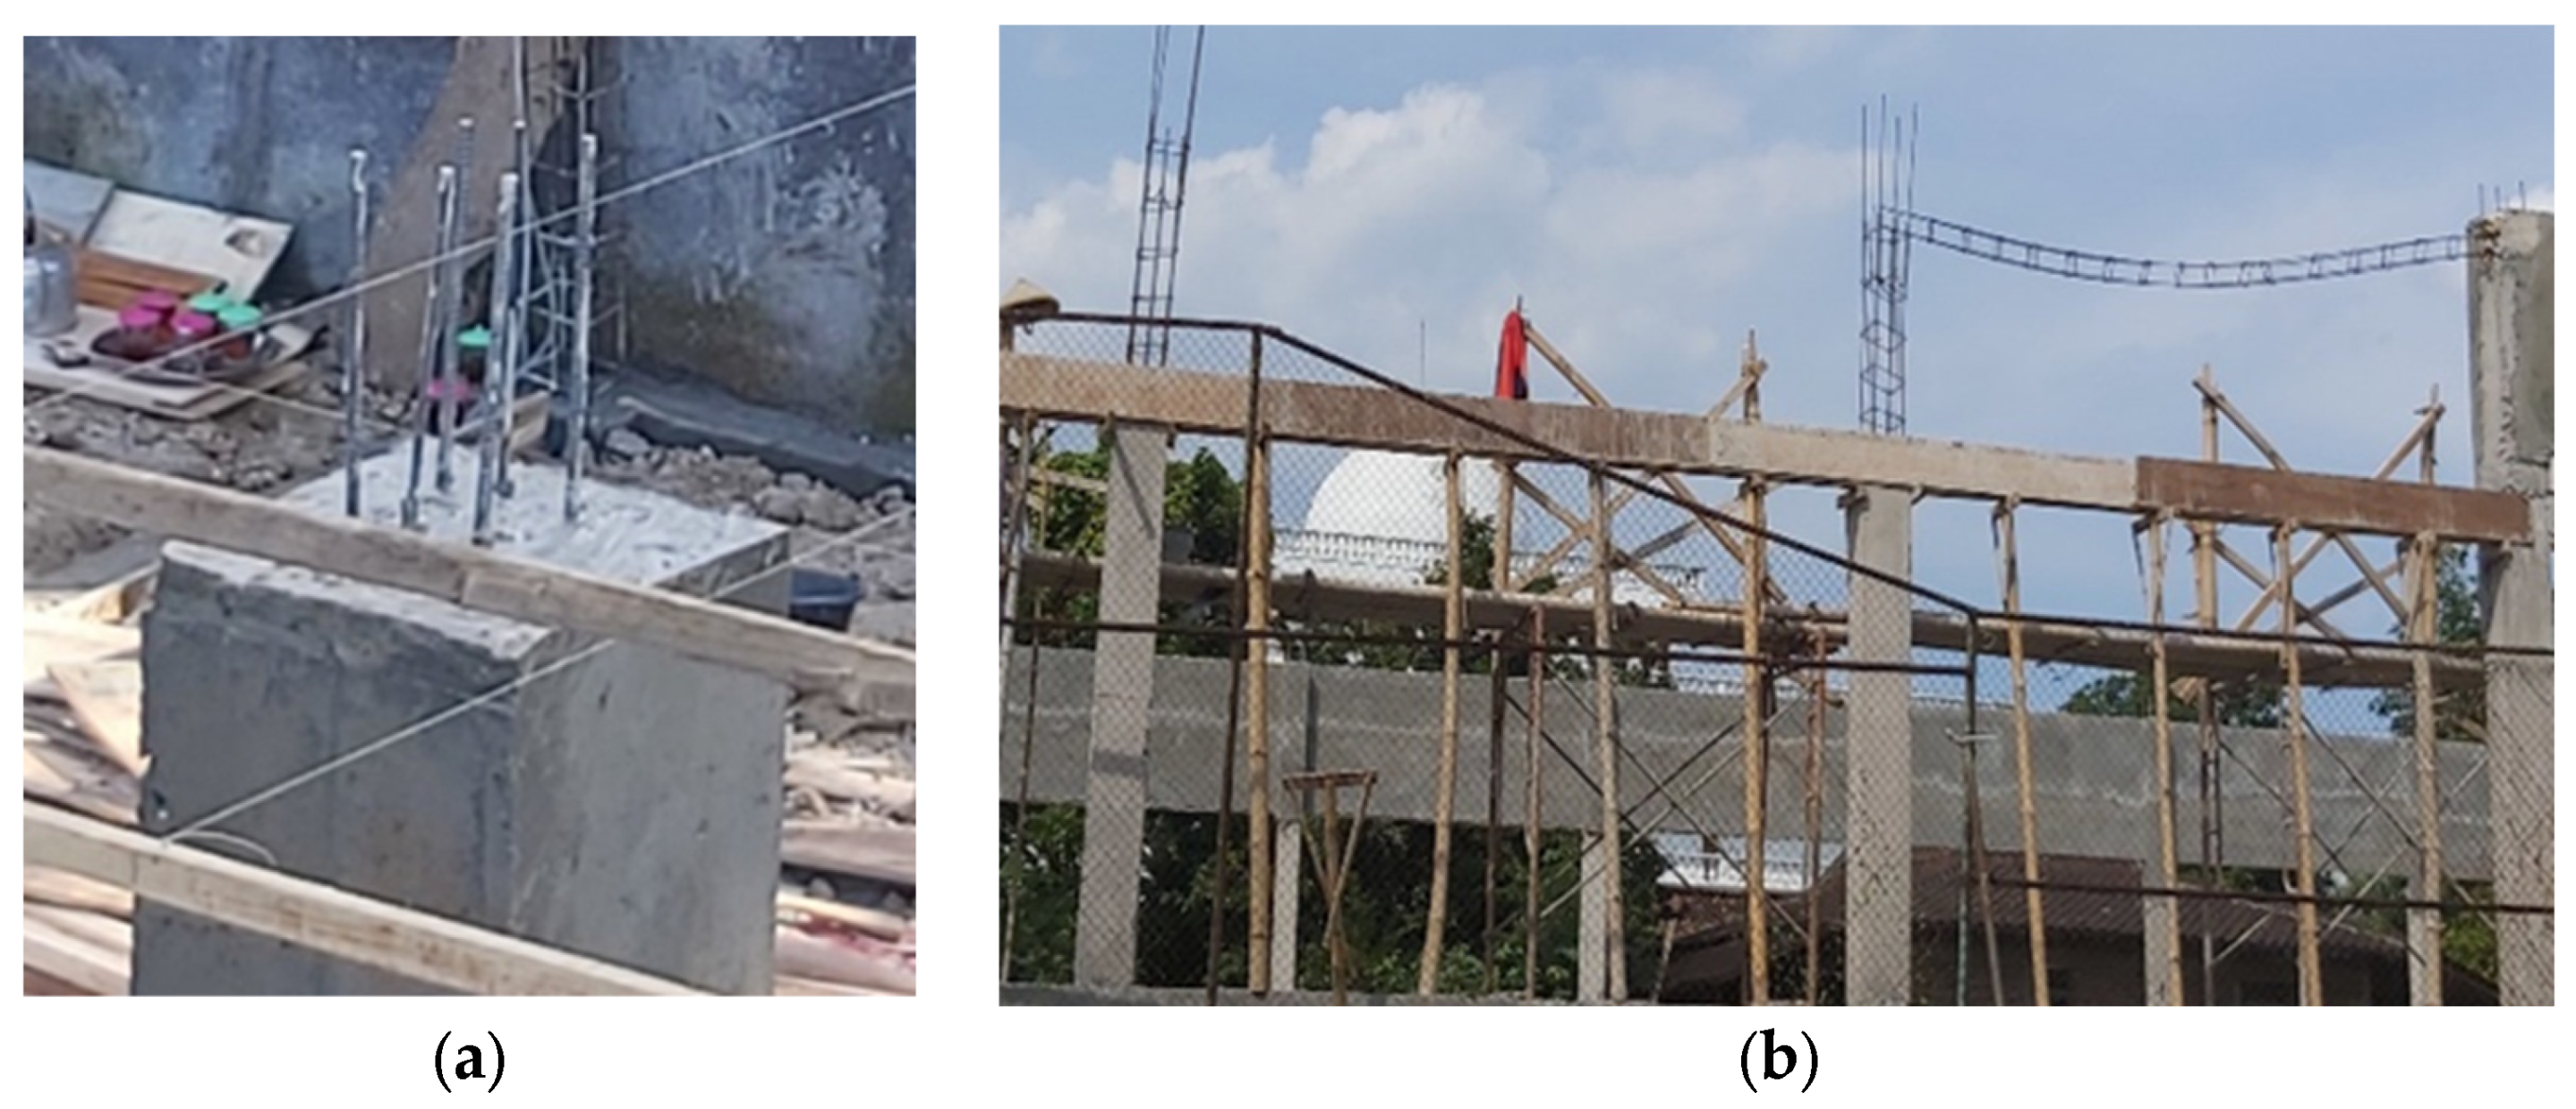
1. Introduction
2. Materials
3. Methods
3.1. RC Frame Structure Model
- An NEB portal model without joint strengthening (NEB-000);
- An NEB model with beam–column joint strengthening using a 75 mm wide plate (NEB-075);
- An NEB model with beam–column joint strengthening using a 100 mm wide steel plate (NEB-100).
3.2. Loading Protocol
- Three complete cycles were applied for each drift ratio.
- The initial drift ratio was 0.002 (0.2%) in the test, and it was within the range of the linear elastic behavior of the specimen. The subsequent drift ratios were at least 1.25 times, but not more than 1.5 times, the previous drift ratio.
- The test was conducted by gradually increasing the drift ratio until a minimum drift ratio of 0.035 (3.5%) was achieved.
3.3. Experimental Setup
4. Numerical Investigation
5. Results and Analysis
5.1. Load Displacement
5.2. Crack Pattern
5.2.1. NEB-000 Model
5.2.2. NEB-075 Model
5.2.3. NEB-100 Model
5.3. Energy Dissipation
5.4. Damage State
5.5. Structural Uncertainty
5.6. Fragility Analysis
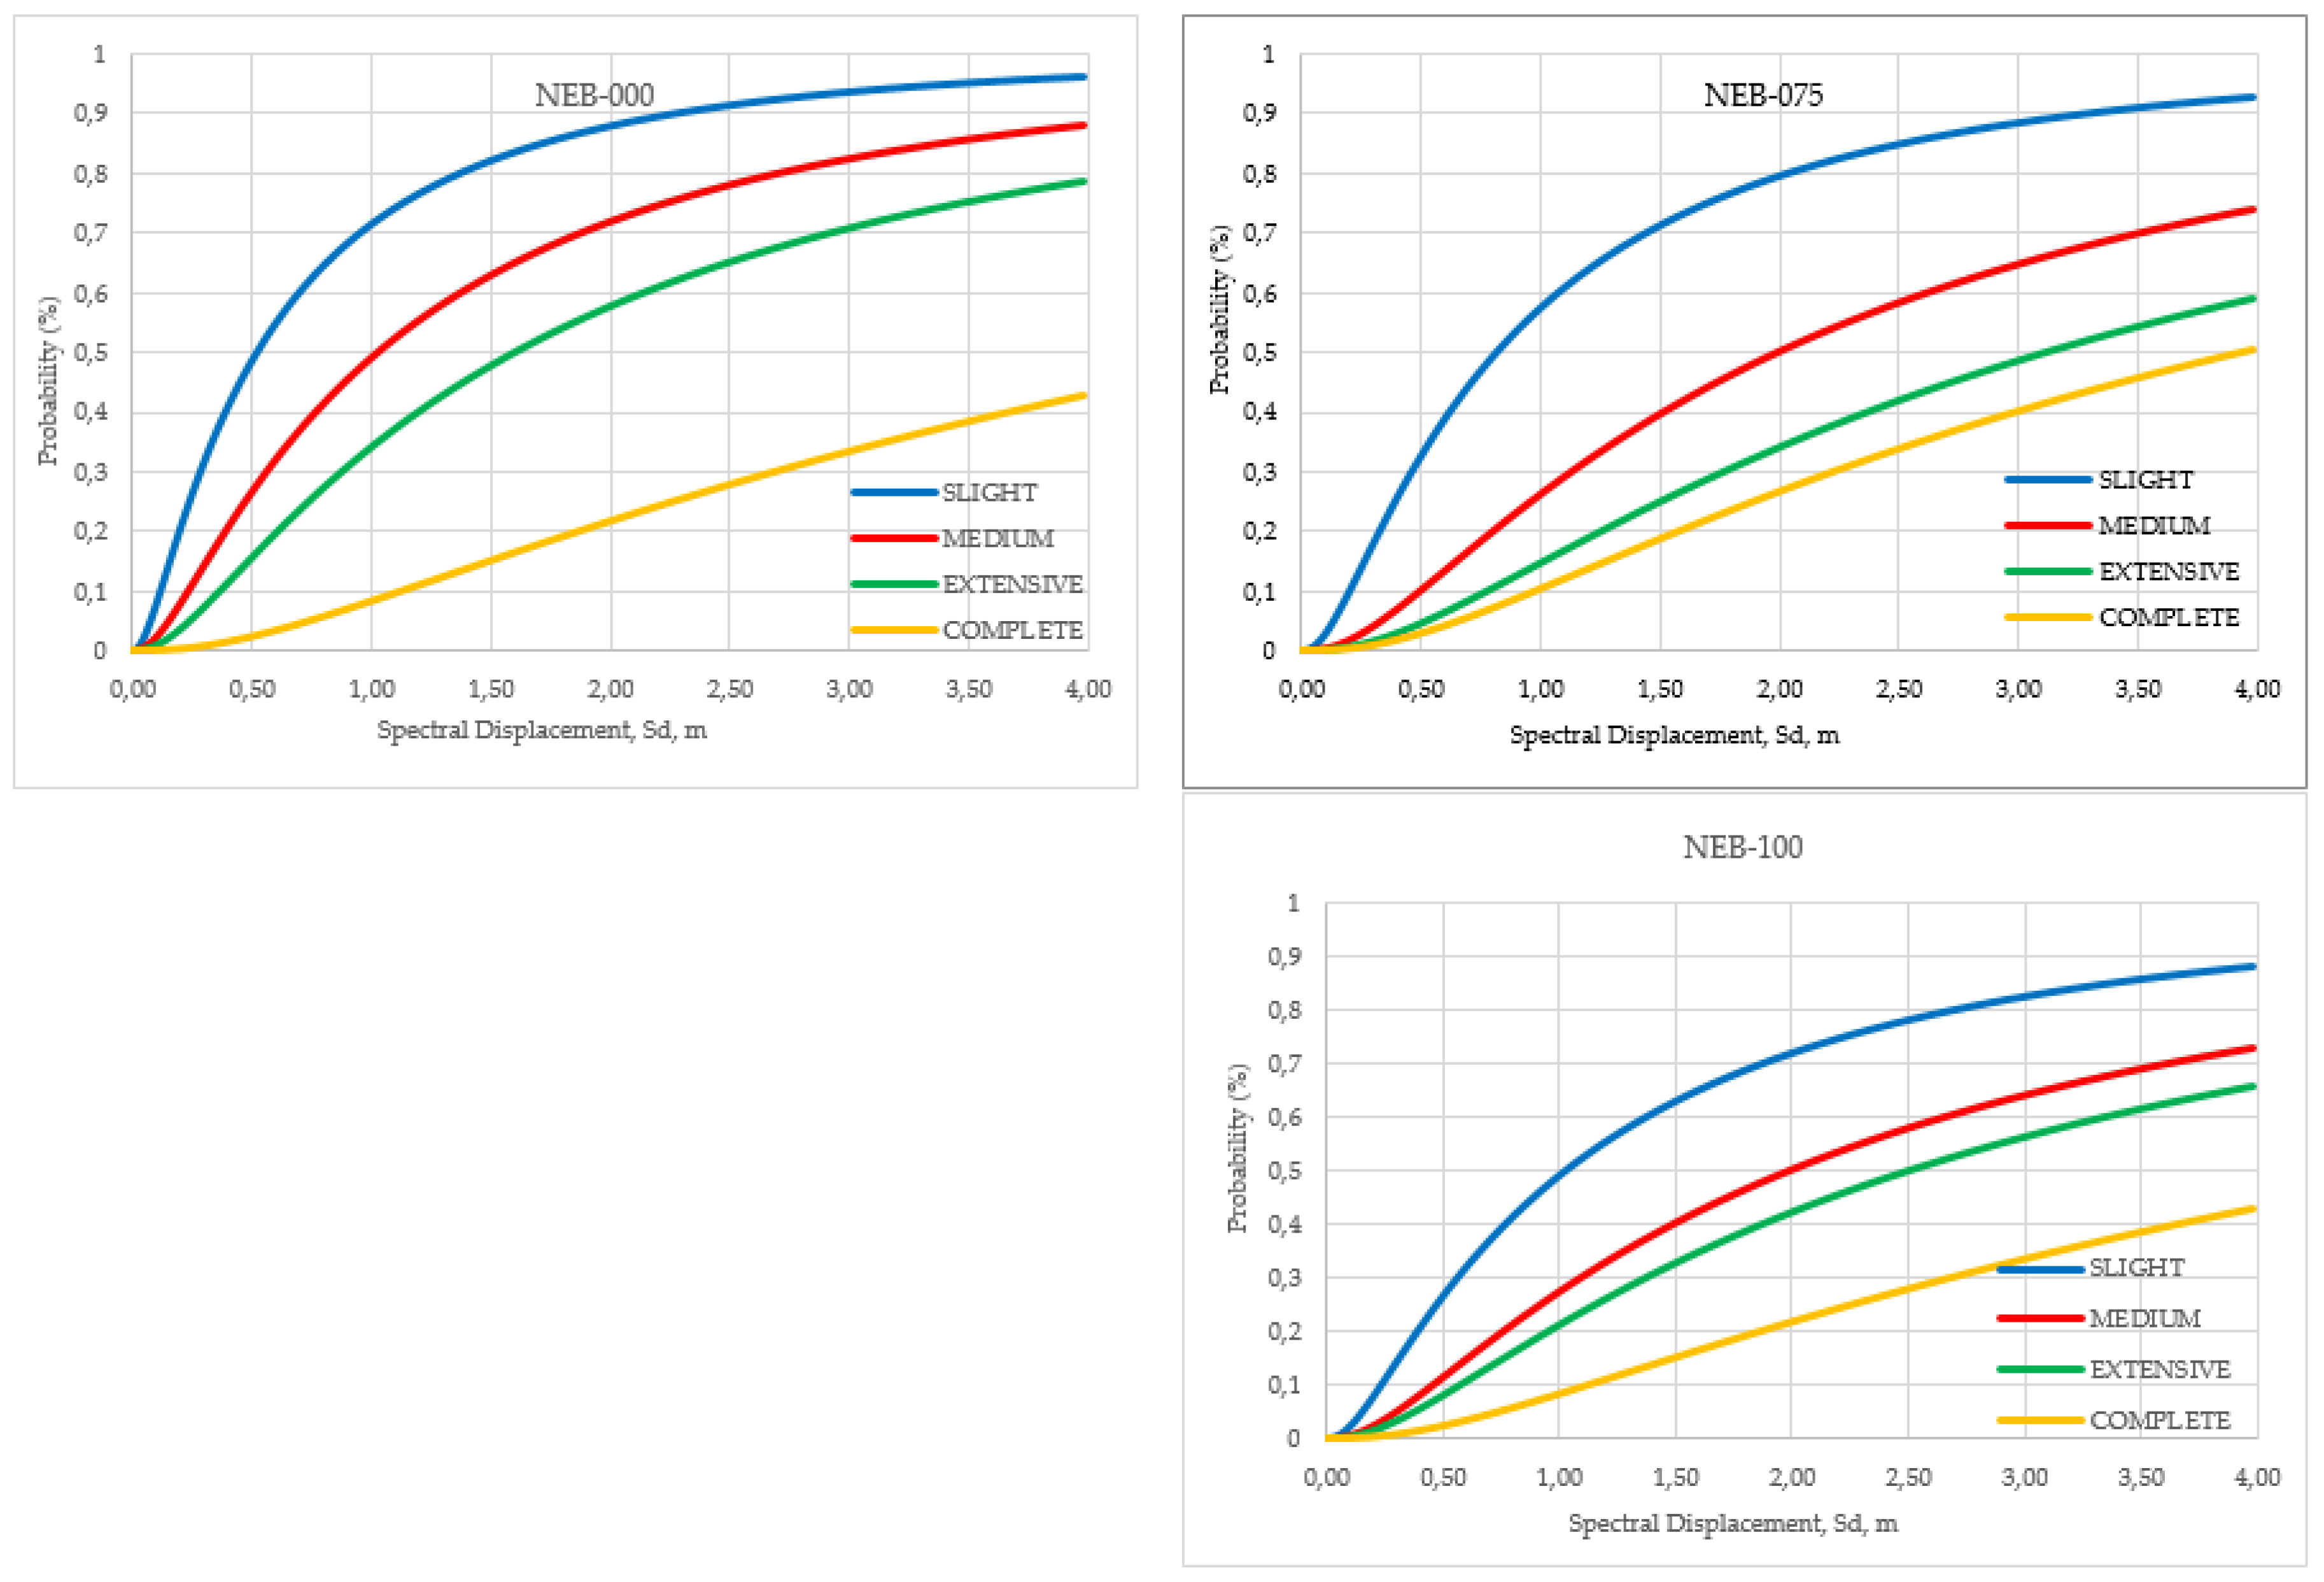
5.6.1. Fragility Curve of NEBs
5.6.2. Discrete Damage of NEBs
6. Conclusions
- The NEB model without joint strengthening tended to experience severe damage in the joint area. This joint damage could potentially cause the beam and column elements to break. The NEB model with joint strengthening using 75 mm wide steel plates reduced the level of joint damage, whereas the NEB model with 100 mm wide steel plates transferred the damage from the joint areas to the column sections at the end of the steel plates. These findings confirm that steel plates can maintain the integrity of beam and column elements and reduce the severity of damage.
- Strengthening the joints of the NEBs using 75 and 100 mm wide steel plates increased the load-bearing capacity by 68.92 and 68.31%, respectively. Compared to using 75 mm wide steel plates, strengthening the joints of NEBs with 100 mm wide steel plates was more effective in preserving the integrity of the beam–column elements. This improved the ductility and energy dissipation of the structure.
- Strengthening the joints of NEBs with 75 and 100 mm wide steel plates can change the damage limit states of NEBs. Subsequently, it also improves the seismic performance of the structure, as the structure exhibited higher undamaged values than the NEBs without joint strengthening.
- The use of steel plates as strengthening materials in NEB effectively improved the seismic performance and integrity of the structural elements. This material is relatively affordable for lower-class communities and easy to apply.
Author Contributions
Funding
Data Availability Statement
Conflicts of Interest
References
- Boen, T. Earthquake Resistant Design of Non-Engineered Buildings in Indonesia; Building Trust International: Jakarta, Indonesia, 2001; p. 34. Available online: https://www.researchgate.net/publication/238659833 (accessed on 2 November 2019).
- Santiago, W.C.; Beck, A. A study of brazilian concrete strength (non-)compliance and its effects on reliability of short columns. IBRACON Struct. Mater. J. 2011, 4, 663–676. [Google Scholar]
- Kristianto, A.; Imran, I.; Suarjana, M.; Pane, I. Confinement of Reinforced-Concrete Columns with Non-Code Compliant Confining Reinforcement plus Supplemental Pen-Binder. ITB J. Eng. Sci. 2012, 44, 220–237. [Google Scholar] [CrossRef]
- Badan Standarisasi Nasional. Persyaratan Beton Struktural untuk Bangunan Gedung SNI 2847-2013; Badan Standarisasi Nasional: Jakarta, Indonesia, 2013; p. 265. [Google Scholar]
- Ha, G.-J.; Ha, Y.-J.; Kang, H.-W. Improvement and Evaluation of Seismic Performance of Reinforced Concrete Exterior Beam-Column Joints Retrofitting with Fiber Reinforced Polymer Sheets and Embedded CFRP Rods. J. Korea Inst. Struct. Maint. Insp. 2015, 19, 151–159. [Google Scholar] [CrossRef]
- Le-Trung, K.; Lee, K.; Lee, J.; Lee, D.H.; Woo, S. Experimental study of RC beam–column joints strengthened using CFRP composites. Compos. Part B Eng. 2010, 41, 76–85. Available online: https://www.sciencedirect.com/science/article/pii/S135983680900119X (accessed on 31 October 2019). [CrossRef]
- Ilia, E.; Mostofinejad, D. Seismic retrofit of reinforced concrete strong beam–weak column joints using EBROG method combined with CFRP anchorage system. Eng. Struct. 2019, 194, 300–319. [Google Scholar] [CrossRef]
- Tafsirojjaman, T.; Fawzia, S.; Thambiratnam, D.P. Structural behaviour of CFRP strengthened beam-column connections under monotonic and cyclic loading. Structures 2021, 33, 2689–2699. [Google Scholar] [CrossRef]
- Meenakshi, B.; Suguna, K.; Raghunath, P. Effect of confinement on concrete beams under cyclic loading with GFRP laminates. Mater. Today Proc. 2021, 45, 6633–6637. [Google Scholar] [CrossRef]
- Roy, B.; Laskar, A.I. Cyclic Performance of Beam-Column Subassemblies with Construction Joint in Column Retrofitted with GFRP. Structures 2018, 14, 290–300. [Google Scholar] [CrossRef]
- Madupu, L.S.; Ram, K.S. Performance of axially loaded reinforced concrete rectangular columns strengthened with GFRP strips. Mater. Today Proc. 2020, 43, 1784–1791. [Google Scholar] [CrossRef]
- Koutas, L.; Pitytzogia, A.; Triantafillou, T.C.; Bousias, S.N. This is a repository copy of Strengthening of infilled reinforced concrete frames with TRM: Study on the development and testing of textile-based anchors. J. Compos. Constr. 2014, 18, 1–33. [Google Scholar] [CrossRef]
- Koutas, L.; Bousias, S.N.; Triantafillou, T.C. Seismic Strengthening of Masonry-Infilled RC Frames with TRM: Experimental Study. J. Compos. Constr. 2015, 19, 1–33. [Google Scholar] [CrossRef]
- Koutas, L.N.; Bournas, D.A. Confinement of masonry columns with textile-reinforced mortar jackets. Constr. Build. Mater. 2020, 258, 120343. [Google Scholar] [CrossRef]
- Giese, A.C.H.; Giese, D.N.; Dutra, V.F.P.; Filho, L.C.P.D.S. Flexural behavior of reinforced concrete beams strengthened with textile reinforced mortar. J. Build. Eng. 2021, 33, 101873. [Google Scholar] [CrossRef]
- Deng, B.-Y.; Liu, X.; Yu, K.-Q.; Li, L.-Z.; Chen, Y. Seismic retrofitting of RC joints using steel cage and haunch with bolted steel plate. Structures 2022, 43, 285–298. [Google Scholar] [CrossRef]
- Cai, Z.; Liu, X.; Wu, R.; Li, L.; Lu, Z.; Yu, K. Seismic retrofit of large-scale interior RC beam-column-slab joints after standard fire using steel haunch system. Eng. Struct. 2022, 252, 113585. [Google Scholar] [CrossRef]
- Rahmi, Y.; Saputra, A.; Siswosukarto, S. Numerical Modelling of Interior RC Beam-Column Joints for Non-Engineered Buildings Strengthened Using Steel Plates. MATEC Web Conf. 2017, 138, 02007. [Google Scholar] [CrossRef][Green Version]
- Purwanto, E.; Adri, P.A.; Kristiawan, S.A.; Sangadji, S.; Alfisa, S.H. Strengthening of Non-engineered Building Beam-Column Joint to Increase Seismic Performance with Variation of Steel Plate Width BT. In Proceedings of the 5th International Conference on Rehabilitation and Maintenance in Civil Engineering, Surakarta, Indonesia, 8–9 July 2021; Kristiawan, S.A., Gan, B.S., Shahin, M., Sharma, A., Eds.; Springer Nature Singapore: Singapore, 2023; pp. 215–224. [Google Scholar]
- FEMA. HAZUS-MH MR4 Multi-Hazard Loss Estimation Methodology—Earthquake Model: Technical Manual; Department of Homeland Security/FEMA: Washington, DC, USA, 2003. [Google Scholar]
- FEMA. Technical and User’s Manual of Advanced Engineering Building Module (AEBM) “Hazus MH 2.1.”; FEMA: Washington, DC, USA, 2015. [Google Scholar]
- FEMA. Hazus–MH 2.1: Technical Manual; FEMA: Washington, DC, USA, 2012. [Google Scholar]
- Wang, C.; Xiao, J. Evaluation of the stress-strain behavior of confined recycled aggregate concrete under monotonic dynamic loadings. Cem. Concr. Compos. 2018, 87, 149–163. [Google Scholar] [CrossRef]
- Wang, C.; Xiao, J.; Qi, C.; Li, C. Rate sensitivity analysis of structural behaviors of recycled aggregate concrete frame. J. Build. Eng. 2022, 45, 103634. [Google Scholar] [CrossRef]
- Wang, C.; Wu, H.; Li, C. Hysteresis and damping properties of steel and polypropylene fiber reinforced recycled aggregate concrete under uniaxial low-cycle loadings. Constr. Build. Mater. 2022, 319, 126191. [Google Scholar] [CrossRef]
- Wang, C.; Xiao, J.; Liu, W.; Ma, Z. Unloading and reloading stress-strain relationship of recycled aggregate concrete reinforced with steel/polypropylene fibers under uniaxial low-cycle loadings. Cem. Concr. Compos. 2022, 131, 104597. [Google Scholar] [CrossRef]
- ACI374.1; Acceptance Criteria for Moment Frames Based on Structural Testing and Commentary. American Concrete Institute: Farmington Hills, MI, USA, 2005; p. 13.
- Cervenka Consulting. ATENA Program Documentation; Cervenka Consulting: Prague, Czech Republic, 2007. [Google Scholar]
- Cervenka, J.; Libor, J. ATENA Program Documentation; Part 6; Cervenka Consulting: Prague, Czech Republic, 2015. [Google Scholar]
- Červenka, J. ATENA Program Documentation Part 2-1 User’s Manual for ATENA 2D. In ATENA Program Documentation Part 4-1 Tutorial for Programme ATENA 2D; Červenka Consulting: Prague, Czech Republic, 2015; Volume 4–1, pp. 1–62. [Google Scholar]
- Cervenka, V.; Jendele, L.; Cervenka, J. ATENA Program Documentation Part 1 Theory; Atena: Prague, Czech Republic, 2012; pp. 1–282. [Google Scholar]
- Federal Emergency Management Agency (FEMA). Hazus Earthquake Model Technical Manual; Hazus 4.2.; FEMA: Washington DC, USA, 2020. [Google Scholar]


| Material | Properties |
|---|---|
| Concrete for column | f′c = 14.72 MPa |
| Concrete for beam | f′c =10.81 MPa |
| Flexural reinforcement | fy = 479.99 MPa and fu = 659.01 MPa |
| Shear reinforcement | fy = 426.74 MPa and fu = 560.76 MPa |
| Steel plate | fy = 399.77 MPa and fu = 589.02 MPa |
| Specimen ID | Beam 15 × 20 × 300 | Column 15 × 15 × 250 | Steel Plate T:W:L (mm) | ||
|---|---|---|---|---|---|
| Longitudinal Reinforcement | Shear Reinforcement | Longitudinal Reinforcement | Shear Reinforcement | ||
| NEB-000 | 4D10 | D6-200 | 4D10 | D6-200 | NA |
| NEB-075 | 4D10 | D6-200 | 4D10 | D6-200 | 5:75:500 |
| NEB-100 | 4D10 | D6-200 | 4D10 | D6-200 | 5:100:500 |
| Parameter | Value of Parameter |
|---|---|
| Cylinder strength | f′c = −0.85 f′cu |
| Tensile strength | f′t = 0.24 f′cu2/3 |
| Initial elastic modulus | Ec = (6000 15.5f′cu) √f′cu |
| Poisson’s ratio | ν = 0.2 |
| Softening compression | wd = −0.0005 mm |
| Type of tension softening | 1—exponential, based on GF |
| Compressive strength in cracked concrete | c = 0.8 |
| Tension stiffening stress | σ st = 0.4 |
| Shear retention factor | variable |
| Tension–compression function type | linear |
| Fracture energy Gf according to VOS 1983 | GF = 0.000025 f′tef [MN/m] |
| Orientation factor for strain localization | γ max = 1.5 |
| Specimen ID | Maximum Load (kN) | Displacement (mm) | ||||
|---|---|---|---|---|---|---|
| Compressive | Tensile | Compressive | Drift Ratio (%) | Tensile | Drift Ratio (%) | |
| NEB-000 | 6.50 | −5.91 | 69.90 | 2.91 | −69.90 | 2.91 |
| NEB-075 | 10.98 | −11.09 | 55.90 | 2.33 | −55.90 | 2.33 |
| NEB-100 | 10.94 | −11.13 | 69.90 | 2.91 | −69.90 | 2.91 |
| Specimen | Energy Dissipation (Joule) | Increase in Value (%) |
|---|---|---|
| NEB-000 | 1556.00 | 0.00 |
| NEB-075 | 2131.98 | 37.02 |
| NEB-100 | 2741.44 | 76.19 |
| Damage State | Description of the Structural Damage |
|---|---|
| Slight (DS1) | Flexural or shear type hairline cracks in some beams and columns near joints or within joints. |
| Moderate (DS2) | Most beams and columns exhibit hairline cracks. In ductile frames, some of the frame elements have reached yield capacity, indicated by larger flexural cracks and some concrete spalling. Nonductile frames exhibit larger shear cracks and spalling. |
| Extensive (DS3) | In ductile frames, some of the frame elements have reached their ultimate capacity, as indicated by large flexural cracks, spalled concrete, and buckled main reinforcement; nonductile frame elements may have suffered shear or bond failures at reinforcement splices, broken ties, or buckled main reinforcement in columns, which can result in partial collapse. |
| Complete (DS4) | Structure is either collapsed or in imminent danger of collapse due to brittle failure of the nonductile frame elements or loss of frame stability. Approximately 13% of low-rise, and 10% of mid-rise, and 5% of high-rise of the total area of C1 buildings with complete damage are expected to be collapsed. |
| Model | Load (kN) | Displacement (mm) | ||||||
|---|---|---|---|---|---|---|---|---|
| First Crack | Yield | Peak | Ultimate | First Crack | Yield | Peak | Ultimate | |
| NEB-000 | 1.37 | 3.80 | 6.50 | 3.69 | 7.50 | 14.70 | 22.90 | 69.90 |
| NEB-075 | 2.25 | 4.30 | 9.04 | 10.39 | 7.50 | 14.70 | 22.90 | 55.90 |
| NEB-100 | 2.66 | 4.72 | 8.21 | 7.98 | 7.50 | 14.70 | 22.90 | 69.90 |
| Model | DS1 (Slight) | DS2 (Medium) | DS3 (Extensive) | DS4 (Complete) | ||||
|---|---|---|---|---|---|---|---|---|
| Sd | Sa | Sd | Sa | Sd | Sa | Sd | Sa | |
| NEB-000 | 0.5243 | 0.1698 | 1.0275 | 0.4693 | 1.6007 | 0.8039 | 4.8860 | 0.4559 |
| NEB-075 | 0.8178 | 0.4717 | 1.9991 | 1.2005 | 3.1245 | 1.3581 | 3.9074 | 1.2853 |
| NEB-100 | 1.0275 | 0.5833 | 1.9991 | 1.1993 | 2.5024 | 1.3532 | 4.8860 | 0.9870 |
| Model | Limit State | Sd (m) | βC | βD | βM(Sds) | βSds |
|---|---|---|---|---|---|---|
| NEB-000 | DS1 | 0.5243 | 2.3981 | 0.4500 | 0.400 | 1.1509 |
| DS2 | 1.0275 | 2.3981 | 0.4500 | 0.400 | 1.1509 | |
| DS3 | 1.6007 | 2.3981 | 0.4500 | 0.400 | 1.1509 | |
| DS4 | 4.8860 | 2.3981 | 0.4500 | 0.400 | 1.1509 | |
| NEB-075 | DS1 | 0.8178 | 2.2248 | 0.4500 | 0.400 | 1.0781 |
| DS2 | 1.9991 | 2.3981 | 0.4500 | 0.400 | 1.0781 | |
| DS3 | 3.1245 | 2.3981 | 0.4500 | 0.400 | 1.0781 | |
| DS4 | 3.9074 | 2.3981 | 0.4500 | 0.400 | 1.0781 | |
| NEB-100 | DS1 | 1.0275 | 2.3836 | 0.4500 | 0.400 | 1.1448 |
| DS2 | 1.9991 | 2.3836 | 0.4500 | 0.400 | 1.1448 | |
| DS3 | 2.5024 | 2.3836 | 0.4500 | 0.400 | 1.1448 | |
| DS4 | 4.8860 | 2.3836 | 0.4500 | 0.400 | 1.1448 |
| Model | Limit State | DBE = 0.255124 g | MCE = 0.382686 g | ||
|---|---|---|---|---|---|
| Probability | Discrete Damage | Probability | Discrete Damage | ||
| NEB-000 | Undamaged | 56.49% | 29.61% | ||
| Slight | 26.44% | 30.04% | 39.16% | 9.55% | |
| Medium | 11.16% | 15.28% | 19.39% | 19.77% | |
| Extensive | 5.42% | 5.74% | 10.54% | 8.85% | |
| Complete | 0.49% | 4.93% | 1.30% | 9.25% | |
| NEB-075 | Undamaged | 81.54% | 65.44% | ||
| Slight | 14.04% | 67.50% | 24.10% | 41.35% | |
| Medium | 2.83% | 11.21% | 6.29% | 17.81% | |
| Extensive | 1.02% | 1.81% | 2.59% | 3.70% | |
| Complete | 0.58% | 0.44% | 1.57% | 1.02% | |
| NEB-100 | Undamaged | 82.46% | 66.86% | ||
| Slight | 11.16% | 71.30% | 19.39% | 47.47% | |
| Medium | 3.59% | 7.57% | 7.42% | 11.98% | |
| Extensive | 2.30% | 1.30% | 5.03% | 2.38% | |
| Complete | 0.49% | 1.80% | 1.30% | 3.73% | |
Disclaimer/Publisher’s Note: The statements, opinions and data contained in all publications are solely those of the individual author(s) and contributor(s) and not of MDPI and/or the editor(s). MDPI and/or the editor(s) disclaim responsibility for any injury to people or property resulting from any ideas, methods, instructions or products referred to in the content. |
© 2024 by the authors. Licensee MDPI, Basel, Switzerland. This article is an open access article distributed under the terms and conditions of the Creative Commons Attribution (CC BY) license (https://creativecommons.org/licenses/by/4.0/).
Share and Cite
Purwanto, E.; Kristiawan, S.A.; Sangadji, S.; Saifullah, H.A. Influence of Joint Strengthening on the Seismic Performance of Non-Engineered Buildings. Buildings 2024, 14, 488. https://doi.org/10.3390/buildings14020488
Purwanto E, Kristiawan SA, Sangadji S, Saifullah HA. Influence of Joint Strengthening on the Seismic Performance of Non-Engineered Buildings. Buildings. 2024; 14(2):488. https://doi.org/10.3390/buildings14020488
Chicago/Turabian StylePurwanto, Edy, Stefanus Adi Kristiawan, Senot Sangadji, and Halwan Alfisa Saifullah. 2024. "Influence of Joint Strengthening on the Seismic Performance of Non-Engineered Buildings" Buildings 14, no. 2: 488. https://doi.org/10.3390/buildings14020488
APA StylePurwanto, E., Kristiawan, S. A., Sangadji, S., & Saifullah, H. A. (2024). Influence of Joint Strengthening on the Seismic Performance of Non-Engineered Buildings. Buildings, 14(2), 488. https://doi.org/10.3390/buildings14020488