Abstract
The purpose of this study is to assess effects of two different simulation methods (i.e., interfaces with a single spring-slider system and interfaces with double spring-slider systems) for interactions between reinforcement and the surrounding medium on the performances of geosynthetic-reinforced soil (GRS) structures when conducting numerical analyses. The fundamental difference between these two methods is the number of the spring-slider systems used to connect the nodes of structural elements simulating the geosynthetic reinforcement and the points of solid grids simulating the surrounding medium. Numerical simulation results of pull-out tests show that both methods reasonably predicted the pullout failure mode of the reinforcement embedded in the surrounding medium. However, the method using the interfaces with a single spring-slider system could not correctly predict the interface shear failure mode between the geosynthetics and surrounding medium. Further research shows that these two methods resulted in different predictions of the performance of GRS piers as compared with results of a laboratory load test. Numerical analyses show that a combination of interfaces with double spring-slider systems for reinforcement between facing blocks and interfaces with a single spring-slider system for reinforcement in soil resulted in the best performance prediction of the GRS structures as compared with the test results. This study also proposes and verifies an equivalent method for determining/converting the interface stiffness and strength parameters for these two methods.
1. Introduction
Geosynthetic-reinforced soil (GRS) has been increasingly used as earth structures, such as retaining walls, slopes, and embankments to support surface loads over the last couple of decades due to its advantages of low cost and simple construction. The performance of a GRS structure consisting of multiple components (e.g., soil, geosynthetic, and facing blocks) is significantly affected by interactions between different components [1,2]; therefore, it is difficult to properly analyze its internal/external stability under failure conditions and its deformations under serviceability conditions using conventional analytical solutions. More recently, numerical software has been increasingly used to evaluate the performance of GRS structures for field applications or theoretical research [3,4]. In the process of establishing numerical models, different methods are used to simulate interactions between different components in GRS structures. Since these simulated interactions may affect the predicted performance of the GRS structures, it is important to select proper interaction simulation methods in a numerical analysis.
There are two common methods in the commercial numerical software to simulate the interaction between the geosynthetic reinforcement and the surrounding medium (e.g., soil and facing blocks) in GRS structures. Figure 1 illustrates the basics of these two interaction simulation methods. Method I simulates the interaction between the geosynthetic reinforcement (i.e., structural elements) and the surrounding medium (i.e., solid grids) using interfaces with a single spring-slider system located at each node of the structural element. This single spring-and-slider system allows relative displacements between the reinforcement and the surrounding medium but does not allow relative displacements between the surrounding medium on the opposing sides of the reinforcement–medium interface as shown in Figure 1a. In other words, in Method I, the displacement on side A of the solid grids is equal to that on side B, but the displacement on either side of the solid grids is not equal to that at the node of the structural element. Examples of using Method I to simulate the interaction between the structural element and the surrounding solid grids are: (1) the “GROUTED” “CABLE” structural elements embedded in the finite difference-based software FLAC2D and (2) the “GEOGRID” or “PLATE” structural elements with “INTERFACE” elements embedded in the finite element-based software PLAXIS2D. Many numerical studies in the literature utilized Method I to simulate the interaction between the geosynthetic reinforcement and the backfill soil in interaction tests [5,6,7], retaining walls [8,9], slopes [10,11], abutments [12,13], and embankments [14,15].
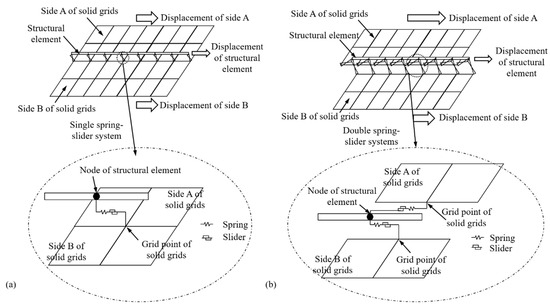
Figure 1.
Basics of two interaction simulation methods in commercial numerical software: (a) Method I: single spring-slider system and (b) Method II: double spring-slider systems.
On the other hand, Method II simulates the interaction between the structural element and the surrounding solid grids using double spring-slider systems located at each node of the structural element. These double spring-slider systems allow not only relative displacements between the reinforcement and the surrounding medium but also relative displacements between the surrounding medium on two opposing sides of the reinforcement–medium interface. In other words, in Method II, the displacements on side A and side B of the surrounding solid grids and at the node of the structural element can be different. The “BEAM” structural element with “INTERFACE” elements on both sides embedded in FLAC2D is one of the examples using Method II to simulate the interaction between the geosynthetic reinforcement and the surrounding medium. In recent studies, Method II was used to simulate the interaction of the geosynthetic reinforcement embedded between two facing blocks [16,17,18,19], the interaction between the geocell and the backfill soil in a geocell-reinforced slope [20], and the interaction of the geotextile-reinforced gravel layer over a void [21].
When establishing a numerical model, choosing different structural elements and interface options is essentially using different methods to simulate the interaction between different components such as the interaction between the geosynthetic and the surrounding medium (i.e., reinforcement–medium interaction). The applying condition of each interaction simulating method is different due to its unique capabilities as discussed previously. However, little research has been conducted in the past to investigate the applicability of each simulating method or the principle of choosing the appropriate simulating method under different conditions. Yu and Bathurst [21] and Yu et al. [22] pointed out that the selection of structure elements and interfaces could have a significant influence on numerical results; therefore, appropriate modeling of the reinforcement–medium interaction is the key to accurately predict the performance of GRS structures. Clearly, it is necessary and important to assess different interaction simulation methods and their effects on the predicted performance of GRS structures using numerical software. Also, another issue that needs to be addressed is the conversion formula between the interface parameters of the two simulation methods. Due to that, the interface parameters determined by direct shear or pullout tests usually correspond to Method II. When Method I is applied in numerical simulation, it inevitably involves a parameter conversion issue. Hence, the conversion formula is of great significance for determining the interface parameters used in numerical simulations based on test results.
In this work, the interface parameter conversion formulas for the above two interface simulation methods were derived based on the interface constitutive model in the FLAC 2D software manual. And two-dimensional numerical analyses were carried out in FLAC 2D to verify the derived relationship and assess the applicability of different interaction simulation methods in predicting the performances of GRS structures. Three interaction tests published in the literature were first chosen for this purpose. Numerical simulations were also conducted to assess the effects of these two interaction simulation methods on the predicted performances of a GRS mini-pier test as compared with the measured results. Finally, recommendations were made for properly applying each interaction simulation method to reasonably simulate the geosynthetic–medium interaction behavior in GRS structures.
2. Numerical Modeling of Geosynthetic Pullout Tests
2.1. Geometry of Numerical Model
Pullout tests with passive reinforcement layers conducted by Zornberg et al. [23] were chosen for numerical simulations in this study considering the pullout test as one of the standard test methods to evaluate reinforcement–soil interaction. Figure 2 shows the geometry of the physical pullout box used by Zornberg et al. [23] as well as the corresponding numerical model established in this study. A woven polypropylene geotextile layer was placed as an active reinforcement, and two passive reinforcement layers with the same material were placed above and below the middle reinforcement layer, respectively. All three reinforcement layers had the same width as the pullout box in the out-of-plane direction (i.e., 0.3 m) and a thickness of 1 mm. Pullout tests were conducted at a displacement rate of 1.0 mm/min. The backfill soil used in the pullout tests was the American Association of State Highway and Transportation Officials (AASHTO) No. 8 aggregate.
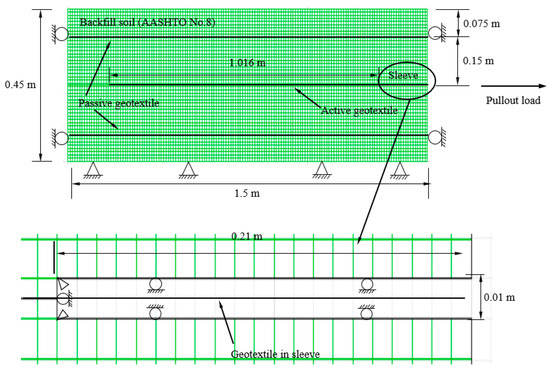
Figure 2.
Geometry of the pullout tests conducted by Zornberg et al. [23] and the corresponding numerical model established in this study.
Finite difference-based software FLAC2D developed by Itasca [24] was used in this study to simulate the pullout tests. Two numerical models using Methods I and II, respectively, were established to calibrate/assess the relationship between the parameters for these methods: (1) Method I (i.e., single spring-slider system) using “CABLE” structural elements with embedded “GROUT ANNULUS” properties and (2) Method II (i.e., double spring-slider systems) using “BEAM” structural elements combined with “INTERFACE” elements on both sides.
2.2. Constitutive Models and Properties
In both numerical models, the AASHTO No. 8 backfill soil was modeled with a linearly elastic perfectly plastic Mohr–Coulomb (MC) constitutive model. According to Morsy et al. [25], the AASHTO No. 8 backfill soil was compacted at the relative density of 70% (i.e., a dry density of 1667 kg/m3). A friction angle ϕ of 37°and a cohesion c of 15 kPa were adopted in the numerical models based on triaxial test results. According to the numerical model in PLAXIS reported by Zornberg et al. [23], the elastic modulus of 18 MPa and a Poisson’s ratio of 0.3 were used in the numerical models; also, the dilation angle ψ of 7° was recommended in this report based on the empirical relationship of ψ = ϕ − 30° recommended by Bolton [26].
The reinforcement layers in these two numerical models were modeled using different structural elements available in FLAC2D (i.e., “CABLE” and “BEAM” elements for Methods I and II, respectively). Both the “CABLE” and the “BEAM” structural elements are linearly elastic. Since the reinforcement layers used in the pullout tests were planar, both “CABLE” and “BEAM” elements were assumed to be continuous and have a width of 1 m in the out-of-plane direction. According to the physical test, the geotextile had a tensile stiffness of 1095 kN/m at a tensile strain of 2% and an ultimate tensile strength of 70 kN/m. Table 1 shows the material properties of the structural elements used in the numerical modeling.

Table 1.
Input parameters for structural elements used to simulate geotextile layers in the numerical modeling of pullout tests.
2.3. Interfaces
For Method I using “CABLE” elements to simulate the geotextile, the interaction between the geotextile and the surrounding AASHTO No. 8 backfill soil was simulated by the embedded “GROUT ANNULUS” around the “CABLE” elements. For Method II using the “BEAM” element, on the other hand, the interaction between the geotextile and the surrounding AASHTO No. 8 backfill soil was simulated by Coulomb sliding “INTERFACE” elements assigned to both upper and lower sides of each “BEAM” element. It should be noted that two “INTERFACES” were assigned to each “BEAM” element while one “GROUT ANNULUS” was embedded around each “CABLE” element. As a result, the input interface parameters for Methods I and II were different. To fairly compare their numerical results using different interaction simulation methods, it is necessary to develop an equivalent method for converting the interface parameters for one Method into those for another.
The benefits of the reinforcement in the improved performance of GRS structures, such as the increased confining stresses [27] or the increased apparent cohesion [28], depend on the reinforcement–soil interaction. In numerical modeling, reinforcement–soil interaction generates shear forces at their interfaces, which contribute to axial forces in the reinforcement. Therefore, equivalency of interface parameters should be based on the same interface shear forces computed by different interaction simulation methods. Specifically, the equivalency of the interface parameters between two methods should produce the same mobilized interface shear force and the same ultimate interface shear strength under ultimate and serviceability limits.
According to the manual of FLAC2D, the total mobilized shear force in the “GROUT ANNULUS” per length around the “CABLE” element Fc (N/m) can be expressed as:
where Kgrout (N/m/m) is the shear stiffness of the “GROUT ANNULUS” and Δuc (m) is the relative shear displacement between the “CABLE” element and the surrounding solid grids.
The mobilized shear force at each “INTERFACE” per length around the “BEAM” element Fb (N/m) can be expressed as:
where ks (Pa/m) is the shear stiffness of the “INTERFACE”; Δub (m) is the relative shear displacement between the “BEAM” element and the surrounding solid grids; w (m) is the width of the “INTERFACE” in the out-of-plane direction (w = 1 m in this study).
As mentioned previously, when the “BEAM” element was used to model the geotextile reinforcement, two “INTERFACES” needed to be assigned to both the upper and the lower sides of the “BEAM” element to simulate the reinforcement–soil interaction. As a result, shear forces developed in both the upper and the lower “INTERFACES”. Due to the symmetry of the geometry and the load applied to the active geotextile layer, the relative shear displacement between the upper side of the “BEAM” element and the surrounding solid grids was the same as that between the lower side of the “BEAM” element and the surrounding solid grids (i.e., Δub,u = Δub,l = Δub). Consequently, the shear force in the upper “INTERFACE” equaled that in the lower “INTERFACE” (i.e., Fb,u = Fb,l = Fb). Therefore, the total mobilized shear force per length on the “BEAM” element was twice the shear force in each “INTERFACE”.
Based on the principle of the same mobilized interface shear force under the serviceability condition, Equation (3) should be satisfied:
Substituting Equations (1) and (2) into Equation (3) and assuming the same relative shear displacement at the reinforcement–soil interface (i.e., Δuc = Δub) led to the following relationship between Kg,bond and ks from different interaction simulation methods:
It should be noted that Equation (4) was derived based on the assumption that the same interface relative shear displacements occurred at the upper and lower sides of the “BEAM” element (Δub,u = Δub,l) under the symmetry condition of the pullout test. However, under an asymmetrical condition, Method II (i.e., “BEAM” structural elements combined with two “INTERFACES”) allows different Δub,u and Δub,l, therefore, Equation (4) may not be accurate and requires further investigation.
In FLAC2D, the ultimate interface shear strength between a reinforcement and soil is controlled by the Mohr–Coulomb failure criterion. The maximum shear force Fmax,c in the “GROUT ANNULUS” per length of the “CABLE” element can be determined by the following equation:
where Sbond (N/m) is the cohesion of the “GROUT ANNULUS”; P (m) is the exposed perimeter of the “CABLE” element; σn (Pa) is the normal stress acting on the structural element; and δi,c (°) is the friction angle of the “GROUT ANNULUS”.
The maximum shear force Fmax,b in each “INTERFACE” per unit length around the “BEAM” element can be expressed as follows:
where ci,b (Pa) and δi,b (°) are the cohesion and the friction angle of the “INTERFACE” between the “BEAM” element and the surrounding solid grids, respectively; other symbols have been defined previously.
Similar to the above discussion, the total shear strength per unit length of the “BEAM” element was twice the shear strength in each “INTERFACE”. Based on the principle of the same ultimate interface shear strength, Equation (7) should be satisfied:
Substituting Equations (5) and (6) into Equation (7) leads to the following equation:
Since the thickness of the geotextile reinforcement was negligible as compared to its out-of-plane width, it was neglected when the exposed perimeter of the reinforcement was calculated as shown in Equation (9). It should be noted that Equation (9) was also used in Table 1 to determine the parameter for the “CABLE” element.
P = 2w
Substituting Equation (9) into Equation (8) leads to the relationship between the interface shear strength parameters for these two interaction simulation methods as follows:
where cint (Pa) and δint (°) are the cohesion and the friction angle of the reinforcement–soil interface, respectively.
In the numerical simulations of the geosynthetic pullout tests, the shear strength parameters for the geotextile–AASHTO No. 8 interface (i.e., reinforcement–soil interface) were determined based on the pullout test results from Zornberg et al. [23]. The cohesion and the friction angle of the geotextile–AASHTO No. 8 interface were cint = 0 kPa and δint = 29.3°, respectively. These interface strength parameters were directly used as the input parameters in Method II (i.e., ci,b and δi,b) due to the same principle of determining the interface strength parameters from pullout test results as that used in Method II. On the other hand, the interface strength parameters used in Method I were converted from those in Method II using Equations (10) and (11). The normal and shear stiffness of the “INTERFACE” used in Method II were calibrated from the pullout test results and the shear stiffness of the “GROUT ANNULUS” used in Method I were calculated using Equation (4). Table 2 shows the input interface parameters for these two interaction simulation methods used in the numerical modeling of the pullout tests.

Table 2.
Input interface parameters for different interaction simulation methods used in the numerical modeling of the pullout tests.
2.4. Modeling Procedure
In Method I, the numerical model was fixed in both horizontal and vertical directions at the bottom but in the horizontal direction only on the left and right boundaries as shown Figure 2. Firstly, the solid grids simulating the AASHTO No. 8 backfill soil in the bottom layer with a thickness of 0.025 m were activated, and the model was solved to elastic equilibrium. Then, in order to simulate the actual compaction preparation procedure in the pullout tests, an 8-kPa uniform vertical stress was applied and removed. The above steps of activating the solid grids layer, applying loads, and unloading were repeated in sequence until the entire model was constructed. The bottom and top layers had a thickness of 0.025 m, and the other eight layers had a thickness of 0.05 m. When the compaction of second, fifth, and eighth layers was completed, the “CABLE” structural elements were activated at the corresponding height. Also, the “GROUT ANNULUS” around the “CABLE” elements were activated to simulate the reinforcement–soil interaction at the same time. The sleeve in the pull-out test was simulated by setting constraints at defects where there were no solid grids in the middle height of the model (Figure 2). The sleeve in the pullout box had a length of 0.21 m and a height of 0.05 m. The sleeve was fixed to the grid boundaries above and below and in the horizontal direction at its left end. An additional section of “CABLE” elements was arranged at the middle height of the sleeve and the node at its left ends was connected with the rightmost node of the active geotextile embedded in the model. All nodes of the additional “CABLE” elements within the sleeve were fixed in the vertical direction to avoid vertical displacement. After that, a normal stress was applied on the top boundary of the numerical model and then equilibrium was solved. The pullout load was simulated by assigning a constant horizontal velocity to the free (rightmost) node of the additional “CABLE” elements in the middle of the sleeve. As designed in the tests, the constant horizontal velocity of the node was 1 mm/min. Then, the model ran 42,000 cycles, and during this process, the node displacement and the pullout load in the rightmost additional “CABLE” element were monitored.
The modeling procedure of Method II was similar to Method I. Their difference lies in the fact that “BEAM” elements instead of “CABLE” elements were used in Method II to simulate the active and passive geotextile layers embedded in the AASHTO No. 8 backfill soil. Due to the application of “BEAM” elements, the soil grids on both upper and lower sides of the geotextile did not directly contact each other, but interacted with adjacent “BEAM” elements through “INTERFACES”. Similarly, an additional “BEAM” structural element was placed in the middle height of the sleeve for the application of a pullout load. And the fix and pullout rate were all the same as that in Method I.
2.5. Numerical Results and Comparison
Figure 3 shows the comparison of the pullout load–front displacement curves from Zornberg et al. [23] and the numerical results obtained using Methods I and II, respectively. For the convenience of comparison, error bars with an error rate of 10% were also plotted for the tests results. Figure 3 shows that the results of both numerical methods were all within 10% error or slightly exceeding the error range of the test results. It means that both numerical methods could reasonably predict the pullout responses of the geotextile layer embedded in the AASHTO No. 8 backfill soil although deviations existed between the numerical results and the test results. Figure 3 shows that the numerically predicted pullout loads matched well with the test results under different normal stresses when the front displacements were small and the interface shear stresses were lower than the shear strength. When the interface shear stresses got close to the shear strength, Figure 3c shows that the pullout loads predicted by both Methods I and II were slightly higher than the test results under the normal stress of 35 kPa, and the errors of numerical model significantly exceeded 10% of the test results. However, this difference was still within an acceptable range of errors for numerical investigation.
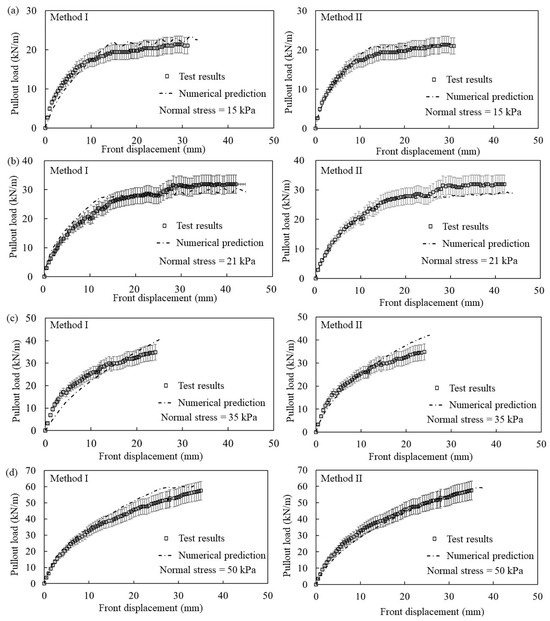
Figure 3.
Comparison of the pullout load–front displacement curves between the test results and the numerical predictions under applied normal stresses of: (a) 15 kPa, (b) 21 kPa, (c) 35 kPa, and (d) 50 kPa.
The comparison between the numerical predictions and the test results in Figure 3 proves both interaction simulation methods (i.e., Methods I and II) are suitable for simulating pullout tests of geosynthetics in soil. In addition, the proposed equivalent method for the conversion of interface parameters shown in Equations (4) and (11) is appropriate. In other words, the reinforcement–soil interaction in pullout tests could be reasonably predicted in FLAC2D using either the “CABLE” structural elements with embedded “GROUT ANNULUS” properties or the “BEAM” structural elements combined with “INTERFACES”.
2.6. Numerical Modeling of Geosynthetic-Block Connection Tests
In the above models, the reinforcement–soil interface had no cohesion. However, the interface between reinforcement and the surrounding medium in GRS structure sometimes has initial cohesion, e.g., reinforcement between facing blocks in a GRS abutment. Geosynthetic–block connection tests conducted by Awad and Tanyu [29] were chosen in this study, in order to further evaluate the performance of the two simulation methods when the interface had cohesion. The geometric characteristics of the test, the material properties, interface parameters and other information used in the simulation are summarized in Table 3. Also, two models using Methods I and II, respectively, were considered.

Table 3.
Geometry, material properties, and interface parameters of geosynthetic connection tests.
Figure 4 shows the comparison of the pullout load–front displacement curves from test and by the numerical simulations using Methods I and II, respectively. According to the range indicated by the error bar with a 10% error rate, the errors between the simulation results of both methods and the tests results were less than 10% or slightly exceeding the error range. It indicates that both numerical models could reasonably predict the pullout responses of the geotextile layer embedded between two concrete facing blocks. The comparison in Figure 4 also proves that the proposed equivalent method for the interface cohesion conversion in Equation (10) is valid.
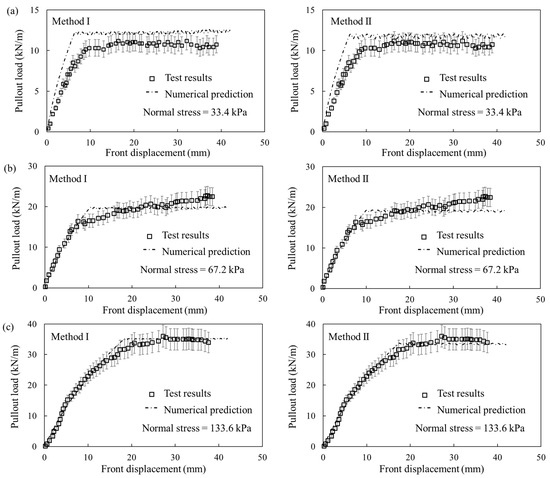
Figure 4.
Comparison of the pullout load–front displacement curves between geosynthetic–block connection test results and numerical predictions under applied normal stresses of: (a) 33.4 kPa, (b) 67.2 kPa, and (c) 133.6 kPa.
In conclusion, both interaction simulation methods are suitable for simulating the reinforcement–medium (i.e., soil or blocks) interaction with or without interface cohesion under pullout action. These interaction simulation methods as well as the proposed equivalent method for the interface parameter convention were further assessed in terms of the predicted performance of GRS structures.
3. Numerical Modeling of Direct Shear Tests of Geosynthetic-Sand Interface
3.1. Geometry of Numerical Model
In GRS structures, geosynthetic reinforcement is not only in pullout resistance state, but also in shear resistance state. It is important to assess the interaction simulation methods for shear properties of geosynthetic–sand interface. For this purpose, direct shear tests of geosynthetic–sand interface conducted by Liu et al. [30] were chosen in this study. Figure 5 shows the geometry of the direct shear test apparatus as well as the corresponding numerical model. Both upper and lower shear boxes were filled with Ottawa sand. A geogrid was placed between two shear boxes and fixed to the lower box. A vertical load was applied onto the top of the upper shear box and a constant shear displacement rate of 1 mm/min load was applied to the vertical boundary of the upper shear box.
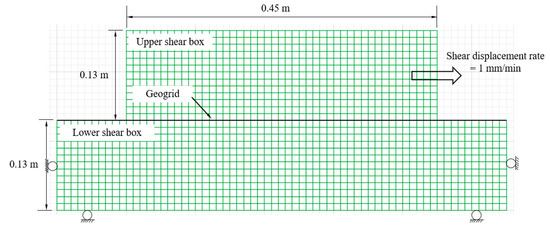
Figure 5.
Geometry of the direct shear tests conducted by Liu et al. [30] and the corresponding numerical model in this study.
Also, Method I using “CABLE” structural elements with embedded “GROUT ANNULUS” and Method II using “BEAM” structural elements combined with “INTERFACES” on both sides were established.
3.2. Constitutive Models and Properties
In both numerical models, the Ottawa sand was modeled with a linearly elastic perfectly plastic Mohr–Coulomb (MC) constitutive model. According to Liu et al. [30], the Ottawa sand was compacted at the relative density of 80% (i.e., a dry density of 1667 kg/m3). An elastic modulus of 20 MPa and a Poisson’s ratio of 0.3 were used in the numerical models based on typical values as well as numerical calibration. A friction angle ϕ of 38.4°and a cohesion c of 0 kPa were adopted in the numerical models based on direct shear test of sands according to Liu et al. (2009). A dilation angle ψ of 8° was used based on the empirical relationship of ψ = ϕ − 30° recommended by Bolton [26]. Similar to previously, two numerical models used different structural elements to simulate the geogrid (i.e., “CABLE” and “BEAM” structural elements for Methods I and II, respectively). Both the “CABLE” and the “BEAM” elements were linearly elastic and assumed to be continuous in the out-of-plane direction. Table 4 shows the material properties of the structural elements used in the numerical simulations in this study.

Table 4.
Input parameters for structural elements used to simulate the geogrid in the numerical modeling of direct shear tests.
3.3. Interfaces
Interface reduction parameter for the geogrid–sand interface was 0.94 based on the direct shear test results. The cohesion and the friction angle of the geogrid–sand interface were cint = 0 kPa and δint = 36.7°, respectively. Similar to what was conducted previously in Section 2, these interface strength parameters were directly used as the input parameters in Method II (i.e., ci,b and δi,b) and were converted to the interface strength parameters used in Method I (i.e., Sbond and δi,c) utilizing Equations (10) and (11). Table 5 shows the input interface parameters for these two interaction simulation methods used in the numerical modeling.

Table 5.
Input interface parameters for different interaction simulation methods used in the numerical modeling of direct shear tests.
3.4. Modeling Procedure
In Method I, the numerical model was fixed in both horizontal and vertical directions at the bottom and fixed in the horizontal direction at the left and right boundaries as shown in Figure 5. Solid grids simulating the sand in the lower shear box were activated in three layers first and the numerical model was then solved to reach equilibrium. The “CABLE” elements simulating the geogrid and their corresponding “GROUT ANNULUS” simulating the reinforcement–sand interaction were then activated, followed by the activation of the three layers of solid grids simulating the sand in the upper shear box. A normal stress was applied on the top boundary of the upper shear box, and then equilibrium was solved. A shear force was simulated by assigning a constant horizontal velocity to the vertical boundary of the top shear box. Method II utilized the same modeling procedure as that used in Method I except that “BEAM” elements instead of “CABLE” elements were used in Method II to simulate the geogrid. “INTERFACES” were assigned to both the upper and the lower sides of the “BEAM” elements to simulate the reinforcement–sand interaction.
3.5. Numerical Results and Comparison
Figure 6 shows the comparison of the shear stress–shear displacement curves obtained from tests and the numerical simulations using Methods I and II, respectively, and errors bar with a 10% error rate of tests results are also plotted. Figure 6 shows that both numerical models could reasonably predict the shear properties of the geogrid–sand interface in general. However, at higher vertical stress levels (187 kPa), the shear stress–shear displacement curve predicted by Method I has some differences from the test values in terms of interface shear stiffness and shear strength. It indicates that although the shear failure of the reinforcement–soil interface can be reflected by both models according to the proposed equation, the simulation effect of the model using the “CABLE” element is not as satisfactory as the model using the “BEAM” element.
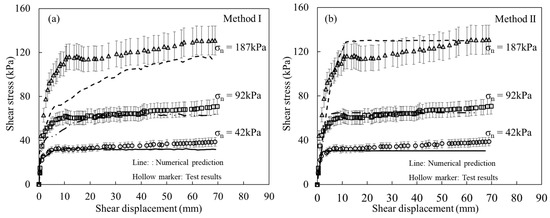
Figure 6.
Comparison of the shear stress–shear displacement curves between test results and numerical predictions under different normal stresses: (a) Method I, (b) Method II.
In conclusion, both interaction simulation methods are suitable for simulating the reinforcement–soil interaction in pullout resistance state or shear resistance state. However, the simulation effect may be different due to failure or deformation forms.
4. Numerical Modeling of Geosynthetic Reinforced Soil (GRS) Mini-Pier Tests
4.1. Geometry of Numerical Model
GRS mini-pier test is a test method developed by the Federal Highway Administration (FHWA) to investigate the load-deformation behavior of a frictionally connected GRS mass [31,32]. A GRS mini-pier is composed of multiple components, such as compacted backfill, closely spaced geosynthetic layers, and hollow Concrete Masonry Unit (CMU) facing blocks. The performance of a GRS mini-pier is significantly affected by the interaction between different components of the pier, including the reinforcement–soil interaction and the reinforcement-facing block interaction. Therefore, the GRS mini-pier test is an excellent example to assess different interaction simulation methods on the predicted performance of GRS structures. The mini-pier test TF6 conducted by Nicks et al. [31] was chosen as the prototype testing of the numerical investigation to assess different interaction simulation methods. The TF6 mini-pier was 2 m high and composed of ten layers of CMU blocks. The cross-sectional dimensions of the pier were 1.4 m × 1.4 m and 1.0 m × 1.0 m with and without the CMU blocks, respectively. The backfill soil used in the TF6 mini-pier test was Virginia Department of Transportation (VDOT) 21A aggregate. Nine layers of woven geotextile were used as reinforcement in the pier with vertical reinforcement spacing of 0.2 m. Each geotextile layer covered a 100% cross-sectional area of the pier including the CMU blocks. Frictional connection was used between geotextile layers and CMU blocks. A concrete slab with a slightly smaller cross-sectional area (0.9 m × 0.9 m) was placed on top of the pier to serve as the footing for vertical loading.
A slice of the TF6 mini-pier with a unit width in the out-of-plane direction was simulated in the 2D numerical models established in FLAC2D. Using the validated interaction simulation methods as well as the proposed equivalent method for determining the interface parameters, three numerical models were analyzed as shown in Figure 7: (1) Method I simulated all the geotextile layers using “CABLE” structural elements with embedded “GROUT ANNULUS”; (2) Method II simulated all the geotextile layers using “BEAM” structural elements combined with “INTERFACES” on both sides; and (3) Method III used different structural elements to simulate the geotextile layers at different locations, i.e., the geotextile layers embedded in the backfill soil modeled using “CABLE” structural elements with “GROUT ANNULUS” and those embedded between CMU blocks modeled using “BEAM” structural elements combined with “INTERFACES” on both sides. It should be noted that, in Method III, the leftmost and rightmost nodes of each “CABLE” element were subordinated to the nodes of the “BEAM” element at the same location.
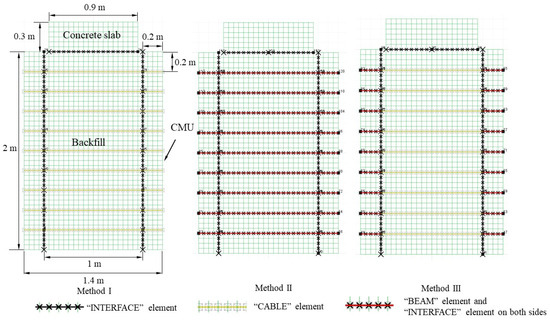
Figure 7.
Numerical meshes of the mini-pier using three different interaction simulation methods.
4.2. Constitutive Models and Properties
In all three numerical models, the backfill soil VDOT21A aggregate was modeled with the linearly elastic perfectly plastic MC constitutive model. A friction angle ϕ of 53° and a cohesion c of 5.5 kPa were adopted in the numerical model based on large-scale direct shear test results reported by Nicks et al. [31]. A dilation angle ψ of 23° was used. The VDOT21A aggregate had a density of 2500 kg/m3, an elastic modulus of 25 MPa, and a Poisson’s ratio of 0.25 based on typical values reported by Shen et al. [18].
Both the CMU blocks and the concrete slab were modeled with the linearly elastic constitutive model. The CMU blocks and the concrete slab had densities of 1230 and 2500 kg/m3, respectively, an elastic modulus of 2 GPa, and a Poisson’s ratio of 0.15 based on typical values.
Linearly elastic “CABLE” and “BEAM” structural elements were used in different numerical models as mentioned previously to simulate the geotextile layers in the TF6 mini-pier. The “CABLE” and “BEAM” structural elements used in Methods I and II had the same length of 1.4 m. In Method III, on the other hand, the “CABLE” elements embedded in the backfill soil and the “BEAM” elements embedded between the CMU blocks had lengths of 1.0 m and 0.2 m, respectively. The input parameters for the “CABLE” and “BEAM” structural elements used in the numerical simulation of the TF6 mini-pier are shown in Table 6.

Table 6.
Input parameters for structural elements used to simulate the geotextile layer in the mini-pier tests.
4.3. Interfaces
In each model, the interfaces between the reinforcement and adjacent media were simulated based on the structure unit selection plan introduced in Section 4.1. Table 7 and Table 8 summarize the interface type and the input interface parameters for the reinforcement–soil interaction and the reinforcement–block interaction, respectively, in the numerical modeling of the TF6 mini-pier. Due to lack of geotextile pullout test results in soil, the shear strength parameters for the reinforcement–soil interface were determined based on an interface interaction coefficient Ci. Goodhue et al. [33] indicated that Ci typically ranges from 0.5 to 0.9 and the cohesion of the soil should be ignored. In this study, interface interaction coefficients Ci of 0 and 0.6 were assigned to the interface cohesion and the interface friction angle of the reinforcement–soil interface, respectively. Therefore, the interface cohesion equaled to cint = Ci · c = 0 × 5.5 = 0 kPa and the interface friction angle equaled to δint = arctan (Ci·tan ϕ) = arctan (0.6·tan 53°) = 38.5°. These two interface shear strength parameters were directly used as the input parameters in Method II (i.e., ci,b and δi,b) and used to convert the interface shear strength parameters in Methods I and III using the proposed equivalent method as discussed previously.

Table 7.
Input interface parameters for the reinforcement–soil interaction used in the numerical modeling of the TF6 mini-pier.

Table 8.
Input interface parameters for the reinforcement–block interaction used in the numerical modeling of the TF6 mini-pier.
In addition to the reinforcement–soil interaction and the reinforcement–block interaction, all three numerical models included interactions between other components, such as the soil–block interaction and the soil–concrete slab interaction. Coulomb sliding “INTERFACES” embedded in FLAC2D were used for the interfaces between these components to simulate the corresponding interactions. Table 9 shows the input interface parameters for the soil–block interaction and the soil–concrete slab interaction in the numerical modeling of the TF6 mini-pier. Different interface interaction coefficients from the literature were also used to determine the interface shear strength parameters.

Table 9.
Input interface parameters for the soil–block interaction and the soil–concrete slab interaction used in the numerical modeling of the TF6 mini-pier.
4.4. Modeling Procedure
The numerical model of the TF6 mini-pier was activated, and an 8-kPa uniform vertical stress was applied layer by layer (layer thickness is 0.2 m) in sequence to simulate compaction. Structural elements simulating the geotextile layers were activated at certain heights according to the reinforcement layout with the activation of the solid grids simulating the VDOT21A aggregate backfill soil and the CMU blocks. Different interaction simulation methods were used to simulate the interactions between different components as discussed earlier for different models. After the construction of the mini-pier was completed, solid grids simulating the concrete slab were activated on top of the pier and the corresponding soil–concrete slab interaction was simulated by activating the “INTERFACE” on top of the pier. A vertical stress was applied onto the concrete slab step by step according to the loading plan. During the construction of the pier and the subsequent loading, the boundary conditions for the numerical model were activated.
4.5. Load-Deformation Behavior of the GRS Mini-Pier under Vertical Loading
Figure 8 shows the comparison of the applied vertical stress–vertical strain curves from mini-pier tests and the numerical analyses of all three models. The vertical strain is calculated as the ratio of the average vertical displacement of the concrete slab to the pier height. For Methods I and III, the numerical predictions agreed well with the test results until the vertical stress equaled to 1500 kPa. When the vertical stress exceeded this value, Methods I and III predicted slightly smaller vertical strains as compared to the test results. For Method II, on the other hand, the numerical simulation produced significantly larger vertical strains under the same applied vertical stress as compared to the test results.
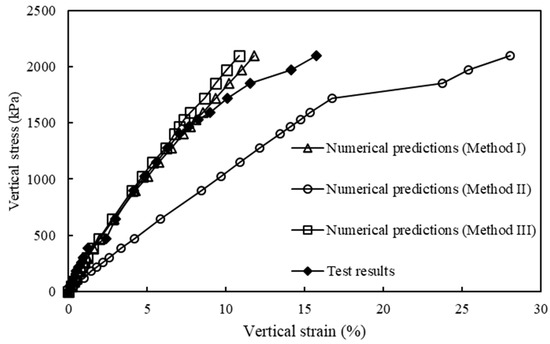
Figure 8.
Comparison of applied vertical stress–vertical strain curves between the TF6 mini-pier test results and the numerical predictions of all three models.
Figure 9 shows the comparison of the lateral displacements of CMU blocks in the TF6 mini-pier test results reported by Nicks et al. [31] and Iwamoto [37] and the numerical predictions from this study. It is obvious that the lateral displacements predicted by Method II, especially at the mid-height to the top of the pier, were significantly larger than the test results as well as those predicted by other two models. Figure 9 shows that Methods I and III predicted slightly larger lateral displacements, especially under relatively high vertical stresses (ranging from 644 kPa to 1467 kPa) as compared to the test results.
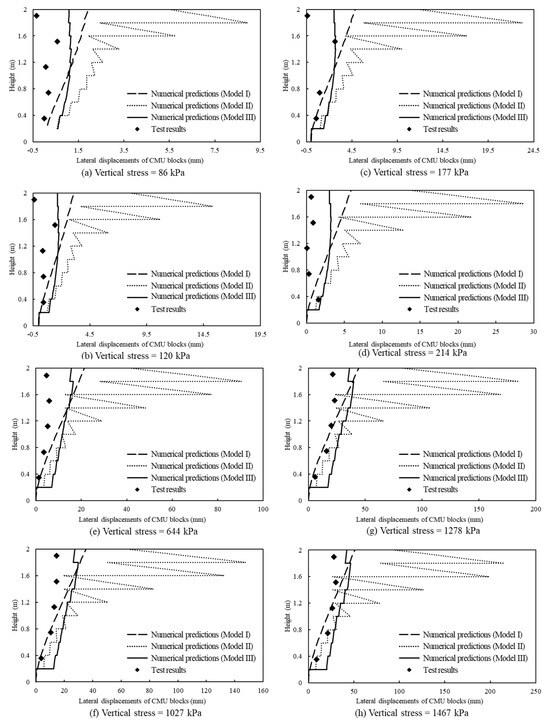
Figure 9.
Comparison of lateral displacements of CMU blocks along pier height between the TF6 mini-pier test results and the numerical predictions.
It should be pointed out that the GRS mini-pier is a three-dimensional structure and its settlement under vertical loading is compensated by lateral displacements of all four free sides. The numerical model established in FLAC2D, on the other hand, was under a plane strain condition (i.e., two-dimensional) and only two (i.e., left and right) free sides could deform under vertical loading to compensate the settlement. Therefore, under the same applied vertical stress, the lateral displacements of CMU blocks predicted by the two-dimensional numerical models were always larger than the test results. However, the main purpose of this study was to assess different numerical interaction simulation methods on the predicted performance of GRS structures. Consequently, the deviations of the numerical predictions from the test results due to different boundary conditions were deemed not important and would not affect the main conclusions of this study.
As compared to Method I, Method III produced a better and more reasonable distribution of lateral displacements of the CMU blocks along the pier height. The TF6 mini-pier test results show that the maximum lateral displacement occurred in the mid height (i.e., 1 m to 1.4 m) of the pier under relatively low vertical stresses ranging from 86 kPa to 214 kPa and moved to the upper third (i.e., 1.4 m to 1.8 m) of the pier under high vertical stresses ranging from 644 kPa to 1467 kPa. The measured locations of the maximum lateral displacements under different applied stresses were closer to the numerical predictions of Method III. On the other hand, the lateral displacements of the CMU blocks predicted by Method I increased approximately linearly with the pier height and the maximum lateral displacement always appeared at the top of the pier despite the change of the applied vertical stresses. This numerical result is not consistent with the test result. In addition, Method III produced a seesaw pattern of the lateral displacements of CMU blocks along the pier height, reflecting the relative displacements/slippages between two adjacent layers of CMU blocks. In other words, Method III was able to capture the discontinuity of the CMU blocks at different layers along the pier height. Method I, on the other hand, produced a relatively smoother curve of the lateral displacements of the CMU blocks along the pier height. The CMU blocks at different layers in Method I acted as a rigid full-height coherent body and rotated around the toe of the pier. In other words, Method I did not have the ability of allowing relative displacements between different layers of the CMU blocks as Method III.
Figure 10 shows the comparison of the volumetric strain of the pier under vertical loading between the numerical predictions and the TF6 mini-pier test results reported by Iwamoto [37]. The TF6 mini-pier test results showed that the pier was compressed under low applied vertical stresses and tended to dilate with the increase of the vertical stress. Among all three numerical models, only Method III was able to capture the volumetric behavior of the GRS mini-pier under vertical loading. Methods I and II, on the other hand, could not reasonably predict the volumetric increase of the GRS mini-pier under high applied vertical stresses.
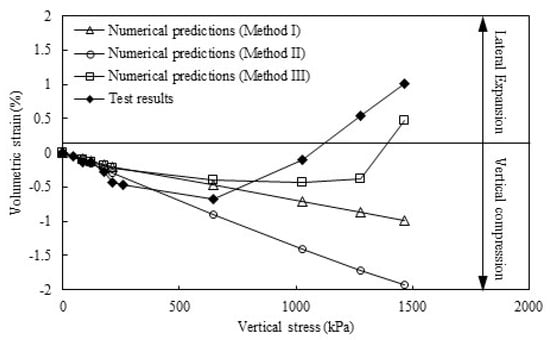
Figure 10.
Comparison of the volumetric strain of the mini-pier between the TF6 mini-pier test results and the numerical predictions.
In conclusion, it was not suitable to use Method II (i.e., “BEAM” structural elements combined with “INTERFACES” on both sides) to predict the load-deformation behavior of the GRS mini-pier under vertical loading since Method II predicted significantly larger settlement and lateral displacements of the pier as compared to the test results. Both Methods I and III could give reasonable predictions of the load–settlement curves of the GRS mini-pier. As compared to Method I, Method III had the advantages of allowing relative displacements between different layers of the CMU blocks and hence had better and more reasonable predictions of both the lateral displacements along the pier height and the volumetric change of the pier under vertical loading.
5. Discussion
The “CABLE” structural elements with embedded “GROUT ANNULUS” utilizes the single spring-slider system and assumes the same displacement at different sides of the reinforcement–medium interface. This method is appropriate to simulate the pullout failure mode of reinforcement embedded in the surrounding medium (i.e., interface shear resistance occurred on both sides of the reinforcement), but not appropriate to simulate the shear failure mode of the reinforcement–medium interface in which relative displacement at different sides of the reinforcement–medium interface is allowed. In this case, the “BEAM” element combined with “INTERFACE” elements on both sides is appropriate to simulate reinforcement in interface shear failure mode due to the fact that it allows different deformation to occur at different sides of the reinforcement–medium interface. And hence, in Section 2, whether “CABLE” elements or “BEAM” elements were used, it can give reasonable simulation results for the pullout test of geosynthetics. However, the results of Section 3 show that when interface shear failure mode dominates, the simulation performance of “BEAM” elements is better than that of “CABLE” elements.
Also, the selection of the interface should also match the actual working and boundary conditions. In the mini-pier test, the vertical boundary of the backfill soil has no horizontal constraint, which is different from the horizontally constrained vertical boundary in the pullout test. In this case, although the reinforcements embedded in backfill soil were in pullout resistance, the “BEAM” element utilizing the double spring-slider systems cannot guarantee the same displacement at different sides of the reinforcement–soil interface. And “CABLE” structural elements with embedded “GROUT ANNULUS” is a better method to simulate the reinforcements in backfill soil. Hence, in the mini-pier test, the numerical results show that the “BEAM” element combined with “INTERFACE” elements on both sides cannot simulate the reinforcement embedded in the backfill soil correctly (Method II).
Therefore, it can be concluded that to accurately simulate the reinforcement and corresponding interface, the type of structural element should be selected according to its failure mode in structure. Some numerical simulation-related investigations followed this approach and have achieved ideal simulation results. For example, during the numerical modeling process of GRS abutment or GRS wall, Method II is often applied to simulate the interaction between geosynthetic and adjacent-facing blocks. Meanwhile, Method I is used to simulate the interaction of buried geosynthetic with the backfill [16,17,19,38,39]. The above discussion of this study also has its limitations and is usually applicable to the simulation of GRS structures that are subject to small deformations. When the vertical deformation of the surrounding medium of geosynthetic is significant, resulting in deformation of the geosynthetic in the vertical direction, Method II has been studied as a more suitable method in most cases by some previous research [20]. In addition, for situations where shear deformation on the interface is limited, such as plate loading tests, the applicability of interface simulation methods still needs to be studied [40,41].
6. Conclusions
This study adopted two-dimensional numerical simulations to assess different interface interaction simulation methods on the predicted performance of geosynthetic pullout tests, interface direct shear tests, and geosynthetic-reinforced soil (GRS) mini-pier tests. Based on the numerical results and the comparisons with test results, the following conclusions could be drawn:
- (1)
- The single spring-slider system simulation method is appropriate to simulate the pullout failure mode of reinforcement–surrounding medium interface. The double spring-slider systems simulation method is appropriate to simulate the interface shear failure mode.
- (2)
- For the pullout failure mode of reinforcement embedded in surrounding medium, e.g., pullout in soil, pullout between blocks and reinforcements embedded in backfill in a GRS pier, the data obtained from the single spring-slider system simulation are in good agreement with the measured value. Although with poor accuracy, the double spring-slider systems can also be used when there is a boundary constraint in the direction where pullout failure develops in. Otherwise, the simulation result obtained from the double spring-slider systems has a great error.
- (3)
- When interface shear failure mode dominates, e.g., direct shear of geosynthetic–sand interface and reinforcements between blocks in a GRS pier, the simulation results obtained by the double spring-slider systems method are in good agreement with the measured data. However, the single spring-slider system method is not applicable to simulate the interface shear failure mode.
- (4)
- In a GRS structure, the interface between geosynthetic reinforcement and medium may be in different failure modes because of the location of reinforcement (e.g., embedded in backfill soil and between facing blocks). For interfaces with different failure modes, different simulation methods have significant influence on the results. Numerical simulation shows that using a single method to simulate the interface with different failure modes cannot obtain results consistent with the laboratory results. Simulation methods should be selected carefully in order to obtain reliable and reasonable predictions.
Author Contributions
Conceptualization, C.Z.; Methodology, C.Z.; Software, C.Z. and G.L.; Validation, P.S. and Q.W.; Resources, C.X.; Writing—original draft, C.Z.; Writing—review and editing, C.X., P.S., G.L. and Q.W.; Funding acquisition, C.X. and P.S. All authors have read and agreed to the published version of the manuscript.
Funding
This study was financially supported by the National Natural Science Foundation of China (Grant No. 42002270) and the National Natural Science Foundation of China under (Grant No. 41772284). The authors would like to appreciate this support.
Data Availability Statement
The data presented in this study are available on request from the corresponding author. The data are not publicly available due to our laboratory’s requirements.
Conflicts of Interest
Author Panpan Shen was employed by the company Shanghai Investigation, Design & Research Institute Co., Ltd. The remaining authors declare that the research was conducted in the absence of any commercial or financial relationships that could be construed as a potential conflict of interest.
References
- Jotisankasa, A.; Rurgchaisri, N. Shear strength of interfaces between unsaturated soils and composite geotextile with polyester yarn reinforcement. Geotext. Geomembr. 2018, 46, 338–353. [Google Scholar] [CrossRef]
- Namjoo, A.M.; Jafari, K.; Toufigh, V. Effect of particle size of sand and surface properties of reinforcement on sand-geosynthetics and sand–carbon fiber polymer interface shear behavior. Transp. Geotech. 2020, 24, 100403. [Google Scholar] [CrossRef]
- Ardah, A.I.S.; Abu-Farsakh, M.; Voyiadjis, G.Z. Numerical parametric study of geosynthetic reinforced soil integrated bridge system (grs-ibs). Geotext. Geomembr. 2020, 49, 289–303. [Google Scholar] [CrossRef]
- Nunes, G.B.; Portelinha, F.H.M.; Futai, M.M.; Yoo, C. Numerical study of the impact of climate conditions on stability of geocomposite and geogrid reinforced soil walls. Geotext. Geomembr. 2022, 50, 807–824. [Google Scholar] [CrossRef]
- Abdi, M.R.; Zandieh, A.R. Experimental and numerical analysis of large scale pull out tests conducted on clays reinforced with geogrids encapsulated with coarse material. Geotext. Geomembr. 2014, 42, 494–504. [Google Scholar] [CrossRef]
- Hegde, A.; Roy, R. A Comparative Numerical Study on Soil–Geosynthetic Interactions Using Large Scale Direct Shear Test and Pullout Test. Int. J. Geosynth. Ground Eng. 2017, 4, 9–19. [Google Scholar] [CrossRef]
- Ren, F.; Huang, Q.; Liu, Q.; Wang, G. Numerical study on the pull-out behaviour of planar reinforcements with consideration of residual interfacial shear strength. Transp. Geotech. 2022, 35, 100766. [Google Scholar] [CrossRef]
- Suksiripattanapong, C.; Chinkulkijniwat, A.; Horpibulsuk, S.; Rujikiatkamjorn, C.; Tanhsutthinon, T. Numerical analysis of bearing reinforcement earth (BRE) wall. Geotext. Geomembr. 2012, 32, 28–37. [Google Scholar] [CrossRef]
- Mirmoradi, S.H.; Ehrlich, M. Modeling of the compaction-induced stress on reinforced soil walls. Geotext. Geomembr. 2015, 43, 82–88. [Google Scholar] [CrossRef]
- Cheuk, C.Y.; Ng, C.W.W.; Sun, H.W. Numerical experiments of soil nails in loose fill slopes subjected to rainfall infiltration effects. Comput. Geotech. 2005, 32, 290–303. [Google Scholar] [CrossRef]
- Hamed, J. On the behaviour of shallow foundations constructed on reinforced soil slope—A numerical analysis. Int. J. Geotech. Eng. 2017, 14, 188–195. [Google Scholar] [CrossRef]
- Ardah, A.; Abu-Farsakh, M.; Voyiadjis, G. Numerical evaluation of the performance of a Geosynthetic Reinforced Soil-Integrated Bridge System (GRS-IBS) under different loading conditions. Geotext. Geomembr. 2017, 45, 558–569. [Google Scholar] [CrossRef]
- Askari, M.; Razeghi, H.R.; Mamaghanian, J. Numerical study of geosynthetic reinforced soil bridge abutment performance under static and seismic loading considering effects of bridge deck. Geotext. Geomembr. 2021, 49, 1339–1354. [Google Scholar] [CrossRef]
- Bergado, D.T.; Teerawattanasuk, C. 2D and 3D numerical simulations of reinforced embankments on soft ground. Geotext. Geomembr. 2008, 26, 39–55. [Google Scholar] [CrossRef]
- Huang, J.; Han, J. Two-dimensional parametric study of geosynthetic-reinforced column-supported embankments by coupled hydraulic and mechanical modeling. Comput. Geotech. 2010, 37, 638–648. [Google Scholar] [CrossRef]
- Zheng, Y.; Fox, P.J. Numerical Investigation of the Geosynthetic Reinforced Soil–Integrated Bridge System under Static Loading. J. Geotech. Geoenvironmental Eng. 2017, 143, 04017008. [Google Scholar] [CrossRef]
- Zheng, Y.; Fox, P.J.; Mccartney, J.S. Numerical study on maximum reinforcement tensile forces in geosynthetic reinforced soil bridge abutments. Geotext. Geomembr. 2018, 46, 634–645. [Google Scholar] [CrossRef]
- Shen, P.; Han, J.; Zornberg, J.G.; Morsy, A.M.; Xu, C. Two and three-dimensional numerical analyses of geosynthetic-reinforced soil (GRS) piers. Geotext. Geomembr. 2019, 47, 352–368. [Google Scholar] [CrossRef]
- Shen, P.; Han, J.; Zornberg, J.G.; Tanyu, B.F.; Christopher, B.R.; Leshchinsky, D. Responses of geosynthetic-reinforced soil (GRS) abutments under bridge slab loading: Numerical investigation. Comput. Geotech. 2020, 123, 103566. [Google Scholar] [CrossRef]
- Halder, K.; Chakraborty, D. Influence of soil spatial variability on the response of strip footing on geocell-reinforced slope. Comput. Geotech. 2020, 122, 103533. [Google Scholar] [CrossRef]
- Yu, Y.; Bathurst, R.J. Influence of Selection of Soil and Interface Properties on Numerical Results of Two Soil–Geosynthetic Interaction Problems. Int. J. Geomech. 2017, 17, 04016136. [Google Scholar] [CrossRef]
- Yu, Y.; Damians, I.P.; Bathurst, R.J. Influence of choice of FLAC and PLAXIS interface models on reinforced soil–structure interactions. Comput. Geotech. 2015, 65, 164–174. [Google Scholar] [CrossRef]
- Zornberg, J.G.; Morsy, A.M.; Mofarraj, B.; Christopher, B.R.; Leshchinsky, D.; Han, J.; Tanyu, B.F.; Gebremariam, F.T.; Shen, P.; Jiang, Y. Defining the Boundary Conditions for Composite Behavior of Geosynthetic Reinforced Soil (GRS) Structures; National Cooperative Highway Research Program (NCHRP), Project; Transportation Research Board: Washington, DC, USA, 2019; Volume 24–41. [Google Scholar]
- Itasca. FLAC2D. Fast Lagrangian Analysis of Continua in 2 Dimensions, version 8.0; Itasca Consulting Group, Inc.: Minneapolis, MN, USA, 2016. [Google Scholar]
- Morsy, A.M.; Zornberg, J.G.; Han, J.; Leshchinsky, D. A new generation of soil-geosynthetic interaction experimentation. Geotext. Geomembr. 2019, 47, 459–476. [Google Scholar] [CrossRef]
- Bolton, M. The strength and dilatancy of sands. Geotechnique 1986, 36, 65–78. [Google Scholar] [CrossRef]
- Yang, Z. Strength and Deformation Characteristics of Reinforced Sand. Ph.D. Thesis, University of California, Los Angeles, CA, USA, 1972. [Google Scholar]
- Schlosser, F.; Long, N.T. Recent results in French research on reinforced earth. J. Constr. Div. 1974, 100, 223–237. [Google Scholar] [CrossRef]
- Awad, M.I.; Tanyu, B.F. Laboratory evaluation of governing mechanism of frictionally connected MSEW face and implications on design. Geotext. Geomembr. 2014, 42, 468–478. [Google Scholar] [CrossRef]
- Liu, C.; Zornberg, J.G.; Chen, T.; Ho, Y.; Lin, B. Behavior of Geogrid-Sand Interface in Direct Shear Mode. J. Geotech. Geoenvironmental Eng. 2009, 135, 1863–1871. [Google Scholar] [CrossRef]
- Nicks, J.E.; Adams, M.T.; Ooi, P.; Stabile, T. Geosynthetic Reinforced Soil Performance Testing—Axial Load Deformation Relationships; Technical Report No FHWA-HRT-13-066; Transportation Research Board: Washington, DC, USA, 2013. [Google Scholar]
- Nicks, J.E.; Esmaili, D.; Adams, M.T. Deformations of geosynthetic reinforced soil under bridge service loads. Geotext. Geomembr. 2016, 44, 641–653. [Google Scholar] [CrossRef]
- Goodhue, M.J.; Edil, T.B.; Benson, C.H. Interaction of foundry sands with geosynthetics. J. Geotech. Geoenvironmental Eng. 2001, 127, 353–362. [Google Scholar] [CrossRef]
- Hatami, K.; Bathurst, R.J. Development and verification of a numerical model for the analysis of geosynthetic-reinforced soil segmental walls under working stress conditions. Can. Geotech. J. 2005, 42, 1066–1085. [Google Scholar] [CrossRef]
- Hatami, K.; Bathurst, R.J. Numerical model for reinforced soil segmental walls under surcharge loading. J. Geotech. Geoenvironmental Eng. 2006, 132, 673–684. [Google Scholar] [CrossRef]
- Ling, H.I.; Liu, H.; Kaliakin, V.N.; Leshchinsky, D. Analyzing dynamic behavior of geosynthetic-reinforced soil retaining walls. J. Eng. Mech. 2004, 130, 911–920. [Google Scholar] [CrossRef]
- Iwamoto, M.K. Observations from Load Tests on Geosynthetic Reinforced Soil. Master’s Thesis, University of Hawaii at Manoa, Honolulu, HI, USA, 2014. [Google Scholar]
- Zhang, W.; Chen, J. Prediction of Reinforcement Connection Loads in Geosynthetic Reinforced Segmental Retaining Walls Using Response Surface Method. Appl. Sci. 2023, 13, 7239. [Google Scholar] [CrossRef]
- Zhang, W.; Chen, J.F. Numerical modeling of geosynthetic reinforced soil retaining walls with different toe restraint conditions. Geotext. Geomembr. 2023, 51, 16–29. [Google Scholar] [CrossRef]
- Reza, J.C.; Bathurst, R.J. Bearing capacity of strip footings seated on unreinforced and geosynthetic-reinforced granular layers over spatially variable soft clay deposits. J. Geotech. Geoenvironmental Eng. 2023, 149, 04023034. [Google Scholar] [CrossRef]
- Kapor, M.; Skejic, A.; Medic, S.; Balic, A. Dic assessment of foundation soil response for different reinforcement between base and soft subgrade layer-physical modeling. Geotext. Geomembr. 2023, 51, 390–404. [Google Scholar] [CrossRef]
Disclaimer/Publisher’s Note: The statements, opinions and data contained in all publications are solely those of the individual author(s) and contributor(s) and not of MDPI and/or the editor(s). MDPI and/or the editor(s) disclaim responsibility for any injury to people or property resulting from any ideas, methods, instructions or products referred to in the content. |
© 2024 by the authors. Licensee MDPI, Basel, Switzerland. This article is an open access article distributed under the terms and conditions of the Creative Commons Attribution (CC BY) license (https://creativecommons.org/licenses/by/4.0/).