Article

Infiltration Models in EnergyPlus: Empirical Assessment for a Case Study in a Seven-Story Building

by
Gabriela Bastos Porsani
1,*,
María Fernández-Vigil Iglesias
1,
Juan Bautista Echeverría Trueba
1 and
Carlos Fernández Bandera
2
1
School of Architecture, University of Navarra, 31009 Pamplona, Spain
2
School of Technology, Universidad de Extremadura, 10003 Cáceres, Spain
*
Author to whom correspondence should be addressed.
Buildings 2024, 14(2), 421; https://doi.org/10.3390/buildings14020421
Submission received: 4 January 2024 / Revised: 22 January 2024 / Accepted: 30 January 2024 / Published: 3 February 2024
(This article belongs to the Special Issue Research on Advanced Technologies Applied in Green Buildings)

Abstract

:
The current decarbonization transition to be achieved by 2050 according to the European Council has given great prominence to the use of Digital Twins as tools for energy management. For their correct operation, it is essential to control the uncertainties of the energy models, which lead to differences between the measured and predicted data. One of the key parameters that is most difficult to assess numerically is air leakage. The existent infiltration models available in EnergyPlus were developed to be applied in low-rise residential buildings with fewer than three stories. Therefore, it is common to rely on air leakage equations employing predefined coefficients. This research presents an empirical assessment of the performance of two EnergyPlus air leakage models, the “Effective Leakage Area” and the “Flow Coefficient”, in predicting dynamic infiltration within the attic of a seven-story building. Blower door tests, along with the application of CO2 tracer gas, were conducted to establish coefficients for the models. Then, they were evaluated in three independent periods according to the criteria established in the American Society for Testing Material D5157 Standard. Those models that only used in situ coefficients consistently met the standard across all three periods, demonstrating for both equations their accurate performance and reliability. For the best model derived from tracer gas data, the R2 and NMSE values are 0.94 and 0.019, respectively. In contrast, the model developed using blower door test data and EnergyPlus default values presented a 64% reduction in accuracy compared to the best one. This discrepancy could potentially lead to misleading energy estimates. Although other software options exist for estimating infiltration, this study specifically targets EnergyPlus users. Therefore, these findings offer valuable insights to make more informed decisions when implementing the infiltration models into energy simulations for high-rise buildings using EnergyPlus.

1. Introduction

The European Union has begun a transition towards decarbonization that will culminate in 2050, reaching climate neutrality [1]. Among the targets established by the European Commission to achieve this objective, improving the energy performance of buildings is essential, since they account for 40% of overall energy consumption and 36% of greenhouse gas (GHG) emissions produced in Europe [2]. This change from fossil fuels to zero or nearly zero carbon emissions requires an accurate quantification and reduction of buildings’ energy demand, both in new and retrofit projects.
In this context, one useful tool for estimating loads and for understanding the electrical and thermal behavior of a building is the “Digital Twin” (DT) [3]. Digital Twin is a term referring to a virtual model that replicates a physical object or system, and the data network between them. Among other uses, it allows managing the whole life-cycle of the represented object [4]. Over the last few years, Digital Twins have been successfully used for the assessment of decarbonization strategies of buildings, cities, and other carbon emission contributors [5,6]. Some examples are the research developed by Kaewunruen et al. [7], who employed a DT to evaluate how to incorporate renewable energies into existing buildings to move them towards being Net Zero Energy Buildings (NZEB). Qian et al. [8] studied, with a significant level of precision, historic dwellings’ carbon emissions through an intelligent Digital Twin platform. This quantification is essential to analyze the decarbonization potential of different retrofit strategies. Zaidi and Haw [9] created a DT of the building sector in Bertam, a Malaysian city, with the objective of estimating its energy consumption and comparing several design strategies to address carbon reduction and energy savings.
Among other applications, DTs are used during the functioning phase of a building for facilities and maintenance management, logistics processes, monitoring, and energy simulation [10]. For that last purpose, the Digital Twin may have an incorporated Building Energy Model (BEM) capable of performing instantaneous energy simulations using real-time monitored data inputs delivered by the Building Management System (BMS). The complex nature of buildings as well as the multitude of interacting independent variables mean that there may be a difference between the simulated data delivered by the BEM and the real measured data [11]. “Building Energy Performance Gap” (BEPG) is the term used to refer to that difference [12]. To reduce this error, the model can be subjected to a calibration process [11], which consists of adjusting some of the model’s parameters involved to those present in the actual building.

1.1. Calibration Methodology

The calibration methodology for building envelopes developed by Ramos et al. [13] and improved by Fernández et al. [14] in one study and by Gutiérrez et al. [15] in another one is an inverse modeling approach. This means that under the guidelines of the American Society of Heating, Refrigerating and Air-Conditioning Engineers (ASHRAE), certain or all parameters are derived through in situ measurements [16]. The methodology is based on a white-box model; in other words, it relies on a transparent and detailed representation of the physical characteristics of the building, with a physics-based equations approach.
The novelty of this calibration process is the reduced number of parameters used to adjust the simulated data curve to align with the curve of the measured data, focusing solely on four key parameters: thermal mass, capacitance, thermal bridges, and infiltration [15]. The building’s construction specifications are integrated into the model, according to the technical documentation available, which constitutes the baseline BEM. Following this, the calibration process begins to identify the optimal set of parameters. EnergyPlus 9.2 serves as the simulation engine and the calibration tool is executed using JePlus + EA 1.4 software [17] using the Non-Dominated Sorting Genetic Algorithm (NSGA-II) [18]. This adjustment process was demonstrated to be simple and cost-effective, compared to previous studies [13,14].
The possible differences between the reality and the virtual model are absorbed by the four variables analyzed in the calibration process. Both the capacitance and the thermal mass are considered black-box parameters: frequently, they lack physical meaning since the values introduced into the algorithm are unrestricted. On the other hand, for thermal bridges and infiltration, the authors set a range of values within which they can oscillate [15].
This novel approach has effectively minimized uncertainties about the required number of variables for calibrating building envelopes. Additionally, it has addressed the influence of input data, also considering the impact of solar radiation in dynamic building simulations [19] and the weather forecasts [20]. Despite these achievements, there are still some questions to be resolved, particularly those regarding the interpretation of the air infiltration values and the thermal inertia [21]. The present study is a step towards obtaining infiltration values adjusted to reality, which will possibly allow for an even more efficient calibration process to be carried out in EnergyPlus.

1.2. Literature Review

Airtightness is recognized as a key indicator of both the quality and energy efficiency of buildings and air leakage values represent crucial data to be implemented into BEMs. However, the physical forces behind infiltration are really complex, making it a challenging parameter to measure due to its dependence on a high number of variables. Some of the factors that must be considered for estimating air leakage are the topography, wind direction and speed, outdoor and indoor temperatures, location and dimensions of openings, local climate, and seasonal fluctuations [22,23]. This great complexity surrounding the air leakage values leads modelers to often use default values [21,24] provided by simulation tools, or to solely focus on infiltration through window frames [25], ignoring other sources of leakage such as unintentional openings, cracks, regular use of exterior doors [16], or the joints between floors, ceilings, and walls [26].
Despite these difficulties, air leakage has been demonstrated to be an important parameter to be considered for a high-quality calibration [27]. The airflow across the building’s envelope plays a crucial role in determining the usage of heating or cooling energy, and can significantly affect the BEM’s precision and highly impact the estimated energy consumption, leading to an increase in the BEPG [28]. Some modeling investigations indicate that infiltration could be responsible for 15–45% of annual space conditioning demand, with variations based on the building type [23,29]. The study of Feijó-Muñoz et al. [30] showed that air leakage may account for 2.43 to 16.44 kWh/m2year of heating loads. Additionally, air infiltration calculation methods can be derived in higher or lower energy demand [31]. Happle et al. have found that using an Equilibrium Pressure Model (EPM) calculation with dynamic values of infiltration rate, which depend on wind pressures and air temperatures, can reduce the annual heating demand, in comparison to using a Simple Infiltration Model (SIM) calculation with static values of infiltration rate [32].
There are several approaches to calculate infiltration, from empirical to theoretical methods. The empirical methods include pressurization test data, the assessment of individual components, and the statistical characterization of a built environment [33]. Theoretical approaches encompass airflow models, in one or more zones, along with computational fluid dynamics (CFD). The latter is the most accurate method but also requires more resources and computing time [34]. One example of applying a CFD tool for the estimation of the wind pressure coefficient is observed in Han et al.’s research [28]. The calculated coefficient and the multi-zone airflow modeling were introduced into the EnergyPlus environment, producing more accurate results. However, as stated by Choi et al. [35], CFD calculations are deemed more suitable for simulating large areas than for tall buildings, with multiple vertical spaces and voids. Also, since it is a very sophisticated and complex method, requiring high computational times, it is common that modelers use a simplified approach to estimate the air change rate.
Over the last decades, several methods have been devised for the estimation of infiltration considering different variables: the BRE model, developed by Warren and Webb in the UK in 1980 [36], and the LBL, created in the USA in 1980 by Sherman and Grimsrud [37], are based on fan pressurization tests. The NRC model was formulated by Shaw in Canada in 1985, where the researcher calculated the rates of stack and wind flow by applying coefficients tailored to monitored data obtained from a unique case study. Another model is the one developed by Walker and Wilson in 1998, the AIM-2 model, which introduces new concepts such as the power law envelope leakage, the fireplace flue, or the differences between crawlspaces, basements, and slab-on-grade [38].
At this stage, it is noteworthy that, as is commonly known by the scientific community, there are programs like CONTAM or FLUENT that allow the creation of detailed and rigorous airflow simulations. Nevertheless, the present research is focused on the simulation tool EnergyPlus, and despite the improvements in recent years, there are currently some difficulties in coupling it with the aforementioned programs [39]. Some of the challenges include the necessity to ensure the system synchronization of both software programs, the important increase in computational loads, and the demanding validation that requires field data. These models have not yet gained widespread adoption in the industry, and consequently, modelers still use the existing simplified empirical or theoretical approaches [23].
EnergyPlus has different infiltration models, and it is essential to comprehensively grasp their limitations and their potential impact on results. The study of Bae et al. [40] demonstrated that the selected EnergyPlus infiltration model significantly impacts both the estimated infiltration rate and the predicted heating energy consumption. Among the options offered by EnergyPlus to address precise air leakage values, one is the Hybrid Object, which is based on measured temperature. The main issue posed by this method is that the object needs at least seven days without using the HVAC system, which is not always possible [41,42]. EnergyPlus also has the AirFlowNetwork model (AFN), which is an advanced infiltration and mixing calculation, capable of simulating wind-driven airflows in multi-zone environments and modeling the effects of forced air distribution systems [43,44]. AFN is a detailed but complex approach; an example can be found in the study performed by McLeod et al. [45], who modeled a flat in EnergyPlus using AFN and different infiltration scenarios to understand the airflow pathways in the prediction of interior temperatures. The outcomes indicated that predicted data were very sensitive to how the AFN model was set. Similarly, Monari et al. [46] defend that conducting a sensitivity analysis at a detailed level is necessary to take into account some highly uncertain parameters (wind directions, airflow pathways, moisture flow, and convective heat transfer, among others), particularly when the analysis aims to perform a calibration of a BEM.
Moreover, EnergyPlus has three airflow models to calculate infiltration, namely: ZoneInfiltration: DesignFlowRate, ZoneInfiltration: FlowCoefficient (hereafter denoted as IFC), and ZoneInfiltration: EffectiveLeakageArea (ELA) [44]. The correct use of these models relies on the use of the appropriate coefficients for each case of study, considering that they were developed from research in low-rise residential buildings, that is, lower than three stories according to ASHRAE [16,47]. Frequently, the modeling practitioners use constant values from regulations or existing field tests, since establishing the correct values of the coefficients for a specific building is a complex process [47]. Both the IFC and the ELA models calculate the airflow resulting from wind and air buoyancy differences independently. Then, they are merged through a simple quadrature superposition [23,38,48]. However, these models were developed for small structures featuring a solitary, well-mixed zone and minimal internal resistance to airflow.
Several variables cause uncertainty in EnergyPlus infiltration models; the building leakage distribution, the envelope properties, and the wind speed are some of them [49,50]. Measurement of the infiltration parameters is the best approach to introducing consistent data into the BEM environment. For experimentally measuring the infiltration rate on-site, two primary methods are employed [16]:
  • The blower door test, which gives an average infiltration value after the building has undergone pressurization and depressurization with high-pressure differences between indoor and outdoor (e.g., 10 to 300 Pa) [51].
  • Tracer gas experiments that can determine the air change rate without necessarily requiring knowledge of the airflow pathways [52]. The experiment consists of introducing a tracer gas, for example, CO 2 , into space at normal conditions (e.g., 3–4 Pa) and can be performed using one of the following three methods: constant concentration, constant injection, and decay. In the last one, the decay equation can be used for the calculation of the infiltration value [16].
There are several examples in the literature where one or both of these methods are applied. The study by Roberti et al. [53] applied the two tests to measure infiltration in a historic building. They found that air infiltration predominantly contributed to the hourly fluctuations and daily peaks in indoor air temperature. Taddeo et al. [54] used the decay method and a blower door to compare the results of air change rate, and they concluded that both experiments produced similar constant values. There are also several studies that apply the EnergyPlus infiltration models, such as the research performed by Shrestha et al. [51], where the infiltration rate of eight one-story case studies was analyzed with two different approaches: using a tracer gas test under standard performing conditions and flow coefficients from a blower door test with the IFC model provided by EnergyPlus. The first one produced more accurately forecasted values. Bae et al. [40] studied the behavior of the three EnergyPlus infiltration models in a two-story research platform, using different coefficients: those derived from the blower door experiment, those found in the literature, and the regression coefficients. After the analysis, the authors stated that the regression coefficients might not be reliable if applied to different weather data, for example, another season with different climate conditions. Furthermore, Gutiérrez et al.’s [15] calibration methodology for BEMs applies the ELA model in two distinct three-story single-family houses. They dynamically adjusted the leakage area based on outdoor conditions (exterior temperature, wind speed, and wind direction). However, the authors did not validate the estimated air leakage area and infiltration rate with actual measurements.
Although, as discussed in this section, several studies apply the EnergyPlus infiltration models (IFC and ELA), there is no literature on their use in high-rise buildings, where the behavior of the airflow is particularly difficult to predict [45]. A common phenomenon that occurs in multi-family and tall residential buildings is that the external wind pressure and stack effect create complex airflow paths, which lead to indoor air problems inside the dwellings [55]. Prior to the present research, an analysis was conducted in an attic located in a seven-story building to obtain the coefficients of the DesignFlowRate model, applying a blower door test and a tracer gas experiment [56]. This study replicates the successful methodology for achieving the coefficients, aiming to verify whether it applies to the equations of the remaining models: ZoneInfiltration: FlowCoefficient (IFC) and ZoneInfiltration: EffectiveLeakageArea (ELA).

1.3. Originality of the Research

As detailed in Section 1.2, the quantification of dynamic infiltration, particularly in high-rise buildings, is a big challenge for modelers. The present research is a step forward in the process of bringing together in situ measurements and two of the infiltration models offered by EnergyPlus: FlowCoefficient and EffectiveLeakageArea. The final goal is to verify, through empirical experiments, whether these models are reliable for estimating the dynamic infiltration that takes place in a dwelling located in a tall building. To achieve this goal, the performance of both models is assessed using the coefficients acquired from the experiments (tracer gas and blower door) and combined with off-the-shelf values. Three different seasons (summer 2021, winter 2021–2022, and spring 2022) are used, to validate the robustness of the in situ coefficients and to avoid coincidences in the results.
The empirical evaluation of infiltration models is achieved by fulfilling the requirements established in the document of the American Society for Testing Material (ASTM) D5157: Standard Guide for Statistical Evaluation of Indoor Air Quality (IAQ) Model [57]. This standard is commonly employed in Indoor Air Quality models, wherein the comparison between the contaminant measurements and predictions [58,59] is assessed through the application of three statistical tools: the coefficient of determination (R2), the normalized mean square error (NMSE), and the line of regression. In this investigation, the ASTM D5157 Standard is applied by analogy to CO 2 concentrations. Considering the influence of infiltration on the decay curve, it becomes feasible to assess infiltration models based on standard criteria. As stated in the documents, a main prerequisite for performing the evaluation is the independence of the data used for the construction of the model. For that reason, in the present study, the summer period is used for training the model, and the other two are used as checking periods.
It should be emphasized that our intent was to conduct the experiment in a real-life scenario rather than within a laboratory environment. This level of experimentation is considered a Technology Readiness Level (TRL) number 5, indicating that the technology is at a breadboard stage and demands more rigorous simulations in environments as close to reality as feasible. TRL is a metric system that assesses the maturity of a technology, from concept formulation to real-world application [60]. The experiment focused on a specific area within a dwelling, allowing for precise control of the test-site environment and facilitating the interpretation of results. By conducting experiments in a limited or controlled environment, researchers can efficiently evaluate the functionality and viability of a technology at its early stages. In this particular case, this decision also considered that future works must be focused on introducing the obtained coefficients into the BEM’s calibration, where each zone is analyzed individually. Nevertheless, it is crucial to emphasize that the research does not aim to apply the findings to other similar case studies, and there are limitations associated with focusing solely on a single zone. These limitations are addressed in future work, through the application of the described methodology to bigger areas and multi-zone spaces.

2. Methodology

Two empirical experiments were performed to estimate infiltration: tracer gas and blower door tests. The first one was designed according to previous studies [61,62], while the blower door test was performed by a professional. All experimental, quantitative, and primary data were gathered on-site and organized using a spreadsheet program.
Figure 1 indicates the main steps and sub-steps performed in this study, which are detailed below.

2.1. Infiltration Model Equations

As previously stated, the present research is centered on IFC and ELA, two infiltration models available in EnergyPlus.
The IFC model is appropriate for smaller, residential-type buildings, and can be expressed as:
I = F s c h e d u l e c C s Δ T n 2 + c C w s × W S 2 n 2
where
  • F S c h e d u l e represents a value from a schedule defined by the user;
  • c: Flow coefficient. Units: m 3 / ( s Pa n ) ;
  • C s : Coefficient for stack-induced infiltration. Units: ( Pa / K ) n ;
  • Δ T : Absolute difference between the average dry bulb temperature within the zone and the average exterior dry bulb temperature. Units: °C;
  • n: Pressure exponent. Dimensionless;
  • C w : Coefficient for wind-induced infiltration. Units: ( Pa s 2 / m 2 ) n ;
  • s: Shelter factor. Dimensionless;
  • W S : Local wind speed. Units: m/s.
On the other hand, the ELA model is based on the ASTM Standard E779 effective leakage area calculation [63] and its equation is as follows:
I = F s c h e d u l e A L 1000 C s Δ T + C w W S 2
where
  • F S c h e d u l e represents a value from a schedule defined by the user;
  • A L : Effective air leakage area corresponding to a 4 Pascal (Pa) pressure differential. Units: cm2;
  • C s : Coefficient for stack-induced infiltration. Units: ( L / s ) 2 / ( cm 4 K ) ;
  • Δ T : Absolute difference between the average dry bulb temperature within the zone and the average exterior dry bulb temperature. Units: °C;
  • C w : Coefficient for wind-induced infiltration. Units: ( L / s ) 2 / ( cm 4 ( m / s ) 2 ) ;
  • W S : Local wind speed. Units: m/s.

2.2. Test Site Description

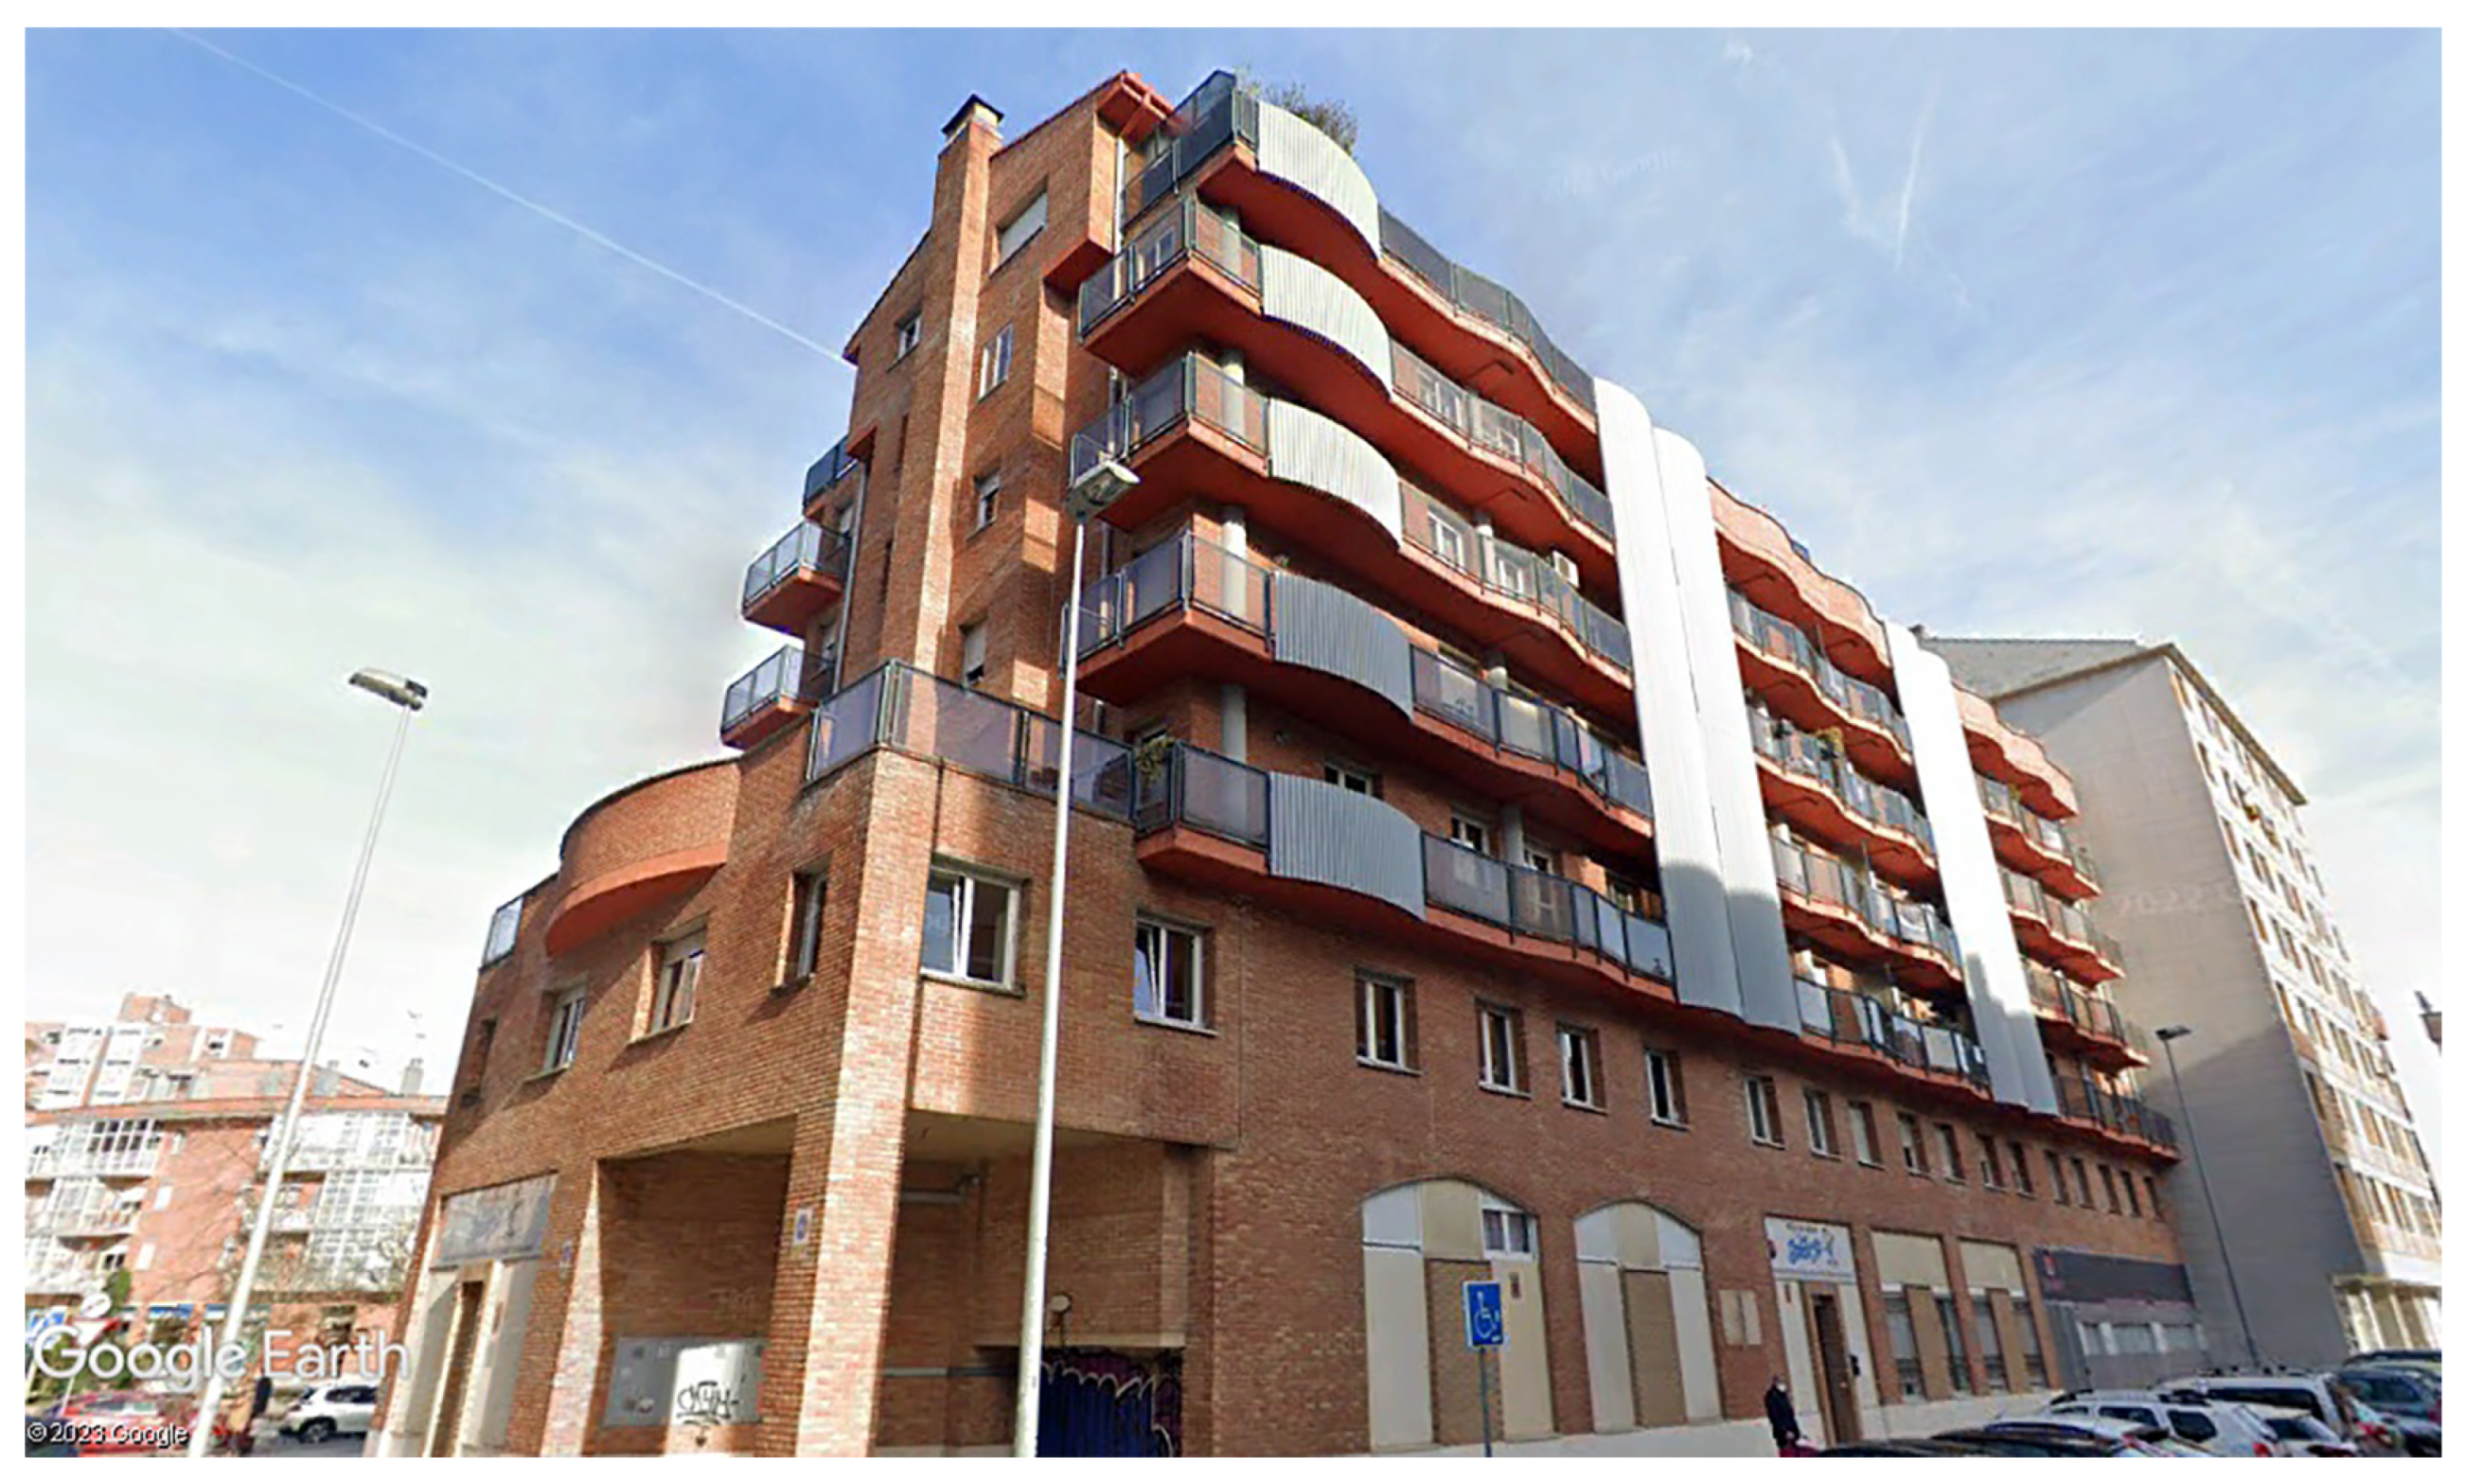
The experimental site is a 29.5 m2 living room situated in the loft of a residential building in the north of Spain, which has a southeast, a northwest, and a southwest façade. The fourth façade is shared with the adjacent building (Figure 2). The reasons for choosing this space are the following:
  • The authors had access to monitoring it and to carry out in situ tests;
  • Since it is a real space, there are imperfections in the thermal envelope. Three of its façades are exterior and exposed to weather conditions; only the east side adjoins the building’s vertical circulation lobby;
  • The test site is located at the top of a high-rise building, which is surrounded by other constructions with different heights: 25 m from the southeast, 27 m from the west, and 55 m from the northwest façade, approximately;
  • The dwelling was unoccupied during the on-site experiments.
The building was constructed in 1992, according to the Government of Navarre’s cadaster. By that date, the Spanish building code (CTE) required façade insulation. The residential building is composed of seven floors and two apartments per floor. Each apartment has two bathrooms, a kitchen, a storage room, a living room, and two bedrooms.
The studied living room is oriented to southeast and southwest. The composition of the façades, from exterior to interior, is as follows: 11.5 cm of perforated brick, an air cavity of 3 cm, insulation (5 cm of EPS foam), 7 cm of hollow brick, and 1.5 cm of gypsum plaster. Regarding the interior partitions, they are made of two layers of gypsum plaster, each of them measuring 1.5 cm, covering 7 cm of hollow brick. There are three windows with aluminum frames and two interior wooden doors.

2.3. Monitored Data

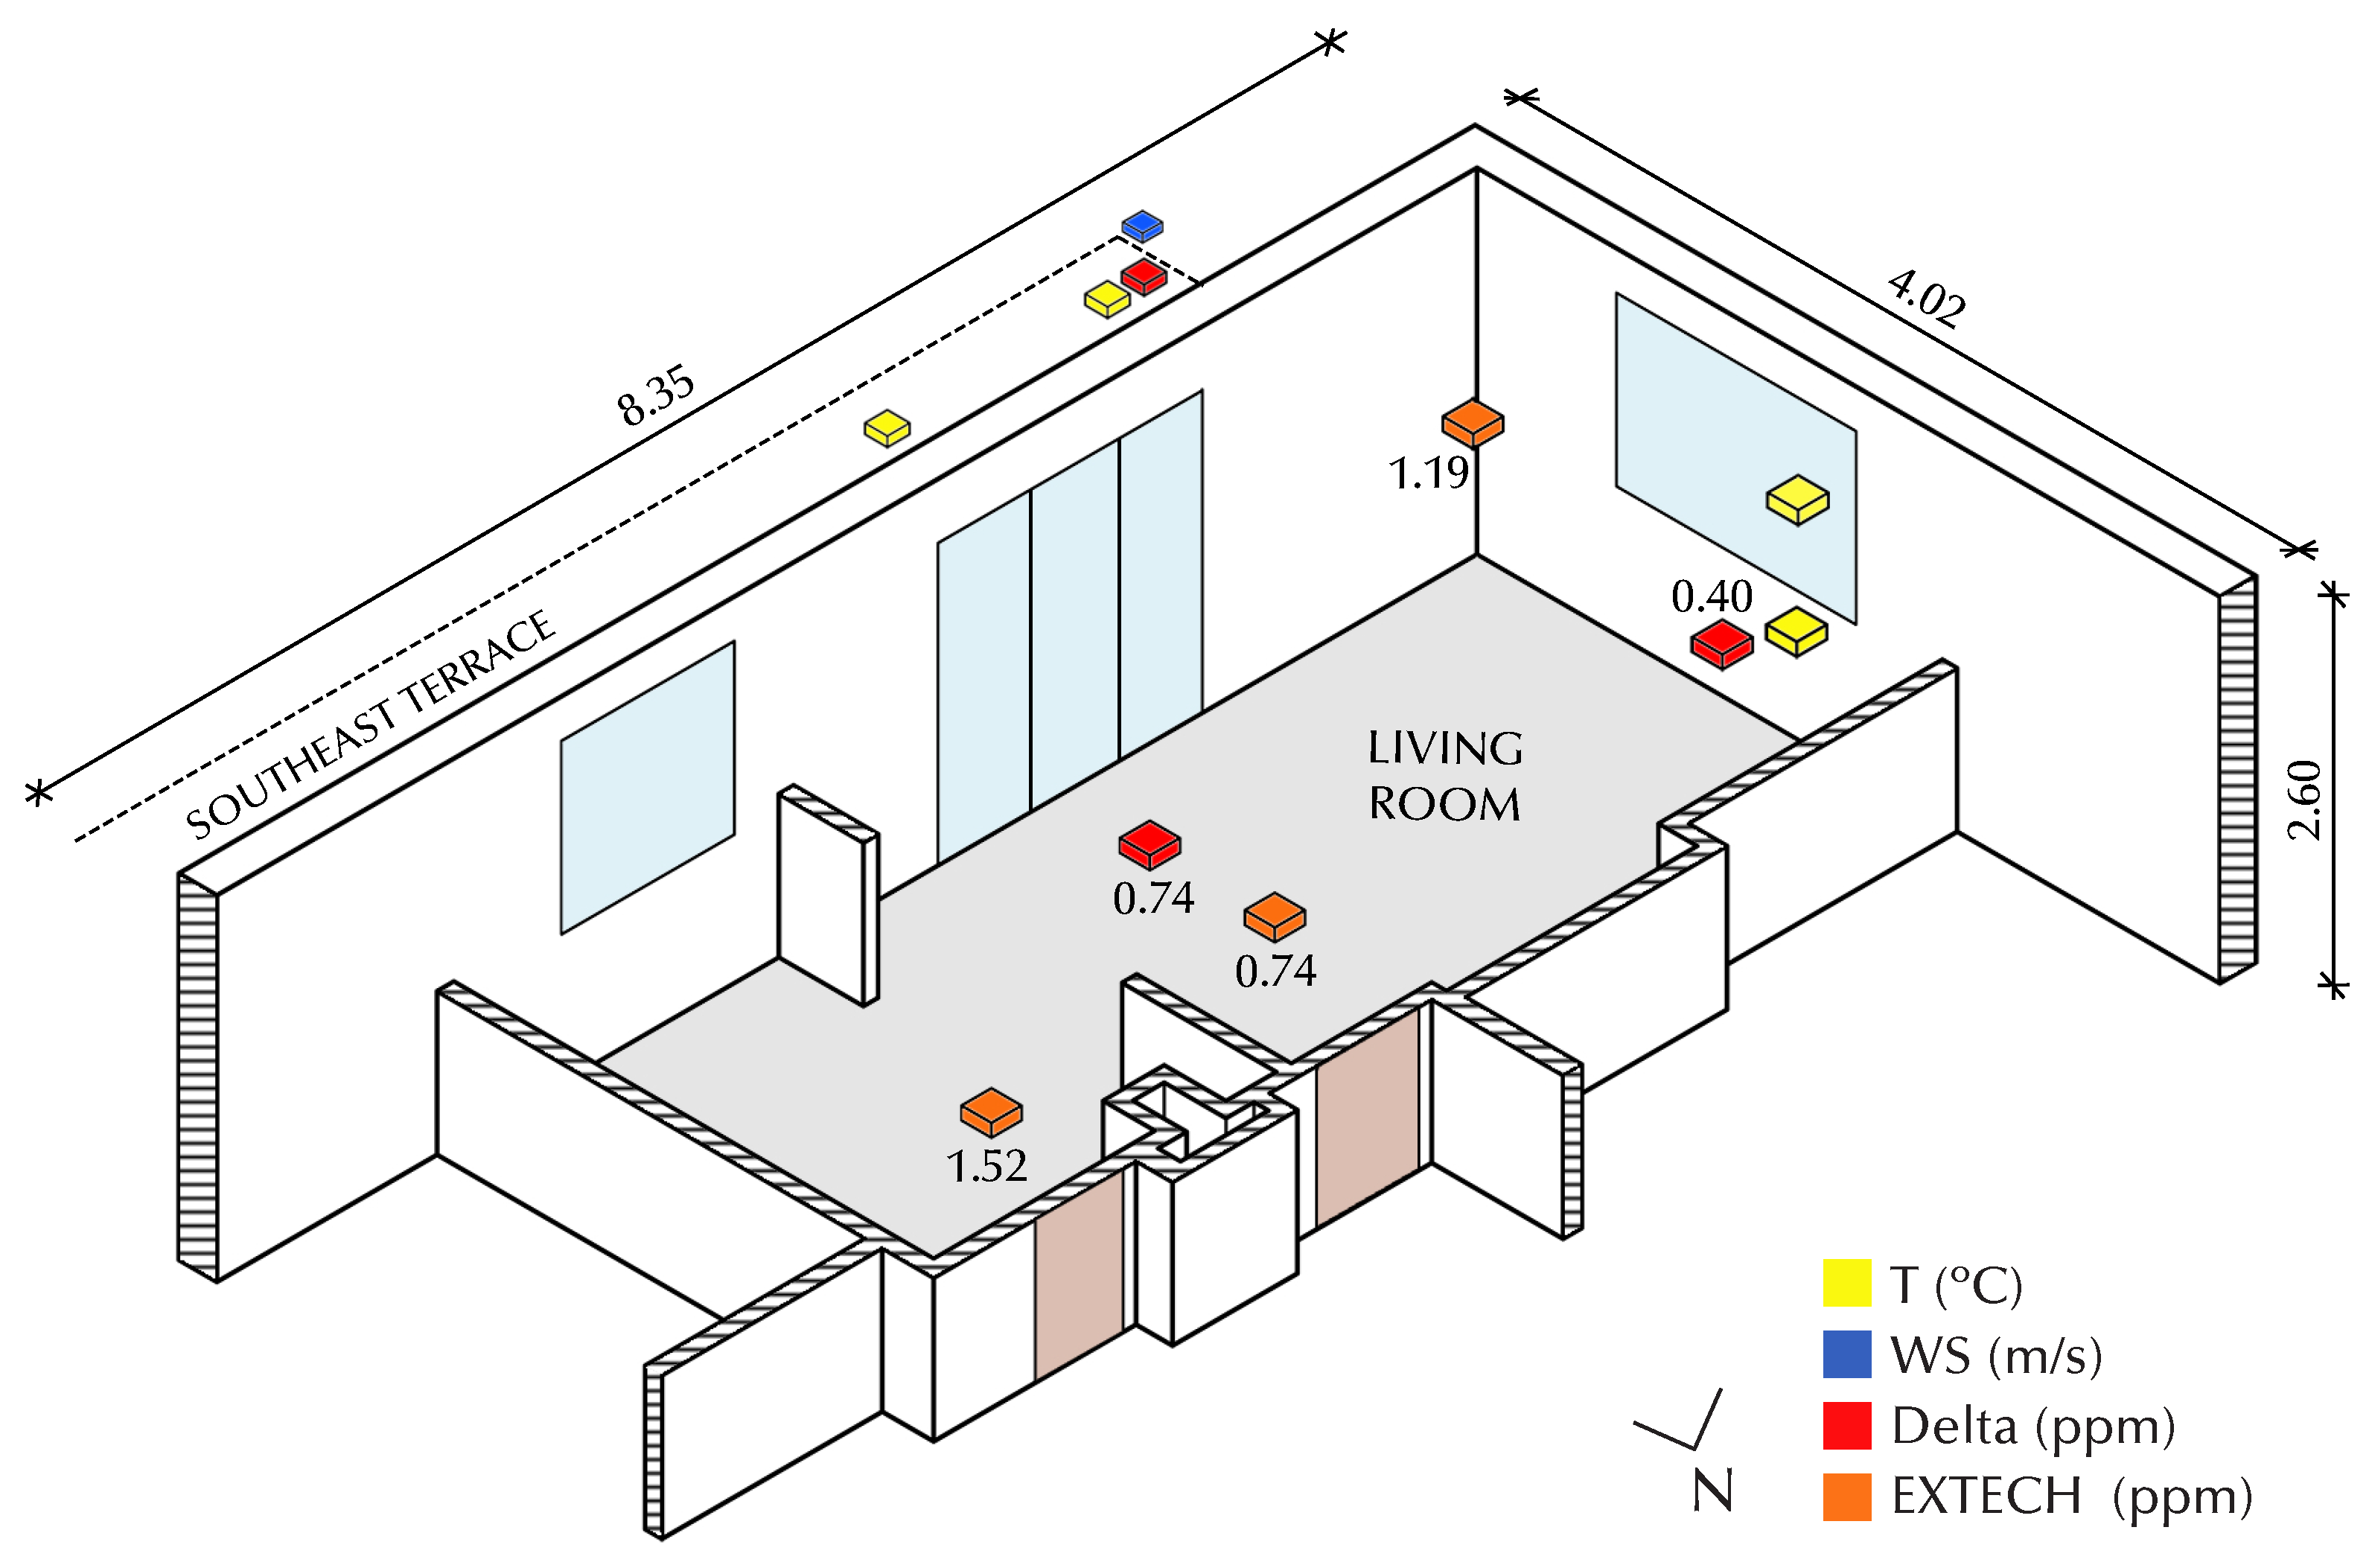
The collected data include indoor and outdoor measurements recorded at 1 min intervals. The dataset was finally made up of 48.439 time-steps. Figure 3 illustrates the 3D view of the living room and the position where the sensors were installed. As can be observed, the indoor air temperature sensors (HOBO ZW-006) were placed at two different heights in order to measure the temperature stratification. These heights were 1.75 m and 0.80 m, which is approximately equal to two-thirds of the floor-to-ceiling height. Concerning the outdoor weather measurements, two air temperature sensors and one wind speed sensor were positioned on the southeast façade. The first two were installed at a height of 2.32 m above ground level, and the third one at a height of 1.90 m.
Regarding the CO 2 sensors, two different models were installed: two Delta OHM HD37VBTV.1 sensors that were linked to the HOBO room’s monitoring system and three units of EXTECH CO210. Both types have a precision of ± 5 % . The sensors were placed in different positions within the living room, trying to gather as much data as possible on the homogeneity of the gas in the room. The distance between the sensors and the ground was determined by the availability provided by the space, such as connections to electrical outlets and structural support locations. We used the average data of the Delta OHM sensors to calculate infiltration, as it proved to be more efficient for handling their information. For recording the CO 2 concentration outside the room, a Delta OHM HD37VBTV sensor was placed on the southeast façade. Table 1 shows the technical specifications of each sensor.
As was mentioned in Section 1.3, the monitored data were collected over three different seasons:
  • P_1_T: Training period of 9 days in summer: from 20 June 2021 to 2 July 2021;
  • P_2_C: Checking period 01 of 11 days in spring: from 10 December 2021 to 9 January 2022;
  • P_3_C: Checking period 02 of 11 days in spring: from 24 March 2022 to 24 April 2022.
Utilizing these three distinct periods enables us to employ the first one for model training, and the remaining two for evaluation purposes, avoiding coincidences and complying with the prerequisite established in the ASTM D5157 Standard.

2.4. Tracer Gas Test

In the living room, the tracer gas experiment using CO 2 was conducted with a fire extinguisher. Only the uniform mixture of the tracer gas was taken into account for the calculations; therefore, the initial 40 min of concentration peaks were excluded. The experiment adhered to the ASTM E741 Standard test method [64,65].
This approach enables the determination of the most suitable coefficients for the test space and contributes to the empirical validation of the models by contrasting the measured CO 2 with the estimated concentration. For this purpose, the following decay Equation (3), established by ASHRAE [16], was used:
C p = C ¯ o C ¯ b g e I t
where in this study:
  • C p : Estimated CO 2 concentration at time, t;
  • C ¯ o : Average of measured interior CO 2 concentration;
  • C ¯ b g : Daily average of measured exterior CO 2 concentration;
  • t: Time, s;
  • I: Infiltration of each time-step determined through IFC or ELA methods.
The decay method was calculated using the multi-point approach to mitigate the measurement errors in contrast to the two-point method [61].
As will be detailed below, an uncertainty analysis was performed to ensure that the tracer gas experiment was designed to comply with the three requirements established by Sherman et al. [52,65]:
  • The injected CO 2 has an homogeneous distribution;
  • All the living room’s exterior openings are closed, interior doors are properly sealed, and the area is not occupied; therefore, there is only air exchange with the outside;
  • The outside air needs to be adequately blended throughout the test area.

2.5. Blower Door Test

A blower door test was also performed by a professional on the test site. This experiment allows the practitioner to have ad hoc coefficients. The test was made following the requirements established at ISO9972 [66]. The HVAC system was deactivated throughout the experiments. The exterior openings were shut, and interior doors were sealed off with paper tape. Then, the room experienced pressurization and depressurization, with a differential of 50 Pa between the indoor and outdoor environments.

2.6. Coefficients of the Equations

2.6.1. Off-the-Shelf Coefficients

In the Input Output document [44], EnergyPlus (E+) provides predefined coefficients values for both models: Flow Coefficient (Equation (1)) and Effective Leakage Area (Equation (2)). ASHRAE (2017) establishes some specific values for stack ( C s ) and wind ( C w ) coefficients, as well as the shelter factor (s), determined by factors such as the number of floors in the building, the presence of a crawl space or a basement with or without a flue, and the shelter class. For this particular test site, the value for the maximum number of stories (3) was selected, since there is no coefficient for a seven-story area. A crawlspace lacking a flue and a shelter class of 3 were the other coefficients chosen. Although the coefficient names may sound alike in both equations, it is crucial to note that they are not interchangeable.

2.6.2. In Situ Coefficients

The site-specific coefficients for both equations were obtained after performing mathematical multi-variable regressions (herein referred to as REG) of the coefficients. The least mean absolute error (MAE) was used as the objective function of the regressions. The iterative process is as follows: The infiltration values calculated using the ELA and IFC models are inserted in the decay equation which results in the predicted CO 2 concentration. The operation is repeated until the MAE between the estimated and measured concentrations of CO 2 is reduced for all the decay days within the training period.
During model fitting, the coefficients were not subject to any range restrictions, except for the n value which was confined to a range of 0.60 to 0.70, based on EnergyPlus [44] recommendation. In addition, the blower door test results can be utilized as coefficients in the equations: two applying to the IFC model (n value of 0.704 and c value of 0.00788 m3/(sPan) at depressurization mode), and one to the ELA model ( A L of 75.60 cm2 at 4 Pa). Table 2 presents all models with the source of their coefficients.

2.7. Model Validation

The ASTM D5157 Standard Guide [57] was used for the validation of the models. Several studies have applied this standard before for the assessment of measurement and prediction of tracer gas [58,59,67].
As was mentioned before, three statistical tools are used to evaluate the concordance between in situ measurements and estimations. These tools are R2, NMSE, and the line of regression. Also, two additional statistical indices are applied for assessing bias: the normalized or fractional bias of the mean concentration (FB) and the fractional bias based on the variance (FS). The values that they should comply with are shown in Table 3.
In addition, an uncertainty analysis of the measurements was conducted to ensure that the data were proper to generate the models. To achieve this purpose, we calculated the standard deviation of the measurements σ by the International Performance Measurement and Verification Protocol (IPMVP) [68], using the following equation:
σ = C o i C ¯ o 2 n 1
where
  • n: Number of time-steps of each period;
  • C o i : Observed CO 2 concentration in ppm;
  • C ¯ o : Mean observed CO 2 concentration in ppm.
This value permits the assessment of the data deviation in comparison to the average value of the dataset. In addition, to evaluate the accuracy of the collected data, the mean (µ) was calculated. As can be seen in Table 4, P_1_T corresponds to 70% of the peak σ values, affirming its suitability as the training period.
Furthermore, the IPMVP [68] was also used to perform an uncertainty analysis for both the CO 2 sensors and the average data. The coefficient of determination (R2) should be above 0.90 and the root mean square error (RMSE) should be as low as possible. This analysis justifies the fulfillment of the requirements explained in Section 2.4.
  • The uniformity of CO 2 dispersion is illustrated by the fact that sensors 4 and 5, placed in distinct areas within the living room, exhibited the same deviation from the average (Table 5).
  • CO 2 concentration curves from from each sensor were analyzed using the R2 value. All the values were higher than 0.94 and 80% were higher than 0.96. That means that the different measured curves were similar, indicating that outside air was infiltrating evenly into the room.

3. Results and Discussion

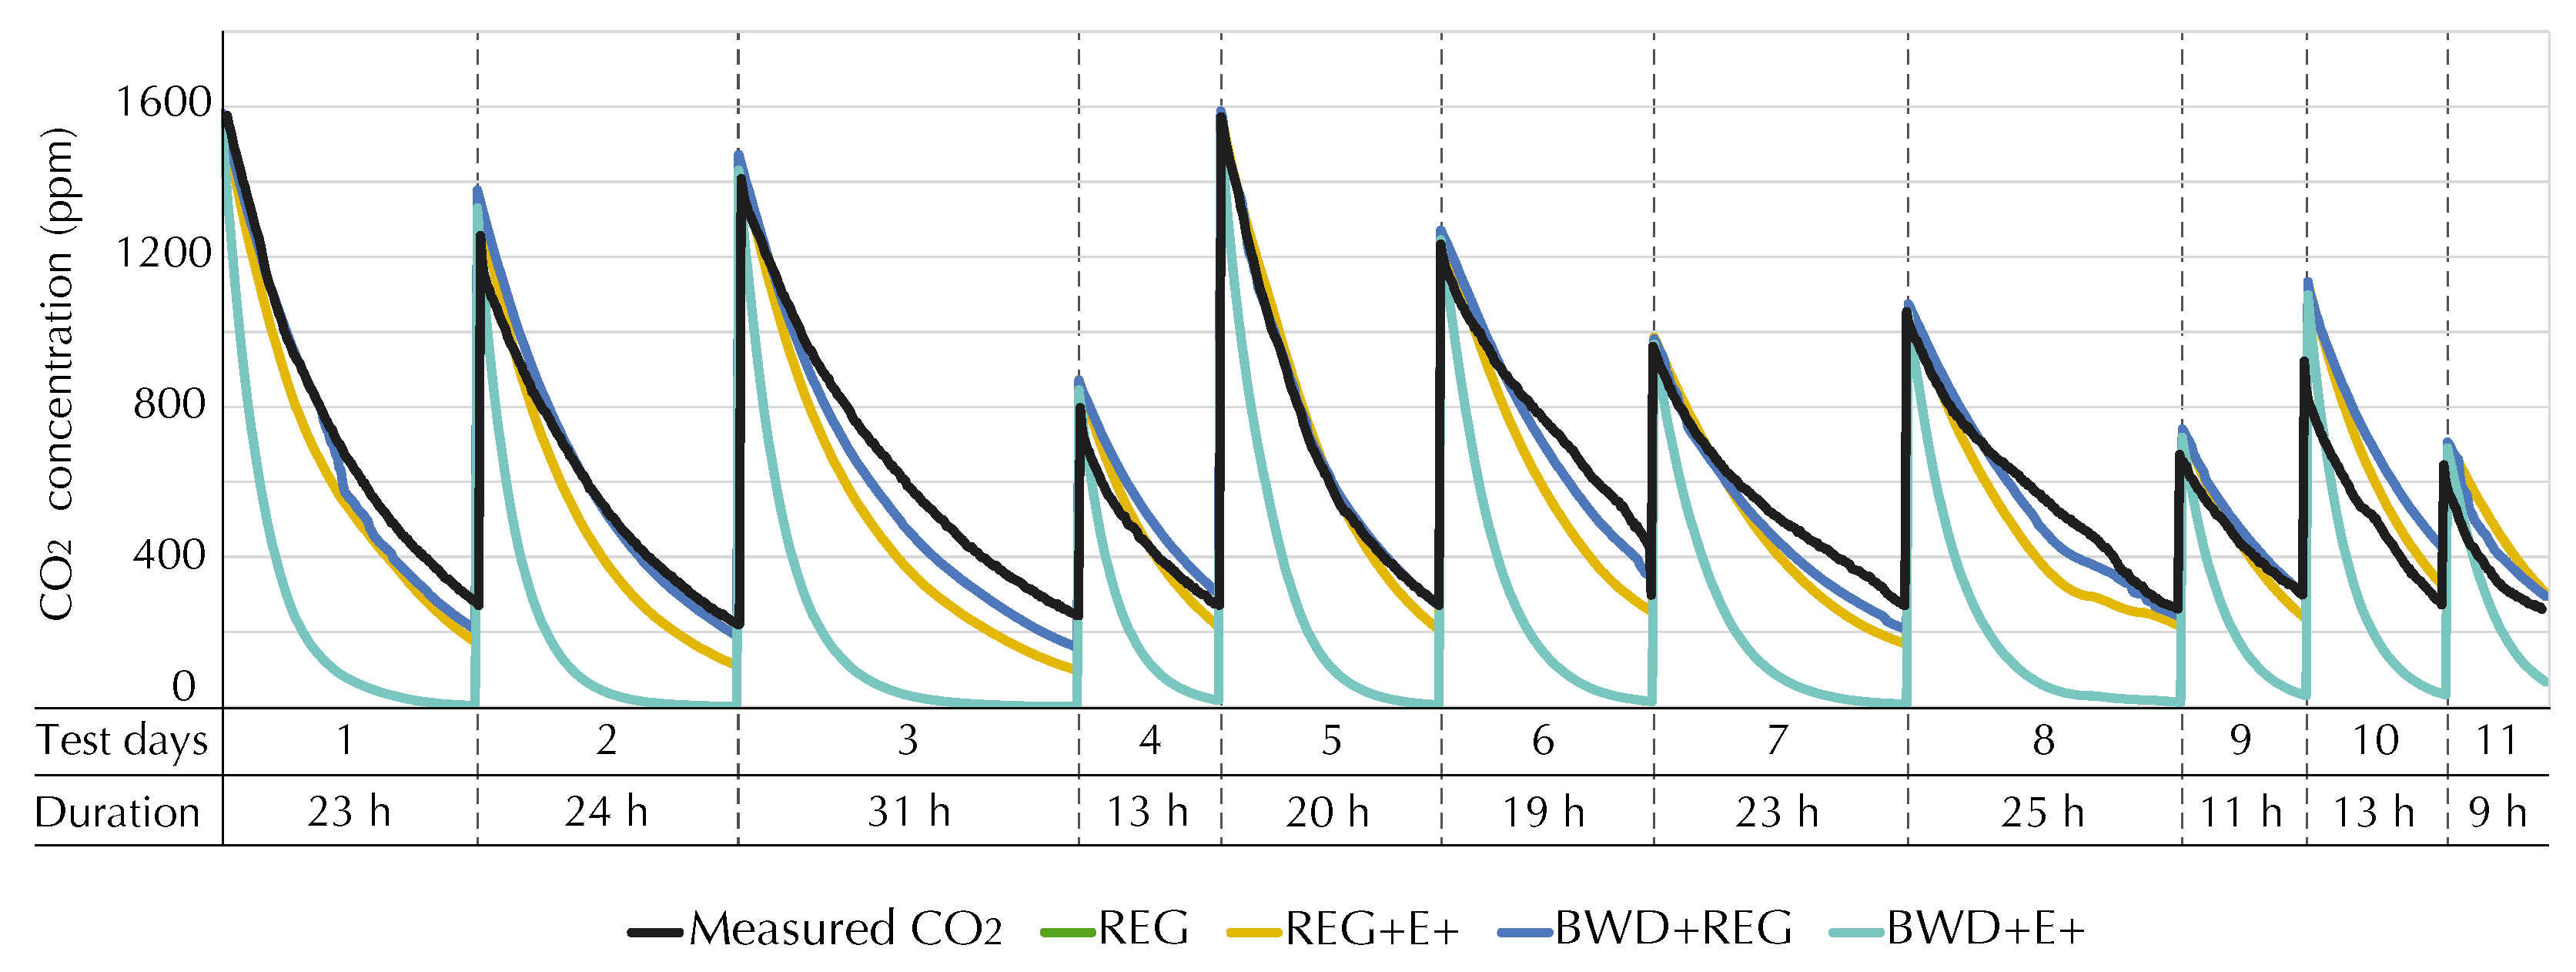
The first (“REG”) and third (“BWD + REG”) IFC and ELA models are the only ones that meet the criteria of ASTM D5157 Standard in the training and checking periods, as specified in Table 6 and Table 7. It is noteworthy that the tracer gas and the blower door tests were performed during different indoor–outdoor pressure conditions. However, combining their coefficients resulted in the best models, as they are tailored to the site, which might explain the accuracy of these models. In the ELA model “BWD + REG”, the AL value is established at 4 Pa, which is a normal pressure condition that could align with the conditions during the tracer gas test.
In contrast, when combining the site-specific coefficients with off-the-shelf coefficients determined for spaces up to three stories, the models did not meet the standard criteria, as is the case of “REG + E+” and “BWD+E+” for both models, IFC and ELA. The second ELA model (“REG + E+”) nearly complied with the standard requirements (b/ C ¯ o equal to 28.83% and R2 equal to 0.72), which confirms the methodology of finding appropriate coefficients for the room. In addition, despite having values found at natural conditions in the ELA, the “BWD + E+” shows the highest NMSE value of 2.735 and the lowest R2 value of 0.60, being the least precise model in representing dynamic infiltration across both equations.
Although the regression attempts to offset the other EnergyPlus coefficients, it is evident that the most accurate models are those exclusively utilizing site-specific values. Despite the fact the default coefficients were calculated for low-rise buildings, they were also tested under different outdoor and indoor conditions. Being situated in an attic within the building exposes the case study more significantly to the influences of wind and the stack effect. Therefore, the data for the external conditions differ from those on other floors of the building or of lower buildings. It was possible to obtain specific coefficients for the case study because, in addition to the in situ experiment, we utilized measured data collected on-site.
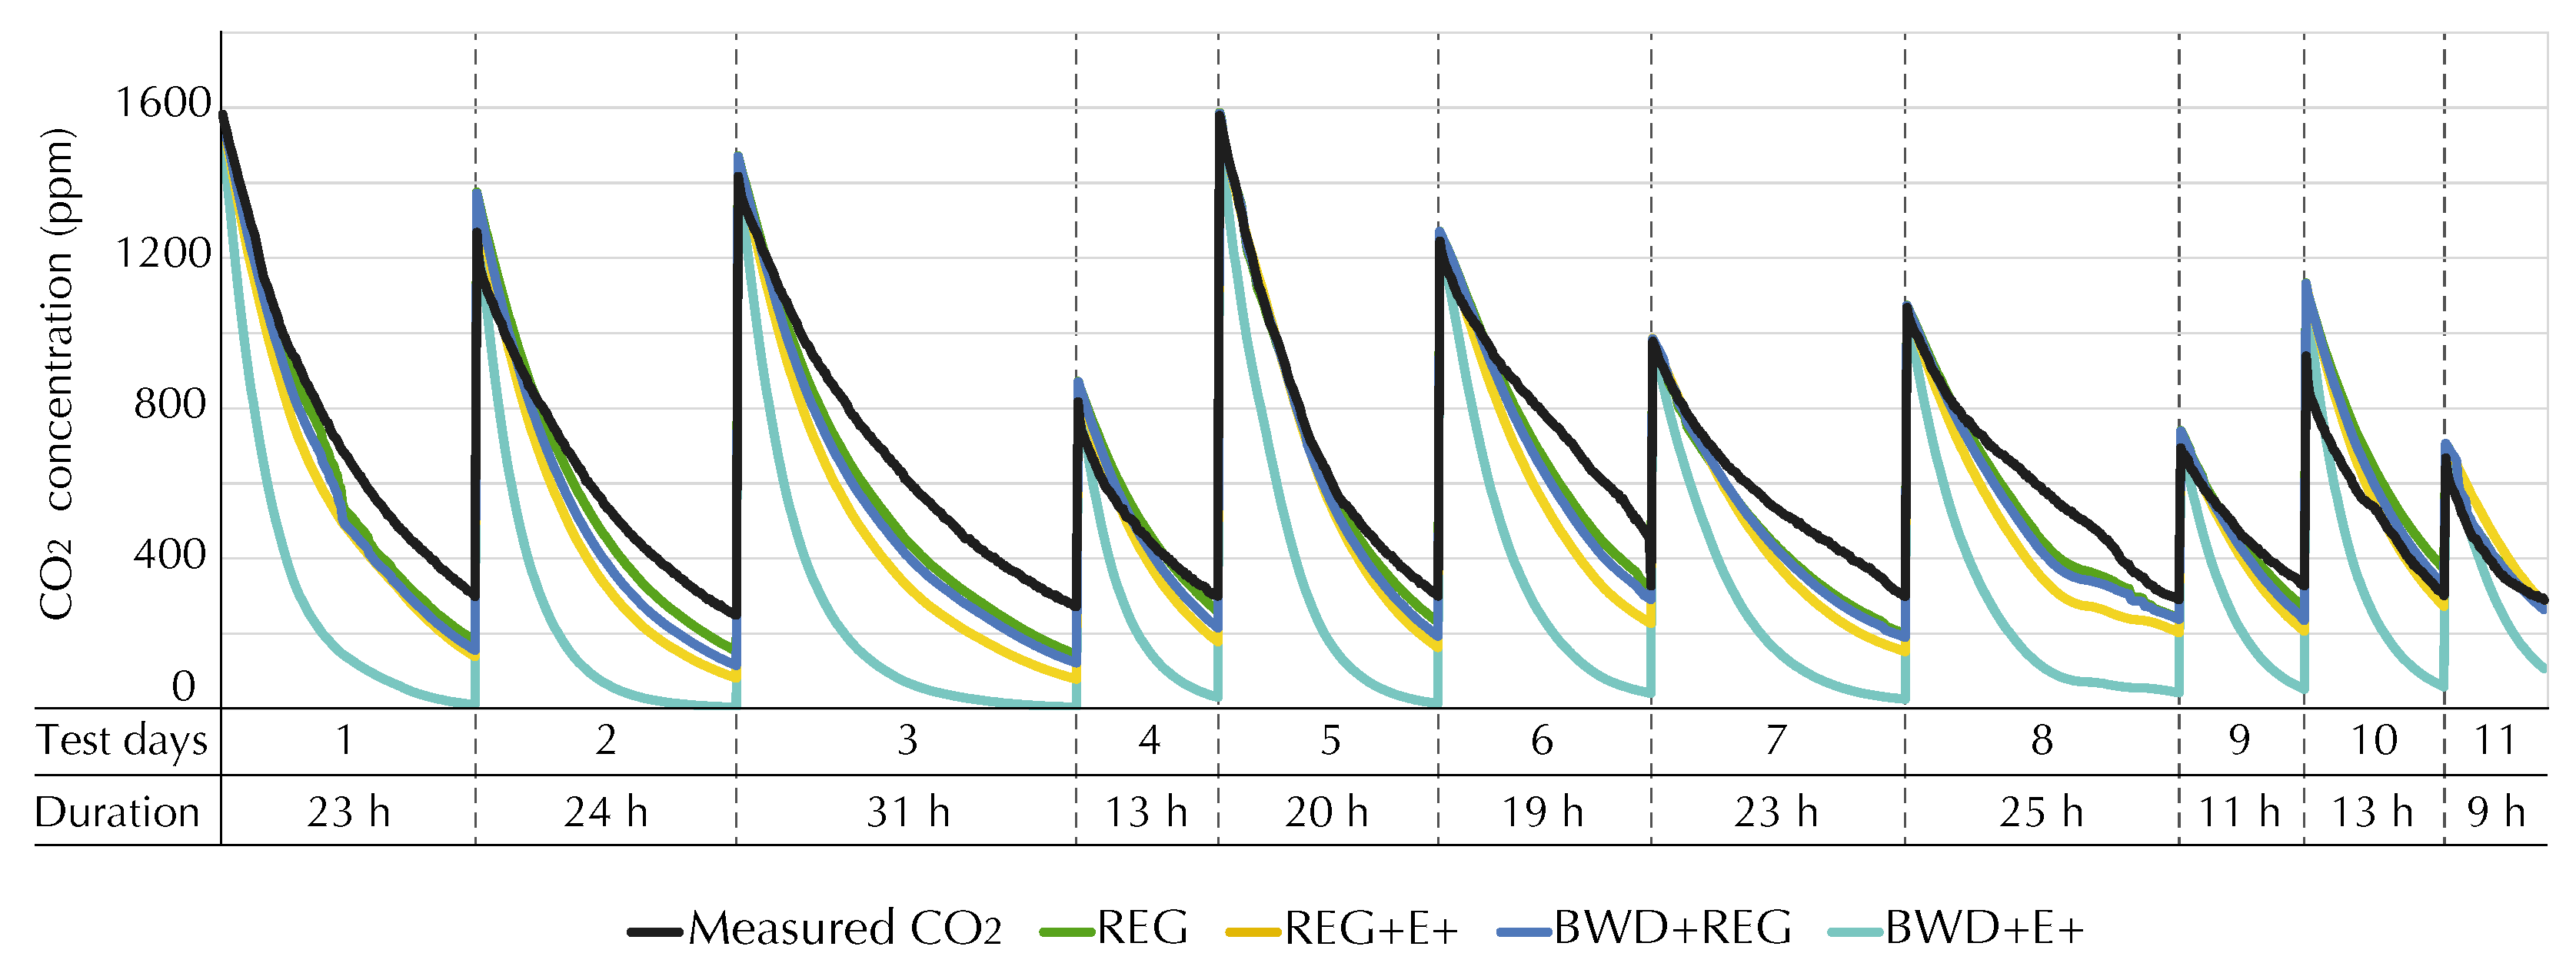
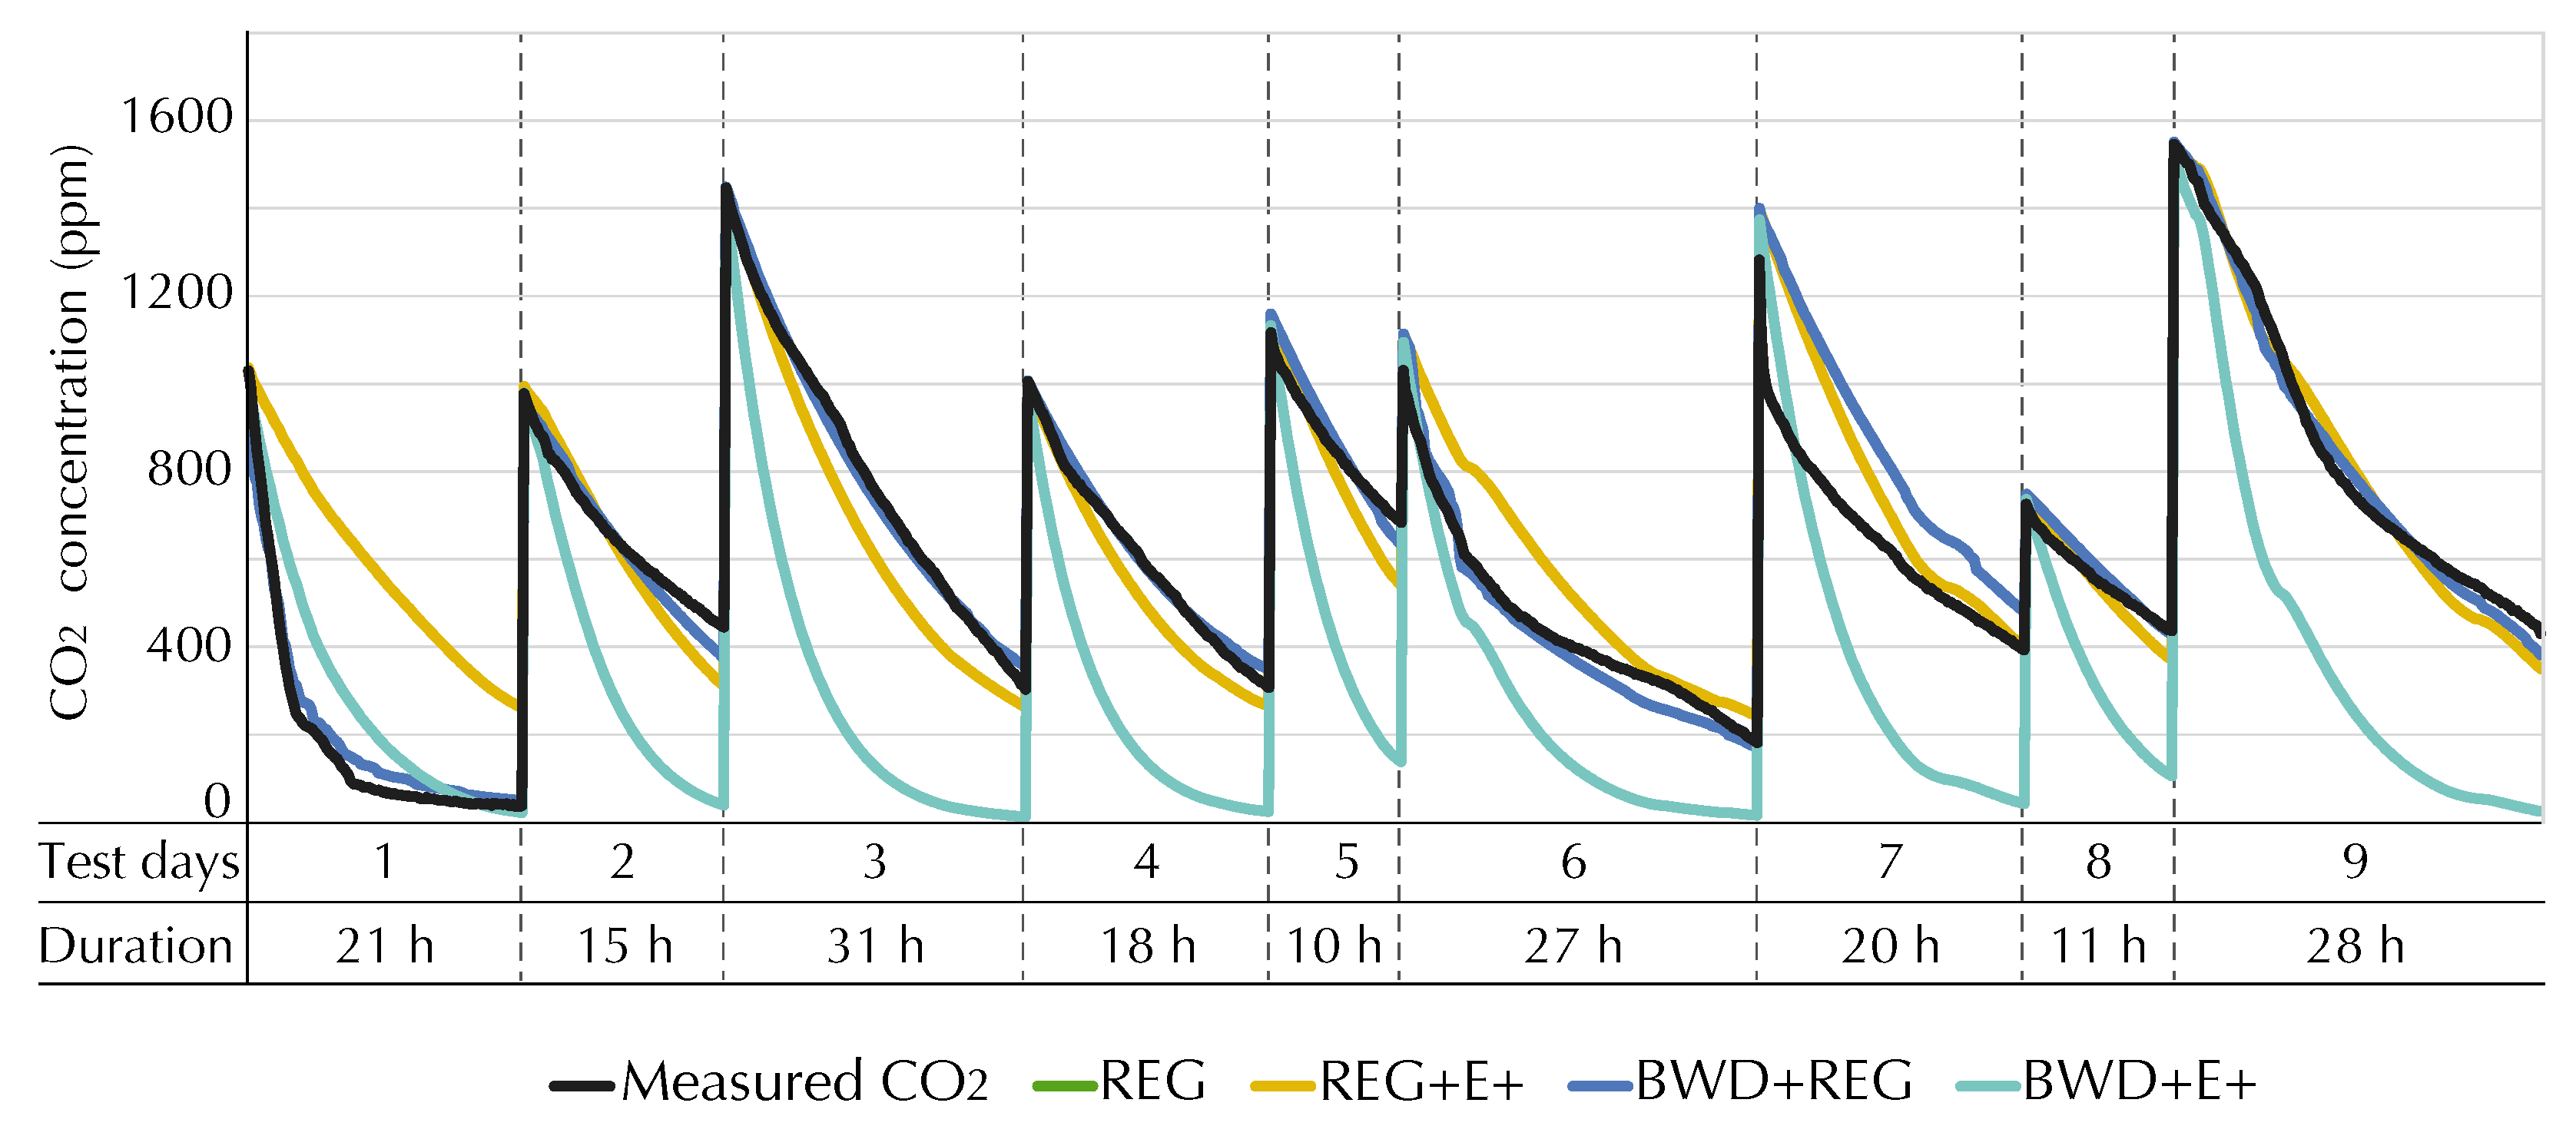
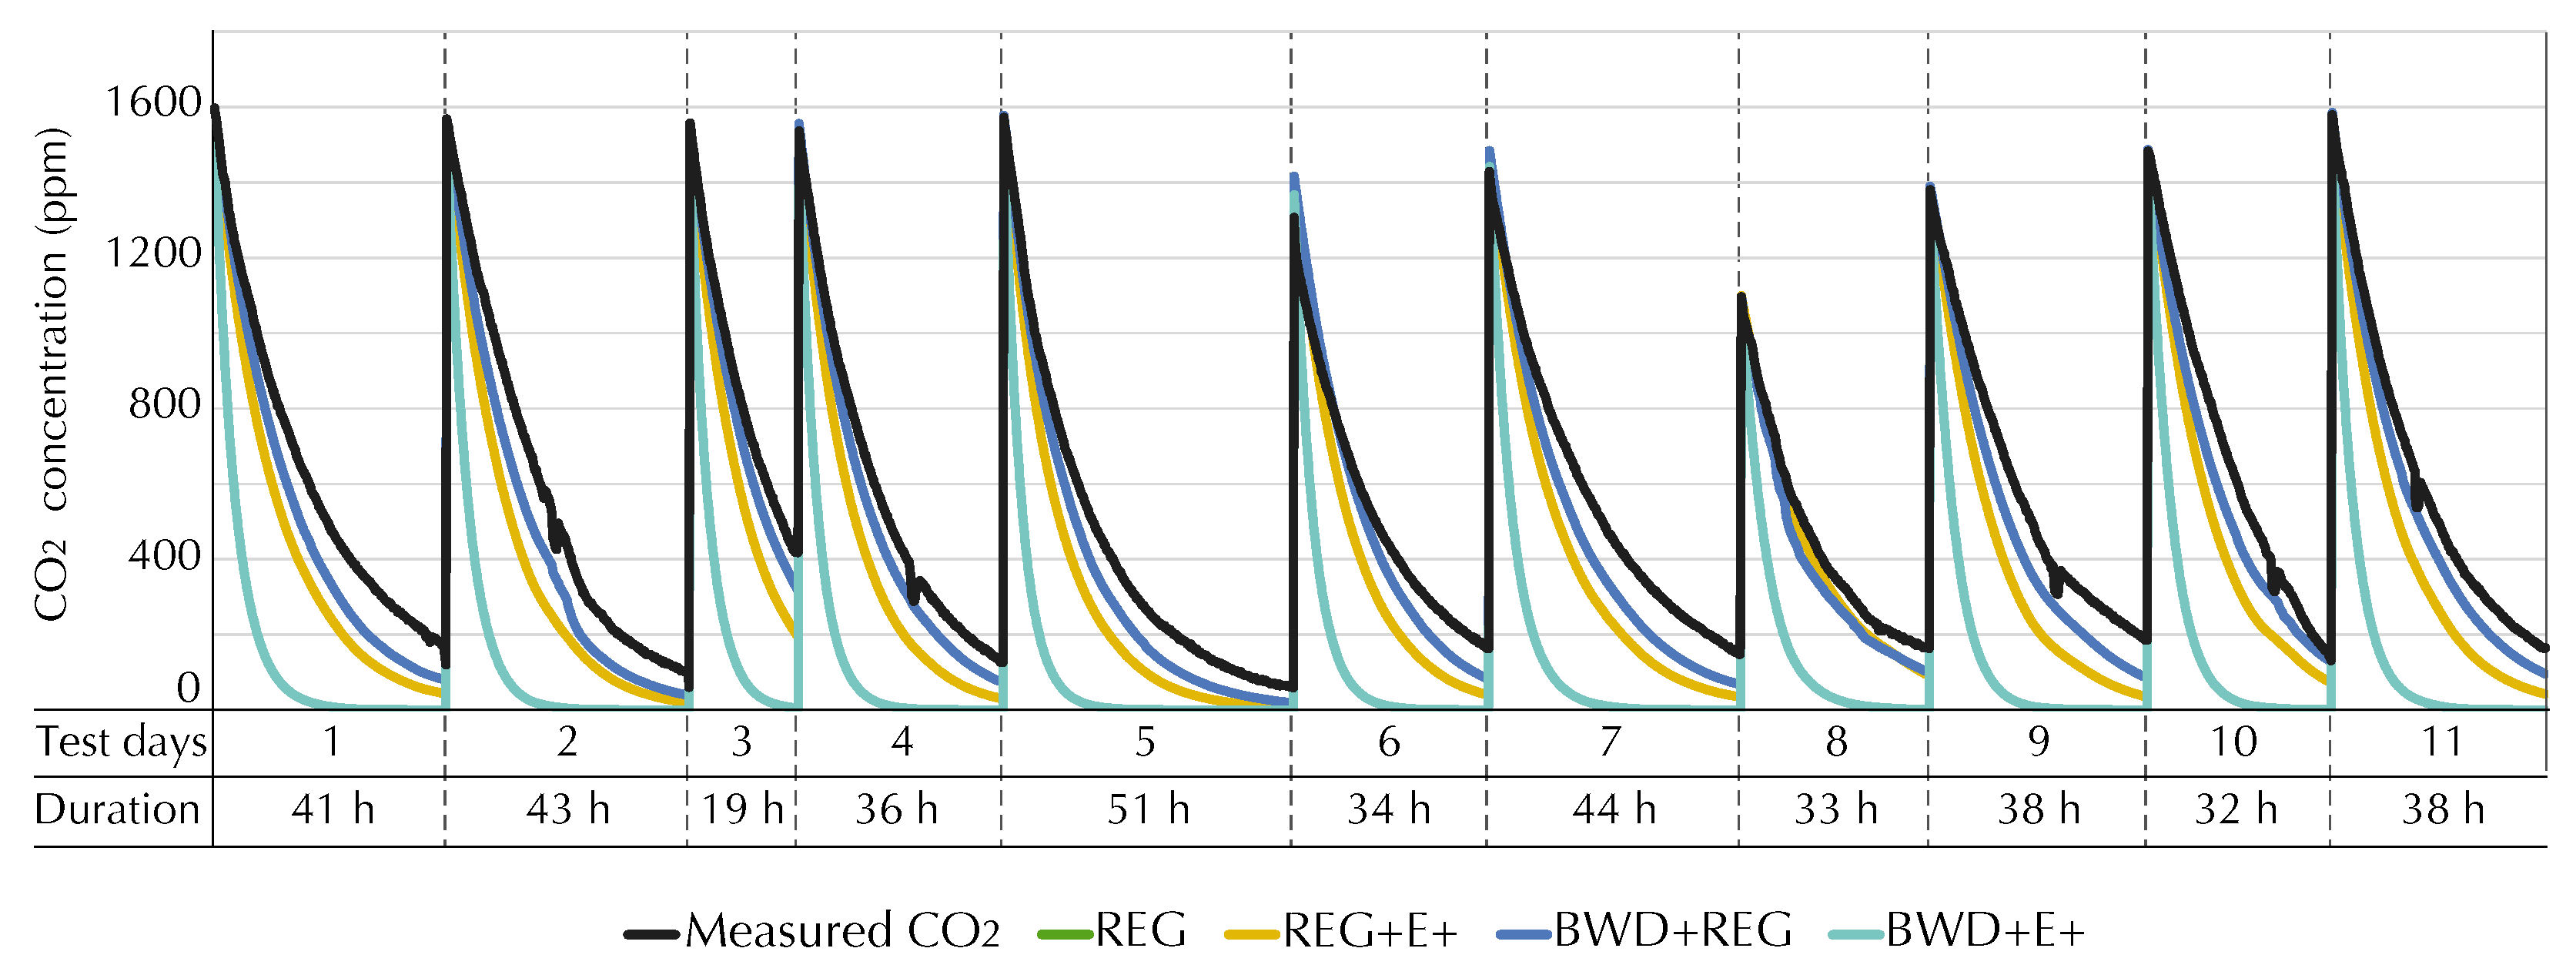
Even though we are checking the models in three distinct periods, a consistent pattern of behavior is observed across all of them. Figure 4, Figure 5, Figure 6, Figure 7, Figure 8 and Figure 9 clearly illustrate the model’s performance, contrasting the measured (black line) and predicted CO2 concentrations from the eight models. In all periods, we can conclude that the IFC and ELA equations are efficient for accurately predicting air leakage in this test case in a high-rise multi-family building, particularly when employing in situ coefficients. Particularly, the “REG” models in both IFC and ELA fit the measured CO 2 curve with an accuracy of 0.94 R2, making it unable to discern the green curve in the graphs.
A blower door test is not necessary for estimating dynamic infiltration in this case study, because the optimal models are those that rely on regression coefficients. However, without the possibility of conducting a tracer gas test or gathering monitored data, combining the results from a blower door test with EnergyPlus coefficients would become a requirement for generating the infiltration models. Considering the calibration of BEMs by time-dependent building energy simulations, taking into consideration the potential inaccuracies in air leakage estimations is crucial. For this particular case study, the greatest discrepancy in estimated infiltration reaches 64%, a consequence of the least precise model, “BWD + E+”, in ELA. This value could lead to misleading energy estimations since infiltration significantly impacts energy demand and consumption.
The results and in situ coefficients presented in Table 8 and Table 9 are particular to this test case, without the aim of extending their applicability to other spaces with the same characteristics.

4. Conclusions

This study has shown that the FlowCoefficient and EffectiveLeakageArea equations can reliably estimate dynamic infiltration for this test site located in the attic of a tall building, particularly when using site-specific coefficients obtained after conducting blower door and tracer gas experiments in the case-study. The models demonstrated consistency across different periods. The tracer gas test provided the most accurate results, according to the ASTM D5157 Standard. Consequently, this test is crucial to obtain more precise infiltration values. The ELA model with regression coefficients showed the best results, with 0.94 of R2 and 0.018 of NMSE in the training period. On the other hand, the combination of blower door results with the off-the-shelf coefficients of EnergyPlus represents only an accuracy of 60% of R2. The obtained results are consistent across the three analyzed periods, demonstrating the robustness of the models.
Regarding the IFC model, employing regression coefficients showed the best results, achieving an NMSE of 0.019 and an R2 of 0.94 during the training period. Nevertheless, these coefficients might not be universally accessible across all building types. Therefore, it was pertinent to analyze the performance of the blower door values along with off-the-shelf coefficients. This combination led to a 64% decrease in accuracy based on R2.
It is noteworthy to mention that while discrete values from these results may not be directly extended to similar spaces or buildings surpassing three stories, the patterns observed in the best-performing models are expected to remain consistent when employing the methods outlined in this research for other case studies. Further research is needed to confirm this hypothesis. In addition, more investigation is required to enhance the application of the methodology, considering the potential challenges associated with conducting tracer gas tests in larger, higher, and occupied spaces.

Limitations and Future Work

One of the main restrictions of this research is its application solely to a single zone of an apartment in a high-rise building. As a single-zone experiment and analysis, it simplifies and overlooks potential interactions that could arise between zones, such as airflows, indoor thermal conditions, and contaminant transfer. Nevertheless, single-zone experiments are required for an initial approach to addressing the problem at hand. Once validated, the method can be applied to larger-scale buildings and multiple zones. In addition, conducting a tracer gas test in occupied spaces and complex multi-story buildings may not be feasible for obtaining infiltration values, as was the case in this study’s test scenario. In such instances, utilizing metabolic CO 2 data with the decay method would be a more practical approach, enabling the analysis of whole dwellings and multiple zones simultaneously [69].
Additional research into different methods for finding ad hoc coefficients is necessary to enhance the cost-effectiveness of the methodology applied in this study. Moreover, while inserting the in situ coefficients into EnergyPlus is straightforward, the next step would be to assess whether they improve the calibration process of BEMs. The forthcoming flowchart (Figure 10) outlines the subsequent steps in model calibration, based on the translation of field measurements into the coefficients and exponents required by the EnergyPlus infiltration equations.

Author Contributions

Conceptualization, G.B.P., J.B.E.T. and C.F.B.; methodology, G.B.P., J.B.E.T. and C.F.B.; software, G.B.P., J.B.E.T. and C.F.B.; validation, G.B.P., J.B.E.T. and C.F.B.; formal analysis, G.B.P., M.F.-V.I., J.B.E.T. and C.F.B.; investigation, G.B.P., M.F.-V.I., J.B.E.T. and C.F.B.; resources, G.B.P., M.F.-V.I., J.B.E.T. and C.F.B.; data curation, G.B.P., J.B.E.T. and C.F.B.; writing—original draft preparation, G.B.P., J.B.E.T. and C.F.B.; writing—review and editing, G.B.P., M.F.-V.I., J.B.E.T. and C.F.B.; visualization, G.B.P., J.B.E.T. and C.F.B.; supervision, J.B.E.T. and C.F.B.; project administration, J.B.E.T. and C.F.B.; funding acquisition, J.B.E.T. and C.F.B. All authors have read and agreed to the published version of the manuscript.

Funding

The author, Gabriela Bastos Porsani, has received funding from a Ph.D. scholarship program called “Asociación de Amigos de la Universidad de Navarra” of the University of Navarra, Spain.

Data Availability Statement

Data are contained within the article.

Conflicts of Interest

The authors declare no conflicts of interest.

Abbreviations

The following abbreviations are used in this manuscript:
GHGGreenhouse Gas Emissions
DTDigital Twin
NZEBNet Zero Energy Buildings
BEMBuilding Energy Model
BMSBuilding Management System
BEPGBuilding Energy Performance Gap
ASHRAEAmerican Society of Heating, Refrigerating and Air-Conditioning Engineers
EPMEquilibrium Pressure Model
SIMSimple Infiltration Model
CFDComputational Fluid Dynamics
HVACHeating, Ventilation, and Air Conditioning
AFNAirFlowNetwork
IFCDesignFlowRate
ELAZoneInfiltration:EffectiveLeakageArea
ASTMAmerican Society for Testing Material
IAQIndoor Air Quality
NMSENormalized Mean Squared Error
TRLTechnology Readiness Level
°CCelsius Degrees
mMeter
TTemperature
tTime
IInfiltration
WSWind Speed
m/sMeters per Second
%Percentage
REGMulti-variable Regression
E+EnergyPlus
BWDBlower Door
MAEMean Absolute Error
IPMVPInternational Performance Measurement and Verification Protocol

References

  1. European Commission and Directorate-General for Energy. Clean Energy for All Europeans; Technical Report; European Commission: Brussels, Belgium, 2019. [Google Scholar] [CrossRef]
  2. European Commission. COM(2020) 562 Final: Stepping up Europe’s 2030 Climate Ambition. Investing in a Climate-Neutral Future for the Benefit of Our People; Technical Report; European Commission: Brussels, Belgium, 2020.
  3. Hou, L.; Wu, S.; Zhang, G.; Tan, Y.; Wang, X. Literature review of digital twins applications in construction workforce safety. Appl. Sci. 2020, 11, 339. [Google Scholar] [CrossRef]
  4. Liu, M.; Fang, S.; Dong, H.; Xu, C. Review of digital twin about concepts, technologies, and industrial applications. J. Manuf. Syst. 2021, 58, 346–361. [Google Scholar] [CrossRef]
  5. Tahmasebinia, F.; Lin, L.; Wu, S.; Kang, Y.; Sepasgozar, S. Exploring the Benefits and Limitations of Digital Twin Technology in Building Energy. Appl. Sci. 2023, 13, 8814. [Google Scholar] [CrossRef]
  6. Borowski, P.F. Digitization, digital twins, blockchain, and industry 4.0 as elements of management process in enterprises in the energy sector. Energies 2021, 14, 1885. [Google Scholar] [CrossRef]
  7. Kaewunruen, S.; Rungskunroch, P.; Welsh, J. A digital-twin evaluation of Net Zero Energy Building for existing buildings. Sustainability 2019, 11, 159. [Google Scholar] [CrossRef]
  8. Qian, Y.; Leng, J.; Wang, H.; Liu, K. Evaluating carbon emissions from the operation of historic dwellings in cities based on an intelligent management platform. Sustain. Cities Soc. 2024, 100, 105025. [Google Scholar] [CrossRef]
  9. Zaidi, N.H.M.; Haw, L.C. Decarbonization of tropical city using digital twin technology: Case study of Bertam city. Iop Conf. Ser. Mater. Sci. Eng. 2023, 1278, 012012. [Google Scholar] [CrossRef]
  10. Opoku, D.G.J.; Perera, S.; Osei-Kyei, R.; Rashidi, M. Digital twin application in the construction industry: A literature review. J. Build. Eng. 2021, 40, 102726. [Google Scholar] [CrossRef]
  11. Coakley, D.; Raftery, P.; Keane, M. A review of methods to match building energy simulation models to measured data. Renew. Sustain. Energy Rev. 2014, 37, 123–141. [Google Scholar] [CrossRef]
  12. De Wilde, P. The gap between predicted and measured energy performance of buildings: A framework for investigation. Autom. Constr. 2014, 41, 40–49. [Google Scholar] [CrossRef]
  13. Ruiz, G.R.; Bandera, C.F.; Temes, T.G.A.; Gutierrez, A.S.O. Genetic algorithm for building envelope calibration. Appl. Energy 2016, 168, 691–705. [Google Scholar] [CrossRef]
  14. Fernández Bandera, C.; Ramos Ruiz, G. Towards a new generation of building envelope calibration. Energies 2017, 10, 2102. [Google Scholar] [CrossRef]
  15. González, V.G.; Ruiz, G.R.; Bandera, C.F. Empirical and comparative validation for a building energy model calibration methodology. Sensors 2020, 20, 5003. [Google Scholar] [CrossRef]
  16. American Society of Heating Refrigerating and Air-Conditioning Engineers. The 2017 ASHARE Handbook Fundamentals; ASHRAE: Atlanta, GA, USA, 2017. [Google Scholar]
  17. Zhang, Y.; Korolija, I. Performing complex parametric simulations with jEPlus. In Proceedings of the SET2010-9th International Conference on Sustainable Energy Technologies, Shanghai, China, 24–27 August 2010; pp. 24–27. [Google Scholar]
  18. Deb, K.; Pratap, A.; Agarwal, S.; Meyarivan, T. A fast and elitist multiobjective genetic algorithm: NSGA-II. IEEE Trans. Evol. Comput. 2002, 6, 182–197. [Google Scholar] [CrossRef]
  19. Du, H.; Bandera, C.F.; Chen, L. Nowcasting Methods for Optimising Building Performance; ORCA, Online Research @ Cardiff: Cardiff, UK, 2019. [Google Scholar]
  20. Lucas Segarra, E.; Du, H.; Ramos Ruiz, G.; Fernández Bandera, C. Methodology for the quantification of the impact of weather forecasts in predictive simulation models. Energies 2019, 12, 1309. [Google Scholar] [CrossRef]
  21. Hong, T.; Lee, S.H. Integrating physics-based models with sensor data: An inverse modeling approach. Build. Environ. 2019, 154, 23–31. [Google Scholar] [CrossRef]
  22. Liddament, M.W. Air Infiltration Calculation Techniques: An Applications Guide; Air Infiltration and Ventilation Centre: Berkshire, UK, 1986. [Google Scholar]
  23. Lozinsky, C.H.; Touchie, M.F. The limitations of multi-zone infiltration algorithms in whole building energy simulation engines. In Proceedings of the eSim 2018, the 10th Conference of IBPSA-Canada, Montréal, QC, Canada, 9–10 May 2018; pp. 367–374. [Google Scholar]
  24. Walker, I.S.; Less, B.D.; Lorenzetti, D.; Sohn, M.; Casquero-Modrego, N. Compartmentalization and Ventilation System Impacts on Air and Contaminant Transport for a Multifamily. In Proceedings of the ASHRAE Buildings XV, Clearwater Beach, FL, USA, 5–8 December 2022. [Google Scholar]
  25. Meiss, A.; Feijó-Muñoz, J. The energy impact of infiltration: A study on buildings located in north central Spain. Energy Effic. 2015, 8, 51–64. [Google Scholar] [CrossRef]
  26. Kalamees, T.; Kurnitski, J.; Korpi, M.; Vinha, J. The distribution of the air leakage places and thermal bridges of different types of detached houses and apartment buildings. In Proceedings of the 2nd European BlowerDoor-Symposium Tight Building Envelope, Thermography and Dwelling Ventilation, Kassel, Germany, 16–17 March 2007; pp. 71–81. [Google Scholar]
  27. Goldwasser, D.; Ball, B.; Farthing, A.; Frank, S.; Im, P. Advances in calibration of building energy models to time series data: Preprint. In Proceedings of the ASHRAE and IBPSA-USA Building Simulation Conference, Chicago, IL, USA, 26–28 September 2018. [Google Scholar]
  28. Han, G.; Srebric, J.; Enache-Pommer, E. Different modeling strategies of infiltration rates for an office building to improve accuracy of building energy simulations. Energy Build. 2015, 86, 288–295. [Google Scholar] [CrossRef]
  29. Jokisalo, J.; Kurnitski, J.; Korpi, M.; Kalamees, T.; Vinha, J. Building leakage, infiltration, and energy performance analyses for Finnish detached houses. Build. Environ. 2009, 44, 377–387. [Google Scholar] [CrossRef]
  30. Feijó-Muñoz, J.; Pardal, C.; Echarri, V.; Fernández-Agüera, J.; de Larriva, R.A.; Calderín, M.M.; Poza-Casado, I.; Padilla-Marcos, M.Á.; Meiss, A. Energy impact of the air infiltration in residential buildings in the Mediterranean area of Spain and the Canary islands. Energy Build. 2019, 188, 226–238. [Google Scholar] [CrossRef]
  31. Hurel, N.; Leprince, V. VIP 46: Building Airtightness Impact on Energy Performance (EP) Calculations. Air Infiltration and Ventilation Centre (AIVC VIP 46). 2023, pp. 1–18. Available online: https://www.aivc.org/resource/vip-46-building-airtightness-impact-energy-performance-ep-calculations (accessed on 3 January 2024).
  32. Happle, G.; Fonseca, J.A.; Schlueter, A. Effects of air infiltration modeling approaches in urban building energy demand forecasts. Energy Procedia 2017, 122, 283–288. [Google Scholar] [CrossRef]
  33. Cardoso, V.E.; Pereira, P.F.; Ramos, N.M.; Almeida, R.M. The impacts of air leakage paths and airtightness levels on air change rates. Buildings 2020, 10, 55. [Google Scholar] [CrossRef]
  34. Hayati, A.; Mattsson, M.; Sandberg, M. Evaluation of the LBL and AIM-2 air infiltration models on large single zones: Three historical churches. Build. Environ. 2014, 81, 365–379. [Google Scholar] [CrossRef]
  35. Choi, K.; Park, S.; Joe, J.; Kim, S.I.; Jo, J.H.; Kim, E.J.; Cho, Y.H. Review of infiltration and airflow models in building energy simulations for providing guidelines to building energy modelers. Renew. Sustain. Energy Rev. 2023, 181, 113327. [Google Scholar] [CrossRef]
  36. Warren, P.; Webb, B. The relationship between tracer gas and pressurization techniques in dwellings. In Proceedings of the Proc. First Air Infiltration Center Conference, Windsor, ON, USA, 6–8 October 1980; pp. 245–276. [Google Scholar]
  37. Sherman, M.; Grimsrud, D. Measurement of Infiltration Using Fan Pressurization and Weather Data; Technical Report; Lawrence Berkeley National Lab. (LBNL): Berkeley, CA, USA, 1980. [Google Scholar]
  38. Walker, I.S.; Wilson, D.J. Field validation of algebraic equations for stack and wind driven air infiltration calculations. HVAC&R Res. 1998, 4, 119–139. [Google Scholar]
  39. Dols, W.S.; Emmerich, S.J.; Polidoro, B.J. Coupling the multizone airflow and contaminant transport software CONTAM with EnergyPlus using co-simulation. In Building Simulation; Springer: Berlin/Heidelberg, Germany, 2016; Volume 9, pp. 469–479. [Google Scholar]
  40. Bae, Y.; Joe, J.; Lee, S.; Im, P.; Ng, L. Evaluation of Existing Infiltration Models Used in Building Energy Simulation; Technical Report; Oak Ridge National Lab. (ORNL): Oak Ridge, TN, USA, 2021. [Google Scholar]
  41. González, V.G.; Bandera, C.F. A building energy models calibration methodology based on inverse modelling approach. In Building Simulation; Springer: Berlin/Heidelberg, Germany, 2022; pp. 1–16. [Google Scholar]
  42. Lee, S.H.; Hong, T. Validation of an inverse model of zone air heat balance. Build. Environ. 2019, 161, 106232. [Google Scholar] [CrossRef]
  43. Gu, L. Airflow network modeling in EnergyPlus. In Building Simulation; Springer: Berlin/Heidelberg, Germany, 2007; Volume 10. [Google Scholar]
  44. DoE, U. EnergyPlus Engineering Reference: The Reference to EnergyPlus Calculations; Lawrence Berkeley National Laboratory: Berkeley, CA, USA, 2021. [Google Scholar]
  45. McLeod, R.S.; Swainson, M.; Hopfe, C.J.; Mourkos, K.; Goodier, C. The importance of infiltration pathways in assessing and modelling overheating risks in multi-residential buildings. Build. Serv. Eng. Res. Technol. 2020, 41, 261–279. [Google Scholar] [CrossRef]
  46. Monari, F.; Strachan, P. Characterization of an airflow network model by sensitivity analysis: Parameter screening, fixing, prioritizing and mapping. J. Build. Perform. Simul. 2017, 10, 17–36. [Google Scholar] [CrossRef]
  47. Ng, L.C.; Persily, A.K.; Emmerich, S.J. Improving infiltration modeling in commercial building energy models. Energy Build. 2015, 88, 316–323. [Google Scholar] [CrossRef]
  48. Sherman, M.H.; Grimsrud, D.T. Infiltration-pressurization correlation: Simplified physical modeling. In Proceedings of the Conference of the American Society of Heating, Refrigeration and Air Conditioning Engineers, Denver, CO, USA, 3–7 February 1980. [Google Scholar]
  49. Persily, A.; Linteris, G. A comparison of measured and predicted infiltration rates. ASHRAE Trans. 1983, 89, 830640. [Google Scholar]
  50. Zheng, X.; Mazzon, J.; Wallis, I.; Wood, C.J. Airtightness measurement of an outdoor chamber using the Pulse and blower door methods under various wind and leakage scenarios. Build. Environ. 2020, 179, 106950. [Google Scholar] [CrossRef]
  51. Shrestha, S.; Hun, D.; Moss, C. Modeling Whole Building Air Leakage and Validation of Simulation Results against Field Measurements. In Whole Building Air Leakage: Testing and Building Performance Impacts; ASTM International: West Conshohocken, PA, USA, 2019. [Google Scholar]
  52. de Gids, W.; Sherman, M.; Janssens, A.; Delmotte, C.; Walker, I.; Borsboom, W.; Jones, B.; Linares, P.; Wahlgren, P.; Kolokotroni, M.; et al. AIVC Technical Note 70–40 years to Build Tight and Ventilate Right: From Infiltration to Smart Ventilation; INIVE EEIG: Brussels, Belgium, 2022; pp. 1–95. ISBN 2-930471-62-4. [Google Scholar]
  53. Roberti, F.; Oberegger, U.F.; Gasparella, A. Calibrating historic building energy models to hourly indoor air and surface temperatures: Methodology and case study. Energy Build. 2015, 108, 236–243. [Google Scholar] [CrossRef]
  54. Taddeo, P.; Ortiz, J.; Salom, J.; Segarra, E.L.; González, V.G.; Ruiz, G.R.; Bandera, C.F. Comparison of experimental methodologies to estimate the air infiltration rate in a residential case study for calibration purposes. In Proceedings of the 39th AIVC 2018-Smart Ventilation for Buildings, Juan-les-Pins, France, 18–19 September 2018; p. 68. [Google Scholar]
  55. Weather-driven infiltration and interzonal airflow in a multifamily high-rise building: Dwelling infiltration distribution. Build. Environ. 2020, 181, 107098. [CrossRef]
  56. Bastos Porsani, G.; Casquero-Modrego, N.; Echeverria Trueba, J.B.; Fernández Bandera, C. Empirical evaluation of EnergyPlus infiltration model for a case study in a high-rise residential building. Energy Build. 2023, 296, 113322. [Google Scholar] [CrossRef]
  57. ASTM D5157-2019; Standard Guide for Statistical Evaluation of Indoor Air Quality Models. American Society for Testing and Materials: West Conshohocken, PA, USA, 2019.
  58. Pourkiaei, S.M.; Romain, A.C. Exploring the Indoor Air Quality in the context of changing climate in a naturally ventilated residential Building using CONTAM. In Proceedings of the Indoor Air 2022, Kuopio, Finland, 18 February 2022. [Google Scholar]
  59. Emmerich, S.; Howard-Reed, C.; Nabinger, S. Validation of multizone IAQ model predictions for tracer gas in a townhouse. Build. Serv. Eng. Res. Technol. 2004, 25, 305–316. [Google Scholar] [CrossRef]
  60. Manning, C.G. Technology Readiness Levels. 2023. Available online: https://t.ly/sC2iK (accessed on 27 December 2023).
  61. Cui, S.; Cohen, M.; Stabat, P.; Marchio, D. CO2 tracer gas concentration decay method for measuring air change rate. Build. Environ. 2015, 84, 162–169. [Google Scholar] [CrossRef]
  62. Li, H.; Li, X.; Qi, M. Field testing of natural ventilation in college student dormitories (Beijing, China). Build. Environ. 2014, 78, 36–43. [Google Scholar] [CrossRef]
  63. ASTM E779-2019; Standard Test Method for Determining Air Leakage Rate by Fan Pressurization. American Society for Testing and Materials: West Conshohocken, PA, USA, 2019.
  64. ASTM E741-11(2017); Standard Test Method for Determining Air Change in a Single Zone by Means of a Tracer Gas Dilution. American Society for Testing and Materials: West Conshohocken, PA, USA, 2017.
  65. Sherman, M.H. Tracer-gas techniques for measuring ventilation in a single zone. Build. Environ. 1990, 25, 365–374. [Google Scholar] [CrossRef]
  66. ISO 9972:2015; Thermal Performance of Buildings, Determination of Air Permeability of Buildings, Fan Pressurization Method. ISO: Geneva, Switzerland, 2015.
  67. Emmerich, S.J.; Nabinger, S.J.; Gupte, A.; Howard-Reed, C. Validation of CONTAM predictions for tracer gas in a townhouse. In Proceedings of the 8th international IBPSA Conference, Eindhoven, The Netherlands, 11–14 August 2003; IBPSA: Eindhoven, The Netherlands, 2003; pp. 299–306. [Google Scholar]
  68. International Performance Measurement and Verification Protocol: Concepts and Options for Determining Energy and Water Savings; Technical Report; National Renewable Energy Lab.: Golden, CO, USA, 2018; Volume I, pp. 1–85. Available online: https://www.nrel.gov/docs/fy02osti/31505.pdf (accessed on 7 December 2023).
  69. Few, J.; Elwell, C.A. Applying the CO2 concentration decay tracer gas method in long-term monitoring campaigns in occupied homes: Identifying appropriate unoccupied periods and decay periods. Int. J. Build. Pathol. Adapt. 2023, 41, 96–108. [Google Scholar] [CrossRef]
Figure 1. Method flowchart.
Buildings 14 00421 g001
Figure 2. View from the ground towards the southeast and southwest façades of the building.
Buildings 14 00421 g002
Figure 3. Living room 3D view. Numbers indicate the height of the CO 2 sensor above the ground, measured in meters.
Buildings 14 00421 g003
Figure 4. IFC model results: CO 2 concentrations curves (measured and estimated) during P_1_T. h means hours.
Buildings 14 00421 g004
Figure 5. IFC model results: CO 2 concentrations curves (measured and estimated) during P_2_C. h means hours.
Buildings 14 00421 g005
Figure 6. IFC model results: CO 2 concentrations curves (measured and estimated) P_3_C. h means hours.
Buildings 14 00421 g006
Figure 7. ELA model results: CO 2 concentrations curves (measured and estimated) during P_1_T. h means hours.
Buildings 14 00421 g007
Figure 8. ELA model results: CO 2 concentrations curves (measured and estimated) during P_2_C. h means hours.
Buildings 14 00421 g008
Figure 9. ELA model results: CO 2 concentrations curves (measured and estimated) during P_3_C. h means hours.
Buildings 14 00421 g009
Figure 10. Flowchart of the model calibration with EnergyPlus infiltration models.
Buildings 14 00421 g010
Table 1. Technical information of the installed sensors.
DataSensor ModelUnityPrecisionRangeResolution
CO 2 Delta OHM HD37VBTV.1ppm±50 ppm0 to 5000 ppm1 ppm
EXTECH CO2100 to 9999 ppm
TemperatureHOBO ZW-006°C±2%−20 to 50 °C0.02 °C
Wind SpeedAHLBORN FVA 615-2m/s±0.5 m/s0 to 50 m/s0.1 m/s
Table 2. Sources of coefficients for IFC (Equation (1)) and for ELA (Equation (2)).
ModelIFC CoefficientsELA Coefficients
c s C s C w n A L C s C w
1. REGREGREGREGREGREGREGREGREG
2. REG + E+REGE+E+E+REGREGE+E+
3. BWD + REGBWDREGREGREGBWDBWDREGREG
4. BWD + E+BWDE+E+E+BWDBWDE+E+
Table 3. Statistical tools outlined in the ASTM D5157 Standard.
IndexDescriptionLimitation
R2Square of the correlation of predictions and measurements≥0.90
NMSENormalized mean square error≤0.25
mSlope of the line of regression0.75 ≤ m ≤ 1.25
FBNormalized or fractional bias of the mean concentration≤0.25
FSFractional bias based on the variance≤0.50
Table 4. Standard deviation ( σ ) and mean (µ) values for each measured data point in every period.
ParameterIndexP_1_TP_2_CP_3_C
CO 2 σ (ppm)316.80378.57278.47
µ (ppm)613.75561.14629.78
ΔT σ (°C)10.293.173.85
µ (°C)4.8013.0811.26
Wind speed σ (m/s)0.330.110.16
µ (m/s)0.180.130.13
Table 5. Results from the uncertainty analysis reveal the variation between the average data employed in the calculus of infiltration and the concentration of CO 2 recorded by every sensor.
Sensor Number and ModelR2RMSE
1. Delta OHM0.990.23
2. Delta OHM0.990.23
3. EXTECH0.980.39
4. EXTECH0.980.46
5. EXTECH0.960.46
Table 6. Results of IFC models following the ASTM D5157 Standard. (Models and values not in compliance with the standard are highlighted in red).
ModelPeriod C ¯ o (ppm) C ¯ p  (ppm)R2mbb/ C ¯ o  (%)NMSEFBFS
1. REGP_1_T613.87637.800.941.05−4.96−0.810.0190.0370.149
P_2_C559.27382.230.961.00−179.76−32.140.177−0.3760.027
P_3_C627.72577.880.941.09−107.86−17.180.026−0.0830.121
2. REG + E+P_1_T613.87637.800.720.81163.7126.670.0770.069−0.100
P_2_C559.27305.980.910.94−219.32−39.220.452−0.585−0.014
P_3_C627.72511.220.891.11−182.63−29.090.079−0.2050.156
3. BWD + REGP_1_T613.87637.800.941.05−7.86−1.280.0210.0370.164
P_2_C559.27398.970.961.00−160.78−28.750.139−0.3350.019
P_3_C627.72551.070.931.11−142.57−22.710.040−0.1300.136
4. BWD + E+P_1_T613.87637.800.640.86−86.69−14.120.276−0.3330.141
P_2_C559.27174.570.740.72−226.69−40.531.895−1.048−0.181
P_3_C627.72286.590.761.01−346.58−55.210.785−0.7460.147
Table 7. Results of ELA models following the ASTM D5157 Standard. (Models and values not in compliance with the standard are highlighted in red).
ModelPeriod C ¯ o (ppm) C ¯ p  (ppm)R2mbb/ C ¯ o  (%)NMSEFBFS
1. REGP_1_T613.87637.800.941.038.641.410.0180.0390.111
P_2_C559.27470.400.991.03−106.68−19.070.038−0.1730.038
P_3_C627.72601.130.941.08−75.83−12.080.019−0.0430.109
2. REG + E+P_1_T613.87637.800.720.80176.9828.830.0770.080−0.129
P_2_C559.27390.620.961.00−166.81−29.830.159−0.3550.019
P_3_C627.72541.760.901.10−146.86−23.400.053−0.1470.144
3. BWD + REGP_1_T613.87637.800.941.038.611.400.0180.0390.111
P_2_C559.27470.390.991.03−106.68−19.070.038−0.1730.038
P_3_C627.72601.130.941.08−75.84−12.080.019−0.0430.109
4. BWD + E+P_1_T613.87637.800.600.81−172.89−28.160.651−0.6120.099
P_2_C559.27143.270.680.64−213.84−38.242.735−1.184−0.252
P_3_C627.72231.270.700.92−347.35−55.341.278−0.9230.097
Table 8. IFC coefficients. (Highlighted in bold are those provided in the EnergyPlus Input Output Document).
ModelIFC Coefficients
cs C s C w n
1. REG9.9 × 10−31.290.0380.3440.600
2. REG + E+0.005000.700.0980.1510.600
3. BWD + REG0.007881.260.0410.3820.704
4. BWD + E+0.007880.700.0980.1510.704
Table 9. ELA coefficients. (Highlighted in bold are those provided in the EnergyPlus Input Output Document).
ModelELA Coefficients
A L C s C w
1. REG104.460.000020.00197
2. REG + E+27.310.000440.00027
3. BWD + REG75.600.000030.00377
4. BWD + E+75.600.000440.00027
Disclaimer/Publisher’s Note: The statements, opinions and data contained in all publications are solely those of the individual author(s) and contributor(s) and not of MDPI and/or the editor(s). MDPI and/or the editor(s) disclaim responsibility for any injury to people or property resulting from any ideas, methods, instructions or products referred to in the content.