Article

Performance and Lifecycle of Hot Asphalt Mix Modified with Low-Percentage Polystyrene and Polybutadiene Compounds

1
Department of Construction Management, Faculty of Civil Engineering, University of Zilina, Univerzitna 8215/1, 01026 Zilina, Slovakia
2
Department of Road Engineering, Kielce University of Technology, Al. Tysiaclecia P.P. 7, 25-314 Kielce, Poland
*
Author to whom correspondence should be addressed.
Buildings 2024, 14(2), 389; https://doi.org/10.3390/buildings14020389
Submission received: 8 December 2023 / Revised: 19 January 2024 / Accepted: 22 January 2024 / Published: 1 February 2024
(This article belongs to the Special Issue Advanced Asphalt Pavement Materials and Design)

Abstract

:
The paper investigates the improvement of bitumen mixture fatigue resistance and the rutting performance by using a specific low percentage of a styrene–butadiene–styrene (SBS) polymer, which contains polystyrene and polybutadiene compounds. A Fourier transform infrared (IR-FT) spectroscopy of the SBS polymer used in following test was carried out to ascertain the polybutadiene and polystyrene compound ratio, which may affect the modificant properties. Unmodified, low-percentage modified SBS, and common polymer-modified bitumen (PMB) as a reference were tested to ascertain the properties, fatigue resistance, and the rutting performance. The test results of the low-percentage modification with SBS are compared against unmodified mixtures and standard PMB mixtures. Finally, a simulation of the practical application was performed using the HDM-4 software (version 2.0), where the material research findings, with an emphasis on the rutting performance, were translated into the pavement performance with a varying binder course layer under simulated traffic conditions. Lifecycle analysis, with a focus on emissions production (CO2, SO2, and NOx) during pavement operation, was conducted for pavements with unmodified, low-percentage modified SBS, and standard PMB binder courses. The lifecycle analysis showed that a 3% modification of the binder course with the SBS polymer can extend the rutting parameter pavement lifecycle by approximately 34.5%, which is about half of the extension provided by the standard PMB modification. The resulting improvement in the pavement serviceability translated to a 9% reduction in CO2 and SO2 emissions and a 7.2% reduction in NOx emissions over a 20-year period.

1. Introduction

Emerging challenges in pavement asset management call for technological solutions for aging road infrastructure and more resilient new pavements. These solutions should provide the required level of service to minimize the cost and energy demands and provide improved pavement performance. Both components of pavement performance, the pavement operational capability and pavement serviceability, must provide the required level of service of new and repaired pavements. Challenges, such as the increase in traffic volume, the weight of vehicles, climate change, and budget limitations, place a high demand for solutions that use common materials and procedures in new and innovative ways [1,2].
Plastic deformation, be it longitudinal or transversal, directly influences pavement serviceability and is a good predictor for pavement reliability [3,4,5]. Plastic deformation manifests itself in the surfacing and binder course layers as a result of traffic loading under certain weather conditions [6], and can be propagated into the deeper road structure. Reversely, it can be propagated from the deeper layers onto the surfacing and binder course layers as a result of drainage construction errors [7]. Approximately 85~95% of rutting happens in bitumen mixture surface and binder course layers if water is not allowed to affect the unbound layers [8].
The ability of bitumen mixtures to withstand plastic deformation is highly desirable [9,10,11], although high-quality paving materials resistant to rutting come with an economic cost that needs to be considered.
Bitumen mixtures can be defined as a composite material, consisting of different fractions of aggregate and bitumen binders. Rutting resistance is influenced by the type and ratio of the aggregate in the mix, as well as its gradation and volumetric parameters [12]. For bitumen mixtures with the same aggregate ratios, the decisive factor for plastic deformation resistance is the properties of the bitumen binder. The properties of the bitumen binder and the bitumen–aggregate interaction in the mixtures were highly influenced by the bitumen composition. The most important factors were the bitumen source and technological factors of the crude oil processing, as described in case studies [13,14]. These properties can be improved, and several modifiers are known to positively impact the properties of the pavement layers. The addition of a modifier is a proven method to enhance the bitumen properties, such as the elastic recovery, rheological properties, binder–aggregate interaction, the aging process, and the rutting resistance [15,16].
One of the most-used types of modification for the hot mix with bitumen is the use of SBS [17,18]. These polymers are thermoplastic rubbers and exhibit a two-phase morphology, a glassy phase of the polystyrene terminal blocks, with a glass transition (Tg) around 100 °C, and an elastomeric phase due to the polybutadiene central blocks (Tg ≅ –80 °C) [19]. At an SBS concentration between a 3 and 5% dosage of the bitumen weight, a polymer network is homogenously formed throughout the bitumen matrix, and this significantly changes the bitumen properties [20,21].
The modification of hot-mix bitumen provides functional benefits [22]; however, it comes with downsides, such as the higher technological complexity of the mixing process. The addition of SBS polymer to the bitumen mixture requires a separate continual mixing and heating procedure. This procedure is necessary to prevent the phase separation of the bitumen and SBS polymer [23,24,25].
Previous research [26] focused on a combination of polybutadiene (as a crumb rubber) and styrene–isoprene–styrene (SIS). This research has shown that this combination can provide satisfactory low–high temperature performance. In addition, findings in [27] show that the utilization of polybutadiene rubber polymer improved the stability when storing the modified bitumen. The addition of at least 1% of polybutadiene rubber polymer improved the performance of the bitumen.
Unfortunately, such a procedure comes with high energy demands. Additional costs also arise from the need for special heated containers needed for storing SBS-modified bitumen. To economize these costs, it is usual to use the entire amount of the SBS-modified bitumen in the production process to prevent leftovers. The highest phase separation in the stored SBS-modified bitumen occurred in the first 3 days of storing, and in a concentration between 3 and 6% of the SBS in the mix [28]. The storage stability improvement through the SBS modification depended on the structural parameters of the bitumen used in their preparation [29].
For that reason, this research focused on the impact of the bitumen mixtures modified to increase the rutting resistance with the SBS polymer in a ratio within 3% of the binder content.
The objective was to ascertain whether the SBS modification within the ≤3% range resulted in an economically viable improvement of the properties of the final bituminous mix, specifically the pavement, where the mix was used in the pavement structure. The scheme shown in Figure 1 shows the research design.
The effect of the application of a low-percentage modification using PS and PB compounds was verified on road bitumens with a penetration grade of 50/70 and 35/50 produced by TOTAL in accordance with [30], EN 12591:2009, Bitumen and bituminous binders–Specifications for paving grade bitumens. For comparison, the reference bitumen 10/40–65 was chosen in accordance with [31], EN 14023:2010, Bitumen and bituminous binders–Specification framework for polymer modified bitumens. Three mixtures were prepared using road bitumen 50/70 and 3% PS and PB compounds, and three reference mixtures using the reference bitumen 10/40–65.

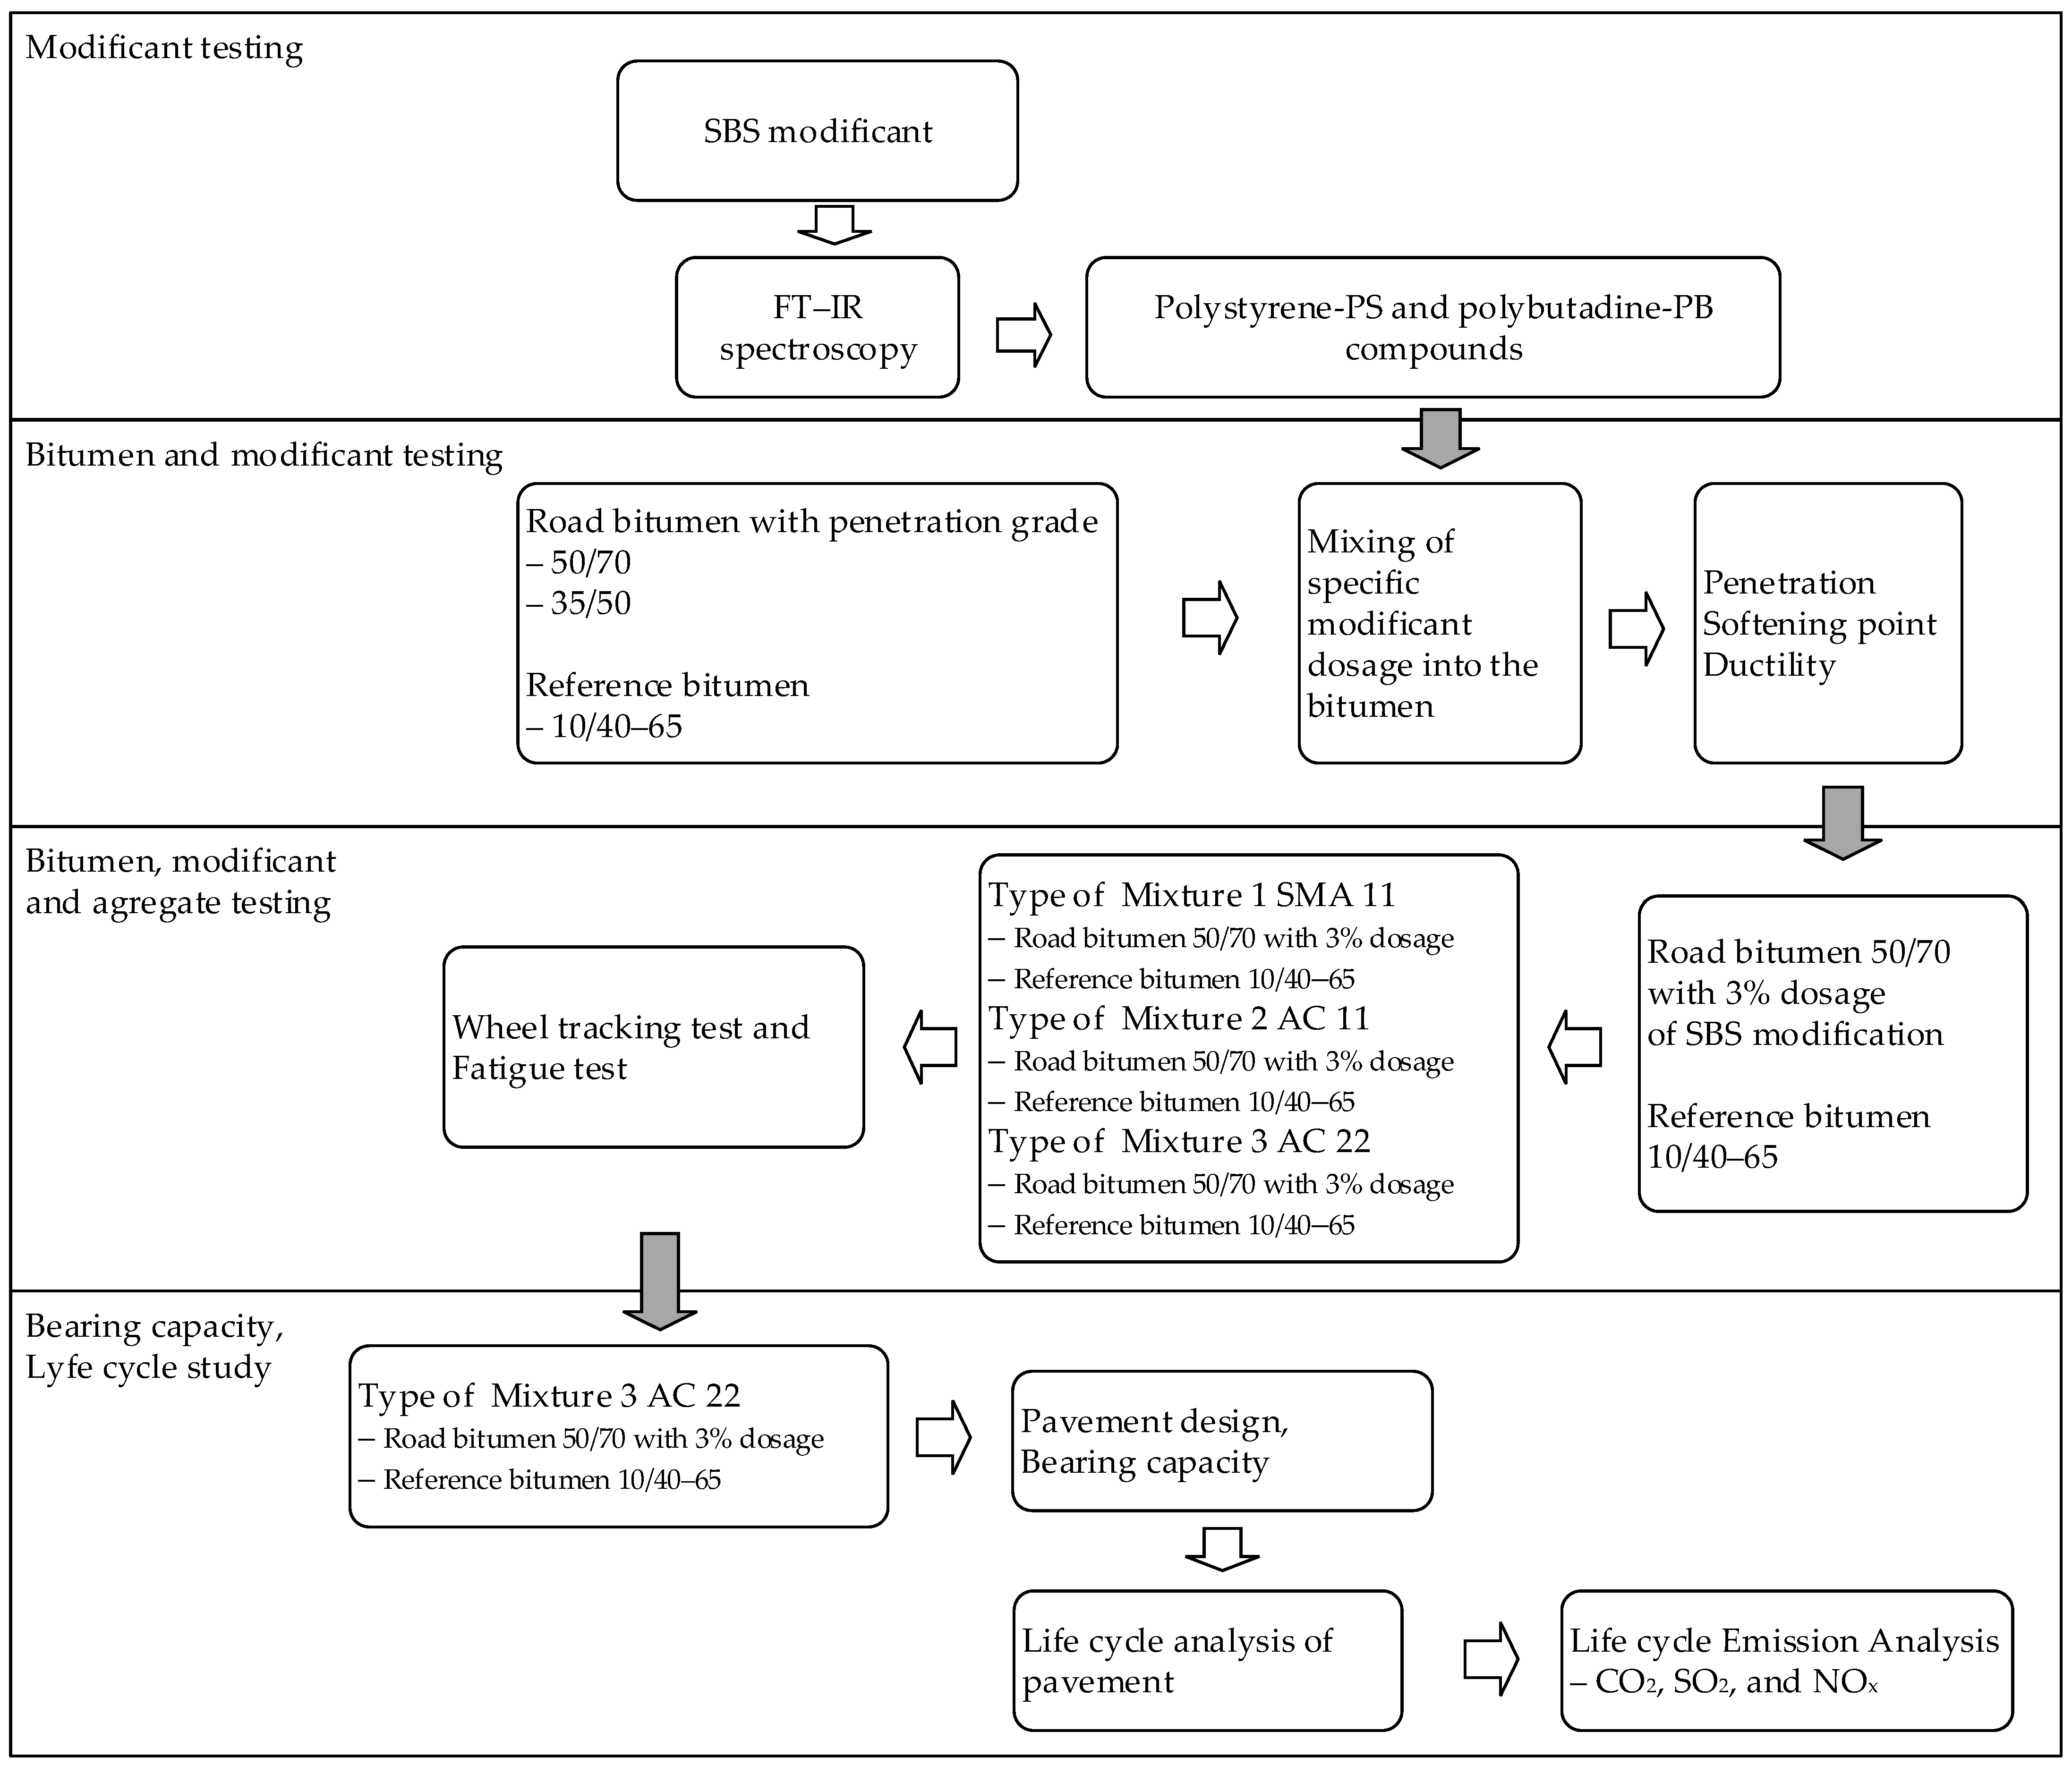
2. Materials and Methodologies

The following materials were used for the research:
  • Road bitumen 35/50;
  • Road bitumen 50/70;
  • SBS polymer;
  • Reference road bitumen 10/40–65;
  • Natural crushed aggregates (several sources of aggregates used melaphyre, andesite, and dolomite filer).
In the modificant testing phase, the composition of the SBS polymer was ascertained by FT-IR spectroscopy and compared with commonly used polymers, as described in Section 3.
In the modificant and bitumen testing phase, the polymer was added to both the 35/50 and the 50/70 bitumen to reach 2%, 2.5%, 3%, and 3.5% concentrations. Both types of bitumens were preheated to 175 °C ± 5 °C, and the modificant was added during constant stirring for 60 min at speed levels ranging from 800 to 2400 rpm. The samples were tested for their penetration, wetting point, and elastic recovery. The testing methodology is described in Section 4.
In the hot asphalt mix testing phase, the mixtures (bitumen with aggregate) were prepared in the AMMAN asphalt-mixing plant. The hot mix was created at 160–185 °C. The samples were created at 170 °C in the CONTROLS Standard Asphalt Slab Roller Compactor following EN 12697-33 [32]. The finished samples were tested for bulk density, wheel tracking, and fatigue; these tests are described in Section 5.

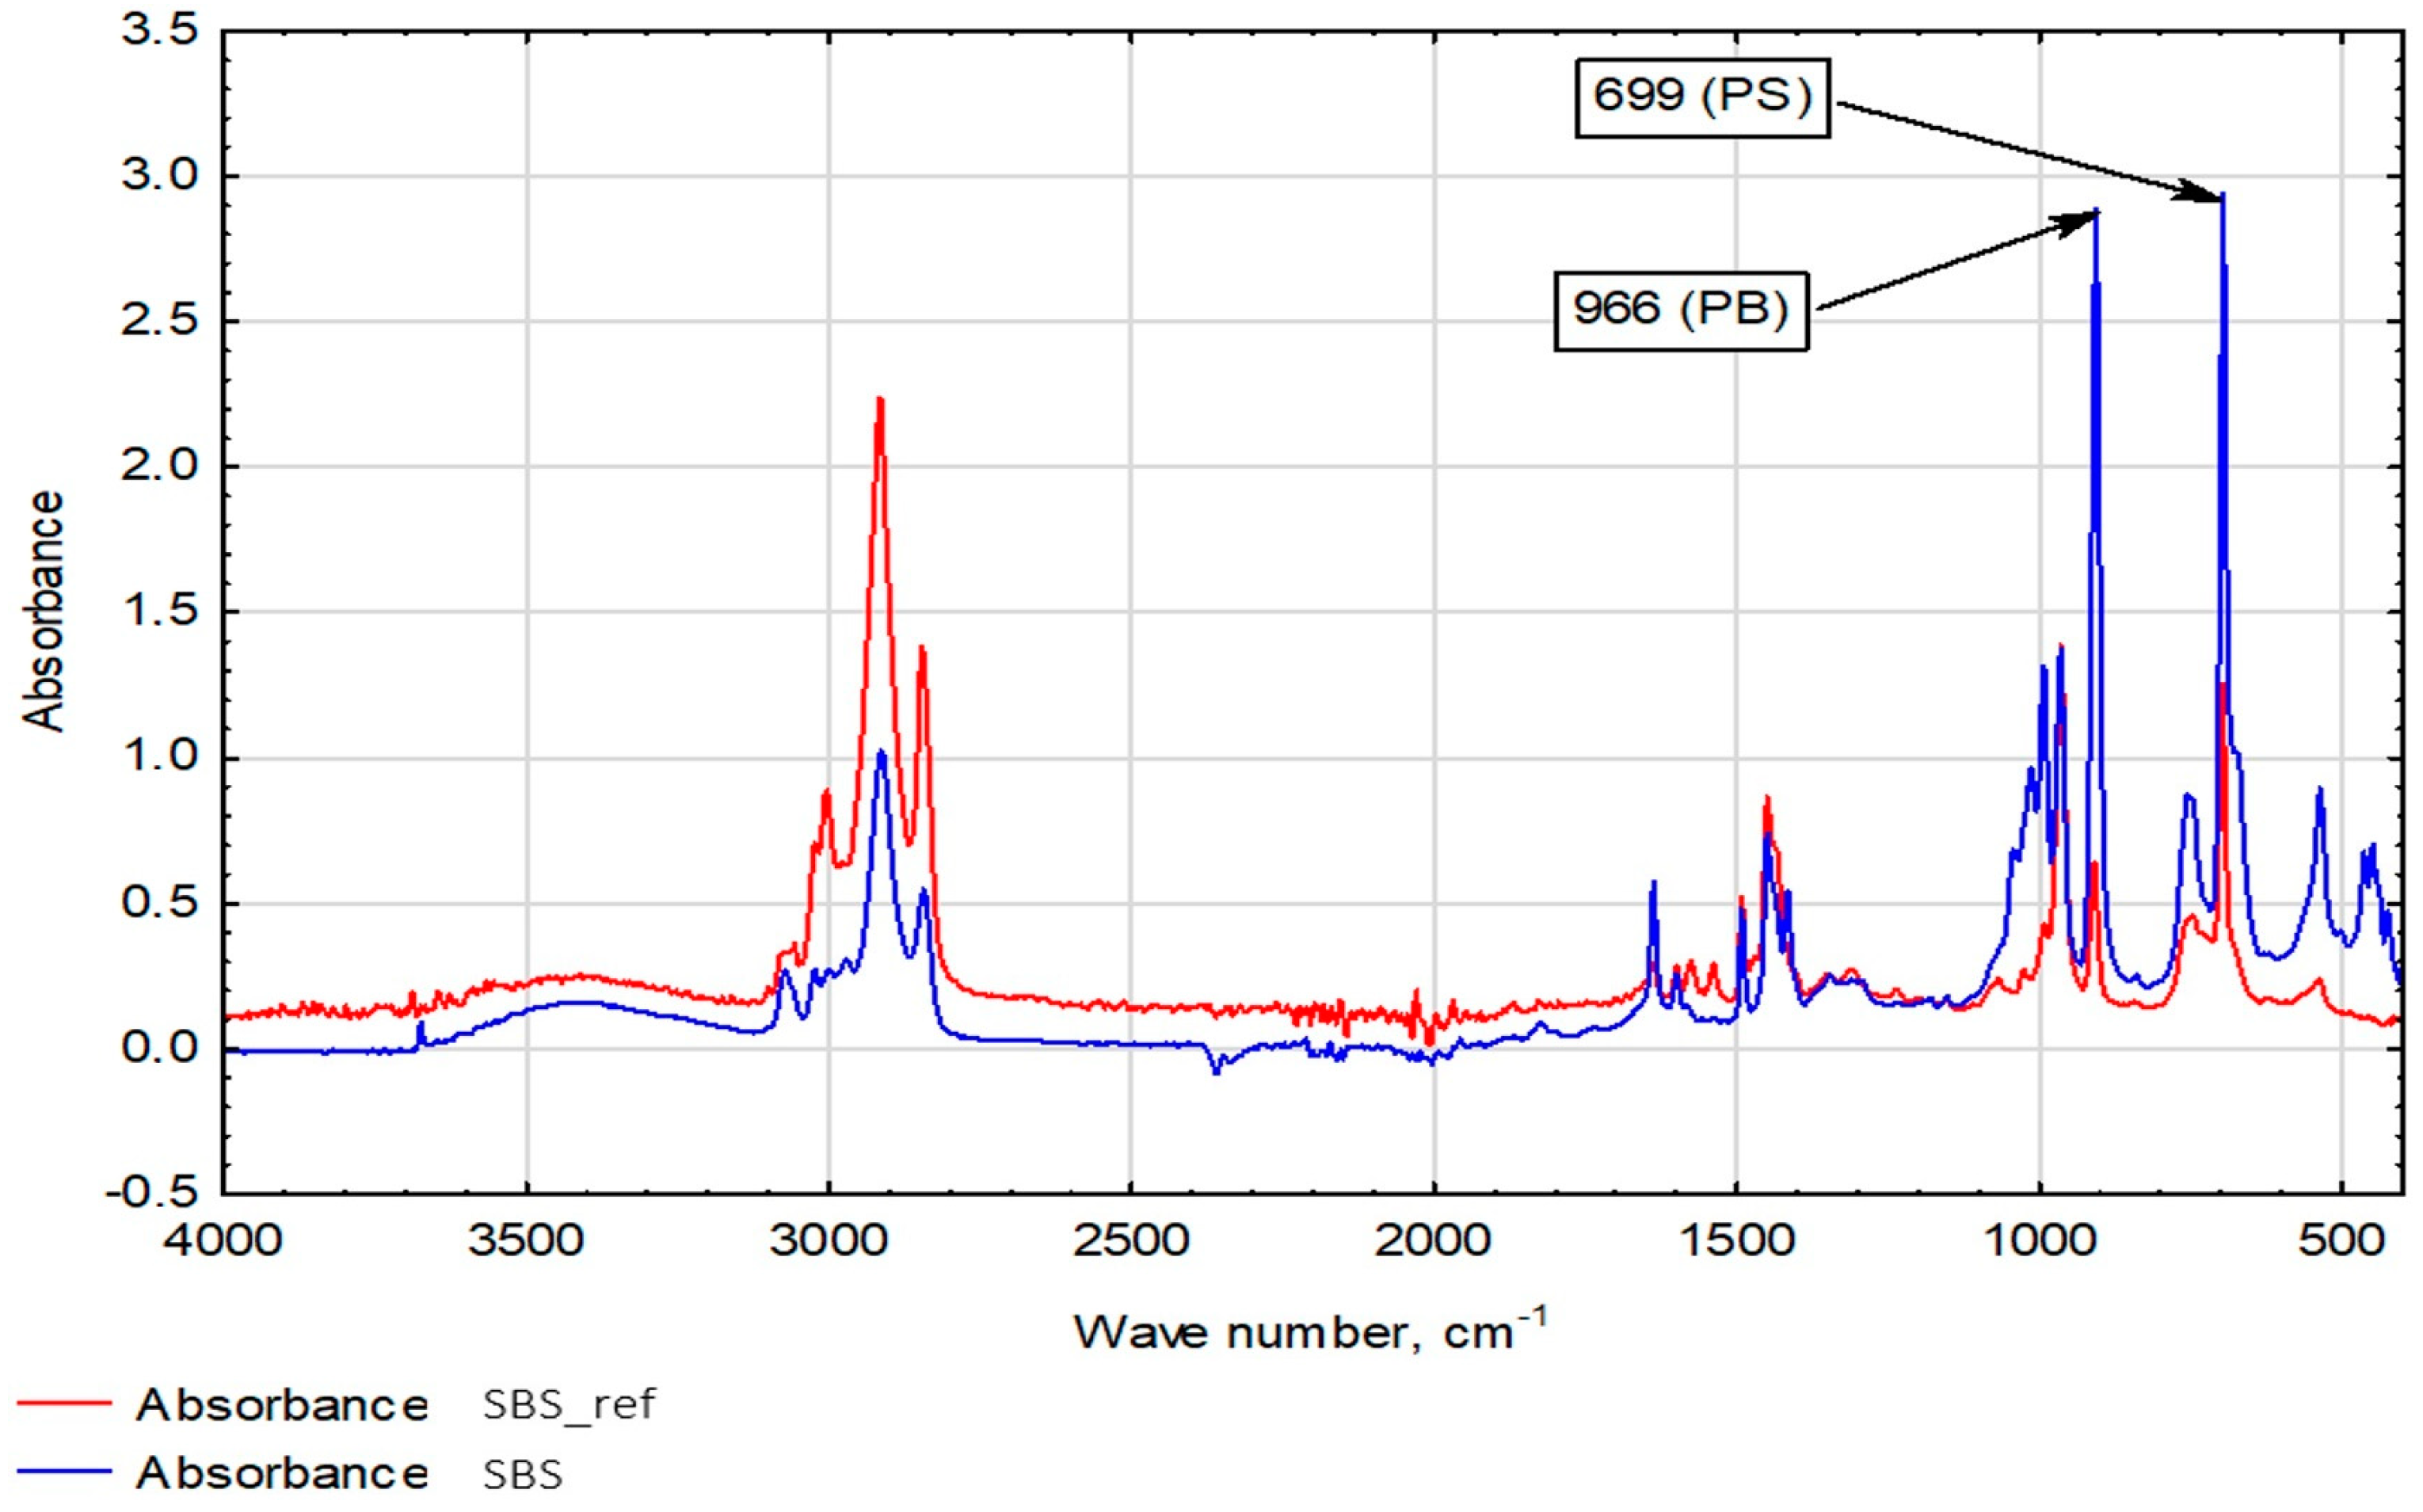
3. Modificant Testing—FT-IR Spectroscopy

The attenuated total reflection (ATR) of the FTIR allowed for the determination of the oxidization degree, and also the quantitative evaluation of the impact of certain bitumen additives by measuring the spectrum of the absorption of certain functional groups [33]. In the case of the polymer sample’s testing, some radiation was subject to reflection, and some was absorbed by the sample. Taking into consideration the crystal’s (diamond’s) background, it was possible to obtain the sample’s specific spectrum. The test results’ evaluation featured an analysis of the surface fields of the absorption bands obtained for a given polymer prior to and after foaming. The test was conducted using the FTIR spectrometer from Nicolet iS5 (ThermoFisher Scientific, Madison, WI, USA) in the spectral range of 7800 cm−1 ÷ 350 cm−1 with the ATR (attenuated total reflectance) attachment (PIKE GladiATR, Madison, WI, USA). The obtained absorption spectra were initially corrected by the introduction of a baseline correction and correction characteristic for the ATR attachment. On the basis of the work by Canto et al. [34] and Luo et al. [35], the spectra analysis for the SBS copolymer generally relied on two peak areas that were taken into consideration. In the spectral analysis, the main emphasis was placed on the comparison of the share of polybutadiene (PB) and polystyrene (PS). According to [34], the absorbance ratio at 966 cm−1 vs. 699 cm−1 is linearly related to the ratio of PB/PS and can be expressed by the equation obtained from linear fit of the FTIR experimental data: (A966 cm−1/A699 cm−1) = 0.42695 [PB]/[PS] − 0.01514. The use of this simple relationship allows for a quick estimation of the proportion between the amount of polystyrene and polybutadiene in the composition of the SBS copolymer. The analysis featured the referenced SBS_REF copolymer (Konimpex, Konin, Poland) for comparative purposes. This copolymer is commonly used for manufacturing commercial polymer-modified bitumen. The main analysis used an SBS copolymer of the polystyrene and polybutadiene compounds (marked as SBS). The FTIR spectra of two SBSs are shown in Figure 2.
The analysis presented in Figure 2 indicates that the polymers used, despite the fact that they belong to the same group of copolymers, exhibited some differences in their composition, especially regarding the phase proportions: PB and PS. To perform a comparative analysis and to determine the proportions between the PS and PB, the analysis of the areas of the characteristic peaks (699 cm−1 and 966 cm−1) was used. Taking into account the relationship given in [34], it was initially determined that, in the SBS_REF-type copolymer, the PB/PS phase ratio was 80.5/19.5, while in the case of the SBS copolymer, the proportion was 51/49. Therefore, it is expected that the SBS copolymer used in the tests will be characterized by a favorable balanced interaction of the PS phase (influencing the increase in the stiffness of the bitumen) and the PB phase (influencing the increase in the elasticity of the polymer-modified bitumen). In the case of the SBS_REF copolymer, the share of the PS phase dominated, which may increase the stiffness with the reduced elasticity of the bitumen modified with this copolymer.

4. Bitumen and Modificant Testing—Penetration, Softening Point, and Elastic Recovery Test

The penetration, softening point, and elastic recovery tests were carried out for the modified bitumen mixtures, two of which were modified with the SBS polymer in ratios ranging from 2 to 3.5%, and a PMB-modified bitumen was tested as a reference.
All samples were prepared and subjected to penetration, softening point, and elastic recovery tests. The basic test of the modified bitumen was a penetration test at 25 °C according to EN 1426 [36], a softening point test according to EN 1427 [37], and an elastic recovery test according to EN 13398 [38] at 25 °C.
After casting the mixtures into the prescribed standard molds for the softening point and elastic recovery, the unmodified castings were left to rest at 20 °C for 60 min. Subsequently, excess material was removed from the top edge of the samples.
For the elastic recovery test, the samples were placed in a water bath and tempered at 25 °C for 90 min. Each sample was then stretched in accordance with the standard in a constant-temperature water bath at a constant rate of 50 mm/min to the prescribed length of 200 mm; subsequently, the bitumen thread was prebroken in the center within 10 s. After 30 min, a value was read for each sample and the elastic recovery was calculated via Equation (1):
R E = d L × 100
where L is the length of the bitumen thread = 200 mm or the length at which premature rupture was reached, and d is the distance between the half-threads after 30 min.
Two samples per each modificant dosage were performed. If the result varied by 5% or more, the test was repeated. The results are shown in Table 1.
For the softening point test, the samples were placed in test molds and a water bath, in which the temperature was maintained at 5 °C for 15 min. Subsequently, the softening point was measured as the temperature at which steel bearing balls placed on top of the sample touched the steel plate beneath the sample. Two samples per each modificant dosage were performed. If the result varied by more than 1 °C, the test was repeated. The results are shown in Table 1.
For the penetration test, the mixtures were cast in casts for 100 g samples with a depth of 35 mm and a diameter of 55 mm. After the casting and cooling of the covered samples at an ambient temperature of 15–30 °C for 60–90 min, the samples were tempered at 25 °C for 60 min. The total needle load was 100 g and the penetration time was 5 s. As in previous tests, two samples per each modificant dosage were performed. The results are shown in Table 1.
In this table, we can see that, even at low percentages, the SBS modification provided an increase in the bitumen properties up to the concentration of 3%. At 3.5%, the property improvement, namely, the hardness (the penetration resistance) and heat resistance (the softening point), started to stagnate due to the lack of SBS preheating and the possibility of an ensuing phase separation.
An SBS concentration as low as 2% increased the final bitumen properties. At a 3% concentration, the hardness (the penetration resistance) and heat resistance (the softening point) with the road bitumen 50/70 peaked. In comparison with a reference PMB bitumen mixture, these improvements were modest, which was expected to manifest in the following wheel tracking test.
In conclusion, based on the results, the next bituminous binders were chosen for further testing:
  • Road bitumen 50/70 + 3% SBS;
  • Road bitumen 10/40–65 reference.
The road bitumen 50/70 + 3% SBS yielded the best result without the phase separation and the road bitumen 10/40–65 was used as a reference. The following step was used to measure the resistance to the rutting of the bitumen mixtures made with the use of these binders. The aim was to ascertain the technical viability of low-percentage SBS modification compared to the unmodified and modified reference mixtures.

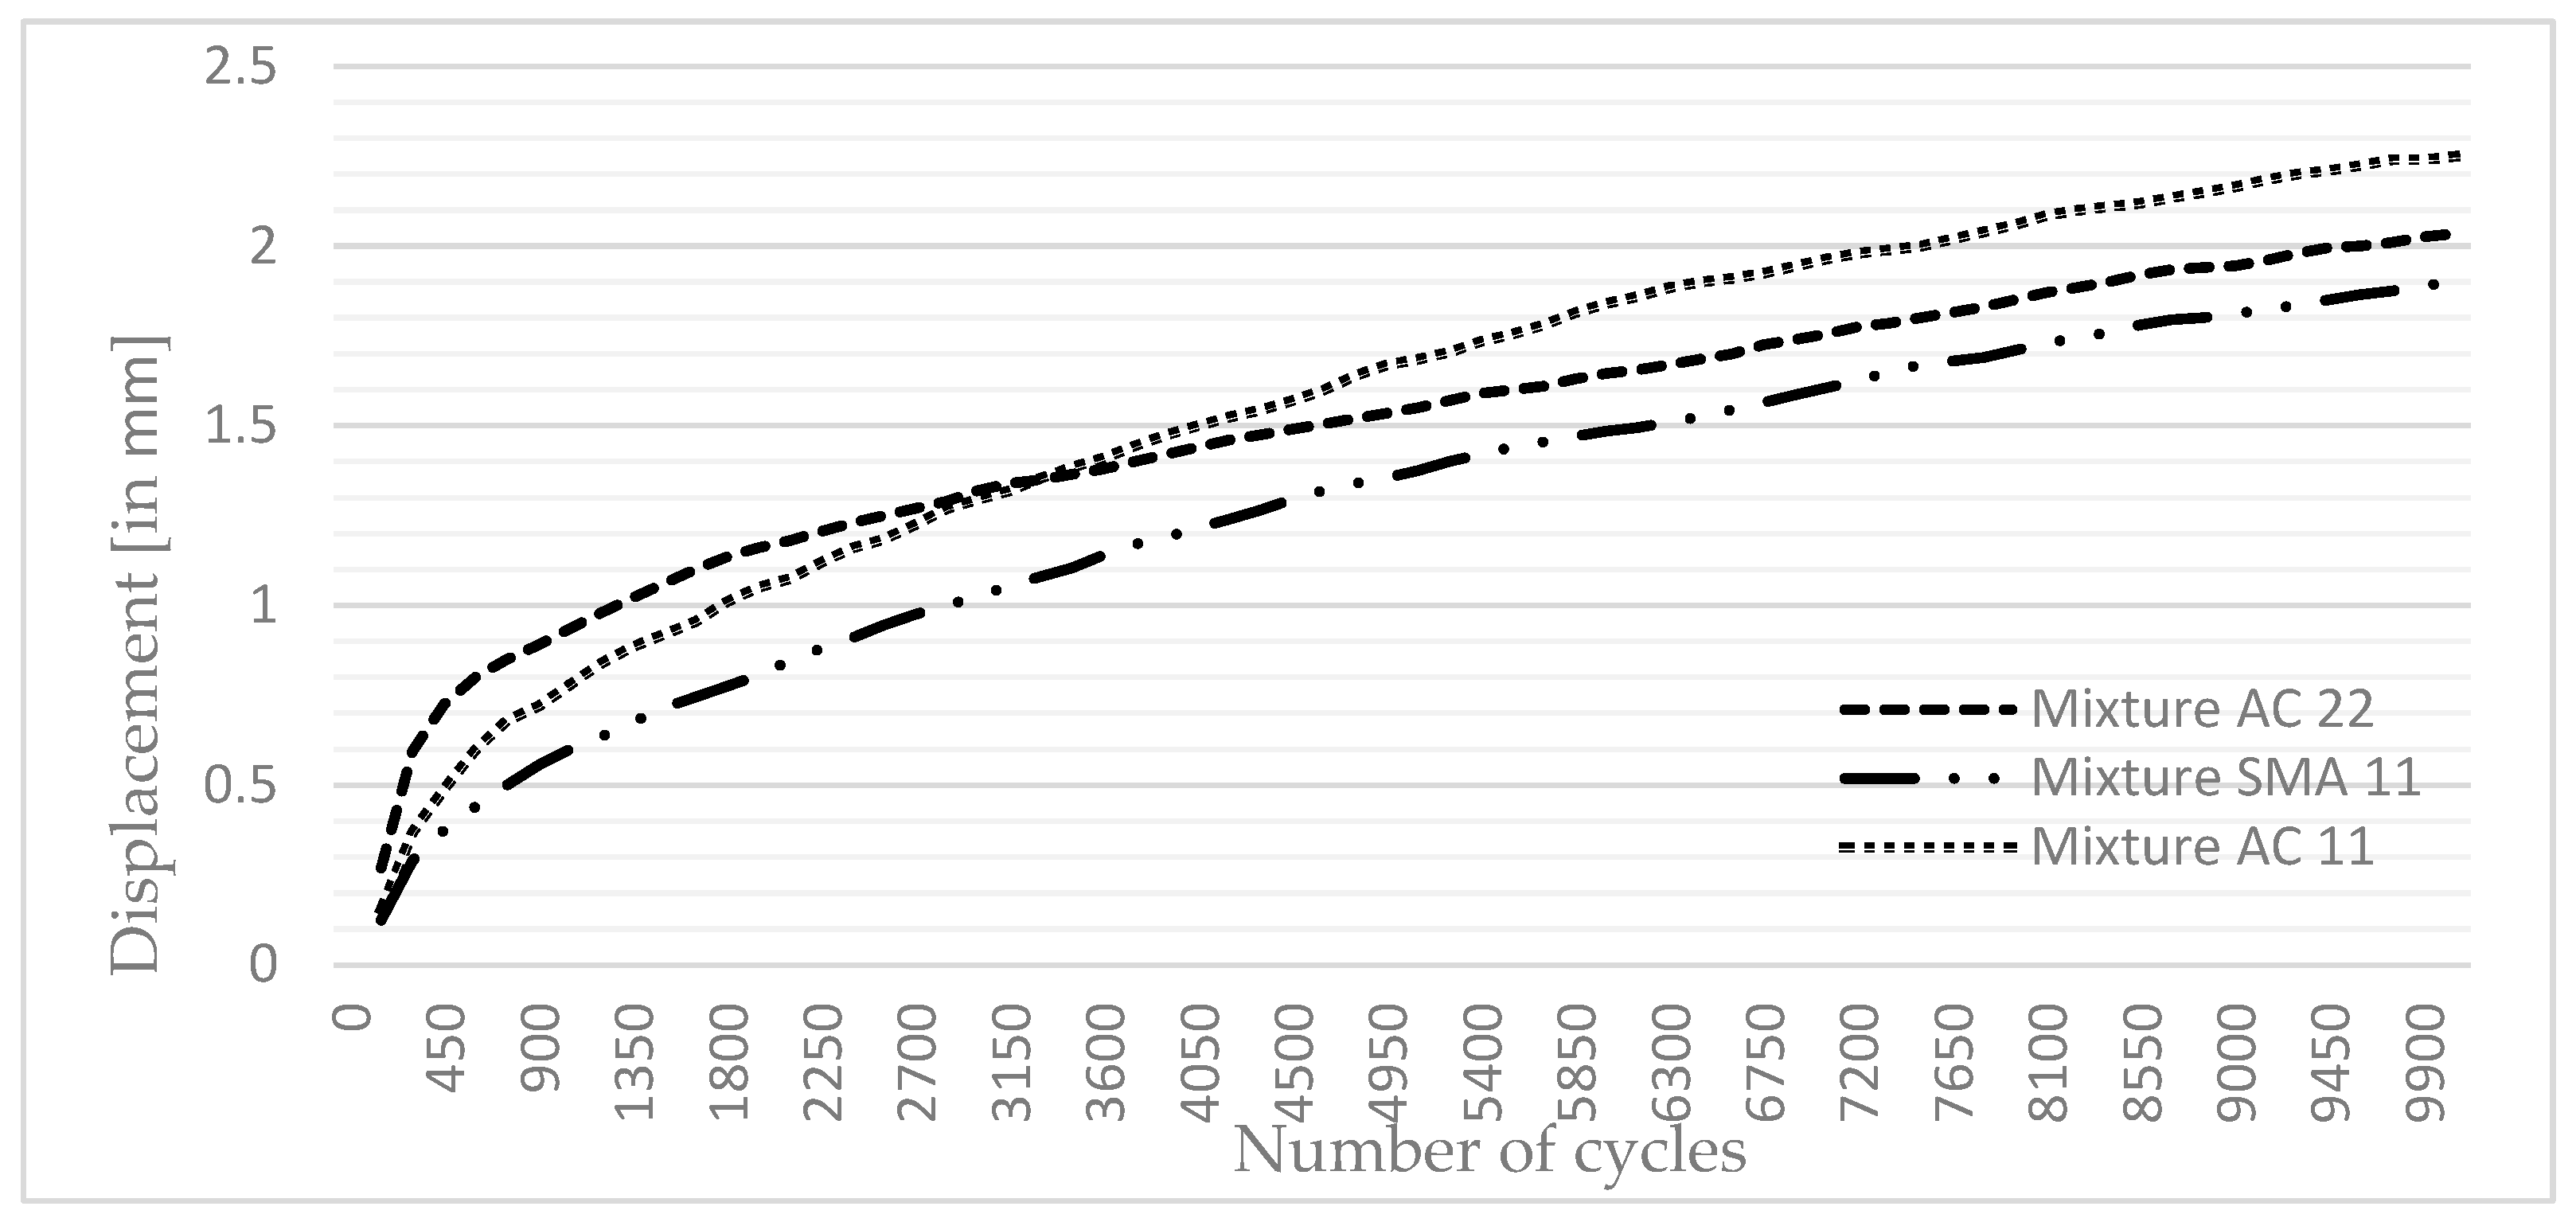
5. Hot Asphalt Mix Testing—The Wheel Tracking Test and the Fatigue Test

The rutting resistance of a bitumen mixture can be ascertained by plastic deformation laboratory testing. Several plastic deformation laboratory testing methods are available [39,40]. These differ by the loading type and the shape of the samples. In principle, we can divide them into large or extra-large and small-sized wheel tracking test devices (WTT).
For this experiment, a small-sized single-wheel WTT device was used following EN 12697-22 [41], fitted with 200 mm diameter treadles tires, with a tire width of 50 mm and thickness of 20 mm. The tire shell was made from solid rubber, with a hardness number of 80 IRHD (International Rubber Hardness Degree).
Following the conclusion of the penetration, softening point, and elastic recovery test presented in the previous section, the rut resistance WTT test and fatigue evaluation, following EN 12697-24 [42], was carried out on three different types of bitumen mixtures with the same type and size of aggregate. The variable was the type of binder specified in the previous section:
  • Road bitumen 50/70 + 3% modifier;
  • Road bitumen 10/40–65 reference.
Three bitumen mixtures were prepared with the use of these binders: SMA11, AC 11, and AC 22. The size of the samples was selected based on the maximal aggregate grain size. The type of mixtures, with the thickness of the samples, the temperature, and the loading conditions, are presented in Table 2. Each type of mixture has a specific aggregate composition, as shown in Figure 3.
The WTT rut-resistance test was carried out on three different types of mixtures—SMA11, AC11, and AC 22. For each mixture, ceteris paribus, two types of bitumen were used—road bitumen 50/70 + 3% SBS and, as a reference, road bitumen 10/40–65. The test samples were as follows:
  • Mixture 1 (SMA11)—length 400 mm, width 300 mm, height 40 mm, weight 11.43 kg, volume 0.0048 m3, and density 2381 kg/m3. The results for Mixture 1 are shown in Table 3.
  • Mixture 2 (AC11)—length 400 mm, width 300 mm, height 41 mm, weight 11 kg, volume 0.0049 m3, and density 2236 kg/m3. The results for Mixture 2 are shown in Table 4.
  • Mixture 3 (AC22)—length 400 mm, width 300 mm, height 80 mm, weight 21.62 kg, volume 0.0096 m3, and density 2252 kg/m3. The results for Mixture 3 are shown in Table 5.
Each sample was evaluated according to PN—EN 12697-22 and 12697-24 [41,42] for:
  • The wheel-tracking slope (WTS), calculated as the mean rate at which the rut depth increased with repeated passes of a loaded small-sized device, model B, in millimeters.
  • The rut depth (RD) of the material using a small-sized device, in millimeters.
  • The mean proportional rut depth (PRD) for the material using a small-sized device, in %.
  • Resistance to fatigue (ɛ6).
Table 3, Table 4 and Table 5 show the results from the measurements on both samples as an average from those measurements with the reference mixture.
The SMA11 sample is equivalent to the same rut resistance as the mixture created with the modified reference bitumen 10/40–65.
The AC11-O sample with 3% of the SBS polymer is equivalent to an 89.9% rut resistance compared to the mixture created with the reference bitumen 10/40–65.
The AC22 sample is equivalent to 76% of the rut resistance compared to the mixture created with reference bitumen 10/40–65. This is the worst result of all three mixtures.
For illustration, the average displacement on the samples with the 3% SBS modifier for all three mixtures relative to the number of loading cycles is shown in Figure 4.

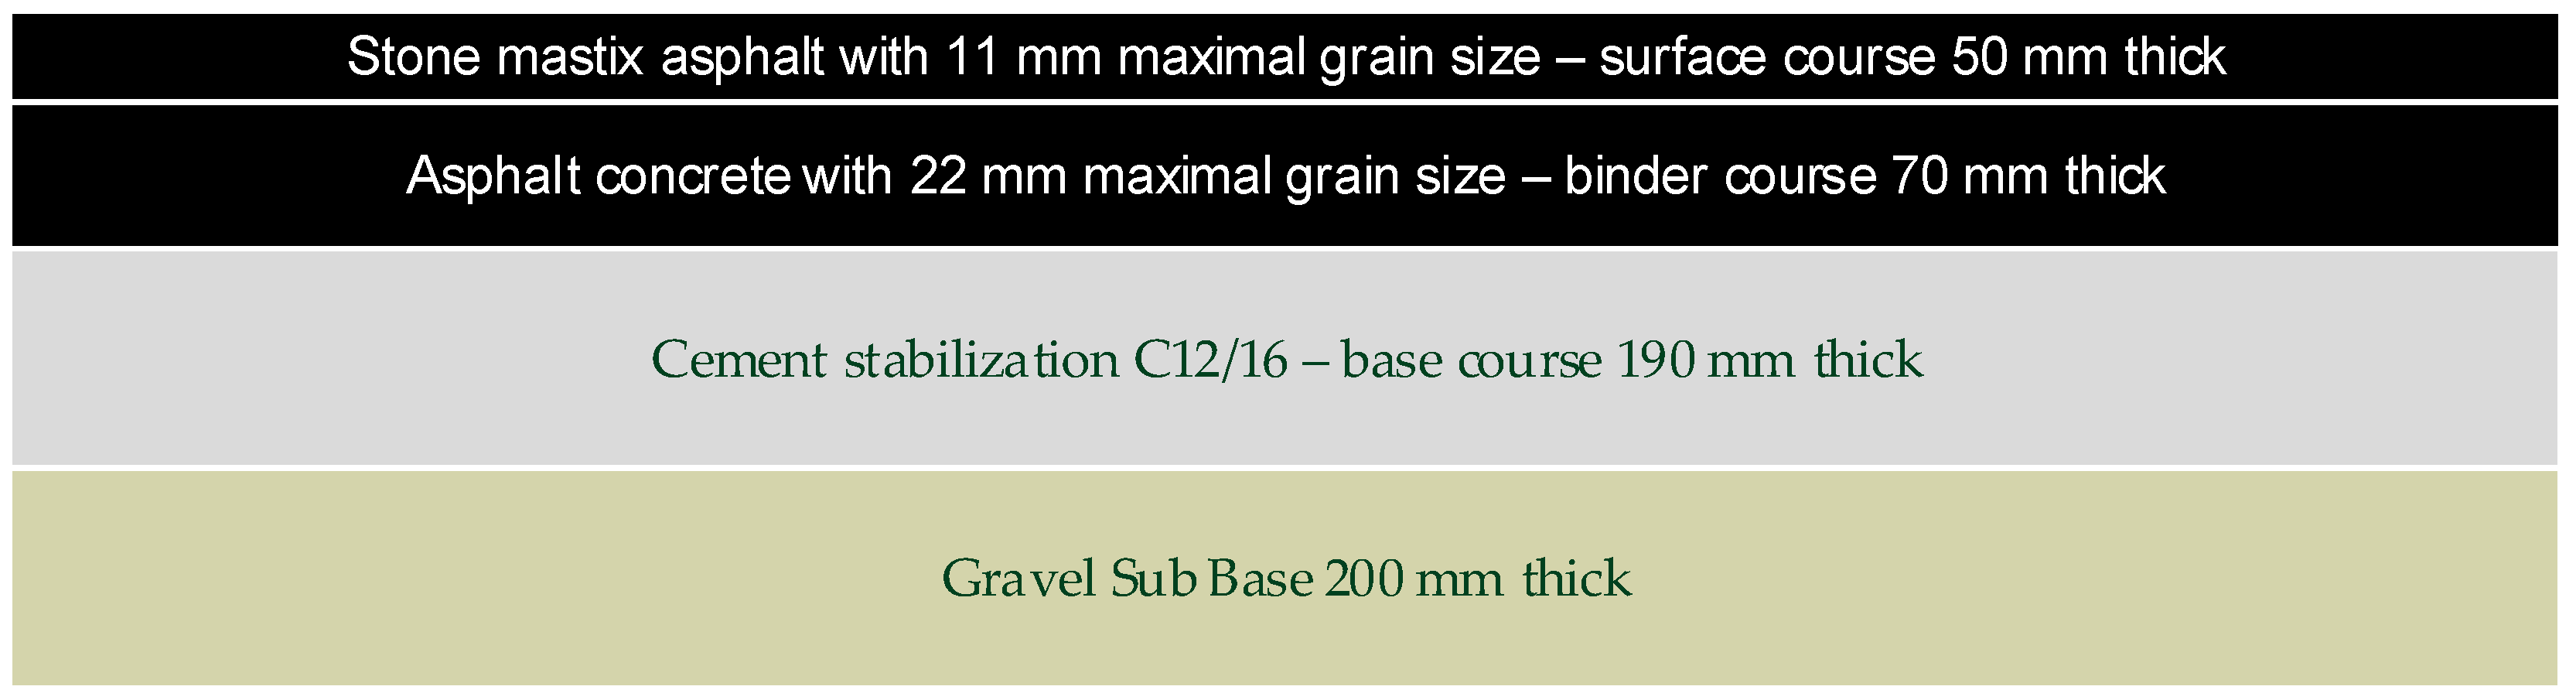
6. Lifecycle Study—Bearing Capacity

To investigate the practical application of the in labo results, a pavement was designed varying in the binder course mixture.
The AC22 layer was critical in terms of the stress and plastic deformation resistance. Three AC22 binder course layers were evaluated in the elastic half-space calculation model for the service life and fatigue (Figure 5 and Table 6). The single variable in this calculation was the material of the layer, i.e., the evaluated pavement varied in the binder course material. Three AC22 mixtures were considered in the binder course:
  • AC22 with road bitumen 50/70 (unmodified);
  • AC22 with road bitumen 50/70 + 3% SBS;
  • AC22 with road bitumen 10/40–65 used as a reference mixture.

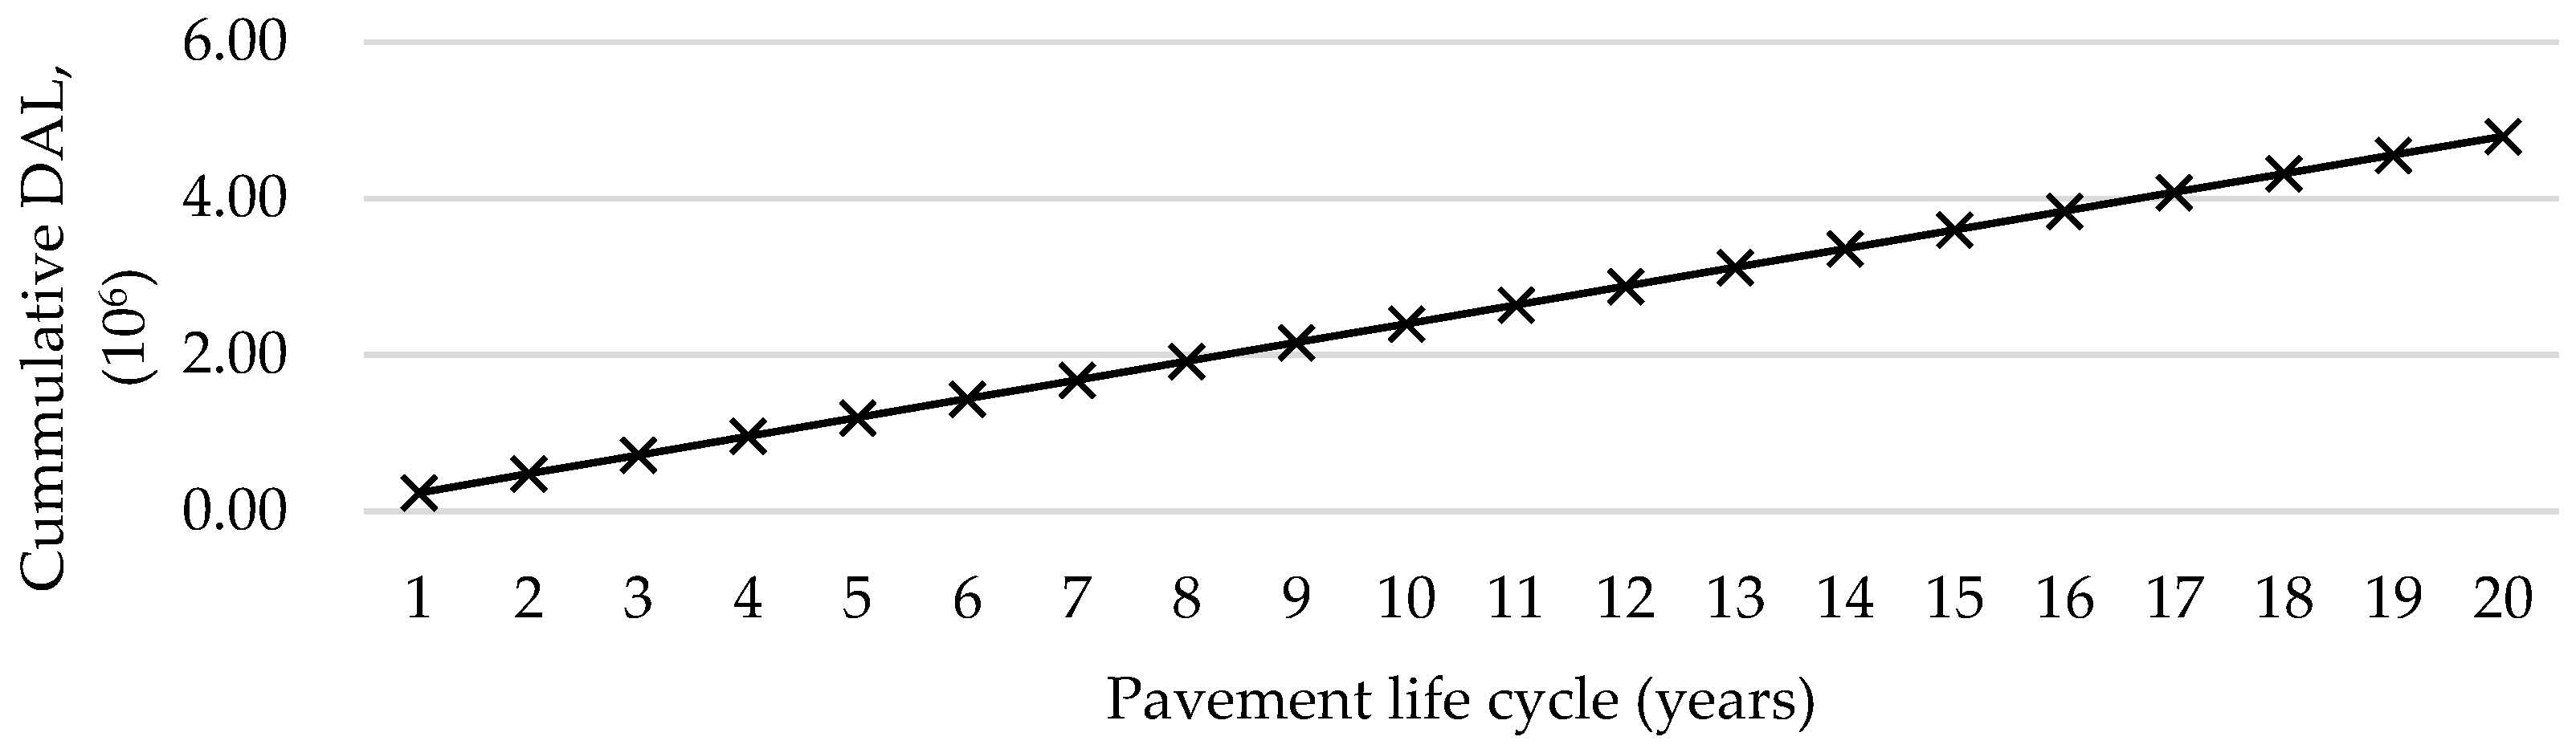
6.1. Service Life of the Pavement Based on the Different Fatigue Parameters of the Asphalt Mixtures

The residual life-expectancy calculation was based on the pavement structure design methodology, as described by [43]. Such a process was composed of the rheological characteristics of the pavement structure layer calculation and the experimental measurement of the fatigue parameter ε6 of the asphalt mixtures of the pavement layers.
The calculation of the maximum design axle load repetitions that the pavement can withstand can be determined from Equation (2):
D A L = 10 6 × ε 6 ε j B
where:
DAL is number of design standard axle loads, Ɛ6 denotes the average deformation derived from the fatigue curve after 106 loading cycles in microstrain (µm/m), and εj is the calculated relative deformation at the bottom of the critical bituminous bound sublayer in the pavement construction (based on a multilayer system in homogenous half-space, calculation model); in our case, the bottom edge of the binder course, B, is a fatigue characteristic specifying the falling gradient of the fatigue line, B = −1/b.
The total thickness of the pavement was 510 mm, with a subgrade stiffness modulus of 60 MPa, estimated in line with [44,45]. The bearing capacity varied depending on the material used in the binder course:
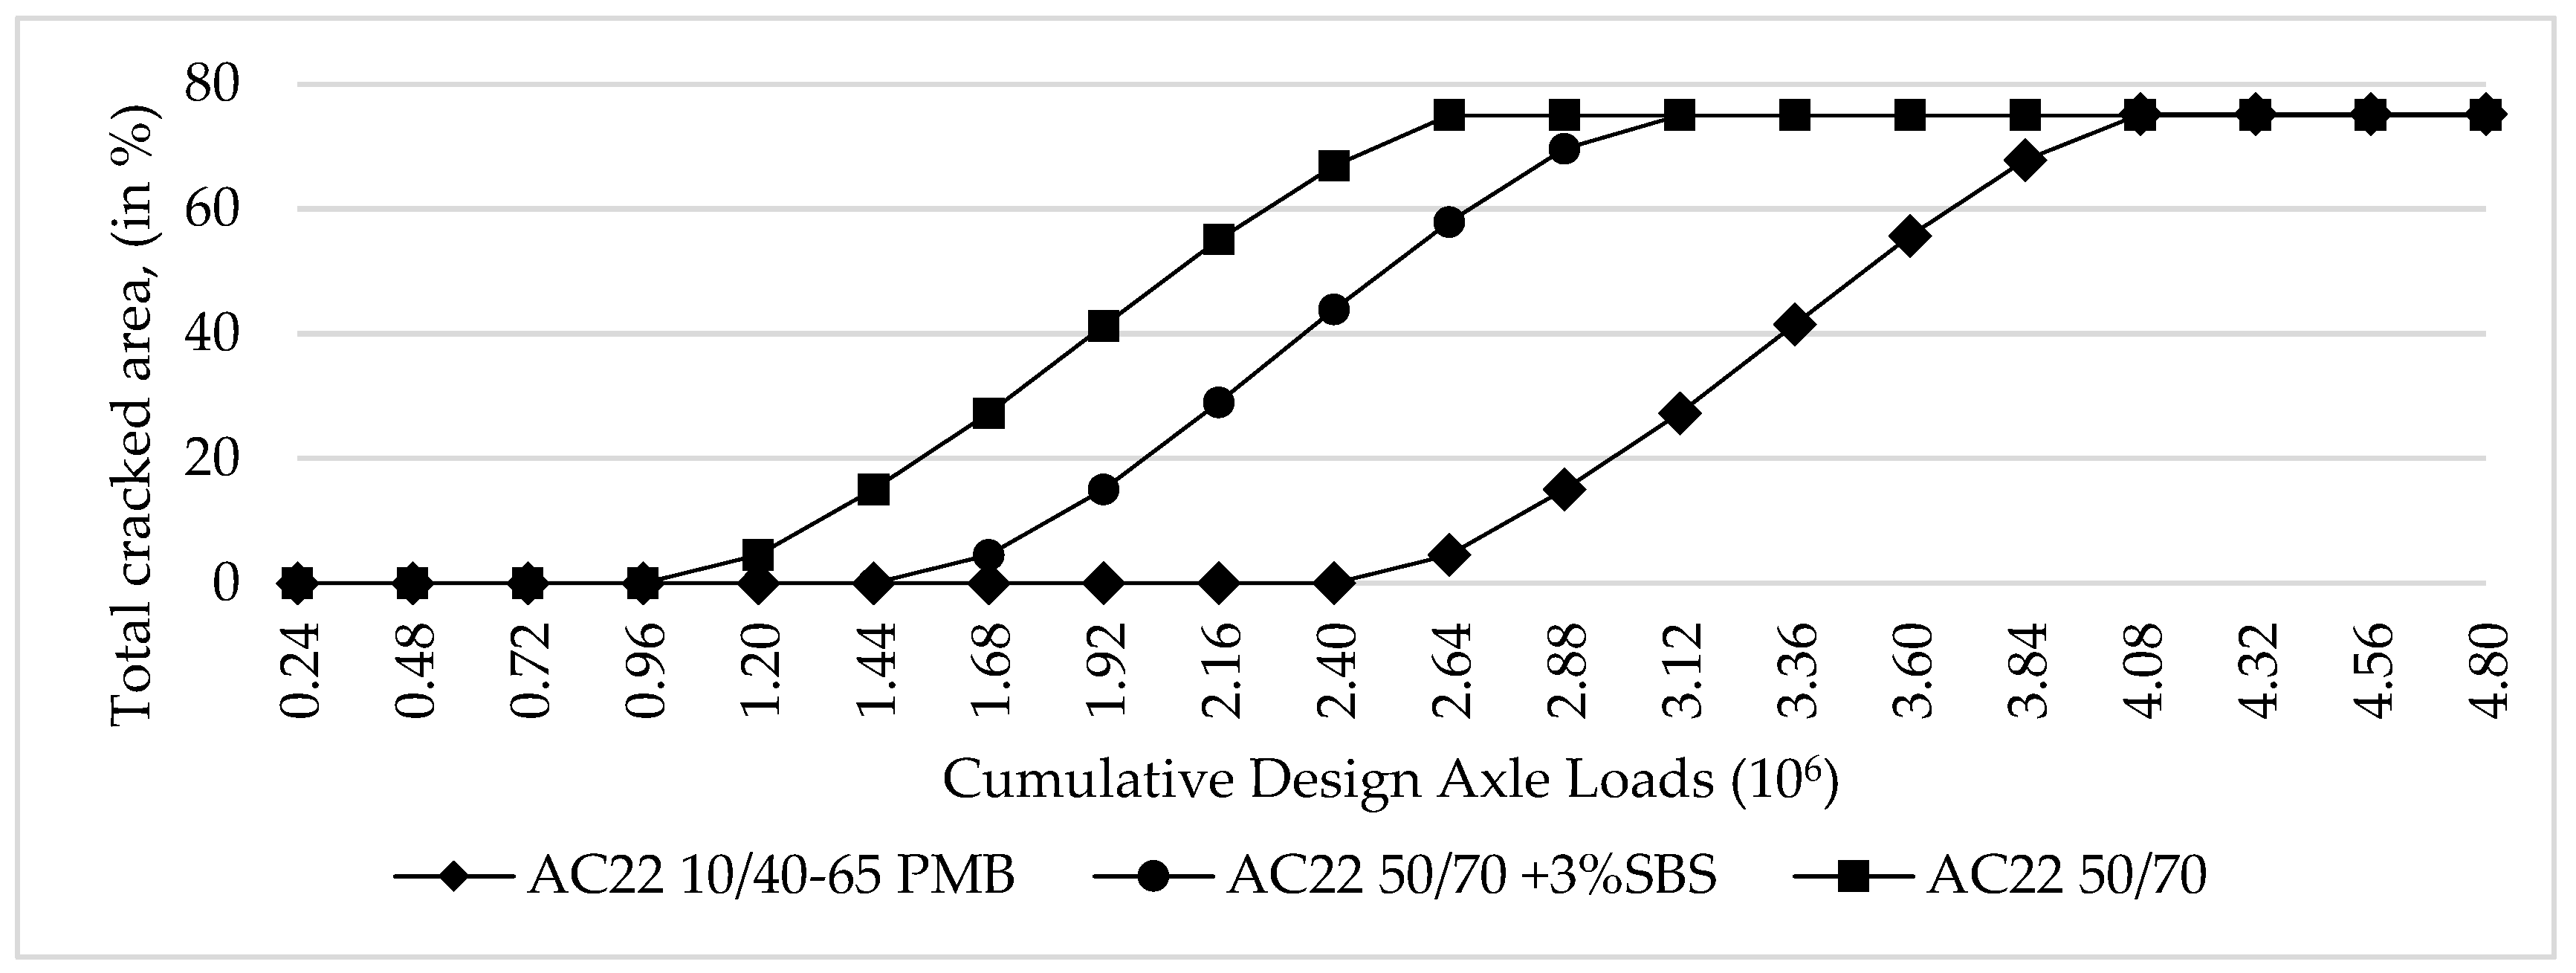
  • AC22 with 50/70 bitumen (unmodified)  − 3.57 × 10⁶ DAL;
  • AC22 with 50/70 bitumen + 3% modifier − 4.80 × 10⁶ DAL;
  • AC22 with 10/40–65 reference bitumen    − 5.99 × 10⁶ DAL.
Subsequently, the lifecycle analysis of these three pavements was performed.

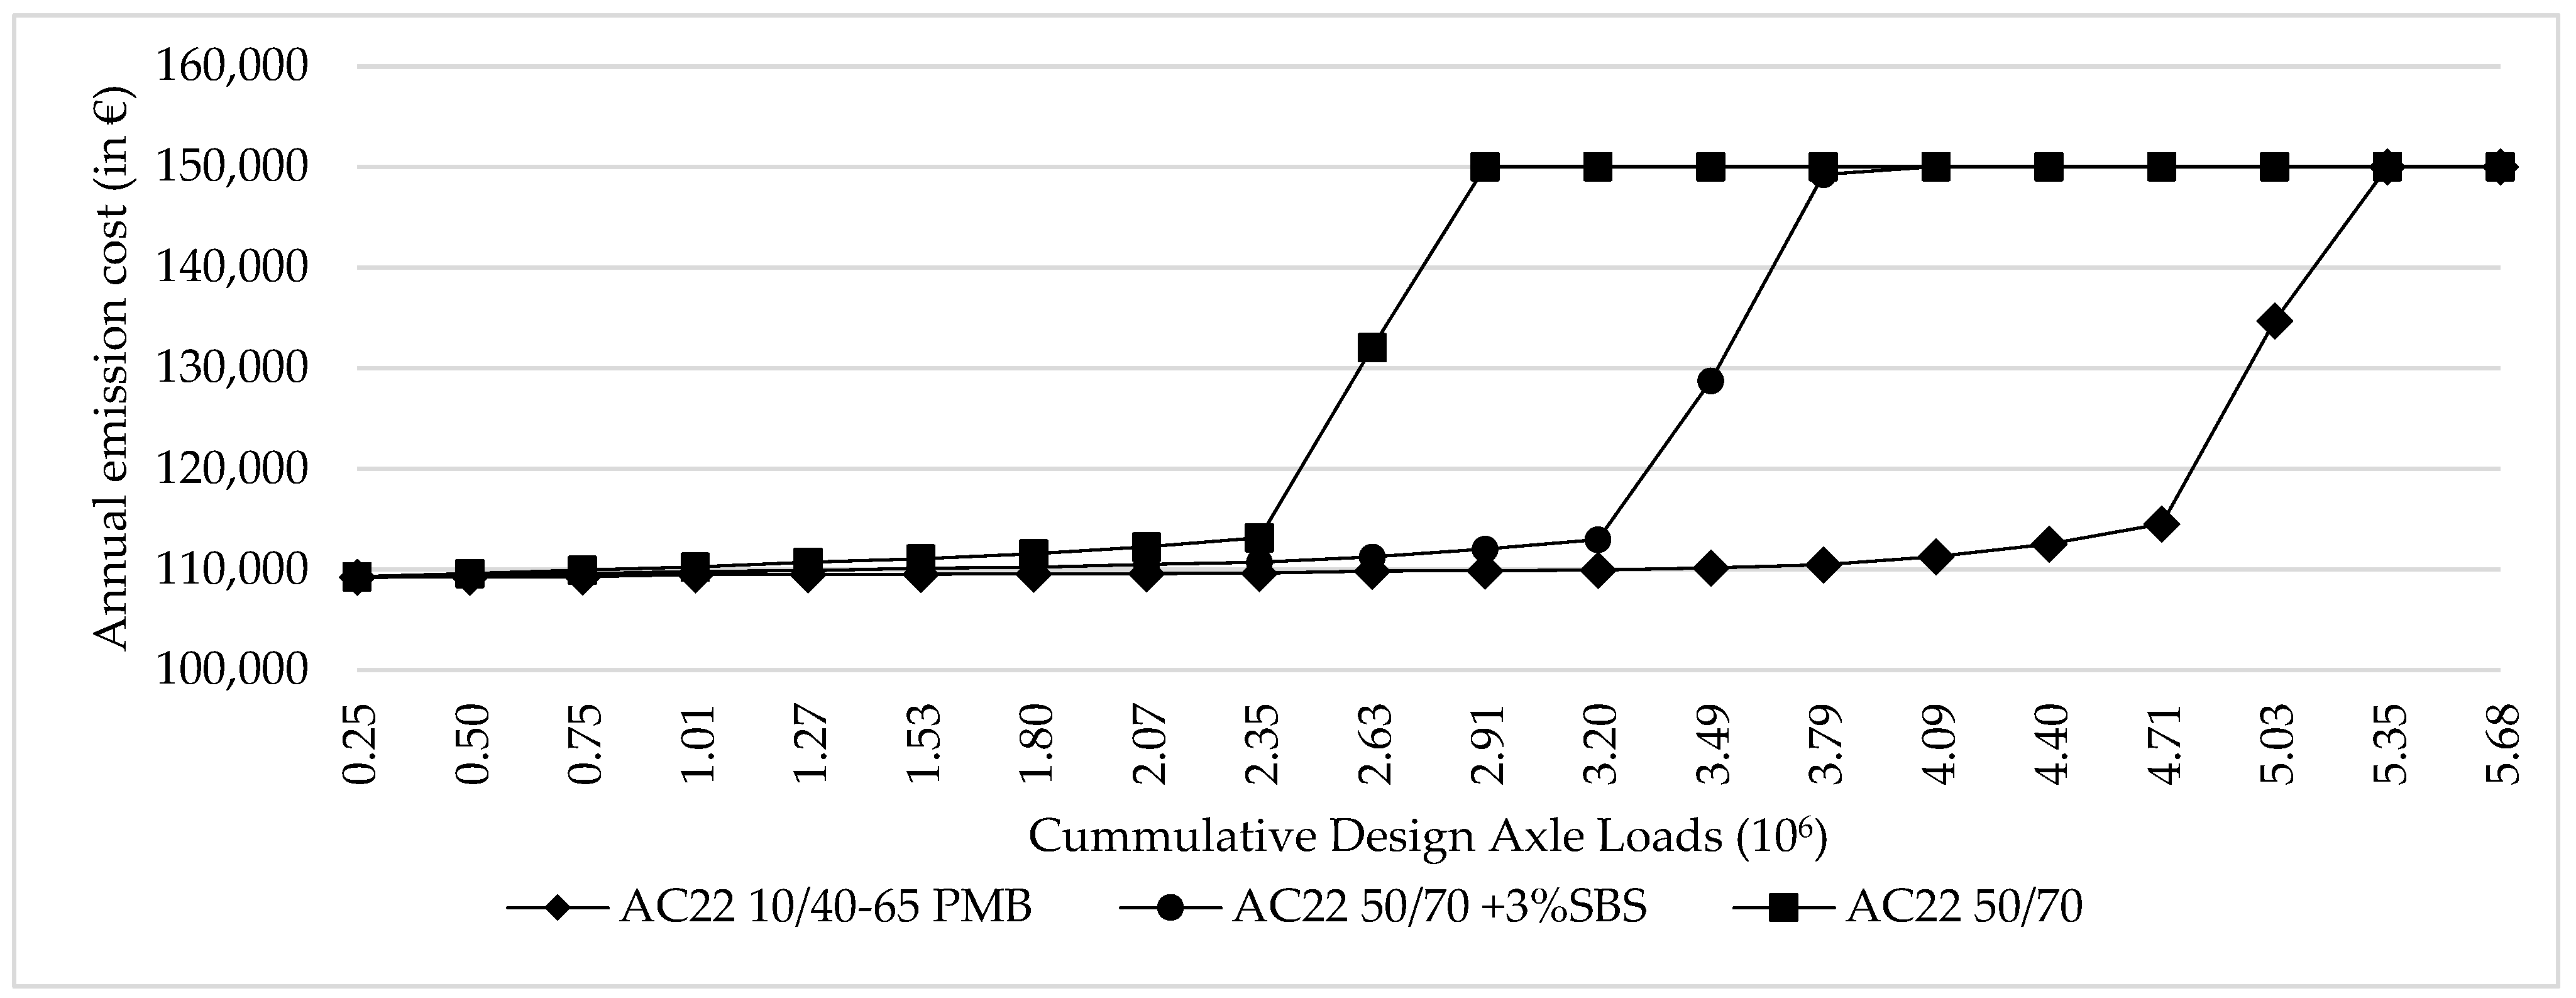
6.2. Lifecycle Study—Emissions Analysis Comparison

It has been shown that the modification with low amounts of the SBS polymer can double the number of loading cycles the binder course can sustain [46]. This is about half of the pavement performance increase than with a full reference modification. It was shown economically that the price for a mixture modification with low amounts of the SBS polymer is about the same as a standard reference modification [46]. This may be due to the fact that the modification with low amounts of the SBS polymer is not standardized. This may inflate the initial mixture procurement price estimates. This lifecycle cost analysis focused on the road user cost vs. the investment cost [46].
This section extends these economic conclusions and explores the environmental impact of a mixture modification with low amounts of the SBS polymer. The modification with low amounts of the SBS polymer simplified the mixing and heating procedure, as well as solved the requirements for continual heating in special storage containers. This created both energy and emissions savings effects. However, the energy and emissions savings potential during the industrial preparation of such mixtures in large quantities could not be ascertained due to limited and unreliable data from the questioned mixing plants. The focus of the research shifted to the pavement operation and the emissions savings potential due to the increased pavement performance.
The objective of this part of the research was to utilize the in labo test results in simulated practical applications and to evaluate the emissions savings potential of the modification with low amounts of the SBS polymer compared to the reference modification and the unmodified mixture. The lifecycle analysis was based on a comparison of the computer-simulated pavement performance under uniform traffic conditions, where the single variable was the binder in the binder course bitumen mixture. Based on the pavement performance, the emissions production was quantified and monetized, and the benefits from the emissions reduction were compared for the modification with low amounts of the SBS polymer and the reference modification.

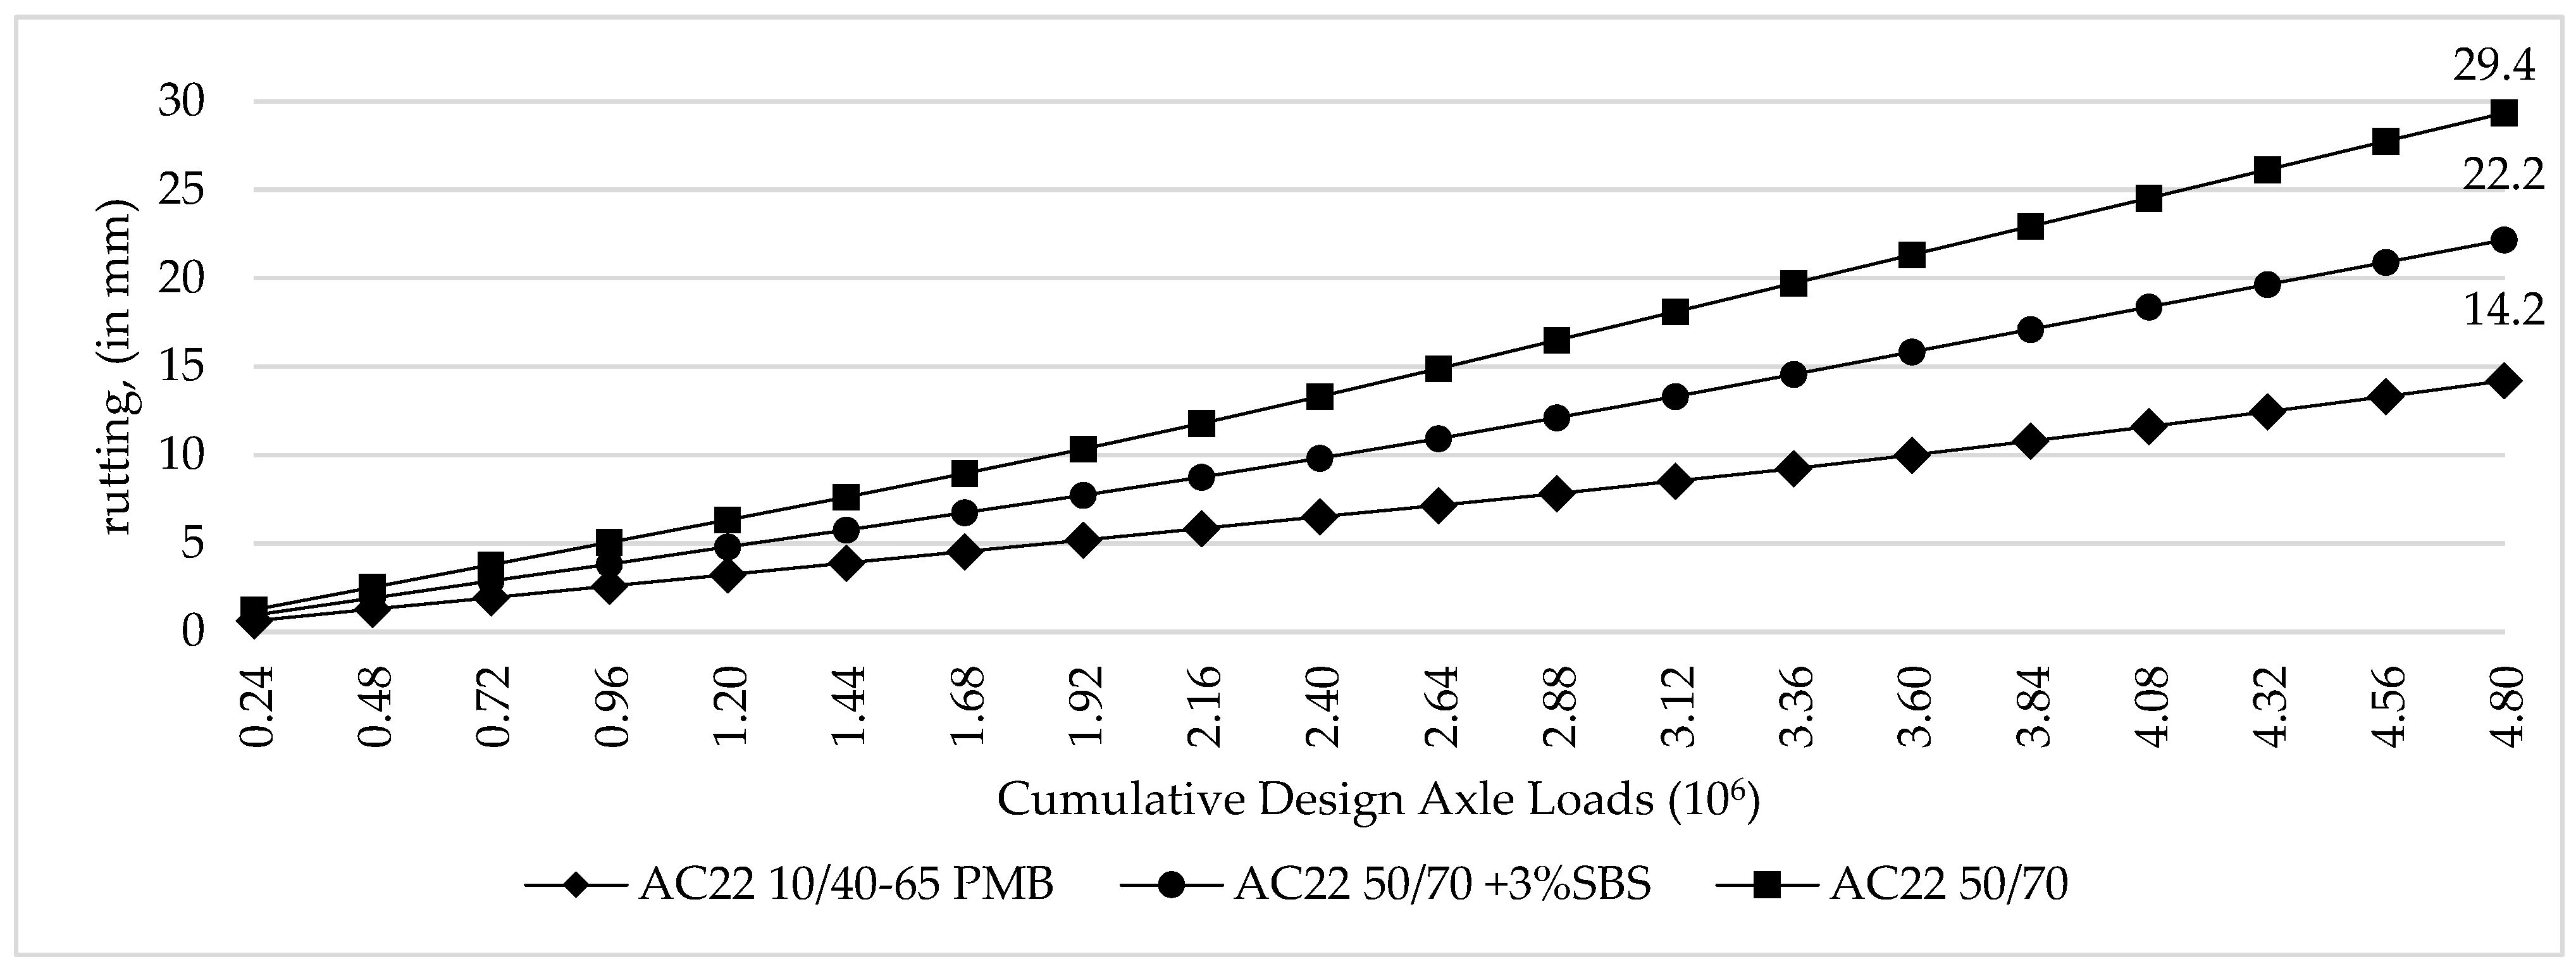
6.3. Pavement Performance

Three simulation scenarios were evaluated following the in labo testing. Three 1 km long single-lane road sections were created with the same pavement structure in the Highway Design and Management Tool (HDM-4). The road alignment, climatic, and traffic loads were the same for all three scenarios. The section was a generic trunk road, with medium traffic intensity in a temperate climatic zone located in Slovakia between the municipalities of Malacky and Velke Levare (geographic coordinates: 48.454713°, 17.010601°). The single variable was the binder in the binder course layer. The base scenario had a binder course that was made from the AC22 with bitumen 50/70. The following scenarios were with the AC22 with the bitumen 50/70 + 3% SBS binder course and the AC22 with the bitumen 10/40–65 as a reference binder course. All scenarios shared the same pavement performance model based on the ISOHDM study [47], which was utilized in HDM-4 [48].
The difference in the rutting resistance ascertained with in labo testing was projected in the experiment via changes in the calibration factor for the rut depth standard deviation model Krds, proportionally to their respective in labo testing results. A total of 20 years of pavement operation was modeled under the climatic and traffic load conditions listed in Table 7 and Table 8. The cumulative traffic load after 20 years of operation was 4.8 × 10⁶ design axle loads, as shown in Figure 6.
Two pavement distresses were investigated—the transversal plastic deformation (the rut resistance) and the total cracked surface area. The rut resistance distress was almost linear without the initial densification phase characteristic for the SMA surfacing layer. During 20 years of the lifecycle, the rutting performance for the pavement with the binder course made from the AC22 with the bitumen 50/70 was 29 mm, and for the AC22 with the bitumen 50/70 + 3% SBS 22 mm and the AC22 with the bitumen 10/45–65 PMB reference, it was 14 mm, as shown in Figure 7.
The total cracked area reached the maximum threshold of 75% in 10 years (2.4 mil DAL), 12 years (2.88 mil. DAL), and 16 years (4.08 mil. DAL) for the respective scenarios, as shown in Figure 8. Worth noting here is that no crack sealing maintenance was scheduled during the simulation to investigate the raw pavement performance without introducing the uncertainty that comes with road-work effect modeling.
These results are quite common for correctly designed semirigid pavements under these loading conditions. As expected, the modification of the pavement binder course provided increased resistance to plastic deformations, as well as cracking. The rut resistance was satisfactory, as the critical rut failure state of the 20 mm mean rut depth was reached, or was expected to be reached, for the PMB layer at the end of the designed bearing capacity. With a critical failure level of 20 mm, the mean rut depth for this type of road section was:
  • AC22 with the bitumen 10/40–65 PMB as the reference mixture reached a 14 mm rut in 4.80 × 10⁶ DAL, which is about 80% of its designed lifetime;
  • AC22 with the bitumen 50/70 + 3% SBS reached a critical rut failure state at 4.32 × 10⁶ DAL at 95% of its designed lifetime;
  • AC22 with the bitumen 50/70 reached a critical rut failure state at 3.36 × 10⁶ DAL at 112% of its designed lifetime.

6.4. Emmisions Production and Savings

The quantification of emissions based on traffic conditions and pavement performance in HDM-4 was based on the study by [49], which further expanded the original modeling proposal [50]. Three emissions types were considered due to the cost of appraising the limitations.
  • Nitrous oxide NOx;
  • Sulfur dioxide SO2;
  • Carbon dioxide CO29.
The quantity of nitrous oxide was predicted using Equation (3); sulfur dioxide with Equation (4); carbon dioxide with Equation (5).
E N O x = 3.6 × a N O x × a 0 + a 1 × F R N O x × I F C × 1 + 0.5 × a 2 × L v e h × 10 3 V v e h
where:
E N O x —nitrous oxide emissions (g/vehiclekilometer);
a N O x —vehicle calibration factor (see Table 9);
a0,a1,a2—vehicle model parameters (see Table 10);
F R N O x —vehicle calibration factor (see Table 11);
IFC—instantaneous fuel consumption (mL/s);
Lveh—vehicle service life (years);
Vveh—vehicle speed (km/h).
E S O 2 = 3.6 × a S O 2 × a 0 × a 1 × I F C × 10 3 V v e h
where:
E S O 2 —sulfur dioxide emissions (g/vehiclekilometer);
a S O 2 —vehicle calibration factor (see Table 9).
E C O 2 = 3.6 × a C O 2 × a 0 × I F C × 10 3 V v e h
where:
E C O 2 —carbon dioxide emissions (g/vehiclekilometer);
a C O 2 —vehicle calibration factor (see Table 9).
Table 9 shows the vehicle calibration factors that enter Equations (3)–(5). Table 10 shows the vehicle model parameters in these equations.
Based on these equations and the traffic volume of different vehicles in the traffic stream, HDM-4 quantifies the annual emissions in tons. The annual production of carbon dioxide, sulfur dioxide, and nitrous oxide is shown in Table 11 for all three scenarios.
The monetization of these emission quantities may differ for different countries depending on how emissions production is valued, if at all, in a given country. In this case study, the value of emissions in Slovakia was based on a handbook on the external cost of transport study [51], and adjusted for inflation via the harmonized index of consumer prices between the years 2019 and 2023 for the year 2023. Constant (real) prices, i.e., prices fixed at a base-year [52], for CO2 was EUR 140.6 per ton, for SO2 was EUR 12.2 per kg, and for NOx was EUR 17.46 per kg. Table 12 shows the monetized costs of the emissions production of these pollutants for all three scenarios. Figure 9 is a graphical representation of Table 12 with the sum of all pollutants for each scenario.
Figure 10 shows the total value of emissions production and the composition of this value for particular pollutants. At first sight, the reduction stemming from improved pavement performance may seem small, but these values are for a single-lane 1 km long road section. Figure 11 shows the benefits of emissions reduction for scenarios with the AC22 with the bitumen 10/40–65 PMB reference and the AC22 with the bitumen 50/70 +3% SBS, where the AC22 with the 50/70 bitumen was the base scenario. Since no maintenance strategy was considered in this research to prevent the uncertainty that comes with road-work effect modeling, we can see that the modification produced negligible benefits in the beginning, and most benefits accrued later in the lifecycle. Once a critical distress threshold of damage was reached, the costs equaled out and no further benefits were produced. This was expected and underscores the importance of the maintenance policy in practice.

7. Discussion

The findings suggest a significant relation between the interaction of the bitumen, the modifier, and the aggregate with the resistance to the permanent deformation of the mixture. The most significant improvement in the rutting resistance was achieved in SMA11, where the 3% SBS polymer ratio in the 50/70 road bitumen provided the same improvement as the reference road bitumen 10/40–65.
For the AC11 mixture, through the 3% SBS polymer ratio, the rutting resistance improvement was 89.9% of the reference with the road bitumen 10/40–65.
An unusual result was achieved during the WTS on the AC22 mixture, which showed that the rutting resistance of the AC22 was lower compared to the rutting resistance of the AC11 mixture. This is unusual, since mixtures with a larger aggregate grain usually have a better rutting resistance. This behavior may have been caused by the undesired interaction of the modificant with the aggregate. Thus, further research in relation to plastic deformation resistance is required to explain this finding and broaden the knowledge on the interaction between the modificant and the aggregate in the final mix.
The findings for the fatigue resistance show that a low-percentage modification using the same aggregate did not reach the ɛ6 value of the reference mix using the 10/40–65 bitumen. The fatigue resistance in this case was carried out at a temperature of 10 °C; further research should focus on the deformation characteristics of similar mixtures at different temperatures, and the validation of these findings in accelerated pavement testing facilities.
The lifecycle study based on the results of the material testing showed that the improvement of the binder course material properties proportionally translated into pavement performance in both the rutting resistance and cracking. As expected, the improved pavement performance attained by the modification produced environmental benefits stemming from the reduction in the traffic emissions. Compared to the AC22 with the road bitumen 50/70, the use of the road bitumen 50/70 and an additional 3% SBS decreased the emissions cost by EUR 126.308 thousand (4.6%) and EUR 321.955 thousand (12.24%) on a 1 km long road section with an AADT of 4876. An important finding is that the savings would be insignificant in situations where the pavement is maintained above a good condition, or is left below a very poor condition. Further research should investigate the thresholds at which the pavement maintenance cost outweigh the emissions savings. In addition, a lifecycle emissions analysis could be incorporated into a comprehensive lifecycle cost analysis to see the emissions savings in a broader economic context. This was also the main limitation of this study, the comparison of different scenarios, i.e., rehabilitation timing could change these results. Also, this study looked only at the benefits, while the procurement costs were omitted. This is mostly because a complex a lifecycle cost analysis and cost–benefit analysis would need to be performed, which would introduce a whole range of other uncertainties.

8. Conclusions

The emerging challenges in pavement management require technological solutions to address aging road infrastructure and promote the creation of more durable types of pavement mixtures. These mixtures have to provide the required level of service, reduce costs and energy requirements, and improve the overall pavement performance. Mixtures with SBS-modified bitumen have been shown to improve both the operational capability and serviceability.
This manuscript investigated the resistances to fatigue and rut by using an SBS polymer in a low ratio. The first step in this study was to analyze a specific SBS polymer for its polystyrene and polybutadiene compounds and to ascertain its impact on the bitumen properties at different dosages of this particular SBS modificant.
The conclusions from the penetration, softening point, and elastic recovery tests performed on three types of bitumen, two of which were modified with varying ratios of the SBS polymer, indicate that, for the road bitumen 35/50, as low as a 2% SBS polymer content:
  • Doubles the elastic recovery value;
  • The softening point is 3 °C higher, but with an adverse effect on the penetration, and with a 12% worse penetration value compared to unmodified bitumen.
As the SBS ratio increases, the properties of the modified bitumen increase proportionally with the SBS content.
For the road bitumen 50/70, as low as a 2% SBS polymer content:
  • Doubles the elastic recovery value;
  • The softening point is 2.5 °C higher, with a penetration increase of 20%.
In the next step, these modified bitumens were used in bituminous mixtures, and these mixtures were tested for rutting resistance through WTT tests. These tests have shown that a 3% SBS polymer ratio in the road bitumen 50/70:
  • In SMA11, achieves the same resistance to permanent deformation as SMA with the reference road bitumen 10/40–65.
  • In AC11, achieves an increase of 89.9% to permanent deformation as AC11 with the reference road bitumen 10/40–65.
  • In AC22, achieves an increase of 76% to permanent deformation as AC11 with the reference road bitumen 10/40–65.
The final step was to apply these findings in the lifecycle assessment and the lifecycle cost analysis.
As a result of the improved rutting resistance, in line with the pavement design methodology based on the elastic half-space model, changes to the fatigue parameters resulted in the extension of the pavement's service life and performance throughout this extended service life. These effects were translated into the three simulation scenarios of 1 km long single-lane road sections with a varying base course layer, for which the lifecycle study and emissions analysis were performed.
It was concluded that the lifetime extension and improved pavement operation at increased distress levels improved the traffic conditions, which led to a decrease in the emissions production. Compared to the AC22 50/70, the use of the AC22 50/70 + 3% SBS decreased the CO2 emissions produced by 493 tons through the 20-year operation period on a 1 km long road section, with an AADT of 4876. For SO2, this decrease was 0.54 tons, and for NOx, it was 2.89 tons. This was a 39.3% reduction in CO2, a 40% reduction in SO2, and a 38.9% reduction in NOx compared to the AC22 10/40–65 PMB. Based on these findings, we conclude that the modification with low amounts of SBS polymer produces net benefits in emissions reduction proportional to its material performance. Compared to the reference PMB modification, it is more dependent on rigorous maintenance standards that enable the pavement to operate at a subcritical operational capability and surface distress in later stages of the lifecycle. Thus, the benefits attained through low-level SBS modification are more sensitive to maintenance and timely rehabilitation. This is also, however, the main limitation of this study. A comparison of different scenarios, i.e., rehabilitation timing, could change these results. Also, this study looked only at the benefits, while the procurement costs were omitted. This is mostly because of the complex lifecycle cost analysis and cost–benefit analysis that would need to be performed, which would introduce a whole range of other uncertainties.

Supplementary Materials

The following supporting information can be downloaded at: https://www.mdpi.com/article/10.3390/buildings14020389/s1.

Author Contributions

Conceptualization, M.K. and Ľ.R.; methodology, M.K.; software, Ľ.R.; validation, M.K., Ľ.R., G.M. and J.M. (Juraj Mušuta); formal analysis, M.K. and J.Š.; investigation, Ľ.R. and G.M.; resources, J.M. (Juraj Mušuta); data curation, M.K., J.Š., G.M. and Ľ.R.; writing—original draft preparation, M.K. and G.M.; writing—review and editing, Ľ.R.; visualization, M.K. and G.M.; supervision, J.M. (Ján Mikolaj), Ľ.R., J.Š. and J.M. (Juraj Mušuta); project administration, J.M. (Ján Mikolaj) and M.K.; funding acquisition, J.M. (Ján Mikolaj) and J.Š. All authors have read and agreed to the published version of the manuscript.

Funding

This paper was supported by the Slovak Research and Development Agency under the contract no. APVV-22-0040.

Data Availability Statement

The authors confirm that the data supporting the findings of this study are available within the article and its supplementary materials.

Conflicts of Interest

The authors declare no conflicts of interest. The funders had no role in the design of the study; in the collection, analyses, or interpretation of data; in the writing of the manuscript; or in the decision to publish the results.

References

  1. Dirmeier, J.; Paterson, J. Renewal and Rejuvenation of Aging Infrastructure. In Routes/Roads; World Road Association (PIARC): Paris, France, 2022; Volume 394. [Google Scholar]
  2. Toplis, C.M.; Kidnie, M.; Marchese, A.; Maruntu, C.; Murphy, H.; Sébille, R.; Thomson, S. International Climate Change Adaptation Framework for Road Infrastructure; Special Project No. 2015R03EN; World Road Association—PIARC: La Défense, France, 2015; ISBN 978-2-84060-362-7. Available online: https://www.piarc.org/en/order-library/23517-en-International%20climate%20change%20adaptation%20framework%20for%20road%20infrastructure (accessed on 5 January 2024).
  3. Remišová, E.; Zatkalíková, V. Evaluation of bituminous binder in relation to resistance to permanent deformation. Procedia Eng. 2016, 153, 584–589. [Google Scholar] [CrossRef]
  4. Tayfur, S.; Ozen, H.; Aksoy, A. Investigation of rutting performance of asphalt mixtures containing polymer modifiers. Constr. Build. Mater. 2007, 21, 328–337. [Google Scholar] [CrossRef]
  5. Mazurek, G.; Iwański, M. Estimation of Zero Shear Viscosity Versus Rutting Resistance Parameters of Asphalt Concrete. Procedia Eng. 2016, 161, 30–35. [Google Scholar] [CrossRef]
  6. Song, S.; Yeom, C. Reduction of Plastic Deformation in Heavy Traffic Intersections in Urban Areas. Sustainability 2021, 13, 4002. [Google Scholar] [CrossRef]
  7. Alaswadko, N.; Hassan, R. Rutting progression models for light duty pavements. Int. J. Pavement Eng. 2018, 19, 37–47. [Google Scholar] [CrossRef]
  8. Coleri, E.; Tsai, B.W.; Monismith, C.L. Pavement rutting performance prediction by integrated Weibull approach. Transp. Res. Rec. 2008, 2087, 120–130. [Google Scholar] [CrossRef]
  9. Buczyński, P.; Šrámek, J.; Mazurek, G. The Influence of Recycled Materials on Cold Mix with Foamed Bitumen Properties. Materials 2023, 16, 1208. [Google Scholar] [CrossRef] [PubMed]
  10. Mazurek, G.; Šrámek, J.; Buczyński, P. Composition Optimisation of Selected Waste Polymer-Modified Bitumen. Materials 2022, 15, 8714. [Google Scholar] [CrossRef] [PubMed]
  11. Pérez, I.; Medina, L.; Gallego, J. Plastic deformation behaviour of pavement granular materials under low traffic loading. Granul. Matter. 2010, 12, 57–68. [Google Scholar] [CrossRef]
  12. Li, W.; Cao, W.; Ren, X.; Lou, S.; Liu, S.; Zhang, J. Impacts of Aggregate Gradation on the Volumetric Parameters and Rutting Performance of Asphalt Concrete Mixtures. Materials 2022, 15, 4866. [Google Scholar] [CrossRef]
  13. Porto, M.; Caputo, P.; Loise, V.; Eskandarsefat, S.; Teltayev, B.; Oliviero Rossi, C. Bitumen and bitumen modification: A review on latest advances. Appl. Sci. 2019, 9, 742. [Google Scholar] [CrossRef]
  14. Paliukaite, M.; Vaitkus, A.; Zofka, A. Evaluation of Bitumen Fractional Composition Depending on the Crude Oil Type and Production Technology. In Environmental Engineering. Proceedings of the International Conference on Environmental Engineering; ICEE: La Vergne, TN, USA, 2014; Volume 9, pp. 1–7. [Google Scholar] [CrossRef]
  15. Subhy, A. Advanced analytical techniques in fatigue and rutting related characterisations of modified bitumen: Literature review. Constr. Build. Mater. 2017, 156, 28–45. [Google Scholar] [CrossRef]
  16. Bala, N.; Kamaruddin, I.; Napiah, M.; Danlami, N. Rheological and Rutting Evaluation of Composite Nanosilica/Polyethylene Modified Bitumen. In Proceedings of the IOP Conference Series: Materials Science and Engineering, Penang, Malaysia, 11–13 March 2017; IOP Publishing: Bristol, UK, 2017; Volume 201, p. 012012. [Google Scholar] [CrossRef]
  17. Singh, M.; Kumar, P.; Maurya, M.R. Strength characteristics of SBS modified asphalt mixes with various aggregates. Constr. Build. Mater. 2013, 41, 815–823. [Google Scholar] [CrossRef]
  18. Sengoz, B.; Isikyakar, G. Evaluation of the properties and microstructure of SBS and EVA polymer modified bitumen. Constr. Build. Mater. 2008, 22, 1897–1905. [Google Scholar] [CrossRef]
  19. Fernandes, M.R.S.; Forte, M.M.C.; Leite, L.F.M. Rheological evaluation of polymer-modified asphalt binders. Mater. Res. 2008, 11, 381–386. [Google Scholar] [CrossRef]
  20. Yetkin, Y. Polymer modified asphalt binders. Constr. Build. Mater. 2007, 21, 66–72. [Google Scholar] [CrossRef]
  21. Airey, G.D. Rheological properties of styrene butadiene styrene polymer modified road bitumens☆. Fuel 2003, 82, 1709–1719. [Google Scholar] [CrossRef]
  22. Schaur, A.; Unterberger, S.; Lackner, R. Impact of molecular structure of SBS on thermomechanical properties of polymer modified bitumen. Eur. Polym. J. 2017, 96, 256–265. [Google Scholar] [CrossRef]
  23. Lu, X.; Isacsson, U.; Ekblad, J. Phase separation of SBS polymer modified bitumens. J. Mater. Civ. Eng. 1999, 11, 51–57. [Google Scholar] [CrossRef]
  24. Zhu, J.; Lu, X.; Kringos, N. Experimental investigation on storage stability and phase separation behaviour of polymer-modified bitumen. Int. J. Pavement Eng. 2018, 19, 832–841. [Google Scholar] [CrossRef]
  25. Zhu, J.; Lu, X.; Balieu, R.; Kringos, N. Modelling and numerical simulation of phase separation in polymer modified bitumen by phase-field method. Mater. Des. 2016, 107, 322–332. [Google Scholar] [CrossRef]
  26. Kok, B.V.; Yalcin BYilmaz, M.; Yalcin, E. Performance evaluation of bitumen modified with styrene–isoprene-styrene and crumb rubber compound. Constr. Build. Mater. 2022, 344, 128304. [Google Scholar] [CrossRef]
  27. Khordehbinan, M.; Kaymanesh, M.R. Chemical analysis and middle-low temperature functional of waste polybutadiene rubber polymer modified bitumen. Pet. Sci. Technol. 2020, 38, 8–17. [Google Scholar] [CrossRef]
  28. Singh, S.K.; Kumar, Y.; Ravindranath, S.S. Thermal degradation of SBS in bitumen during storage: Influence of temperature, SBS concentration, polymer type and base bitumen. Polym. Degrad. Stab. 2018, 147, 64–75. [Google Scholar] [CrossRef]
  29. De Carcer, Í.A.; Masegosa, R.M.; Viñas, M.T.; Sanchez-Cabezudo, M.; Salom, C.; Prolongo, M.G.; Páez, A. Storage stability of SBS/sulfur modified bitumens at high temperature: Influence of bitumen composition and structure. Constr. Build. Mater. 2014, 52, 245–252. [Google Scholar] [CrossRef]
  30. EN 12591:2009; Bitumen and Bituminous Binders—Specifications for Paving Grade Bitumens. European Committee for Standardization (CEN); European Committee: Brussels, Belgium, 2009.
  31. EN 14023:2010; Bitumen and Bituminous Binders—Specification Framework for Polymer Modified Bitumens. European Committee for Standardization (CEN); European Committee: Brussels, Belgium, 2010.
  32. EEN 12697-33:2019; Bituminous Mixtures—Test Method—Part 33: Specimen Prepared by Roller Compactor. European Committee for Standardization (CEN); European Committee: Brussels, Belgium, 2019.
  33. Bernier, A.; Zofka, A.; Yut, I. Laboratory Evaluation of Rutting Susceptibility of Polymer-Modified Asphalt Mixtures Containing Recycled Pavements. Constr. Build. Mater. 2012, 31, 58–66. [Google Scholar] [CrossRef]
  34. Canto, L.B.; Mantovani, G.L.; deAzevedo, E.R.; Bonagamba, T.J.; Hage, E.; Pessan, L.A. Molecular Characterization of Styrene-Butadiene-Styrene Block Copolymers (SBS) by GPC, NMR, and FTIR. Polym. Bull. 2006, 57, 513–524. [Google Scholar] [CrossRef]
  35. Luo, S.; Tian, J.; Liu, Z.; Lu, Q.; Zhong, K.; Yang, X. Rapid Determination of Styrene-Butadiene-Styrene (SBS) Content in Modified Asphalt Based on Fourier Transform Infrared (FTIR) Spectrometer and Linear Regression Analysis. Measurement 2020, 151, 107204. [Google Scholar] [CrossRef]
  36. EN 1426; Bitumen and Bituminous Binders. Determination of Needle Penetration. European Committee for Standardization (CEN); European Committee: Brussels, Belgium, 2015.
  37. EN 1427; Bitumen and Bituminous Binders. Determination of the Softening Point—Ring and Ball Method. European Committee for Standardization (CEN); European Committee: Brussels, Belgium, 2015.
  38. EN 13398; Bitumen and Bituminous Binders. Determination of the Elastic Recovery of Modified Bitumen. European Committee for Standardization (CEN); European Committee: Brussels, Belgium, 2018.
  39. Zhou, F.; Chen Dar-Hao Scullion, T.; Bilyeu, J. Case study: Evaluation of laboratory test methods to characterize permanent deformation properties of asphalt mixes. Int. J. Pavement Eng. 2003, 4, 155–164. [Google Scholar] [CrossRef]
  40. Morea, F.; Zerbino, R. Wheel tracking test (WTT) conducted under different standards. Study and correlation of test parameters and limits. Mater. Struct. 2015, 48, 4019–4028. [Google Scholar] [CrossRef]
  41. EN 12697-22; Bituminous Mixtures. Test Methods. Part 22: Wheel Tracking. European Committee for Standardization (CEN); European Committee: Brussels, Belgium, 2020.
  42. EN 12697-24; Bituminous Mixtures. Test Methods for Hot Mix Asphalt—Part 24: Resistance to Fatigue. European Committee for Standardization (CEN); European Committee: Brussels, Belgium, 2018.
  43. Mikolaj, J.; Remek, Ľ.; Kozel, M. Road Asset Value Calculation Based on Asset Performance, Community Benefits and Technical Condition. Sustainability 2022, 14, 4375. [Google Scholar] [CrossRef]
  44. Decký, M.; Drusa, M.; Papán, D.; Šrámek, J. The Relationship between Dynamic and Static Deformation Modulus of Unbound Pavement Materials Used for Their Quality Control Methodology. Materials 2022, 15, 2922. [Google Scholar] [CrossRef] [PubMed]
  45. Gago, F.; Valletta, A.; Mužík, J. Formulation of a Basic Constitutive Model for Fine-Grained Soils Using the Hypoplastic Framework. Civ. Environ. Eng. 2021, 17, 450–455. [Google Scholar] [CrossRef]
  46. Šrámek, J.; Kozel, M.; Remek, L.; Mikolaj, J. Evaluation of Bitumen Modification Using a Fast-Reacting SBS Polymer at a Low Modifier Percentage. Materials 2023, 16, 2942. [Google Scholar] [CrossRef]
  47. Odoki, J.B.; Kerali, H.G.R. Analytical Framework and Model Description. In The Highway Development and Management Series; Association Mondiale de la Route—World Road Association: La Défense, France, 2023; Volume 4, ISBN 2-84060-102-8. [Google Scholar]
  48. World Road Association—PIARC. HDM-4 Software, version 2.0; World Road Association—PIARC: La Défense, France; Available online: https://www.piarc.org/en/PIARC-knowledge-base-Roads-and-Road-Transportation/Road-Safety-Sustainability/Road-Assets-Management/HDM-4-Software (accessed on 2 October 2023).
  49. Collings, A.A.; Watkiss, P.R. Development of Environmental Impacts and Energy Balance Models for HDM-4, Final Project Report for the Department for International Development, UK; AEA Technology: Carlsbad, CA, USA, 1998. Available online: https://assets.publishing.service.gov.uk/media/57a08d86e5274a27b20018d1/R7369_final_report_issue_2.pdf (accessed on 2 October 2023).
  50. Hammerstrom, U. Proposal for a Vehicle Exhaust Model in HDM-4, ISOHDM Supplementary Technical Relationships Study Draft Report; Swedish National Road Administration, Road and Traffic Management Division: Borlange, Sweden, 1995.
  51. Essen, H.; Fiorello, D.; El Beyrouty, K.; Bieler, C.; van Wijngaarden, L.; Schroten, A.; Parolin, R.; Brambilla, M.; Sutter, D.; Maffii, S. Handbook on the External Costs of Transport–Version 2019—1.1; No. 18.4 K83. 131; Publications Office: Luxembourg, 2020; Available online: https://data.europa.eu/doi/10.2832/51388 (accessed on 2 October 2023).
  52. Sartori, D.; Catalano, G.; Genco, M.; Pancotti, C.; Sirtori, E.; Vignetti, S.; Del Bo, C. Guide to Cost-Benefit Analysis of Investment Projects. Economic Appraisal Tool for Cohesion Policy 2014–2020; European Commission, Directorate-General for Regional and Urban Policy: Luxembourg, 2014; ISBN 978-92-79-34796-2. [CrossRef]
Figure 1. Design of the experiment.
Buildings 14 00389 g001
Figure 2. FTIR spectra for the SBS block copolymers. (Supplementary data are available online).
Buildings 14 00389 g002
Figure 3. Mixtures’ coarse-grain lines.
Buildings 14 00389 g003
Figure 4. Displacement increase.
Buildings 14 00389 g004
Figure 5. Pavement construction design.
Buildings 14 00389 g005
Figure 6. Cumulative design axle load during the pavement lifecycle.
Buildings 14 00389 g006
Figure 7. Rut mean depth relative to the design axle load during the pavement lifecycle.
Buildings 14 00389 g007
Figure 8. Total cracked area relative to the design axle loads during the pavement lifecycle.
Buildings 14 00389 g008
Figure 9. Total annual emissions costs relative to design axle loads during the pavement lifecycle.
Buildings 14 00389 g009
Figure 10. Total value of emissions production.
Buildings 14 00389 g010
Figure 11. Total benefits from emissions reduction during the pavement lifecycle. (Supplementary data are available online).
Buildings 14 00389 g011
Table 1. Results of the penetration, softening point, and elastic recovery.
BitumenModification DosagePenetration (0.1 mm)Softening Point (°C)Elastic Recovery (%)
road bitumen 35/500.00%4853.6516%
2.00%5357.0548%
2.50%5157.4549%
3.00%4857.5551%
3.50%4257.6054%
road bitumen 50/700.00%6749.6512%
2.00%5652.3023%
2.50%5452.5040%
3.00%4752.6049%
3.50%4952.5050%
road bitumen 10/40–65 -4065.0070%
Table 2. Rutting performance testing conditions.
MixtureMax.
Aggregate Size
Sample ThicknessTemperingNo. of Cycles
Mixture 1(SMA11) with 50/70 road bitumen + 3% of SBS modifier11 mm40 mm5 h10,000
Mixture 1(SMA11) with 10/40–65 road bitumen—reference11 mm40 mm5 h10,000
Mixture 2(AC11) with 50/70 road bitumen + 3% of SBS modifier11 mm40 mm5 h10,000
Mixture 2(AC11) with 10/40–65 road bitumen—reference11 mm40 mm5 h10,000
Mixture 3(AC22) with 50/70 road bitumen + 3% of SBS modifier22 mm80 mm8 h10,000
Mixture 3(AC22) with 10/40–65 road bitumen—reference 22 mm80 mm8 h10,000
Table 3. Mixture 1 (SMA 11).
Bitumen50/70 + 3% SBS Modifier10/40–65 Reference
Test temperature50 °C50 °C
WTS (mm)0.085 mm0.10 mm
RD (mm)1.875 mm1.900 mm
PRD (%)4.68%4.70%
ɛ6 (μm)119190
Table 4. Mixture 2 (AC 11).
Bitumen50/70 + 3% SBS Modifier10/40–65 Reference
Test temperature50 °C50 °C
WTS (mm)0.10 mm0.10 mm
RD (mm)2.280 mm2.050 mm
PRD (%)5.56%5.00%
ɛ6 (μm)115125
Table 5. Mixture 3 (AC22).
Bitumen50/70 + 3% SBS Modifier10/40–65 Reference
Test temperature50 °C50 °C
WTS (mm)0.145 mm0.07 mm
RD (mm)2.370 mm1.800 mm
PRD (%)3.95%3.00%
ɛ6 (μm)98131
Table 6. Parameters of the pavement.
LayerPoisson NumberComplex
Modulus
SMA—Stone matrix asphalt0.305195 MPa
AC22—with road bitumen 50/70 (unmodified)0.337130 MPa
AC22—with road bitumen 50/70 + 3% SBS0.336930 MPa
AC22—with road bitumen 10/40–650.336192 MPa
Cement stabilization C12/150.222000 MPa
Gravel Sub-base0.35120 MPa
Subgrade0.3560 MPa
Table 7. Climatic load.
Moisture ClassificationMoisture
Index
Duration of Dry SeasonMean Monthly
Precipitation
Mean
Temperature
Avg.
Temperature Range
Days T > 32 °CFreeze
Index
Semiarid−367.32 months54.5 mm9.5 °C20.2 °C19.5 days262
Table 8. Traffic load.
VanMedium
Lorry
Medium
Passenger Car
Heavy
Bus
Articulated
Truck
Heavy
Lorry
Total
AADT147142455928182184876
20-year total308788294,6395883822378102,396
Table 9. Vehicle calibration factors for the different emission types [48].
VehicleNitrous OxideCarbon DioxideSulfur Dioxide
aNOxFRNOxaCO2aSO2
Light Truck0.02700.00001.80000.0050
Medium Truck0.02700.00002.00000.0050
Medium Car0.05500.17001.80000.0005
Heavy Bus0.02700.00002.00000.0050
Articulated Truck0.02700.00002.00000.0050
Heavy Truck0.02700.00002.00000.0050
Table 10. Vehicle model parameters for the different emission types [48].
Vehiclea0 (×10−2)a1 (×10−2)a2 (×10−2)
Light Truck−2.936.010.00
Medium Truck1.392.900.00
Medium Car−3.924.922.00
Heavy Bus1.392.900.00
Articulated Truck13.72.940.00
Heavy Truck1.392.900.00
Table 11. Annual emission quantities (tons).
YearCarbon Dioxide—CO2Sulfur Dioxide—SO2Nitrous Oxide—NOx
AC22 10/40–65 PMB ReferenceAC22 50/70 + 3%SBS AC22 50/70AC22 10/40–65 PMB ReferenceAC22 50/70 + 3%SBSAC22 50/70AC22 10/40–65 PMB ReferenceAC22 50/70 + 3%SBSAC22 50/70
1367.96368.11368.360.440.440.442.992.992.99
2368.12368.55369.330.440.440.442.993.003.00
3368.30369.04370.360.440.440.442.993.003.01
4368.49369.53371.440.440.440.443.003.013.02
5368.68370.05372.580.440.440.453.003.013.03
6368.87370.61373.780.440.440.453.003.023.04
7369.06371.22375.040.440.440.453.003.023.06
8369.26371.89377.360.440.440.453.003.033.08
9369.48372.65382.980.440.450.463.003.033.08
10369.74373.97459.810.440.450.543.013.053.49
11370.03376.97527.040.440.450.613.013.073.93
12370.38381.58527.040.440.460.613.013.083.93
13370.79447.86527.040.440.520.613.023.413.93
14371.72523.87527.040.440.610.613.033.913.93
15374.11527.04527.040.450.610.613.053.933.93
16378.49527.04527.040.460.610.613.083.933.93
17390.59527.04527.040.470.610.613.093.933.93
18470.27527.04527.040.550.610.613.553.933.93
19527.04527.04527.040.610.610.613.933.933.93
20527.04527.04527.040.610.610.613.933.933.93
total7838.428598.149091.449.3110.1210.6662.6867.2170.10
Table 12. The annual value of emission quantities (EUR).
YearCarbon Dioxide—CO2Sulfur Dioxide—SO2Nitrous Oxide—NOx
AC22 10/40–65 PMB ReferenceAC22 50/70 + 3%SBS AC22 50/70AC22 10/40–65 PMB ReferenceAC22 50/70 + 3%SBS AC22 50/70AC22 10/40–65 PMB ReferenceAC22 50/70 + 3%SBS AC22 50/70
151,73551,75651,79152895289528952,20552,20552,205
251,75851,81851,92852895289528952,20552,38052,380
351,78351,88752,07352895289528952,20552,38052,555
451,81051,95652,22452895289528952,38052,55552,729
551,83652,02952,38552895289540952,38052,55552,904
651,86352,10852,55352895289540952,38052,72953,078
751,89052,19452,73152895289540952,38052,72953,428
851,91852,28853,05752895289540952,38052,90453,777
951,94952,39553,84752895409552952,38052,90453,777
1051,98552,58064,64952895409649152,55553,25360,935
1152,02653,00274,10252895409733252,55553,60268,618
1252,07553,65074,10252895529733252,55553,77768,618
1352,13362,96974,10252896250733252,72959,53968,618
1452,26473,65674,10252897332733252,90468,26968,618
1552,60074,10274,10254097332733253,25368,61868,618
1653,21674,10274,10255297332733253,77768,61868,618
1754,91774,10274,10256497332733253,95168,61868,618
1866,12074,10274,10266117332733261,98368,61868,618
1974,10274,10274,10273327332733268,61868,61868,618
2074,10274,10274,10273327332733268,61868,61868,618
total1,102,0821,208,8981,278,256111,906121,642128,1331,094,3931,173,4871,223,946
Disclaimer/Publisher’s Note: The statements, opinions and data contained in all publications are solely those of the individual author(s) and contributor(s) and not of MDPI and/or the editor(s). MDPI and/or the editor(s) disclaim responsibility for any injury to people or property resulting from any ideas, methods, instructions or products referred to in the content.

