Abstract
The determination of mechanical properties for different building materials is a highly relevant and practical field of application for machine learning (ML) techniques within the construction sector. When working with vibrocentrifuged concrete products and structures, it is crucial to consider factors related to the impact of aggressive environments. Artificial intelligence methods can enhance the prediction of vibrocentrifuged concrete properties through the use of specialized machine learning algorithms for materials’ strength determination. The aim of this article is to establish and evaluate machine learning algorithms, specifically Linear Regression (LR), Support Vector Regression (SVR), Random Forest (RF), CatBoost (CB), for the prediction of compressive strength in vibrocentrifuged concrete under diverse aggressive operational conditions. This is achieved by utilizing a comprehensive database of experimental values obtained in laboratory settings. The following metrics were used to analyze the accuracy of the constructed regression models: Mean Absolute Error (MAE), Mean Squared Error (MSE), Root-Mean-Square Error (RMSE), Mean Absolute Percentage Error (MAPE) and coefficient of determination (R2). The average MAPE in the range from 2% (RF, CB) to 7% (LR, SVR) allowed us to draw conclusions about the possibility of using “smart” algorithms in the development of compositions and quality control of vibrocentrifuged concrete, which ultimately entails the improvement and acceleration of the construction and building materials manufacture. The best model, CatBoost, showed MAE = 0.89, MSE = 4.37, RMSE = 2.09, MAPE = 2% and R2 = 0.94.
1. Introduction
Currently, construction volumes continue to grow rapidly and exceed the maximum indicators of previous years. Projects that were “frozen” during the pandemic are being resumed, and new ones emerge that require serious material resources [1]. The use of cost-effective building materials, widely used in various construction infrastructure facilities, including vibrocentrifuged concrete, is coming to the fore [2,3].
Vibrocentrifuged concrete is concrete made using centrifugal compaction technology with the additional technological stage that exerts additional vibrations during concrete’s formation. This type of concrete has a varitropic structure with different cross-sectional densities. Due to the influence of centrifugal forces, most of the coarse aggregate is concentrated in the outer part of the product, which makes the outer part of the structure more durable. In the middle part of the vibrocentrifuged product, the solution part and smaller grains of coarse aggregate are predominantly concentrated. The positive effect of mixed action of vibration and centrifugal compaction is observed in this area of the product. Vibrations make it possible to form more uniform and dense outer and middle layers. The internal part of the product comprises a mortar part with a large amount of squeezed out water from the top and middle layers and is the least durable [4,5]. In addition to thetechnological solutions aimed at improving physical and mechanical characteristics, there are inexpensive and effective formulation solutions that can improve the properties of vibrocentrifuged concrete [5].
Particular attention should also be paid to predicting the strength characteristics of vibrocentrifuged concrete. Structures made from vibrocentrifuged concrete must withstand extreme operating conditions, and accurate prediction of their properties is important, first of all, to ensure the required level of safety [6,7,8,9,10]. Along with traditional methods for calculating strength, which involve the formation of a sample and its subsequent testing in laboratory conditions, modern, fast and equally predictive methods of machine learning are used today [11,12,13,14]. For example, in the research presented in [15], the authors applied one of the machine forecasting methods—the random forest method. The developed model for predicting the change in compressive strength of concrete is in good agreement with the experimental results. In general, tree-based models, such as decision trees and random forests, demonstrate high forecasting quality, which is confirmed by several following investigations [16,17,18]. Also popular is the Support Vector Regression (SVR) method, which is quite often used to assess the properties of building composites. For example, in studies [19], the SVR method was used to assess the durability of high-performance basalt fiber reinforced concrete and showed fairly high accuracy. Similarly, in research [20,21,22,23,24], this machine learning method makes it possible to quite accurately predict the concrete characteristics by including various additives (fly ash, microsilica) and subject to various types of impacts. In general, the introduction of machine learning methods allows to save costs on the production of many experimental samples and the procedure for testing them, as well as significantly speeds up the process of obtaining future properties of a concrete composite [25]. Recently, there is an increased interest in prediction of concrete properties using artificial neural networks (ANN) [26,27,28]. For example, in studies [29], researchers note the potential of a machine learning method to determine the structural behavior of reinforced concrete beams, since the forecast data using ANN are consistent with the results obtained using a traditional calculation method developed in accordance with current design codes. According to the study presented in [30], artificial intelligence methods can enhance concrete production by utilizing specialized algorithms to analyze concrete characteristics. Methods based on CatBoost, K-nearest neighbors and SVR using their own accumulated empirical base showed excellent results when the error was between 6.15–7.89%. In an article [31], a hybrid machine learning model was developed to identify failure modes more accurately and predict the shear strength of rectangular hollow reinforced concrete columns. This was achieved by utilizing moth-flame optimization (MFO) and implementing a five-fold cross-validation approach to fine-tune the hyperparameters. In summary, the hybrid MFO (extreme gradient boosting (XGB)) model shows an accuracy of 93% in classification and coefficient of determination R2 = 0.996 in predicting the shear strength of hollow reinforced concrete columns. Similar studies using ANN to estimate the ultimate loads and displacements in various concrete structures are presented in [32,33,34,35]. ANNs are also actively used to predict various properties of concrete made using various modifying additives, fiber fibers, lightweight and recycled aggregates, and the developed models show fairly accurate results [36,37,38,39,40,41].
The analyzed literature mainly covered the study of methods for predicting the properties of traditional types of concrete with a uniform cross-section of elements in terms of thickness. The review made it possible to select the most suitable methods for accurately predicting the strength of concrete with a non-uniform cross-section of elements in terms of thickness. In this regard, there is a scientific deficit, which comprises providing methods for predicting the characteristics of concrete characterized by different cross-sectional properties (the so-called variatropy) [5,8,9,10,42,43]. Hence, the uniqueness of this work can be discerned in three dimensions: theoretical, applied, and recommendatory. Theoretical expansion of ideas about the feasibility of using artificial intelligence methods, in particular machine learning algorithms, makes it possible to more broadly assess the influence of factors such as composition and environmental conditions on the performance characteristics of the material under study. The practical significance lies in the possibility of applied use of the developed methods for more accurate quality control of concrete structures, as well as for optimizing the material production process. The recommendatory nature of the final part of the study, as well as the development of specific proposals for enterprises in the construction industry, will reduce the costs of maintaining construction infrastructure by improving the safety and durability of building structures.
The purpose of this work is to predict the compressive strength of vibrocentrifuged concrete exposed to various aggressive operational impacts using four machine learning methods: Linear Regression (LR), Support Vector Regression (SVR), Random Forest (RF) and CatBoost (CB).
The primary objectives of this research are:
- -
- An in-depth examination of the existing machine learning techniques for determining the physical and mechanical attributes of concrete.
- -
- Justification of the need to supplement traditional methods for determining the strength of vibrocentrifuged concrete with forecasting tools based on machine learning methods;
- -
- Preparation of empirical data obtained during real physical experiments;
- -
- Using Feature Engineering technology to improve the accuracy of the model by adding a new feature with information about cluster membership to the original data set;
- -
- Description of the selected machine learning models, their implementation in order to compare of the data of their prediction with experimental results based on the main quality metrics of regression models.
2. Materials and Methods
2.1. Materials for Concrete
The following materials were used to make concrete:
- (1)
- Portland cement CEM I 52.5N (Serebryakovcement, Mikhailovka, Russia) with a specific surface area of 340 m2/kg, compressive strength after 28 days of hardening—56.0 MPa;
- (2)
- Crushed sandstone (Sokolovsky quarry, Novoshakhtinsk, Russia) with grain sizes from 5 to 20 mm;
- (3)
- River sand (Kagalnitsky quarry, Kagalnik, Russia) with a fineness modulus of 1.43 and a bulk density of 1400 kg/m3
2.2. Preparation Parameters and Composition of Vibrocentrifuged Concrete
The vibrocentrifuged specimens were manufactured from a concrete mixture with the following recipe and properties (Table 1). The vibrocentrifuged concrete was produced in a laboratory vibro centrifuge with the following characteristics of centrifugation (rotation speed—156 rad/s, molding duration—12 min) and vibration (height of clamp protrusions—5 mm, length of protrusions—20 mm, step between protrusions—30 mm). After molding, the samples were kept for 24 h, and then were taken from the molds and kept for 28 days in appropriate conditions. Then, they were subjected to various types of aggressive influences, such as freeze–thaw cycles; chloride attack, sulfate attack, and wet-dry cycles [5,8,9,10,42].

Table 1.
Concrete mix design.
The compressive strength of vibrocentrifuged concrete was 58.2 MPa. The standard deviation of the compressive strength values in the study was 5.6%.
2.3. Dataset Description
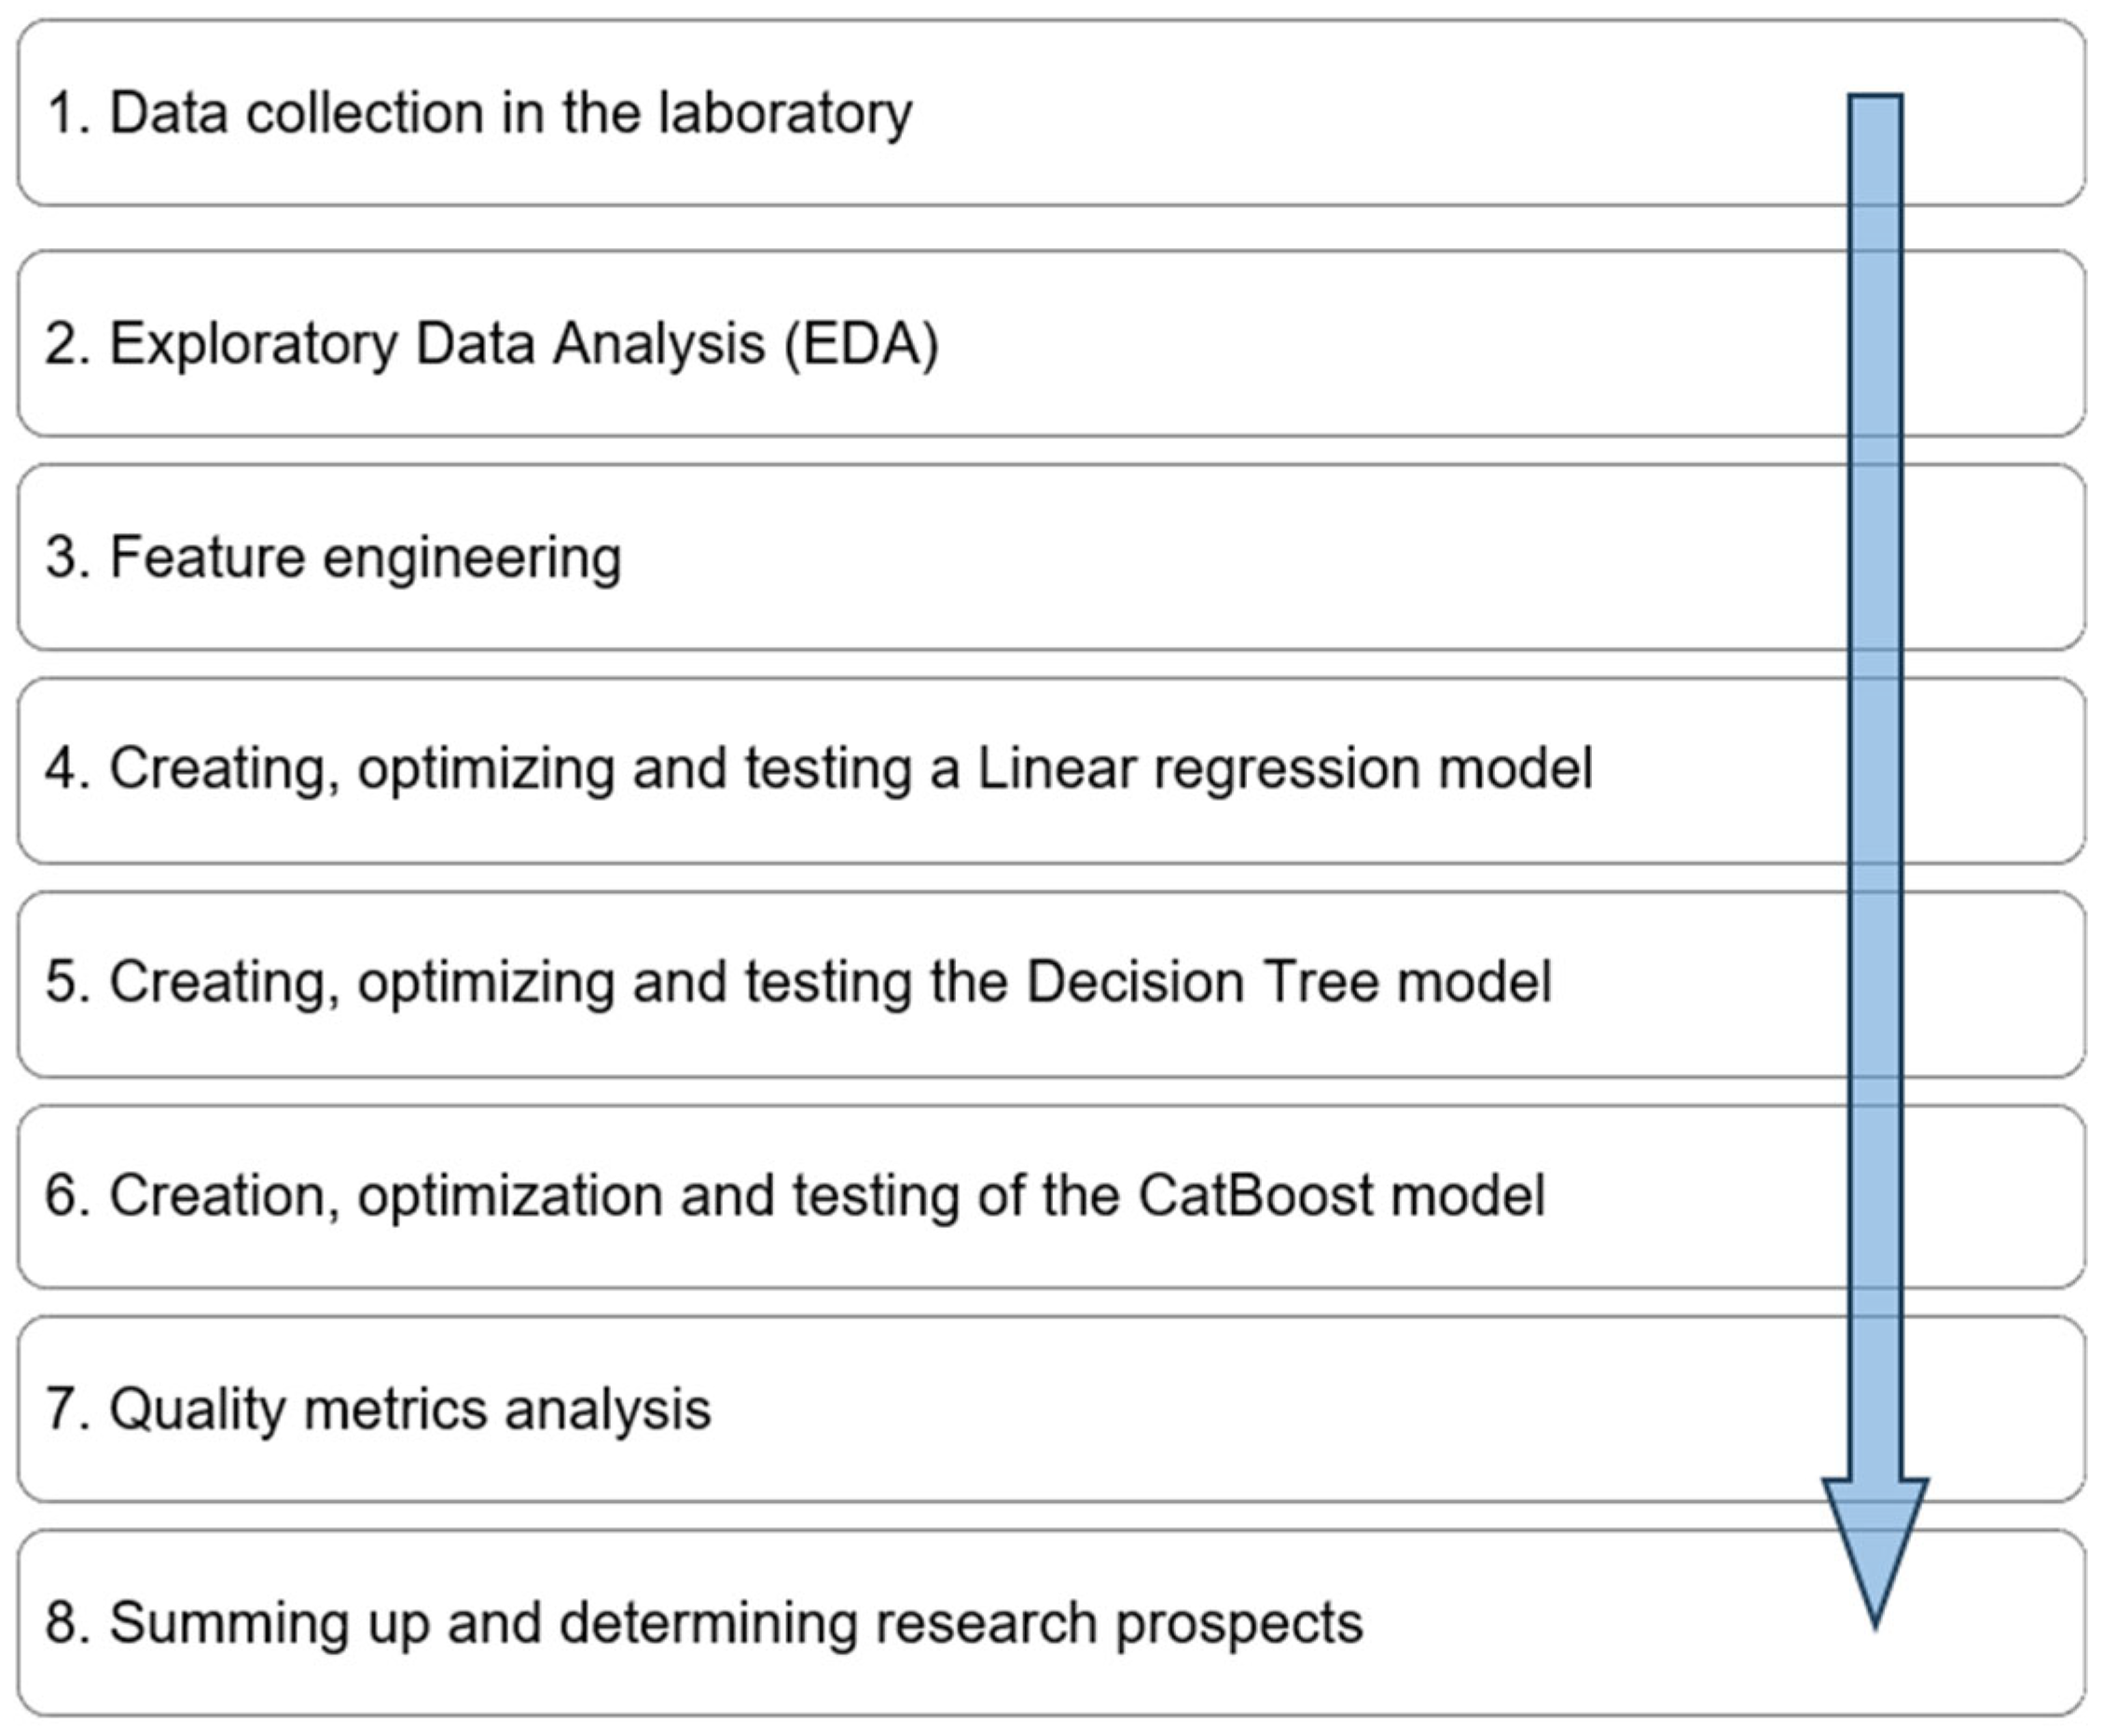
Data collection was carried out on the basis of the results of previously conducted studies [8,9,10,42], necessary for choosing an algorithm. Figure 1 shows the sequence of the study.
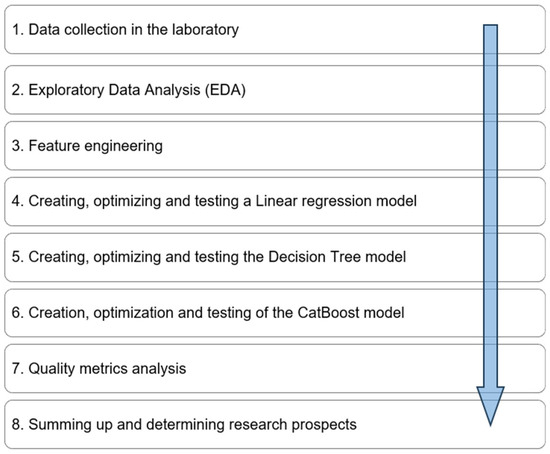
Figure 1.
Research process.
The first step was collecting data in a laboratory setting. Next, exploratory data analysis was carried out and additional features were identified. After preparing the data array, the selected machine learning models were created, optimized, and tested. After assessing their quality, the final step was to summarize and determine the prospects for the study. If the quality metrics do not suit the researcher, it could be returned to the model optimization step, or to step three for more detailed work with the data.
As an input data set, the machine learning model receives the results of laboratory tests performed to study the influence of aggressive environmental factors on the strength of vibrocentrifuged concrete.
The data array contains measurements for 600 samples of the mixture according to 4 characteristics: No. 1 (X1)—the number of freeze–thaw cycles; No. 2 (X2)—chloride content, mg/dm3; No. 3 (X3)—sulfate content, mg/dm3; No. 4 (X4)—number of wet-dry cycles, forecast column—compressive strength (MPa). A total of 600 sample trials were carried out (3 cube samples for each test). In total, 1800 sample cubes were produced.
Each of the factors is in a certain range of values [44]. For example, the parameter “number of freeze–thaw cycles” varied from 1 to 250 cycles. The concrete composite experiences destructive consequences when subjected to alternating freezing and thawing. The main reason for the destruction under freezing and thawing conditions is frozen water, which creates pressure and stress in capillary pores and the mouths of micro-cracks, which subsequently leads to the gradual destruction of concrete [45,46]. The chloride content varied from 650 mg/dm3 to 900 mg/dm3, and the sulfate content varied from 450 mg/dm3 to 550 mg/dm3. The content of chlorides and sulfates in the operating environment of vibrocentrifuged concrete contributes to the development of destructive corrosion processes. The main mechanism of action of both sulfate and chloride attack is as follows. Chlorine and sulfur ions penetrate into the thickness of concrete through places of increased permeability (micro-cracks, capillary, and open pores) and enter into chemical reactions with the formation of new unstable compounds. These crystalline compounds, having a slightly larger volume compared to the volume of the initial phase, cause internal stresses and destroy concrete [8,9,47,48]. The number of wetting and drying cycles varied from 1 to 500 cycles. The negative effect of alternating wetting and drying on concrete is primarily due to the disruption of adhesion between the cement stone and the aggregate. In accordance with this, the repetitive wetting and drying of concrete in alternating cycles can be likened to an impact, giving rise to changing stresses. This, in turn, leads to the formation and subsequent development of micro-cracks. Additionally, the accumulation of these damages leads to further deterioration of the properties of concrete [42,49].
All the above factors directly affect the strength of the building material under study. Building a model for training data in order to obtain accurate predictions for new samples that have not yet been encountered during laboratory tests, but have the same characteristics, is advisable for the construction industry during the assessment of the quality of a vibrocentrifuged concrete sample.
To understand the essence of the data and identify dependencies, it is necessary to analyze the data. Table 2 presents the statistical characteristics of the studied data set containing 600 rows.
Table 2.
Statistical characteristics of the analyzed data set.
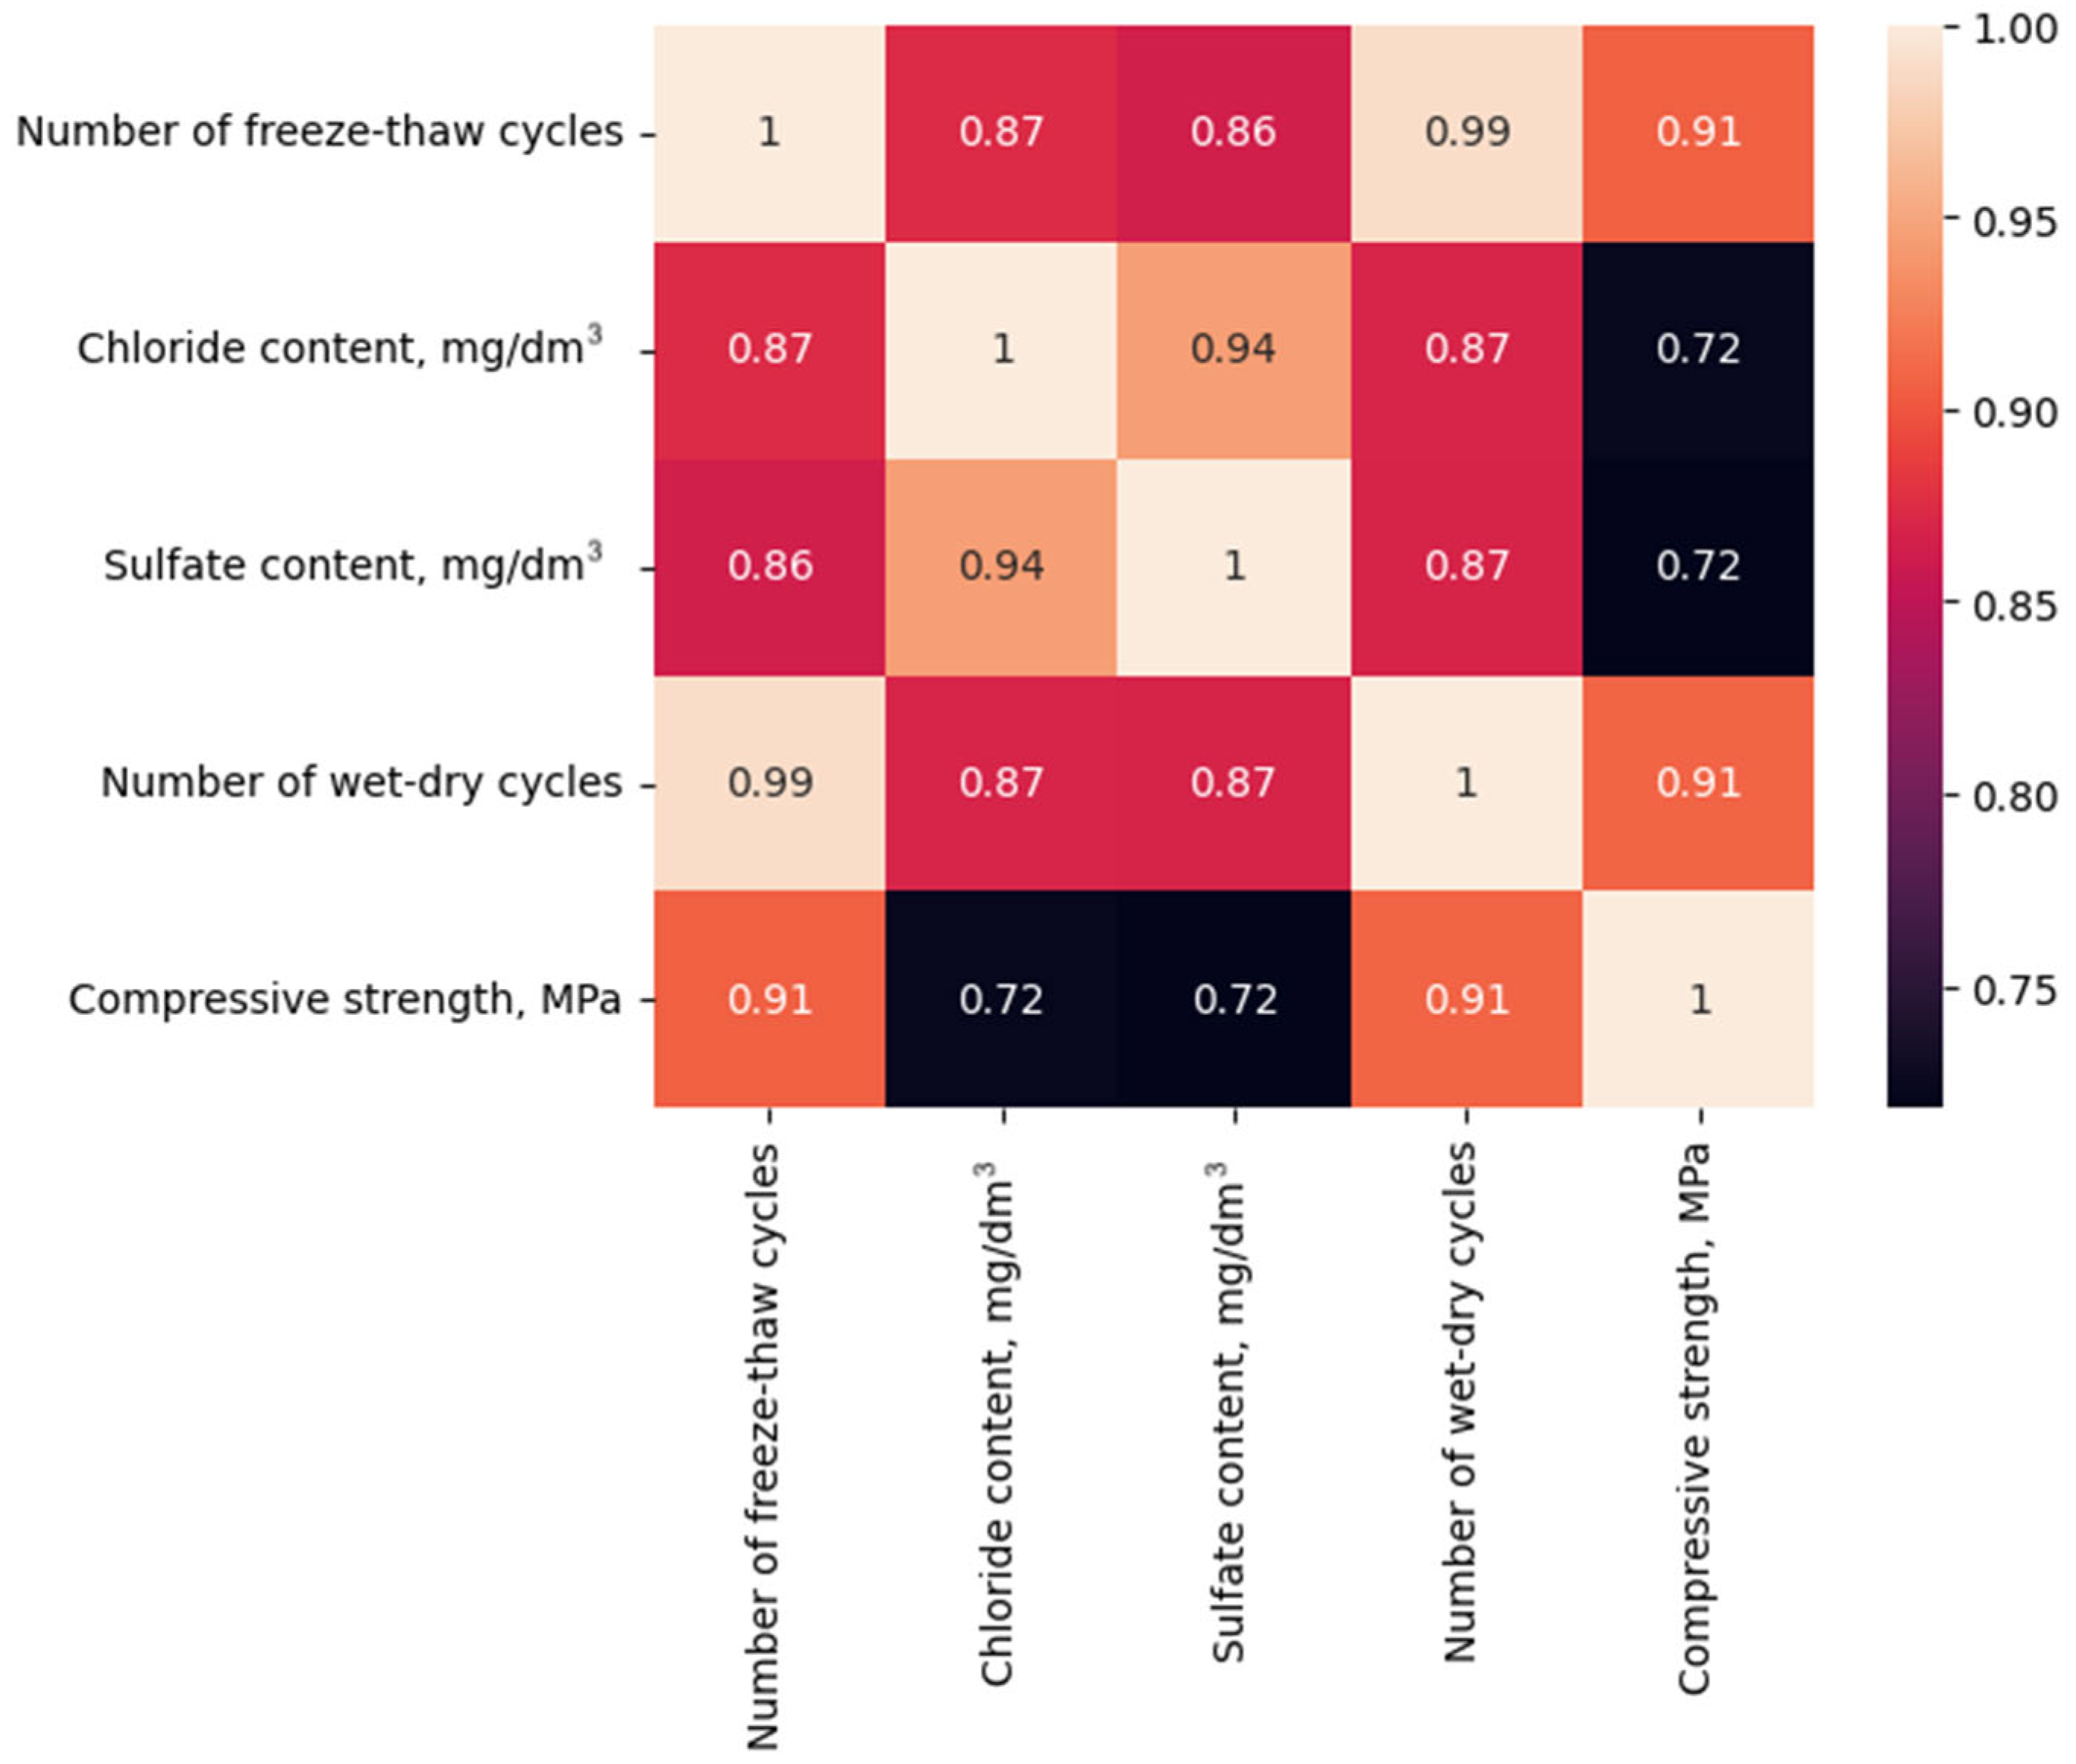
The correlation between the columns is illustrated in Figure 2. A strong linear correlation (>0.7) is observed between the individual input variables and the predicted column. Additionally, there is an observed negative correlation whereby an increase in one variable is accompanied by a decrease in another.
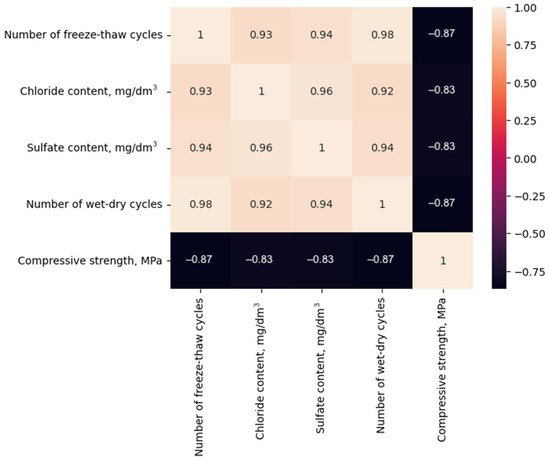
Figure 2.
Correlation matrix.
Figure 3 shows a matrix depicting a new practical correlation coefficient (), based on several improvements to the test of Pearson’s hypothesis of independence of two variables, it captures a nonlinear relationship [50].

Figure 3.
Correlation matrix taking into account nonlinear dependencies.
This correlation matrix derived from -value. -value gets transformed into a correlation coefficient of bivariate gauss with correlation value rho, provided binning and number of records. Correlation coefficient value is between 0 and 1 [50]. The application of this methodology provides additional insight into the connections and degree of influence of input parameters on the output.
Figure 4 is a visualization of the matrix of pair-wise relationships between variables in the data set.
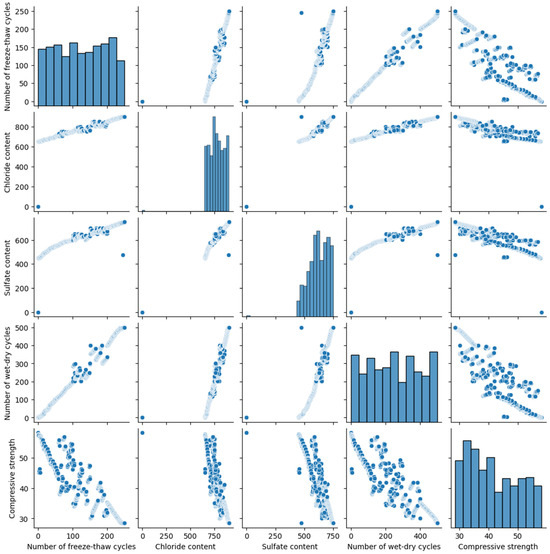
Figure 4.
Distribution of data characteristics of input and output variables.
This matrix allows us to quickly and clearly assess the degree of correlation between various characteristics, as well as identify dependency trends and outliers. A linear dependence is observed in the graphs, which corresponds to the process of conducting experiments in laboratory conditions. This means the data adequately reflects the general pattern of the process of formation of the strength characteristics of vibrocentrifuged concrete, depending on the parameters considered.
2.4. Feature Engineering
To enhance the model accuracy, the Feature Engineering technique was implemented. Feature Engineering refers to the practice of creating new features or modifying existing ones in order to enhance the performance of a machine-learning model. To confirm the hypothesis about the existence of clusters in the data, the t-SNE algorithm was used, which allows for the process of dimensionality reduction followed by visualization in a two-dimensional space [51]. The Kullback–Leibler minimization (KL-divergence) formula was used in the t-SNE method to adjust the parameters so that the similarity probabilities in the low-dimensional space are as close as possible to the probabilities in the original space. Kullback–Leibler (KL) divergence between two probability distributions, P (in high-dimensional space) and Q (in low-dimensional space) was determined by the formula:
According to Figure 5, four clusters are visually distinguished in the obtained data, where the scale indicates the value of compressive strength in MPa.
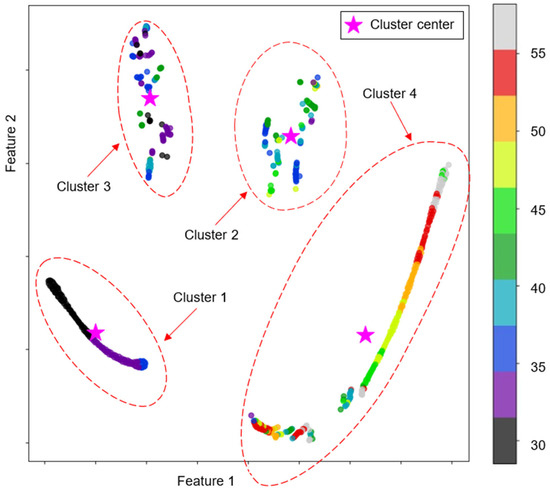
Figure 5.
Clusters in the data.
The graph axes represent Feature 1 and Feature 2, characterizing the influence of all parameters in combination with the preservation of metric properties, obtained after reducing the dimension of the input data using the t-SNE algorithm.
Cluster 4 has the highest strength values, while cluster 1 has the lowest. Then, using the K-means algorithm, clustering into 4 clusters was carried out on the original data set, and a new parameter X5 was created, indicating membership in the corresponding cluster.
2.5. Description of Machine Learning Methods Chosen for the Study
In this study, the machine learning algorithms are developed using Python 3.10.11, libraries Optuna 3.5.0 (Preferred Networks, Inc., Tokyo, Japan) and Sklearn 1.3.2.
The data set was partitioned into training, validation, and testing subsets with a distribution ratio of 65% for training, 15% for validation, and 20% for testing.
Without optimization, machine learning models often either poorly generalize relationships in the data or overfit, so a method was required that will iteratively converge when selecting hyperparameters, thereby reducing both search time and the number of iterations. To select hyperparameters in this study, the automatic hyperparameter optimization software framework Optuna was used, where at each iteration of hyperparameter selection a random validation sample was selected, and thus, the model optimization process occurs more objectively [52]. An alternative to Optuna is the Grid Search optimization algorithm, which allows selecting the best combinations of parameters from a list of options that we define ourselves, thereby automating the trial-and-error method. However, due to the large number of options for combining parameters, Grid Search takes longer to work when specifying a detailed grid. While Optuna selects optimal values in a given range based on the Tree-Structured Parzen Estimator algorithm [53].
2.5.1. Linear Regression
The first method implemented in this study is linear regression. This algorithm holds significant importance and is widely employed for forecasting purposes.
When solving a regression problem, it is necessary to preorder the actual response Y from the input vector . The linear regression model looks like (1):
where are model coefficients (weights); is bias.
To find the weights of the regression model and bias, the loss function (2) is minimized:
In preparing the data for the Linear Regression implementation, a preprocessing step was performed to standardize the data. Thus, the average value was equal to 0 and the standard deviation was 1.
Because of fit a linear model, the following equation was obtained (3):
2.5.2. Support Vector Regression (SVR)
Support Vector Regression (SVR) is a widely utilized extension of Support Vector Machines (SVM) for conducting regression analysis. As a supervised learning method, SVR requires labeled training data. In our case, there is a response column “Compressive strength, MPa”, which allows us to train the model in a controlled manner.
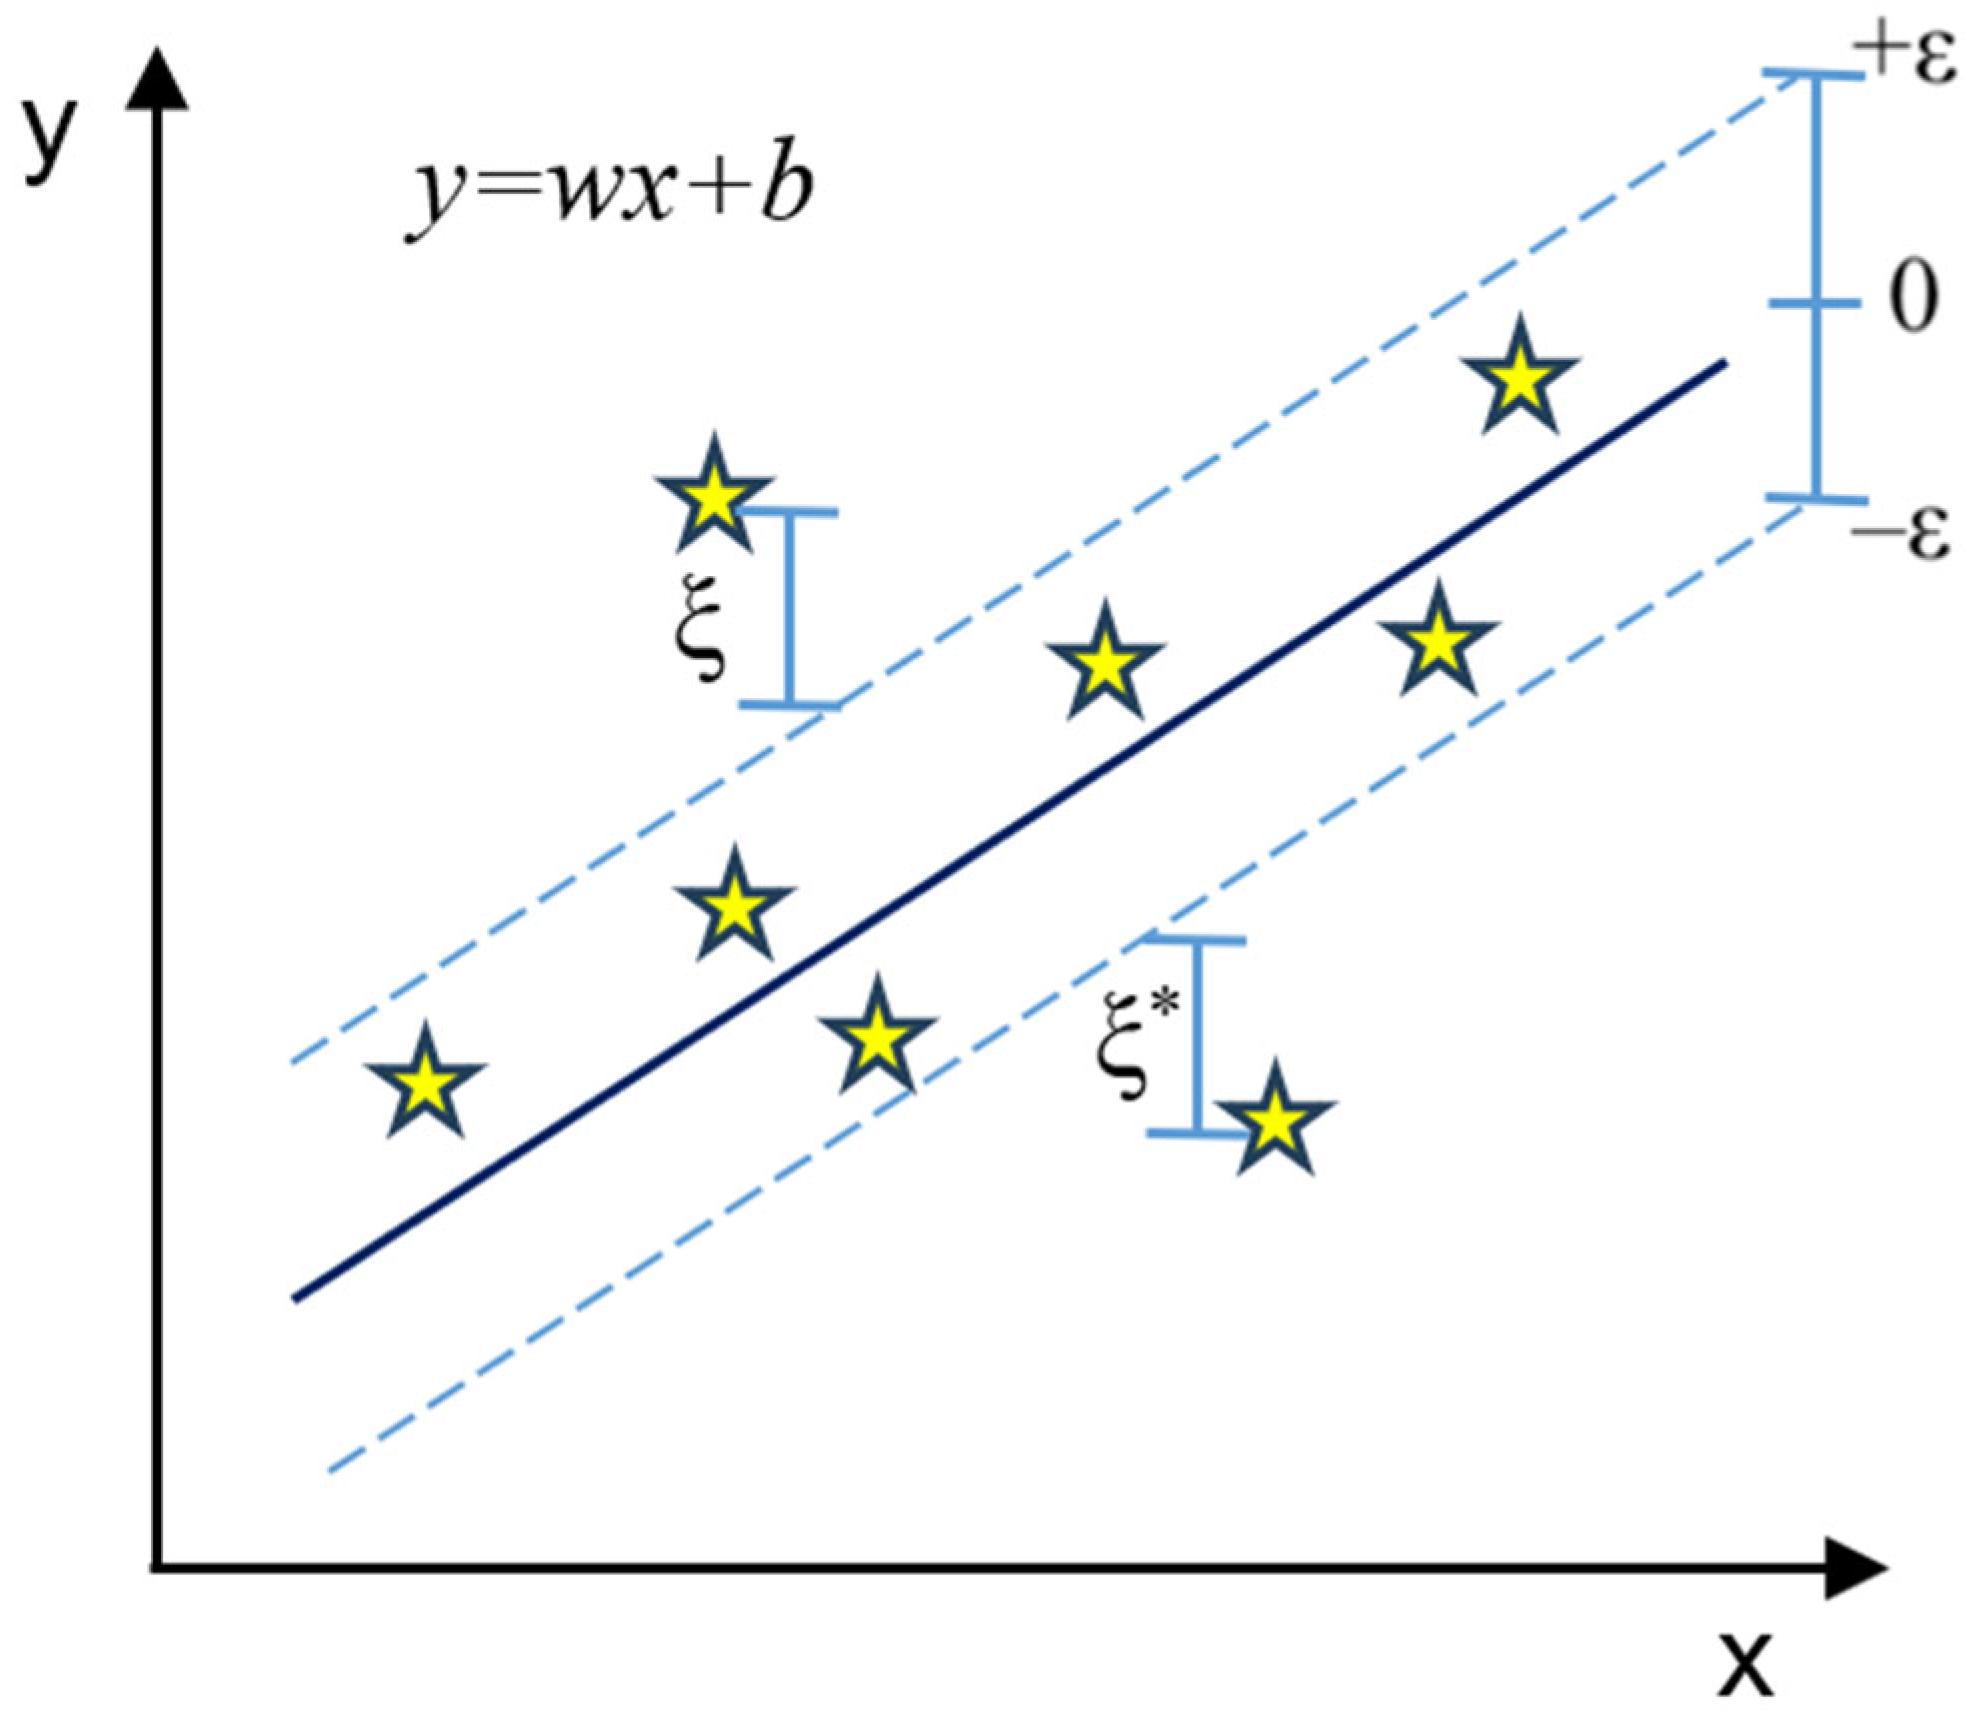
SVR in its implementation is generally very similar to the SVM method for a standard classification problem, but it is worth noting a number of differences (Figure 6) [54]:

Figure 6.
Linear SVR (a star is a symbol for point from the training set).
- SVR has a specific parameter ε (epsilon). This parameter determines “the width of the tube around the function” being evaluated (hyperplane). Predictions that fall within this “tube” are considered correct.
- Support vectors comprise points located outside the pipe, not exclusively those on the edge, as observed in classification problems.
- By modifying the regularization parameter C, one can control the value of the additional sliding variable (ξ), which serves as a measure of the distance to points situated outside the pipe.
Nevertheless, the primary concept remains consistent: to minimize error by individualizing the hyperplane that maximizes the margin, while acknowledging the acceptance of some error [54].
Here C = regularization parameter. The strength of the regularization is inversely proportional to C; = insensitive tube; = slack variables.
In this study, Linear kernel was used to build the SVR model, and the values of the regularization parameter C and Epsilon were selected (Table 3).
Table 3.
Parameters for the SVR model.
2.5.3. Random Forest Regression
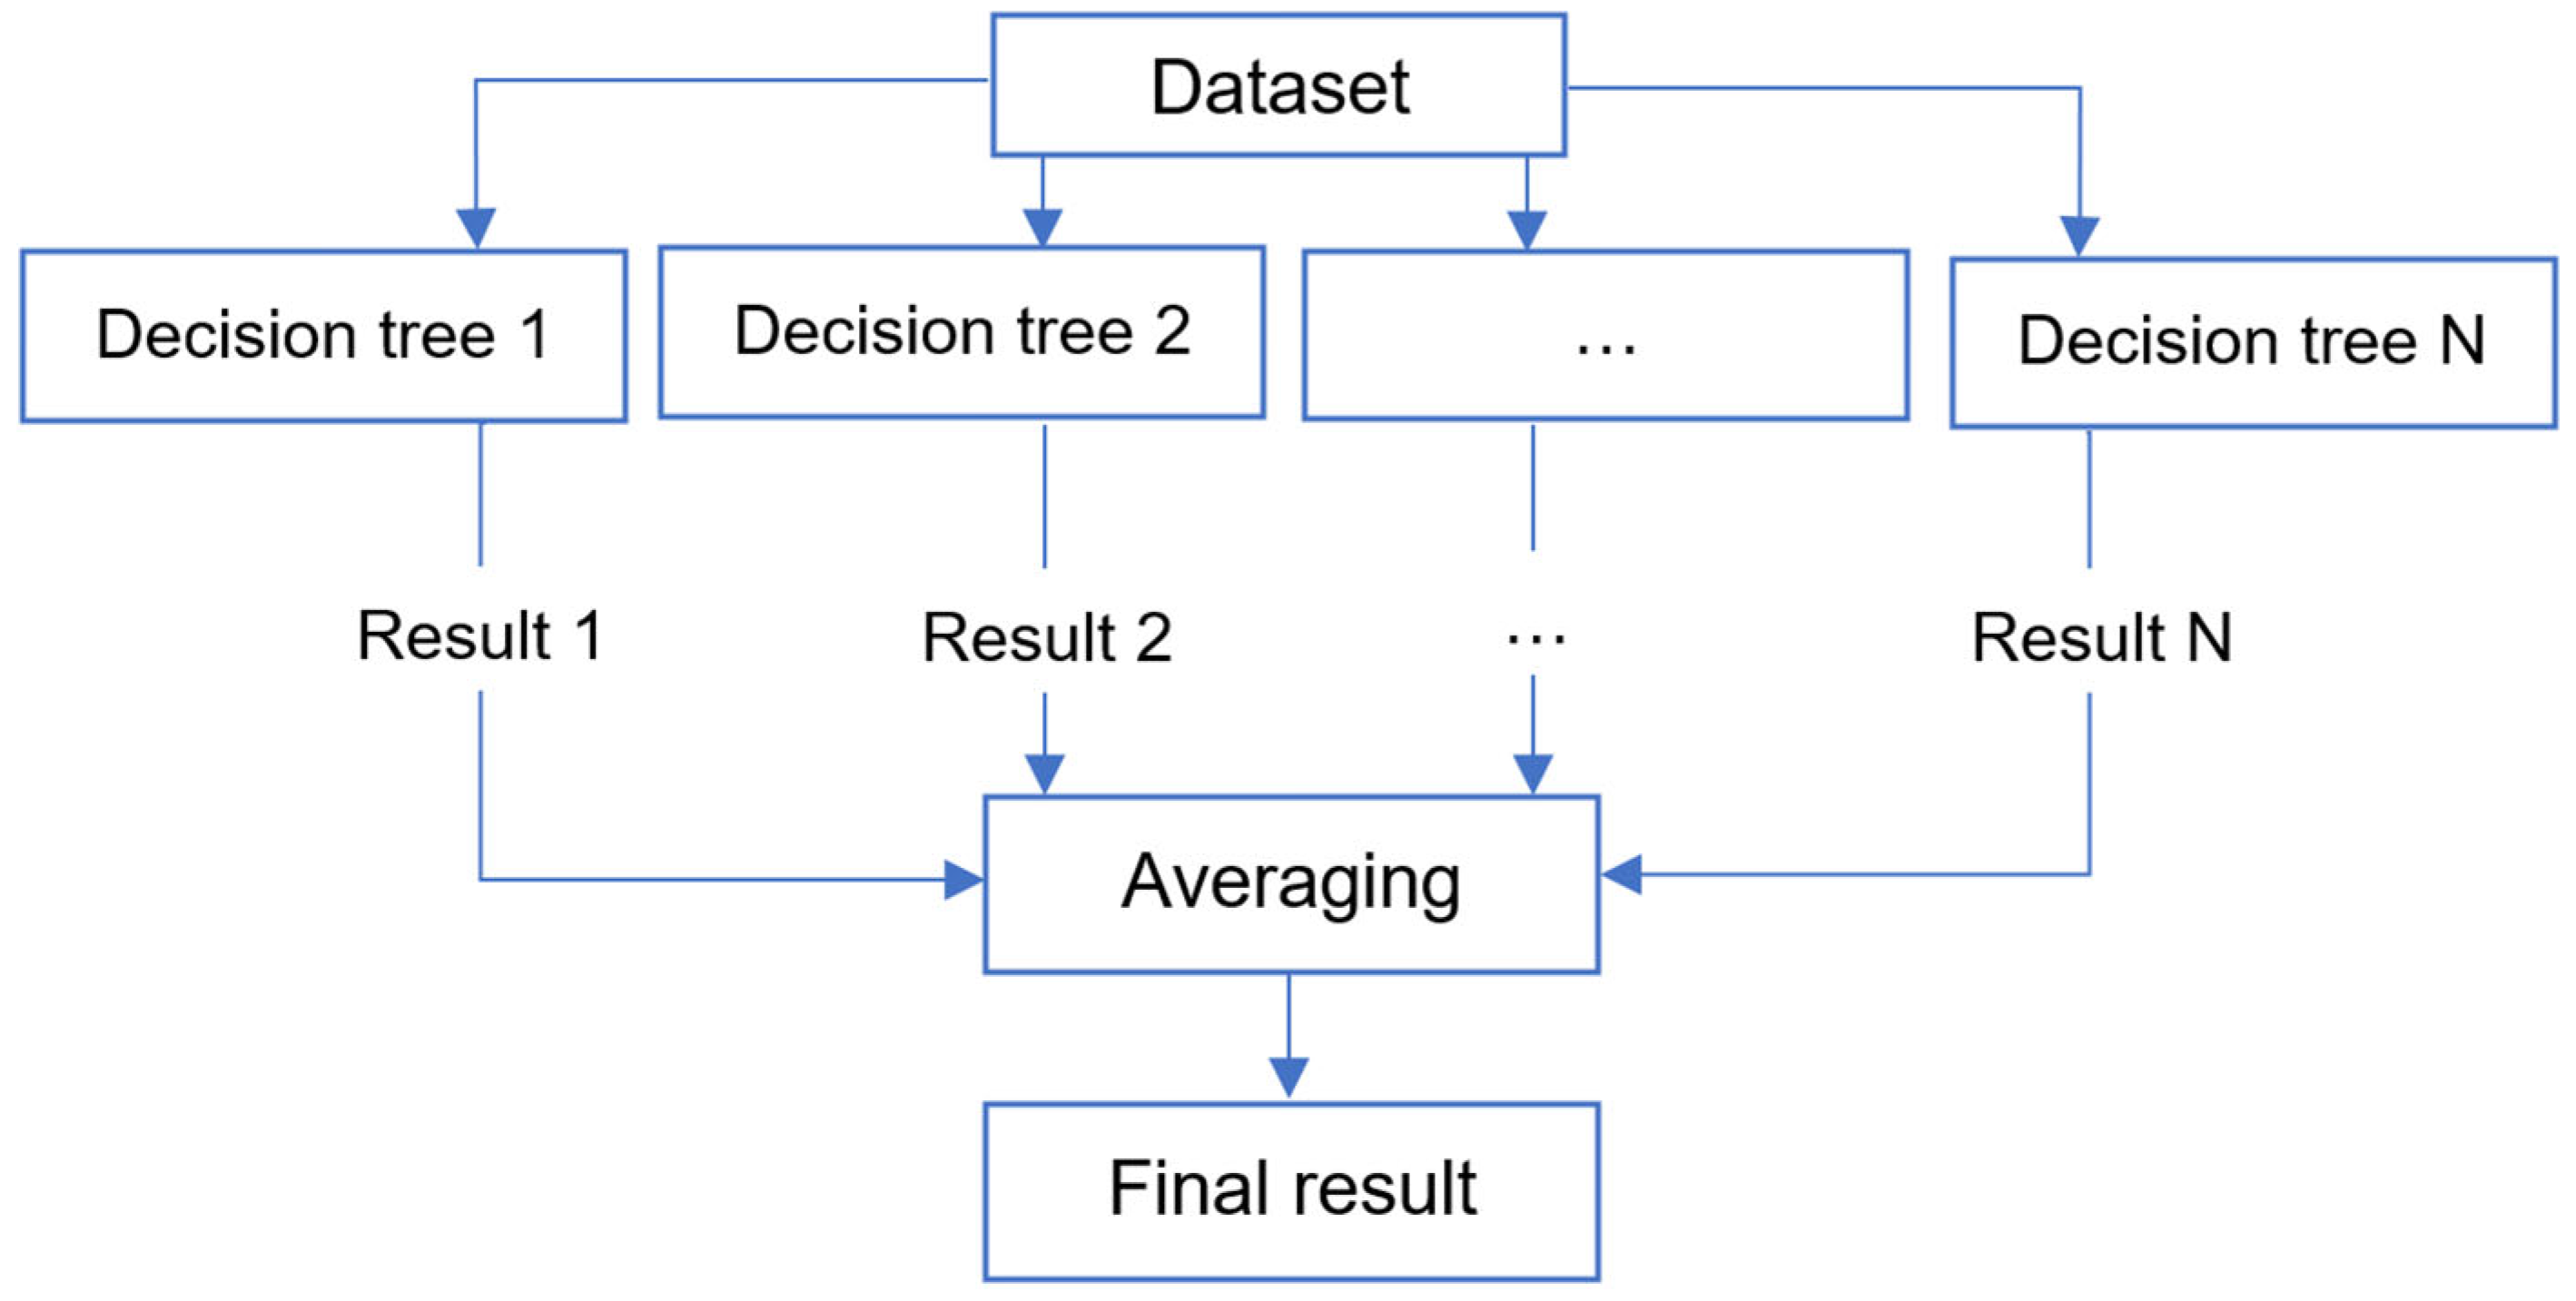
Random Forest Regression (RF) is a machine learning method that uses a large number of decision trees. The individual trees are then combined to form a consensus prediction, which is typically more accurate than a single tree.
The basic principle of RF is to create a random subset of data for each tree. This principle allows us to reduce the correlation between trees and increase their diversity. Each tree is built independently of the others, predicting the target variable using the available features. When solving a regression problem, a solution is selected by averaging the obtained values, as shown in Figure 7.
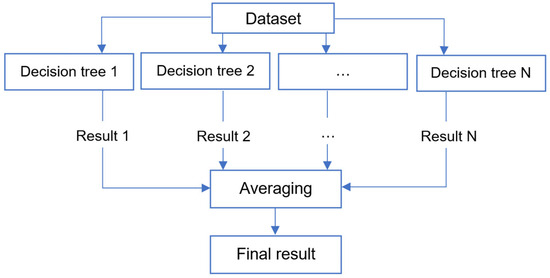
Figure 7.
Scheme of the RF algorithm.
Table 4 shows the values of the tunable hyperparameters for the Random Forest model.
Table 4.
Random Forest model parameters.
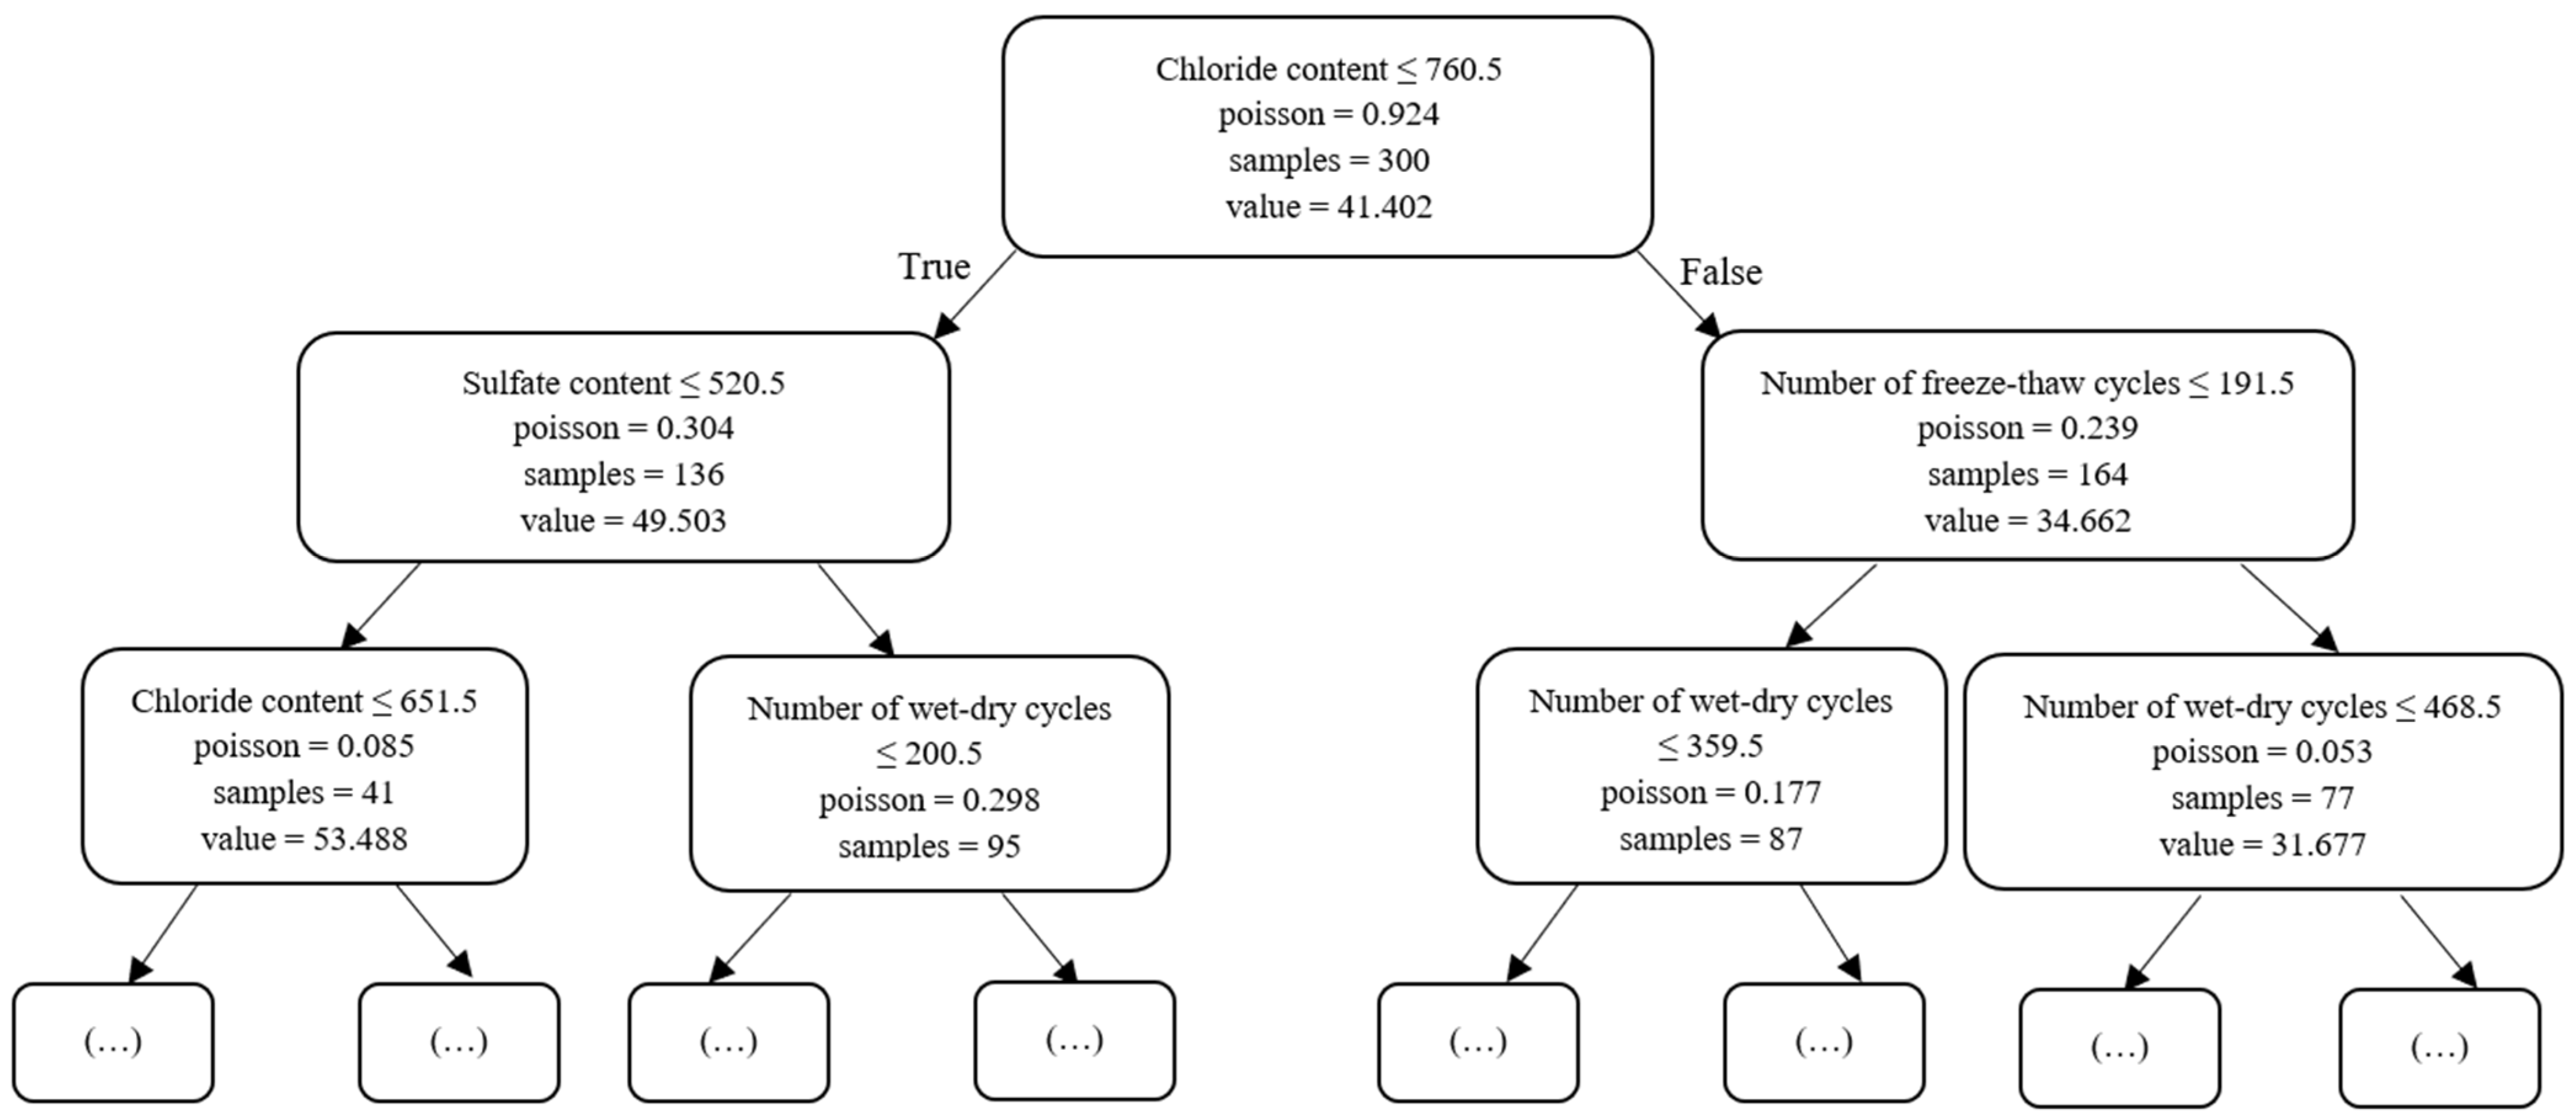
Part of one of the decision trees from Random Forest is depicted in Figure 8. Unlike CB, trees in RF are not symmetrical.
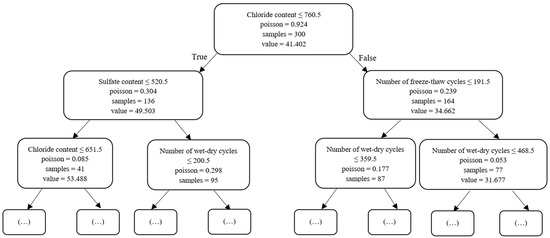
Figure 8.
Tree structure in Random Forest.
2.5.4. CatBoost Regressor
CatBoost is a machine learning library developed by Yandex for gradient boosting on decision trees. It improves the performance of gradient boosting on categorical data, which is often the case in real-world datasets. When applying decision trees using this approach, identical conditions are employed to generate left and right splits at every tree level. This entails the utilization of symmetric trees, which typically yields a substantial improvement in performance compared to the conventional layer-by-layer tree construction method.
In this study, this method was chosen because it can show good results with a relatively small amount of data, unlike other machine learning algorithms that work well only after training on a large training set.
Table 5 presents the values of customizable hyperparameters for the CatBoost model.
Table 5.
CatBoost model parameters.
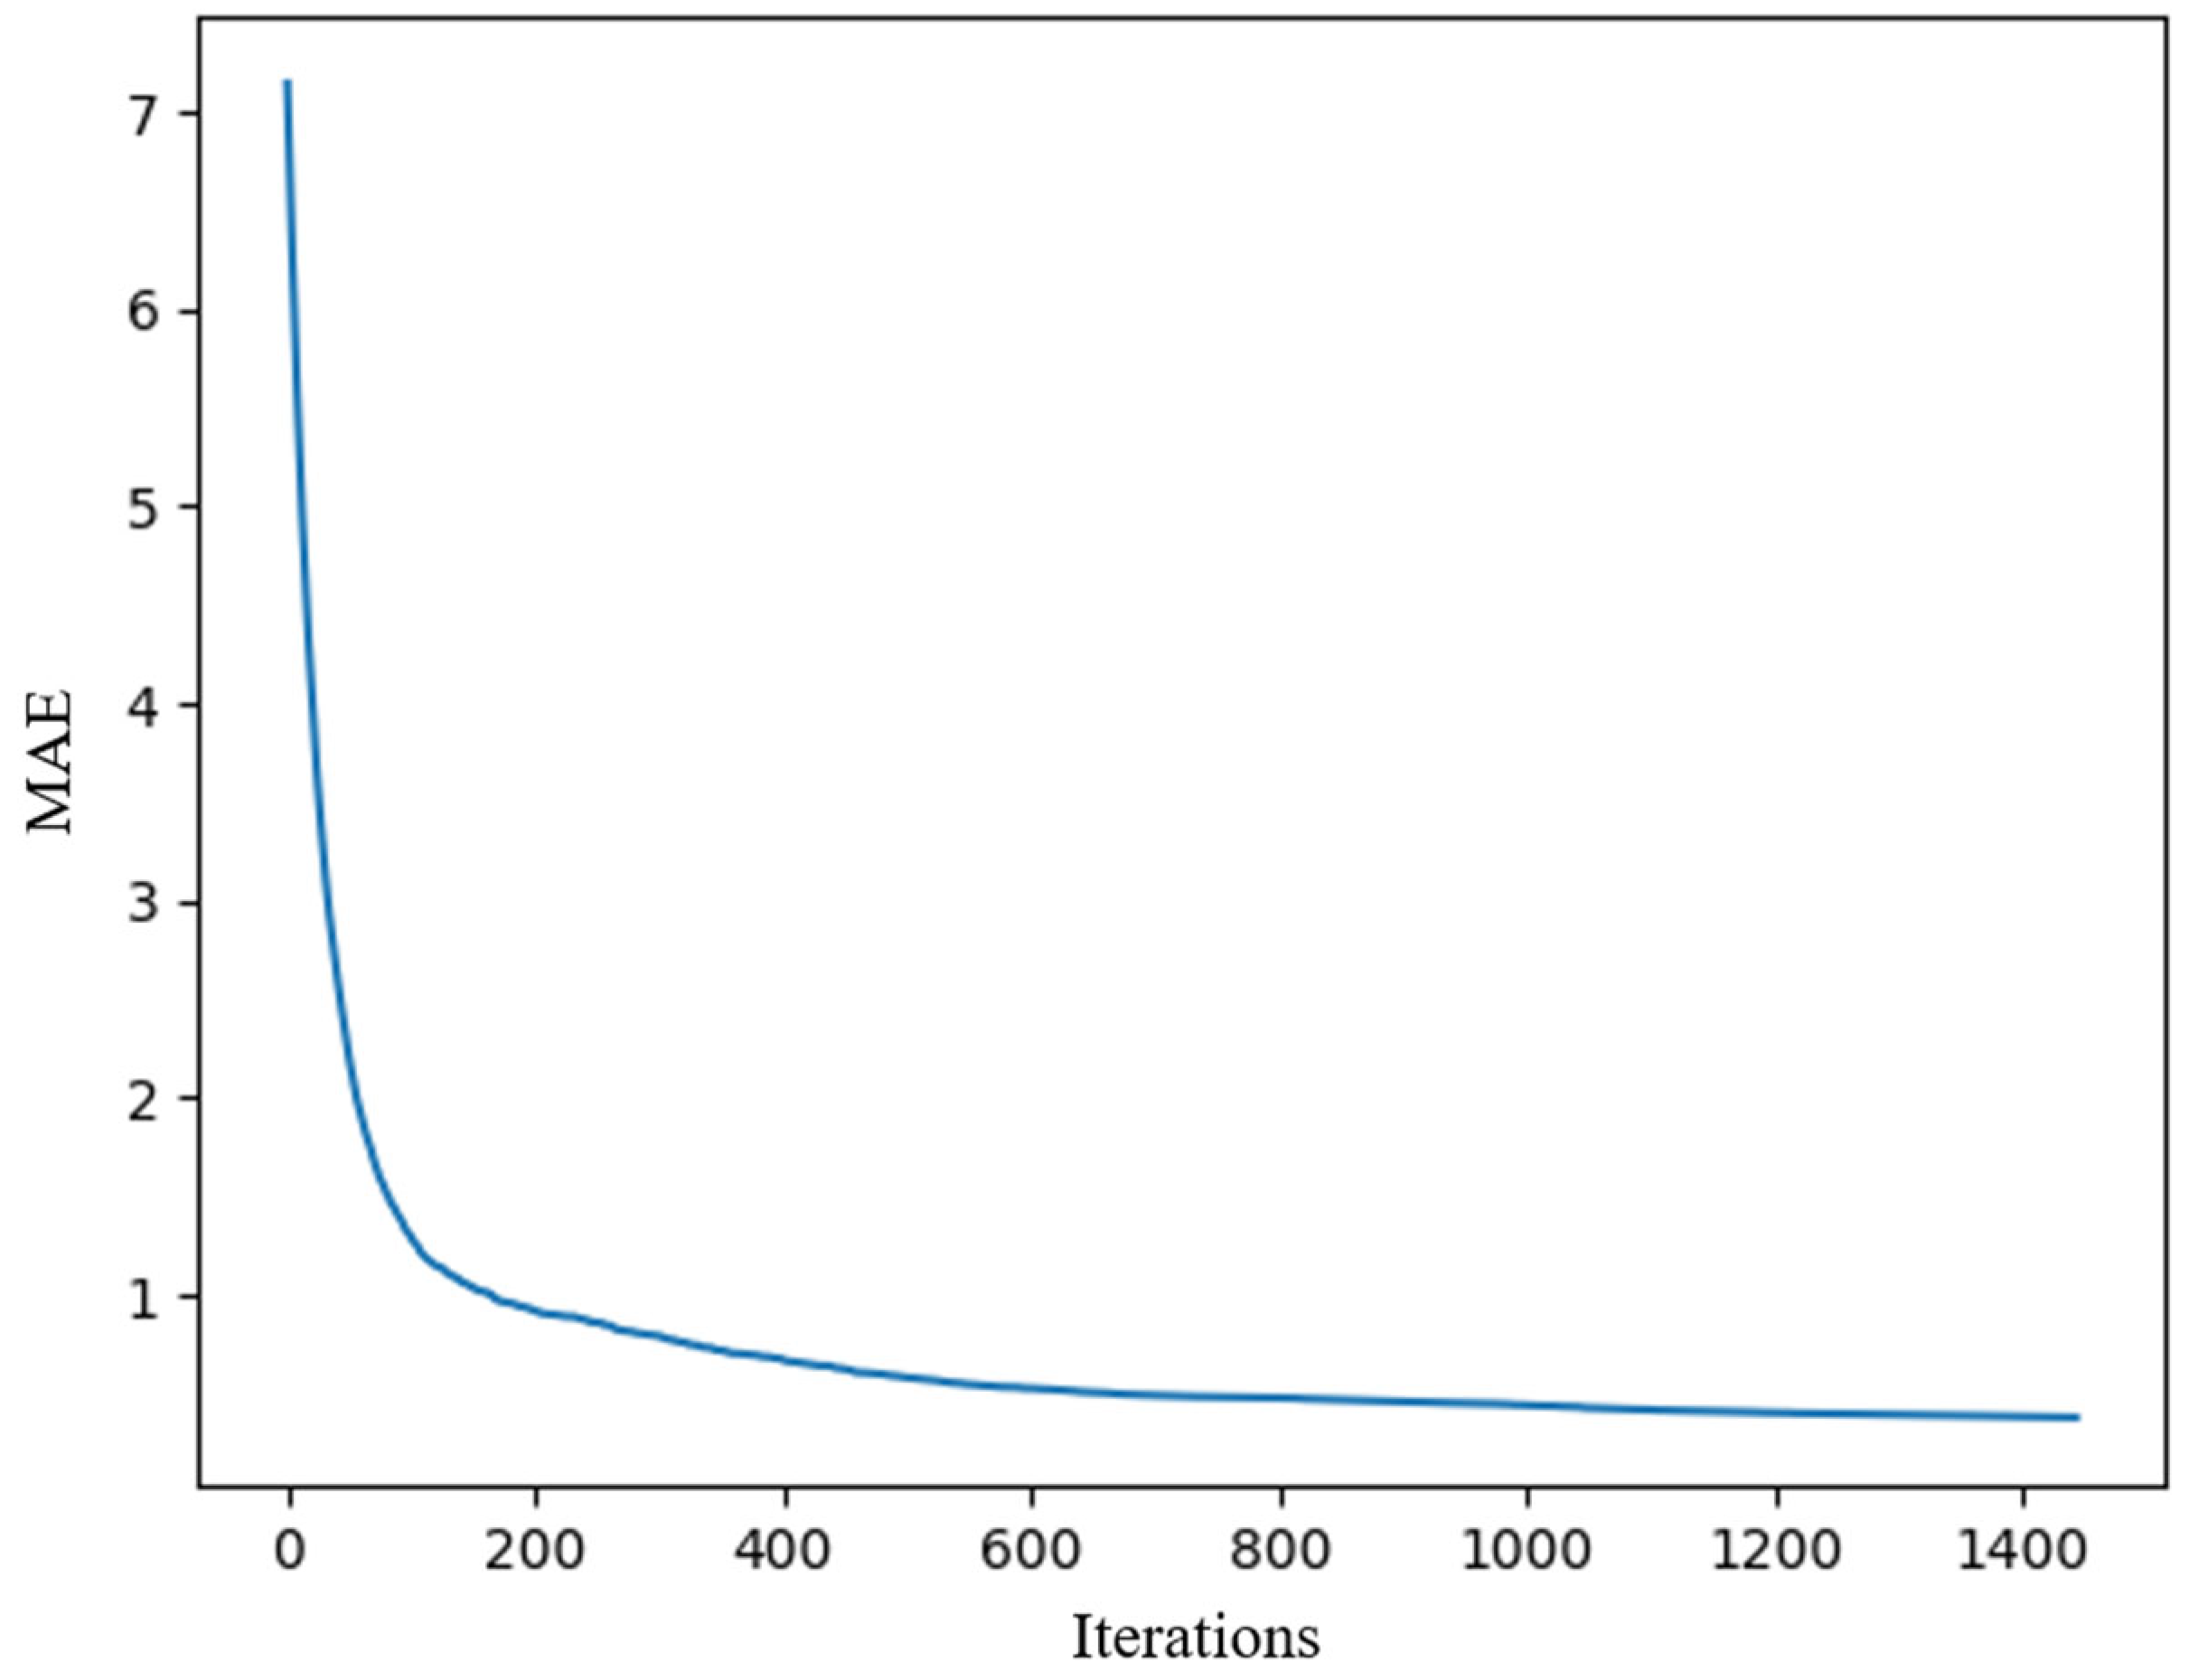
Figure 9 shows a training graph. The OX axis shows the number of iterations, and the OY axis presents the loss function.
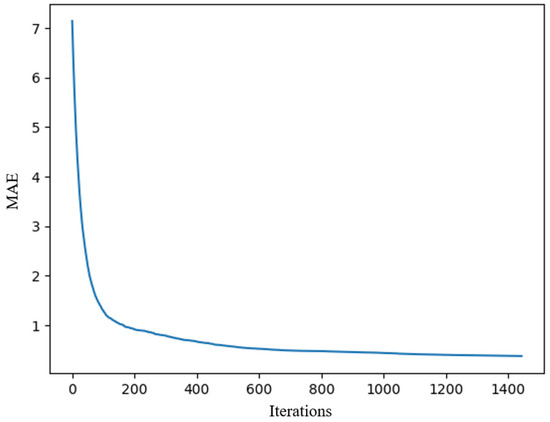
Figure 9.
Training the CatBoost model.
From the graph, we can observe that learning occurs smoothly and there is a decrease in the value of the Mean Absolute Error (MAE) metric, which is chosen as the loss function. To detect overfitting, the IncToDec method was used.
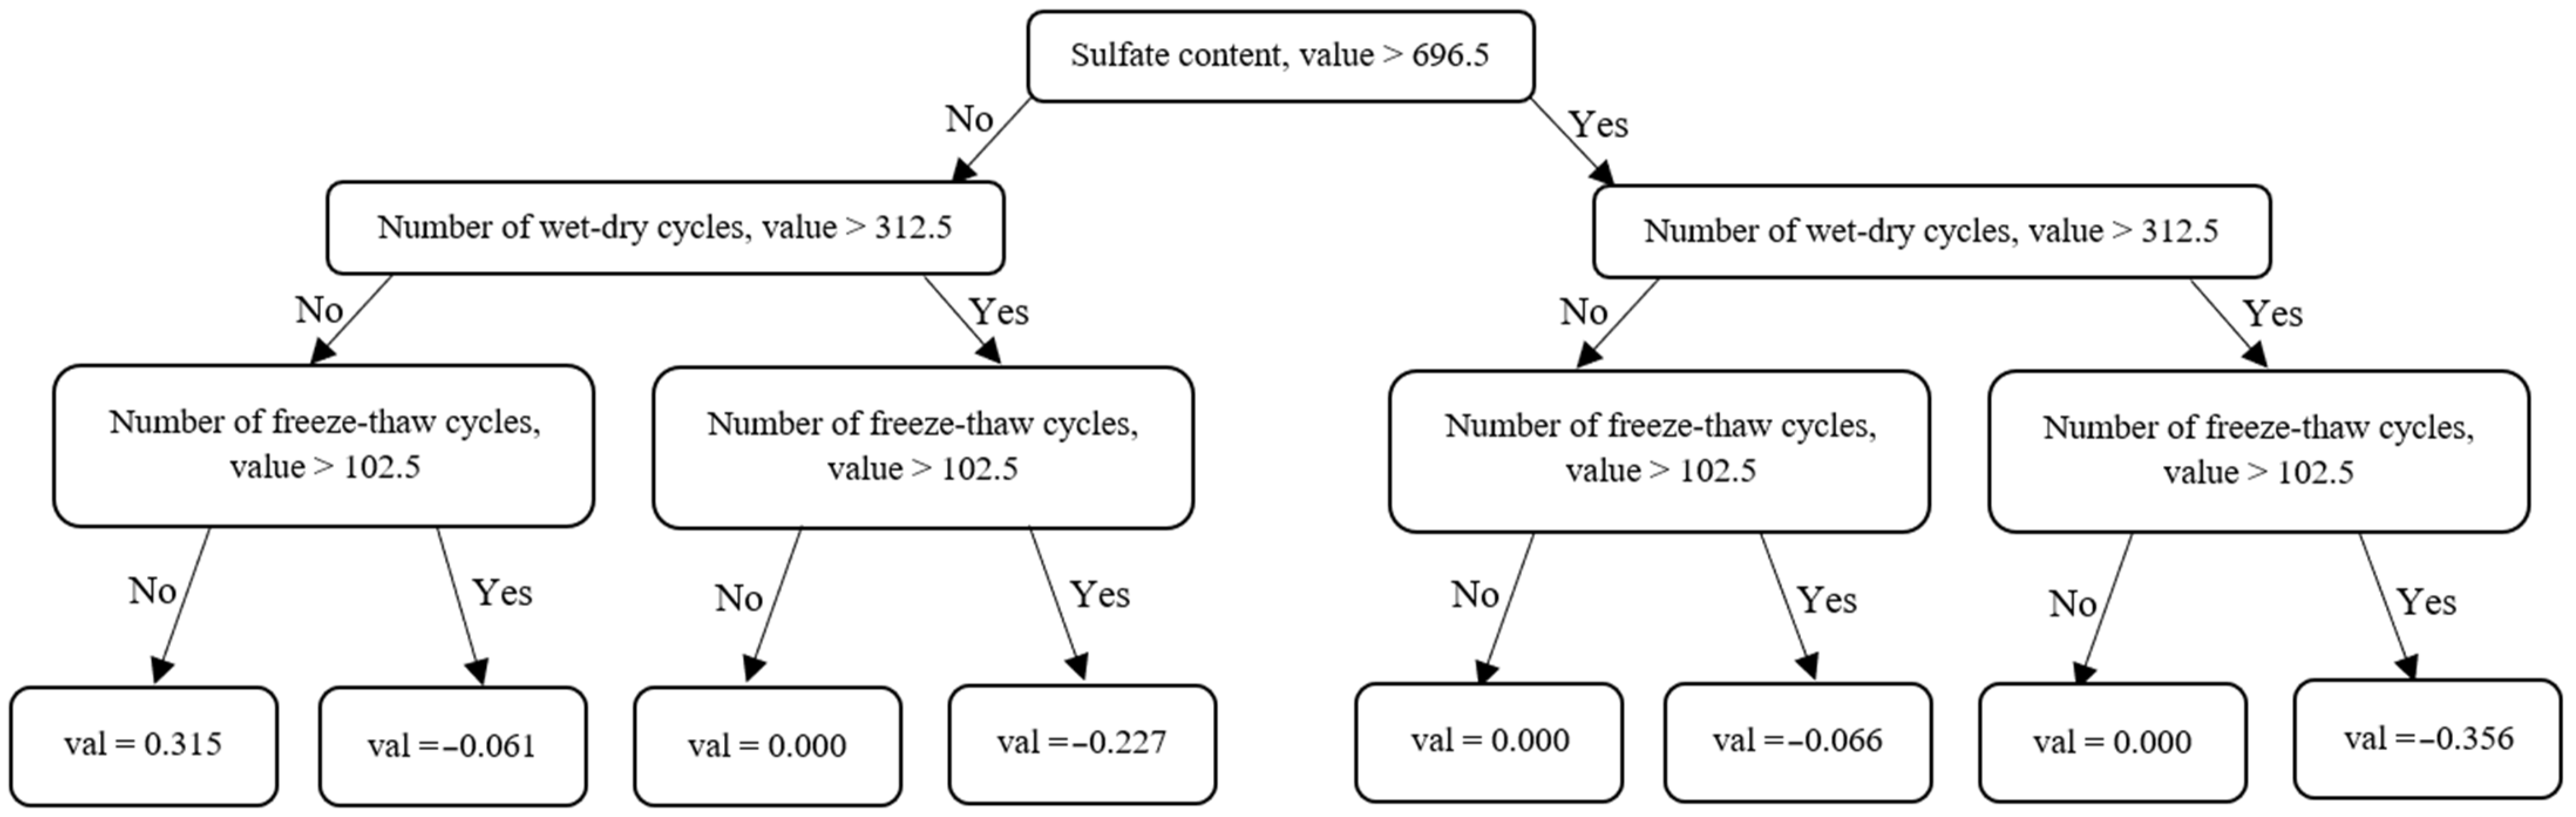
Figure 10 shows the formation of a tree structure of symmetric trees using decision rules during the implementation of the CatBoost algorithm.
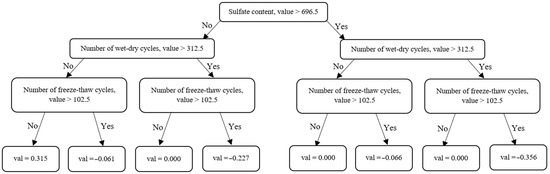
Figure 10.
Tree structure in CatBoost.
2.6. Performance-Evaluation Methods
To analyze the accuracy of the regression models obtained, the following metrics were applied: Mean Absolute Error (MAE), Mean Squared Error (MSE), Root-Mean-Square Error (RMSE), Mean Absolute Percentage Error (MAPE) and coefficient of determination R2. Formulas for calculating them (7)–(11):
Here represents the actual value of the compressive strength; = predicted value of compressive strength; is an average value for .
It is noteworthy that, in comparison to linear regression, support vector regression (SVR), random forest (RF), and catboost (CB) methods offer greater flexibility in modeling non-linear relationships between variables. However, RF and CB do not have the ability to extrapolate. In this case, this is not a problem, since the minimum and maximum values of both the features and the target variable are taken into account in the data set under consideration.
3. Results and Discussion
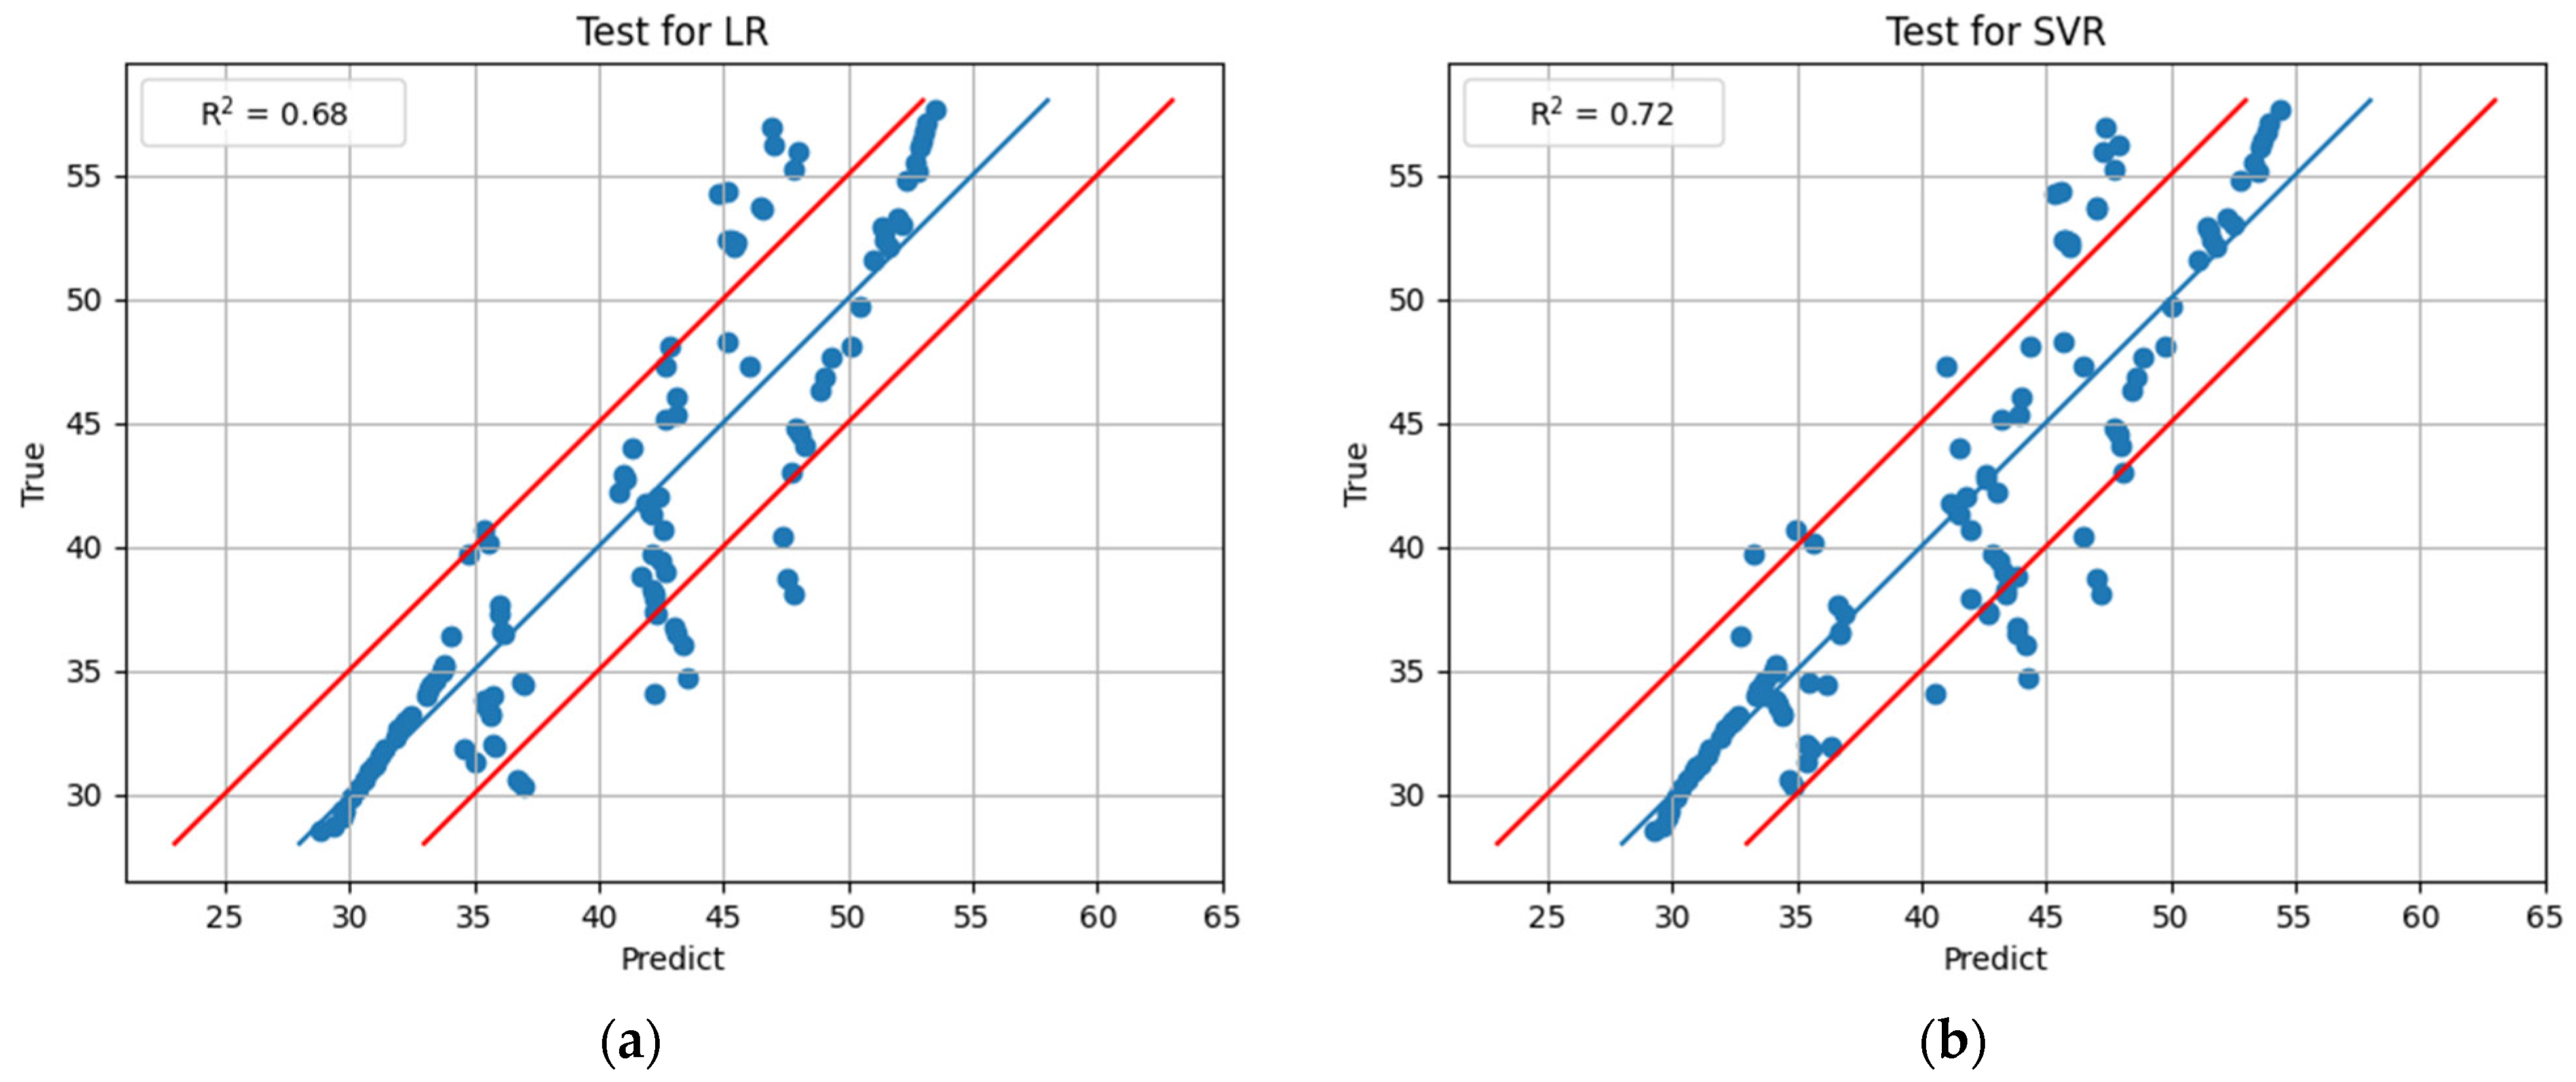
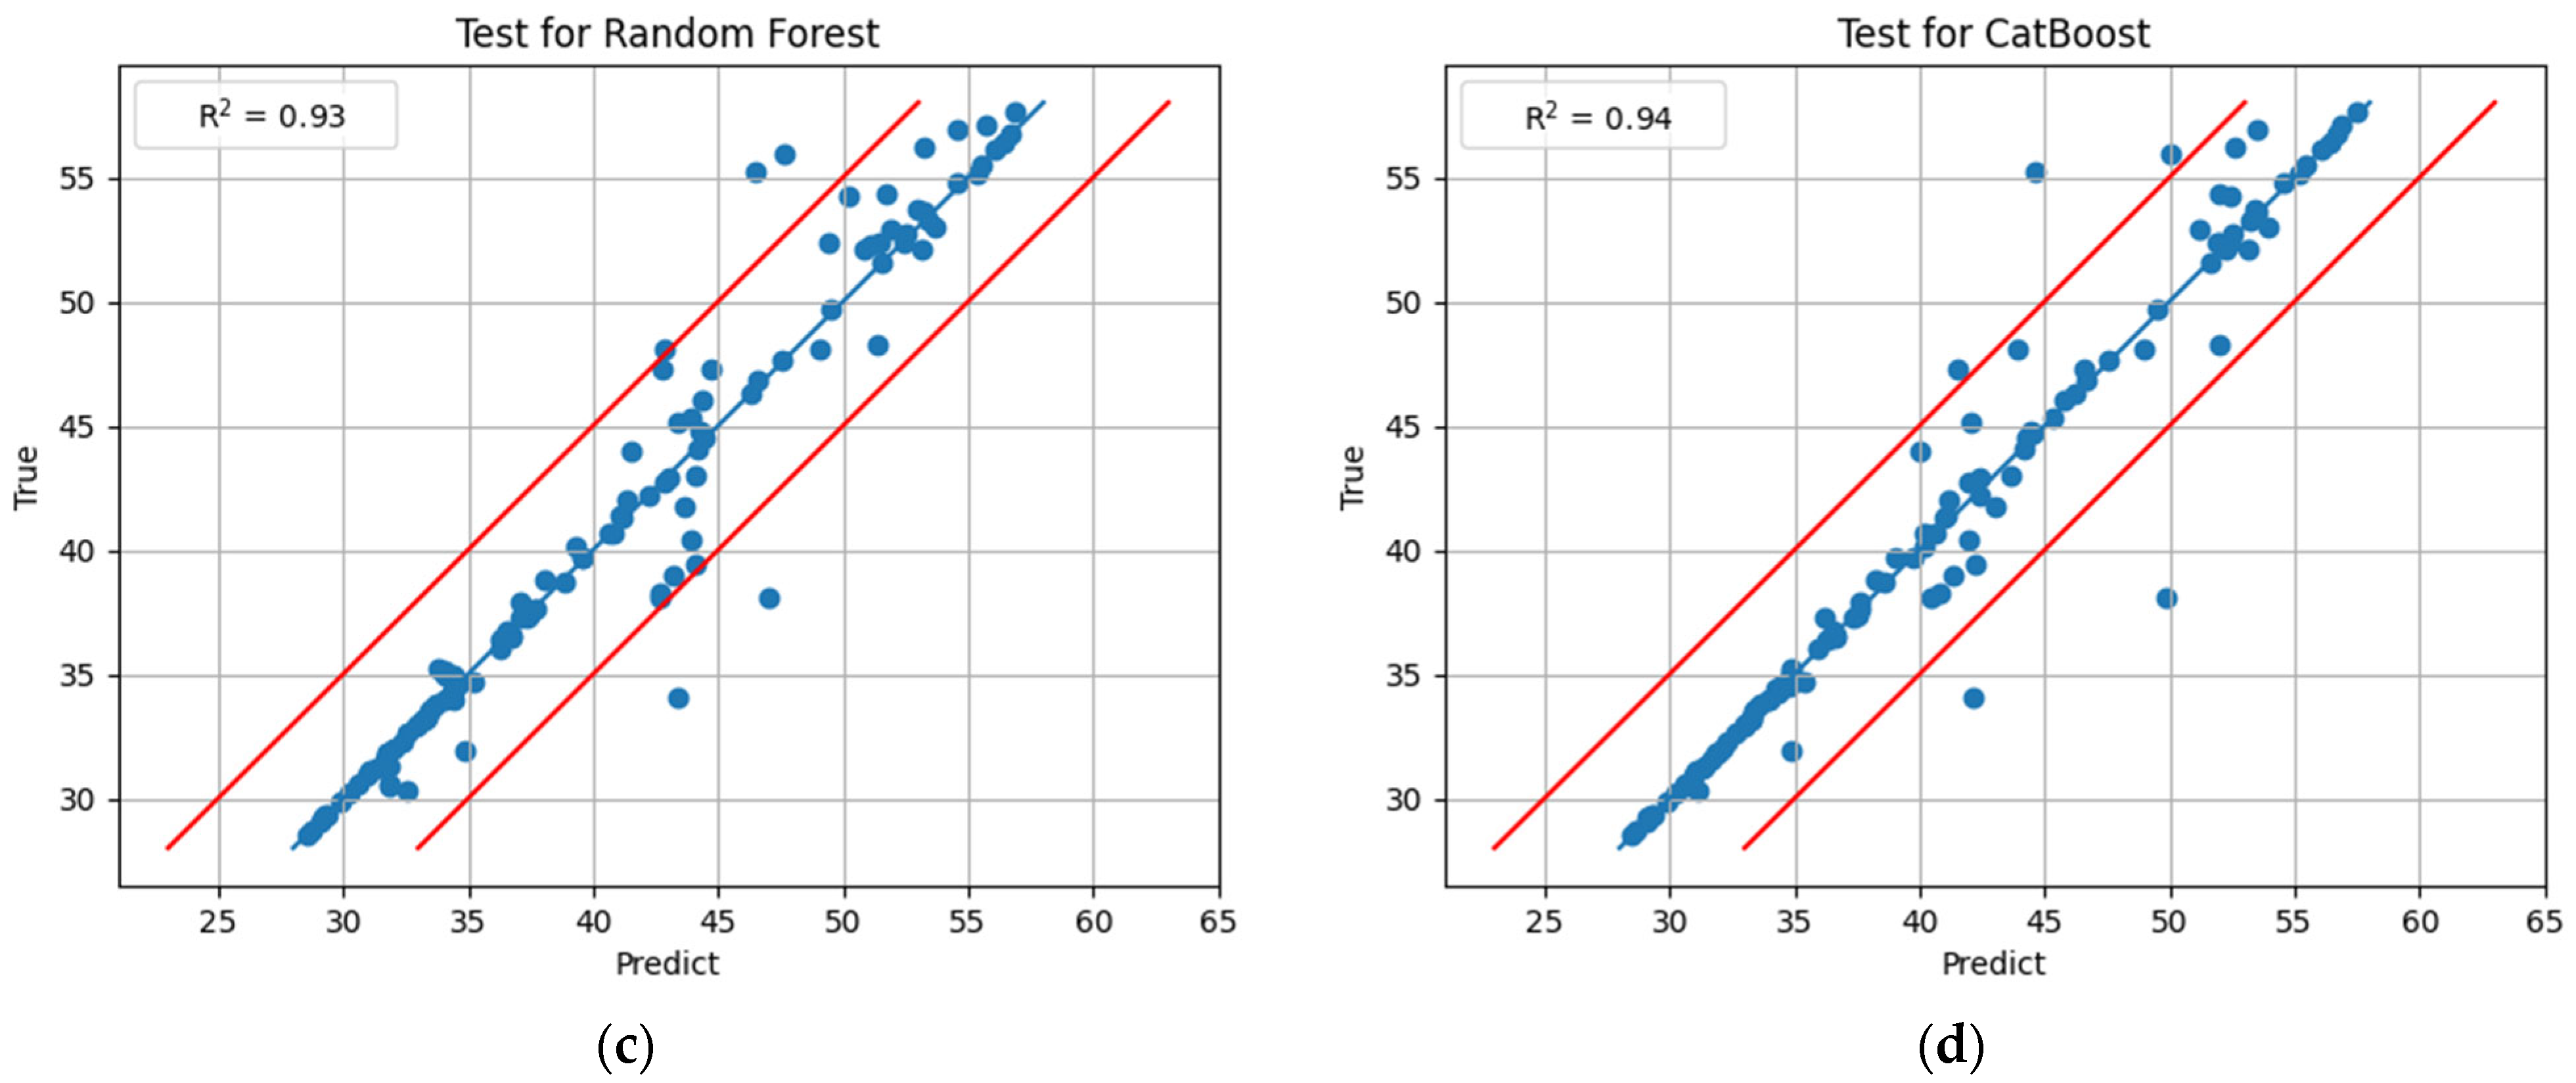
Prediction error graphs (Figure 11) show the actual strength values for vibrocentrifuged concrete samples in comparison with the predicted values obtained from the developed models based on the proposed machine learning methods. This visualization method provides a means to observe the extent of variance present in the models. The red lines highlight the boundary with ∆ = ±5 MPa, since going beyond these boundaries is undesirable when determining the compressive strength of vibrocentrifuged concrete (taking into account the considered factors influencing the strength).
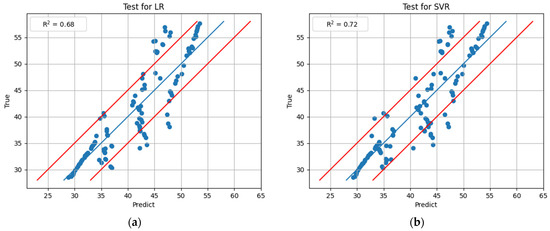
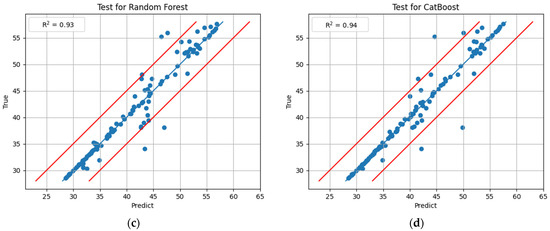
Figure 11.
Relationship between actual compressive strength values and calculated values for model (a) LR; (b) SVR; (c) RF; (d) CB.
Analyzing the forecast results on the test sample, we can conclude that the tree-like algorithms Random Forest and CatBoost show more accurate results from the statistical point of view and falling into a given interval of the “tube” with boundaries ∆ = ±5 MPa. For the Linear Regression and Support Vector Regression methods, some forecast values are observed to go beyond a conventionally defined “tube”, both beyond the upper and lower limits.
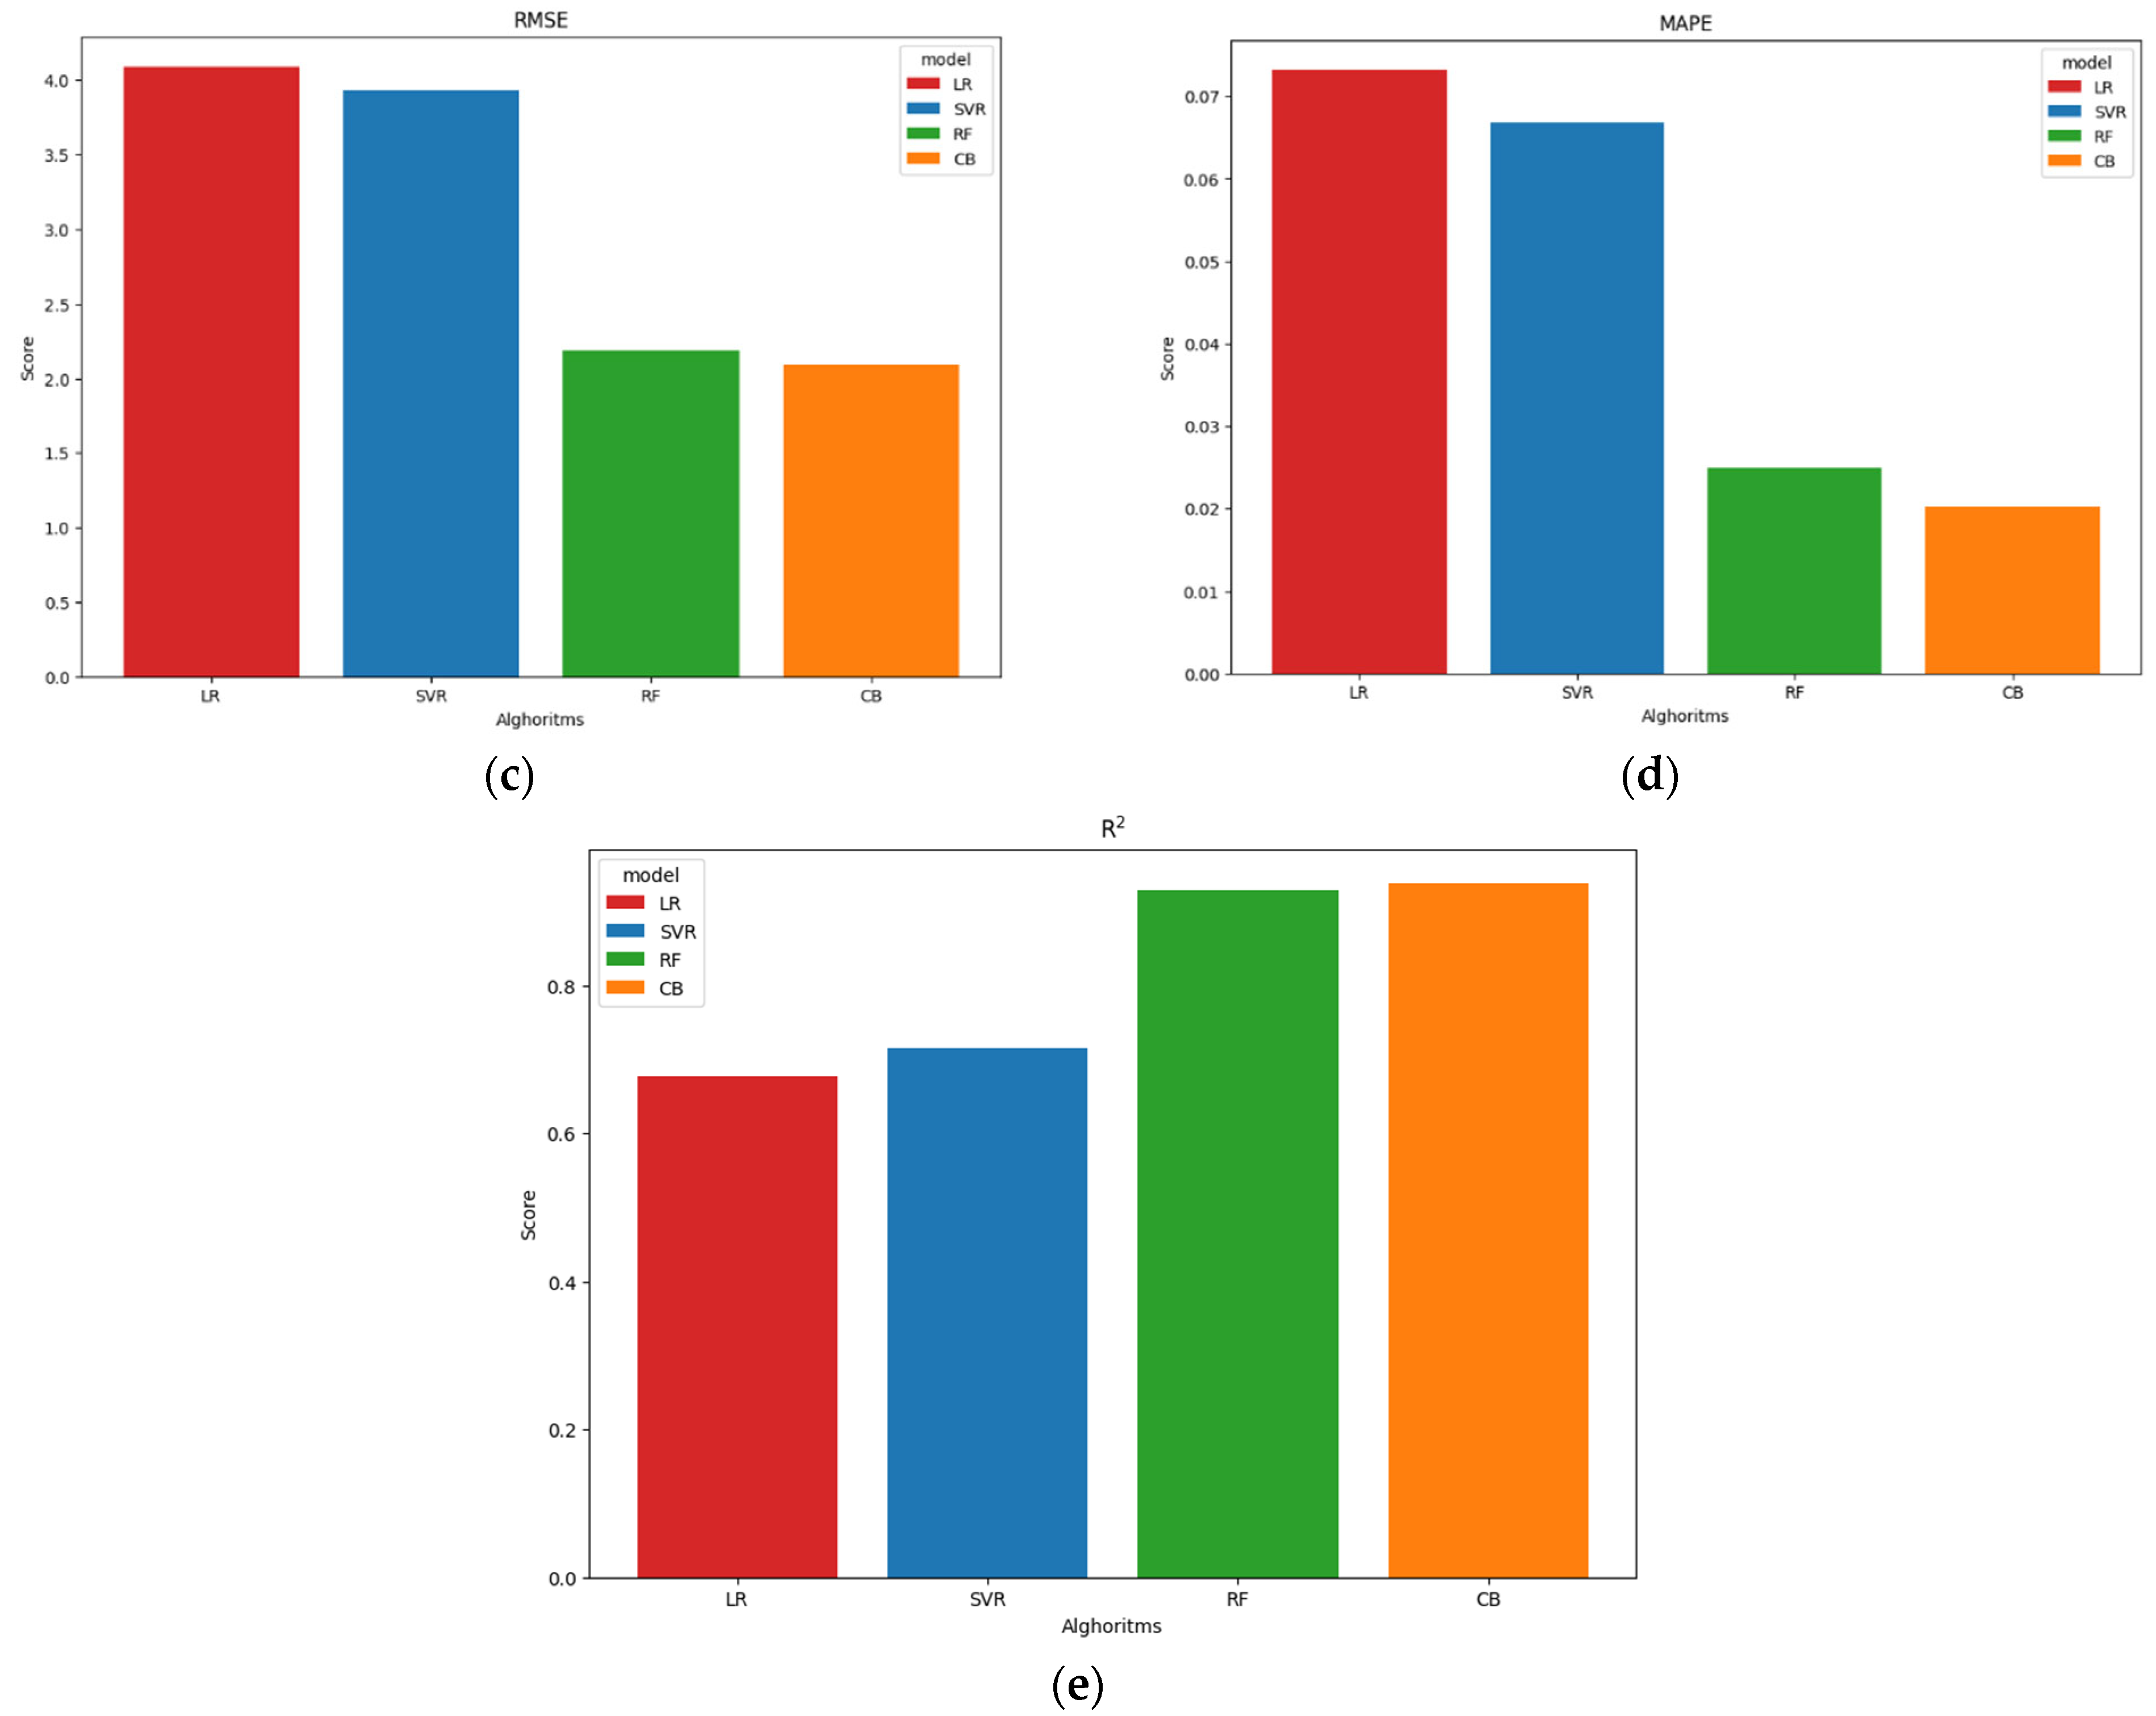
Table 6 displays the metrics chosen to assess the developed models. The visual representation of this table can be observed in Figure 12.
Table 6.
Metrics of the developed models on the test sample.
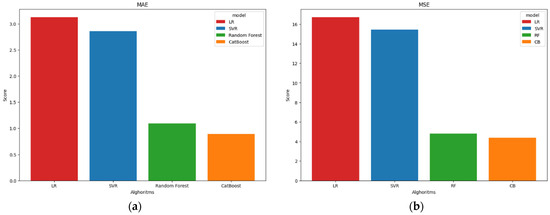

Figure 12.
Metric values for the developed models (a) MAE; (b) MSE; (c) RMSE; (d) MAPE; (e) R2.
The best values were demonstrated by the Random Forest and CatBoost models with a Mean Absolute Percentage Error of 2%, while for the LR and SVR regression models, this metric was 7%. The remaining metric values for CatBoost slightly exceeded the accuracy of Random Forest. It can be concluded that tree-like structures are most preferable for predicting the strength of vibrocentrifuged concrete when analyzing the impact of several freeze–thaw cycles, the content of chlorides and sulfates and the number of wetting-drying cycles.
The findings of this study revealed that the determination coefficient for several developed models is significantly high, ranging from 0.93 to 0.94. These values are consistent with those obtained in a previous study [17], which also examined tree structures.
The CB model turned out to be the best in terms of errors, exceeding the values presented in the study [55], but being inferior by 0.1 in the value of the coefficient of determination. The models are saved and can be used by other researchers in the future. New data enters the model as an array of numeric data. Predictions are made by walking through all the trees of the final CB model.
The MAE values range from 0.89 to 3.12, MSE from 4.37 to 16.71, RMSE from 2.09 to 4.09, which is in a good agreement with the results of previously studied by other authors [17,18,55]. The MAPE value (2–7%) on the test sample is acceptable, since such a model error is comparable to the technical documents.
Discussing the results obtained and comparing them with the results previously obtained by other authors, it should be noted that the chosen question is unconditionally novel. The fact is that predicting the properties of concrete was previously known and described in works [6,11,15,17,18,20,21,23,24,25,26,27,28,30,33,36,40,41,55]. The same study touches upon the topic of predicting the properties of special concretes, that is, variatropic concretes obtained using vibrocentrifuge technology. That is, the prediction of properties is carried out in relation to particularly complex structures with an improved type that has a difference in the thickness of the properties. In addition to the integral characteristics, general and averaged over the cross section of the element, there is also a differentiation of properties and characteristics. All this together affects the performance characteristics of the material. All the more important is the issue of automation and unification of the processes of predicting the properties of such concrete.
In this regard, artificial intelligence methods come to the fore. The proposed method and the proposed concept, in general, represent a new approach in the technology and life cycle management of vibrocentrifuged concrete. The introduction of artificial intelligence methods into more complex and advanced types of materials is a current trend, and this is where the significance of the research lies.
The proven significance of the conducted research and the analysis and discussion of the results obtained is justified by the high demand of production and construction organizations for new technologies for predicting the properties of various concretes. The stakeholders in this case are construction organizations, manufacturers of concrete and reinforced concrete products, large developers, and design organizations. These stakeholders, first of all, will advocate for the most high-quality and reliable prediction of the life cycle of reinforced concrete vibrocentrifuged structures. In the case of production organizations, we are talking about the reliability and high quality of the materials produced, namely vibrocentrifuged concrete. In the case of construction organizations, we are talking about more reliable and convenient construction and installation activities and unification of construction processes. In the case of design organizations, we are talking about the possibility of introducing higher safety and reliability factors when designing structures, as well as operating with a longer life cycle of structures made from variatropic vibrocentrifuged concrete with properties predicted by artificial intelligence methods.
When conducting research, obtaining results, and also taking into account the assessment of the feasibility of using the results in the practice of construction, design and, first of all, predicting the properties of vibrocentrifuged concrete, in conclusion several important aspects should be noted. Concrete itself is a heterogeneous compositional structure, consisting of various phases, various constituent components, differing in dispersion, size, characteristics and mechanics of destruction under various influences. Taking into account the accumulated experience and known mathematical dependencies, scientists and engineers have learned to predict the structure of simple concrete with a certain degree of success. At the same time, such complex concrete samples as variatropic vibrocentrifuged products or structures have much greater difficulty in predicting their properties. Predicting the properties and processes of structure formation of variatropic vibrocentrifuged structures is a complex scientific and engineering problem. The method proposed in this study allows achieving accuracy with a calculated error of the order of ±5 MPa. Taking into account the fact that variatropic vibrocentrifuged concrete and reinforced concrete structures, as a rule, have high strength and mechanical characteristics, one can note a fairly high accuracy and a low degree of deviation in the permissible range.
When moving beyond controlled laboratory conditions, problems may arise due to the emergence of new factors, conditions and dependencies that reduce the quality of ML-based predictive models. However, by monitoring data drift and concept drift, you can detect this moment and quickly respond to it. The advantage of machine learning algorithms in real construction projects is the ability to create predictive models based on real data with a high degree of accuracy. The integration of additional sensors will expand knowledge about the building material under study and increase the accuracy and stability of the model during further use.
Increasing computing power will make it possible to implement more complex AI models without slowing down the speed of calculations. Also, with the accumulation of large volumes of data in the future, it will be possible to use deeper and more complex neural networks, which will increase the accuracy and efficiency of predicting the strength of construction materials. By using a larger database with a wider range of experimental values, potentially reflecting a wider variety of environmental conditions and material compositions, we could make our models more stale, as well as applying more complex models such as deep neural networks.
The usefulness of the study is justified by the importance of the result obtained. The result obtained in the form of specific proposals for the implementation of artificial intelligence information technologies in construction practice shows and demonstrates a significant increase in the effectiveness of technological solutions for engineering workers. Society receives an advantage in the form of more unified and high-quality technologies in construction and the production of building materials, and the production sector itself receives a more automated, improved option for obtaining high-quality products and a significant reduction in the percentage of failures and defects.
4. Conclusions
The outcomes of the project encompass both theoretical and practical dimensions.
- (1)
- An empirical database has been compiled that includes information on the strength of vibrocentrifuged concrete, taking into account the influence of the number of freeze–thaw cycles, the content of chlorides and sulfates, and the number of wetting-drying cycles.
- (2)
- In order to enhance the model’s accuracy, Feature Engineering technology was utilized. This involved proposing and validating a hypothesis regarding the potential division of data into clusters. Additionally, a new feature was incorporated, containing details about membership in the corresponding cluster within the original dataset.
- (3)
- Implementation and comparison of four machine learning algorithms based on Linear Regression, Support Vector Regression, Random Forest, and CatBoost were carried out.
- (4)
- The CatBoost model showed the best results: MAE = 0.89, MSE = 4.37, RMSE = 2.09, MAPE = 2% and R2 = 0.94.
- (5)
- It has been determined that machine learning techniques exhibiting a MAPE value ranging from 2 to 7% on a test sample are deemed suitable for implementation. This level of model error is comparable to the standards set forth in normative documents for concrete. Feature engineering and feature selection technologies will help reduce the error. Additionally, also with an increase in the data set, it will be possible to use more complex models.
- (6)
- The developed models can be offered to civil engineers, specialists in the field of materials science and materials technology as an additional source of information for making informed decisions regarding the development of improved concrete mix compositions and construction methods. These models can also be used for other materials that are exposed to aggressive environments. When changing materials and wanting to take into account a diverse range of their properties, it is advisable to use the technology of data drift, concept drift and domain adaptation. These methods will allow you to take into account new connections in the data without losing quality.
- (7)
- The limitation is that we can have confidence in the results presented within the range reported in vitro. However, we believe that it reflects real-world conditions as closely as possible. The developed intelligent models can become part of a large-scale forecasting system. Continuation of the research is planned in the direction of increasing the number of data in order to track the impact of additional factors influencing the strength characteristics of vibrocentrifuged concrete, as well as testing other machine learning models for prediction.
Author Contributions
Conceptualization, I.R., S.A.S., E.M.S., A.N.B., A.K., N.B., A.C., A.P. and D.E.; methodology, A.K., N.B. and I.R.; software, A.P., N.B., I.R. and A.K.; validation, I.R., A.K., A.P., S.A.S., E.M.S. and A.N.B.; formal analysis, A.K., I.R. and A.C.; investigation, I.R., S.A.S., E.M.S., A.N.B., A.K., N.B., A.C., A.P. and D.E.; resources, B.M., I.R., S.A.S., L.R.M. and E.M.S.; data curation, S.A.S., E.M.S., A.K., N.B. and I.R.; writing—original draft preparation, I.R., S.A.S., E.M.S. and A.N.B.; writing—review and editing, I.R., S.A.S., E.M.S. and A.N.B.; visualization, I.R., S.A.S., E.M.S., A.N.B.; supervision, L.R.M. and B.M.; project administration, L.R.M. and B.M.; funding acquisition, A.N.B. and B.M. All authors have read and agreed to the published version of the manuscript.
Funding
The research was supported by the Russian Science Foundation grant No. 23-79-10289, https://rscf.ru/en/project/23-79-10289/ (accessed on 29 January 2024).
Institutional Review Board Statement
Not applicable.
Informed Consent Statement
Not applicable.
Data Availability Statement
The raw data supporting the conclusions of this article will be made available by the authors on request.
Acknowledgments
The authors would like to acknowledge the administration of Don State Technical University for their resources and financial support.
Conflicts of Interest
Author Alexey Kozhakin was employed by the company OOO VDK. The remaining authors declare that the research was conducted in the absence of any commercial or financial relationships that could be construed as a potential conflict of interest.
References
- Shufrin, I.; Pasternak, E.; Dyskin, A. Environmentally Friendly Smart Construction—Review of Recent Developments and Opportunities. Appl. Sci. 2023, 13, 12891. [Google Scholar] [CrossRef]
- Yang, G.; Yang, R.; Zhang, J. Prediction and Interpretation of Residual Bearing Capacity of Cfst Columns under Impact Loads Based Interpretable Stacking Fusion Modeling. Buildings 2023, 13, 2783. [Google Scholar] [CrossRef]
- Bazhenov, Y.M.; Murtazaev, S.A.Y.; Alaskhanov, A.H.; Saydumov, M.S.; Bataev, D.K.S.; Murtazaeva, T.S.A. High-strength concretes based on anthropogenic raw materials for earthquake resistant high-rise construction. Eng. Solid Mech. 2021, 9, 335–346. [Google Scholar] [CrossRef]
- Kliukas, R.; Lukoševičienė, O.; Jaras, A.; Jonaitis, B. The Mechanical Properties of Centrifuged Concrete in Reinforced Concrete Structures. Appl. Sci. 2020, 10, 3570. [Google Scholar] [CrossRef]
- Mailyan, L.R.; Stel’makh, S.A.; Shcherban’, E.M.; Khalyushev, A.K.; Smolyanichenko, A.S.; Sysoev, A.K.; Parinov, I.A.; Cherpakov, A.V. Investigation of Integral and Differential Characteristics of Variatropic Structure Heavy Concretes by Ultrasonic Methods. Appl. Sci. 2021, 11, 3591. [Google Scholar] [CrossRef]
- Abbas, Y.M.; Khan, M.I. Robust Machine Learning Framework for Modeling the Compressive Strength of SFRC: Database Compilation, Predictive Analysis, and Empirical Verification. Materials 2023, 16, 7178. [Google Scholar] [CrossRef] [PubMed]
- Leonovich, S.N.; Shalyi, E.E.; Kim, L.V. Reinforced Concrete under the Action of Carbonization and Chloride Aggression: A Probabilistic Model for Service Life Prediction. Sci. Tech. 2019, 18, 284–291. [Google Scholar] [CrossRef]
- Shcherban’, E.M.; Stel’makh, S.A.; Beskopylny, A.N.; Mailyan, L.R.; Meskhi, B.; Elshaeva, D.; Chernil’nik, A. Physical and Mechanical Characteristics of Variotropic Concrete during Cyclic and Continuous Sulfate Attack. Appl. Sci. 2023, 13, 4386. [Google Scholar] [CrossRef]
- Shcherban’, E.M.; Stel’makh, S.A.; Beskopylny, A.N.; Mailyan, L.R.; Meskhi, B.; Varavka, V.; Chernil’nik, A.; Elshaeva, D.; Ananova, O. The Influence of Recipe-Technological Factors on the Resistance to Chloride Attack of Variotropic and Conventional Concrete. Infrastructures 2023, 8, 108. [Google Scholar] [CrossRef]
- Beskopylny, A.N.; Shcherban, E.M.; Stel’makh, S.A.; Mailyan, L.R.; Meskhi, B.; Chernil’nik, A.; El’shaeva, D. Influence of Variatropy on the Evaluation of Strength Properties and Structure Formation of Concrete under Freeze-Thaw Cycles. J. Compos. Sci. 2023, 7, 58. [Google Scholar] [CrossRef]
- Kovačević, M.; Hadzima-Nyarko, M.; Grubeša, I.N.; Radu, D.; Lozančić, S. Application of Artificial Intelligence Methods for Predicting the Compressive Strength of Green Concretes with Rice Husk Ash. Mathematics 2024, 12, 66. [Google Scholar] [CrossRef]
- Qin, X.; Kaewunruen, S. Eco-Friendly Design and Sustainability Assessments of Fibre-Reinforced High-Strength Concrete Structures Automated by Data-Driven Machine Learning Models. Sustainability 2023, 15, 6640. [Google Scholar] [CrossRef]
- Nizina, T.A.; Nizin, D.R.; Selyaev, V.P.; Spirin, I.P.; Stankevich, A.S. Big data in predicting the climatic resistance of building materials. I. Air temperature and humidity. Constr. Mater. Prod. 2023, 6, 18–30. [Google Scholar]
- Abramyan, S.G.; Klyuev, S.V.; Polyakov, V.G.; Sabitova, T.A.; Akopyan, G.O.; Guseynov, K.M. Specifics of information model development for functional conversion of offshore oil platforms. Constr. Mater. Prod. 2023, 6, 42–57. [Google Scholar] [CrossRef]
- Farooq, F.; Nasir Amin, M.; Khan, K.; Rehan Sadiq, M.; Faisal Javed, M.; Aslam, F.; Alyousef, R. A Comparative Study of Random Forest and Genetic Engineering Programming for the Prediction of Compressive Strength of High Strength Concrete (HSC). Appl. Sci. 2020, 10, 7330. [Google Scholar] [CrossRef]
- Stel’makh, S.A.; Shcherban’, E.M.; Beskopylny, A.N.; Mailyan, L.R.; Meskhi, B.; Razveeva, I.; Kozhakin, A.; Beskopylny, N. Prediction of Mechanical Properties of Highly Functional Lightweight Fiber-Reinforced Concrete Based on Deep Neural Network and Ensemble Regression Trees Methods. Materials 2022, 15, 6740. [Google Scholar] [CrossRef]
- Khodaparasti, M.; Alijamaat, A.; Pouraminian, M. Prediction of the concrete compressive strength using improved random forest algorithm. J. Build. Rehabil. 2023, 8, 92. [Google Scholar] [CrossRef]
- Thi Mai, H.-V.; Nguyen, T.-A.; Ly, H.-B.; Tran, V.Q. Prediction Compressive Strength of Concrete Containing GGBFS using Random Forest Model. Adv. Civ. Eng. 2021, 2021, 6671448. [Google Scholar] [CrossRef]
- Hasanzadeh, A.; Vatin, N.I.; Hematibahar, M.; Kharun, M.; Shooshpasha, I. Prediction of the Mechanical Properties of Basalt Fiber Reinforced High-Performance Concrete Using Machine Learning Techniques. Materials 2022, 15, 7165. [Google Scholar] [CrossRef]
- Tang, F.; Wu, Y.; Zhou, Y. Hybridizing Grid Search and Support Vector Regression to Predict the Compressive Strength of Fly Ash Concrete. Adv. Civ. Eng. 2022, 2022, 3601914. [Google Scholar] [CrossRef]
- Ding, B.; Wang, Q.; Ma, Y.; Shi, H. Prediction of compressive strength of concrete for high-performance concrete using two combined models, SVR-AVOA and SVR-SSA. Multiscale Multidiscip. Model. Exp. Des. 2023, 23, 00226. [Google Scholar] [CrossRef]
- Rajczakowska, M.; Szeląg, M.; Habermehl-Cwirzen, K.; Hedlund, H.; Cwirzen, A. Interpretable Machine Learning for Prediction of Post-Fire Self-Healing of Concrete. Materials 2023, 16, 1273. [Google Scholar] [CrossRef] [PubMed]
- Jiang, Y.; Li, H.; Zhou, Y. Compressive Strength Prediction of Fly Ash Concrete Using Machine Learning Techniques. Buildings 2022, 12, 690. [Google Scholar] [CrossRef]
- Sai, G.; Singh, V. Prediction of Compressive Strength Using Support Vector Regression. Mendel 2019, 25, 51–56. [Google Scholar] [CrossRef]
- Lin, C.-J.; Wu, N.-J. An ANN Model for Predicting the Compressive Strength of Concrete. Appl. Sci. 2021, 11, 3798. [Google Scholar] [CrossRef]
- Chopra, P.; Sharma, R.K.; Kumar, M. Artificial Neural Networks for the Prediction of Compressive Strength of Concrete. Int. J. Appl. Sci. Eng. 2015, 13, 187–204. [Google Scholar] [CrossRef]
- Chopra, P.; Sharma, R.K.; Kumar, M. Prediction of Compressive Strength of Concrete Using Artificial Neural Network and Genetic Programming. Adv. Mater. Sci. Eng. 2016, 2016, 7648467. [Google Scholar] [CrossRef]
- Almeida, T.A.d.C.; Felix, E.F.; de Sousa, C.M.A.; Pedroso, G.O.M.; Motta, M.F.B.; Prado, L.P. Influence of the ANN Hyperparameters on the Forecast Accuracy of RAC’s Compressive Strength. Materials 2023, 16, 7683. [Google Scholar] [CrossRef]
- Ahmad, M.M.; Elahi, A.; Barbhuiya, S. Comparative Analysis of Reinforced Concrete Beam Behaviour: Conventional Model vs. Artificial Neural Network Predictions. Materials 2023, 16, 7642. [Google Scholar] [CrossRef]
- Beskopylny, A.N.; Stel’makh, S.A.; Shcherban’, E.M.; Mailyan, L.R.; Meskhi, B.; Razveeva, I.; Chernil’nik, A.; Beskopylny, N. Concrete Strength Prediction Using Machine Learning Methods CatBoost, k-Nearest Neighbors, Support Vector Regression. Appl. Sci. 2022, 12, 10864. [Google Scholar] [CrossRef]
- Tran, V.-L.; Lee, T.-H.; Nguyen, D.-D.; Nguyen, T.-H.; Vu, Q.-V.; Phan, H.-T. Failure Mode Identification and Shear Strength Prediction of Rectangular Hollow RC Columns Using Novel Hybrid Machine Learning Models. Buildings 2023, 13, 2914. [Google Scholar] [CrossRef]
- Taheri, E.; Mehrabi, P.; Rafiei, S.; Samali, B. Numerical Evaluation of the Upright Columns with Partial Reinforcement along with the Utilisation of Neural Networks with Combining Feature-Selection Method to Predict the Load and Displacement. Appl. Sci. 2021, 11, 11056. [Google Scholar] [CrossRef]
- Yang, Y.; Liu, G.; Zhang, H.; Zhang, Y.; Yang, X. Predicting the Compressive Strength of Environmentally Friendly Concrete Using Multiple Machine Learning Algorithms. Buildings 2024, 14, 190. [Google Scholar] [CrossRef]
- Khan, S.; Ali Khan, M.; Zafar, A.; Javed, M.F.; Aslam, F.; Musarat, M.A.; Vatin, N.I. Predicting the Ultimate Axial Capacity of Uniaxially Loaded CFST Columns Using Multiphysics Artificial Intelligence. Materials 2022, 15, 39. [Google Scholar] [CrossRef] [PubMed]
- Atasham ul haq, M.; Xu, W.; Abid, M.; Gong, F. Prediction of Progressive Frost Damage Development of Concrete Using Machine-Learning Algorithms. Buildings 2023, 13, 2451. [Google Scholar] [CrossRef]
- Ismael Jaf, D.K. Soft Computing and Machine Learning-Based Models to Predict the Slump and Compressive Strength of Self-Compacted Concrete Modified with Fly Ash. Sustainability 2023, 15, 11554. [Google Scholar] [CrossRef]
- Shao, S.; Wang, R.; Gong, A.; Li, R.; Xu, J.; Wang, F.; Liu, F. Study and Neural Network Analysis on Durability of Basalt Fibre Concrete. Water 2023, 15, 1016. [Google Scholar] [CrossRef]
- Adamu, M.; Çolak, A.B.; Ibrahim, Y.E.; Haruna, S.I.; Hamza, M.F. Prediction of Mechanical Properties of Rubberized Concrete Incorporating Fly Ash and Nano Silica by Artificial Neural Network Technique. Axioms 2023, 12, 81. [Google Scholar] [CrossRef]
- Mhaya, A.M.; Shahidan, S.; Algaifi, H.A.; Zuki, S.S.M.; Benjeddou, O.; Ibrahim, M.H.W.; Huseien, G.F. Thermal Conductivity of Coconut Shell-Incorporated Concrete: A Systematic Assessment via Theory and Experiment. Sustainability 2022, 14, 16167. [Google Scholar] [CrossRef]
- Shah, H.A.; Yuan, Q.; Akmal, U.; Shah, S.A.; Salmi, A.; Awad, Y.A.; Shah, L.A.; Iftikhar, Y.; Javed, M.H.; Khan, M.I. Application of Machine Learning Techniques for Predicting Compressive, Splitting Tensile, and Flexural Strengths of Concrete with Metakaolin. Materials 2022, 15, 5435. [Google Scholar] [CrossRef]
- de-Prado-Gil, J.; Zaid, O.; Palencia, C.; Martínez-García, R. Prediction of Splitting Tensile Strength of Self-Compacting Recycled Aggregate Concrete Using Novel Deep Learning Methods. Mathematics 2022, 10, 2245. [Google Scholar] [CrossRef]
- Beskopylny, A.N.; Stel’makh, S.A.; Shcherban’, E.M.; Mailyan, L.R.; Meskhi, B.; Chernil’nik, A.; El’shaeva, D.; Pogrebnyak, A. Influence of Variotropy on the Change in Concrete Strength under the Impact of Wet–Dry Cycles. Appl. Sci. 2023, 13, 1745. [Google Scholar] [CrossRef]
- Korolev, E.V.; Bazhenov, Y.M.; Smirnov, V.A. Building Materials of Varitropic Frame Structure; National Research Moscow State University of Civil Engineering: Moscow, Russia, 2011; 304p. [Google Scholar]
- SP 28.13330.2017 Protection Against Corrosion of Construction. Available online: https://docs.cntd.ru/document/456069587 (accessed on 4 January 2024).
- Zhang, K.; Guo, A.; Yu, Y.; Yang, B.; Yu, B.; Xie, C. Freeze–Thaw Damage Degradation Model and Life Prediction of Air-Entrained Concrete in Multi-Year Permafrost Zone. Materials 2023, 16, 7703. [Google Scholar] [CrossRef] [PubMed]
- Yuan, X.; Dai, M.; Li, M.; Liu, F. Study of the Freeze–Thaw Resistance for Composite Fiber Recycled Concrete with Sulphate Attack Exposure. Buildings 2023, 13, 1037. [Google Scholar] [CrossRef]
- Casanova, L.; Ceriani, F.; Messinese, E.; Paterlini, L.; Beretta, S.; Bolzoni, F.M.; Brenna, A.; Diamanti, M.V.; Ormellese, M.; Pedeferri, M. Recent Advances in the Use of Green Corrosion Inhibitors to Prevent Chloride-Induced Corrosion in Reinforced Concrete. Materials 2023, 16, 7462. [Google Scholar] [CrossRef]
- El Inaty, F.; Marchetti, M.; Quiertant, M.; Omikrine Metalssi, O. Chemical Mechanisms Involved in the Coupled Attack of Sulfate and Chloride Ions on Low-Carbon Cementitious Materials: An In-Depth Study. Appl. Sci. 2023, 13, 11729. [Google Scholar] [CrossRef]
- Liu, J.; Zang, S.; Yang, F.; Zhang, M.; Li, A. Fracture Mechanical Properties of Steel Fiber Reinforced Self-Compacting Concrete under Dry–Wet Cycle Sulfate Attack. Buildings 2022, 12, 1623. [Google Scholar] [CrossRef]
- Baak, M.; Koopman, R.; Snoek, H.; Klous, S. A new correlation coefficient between categorical, ordinal and interval variables with Pearson characteristics. arXiv 2019, arXiv:1811.11440v2. [Google Scholar] [CrossRef]
- van der Maaten, L.; Hinton, G. Visualizing High-Dimensional Data Using t-SNE. J. Mach. Learn. Res. 2008, 9, 2579–2605. [Google Scholar]
- Akiba, T.; Sano, S.; Yanase, T.; Ohta, T.; Koyama, M. Optuna: A Next-generation Hyperparameter Optimization Framework. arXiv 2019, arXiv:1907.10902v1. [Google Scholar]
- Watanabe, S. Tree-Structured Parzen Estimator: Understanding Its Algorithm Components and Their Roles for Better Empirical Performance. arXiv 2023, arXiv:2304.11127v3. [Google Scholar]
- Smola, A.J.; Schölkopf, B. A tutorial on support vector regression. Stat. Comput. 2004, 14, 199–222. [Google Scholar] [CrossRef]
- Rathakrishnan, V.; Bt Beddu, S.; Ahmed, A.N. Predicting compressive strength of high-performance concrete with high volume ground granulated blast-furnace slag replacement using boosting machine learning algorithms. Sci. Rep. 2022, 12, 9539. [Google Scholar] [CrossRef] [PubMed]


Disclaimer/Publisher’s Note: The statements, opinions and data contained in all publications are solely those of the individual author(s) and contributor(s) and not of MDPI and/or the editor(s). MDPI and/or the editor(s) disclaim responsibility for any injury to people or property resulting from any ideas, methods, instructions or products referred to in the content. |
© 2024 by the authors. Licensee MDPI, Basel, Switzerland. This article is an open access article distributed under the terms and conditions of the Creative Commons Attribution (CC BY) license (https://creativecommons.org/licenses/by/4.0/).