4.1. Analysis of Coupling Coordination Level Between Urban Human Settlement Environment and Economic Development
- (1)
Evaluation results of the coupling degree and coordination degree of the urban human settlement environment and economic development
Based on the panel data of 31 provinces and cities from 2011 to 2021, the coupling degree and coupling coordination degree of the two systems are obtained by Formulas (1)–(10). The coupling degree calculation results are shown in
Table 6.
It can be seen that the coupling degree between urban human settlements and economic development in China is at a relatively high level. Among them, Beijing, Tianjin, Shanghai, Jiangsu, Zhejiang, Fujian, Shandong, and Guangdong provinces have a strong interaction relationship between urban human settlements and economic development, and the coupling score of the two systems has been maintained at a high value of 0.9, and the coupling value reaches 1 in some years, achieving an orderly state. The coupling degree evaluation scores of Shanxi, Inner Mongolia, Liaoning, Heilongjiang, Anhui, Henan, Hubei, Hunan, Chongqing, Sichuan, Guizhou, Yunnan, Tibet, Shaanxi, and Xinjiang in the past 11 years are all greater than 0.8. The coupling development of urban human settlements and economic development in these regions is at a high level, and the system is closely linked. In most other provinces and cities, the coupling level between the urban human settlement environment and economic development is maintained above 0.7. Eight provinces, Hebei, Guangxi, Hainan, Jilin, Gansu, Qinghai, Ningxia, and Jiangxi, had coupling values lower than 0.8 in 2011. With the continuous improvement of system interaction, their coupling values were all higher than 0.8 by the end of the study, entering the stage of high-level coupling and gradually showing high-quality interaction between the two systems.
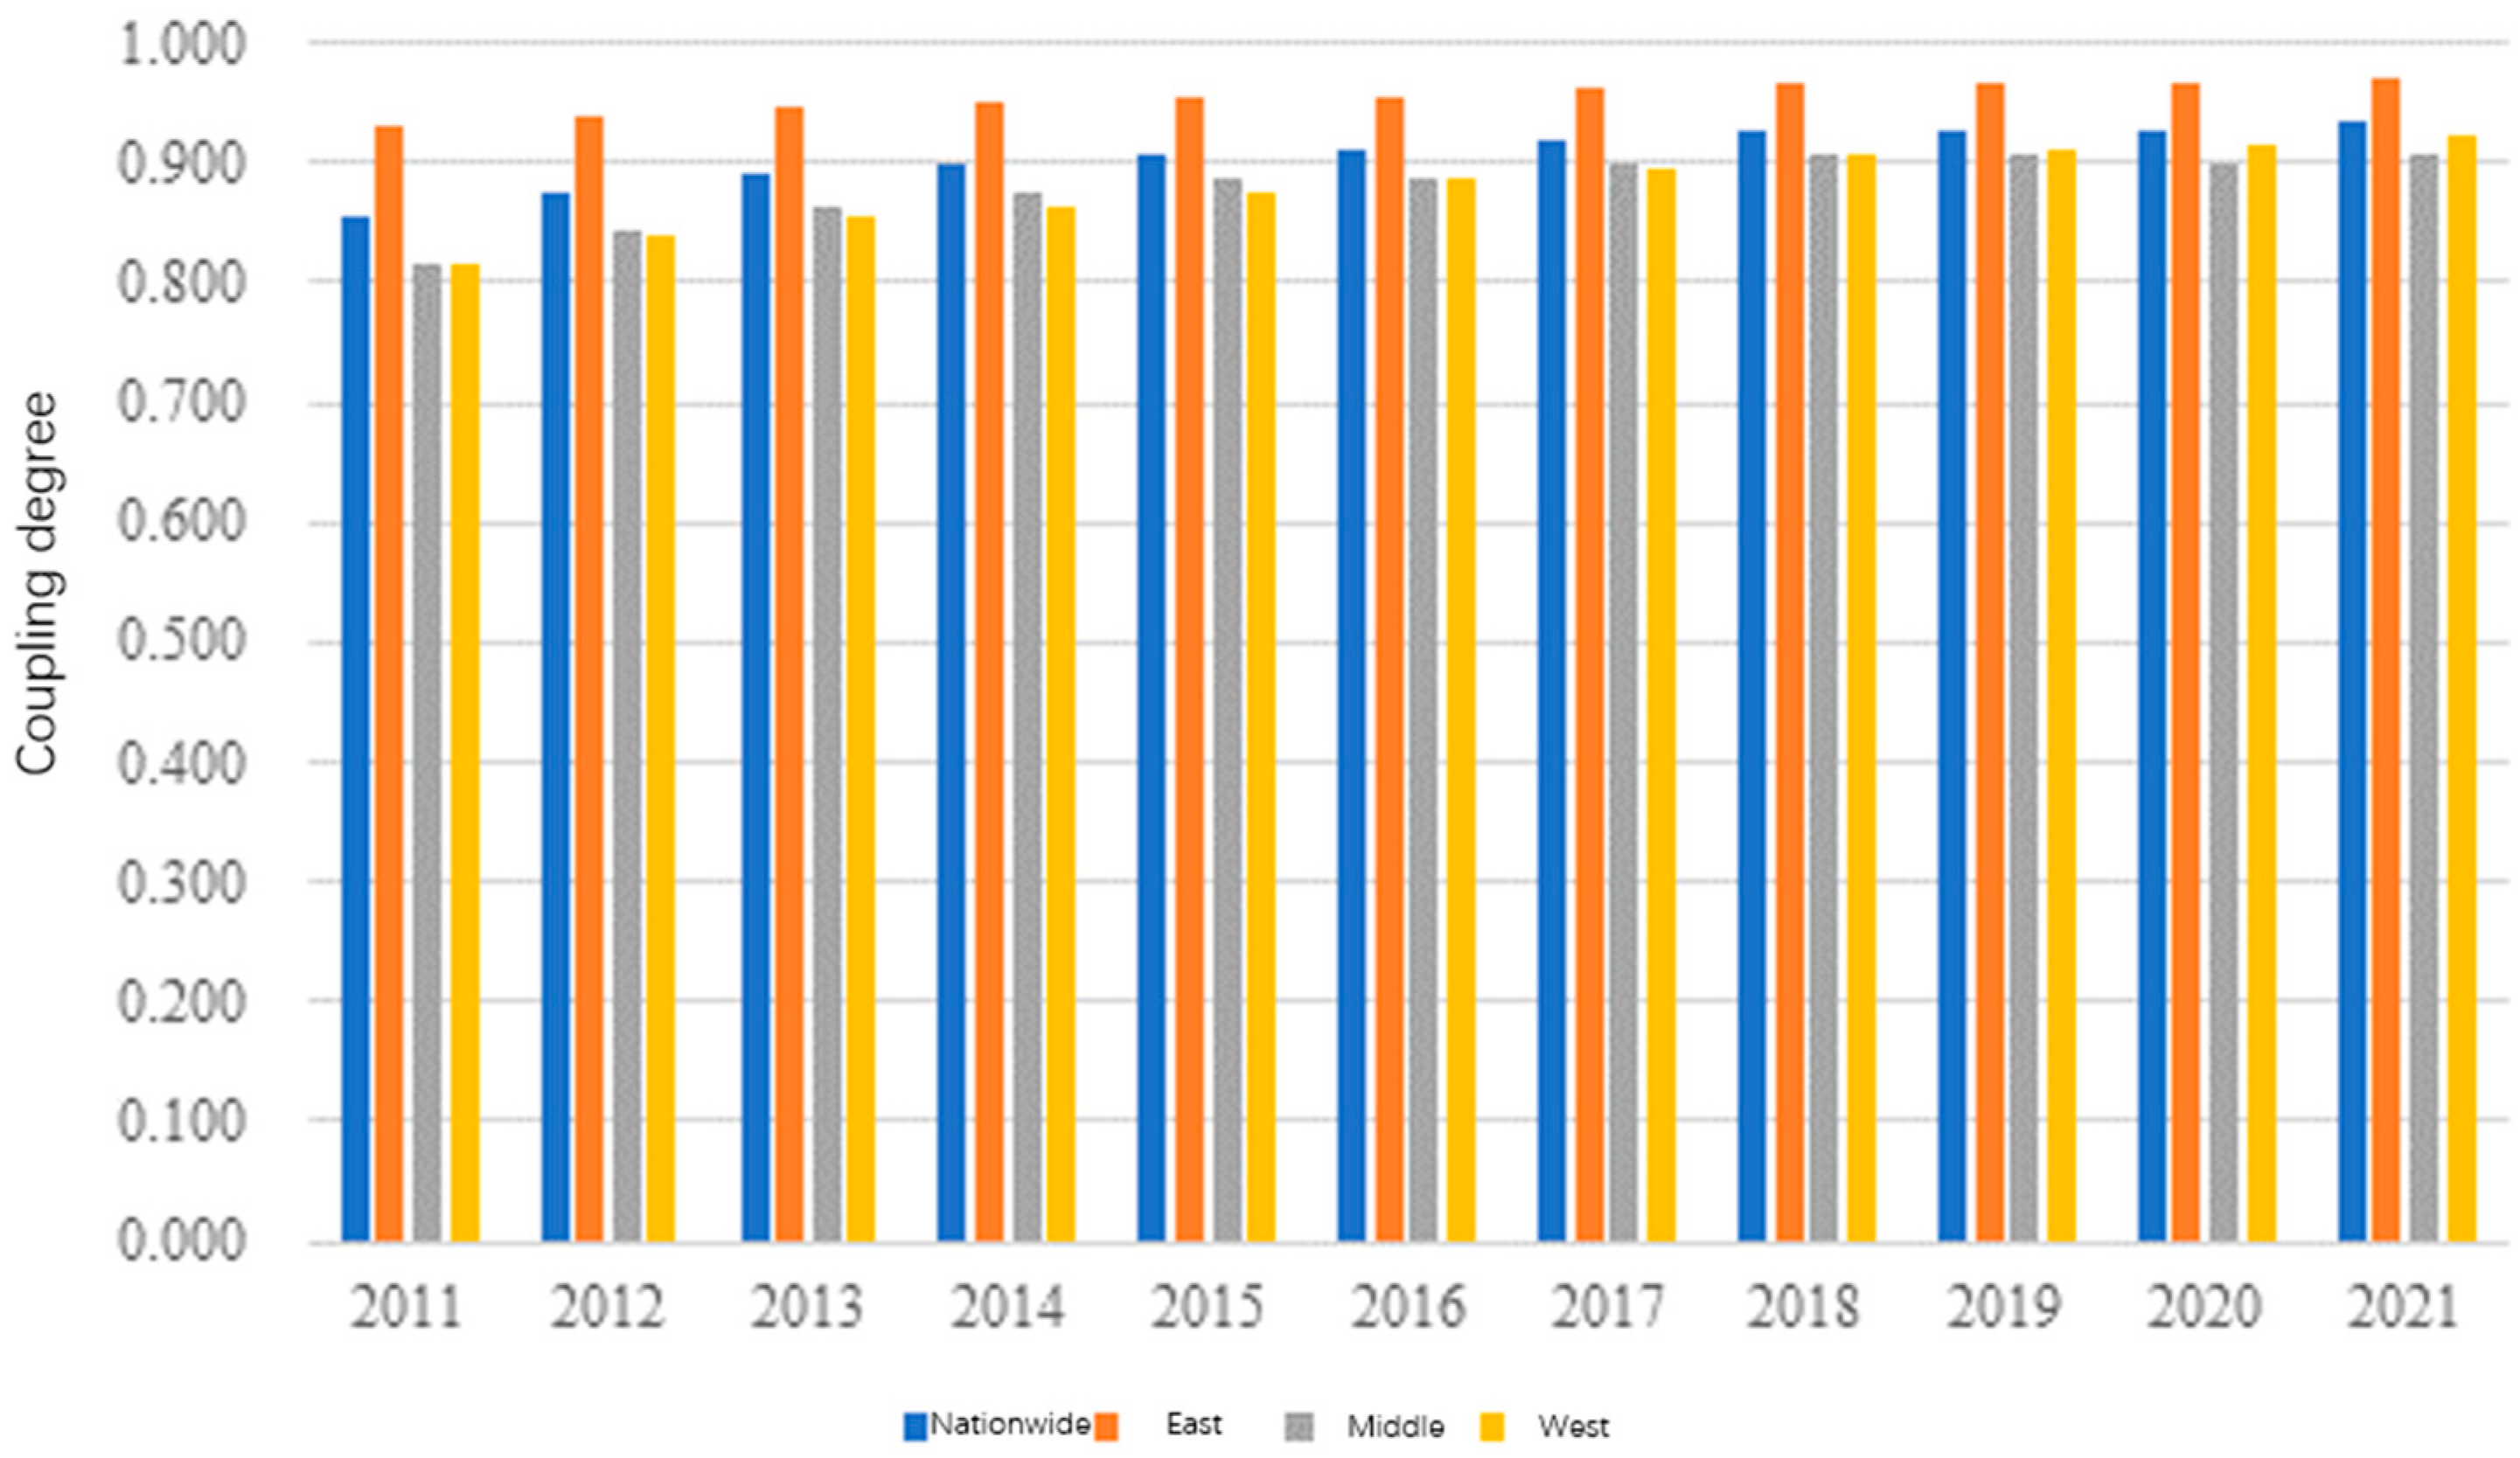
The country is further divided into three regions: eastern, central, and western regions for comparison, and the average coupling degree between urban human settlements and economic development systems of each province in the region is taken, respectively, to measure the coupling level of the two systems in each region, as shown in
Figure 3.
On the whole, the coupling degree of each region showed a trend of fluctuating growth, and gradually advanced from the benign development of the system to the deep interaction, with a high degree of order. Among them, the coupling state of the eastern, central, and western regions and the national urban human settlement environment and economic development system will reach the highest level in 2021. The eastern region is the region with the most active economic capital and the most abundant resources, and the coupling development degree of the two systems leads the country, but with the migration of time, the advantage gap between the eastern region and the central region, the western region and the country first expands and then narrates. The coupling rate of the two systems in the western region is relatively large, from slightly lagging behind the three regions and the national average level in the early stage of the study to exceeding the central region in the later stage, the system coupling state is good, and the gap with the national average level is becoming smaller and smaller.
The coupling degree can only reflect the degree of correlation between the system and the strength of the function, and more reflects the interaction between the two. Therefore, it is necessary to further analyze the level of coupling coordination degree to explore the coordinated development of China’s inter-regional human settlements environment and economy. The score results of coupling coordination degree are shown in
Table 7.
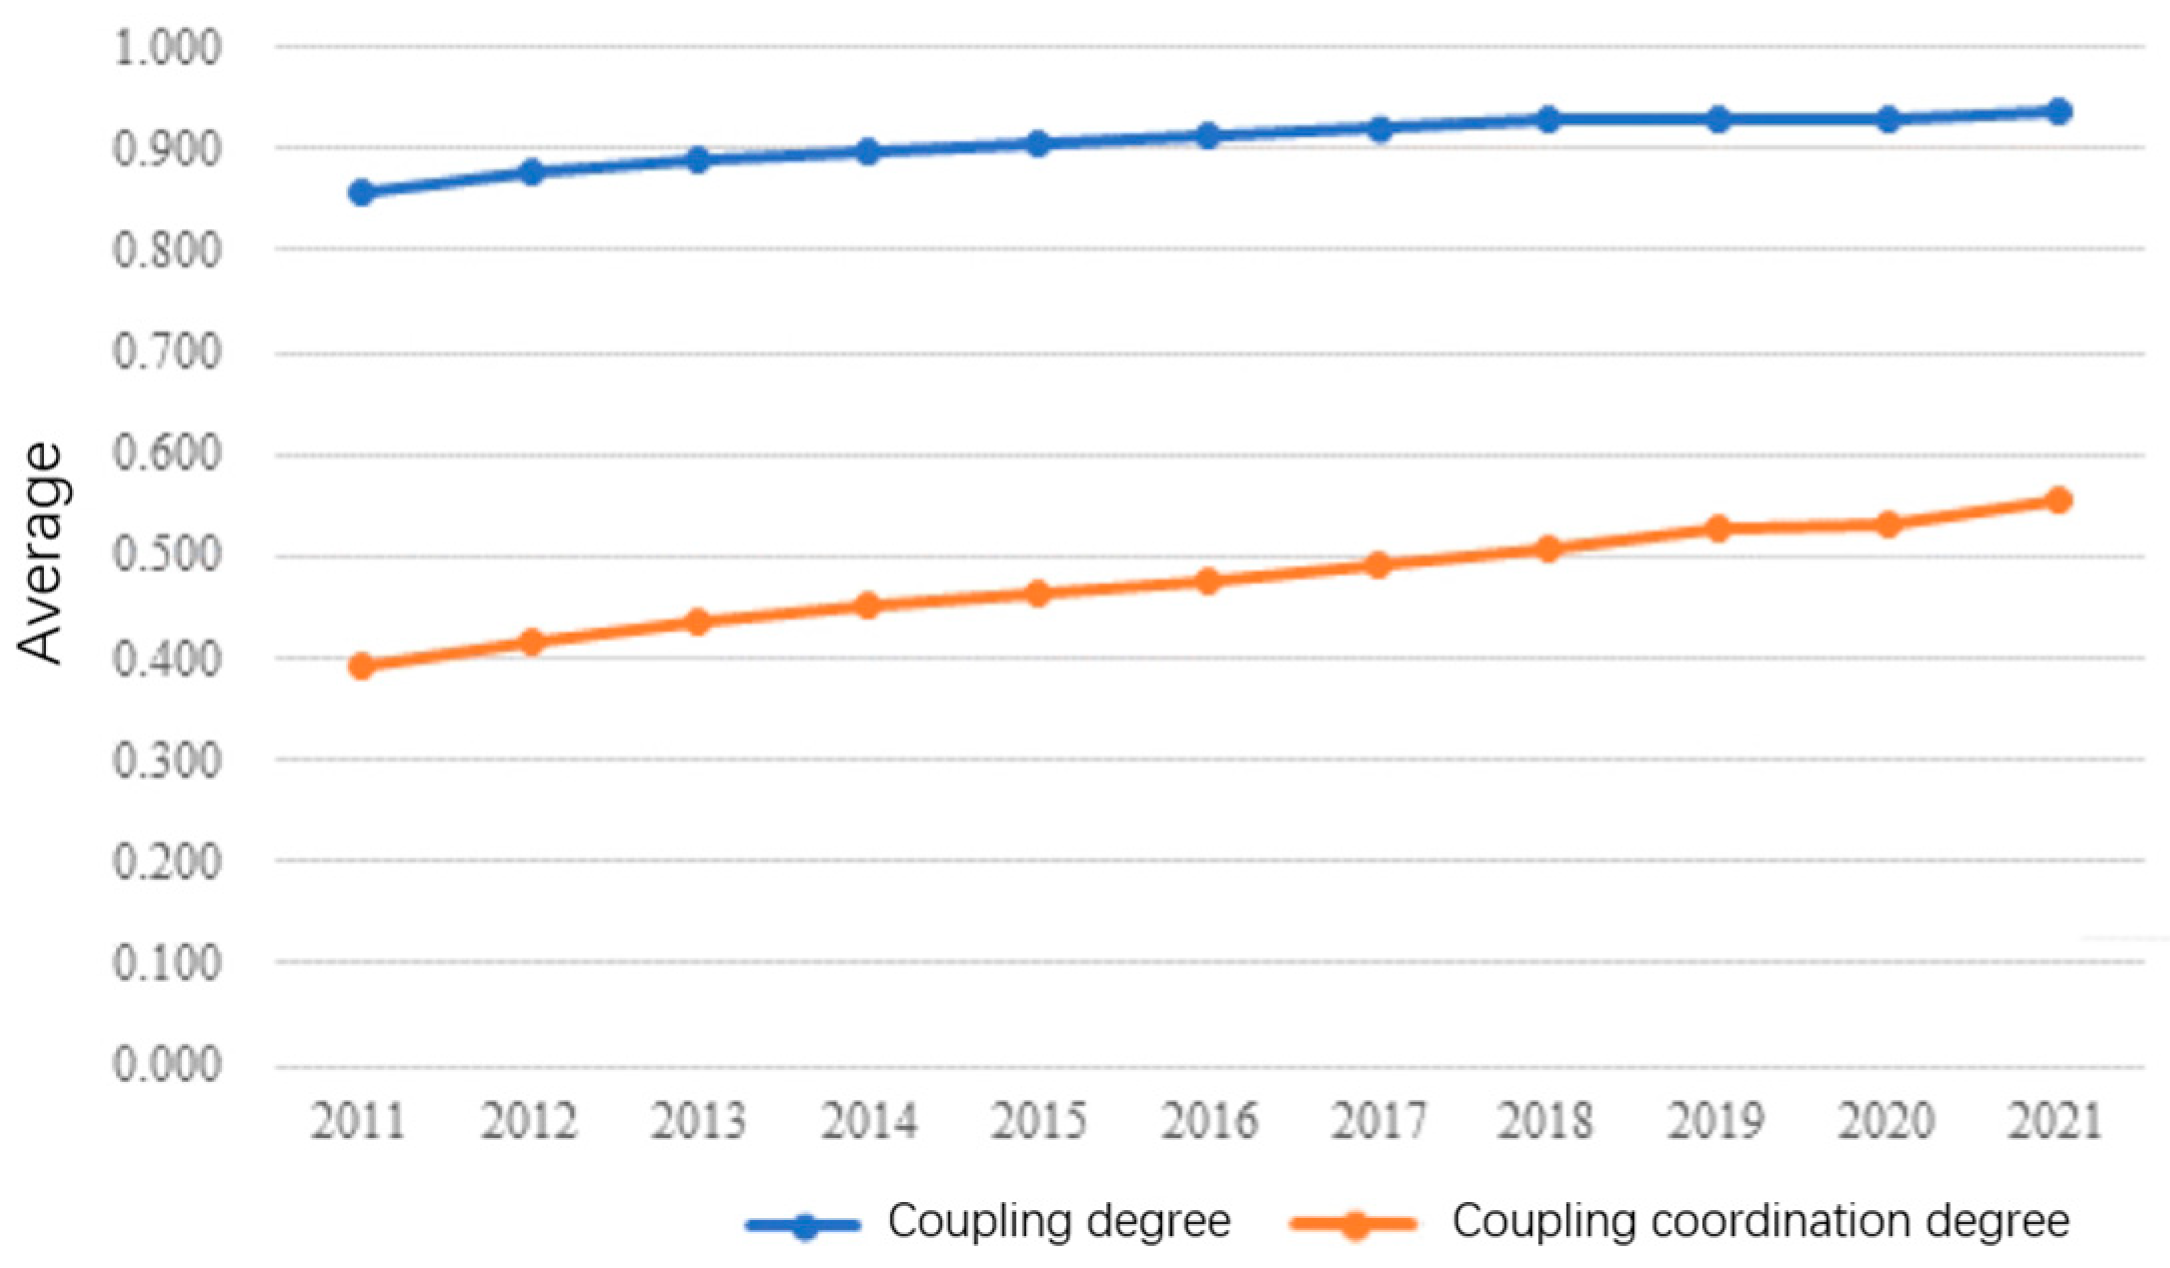
On the whole, the degree of coupling coordination between the urban human settlement environment and economic development is far lower than the degree of coupling between them. It shows that although the interaction between the urban human settlement environment and economic development is relatively close, the coordinated development of the two systems is not good. In order to more intuitively compare the trend and gap of the coupling degree and coordination degree of the two systems in the country, as shown in
Figure 4. The figure shows that the coordination degree between the urban human settlement environment and economic development increases evenly from 2011 to 2021, and the difference between the coupling degree and the coupling degree decreases slightly. However, the mean value of the coupling coordination degree between the two systems in China in 2021 is still below 0.6, and the overall state is still barely coordinated according to the divided coupling coordination level.
- (2)
Analysis of time-series changes in the coupling coordination level between urban human settlement environment and economic development
(1). The sequential changes in the coupling and coordination between urban human settlements and economic development in various provinces and cities.
Table 7 shows that from 2011 to 2021, the coupling coordination level of the urban human settlement environment and economic development in various provinces and cities in China has increased steadily, but the growth rate is different. The range of coupling coordination degree decreased from 0.396 in 2011 to 0.351 in 2021, narrowing the regional gap. Anhui had a low initial value but the fastest growth rate, rising from 19 to 13, driven significantly by the economy. Gansu has been regressing for a long time, mainly due to the low development level of the urban human settlement environment. Beijing took the lead at the beginning and was overtaken by Shanghai later, but the coupling coordination value from 2011 to 2019 still ranked first.
According to the classification standard of the coupling coordination, in 2011, 21 provinces in China were moderately disordered, 6 provinces were barely coordinated, and 3 provinces were well coordinated. By 2021, the proportion of well-coordinated provinces will rise to 25.8%, there will be no moderately dysfunctional provinces, 21 provinces had coupling coordination degrees greater than 0.4, and the remaining provinces were barely coordinated. Gansu from the moderate imbalance to the edge of barely coordinated, Liaoning has always been barely coordinated. By 2021, 19 provinces will be barely coordinated and 8 provinces will be well coordinated.
Figure 5 shows that the average coupling degree and coordination degree of all provinces and cities from 2011 to 2021 are similar, and they are in a barely coordinated state. The coordinated development of Beijing, Shanghai and Guangdong is leading, followed by Zhejiang and Jiangsu, and the imbalance is moderate in Hebei, Jiangxi, Guizhou, Tibet, and Gansu. In general, from 2011 to 2021, the coupling degree and coordination degree of provinces and cities are similar, with an average of 0.4–0.6, barely coordinated. The coordination degree of Beijing, Shanghai, and Guangdong took the lead, with an average value greater than 0.7, indicating good coordination. Zhejiang and Jiangsu followed, with an average value greater than 0.6. The mean value of Heilongjiang, Jiangxi, Guizhou, Tibet, and Gansu was greater than 0.4, with moderate imbalance.
(2). The sequential change in the coupling coordination between the overall urban human settlement environment and economic development (
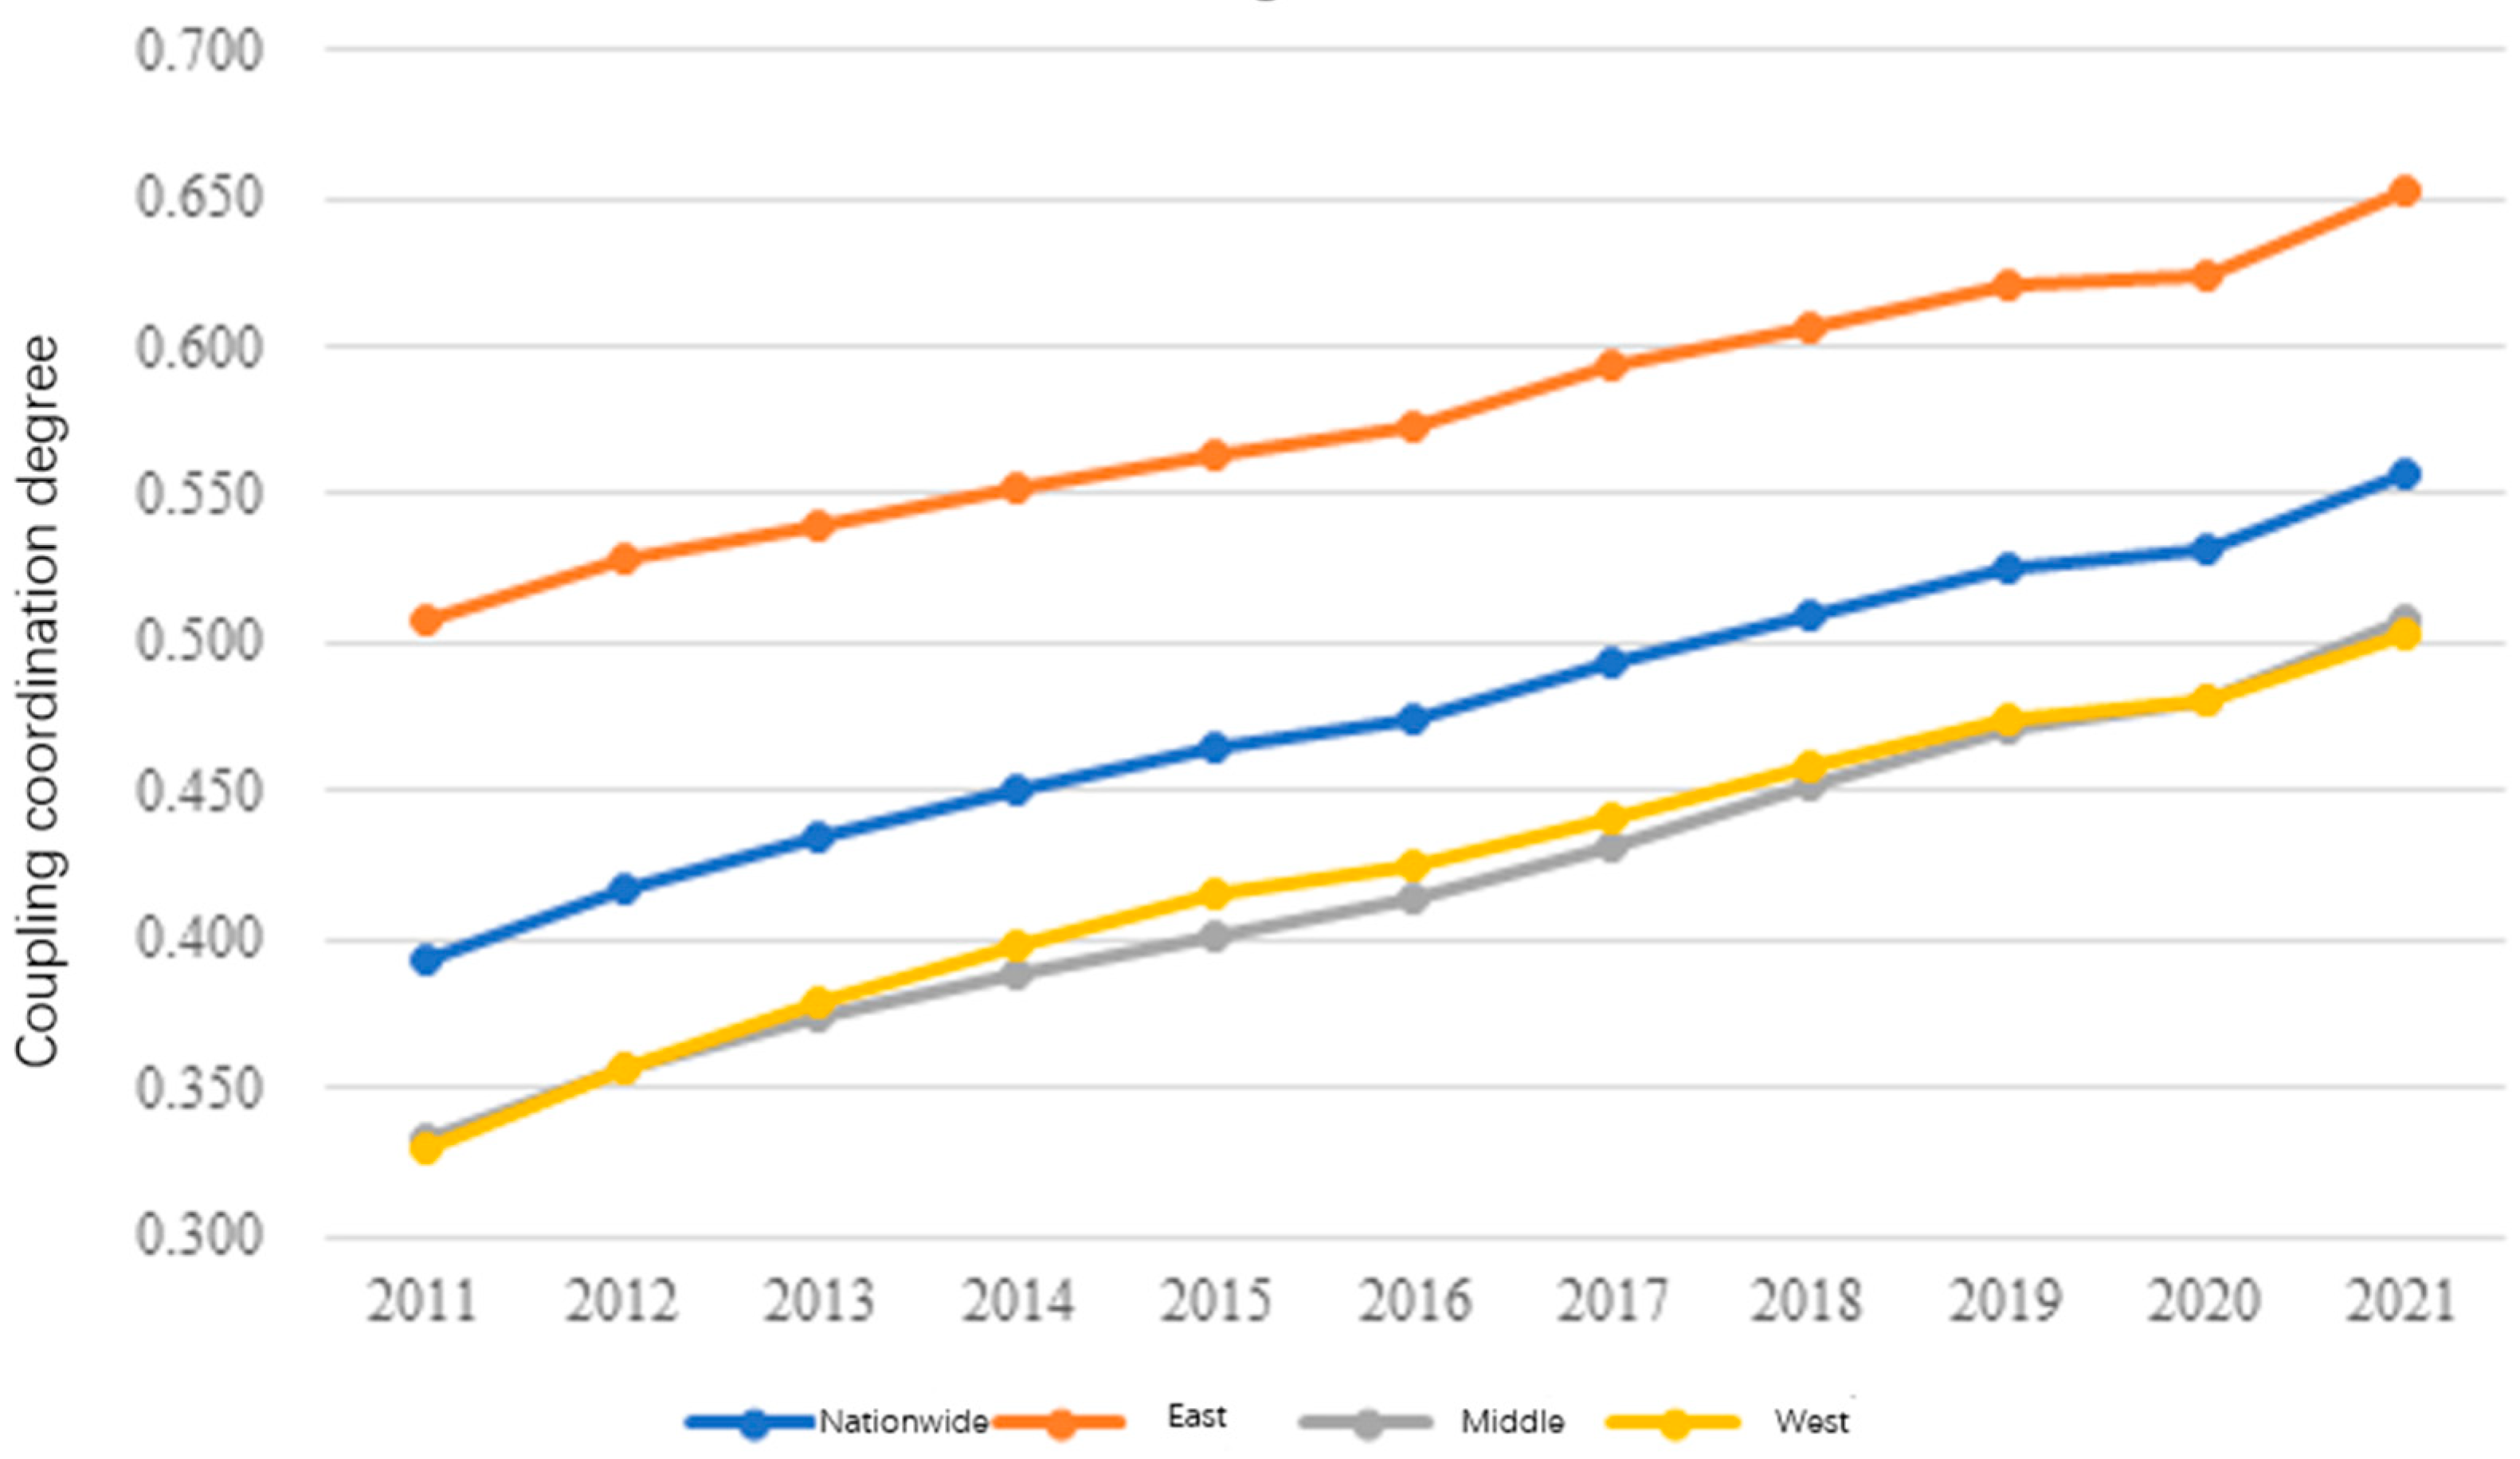
Figure 6).
From the perspective of the coupling coordination level of the whole country and the three major regions, the mean value of the coupling coordination between urban human settlements and economic development nationwide increased from 0.39 to 0.56, from about 0.51 to 0.65 in the eastern region, from 0.33 to 0.51 in the central region, and from 0.33 to 0.5 in the western region. In the central and western regions, the growth rate of the coupled coordination mean is similar, from the moderate imbalance to the barely coordinated stage, showing a steady and gradual growth trend. Among them, the coupling coordination value of the two systems in the country broke through 0.4 in 2012, entering the stage of reluctant coordination, and the central region achieved a leap in the type of coordinated development in 2013. The eastern region has always been the “leader” in the coupling and coordination level of urban human settlements and economic development. As early as 2011, the eastern region achieved a reluctant coordination between the two systems, and finally broke through 0.6 in 2018 to enter a good coordination stage, indicating that the urban human settlements and economic development in the eastern region are at a relatively mature development level compared with the whole country and the other two regions, and have maintained a certain development speed and are in a far-ahead position. The level of coupling coordination in the central and western regions is relatively similar, and has always been below the national average level, but it also maintains a stable growth trend. In 2015, the average of the coupling coordination degree in the central and western regions was greater than 0.4, and the coupling coordination degree in the central and western regions has successfully moved from a moderate imbalance to a barely coordinated transition state, and the coupling coordination relationship between urban human settlements and economic development has become increasingly close.
- (3)
Analysis of the spatial pattern of the coupling coordination level between the urban human settlement environment and economic development
In order to further explore the development and evolution characteristics of the coupling coordination level between the urban human settlement environment and economic development in 31 provinces and cities in China, and directly and clearly demonstrate their spatial evolution, the ArcGIS10.2 software is used according to the coupling coordination D-value data and classification standards of three time sections in 2011, 2016, and 2021. A coordinated spatial distribution map of urban human settlements and economic development in 31 provinces of China was drawn.
According to
Figure 7,
Figure 8 and
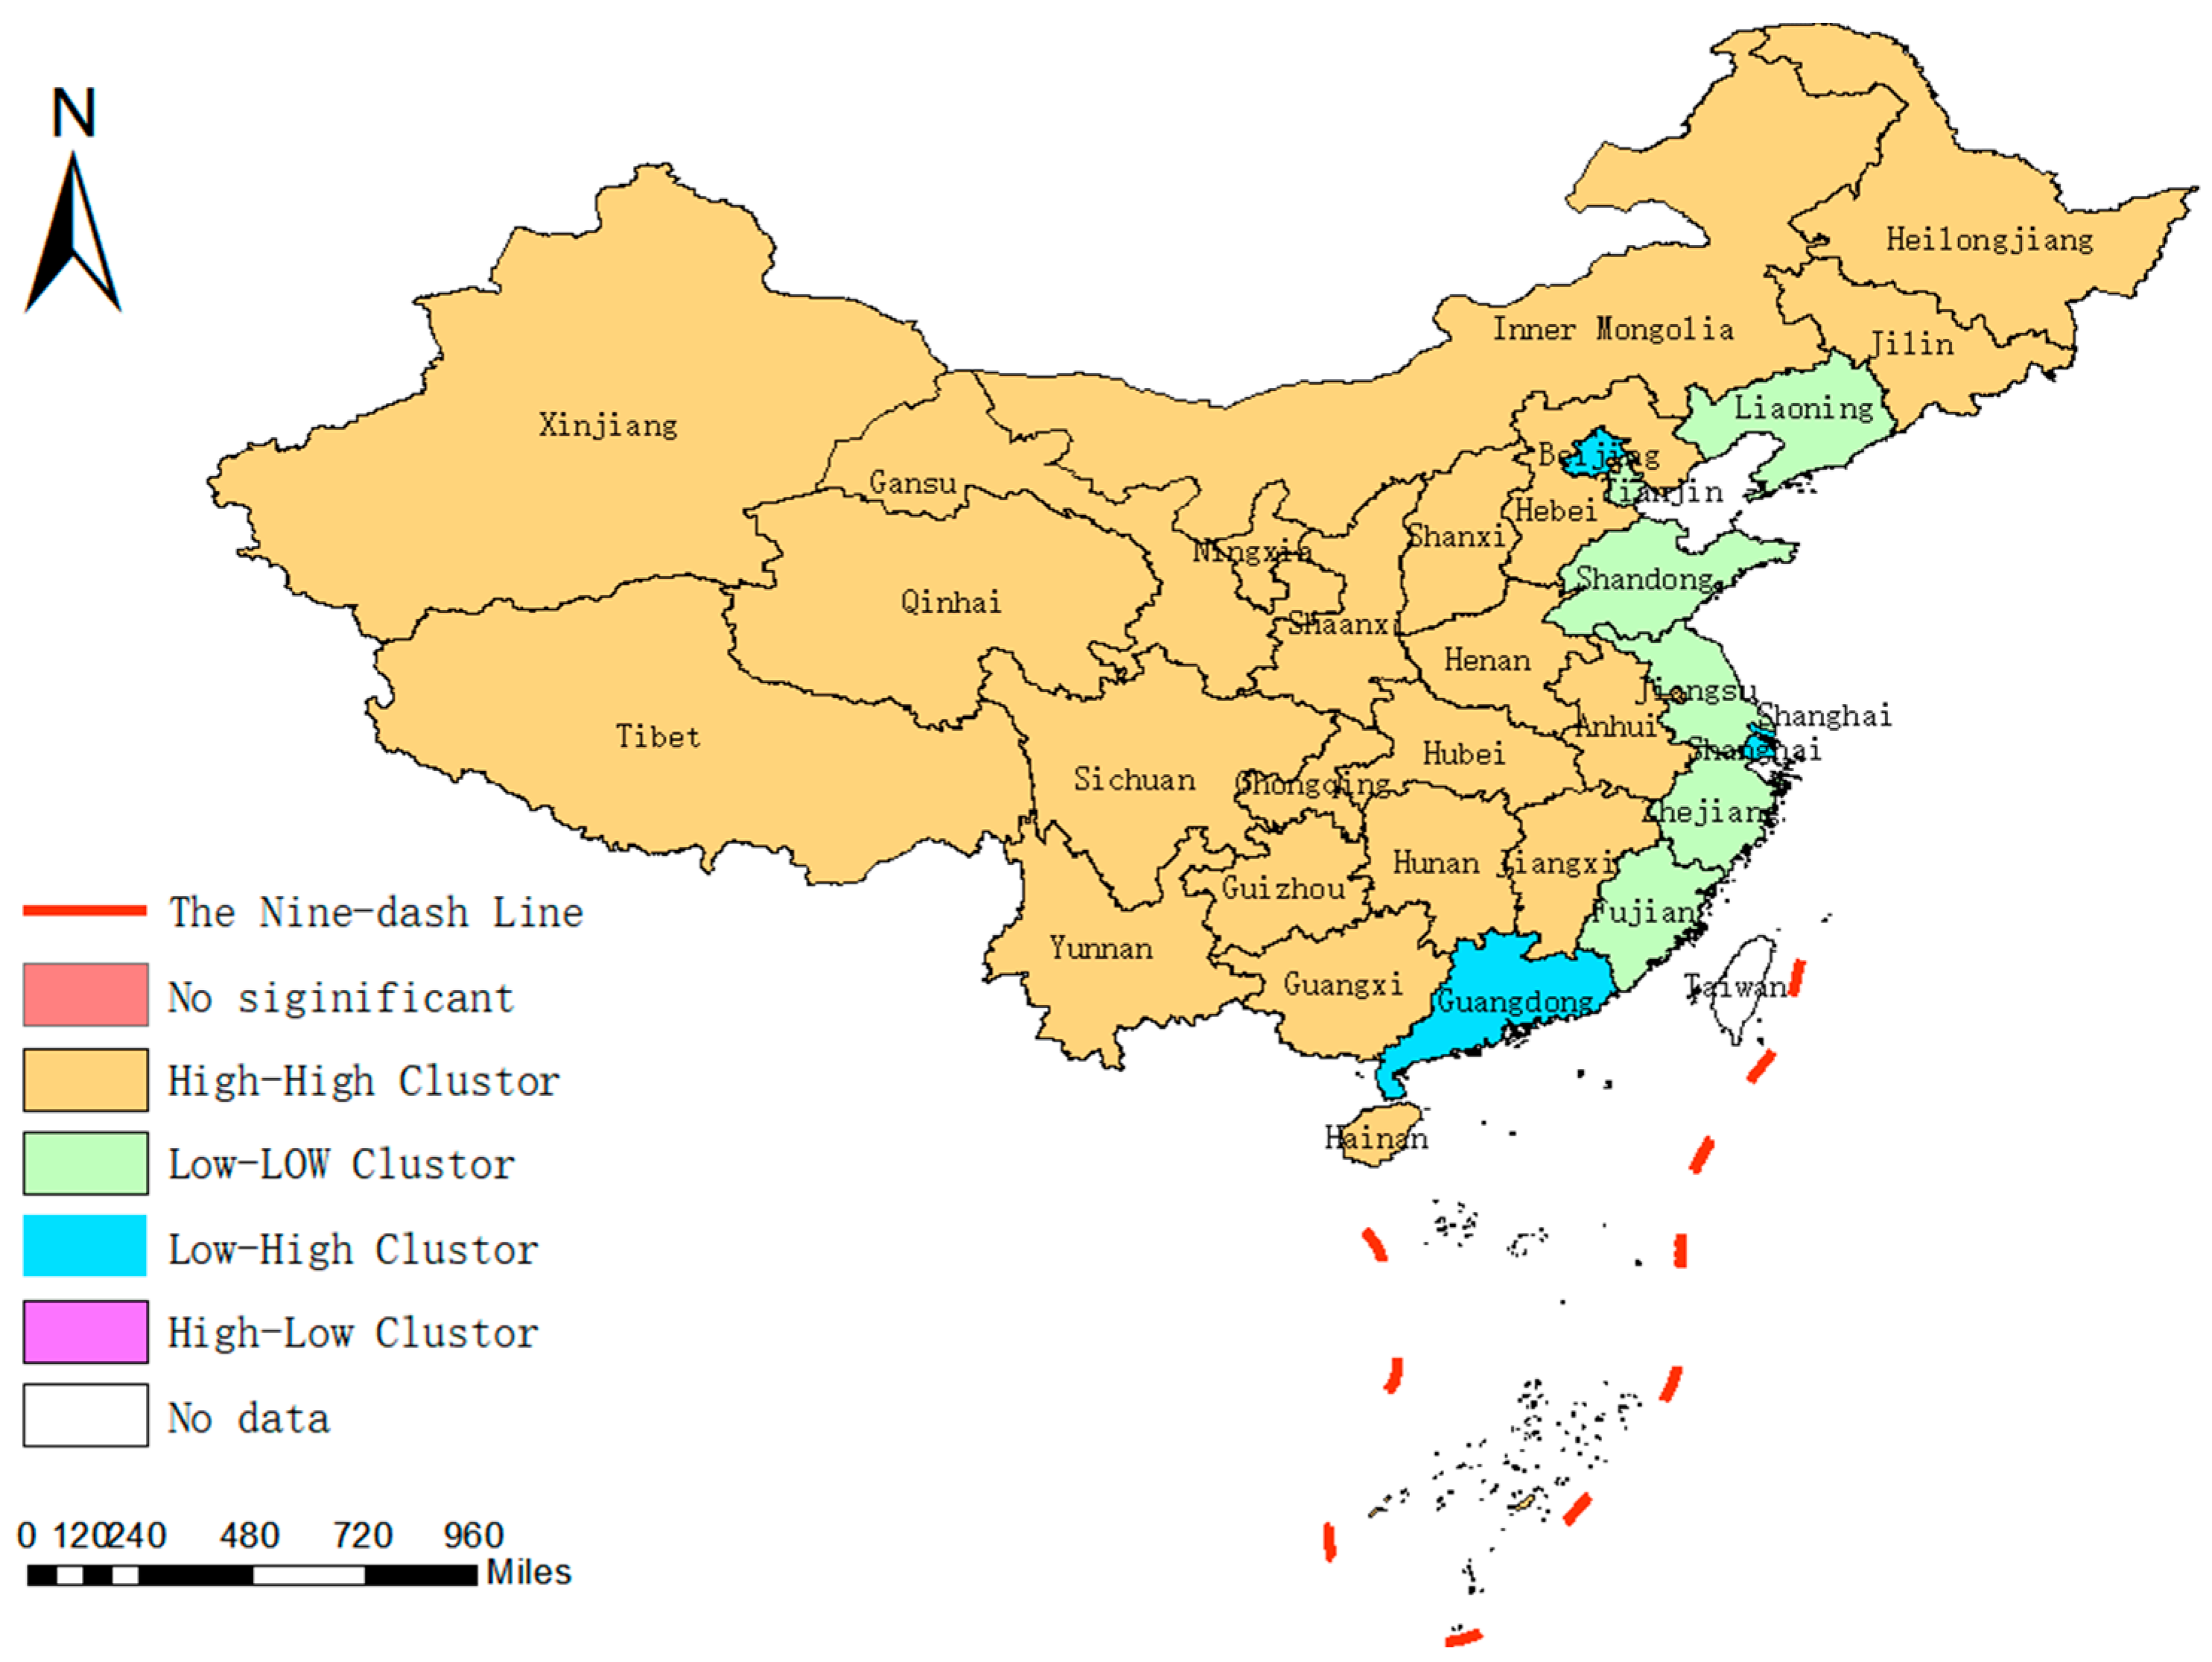
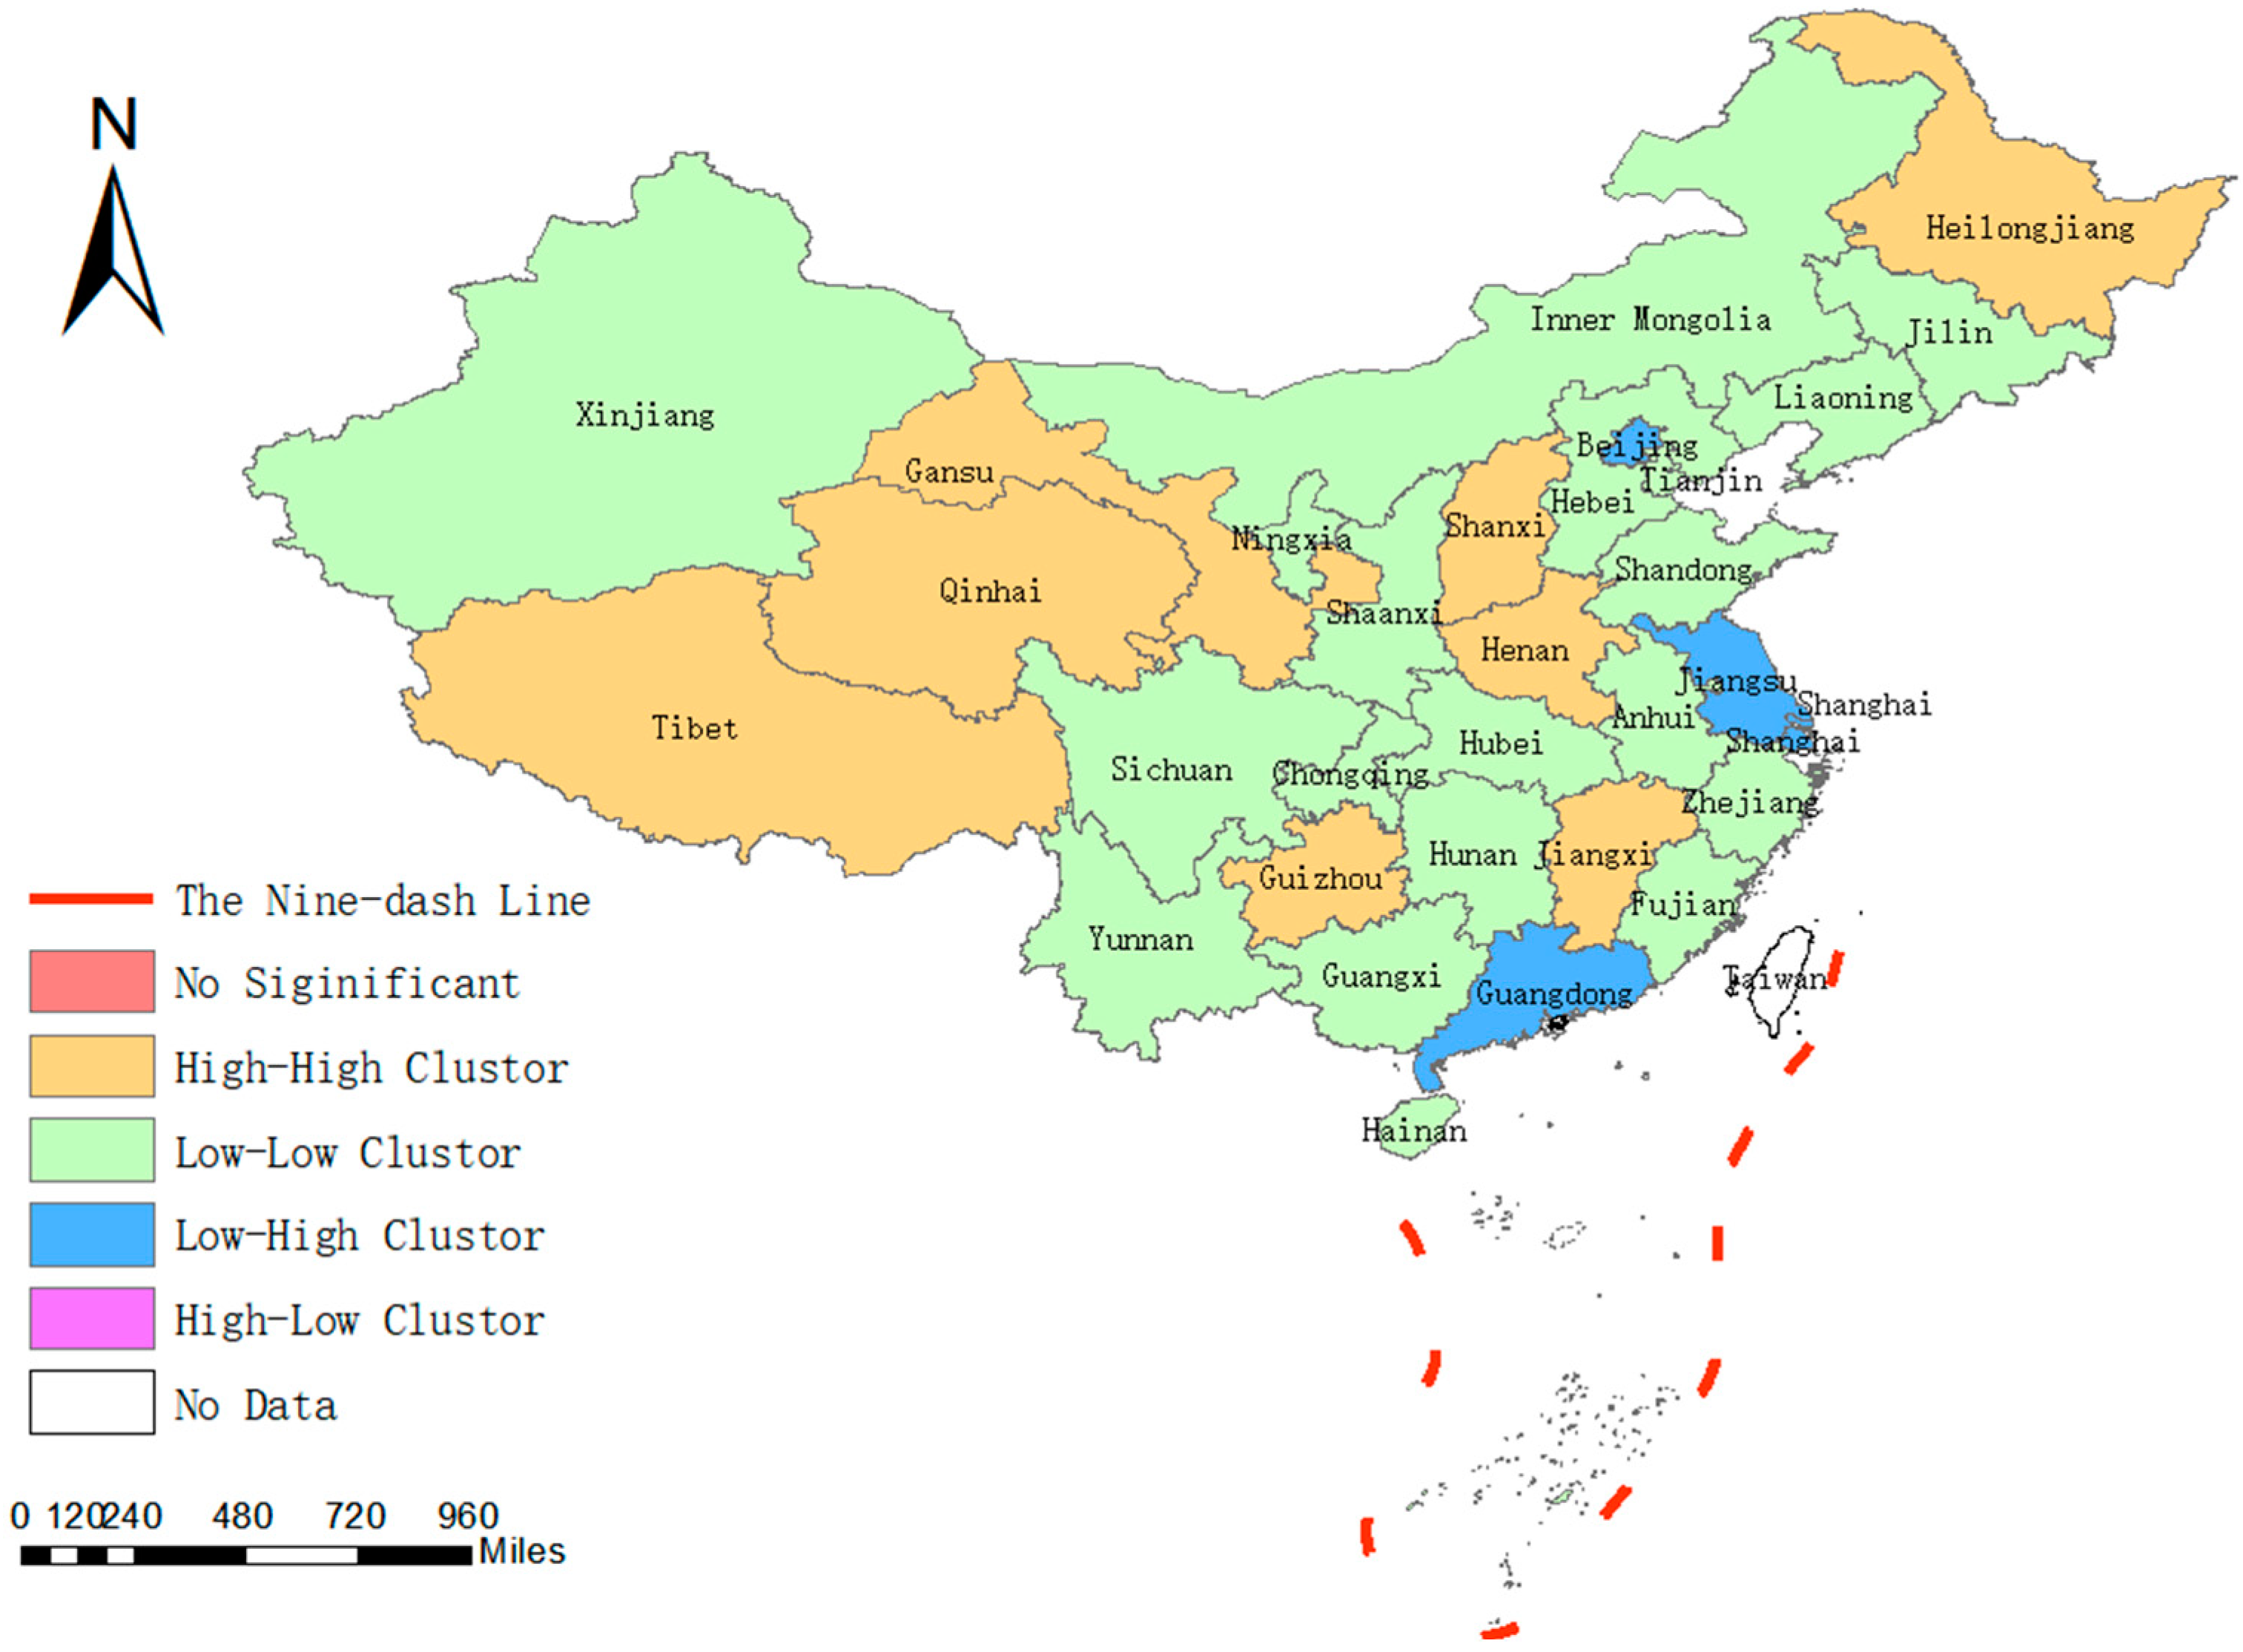
Figure 9, the coupling and coordinated development of the urban human settlement environment and economic development in 31 provinces (municipalities and districts) has obvious regional imbalance, which crosses the three development levels of moderate imbalance, barely coordinated and well coordinated. In the three selected time nodes, the provinces in the coordinated state are concentrated in the eastern region, and most of them belong to the three major urban agglomerations of Beijing-Tianjin-Hebei, Yangtze River Delta, and Pearl River Delta.
In 2011, the coordination between the urban human settlement environment and economic development system in most provinces and cities in China was in a stage of moderate imbalance, and only six provinces, Liaoning, Shandong, Tianjin, Jiangsu, Zhejiang, and Fujian, were barely coordinated, all located in the eastern region. In 2016, the eastern regions of Beijing, Jiangsu, Shanghai, and Guangdong were in a good state of coordination. In the central region, except for Shanxi, Heilongjiang, Jiangxi, and Henan, which are still in the stage of moderate imbalance, other regions have entered the stage of reluctant coordination. The four provinces that have jumped to a good coordination level are mainly Beijing, Jiangsu, Shanghai, and Guangdong. In the western region, except for Sichuan, Chongqing, Yunnan, Gansu, and Qinghai, which are in a moderate state of imbalance, the rest of the region has risen to a barely coordinated state. By 2021, Tianjin, Shandong, Zhejiang, and Fujian will be added to the well-coordinated state, all of which are located in the eastern region, indicating that the coordination degree between urban human settlements and economic development in the eastern region of China is relatively high, the development process is relatively fast, and the diffusion effect of the well-coupled and coordinated development of the two systems is relatively significant. The central region and the western region have entered the process of barely coordinated development, among which Heilongjiang and Gansu have entered barely coordinated development from the disordered state in 2018. The provinces with unbalanced coupling between the urban human settlement environment and economic development are mainly distributed in the central and western regions. Until 2021, the development gap between the central and western regions will gradually narrow and the development will be relatively stable. In contrast, there is still a large gap with the eastern region. From the spatial evolution and distribution of the coupling and coordination development types of provinces and cities, it is obvious that the coupling and coordination of regional urban human settlements and economic development in China show a gradient a decreasing trend from East to West, and the overall spatial distribution pattern is “high in the east and low in the west”.
4.2. Spatial Correlation Analysis of the Coupling Coordination Level Between the Urban Human Settlement Environment and Economic Development
It can be roughly observed from the spatio-temporal evolution analysis that the regions adjacent to the provinces with a higher level of coupling coordination between urban human settlement environment and economic development also have a good development trend, and there is a high and low clustering situation in space. In order to further study this feature, exploratory spatial data analysis (ESDA) is used to reveal its spatial interaction mechanism.
- (1)
Spatial correlation analysis method
Tobler’s first law of geography states that everything is correlated, revealing that things near each other are more correlated than things far away. Due to the influence of economic relations, geographical proximity, cultural origin, and other factors, there is a correlation between many variables that cannot be ignored, that is, spatial correlation. Through the spatial autocorrelation analysis, the spatial correlation can be effectively analyzed. Spatial autocorrelation can be divided into global and local spatial autocorrelation. Among them, the global spatial autocorrelation is mainly used to verify the spatial pattern of a certain element in the whole region and show its distribution in the global spatial sequence to analyze whether there is spatial correlation. Global Moran’s I Index, Geary’s C index and so on are often used to measure. Local spatial autocorrelation examines the degree of correlation between the geographical phenomenon or attribute value of a local unit and the same phenomenon of the local unit in the neighborhood, which is usually analyzed by using the local Moran’s index and presented by scatter plot and cluster plot. Usually, the global Moran’s I index is calculated first to confirm whether clusters or outliers occur in the research space. Since the global autocorrelation index can only explain the overall distribution and correlation status of a certain phenomenon within the research scope, the local autocorrelation index is introduced to measure the correlation status of the local space and further explain the specific region where clusters or outliers occur. Hence, locate the spatial distribution positions of clusters with similar properties. There are three kinds of spatial correlation: positive correlation, negative correlation, and random distribution. The spatial positive correlation means that the values of the variables become more and more similar as the spatial distance and location of the distribution shrink and cluster, and the observed values in different regions show a trend of convergence. Negative correlation is on the contrary, random distribution means that the distribution of variable values in space is completely random, and there is no regularity in high and low values.
(1). Moran’s I index of global space is used to measure the overall spatial agglomeration distribution trend of coupling and coordination between urban human settlements and economic development. The specific expression of Moran’s I index is:
where
represents the sample variance, n is the total number of samples,
represents the attribute value of region
,
represents the average value, and
is the spatial weight matrix.
In this paper, the inverse distance weight matrix is selected to calculate the spherical geographical distance between province
and province
based on the latitude and longitude data of each province, and the weight matrix is constructed by taking the reciprocal of it, which is expressed as follows:
The value range of the global Moran’s I index is [−1, 1]. When the significance level is given, if the global Moran’s I index value is greater than zero, it means that there is a spatial positive correlation between the coupling coordination level of the two systems. The value of Moran’s I index is less than zero, there is a spatial negative correlation between the development level of the two systems. When the value of the Moran’s I index is zero, it indicates that the spatial distribution is random and there is no spatial correlation. Generally, the Z-test is used to perform a statistical test on the global Moran index, and the formula is as follows:
where
,
is the mathematical expectation, and VAR is the variance.
(2). The formula for calculating local Moran’s I is as follows:
where
is the regional observed value after standardization;
is the spatial lag value, that is, the weighted average of the neighborhood around the observed value.
- (2)
The coupling and coordination spatial correlation characteristics of urban human settlements and economic development
According to the calculation result of the coupled coordination value of 31 provinces and cities in our country, the spatial autocorrelation index is calculated by Arc GIS and GeoDa 1.22 software platform tools, and the Moran scatter chart and Lisa agglomeration chart are drawn. The global and local spatial autocorrelation analysis of the coupling coordination degree between urban human settlement environment and economic development in China’s provinces and cities from 2011 to 2021 is carried out.
(1). Global spatial correlation analysis.
Firstly, the global spatial Moran Index is calculated, and the Moran’s I calculation results from 2011 to 2021 are shown in
Table 8.
Through the global Moran index test, it is found that the values of the inverse distance weight matrix measure are consistent with reality, and the significance test is passed, indicating that the measure results are reliable. During the 2011–2021 study period, the Moran’s I value of the coupling coordination degree of the two systems of provinces and cities in China is greater than 0, and the
P value is less than 0.05, that is, the possibility of randomly generating this clustering pattern is less than 5%. Through the 95% confidence test, the coupling coordination degree of urban human settlements and economic development in all provinces and cities in China has the characteristics of spatial positive correlation. There is a significant positive spatial interaction between adjacent units, that is, provinces with the same coupling and coordinated development level tend to be spatially clustered. According to the statistical results in
Table 8, the value of the global Moran Index is in the range of 0.1–0.16. From the change trend of the value, the overall change range of the Moran’s I value of the coupling coordination degree of the two systems is small and tends to be stable from 2011 to 2021. It shows that the coupling and coordination of regional urban human settlements and economic development system in China presents a steady and gradual agglomeration development.
(2). Local spatial correlation analysis.
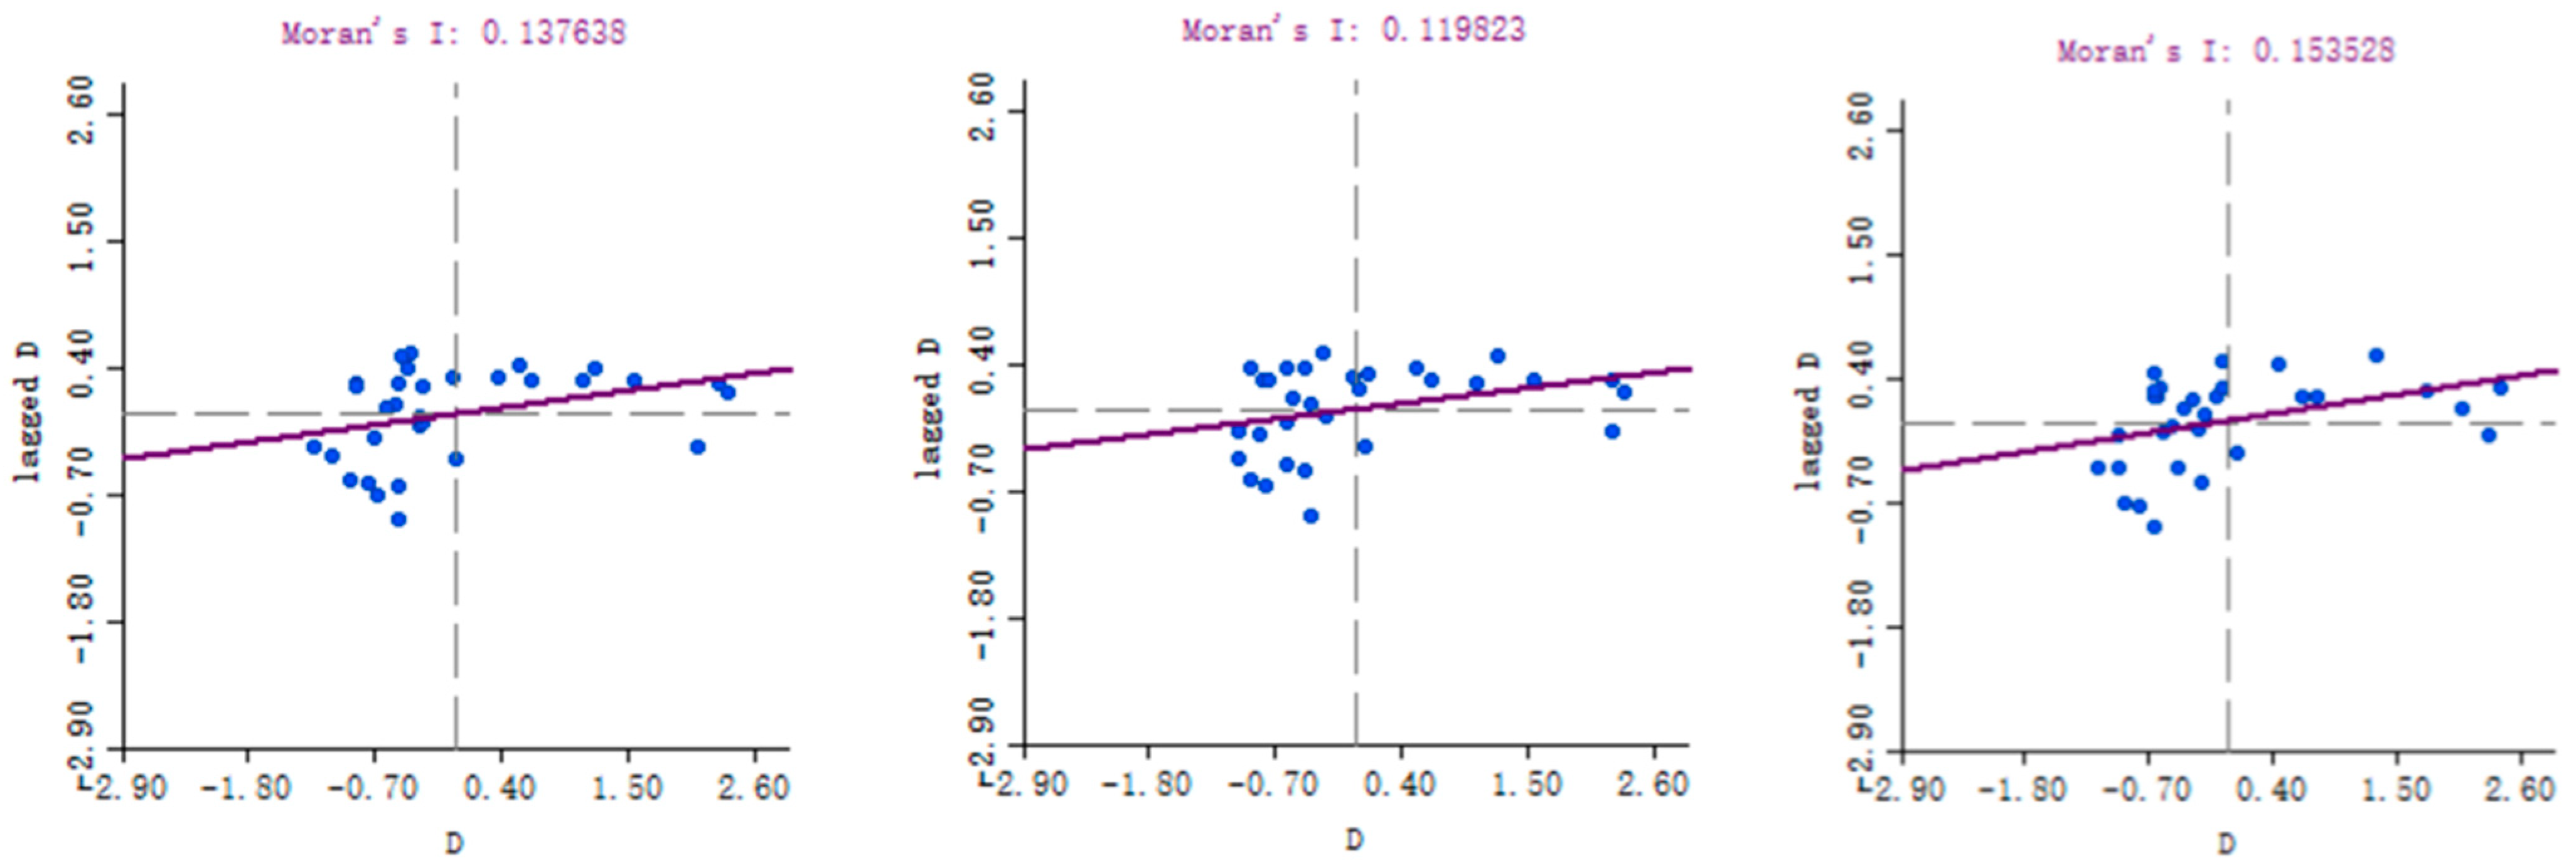
Local Moran’s I index was used to measure the correlation features between provinces and neighboring provinces, and was presented by Moran scatter plot and Lisa aggregation plot. Three research time nodes of 2011, 2016, and 2021 were selected to draw scatter plot and Lisa cluster plot, as shown in
Figure 10.
The horizontal coordinate of the scatter plot represents the observed value after standardization of the space unit itself, and the vertical coordinate represents the “lag” value of the space unit, that is, the index expected value of the adjacent unit determined by the matrix W after standardization. The first quadrant (H-H) indicates that not only the coupling coordination level in the region is higher, but also the coupling coordination level in the neighborhood is higher, showing a high-value cluster. The second quadrant (L-H) represents the situation where the low value is surrounded by the high value, that is, the coupling coordination level of itself is low but the coupling coordination level of the surrounding area is high. The third quadrant (L-L) is low-value agglomeration, that is, the coupling coordination values of itself and the surrounding areas are low. The research unit in the fourth quadrant (H-L) is characterized by low coupling coordination values in the local region but high coupling coordination values in the neighborhood, which is a situation where high values are surrounded by low values.
From the comparison between
Figure 10 and
Figure 11, it can be found that the provincial and municipal units located in the first quadrant (high-high type) and the second quadrant (low-high type) account for the majority. Compared to the third quadrant (low-low type) and the fourth quadrant (high-low type), this indicates that the aggregation areas of high values and low values are more significant, with less spatial difference. Although the Moran’s I scatter plot does not conduct a detailed test on the local Moran index for each area, the Lisa cluster map shows the spatial units that have passed the significance test at a given significance level, clarifying the positive correlation between the coupling coordination value in the urban human settlement environment and economic development space, and highlighting the spatial aggregation areas of high and low values.


