Article

Effects of Out-of-Plane Deformation of the Base Plate on the Structural Behavior of an Exposed Column Base

Graduate School of Engineering, Nagasaki University, Nagasaki 852-8521, Japan
*
Author to whom correspondence should be addressed.
Buildings 2024, 14(12), 3881; https://doi.org/10.3390/buildings14123881
Submission received: 29 October 2024 / Revised: 27 November 2024 / Accepted: 30 November 2024 / Published: 3 December 2024
(This article belongs to the Special Issue Research on the Seismic Design of Steel Frames)

Abstract

This study explores the behavior of exposed column bases in concrete-filled steel tubular (CFST) and steel structures, with a focus on cases where base plates yield due to out-of-plane deformation. Understanding these mechanisms is crucial for improving the design and safety of these structures. Experimental tests and numerical analyses were conducted on four specimens to investigate their lateral load versus drift angle behavior. The tests demonstrated that base plates exhibited sufficient deformation capacities and enhanced hysteresis characteristics. Finite element method (FEM) analysis successfully traced the load–deformation relationships observed in the tests, providing detailed insights into stress distribution on the base plates. Based on these analyses, a simplified calculation method was proposed to evaluate the horizontal strength of exposed column bases. The proposed method showed excellent agreement with the test results, highlighting its potential as a practical tool for structural design.

1. Introduction

Concrete-filled steel tubular (CFST) structures have been used in seismic regions. A CFST structure consists of CFST columns, steel beams, and steel base plates. This structure is categorized in steel structure. There have been many steel-structure buildings that collapsed due to damage to exposed column bases, for example, as shown in Figure 1. These damages were reported in [1,2,3].
An exposed column base connection is commonly used in mid- and low-rise buildings owing to its ease of installation and cost effectiveness. Several studies have shown interesting outcomes for column bases [4,5,6,7]. The base plate is welded to the lower end of the column and is connected by anchor bolts to the concrete foundation. The authors focus on the structural behavior and the calculation method of the strength of an exposed column base which yields at the base plate.
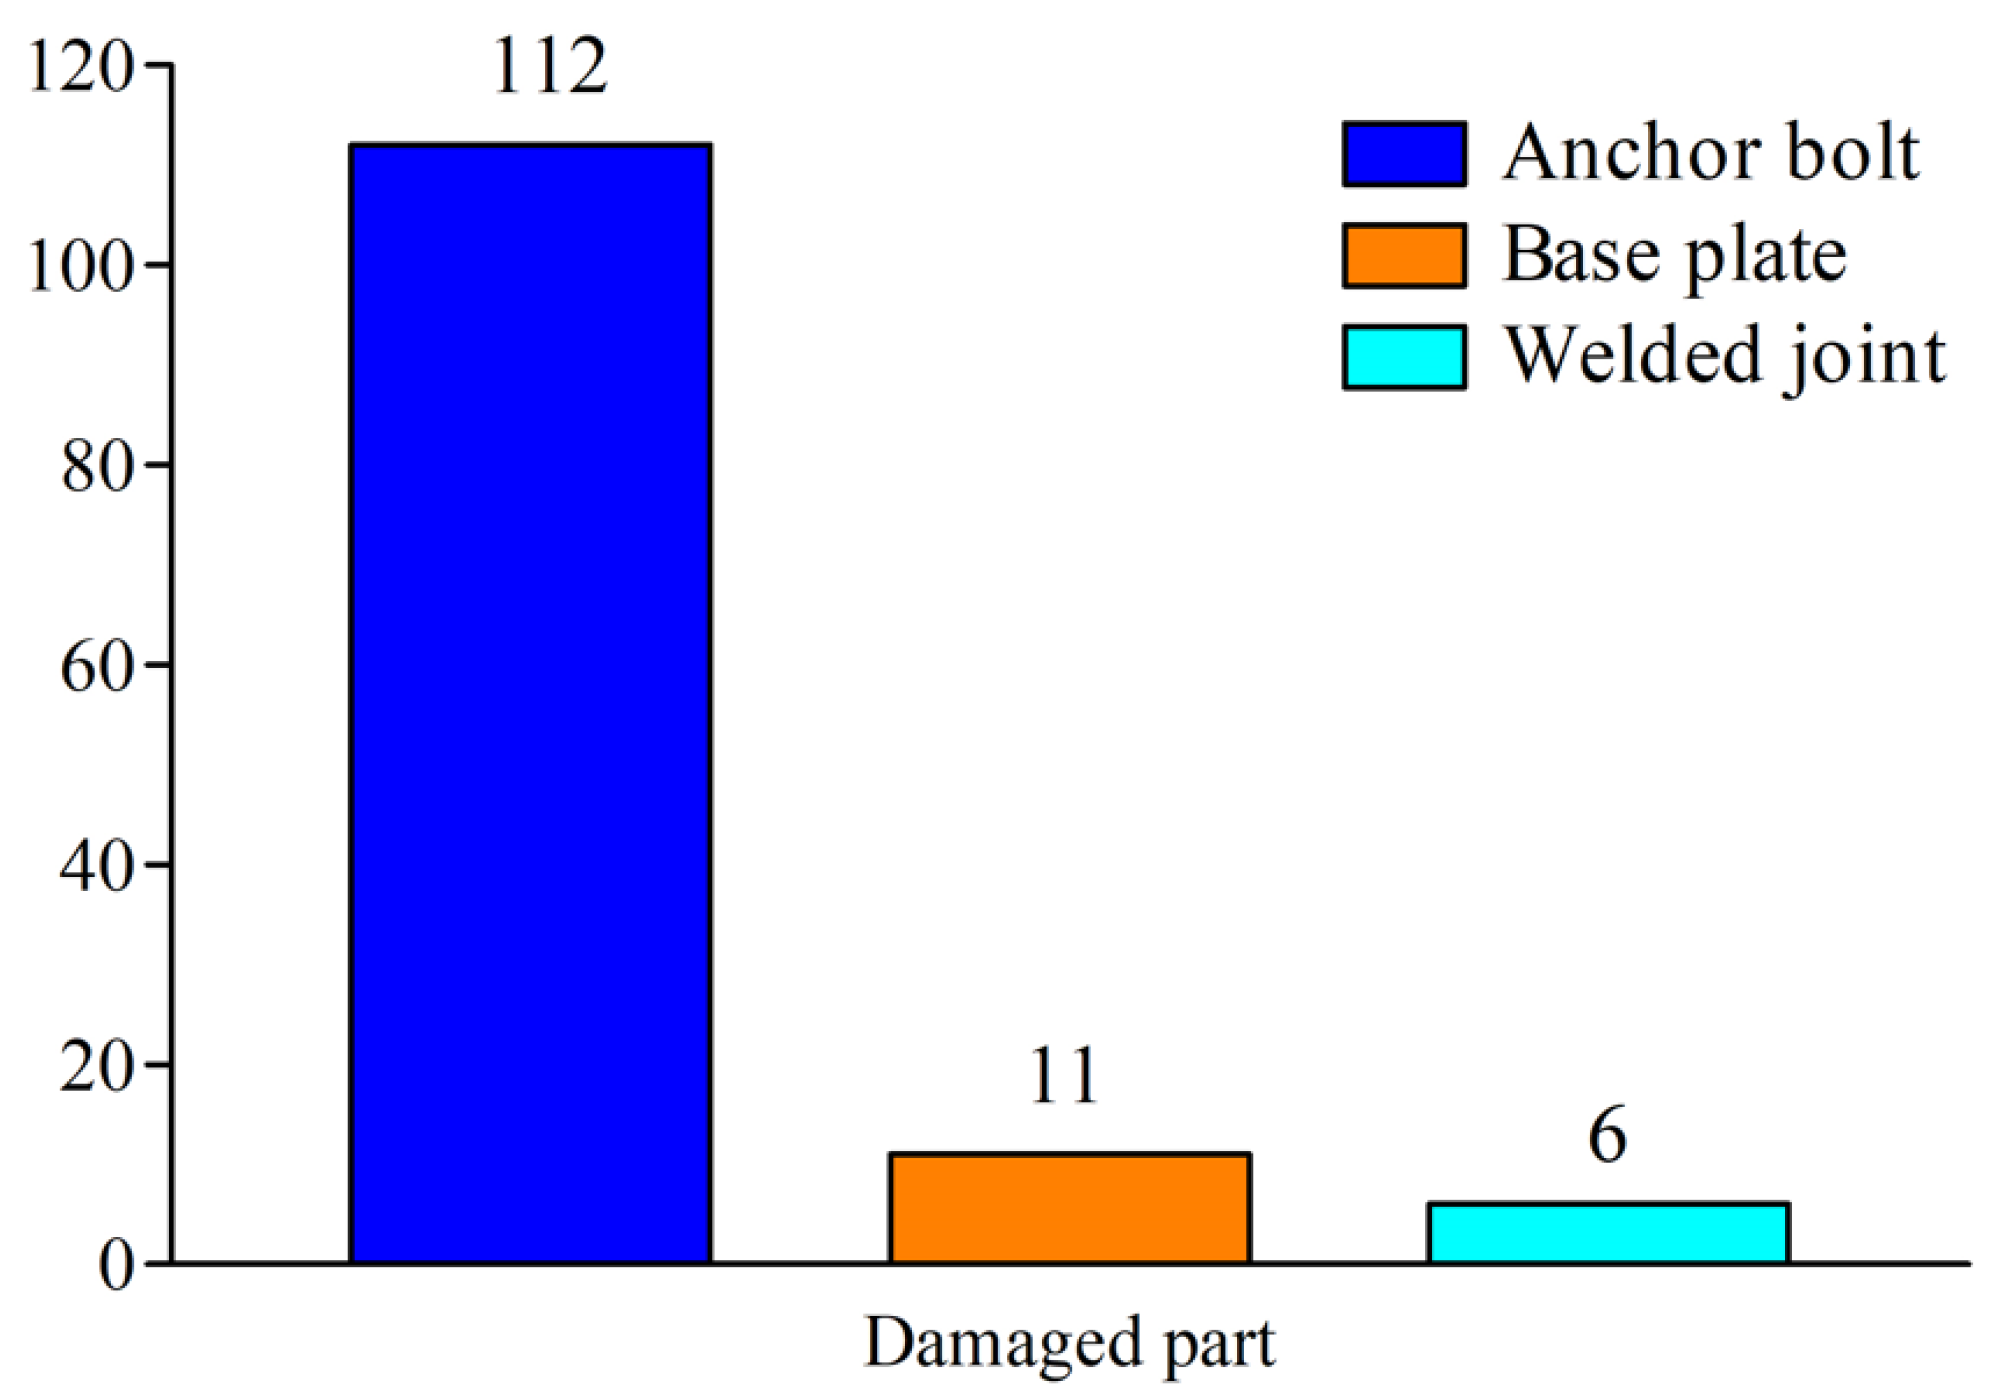
Figure 2 shows the statistical data of the column bases of steel structures damaged by the Kobe earthquake in 1995 in Japan [1]. Anchor bolt failures account for 87% of the data. This is because the current design guidelines [8] in Japan specify that anchor bolts in exposed column bases should yield axially first, preventing the base plate from plasticizing. Anchor bolt failures were studied in some articles [9,10,11,12,13]. However, column bases with fracturing anchor bolts have a poor energy absorption capacity [14]. Past earthquake damage has shown not only insufficient elongation of anchor bolts but also significant out-of-plane deformations of base plates.
Studies of the structural design including out-of-plane deformation of the base plate in an exposed column base were reported in [15,16].
In a study by Kokubo et al. [17], the yielding type of anchor bolts and base plate were tested. In the test, cyclic loads were applied in the horizontal direction with a displacement control under a constant axial force of 200 kN. The history of the drift angles of the column was ±0.5%, ±1%, ±2%, ±4%, and ±8%. The study confirmed that the hysteresis characteristics of the base plate yielding type were not inferior to those of the anchor bolts yielding type.
Furthermore, in an experimental study by Akiyama et al. [18], the test parameter was thickness of the base plate of 60 mm and 30 mm. The former was an anchor bolt yielding type column base and the latter was a base plate yielding type column base. An inertial loading device was used to vibrate the test specimen, and vibrations were applied in the order of elastic excitation, plastic excitation, and ultimate excitation. In both cases, the maximum rotation angles of the column bases were around 6/100, demonstrating large deformation performance. In the base plate yielding type, the base plate deformed out of plane, and the hysteresis characteristics were intermediate between those of the slip type and the origin-oriented type.
In a study by Takamatsu et al. [19], a total of four specimens with base plates of 9 mm and 19 mm thickness were tested under axial forces of 0 kN and 500 kN. A predetermined axial force was applied using a vertical hydraulic jack, and cyclic horizontal loadings were conducted using a horizontal hydraulic jack. The horizontal loading was repeated in a displacement-controlled manner for each cycle until the rotational angle at the column base reached approximately 0.1 rad. The test results showed that for the specimens without axial force, the base plate plastically deformed out of plane, and the hysteresis curve exhibited typical origin-oriented characteristics. The hysteresis curve for the specimens with an axial force of 500 kN also showed origin-oriented characteristics.
Based on the above studies, out-of-plane deformation of the base plate in exposed column bases is not inevitable to avoid as a failure mode in the critical state of buildings in large-scale earthquakes. From the point of view of deformation capacities and energy-dissipating capacities of the parts, it is necessary to accumulate the test and analytical studies of the base plate yielding type of the column base.
Exposed column bases are also used in CFST (concrete-filled steel tubular) structures. Due to the high strength of CFST structures, it is difficult to realize that column yielding mechanism before the yielding of the part of the column base.
The authors thus conducted a lateral loading test of four specimens of column bases with CFST columns and derived the strength formula for column bases with yielding at the base plates by comparing the test and FEM analysis results carried out to clarify the load versus deformation relationship and stress distribution states of the base plates.

2. Test Study

To demonstrate the behavior of exposed column bases where the base plate yields first, tests were conducted as shown in Figure 3. The specimen consisted of a CFST column, a thin steel base plate, and a rigid steel foundation.

2.1. Specimens

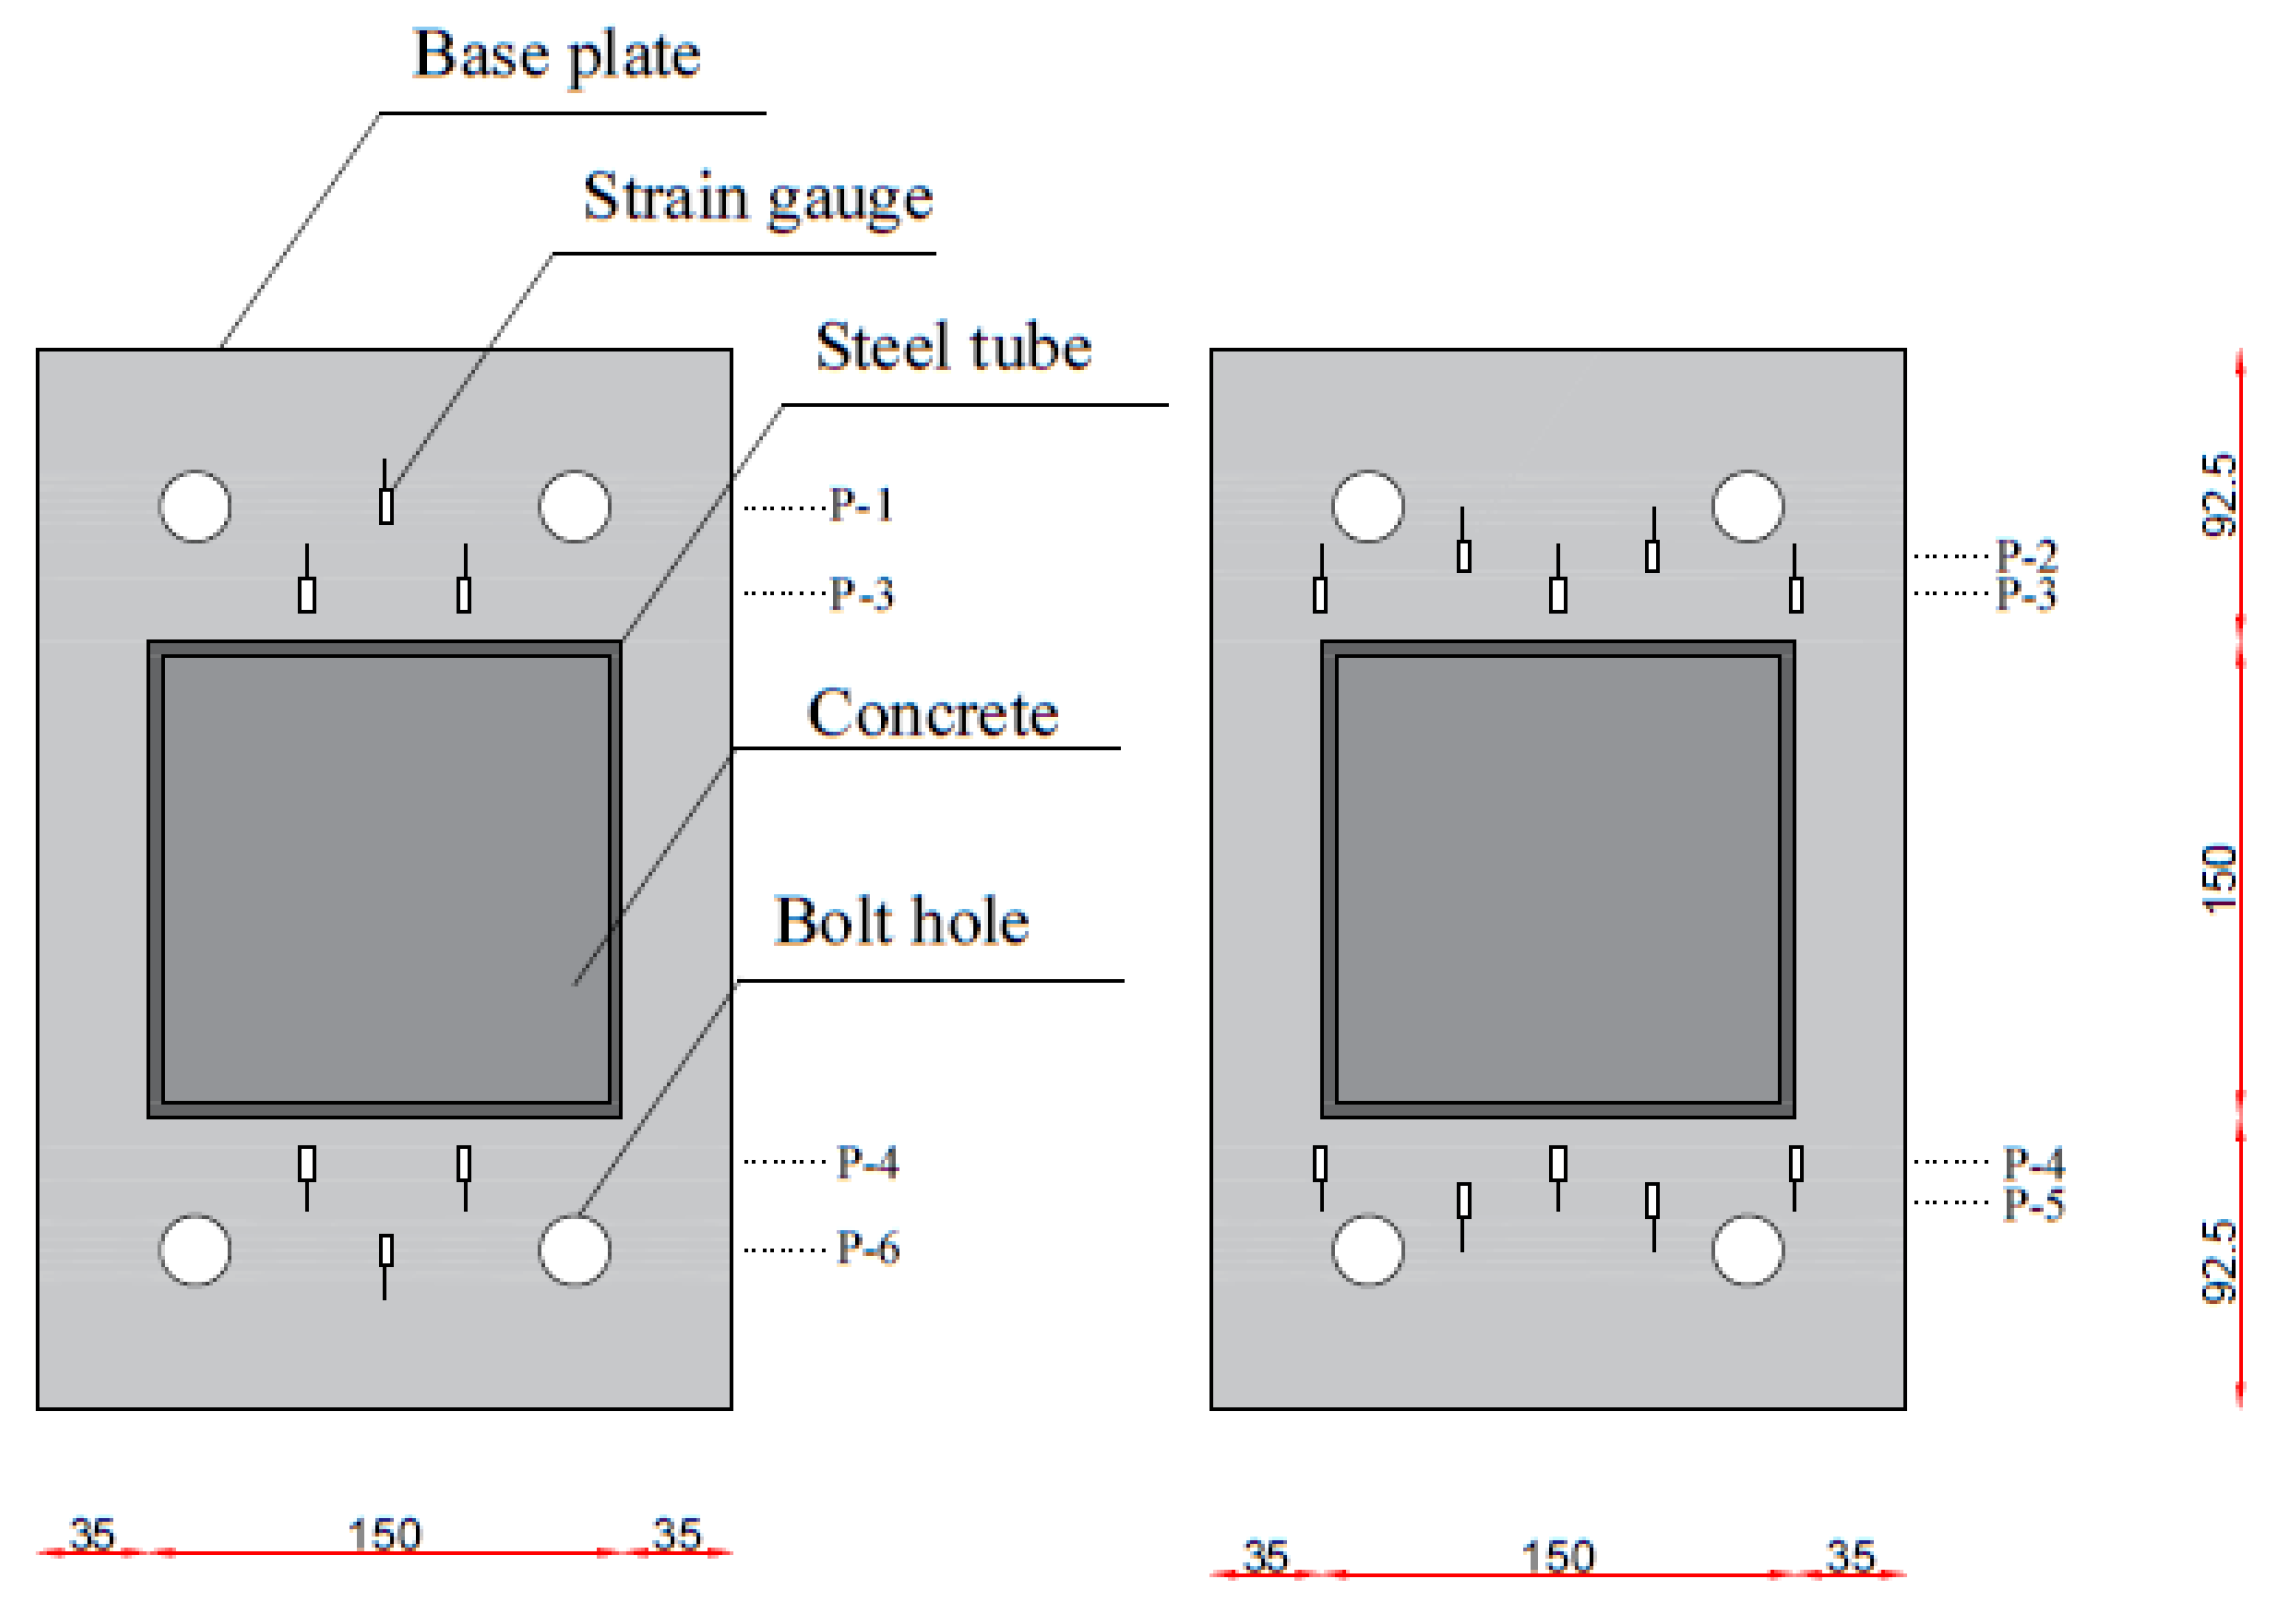
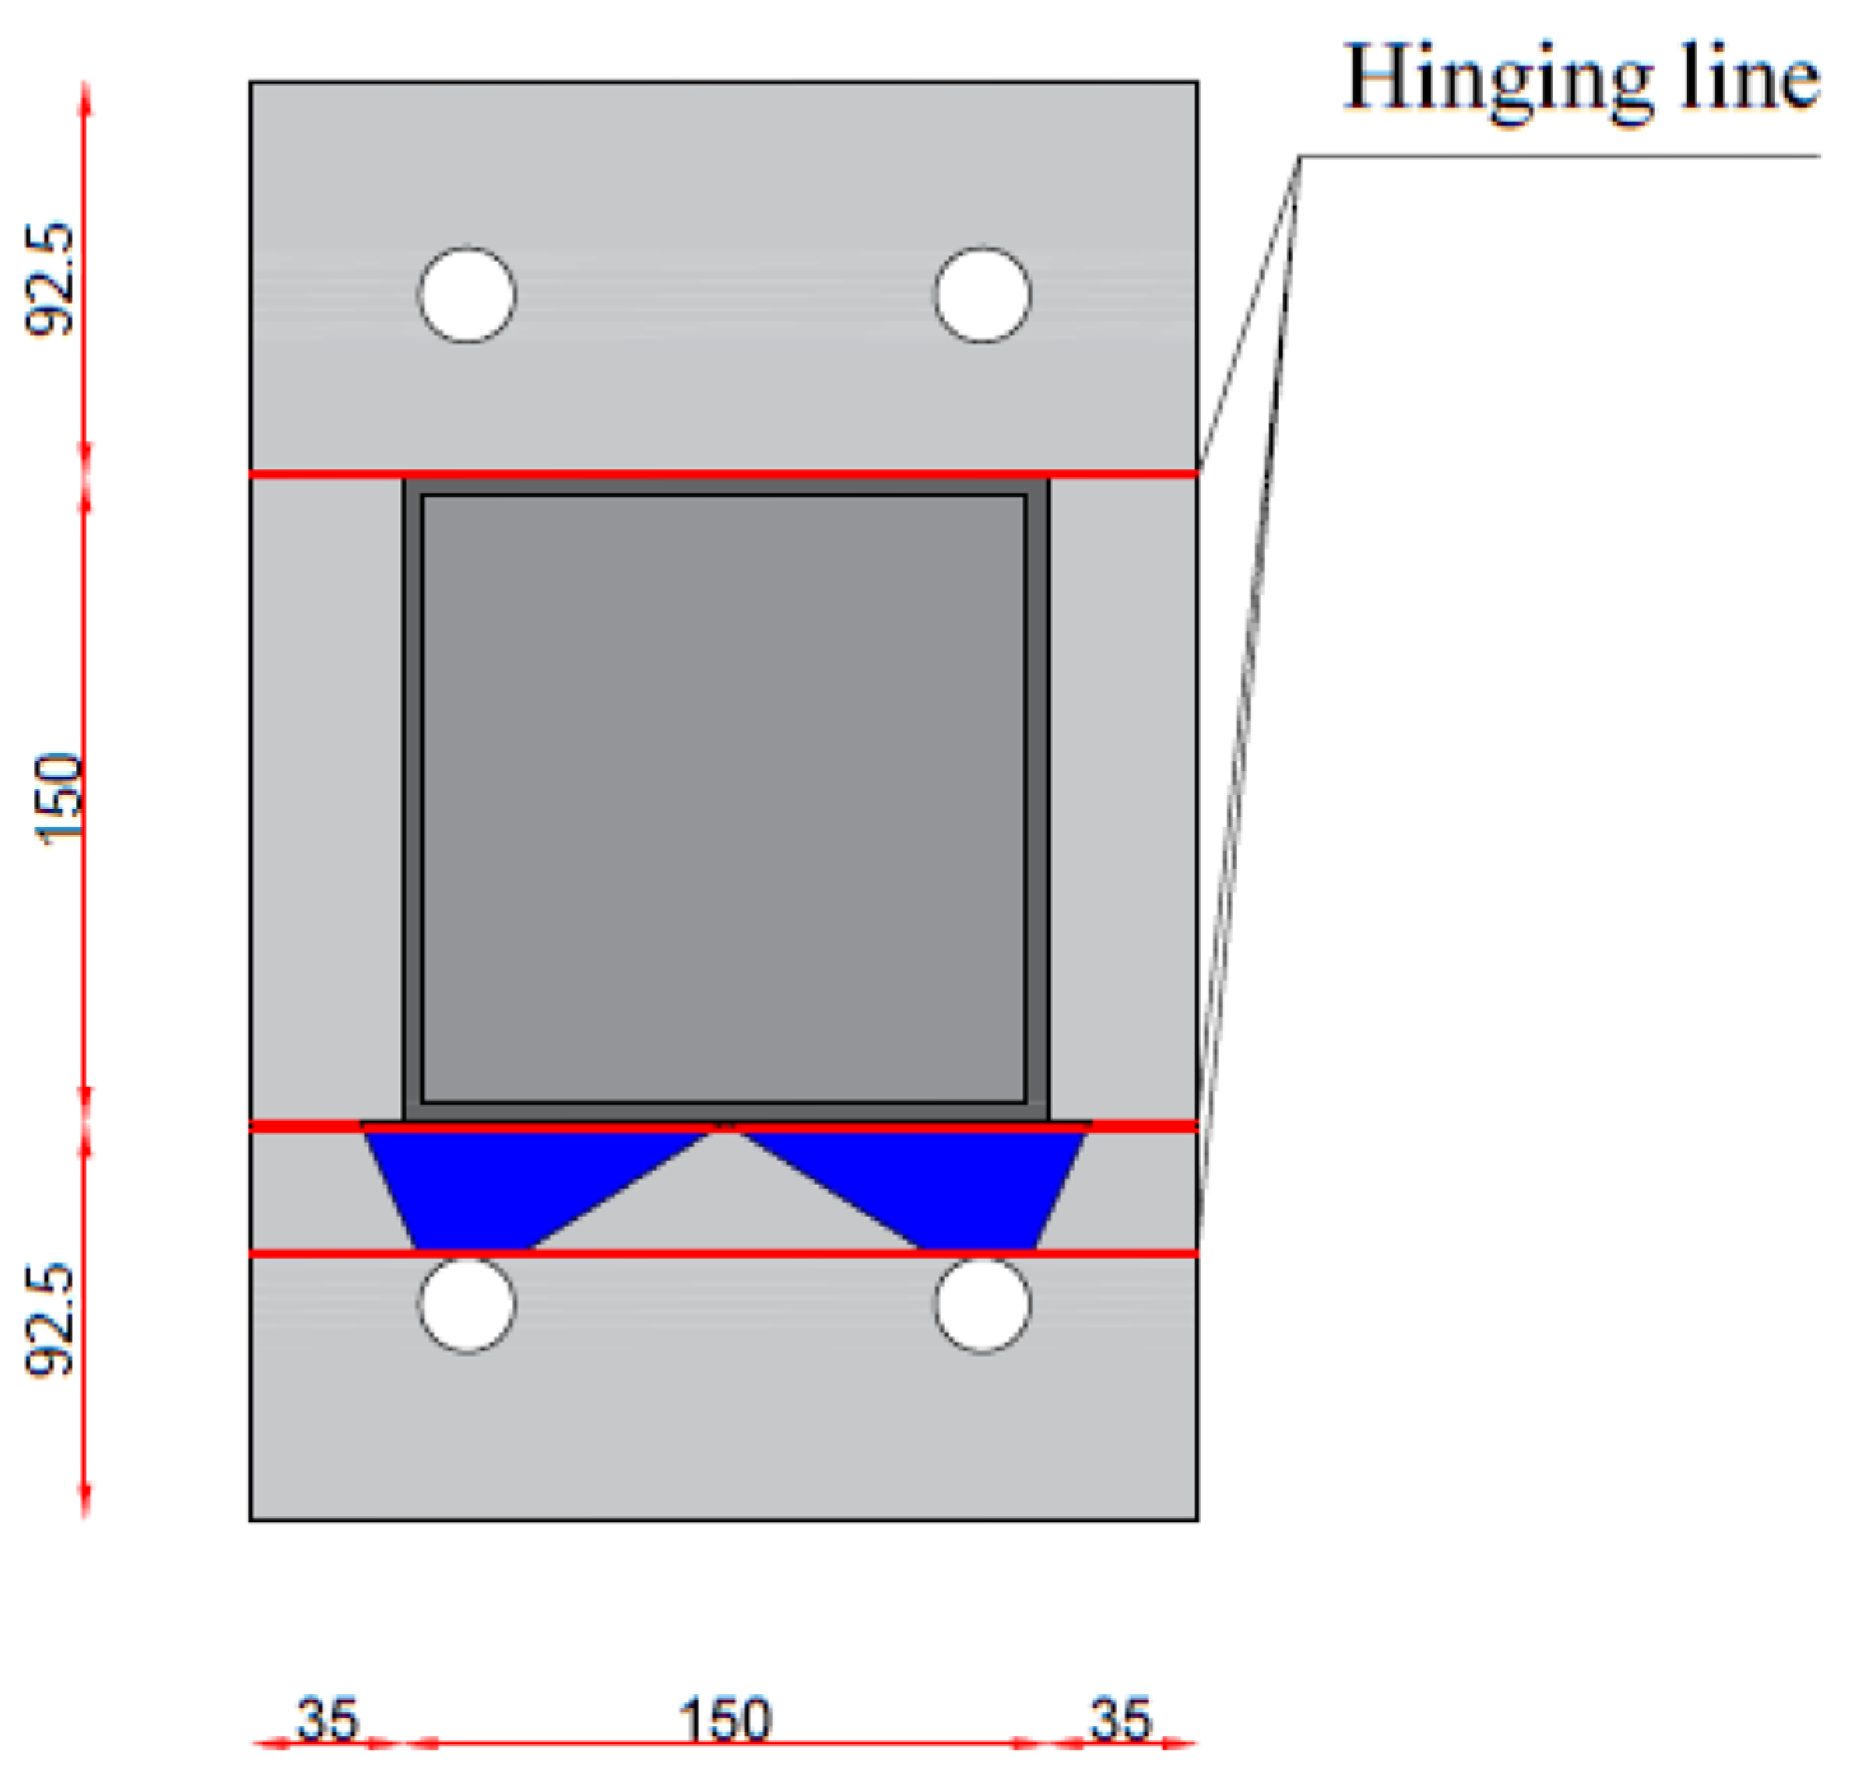
The dimensions of the base plate are shown in Figure 4. The test specimens were made of □-150 × 150 × 4.50 mm STKR400 square steel tubes. The height of all specimens was 855 mm. The material properties of the column are shown in Table 1. The steel plates for the base plates measured 220 × 335 mm, with thicknesses of 6.00 mm and 5.60 mm. The material properties of the plates are shown in Table 2. The bolt holes were 22 mm in diameter. The steel plates were welded to the steel tubes. The specimens were fixed to the loading frame using four high-strength M20 bolts. Strain gauges were glued on the base plates to measure the deformations at each place. Careful measurement of the strain on the surface of the plates was demonstrated. In specimens S1 and S2, the positions of strain gauges were P-1, P-3, P-4, and P-6. In specimens S3 and S4, the positions of strain gauges were P-2, P-3, P-4, and P-5. In this study, the columns are not steel but CFST, in which concrete filled steel tubes. The compressive strengths of the concrete are shown in Table 3. The notations in the tables are as follows: σy: yield stress; σu: tensile stress; σc: compressive strength of concrete; E: Young’s modulus; Ec: Young’s modulus of the concrete; BP: width of the base plate; DP: length of the base plate; t: thickness of the base plate.

2.2. Test Setup

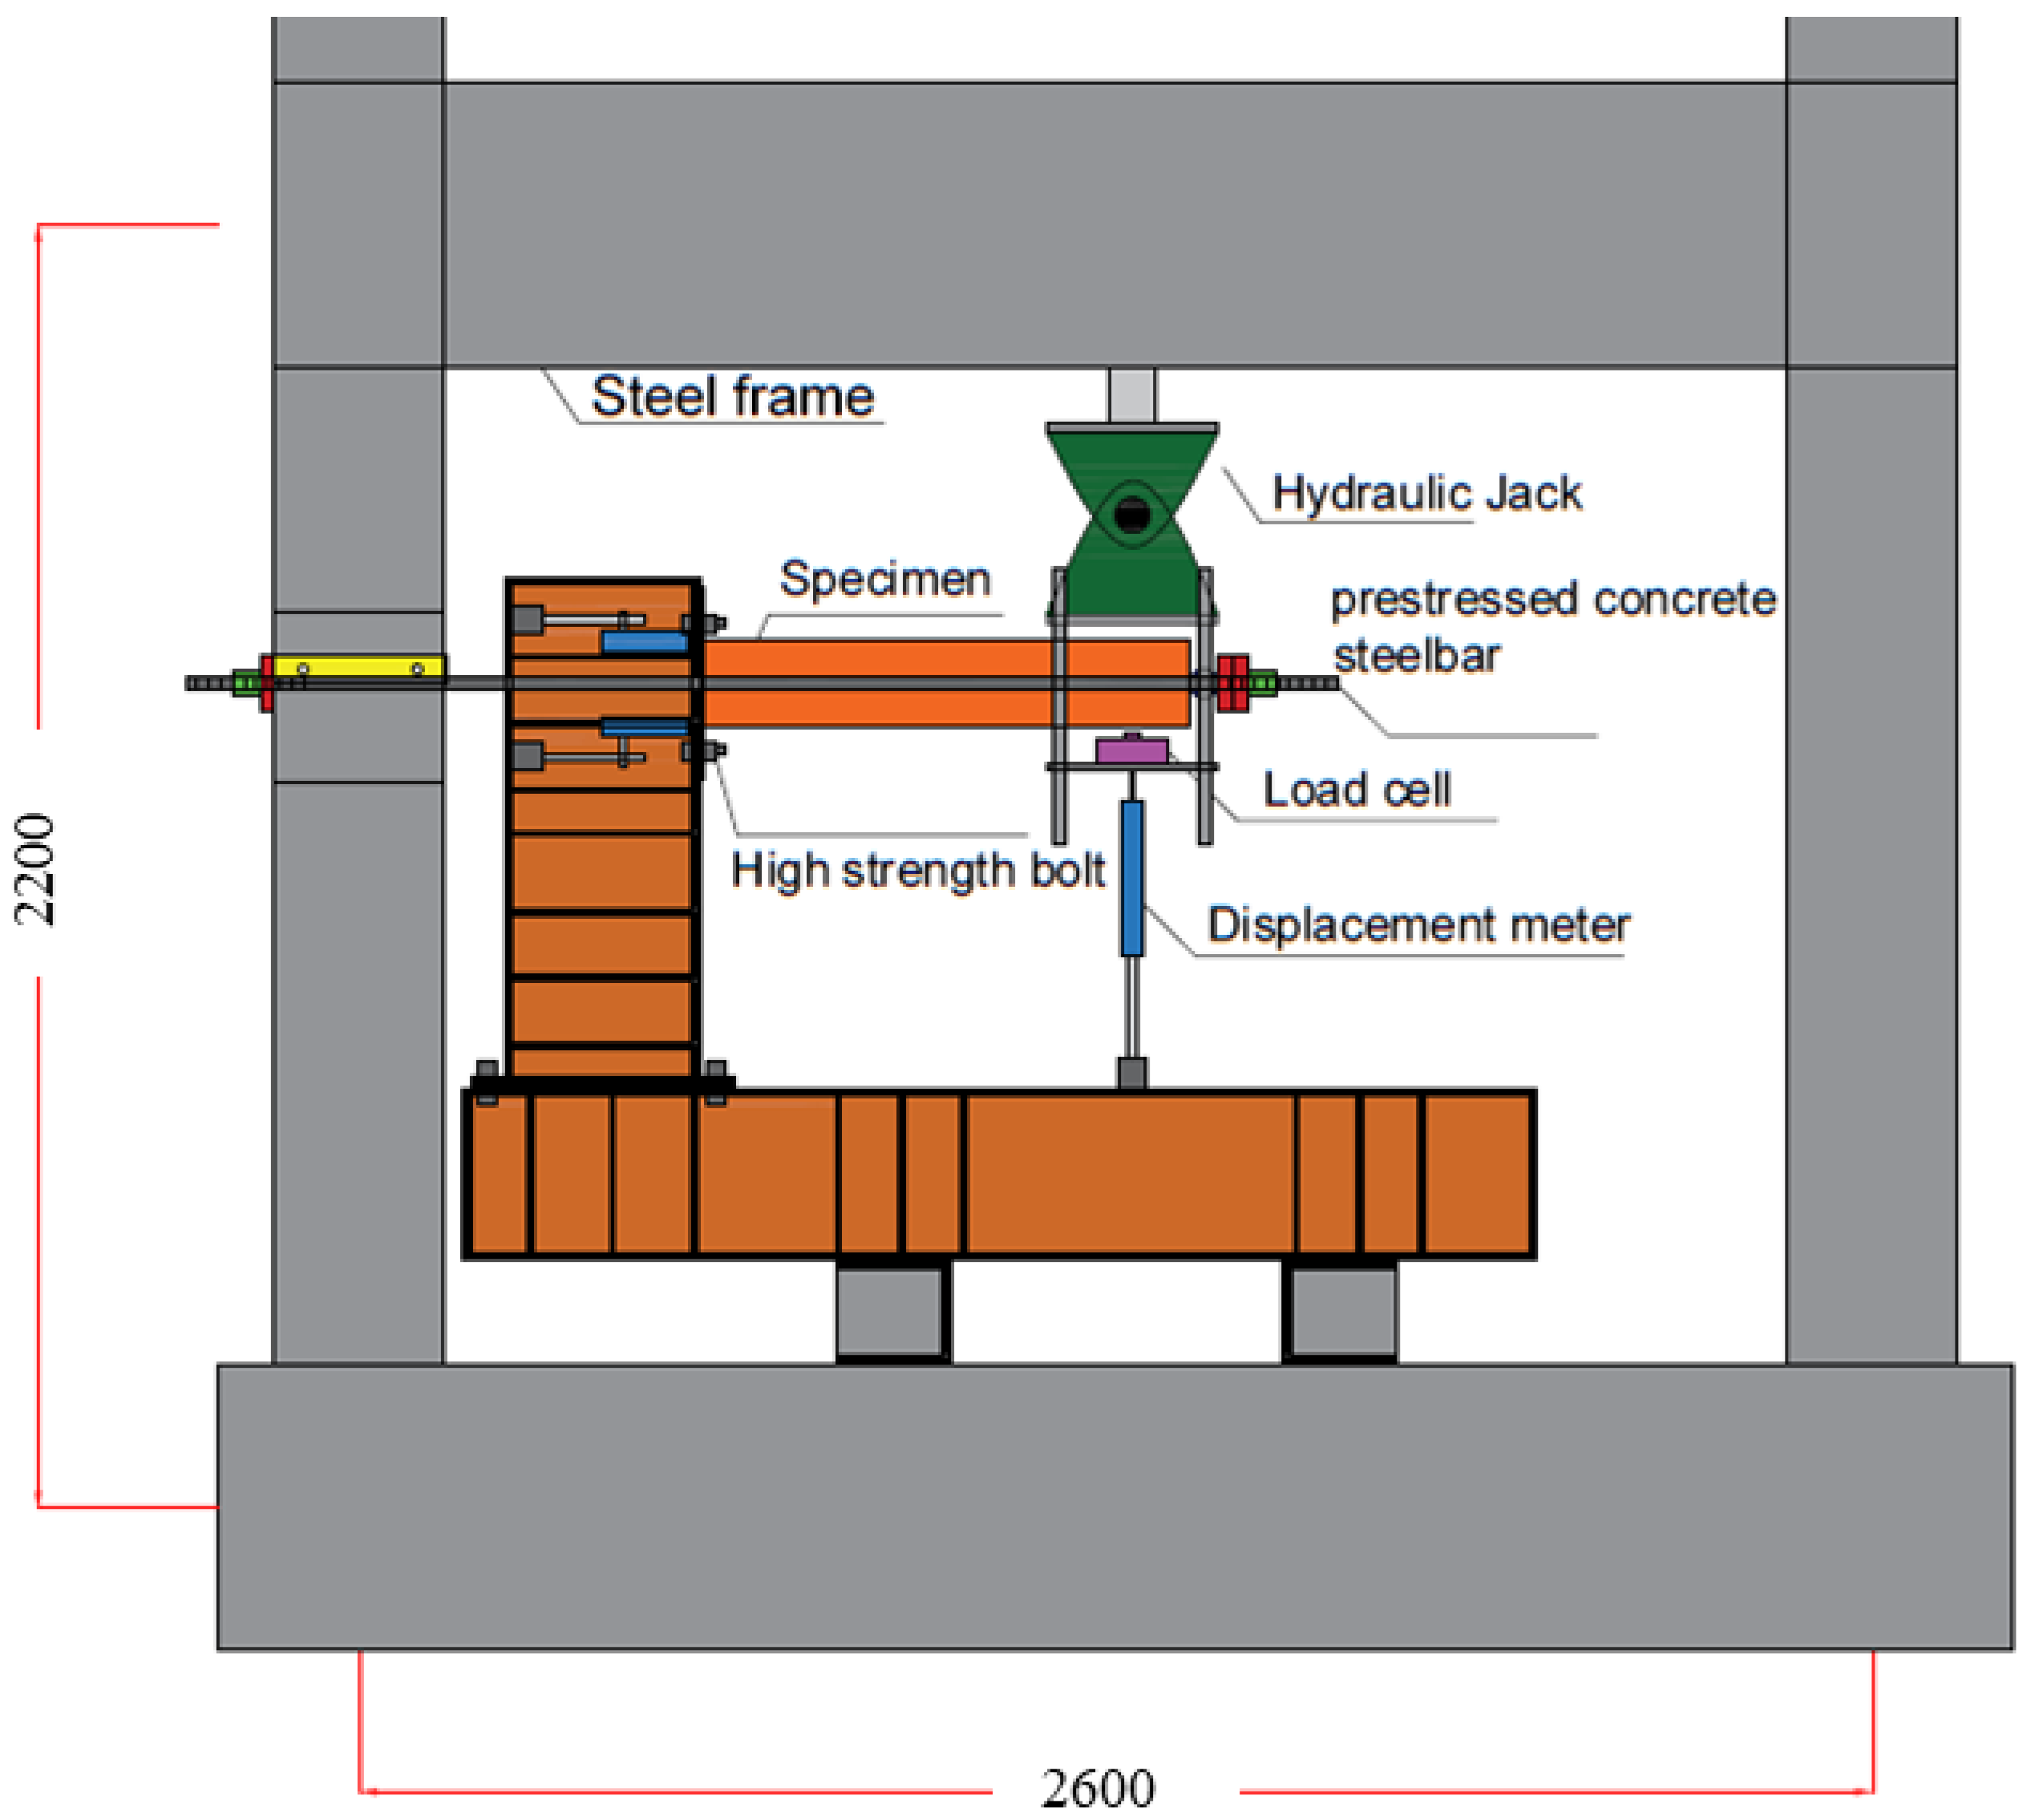
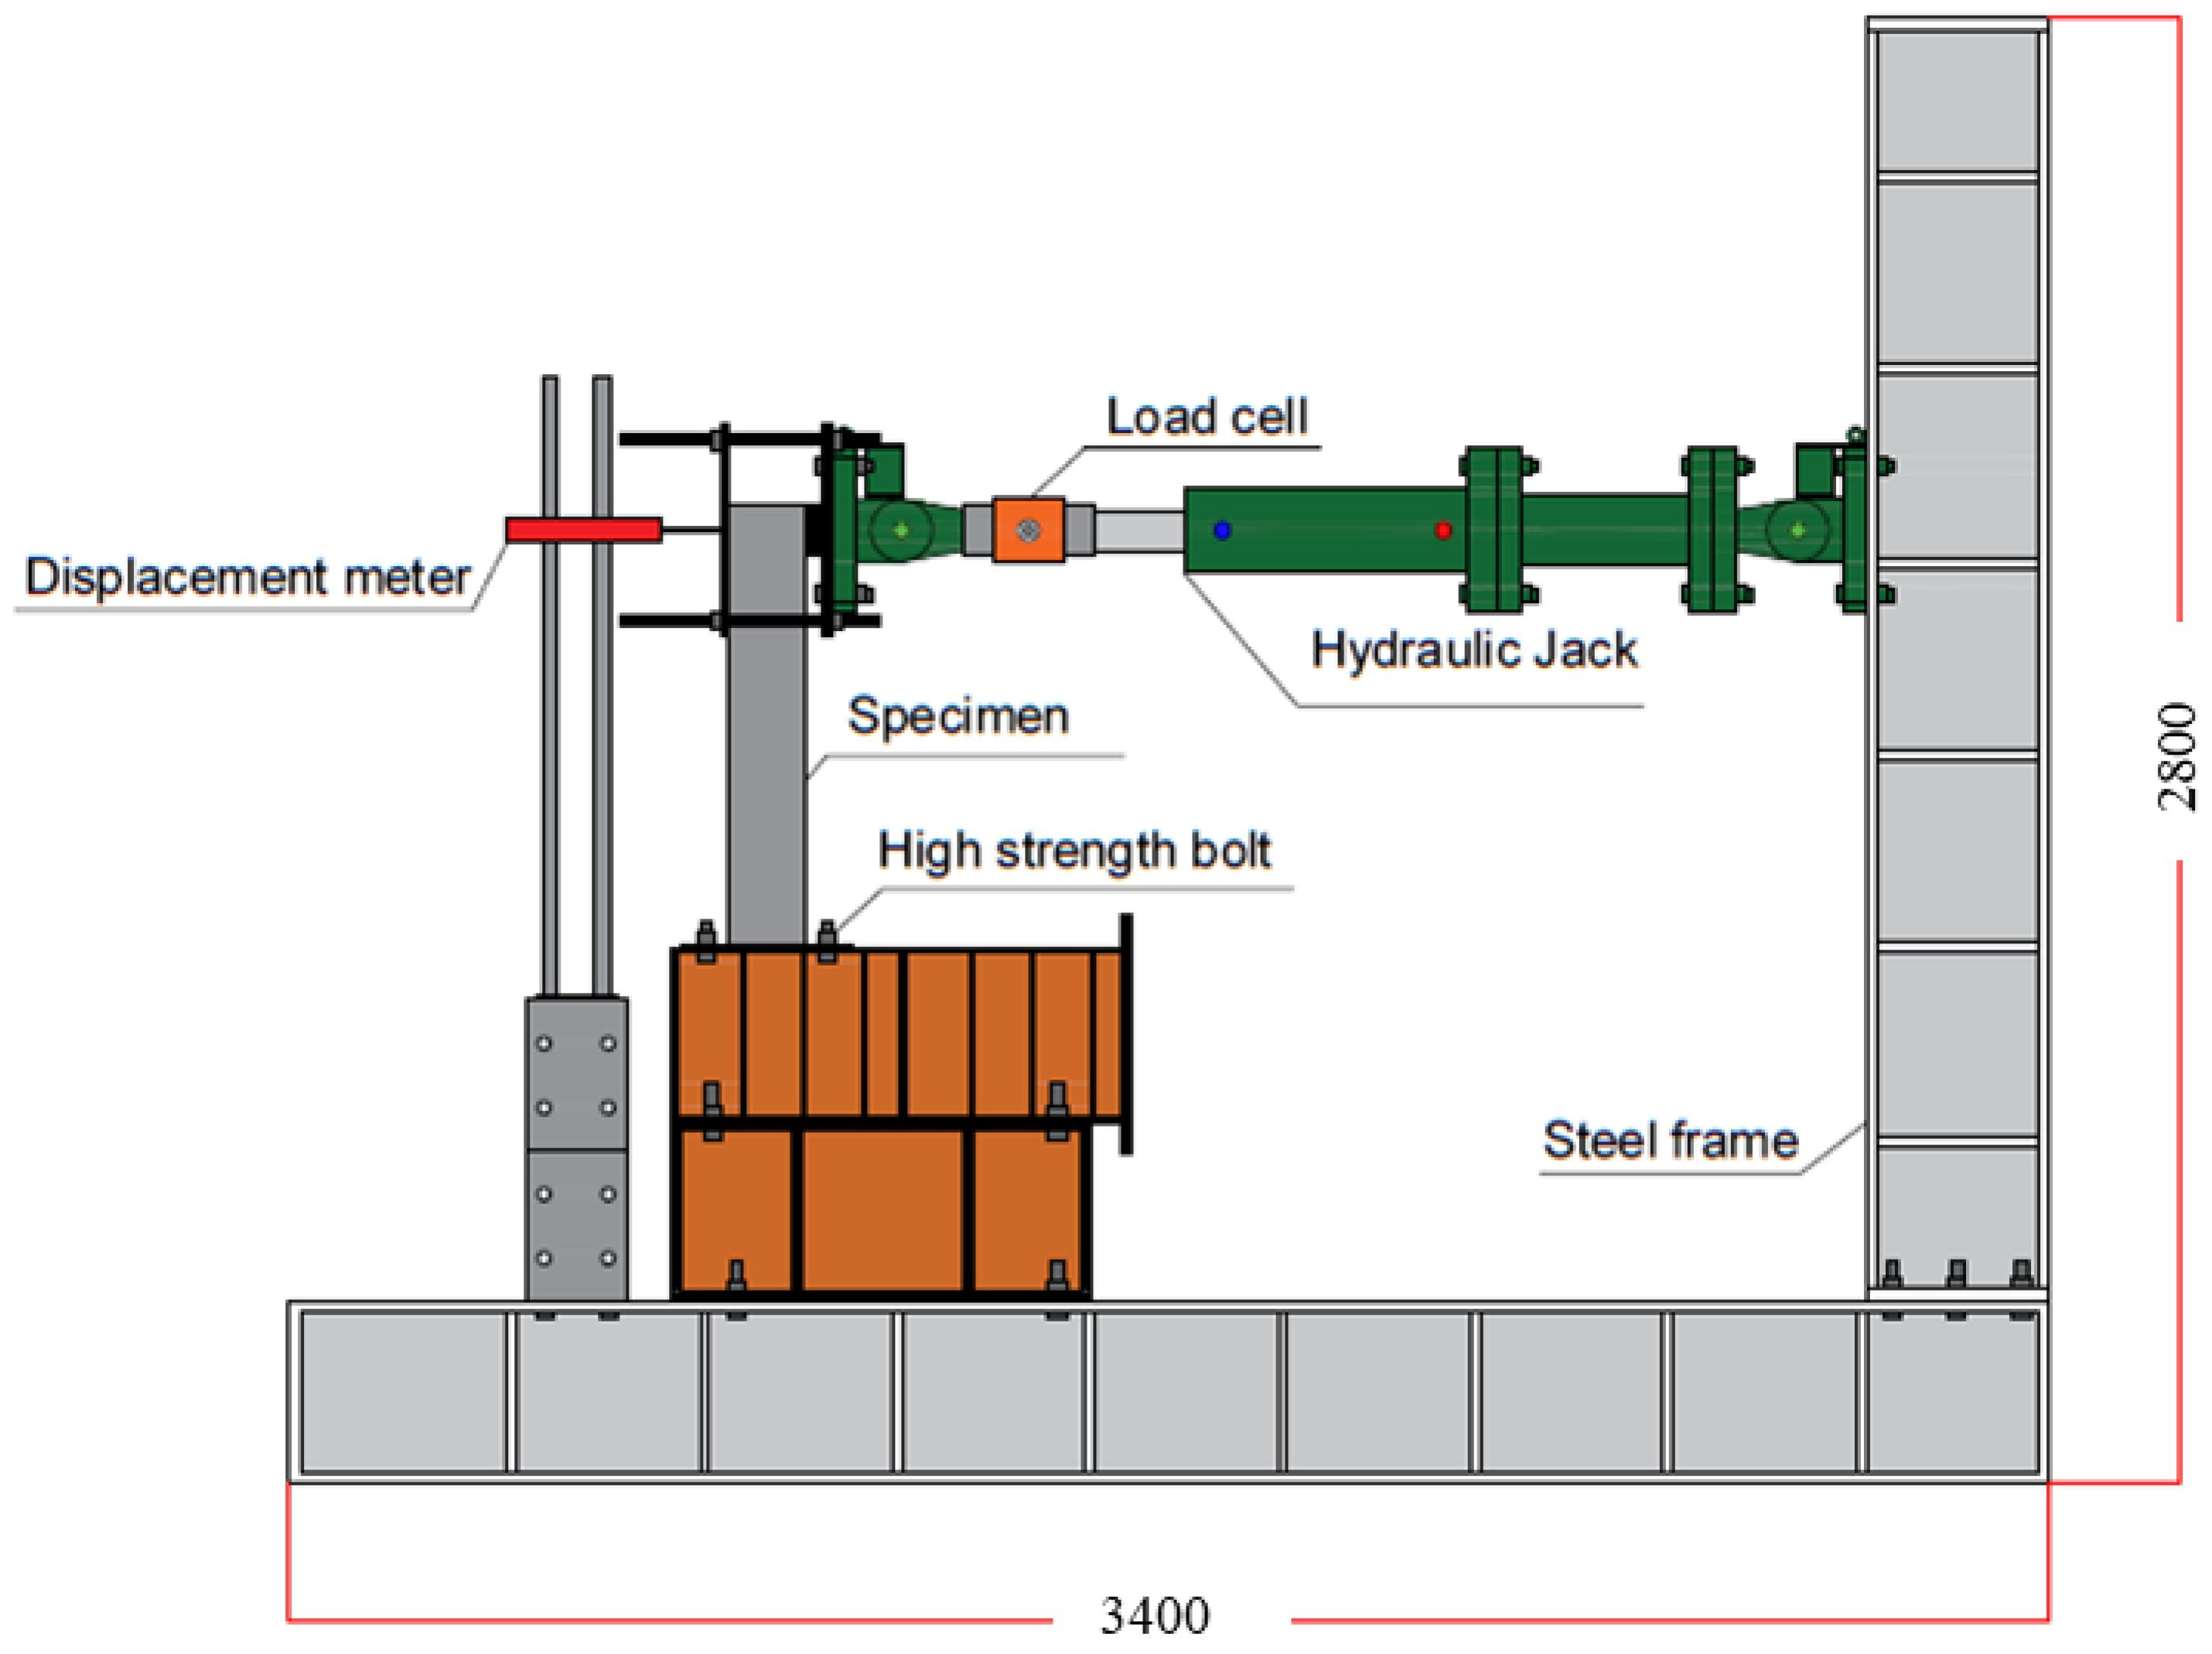
The tests were conducted with two setups, as shown in Figure 5 and Figure 6. The foundation of the specimen was not concrete but steel because the test focused on out-of-plane deformation of the base plate by using a rigid steel foundation.
The equipment for setup 1 consisted of a 100 kN capacity hydraulic jack, an SS400 steel frame, and a 200 kN capacity load cell. An axial force was applied by introducing tensile forces to two PC steel rods set longitudinally. Tensile strain was measured with strain gauges glued on the PC steel rods. The equipment for setup 2 consisted of a 300 kN capacity double-acting hydraulic jack. An axial force was not applied. All the specimens were set to rigid foundations with four M20 high-strength bolts.
The axial force of the S1 and S2 specimens was introduced from the top of the column by tightening the PC steel rods. The value of the axial force was 50 kN. In setup 1, the lateral force was applied at a height of 760 mm, and at a height of 810 mm in setup 2. Cyclic loadings were carried out under displacement control obtained with an LVST (linear variable differential transformer) at the loading point. The drift angles of the columns of 0.01, 0.02, 0.03, and 0.05 rad were applied twice in each step.

2.3. Test Results and Discussion

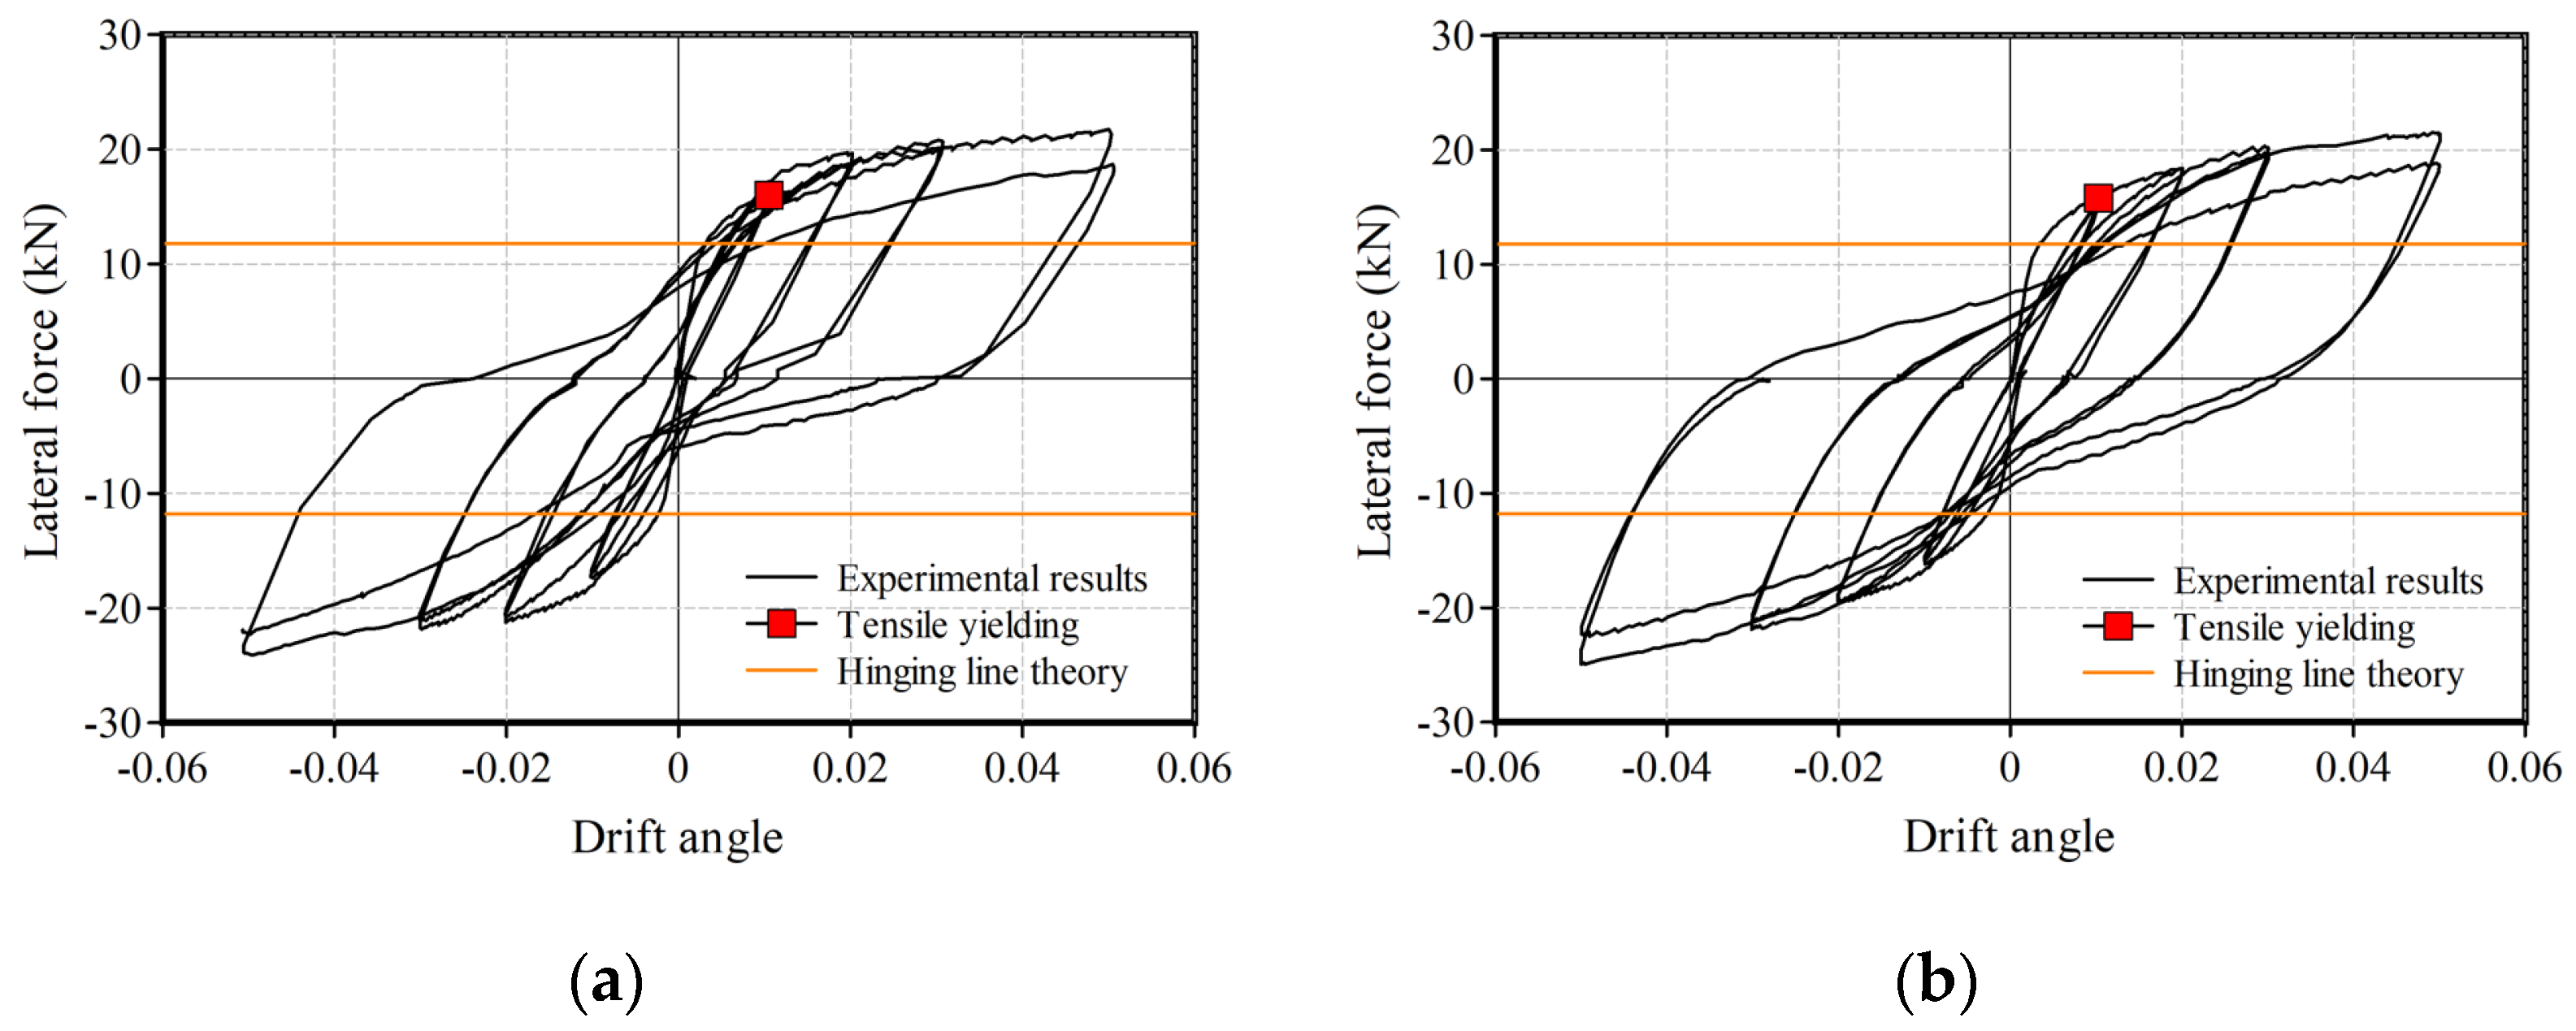
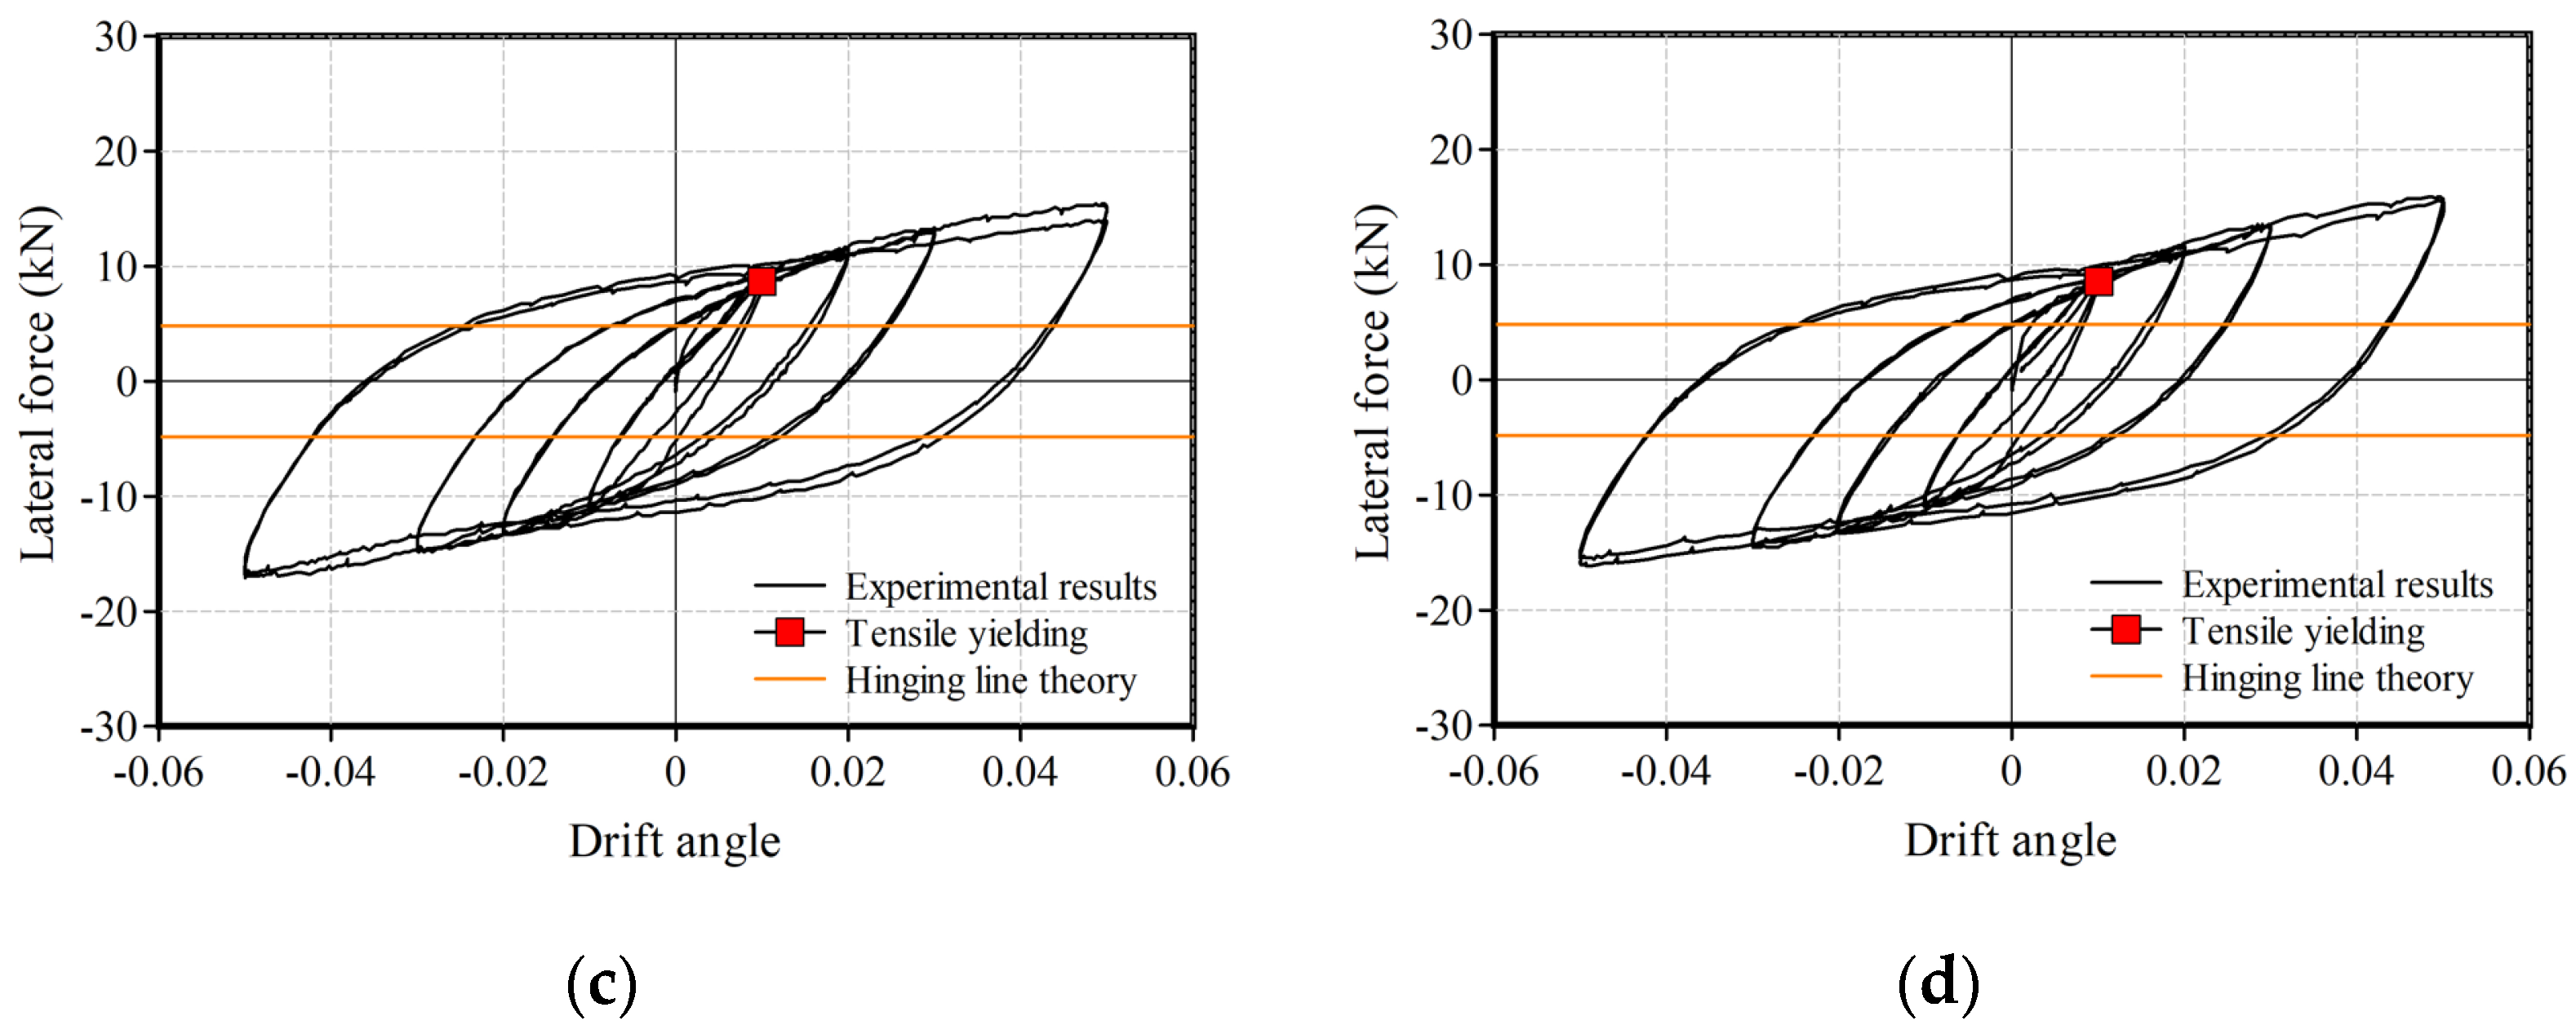
The test results of lateral force versus drift angle are shown in Figure 7, where the restoring force characteristics are stable even at the drift angle of 0.05 rad. The energy absorption capacities were maintained when the base plates were thin, 6 mm and 5.6 mm. After the loading tests, plastic deformations were observed only in the base plates, with no residual deformations in the bolts or the columns.
The lateral force corresponding to the yield strength and the full plastic strength of the steel tube of S1 and S2 were 56.4 kN and 84.7 kN, respectively. Those of the steel tubes of S3 and S4 were 43.6 kN and 65.4 kN, respectively. These values were sufficiently larger than the yielding strength of the base plates.
There are two declining points in the load–deformation curves in Figure 7. Stiffness obviously declined at drift angle R of around 0.002 rad and 0.01 rad. The first was due to out-of-plane deformation of the base plate and the second was due to the tensile yielding of the base plate.
The strength of the base plates calculated using the theory of the yield hinging lines was 11.8 kN for the S1 and S2 specimens and 4.81 kN for the S3 and S4 specimens. These are shown as orange lines in Figure 7. At the early stage of the loading, the base plate started plastic bending at around R = 0.002 rad, the strength of which was estimated using the hinging line method. The hinging line theory tends to underestimate the second yielding points of the test results. The authors proposed the calculating method to estimate the second yielding strength of the test accurately.

2.4. Discussion of the Deformation of the Base Plates

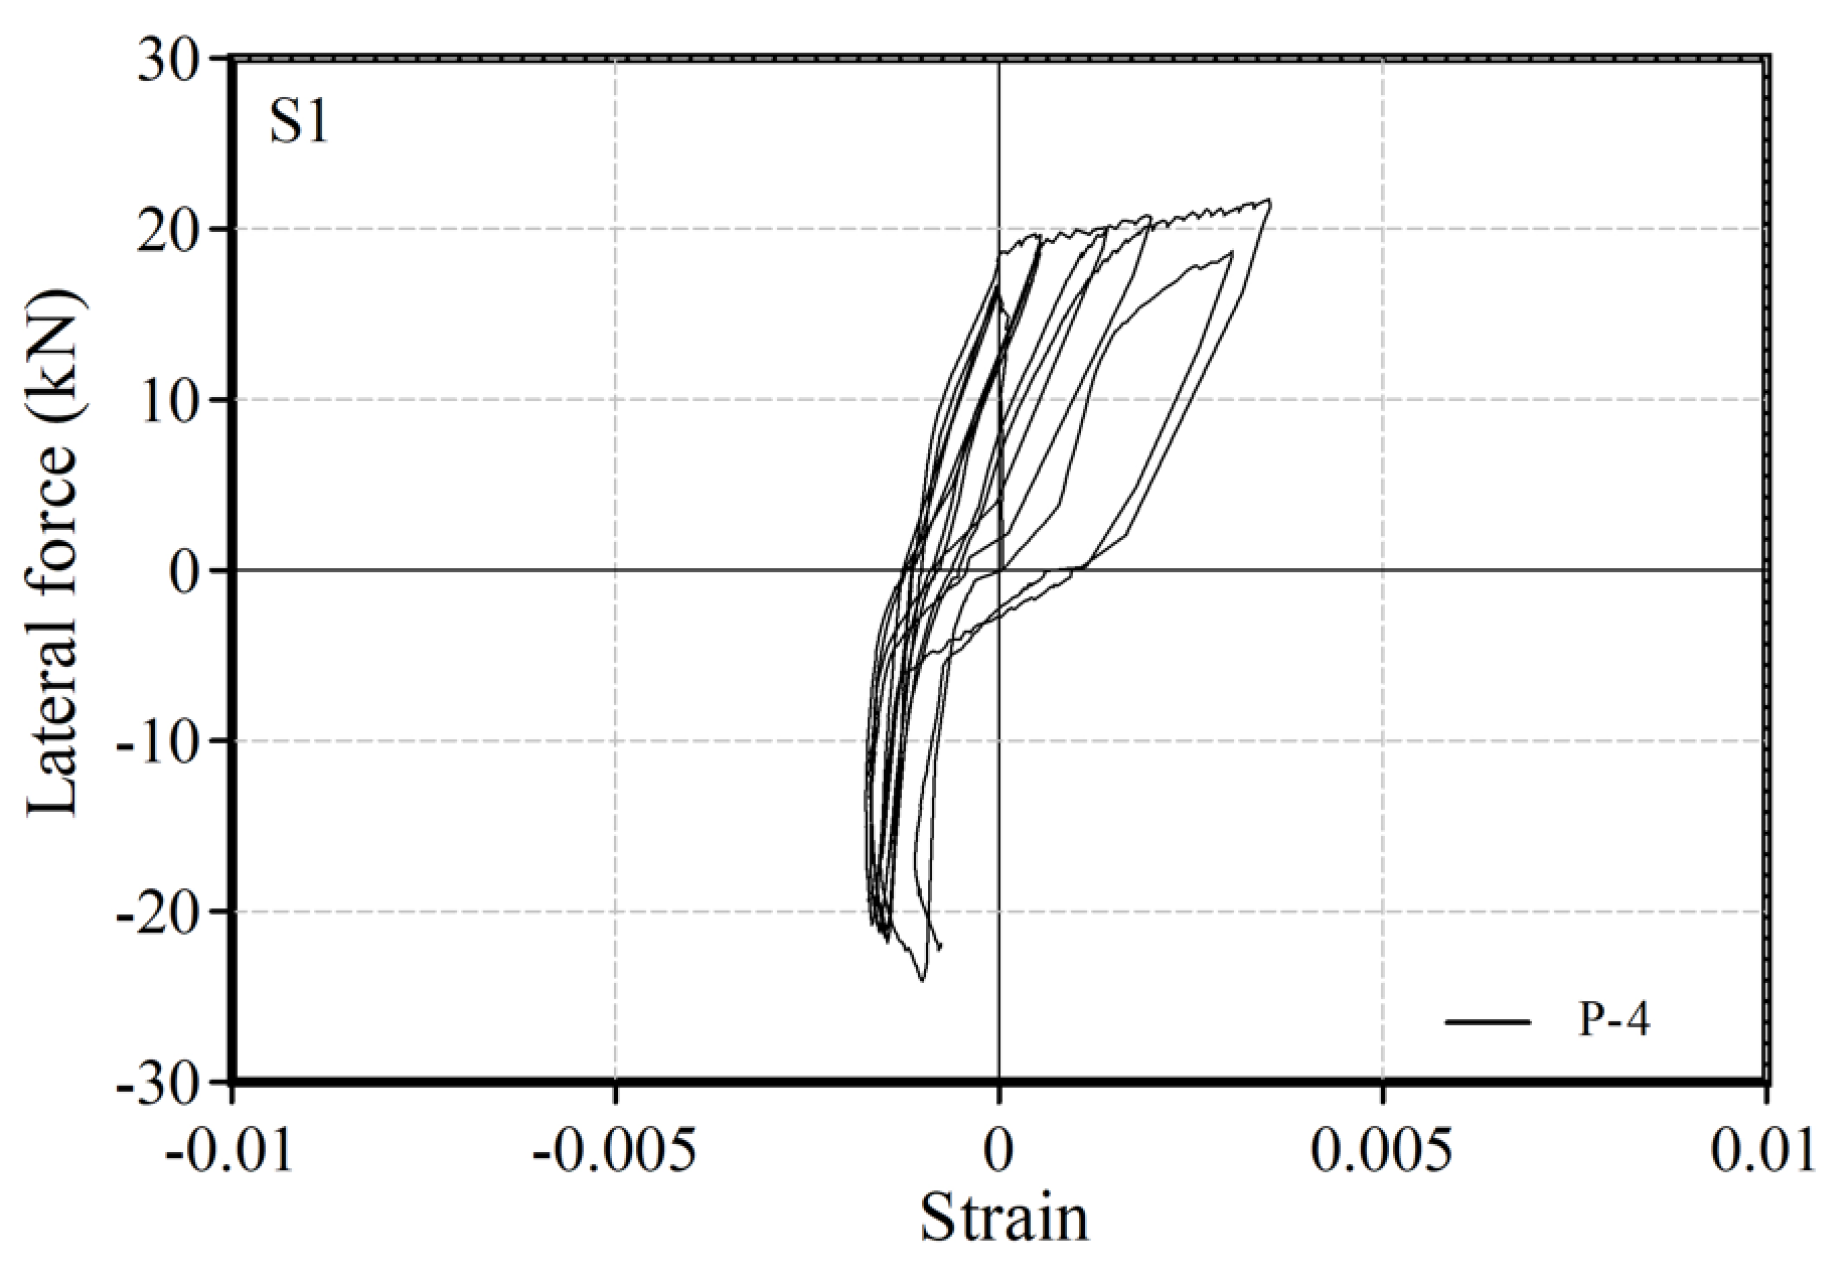
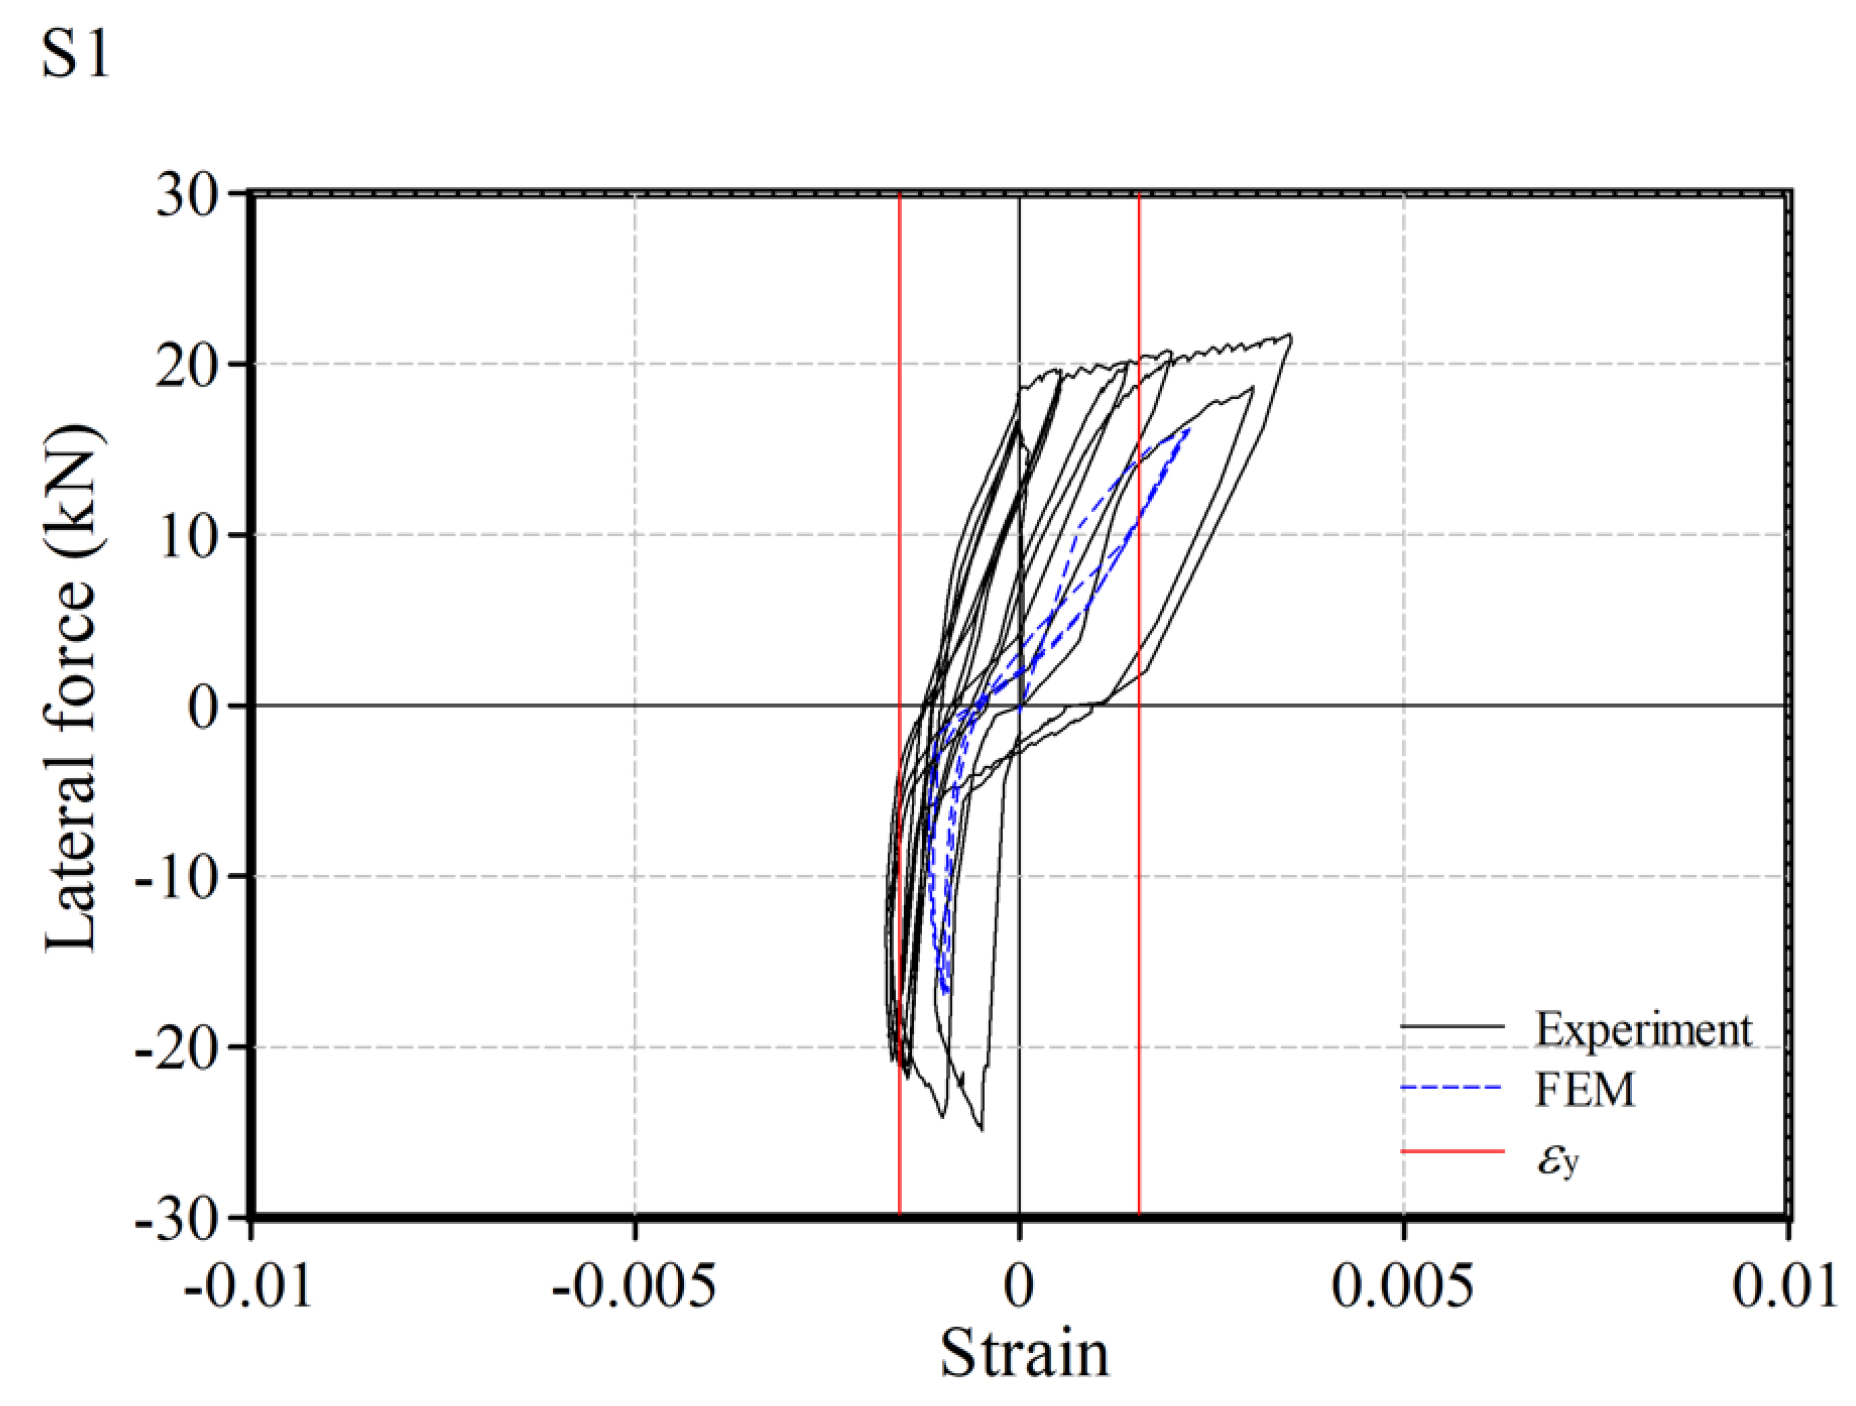
One example of strain at the local point of P-4 on the base plate of specimen S1 is shown in Figure 8. Strain elongation was greater than the shrinkage. This indicates that the strain energy of the base plate under the tensile force must be considered to estimate the strength. The authors focused on the tensile yielding points of the base plates to evaluate the strength of exposed column bases. The yield point of all the specimens was determined at the drift angle of 0.01 rad as explained later.

2.5. Study of the Equivalent Viscous Damping Ratio

The value of the equivalent viscous damping ratio (heq) based on the load–deformation relationship of the test is useful to estimate the energy absorption capacity. Figure 9 shows the hysteresis curve of the S1 specimen in the first cycle. The examination of the equivalent viscous damping ratio for each cycle is presented in Table 4. It can be observed that the value of heq increased with more cycles. This means that the damping effect of the column base increased with the increase in plastic deformation. The average value of the equivalent viscous damping ratio was 20.7%, which is higher than the value of the damping ratio of 2% in a dynamic response analysis in normal seismic designs.
h e q = 1 4 π Δ W W e
Δ W : A r e a   o f   o n e   c y c l e   o f   t h e   h y s t e r e s i s   l o o p
W e : E l a s t i c   s r a i n   e n e r g y
Figure 9. Hysteresis loop of the test and strain energy.
Buildings 14 03881 g009
Table 4. Equivalent viscous damping ratio for each cycle.
Specimenheq (%)Average heq (%)
0.01 rad0.02 rad0.03 rad0.05 rad
S17.68 13.9 16.4 23.5 15.4 16.020.7
S27.78 14.7 18.8 25.2 16.6
S316.4 23.3 28.7 35.2 25.9 25.5
S415.3 23.5 28.3 33.2 25.1

3. Analysis of the Base Plate

Three-dimensional finite element method (FEM) analysis was performed using software Marc 2023 SE.

3.1. Model and Loading Process

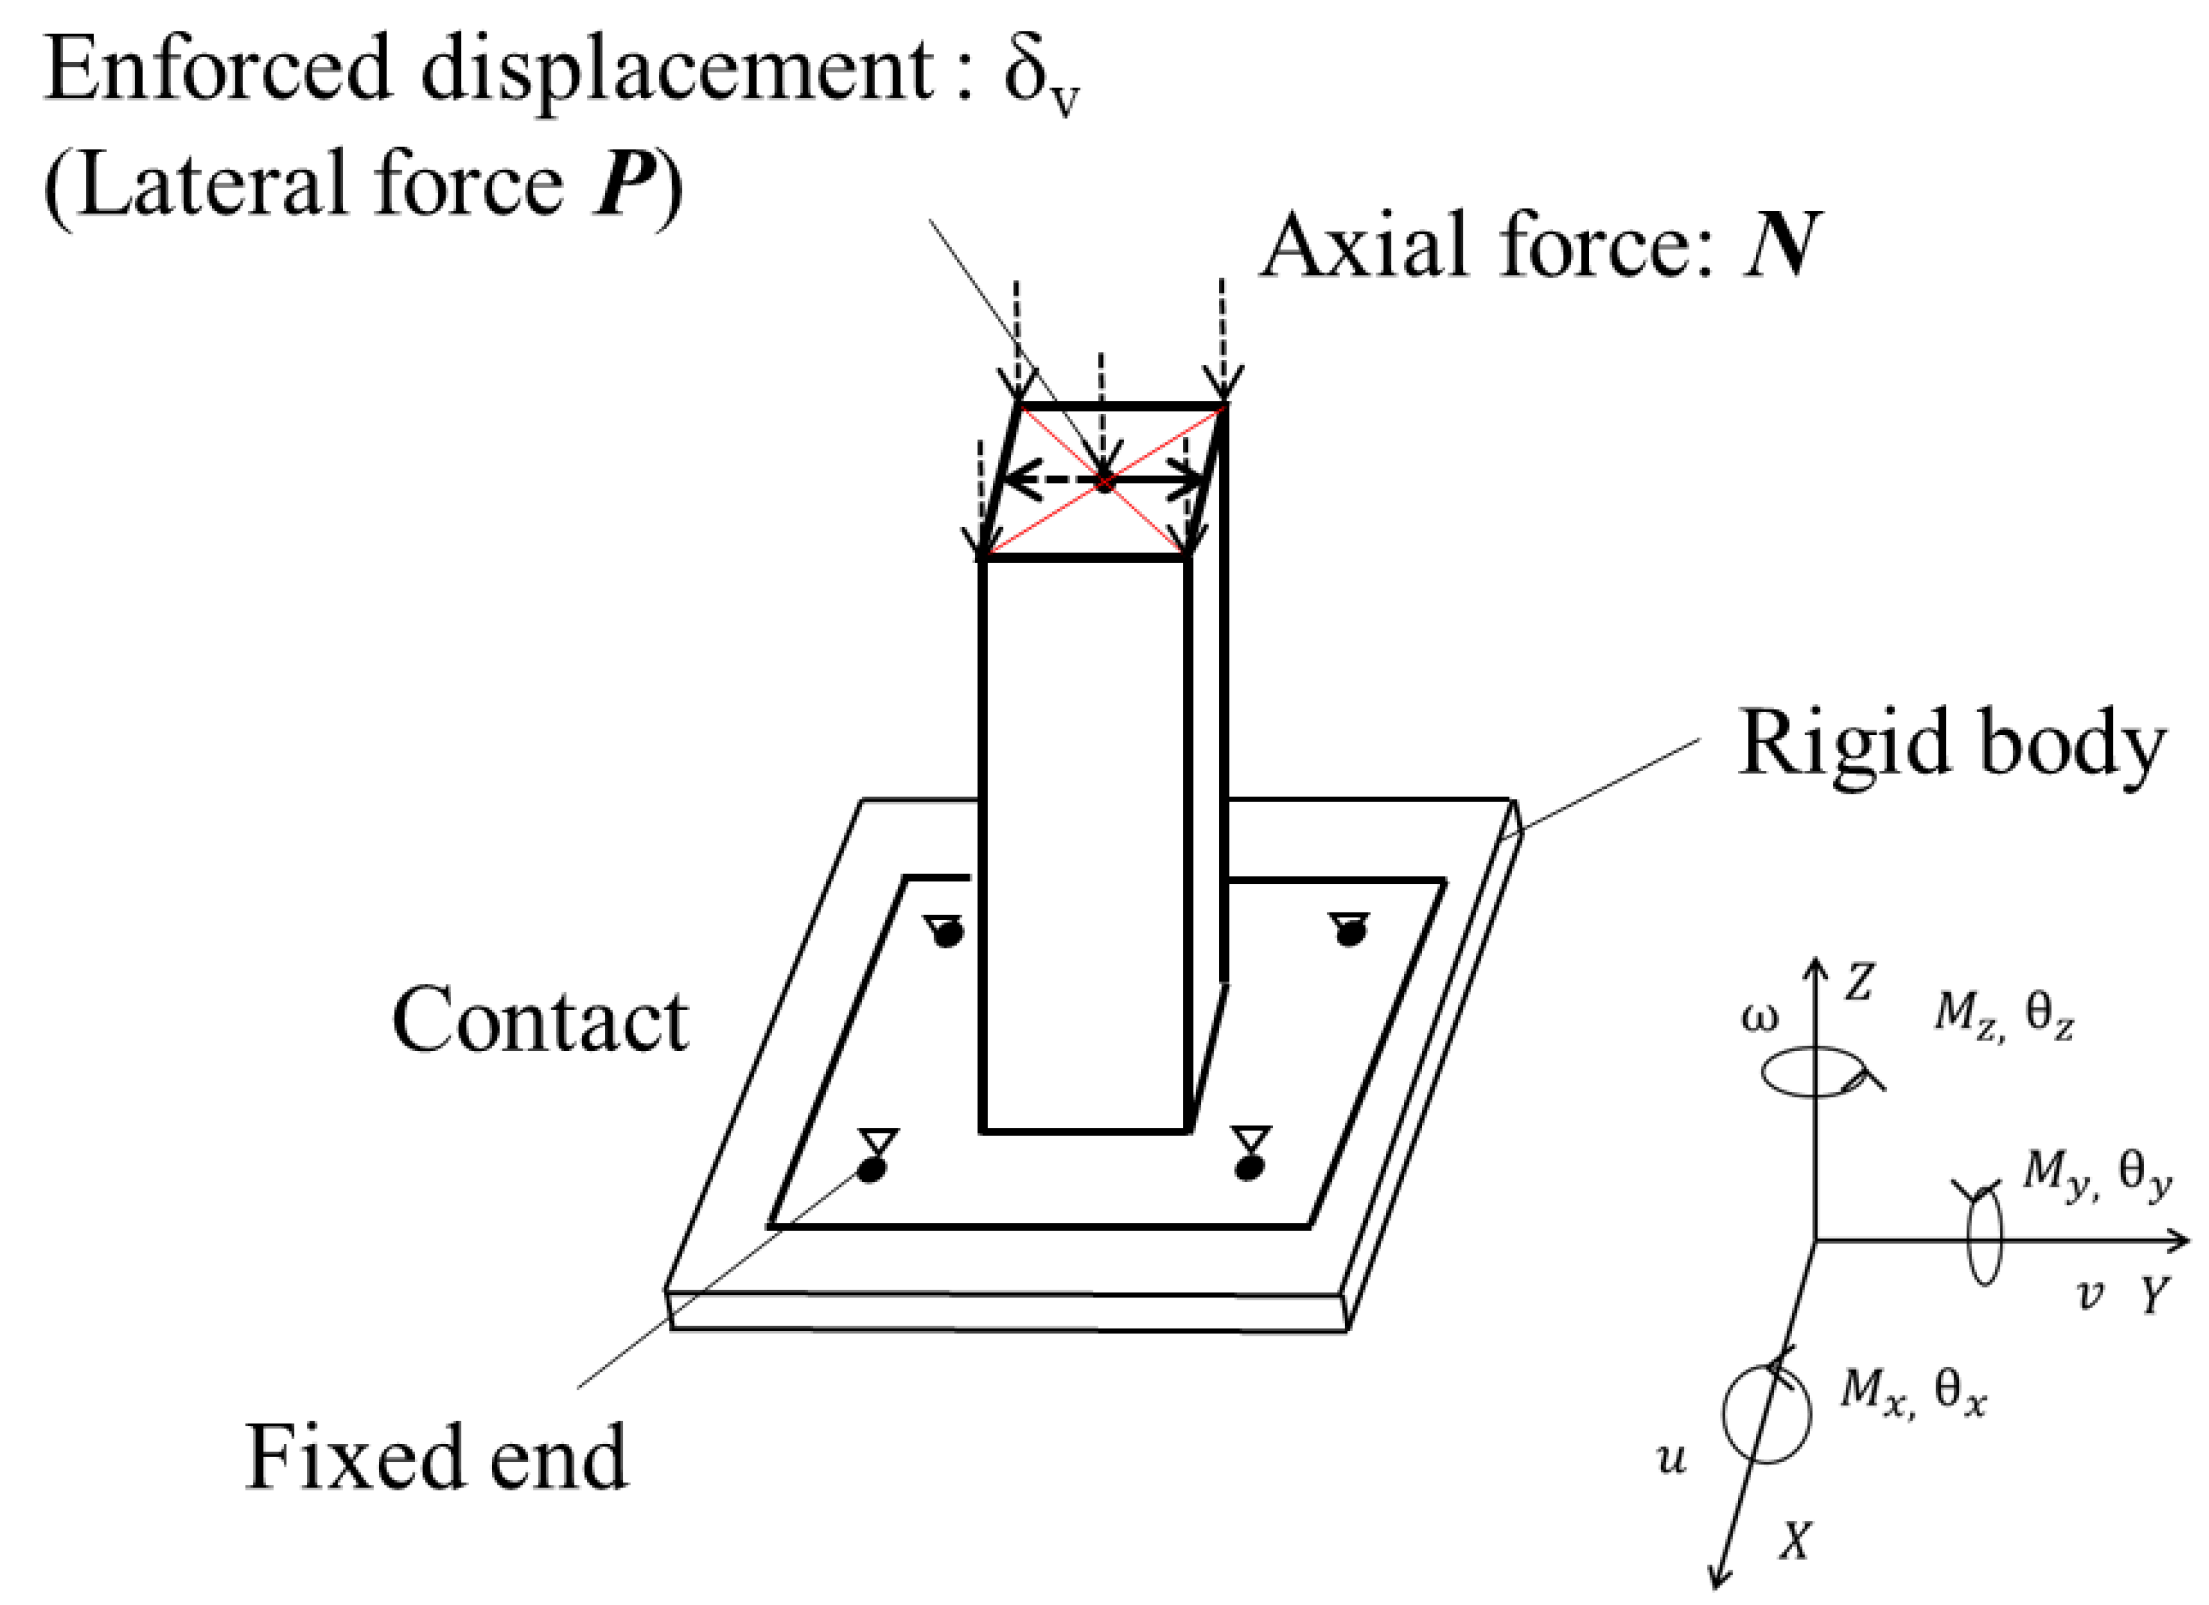
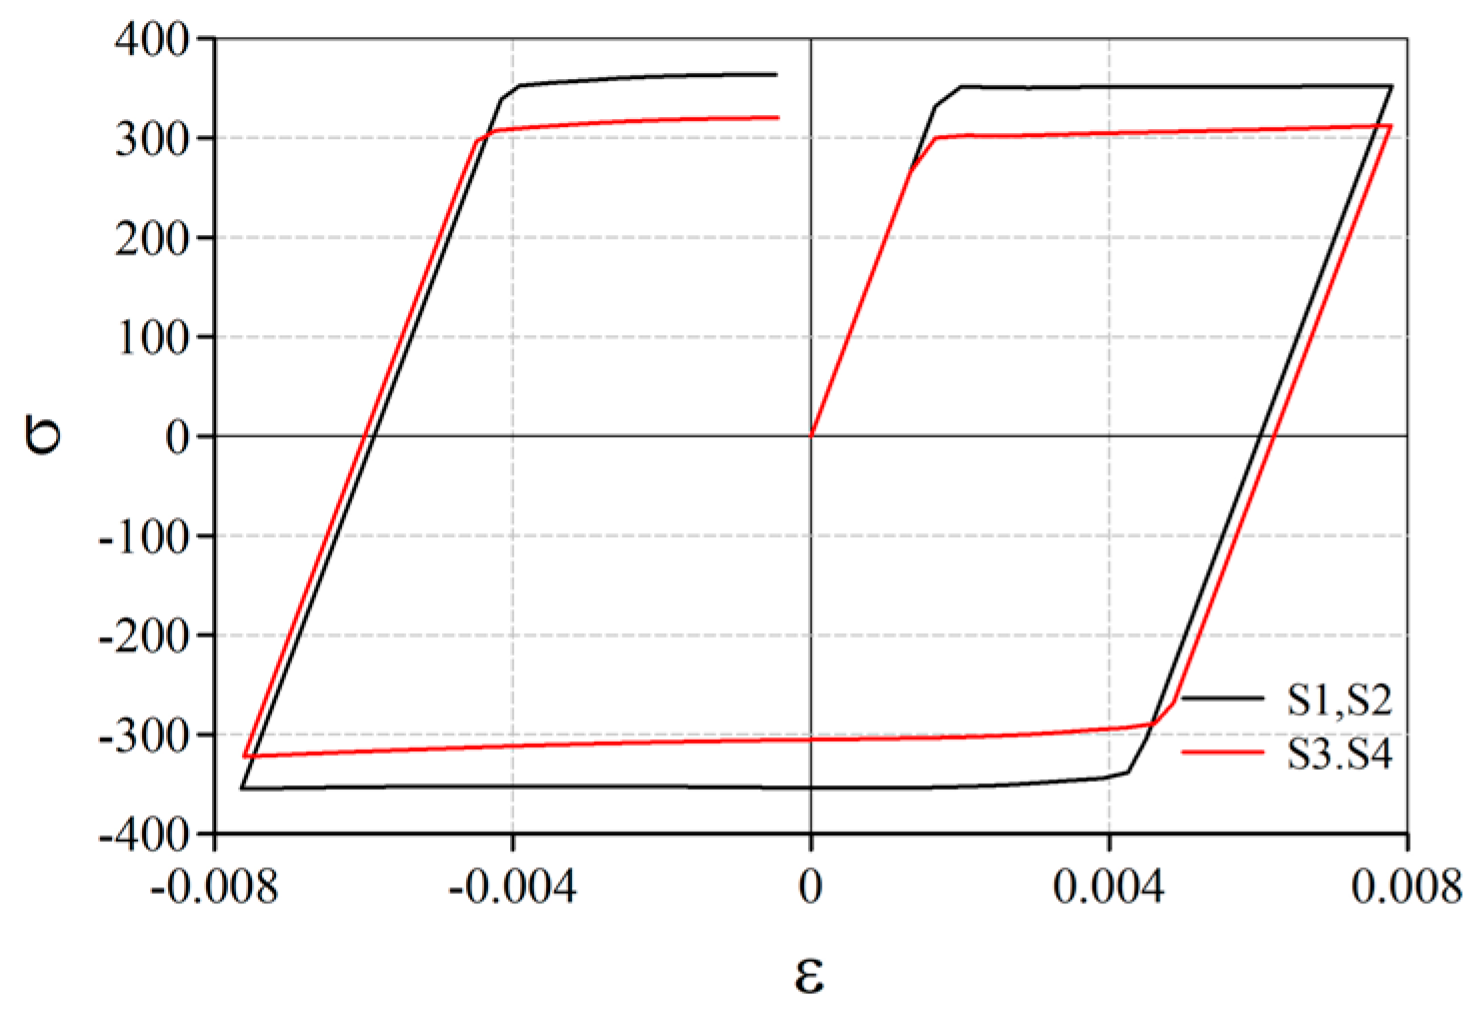
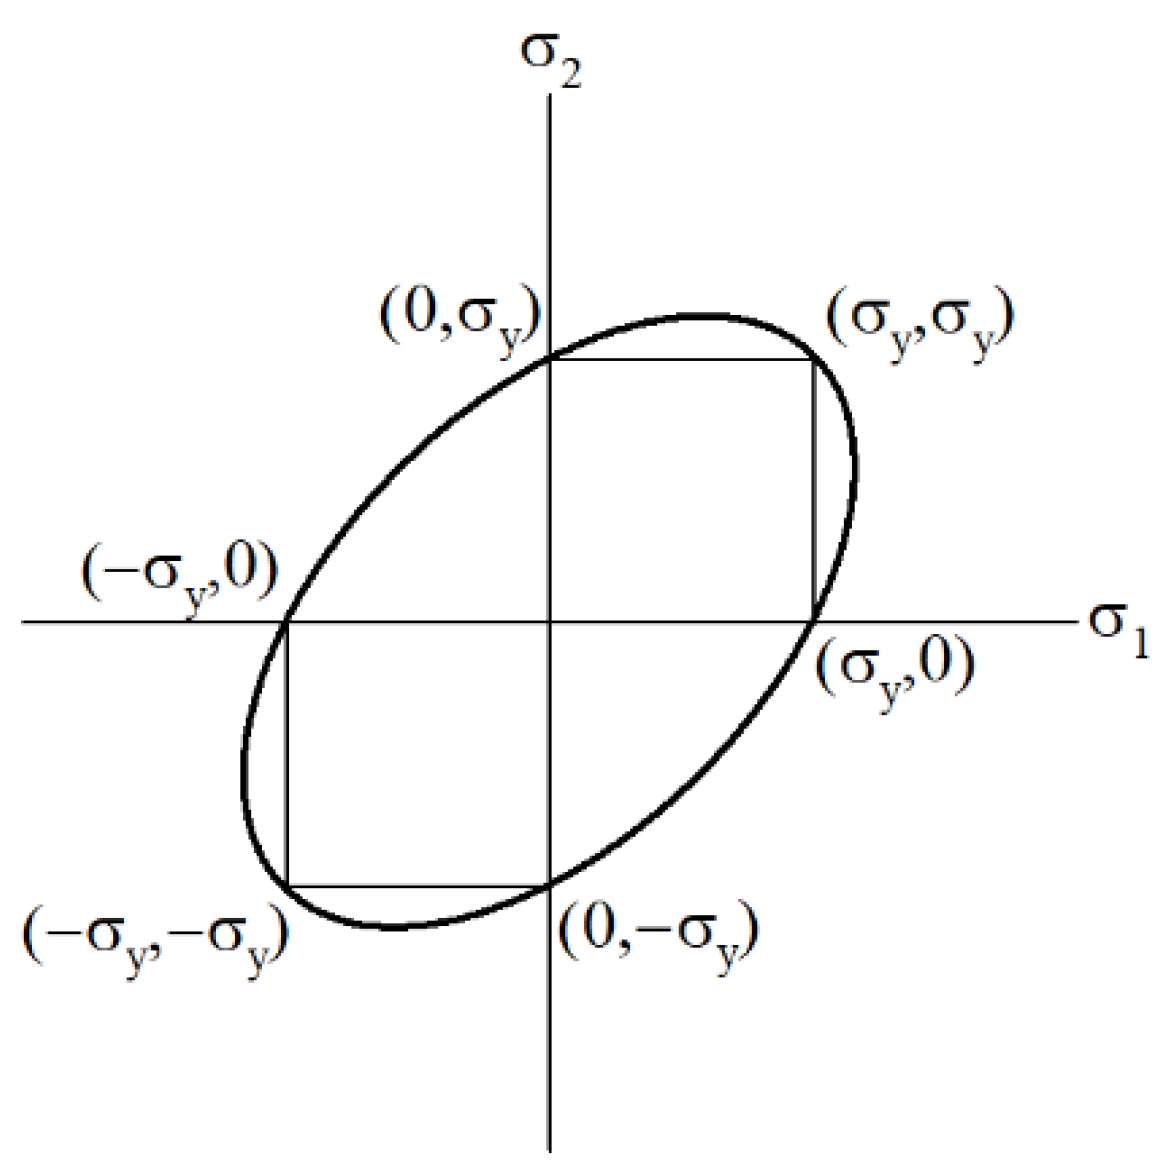
The FEM analysis model is shown in Figure 10. The specimen was touched on the infinite rigid body of the foundation. The base plate was fixed to the rigid body at the points of bolt holes. The axial forces of S1 and S2 were subjected to 50 kN in the Z-axis direction. The lateral force was applied in the y-axis direction under the control of the displacement conducted in the test. The stress–strain relationships shown in Figure 11 were used in the analysis. The values of Young’s modulus and yield strength of the steels were the same as those in Table 2. Poisson’s ratio was 0.3 for the analysis. The von Mises yield criterion shown in Figure 12 was used under the triaxial stress state of the steels.

3.2. Analytical Results and Discussion

The results of the analysis (red lines) are shown in Figure 13, compared to the test results (black lines) within the absolute value of the drift angle of 0.01 rad. The analytical results traced well to the test results.
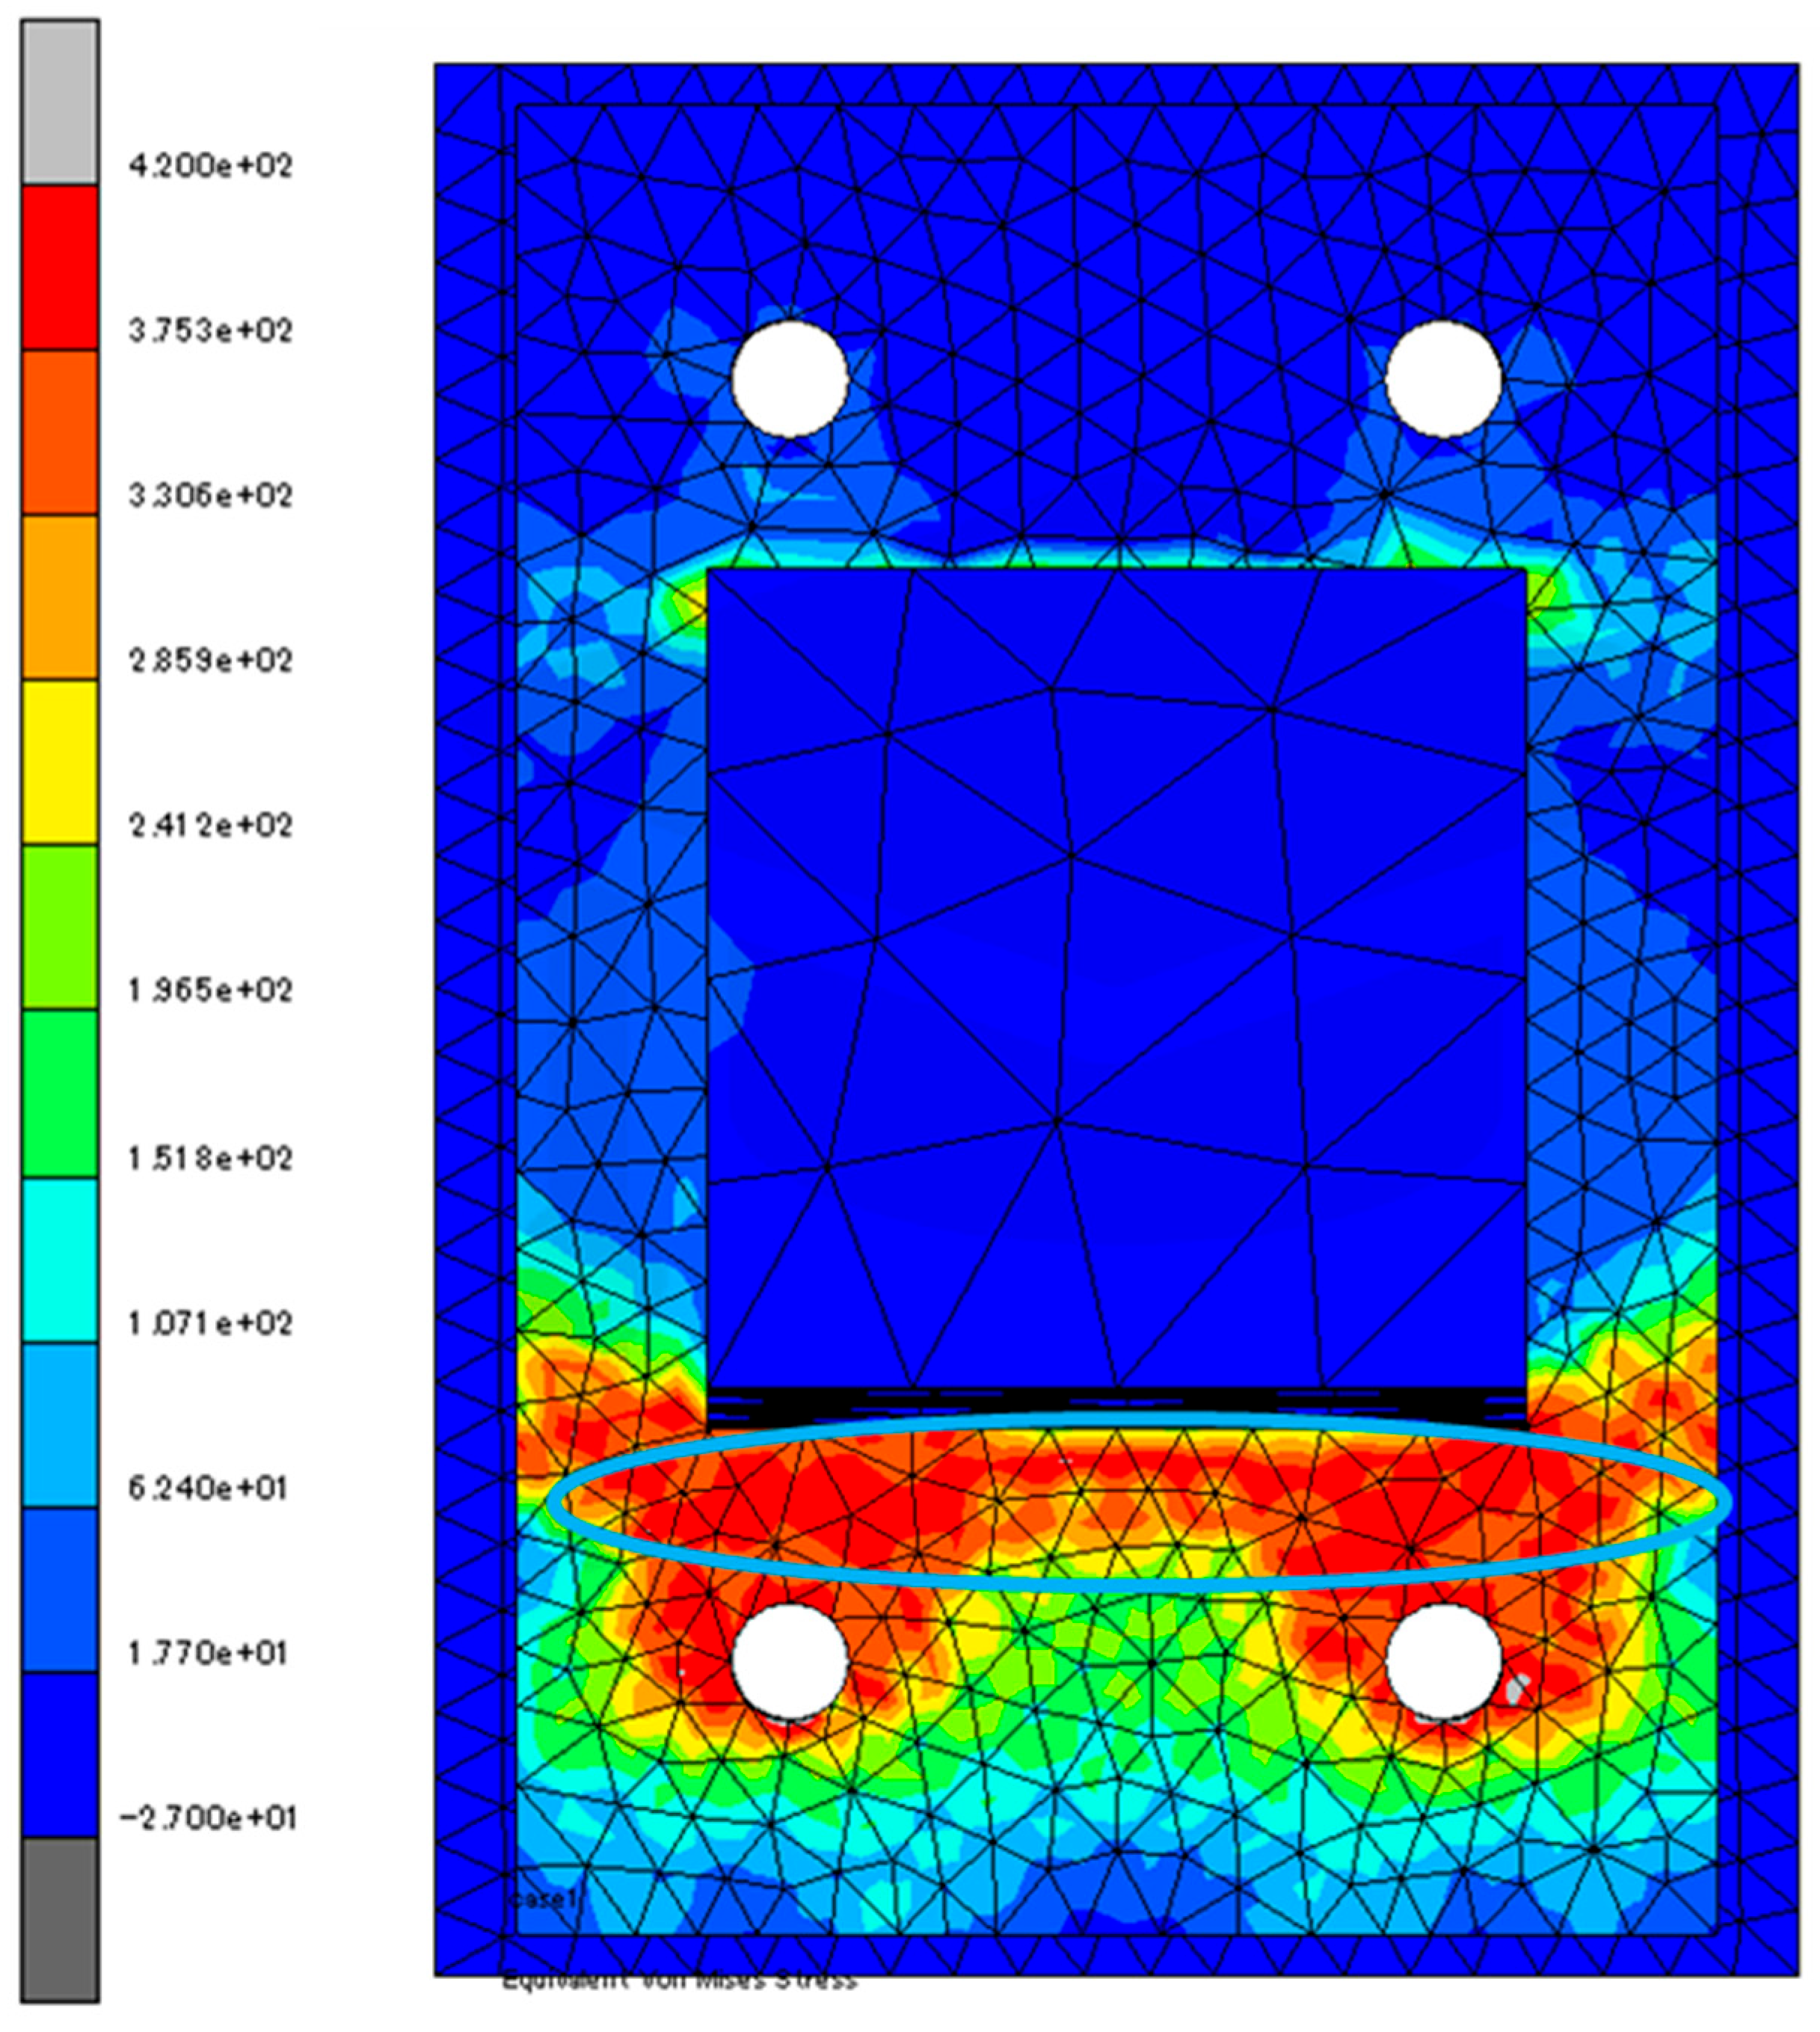
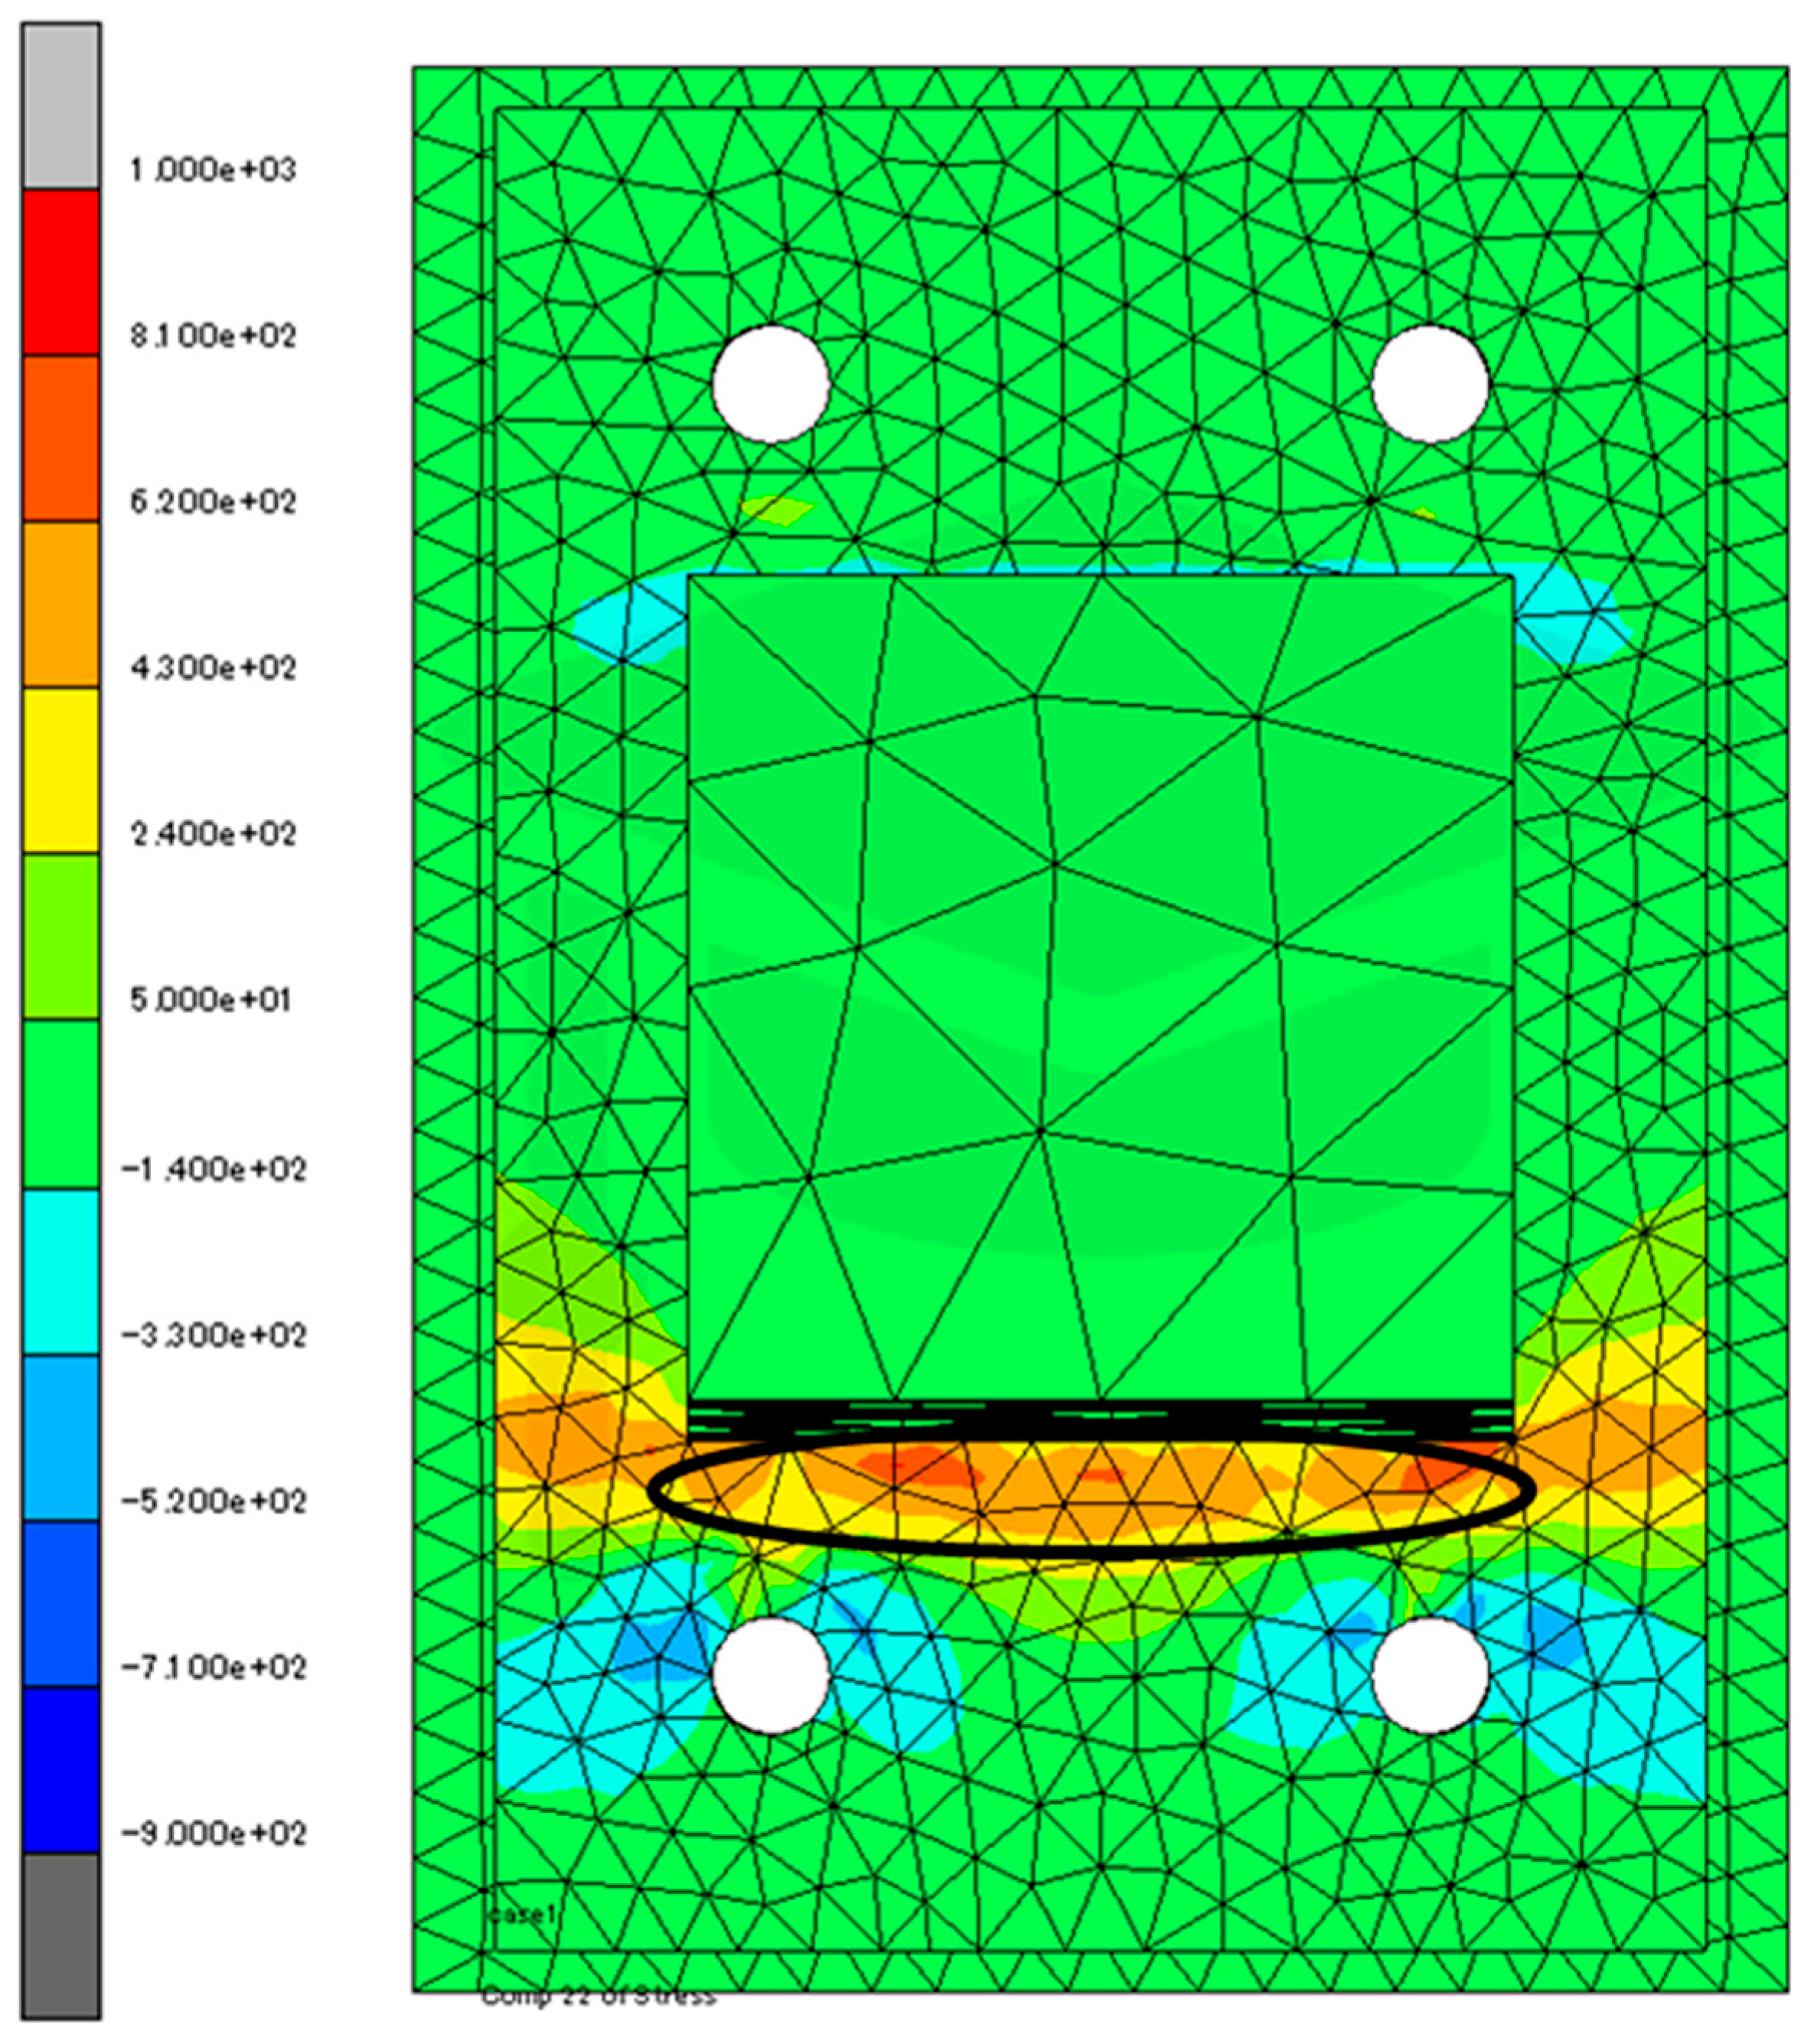
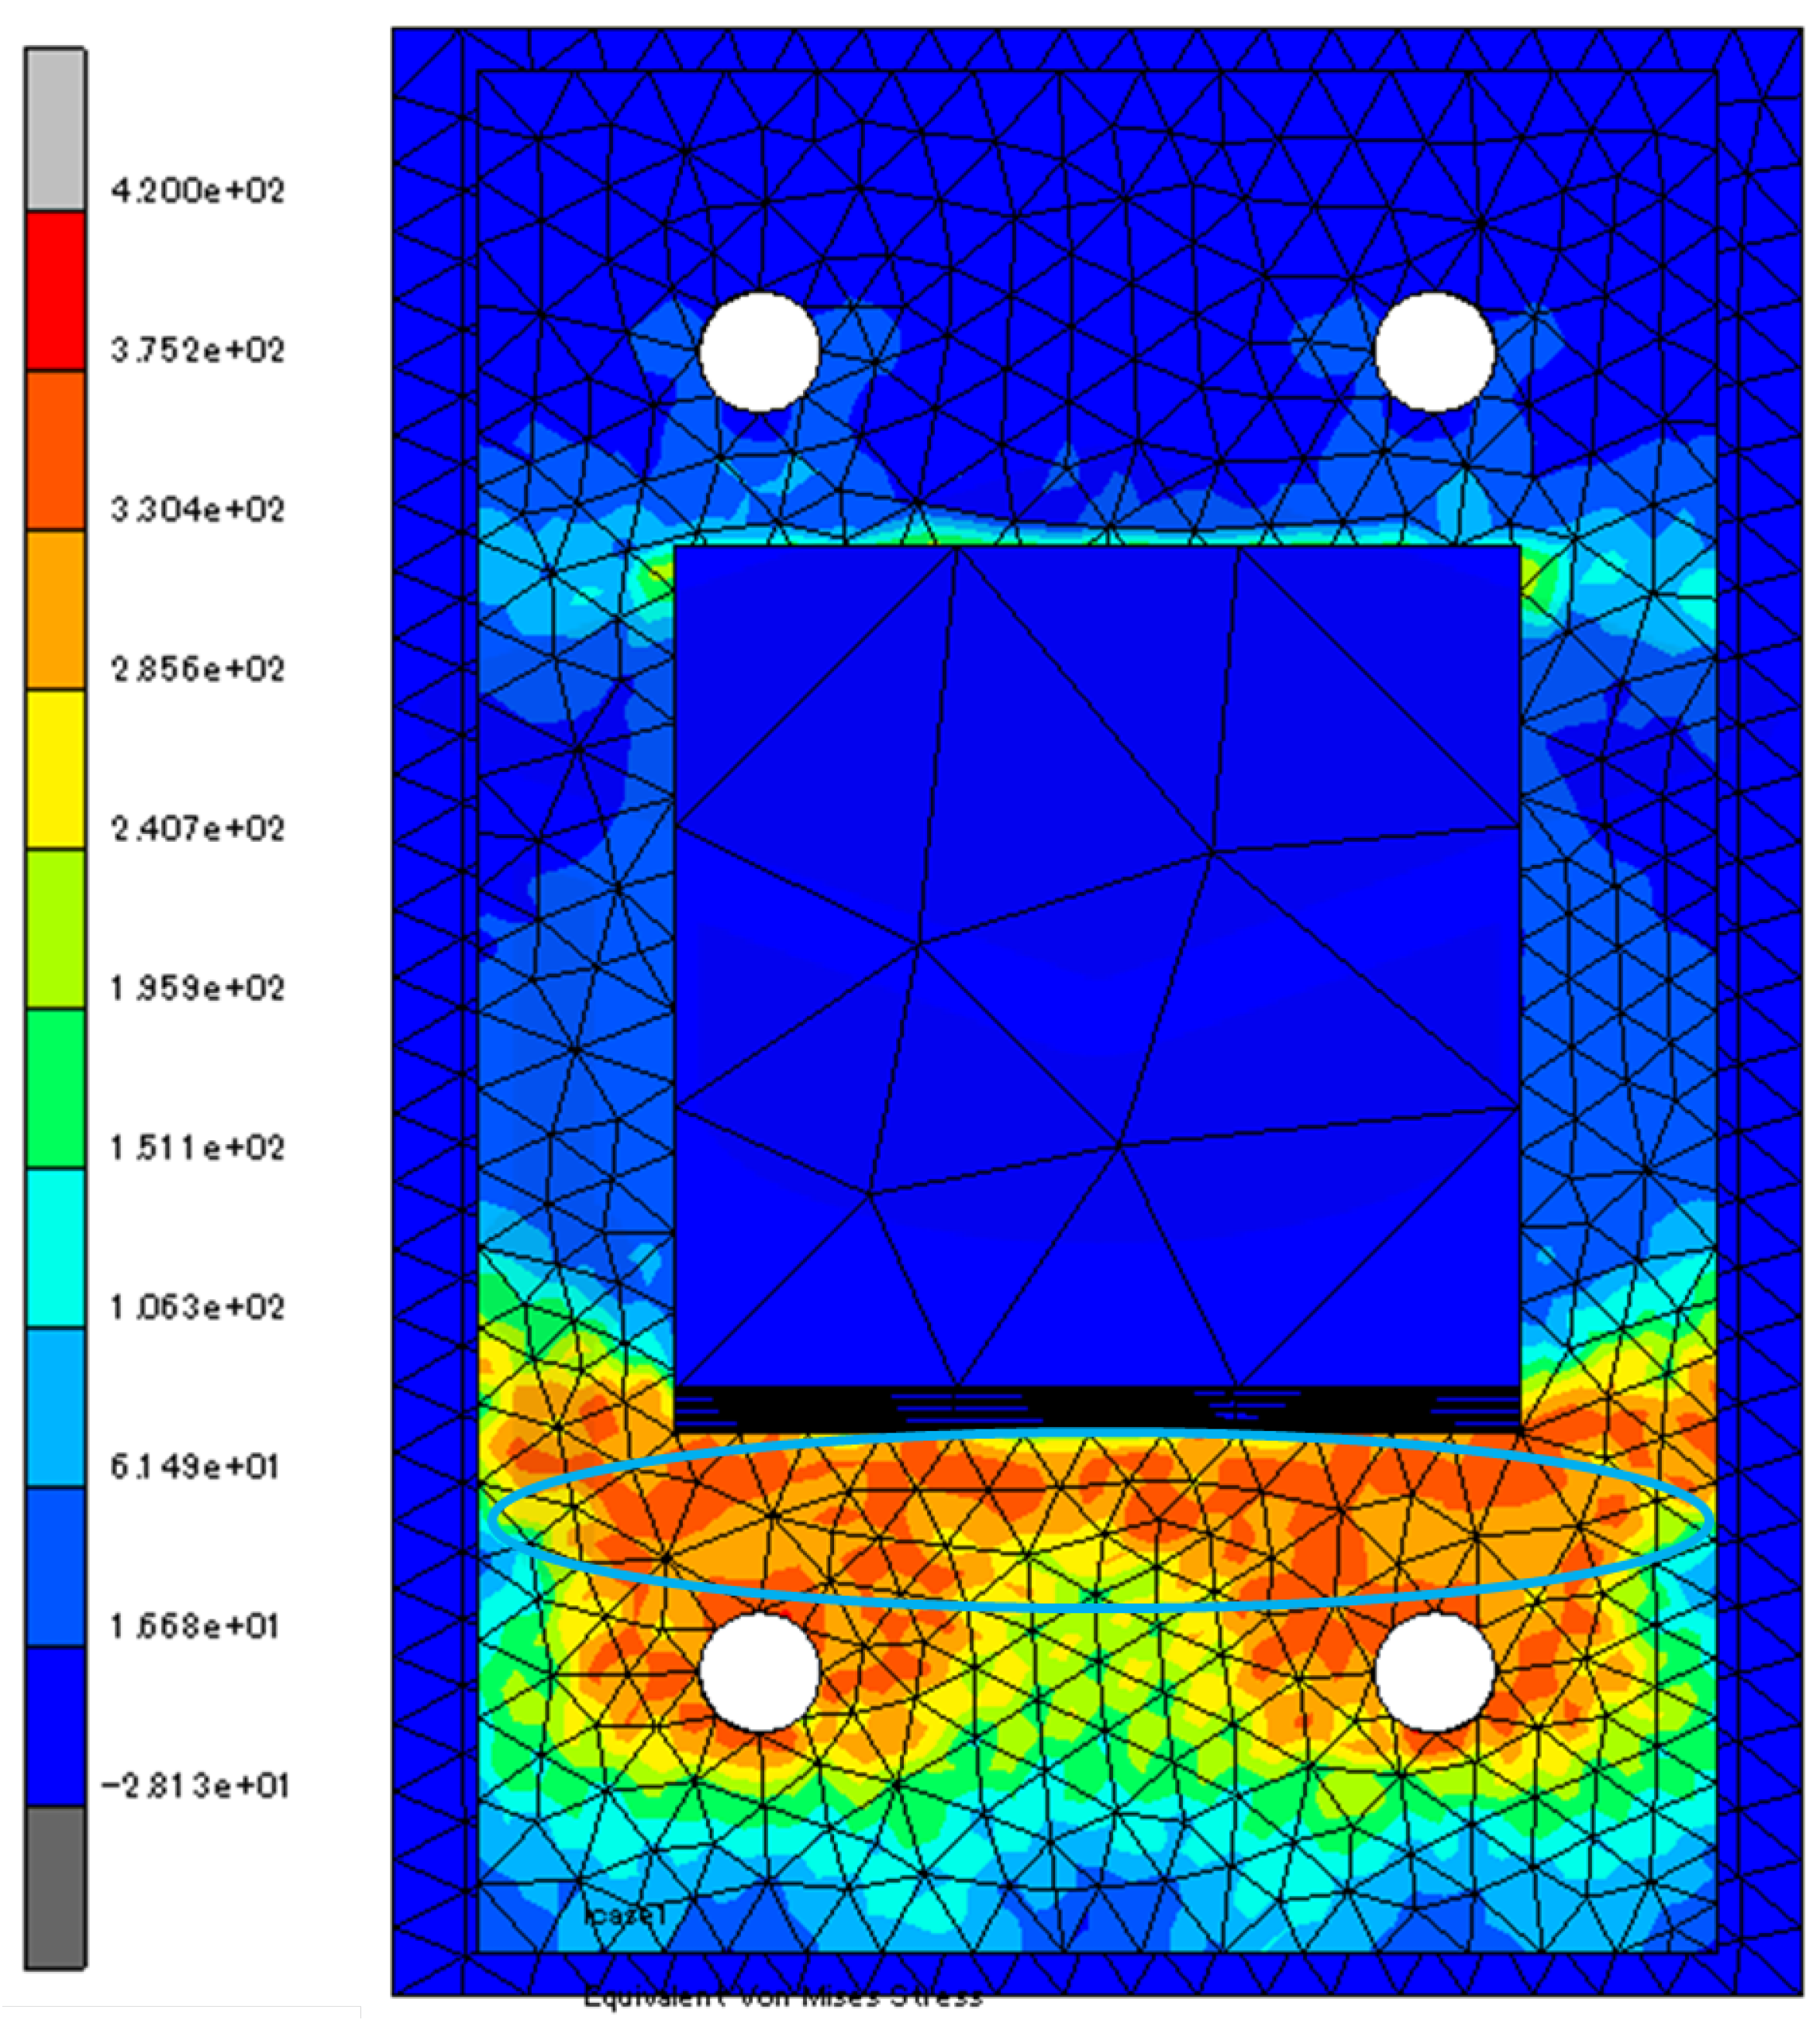
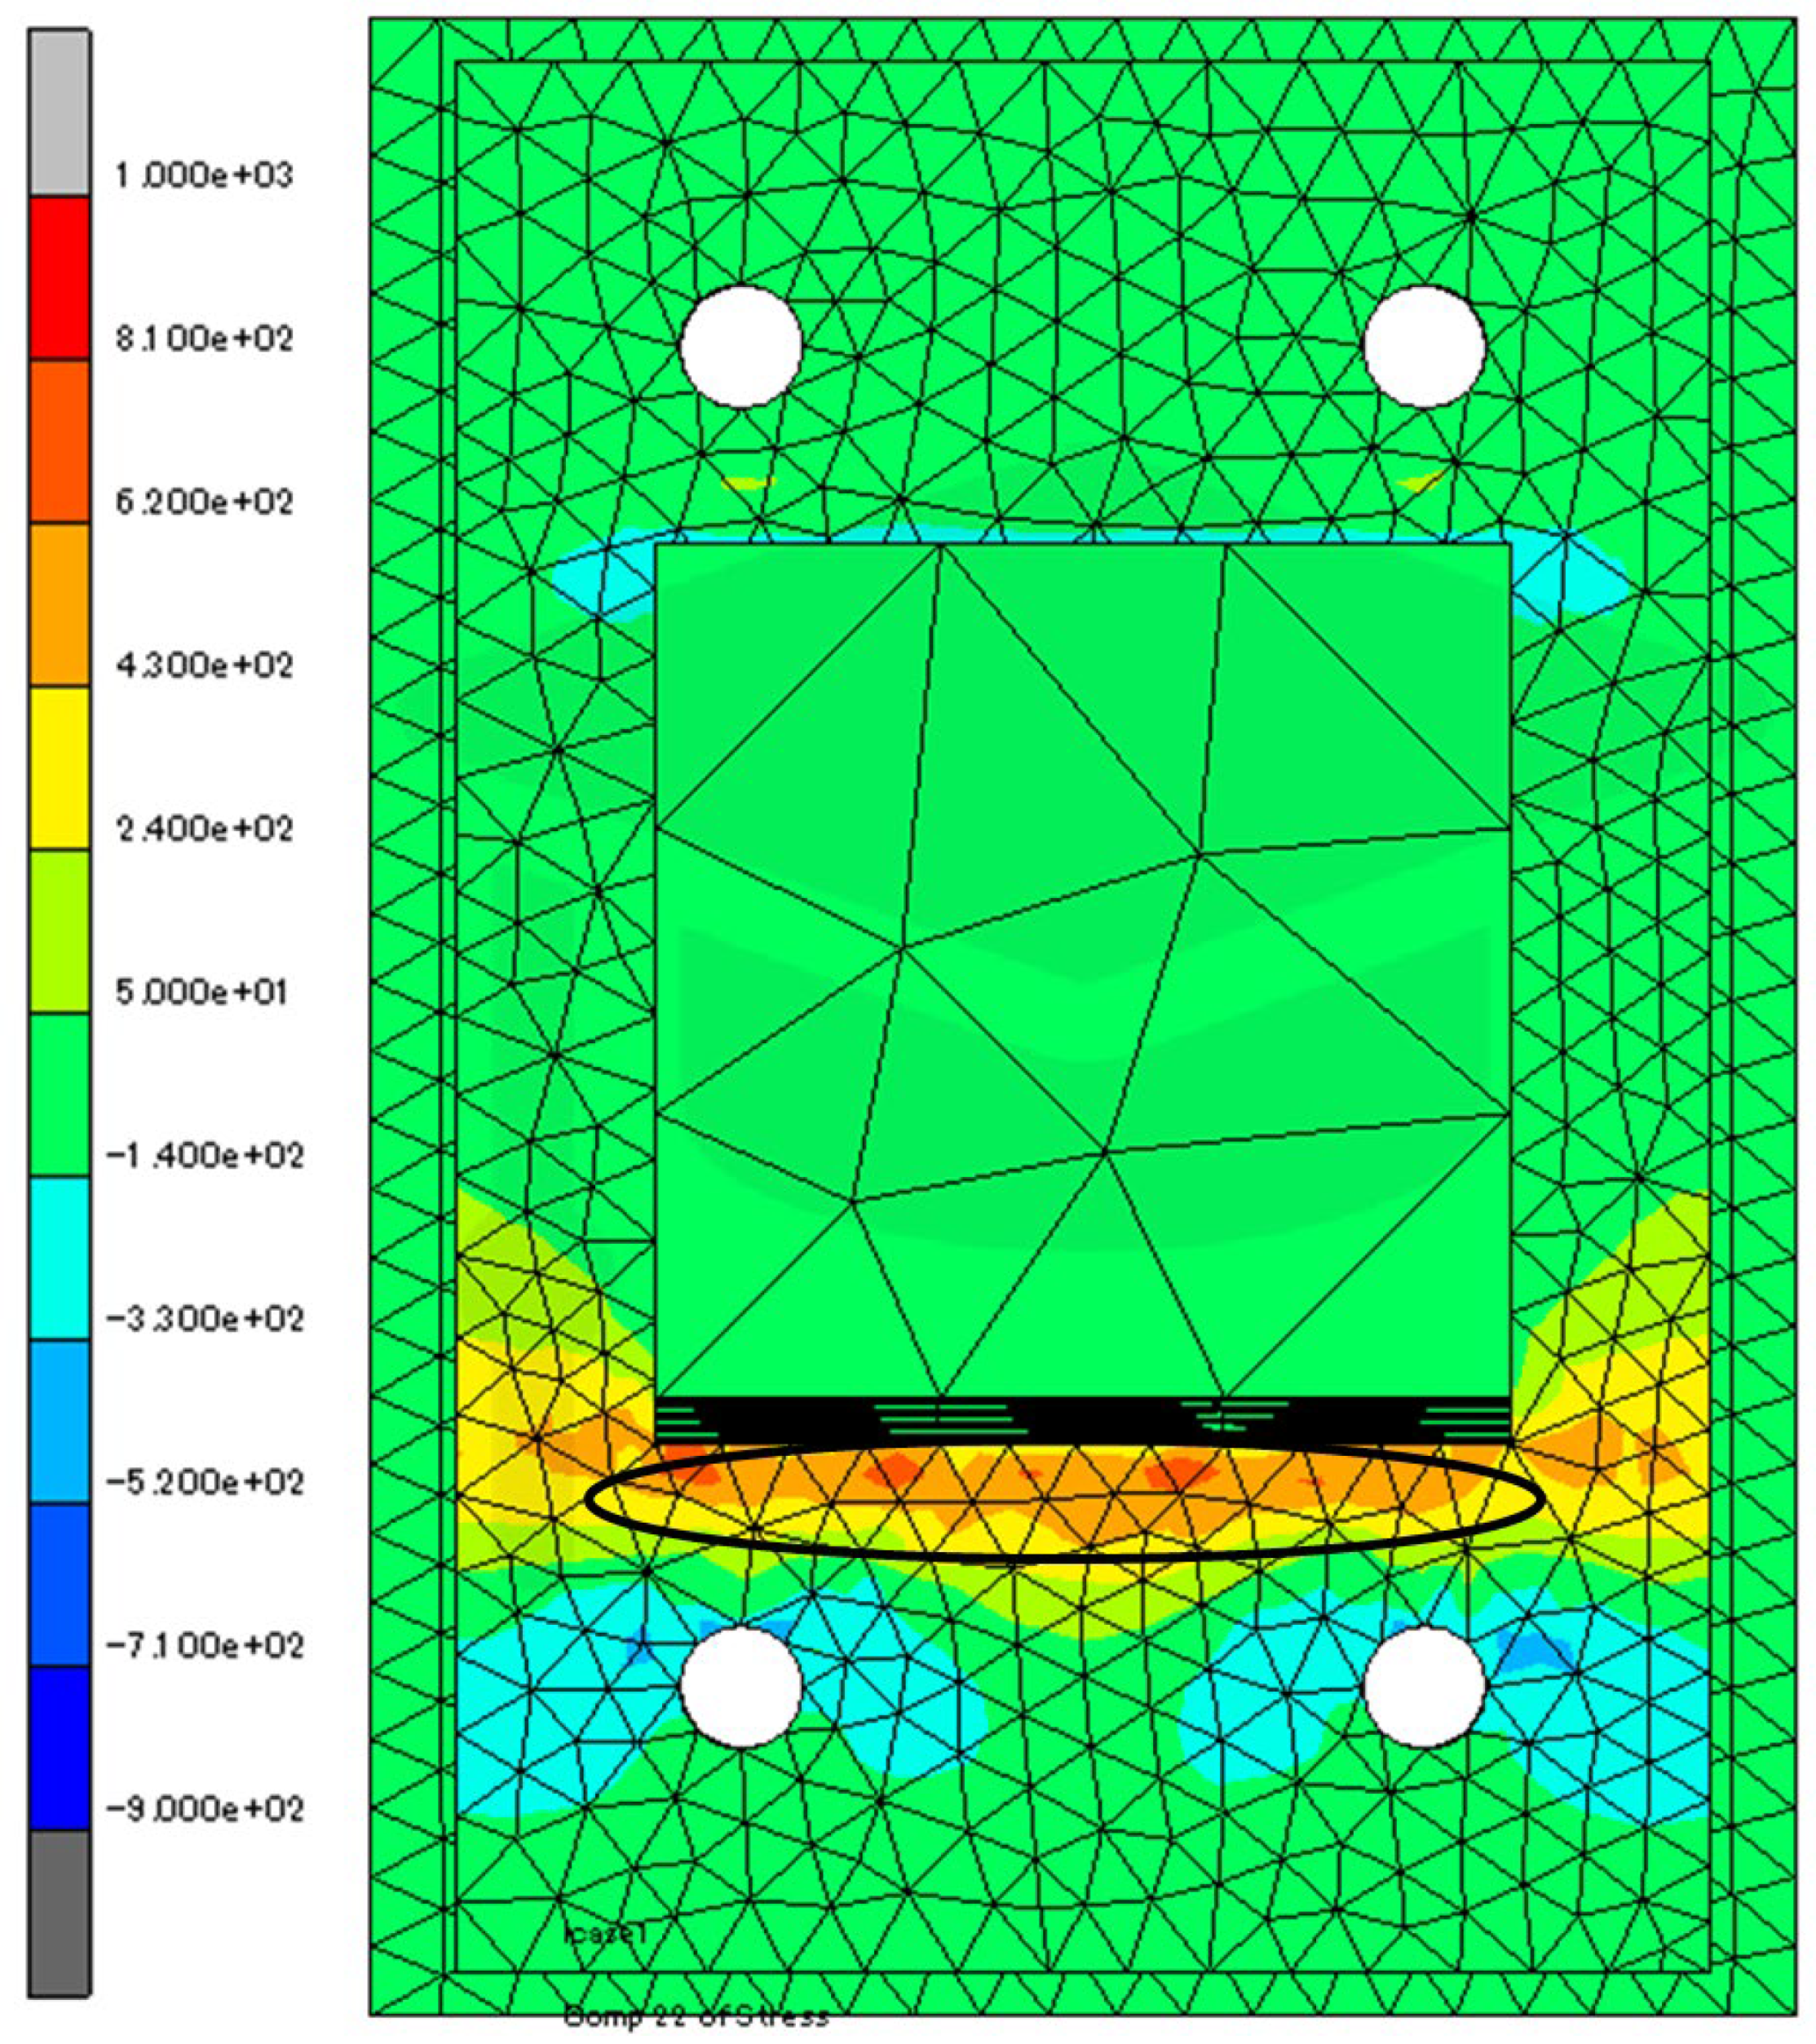
In the load–deformation curves of the test and the analysis, the stiffness obviously declined at the drift angle R of around 0.002 rad and 0.01 rad. At the early stage of loading, the base plate started to bend at around R = 0.002 rad, the strength of which was estimated using the hinging line method. After R = 0.01 rad, the strength would not increase from the test result in Figure 7. The authors focused on the strength at R = 0.01 rad since that strength is necessary for a rational design of the plates of an exposed column base. Figure 14 and Figure 15 show von Mises stress contours and Y-directional stress contours for the S1 and S2 analyses at R = 0.01 rad. Figure 16 and Figure 17 show von Mises stress contours and Y-directional stress contours for the S3 and S4 analyses at R = 0.01 rad. In this analysis, the Y-direction was the same as the loading direction of the test. The warm-colored area was found to be the area of stress concentration and yielding. In the Y-direction contours, the tensile side of the plate increased its stress. These figures show the phenomenon that the tensile resistance of the base plate increases with the progress of the out-of-plane deformation of the base plate. It was found that tensile yielding at the base plate in the test and the analysis occurred at around analyzer yields at R = 0.01 rad.
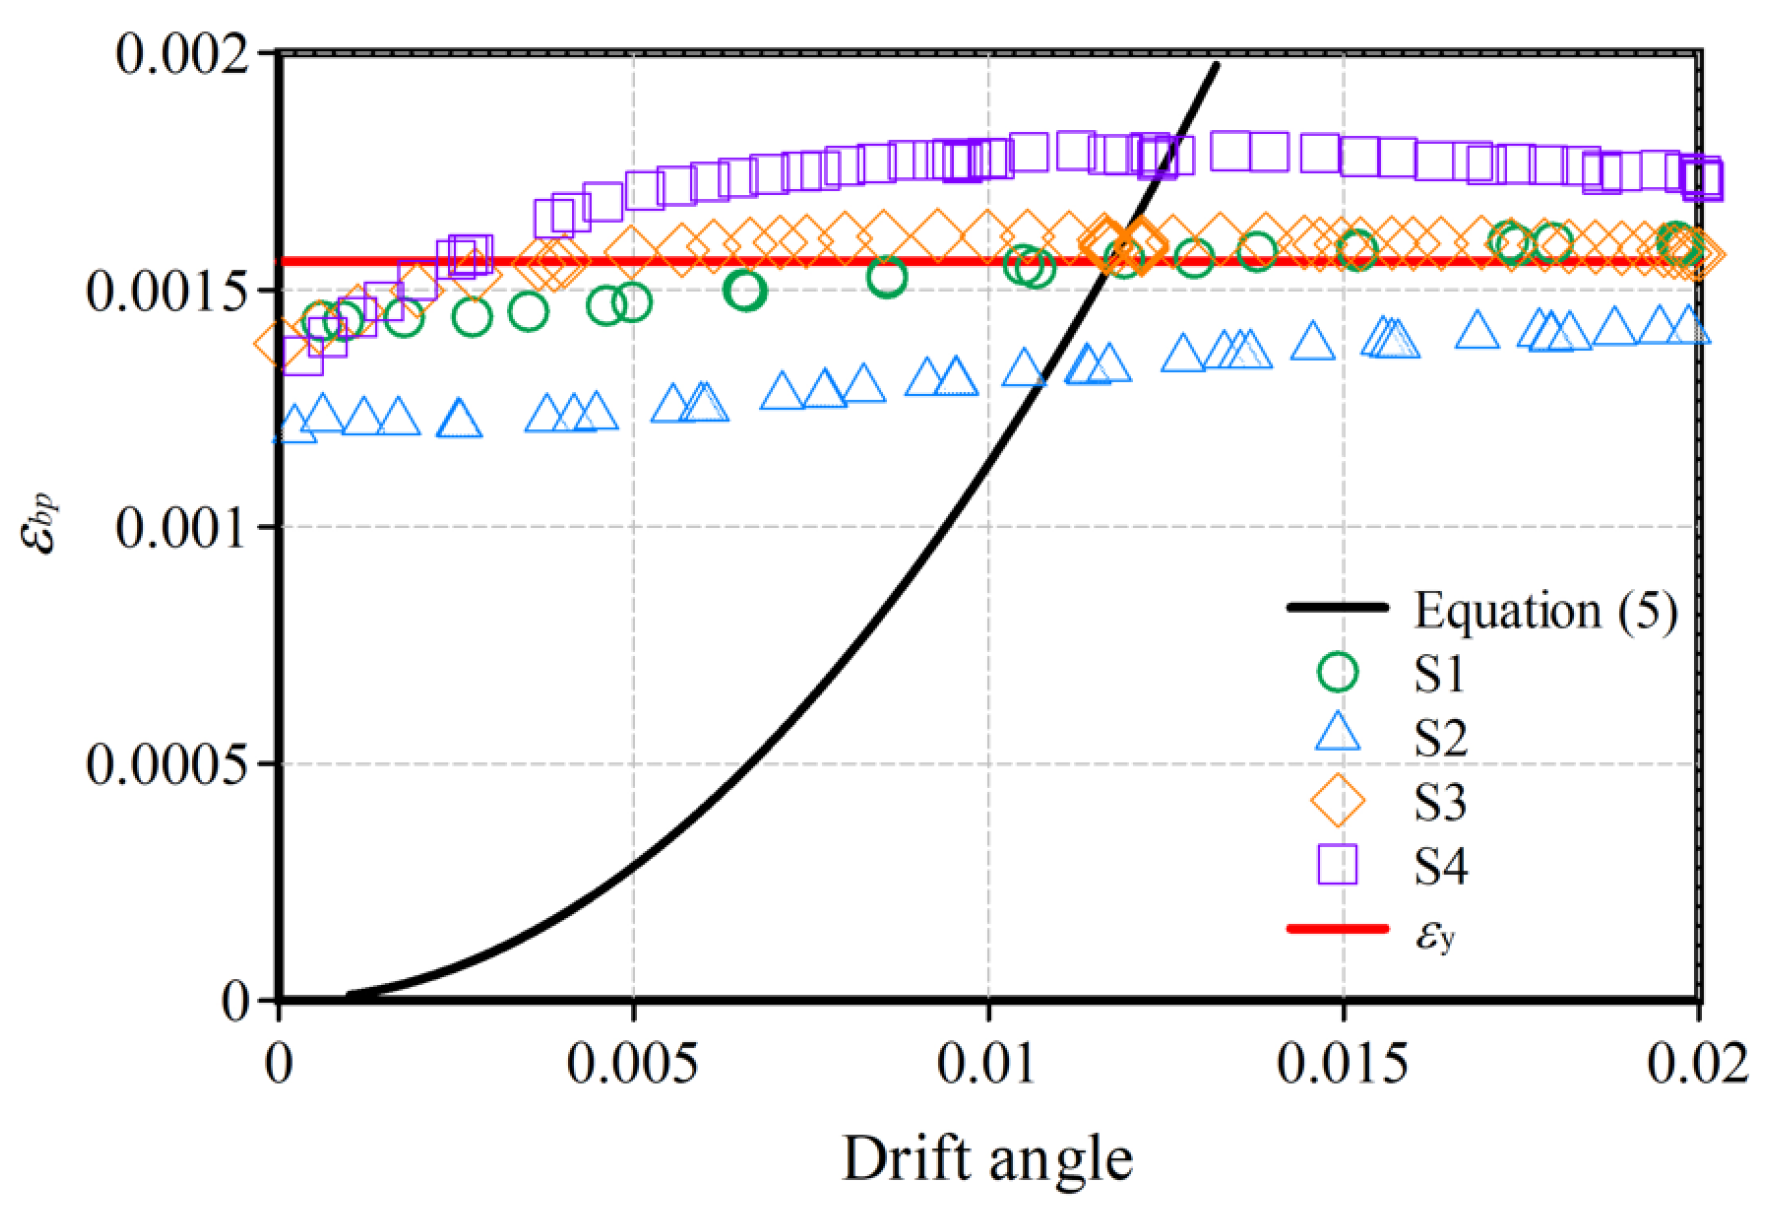
In the study, the authors proposed a calculation method which is shown with the blue lines in Figure 13. The red arrows indicate that the values obtained using the strength formula proposed by the authors exceed the calculated values based on the hinging line method. The strains at the position of P-4 on the base plate obtained in the test and the analysis attained its yield strain εy in Figure 18, where it is evident that the strength of the column base must be estimated by considering the tensile resistance of the base plate. A detailed explanation of the calculation method is provided in the next section.

4. Simple Calculation Method for the Yielding Strength of an Exposed Column Base

Rational structural designs need to predict the yielding strength of parts precisely. A simple calculation method is proposed to evaluate the yielding strength of the base plates through the hinging line theory [20] and strain energy theory.
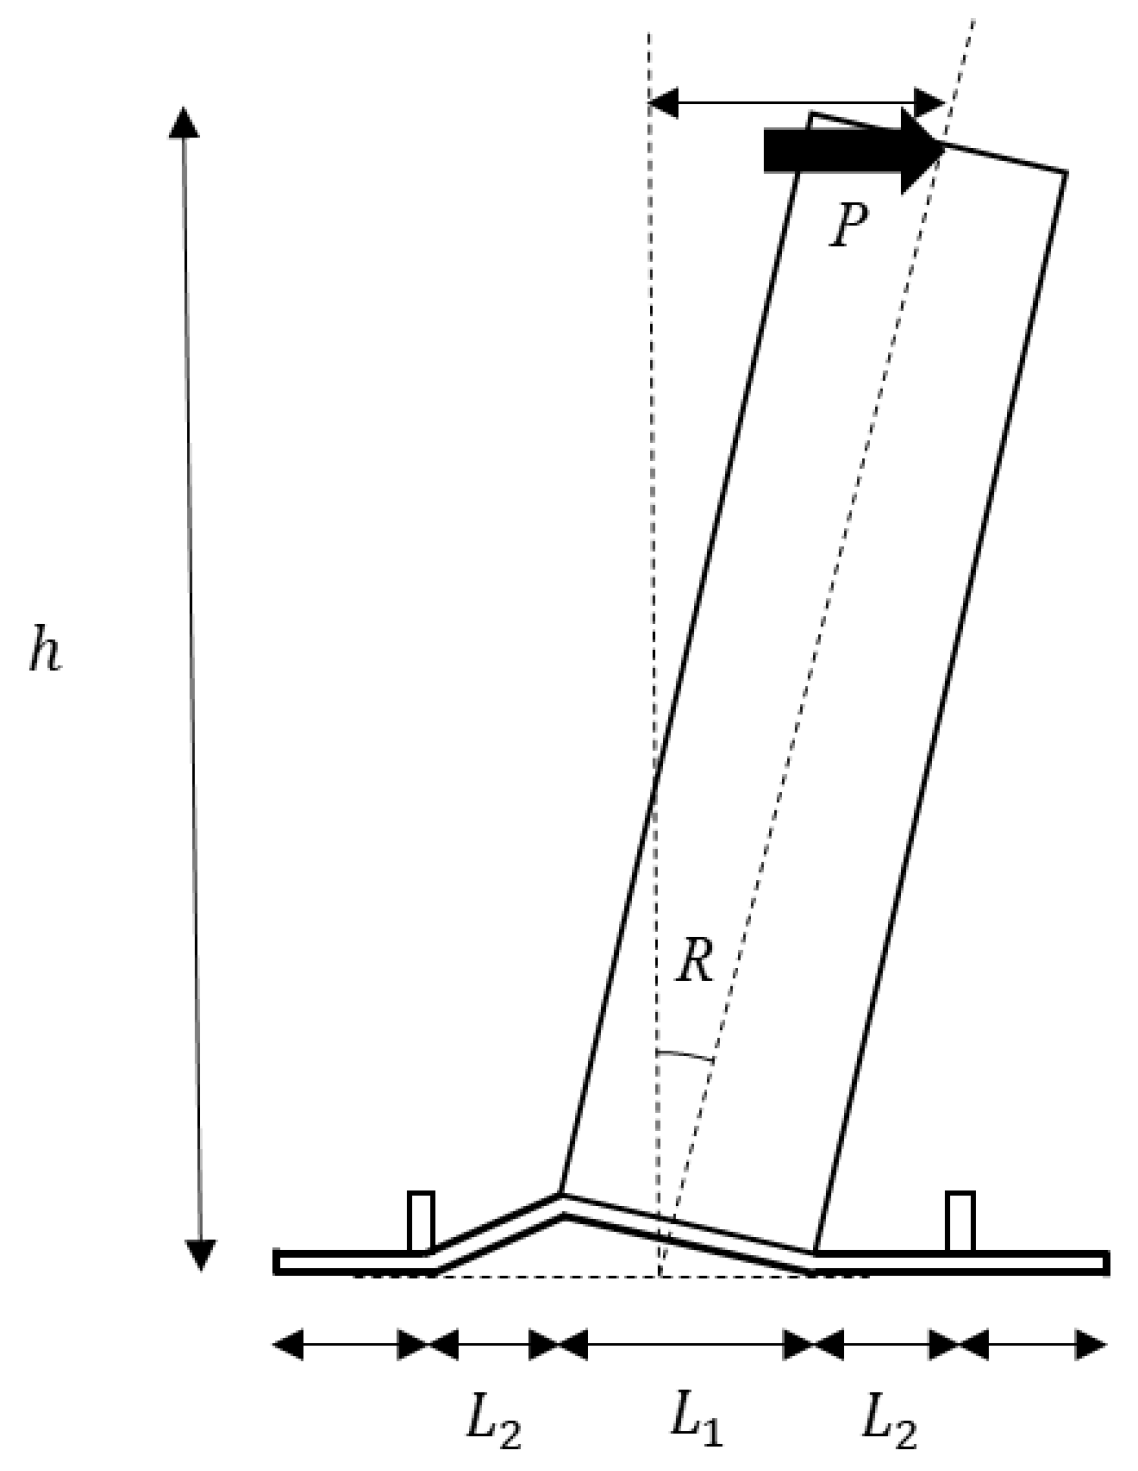
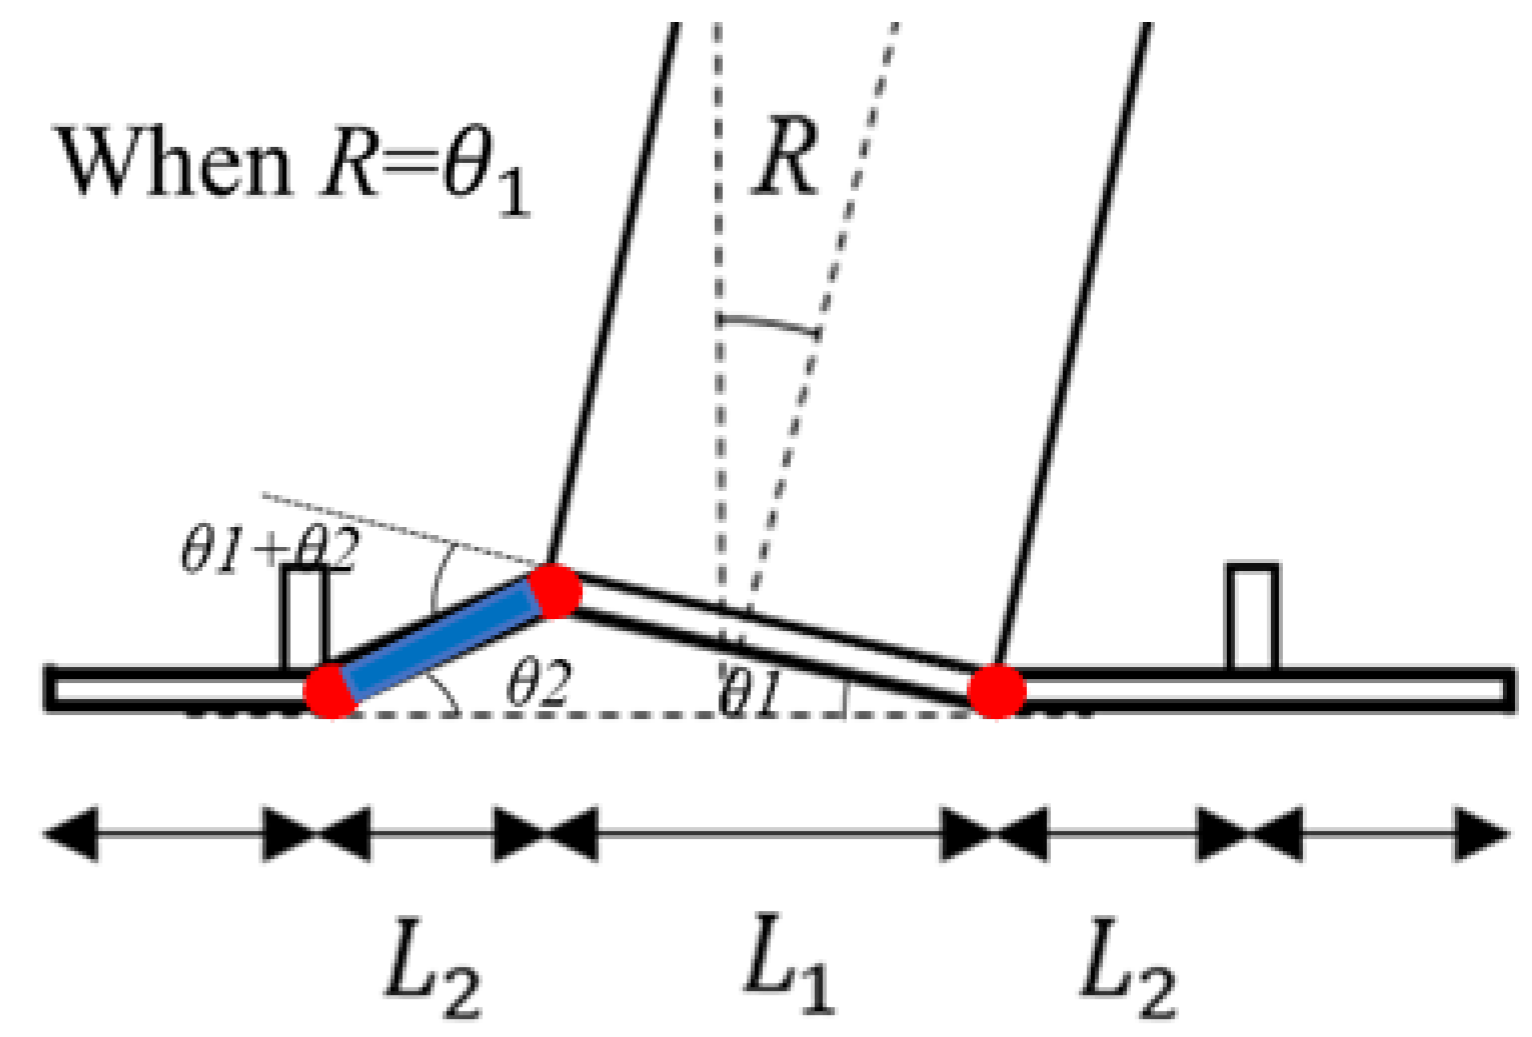
The failure mechanism is assumed to be illustrated in Figure 19 and Figure 20 under a lateral force P. Figure 20 illustrates the deformation of the plate when the top of the column sways at the drift angle R, where the red points show the hinging lines and the blue part shows the elongation part. The internal work U includes the plastic rotating deformation at the hinging line and the elastic elongation deformation of the base plate, assuming that the column and bolts are rigid.
Figure 21 shows the plan view of three hinging lines and the elongation area. In the analysis, plastic out-of-plane deformations of the base plates occurred on the three lines at the drift angle of 0.05 rad. On the other hand, tensile strain distributions were getting wider in a trapezoidal shape on the base plates until R = 0.01 rad.
From Equation (2), the external work W due to the load was obtained. This is equal to the internal work U caused by deformation in the base plate shown in Equation (3). Equations (2) and (3) are expressed as the functions of the variable R. Equation (4) represents the formula for the full plastic moment of the plate. Equation (5) shows the geometric relationship between the tensile strain of the base plate and the drift angle.
W = P · h · R N · L 1 2 · R
U = 2 M p α R + 2 M p R + E A ε b p 2 2 L 2
M p = σ y B p t 2 / 4 ,
ε b p = 1 + α R 2 1
The symbols used in the equations are summarized below:
  • A : A r e a   o f   t h e   t e n s i l e   y i e l d i n g   p a r t   o f   t h e   b a s e   p l a t e
  • B p : W i d t h   o f   t h e   b a s e   p l a t e
  • E : Y o u n g s   m o d u l u s
  • h : H e i g h t   a t   t h e   l o a d i n g   p o i n t
  • L 1 : D e p t h   o f   t h e   s t e e l   t u b e
  • L 2 : D i s t a n c e   b e t w e e n   t h e   h i n g i n g   l i n e s
  • M p : F u l l   p l a s t i c   m o m e n t   o f   t h e   b a s e   p l a t e
  • N : A x i a l   f o r c e
  • P : L a t e r a l   f o r c e
  • α : L 1 / L 2
  • ε b p : T e n s i l e   s t r a i n   o f   t h e   b a s e   p l a t e
The first variation of the external work δW and the first variation of the internal work δU can be expressed by taking the variation of the variable R as follows:
δ W = P h δ R N · L 1 2 · δ R
δ U = 2 M p α δ R + 2 M p δ R + α 2 E A L 2 R R α R 2 + 1 δ R
The principle of virtual work is expressed as δW = δU. This means Equation (6) = Equation (7), where the first variation of the drift angle δR is eliminated, so that:
P h = 2 M p α + 2 M p + α 2 E A L 2 R R α R 2 + 1 + N L 1 2
Figure 22 shows the relationship between the strain εbp on the base plate and the drift angle of the specimen. The observed strains except for the S2 specimen attained the yield strain εy of the base plate. The strain calculated with Equation (5) increased as the drift angle increased and exceeded the yield strain εy. From the equation, drift angle R is 0.0118nrad when εbp· = εy. The strength of the column base was defined at R = 0.01 rad. Figure 23 shows the calculation models for the lateral force versus drift angle. The first declining point was defined at R = 0.002 rad, which was caused by the out-of-plane deformation of the base plate. The second declining point was defined at R = 0.01 rad, which was caused by the tensile yielding of the base plate. These are rough definitions. The authors will continue to develop a more precise model for the same concept in further studies.
The calculated results for the tensile yielding strength of S1, S2 and S3, S4 were 16.7 kN and 8.41 kN, respectively. The test, calculated, and analytical values are summarized in Table 5. The test results were predicted by calculations with 5.4% errors, while the analysis estimates resulted in 7.5% errors.

5. Conclusions

This study focused on the yield strength and yielding behavior of the base plate of an exposed column base using a test and the analysis. The simple calculation method was proposed on the basis of the strain energy theorem and the distribution of tensile stress in the base plate obtained by the FEM analysis. The findings are summarized below:
  • All the specimens failed in yielding at the base plates of an exposed CFST column base.
  • The test results of the relationship between the lateral load and the drift angle showed stability without strength deterioration. The hysteresis characteristics of the specimens with axial force application were origin-oriented, and those of the specimens with no axial force application were spindle-shaped.
  • Energy absorption capacities were estimated using the equivalent viscous damping ratio at each step of the drift angle of 0.01, 0.02, 0.03, and 0.05 rad. The ratios increased with cyclical loading. The average value was 20.7%.
  • The FEM analysis traced well the test results, revealing the tensile yielding area of the base plates.
  • The FEM analysis provided the stress distribution on the base plates when the load versus deformation relationship showed a significant decline at R = 0.01 rad.
  • The calculation method for the tensile yielding strength of the base plate of a column base accurately evaluated each test strength. It showed that the assumption of the stress distribution area was reasonable owing to the results of the FEM analysis.
  • The simple calculation method proposed in this paper demonstrated high consistency with the test results, suggesting its potential as a practical tool for structural design.

Author Contributions

H.N. was responsible for the study design. D.N., H.N., and I.C. were involved in the analysis, calculations, and data interpretation. All the authors critically revised the report, commented on the drafts of the manuscript, and approved the final report. All authors have read and agreed to the published version of the manuscript.

Funding

This study was supported by the following research: “Development and Practical Use of WGFT (Representative: Hiroyuki Nakahara at Nagasaki University)”; grant provided through the Construction Technology Research and Development Subsidy Program by the Ministry of Land, Infrastructure, Transport, and Tourism of Japan in 2023–2024.

Data Availability Statement

The data that support the findings of this study are available from the corresponding author upon reasonable request.

Acknowledgments

The authors wish to express their gratitude to Nanae Mikoshi, Ryo Aoki, and Shoichiro Sasaki (students of Nagasaki University) and Kenta Okamoto (technician at Nagasaki University) for their contributions to the experimental study.

Conflicts of Interest

The authors declare no conflict of interest.

References

  1. Reconnaissance Report on Damage to Steel Building Structures Observed from the 1995 Hyogoken-Nanbu Earthquake; Steel Committee of Kinki Branch the Architectural Institute of Japan (AIJ): Osaka, Japan, 1995.
  2. Final Report of the Architectural Earthquake Investigation Committee on the 1995 Great Hanshin-Awaji Earthquake; Architectural Earthquake Investigation Committee: Tokyo, Japan, 1996.
  3. Damage and Lessons of Steel Structures in the Hyogoken-Nanbu Earthquake; Architectural Institute of Japan (AIJ): Tokyo, Japan, 1996.
  4. Cui, Y.; Wang, F.; Yamada, S. Effect of Column Base Behavior on Seismic Performance of Multi-Story Steel Moment Resisting Frames. Int. J. Struct. Stab. Dyn. 2019, 19, 1940007. [Google Scholar] [CrossRef]
  5. Cui, Y. Shear behavior of exposed column base connections. Steel Compos. Struct. 2016, 21, 357–371. [Google Scholar] [CrossRef]
  6. Kishiki, S.; Yang, X.; Ishida, T.; Tatsumi, N.; Yamada, S. Experimental study of concrete breakout failure mechanism in an exposed column base with a foundation beam. Eng. Struct. 2021, 243, 112661. [Google Scholar] [CrossRef]
  7. You, Y.-C.; Lee, D. Development of improved exposed column-base plate strong-axis joints of low-rise steel buildings. J. Constr. Steel Res. 2020, 169, 106062. [Google Scholar] [CrossRef]
  8. Recommendation for Design of Connection in Steel Structures; Architectural Institute of Japan (AIJ): Tokyo, Japan, 2021.
  9. You, Y.-C.; Lee, D. Effect of anchors on the seismic performance of exposed column-base plate weak-axis connections. J. Build. Eng. 2020, 32, 101803. [Google Scholar] [CrossRef]
  10. Yamanishi, T.; Tamai, H.; Takamatsu, T.; Matsuo, A. Elastic Rotational Rigidity of Exposed Column-base (In case of anchor bolt yield type). J. Struct. Constr. Eng. 2008, 73, 317–324. (In Japansese) [Google Scholar] [CrossRef]
  11. Pan, J.; Huang, R.; Xu, J.; Wang, P.; Wang, Z.; Chen, J. Behavior of exposed column-base connections with four internal anchor bolts under seismic loading. Structures 2021, 34, 105–119. [Google Scholar] [CrossRef]
  12. Tamai, H.; Ichinose, N. On Deformation Capacity of Exposed Column-Base; Graduate School of Engineering, Nagasaki University: Nagasaki, Japan, 2015; Volume 45. (In Japanese) [Google Scholar]
  13. Lim, W.-Y.; Lee, D.; You, Y.-C. Exposed column-base plate strong-axis connections for small-size steel construction. J. Constr. Steel Res. 2017, 137, 286–296. [Google Scholar] [CrossRef]
  14. Akiyama, H. Seismic Design of Steel Column Bases; GIHODO SHUPPAN Co., Ltd.: Tokyo, Japan, 1985. (In Japanese) [Google Scholar]
  15. Yanagita, Y.; Hannuki, T.; Akiyama, H. Experimental Study on Hysteretic Behaviors of Exposed Steel Column Bases: (Part III) Experimental Formulas of Week Base-Plate Types; Summaries of Technical Papers of Annual Meeting Architectural Institute of Japan; SC-1, Structures III, Timber Structures Steel Structures Steel Reinforced Concrete Structures; Architectural Institute of Japan (AIJ): Tokyo, Japan, 2005; pp. 651–652. (In Japanese) [Google Scholar]
  16. Cui, Y.; Wang, F.; Li, H.; Yamada, S. Rotational behavior of exposed column bases with different base plate thickness. Steel Compos. Struct. 2019, 32, 497–507. [Google Scholar] [CrossRef]
  17. Kokubo, A.; Hannuki, T.; Yanagita, Y.; Akiyama, H. Experimental Study on Hysteretic Behavior of Exposed Steel Column Bases: Part I Experimental Program and Results; Summaries of Technical Papers of Annual Meeting Architectural Institute of Japan; C-1, Structures III, Timber Structures Steel Structures Steel Reinforced Concrete Structures; Architectural Institute of Japan (AIJ): Tokyo, Japan, 2004; pp. 721–722. (In Japanese) [Google Scholar]
  18. Akiyama, H.; Yamada, S.; Takahashi, M.; Katsura, D.; Kimura, K.; Yahata, S. Full scale shaking table test of the exposed column bases. J. Struct. Constr. Eng. 1998, 63, 185–192. (In Japanese) [Google Scholar] [CrossRef] [PubMed]
  19. Takamatsu, T.; Douki, H. Experimental Study on Restoring Force Characteristics of Exposed-Type Column Base. Bull. Hiroshima Inst. Technol. 2001, 35, 133–140. (In Japanese) [Google Scholar]
  20. Inoue, K.; Suita, K. Building Steel Structure’s Theory and Design; Kajima Institute Publishing Co., Ltd.: Tokyo, Japan, 2007. (In Japanese) [Google Scholar]
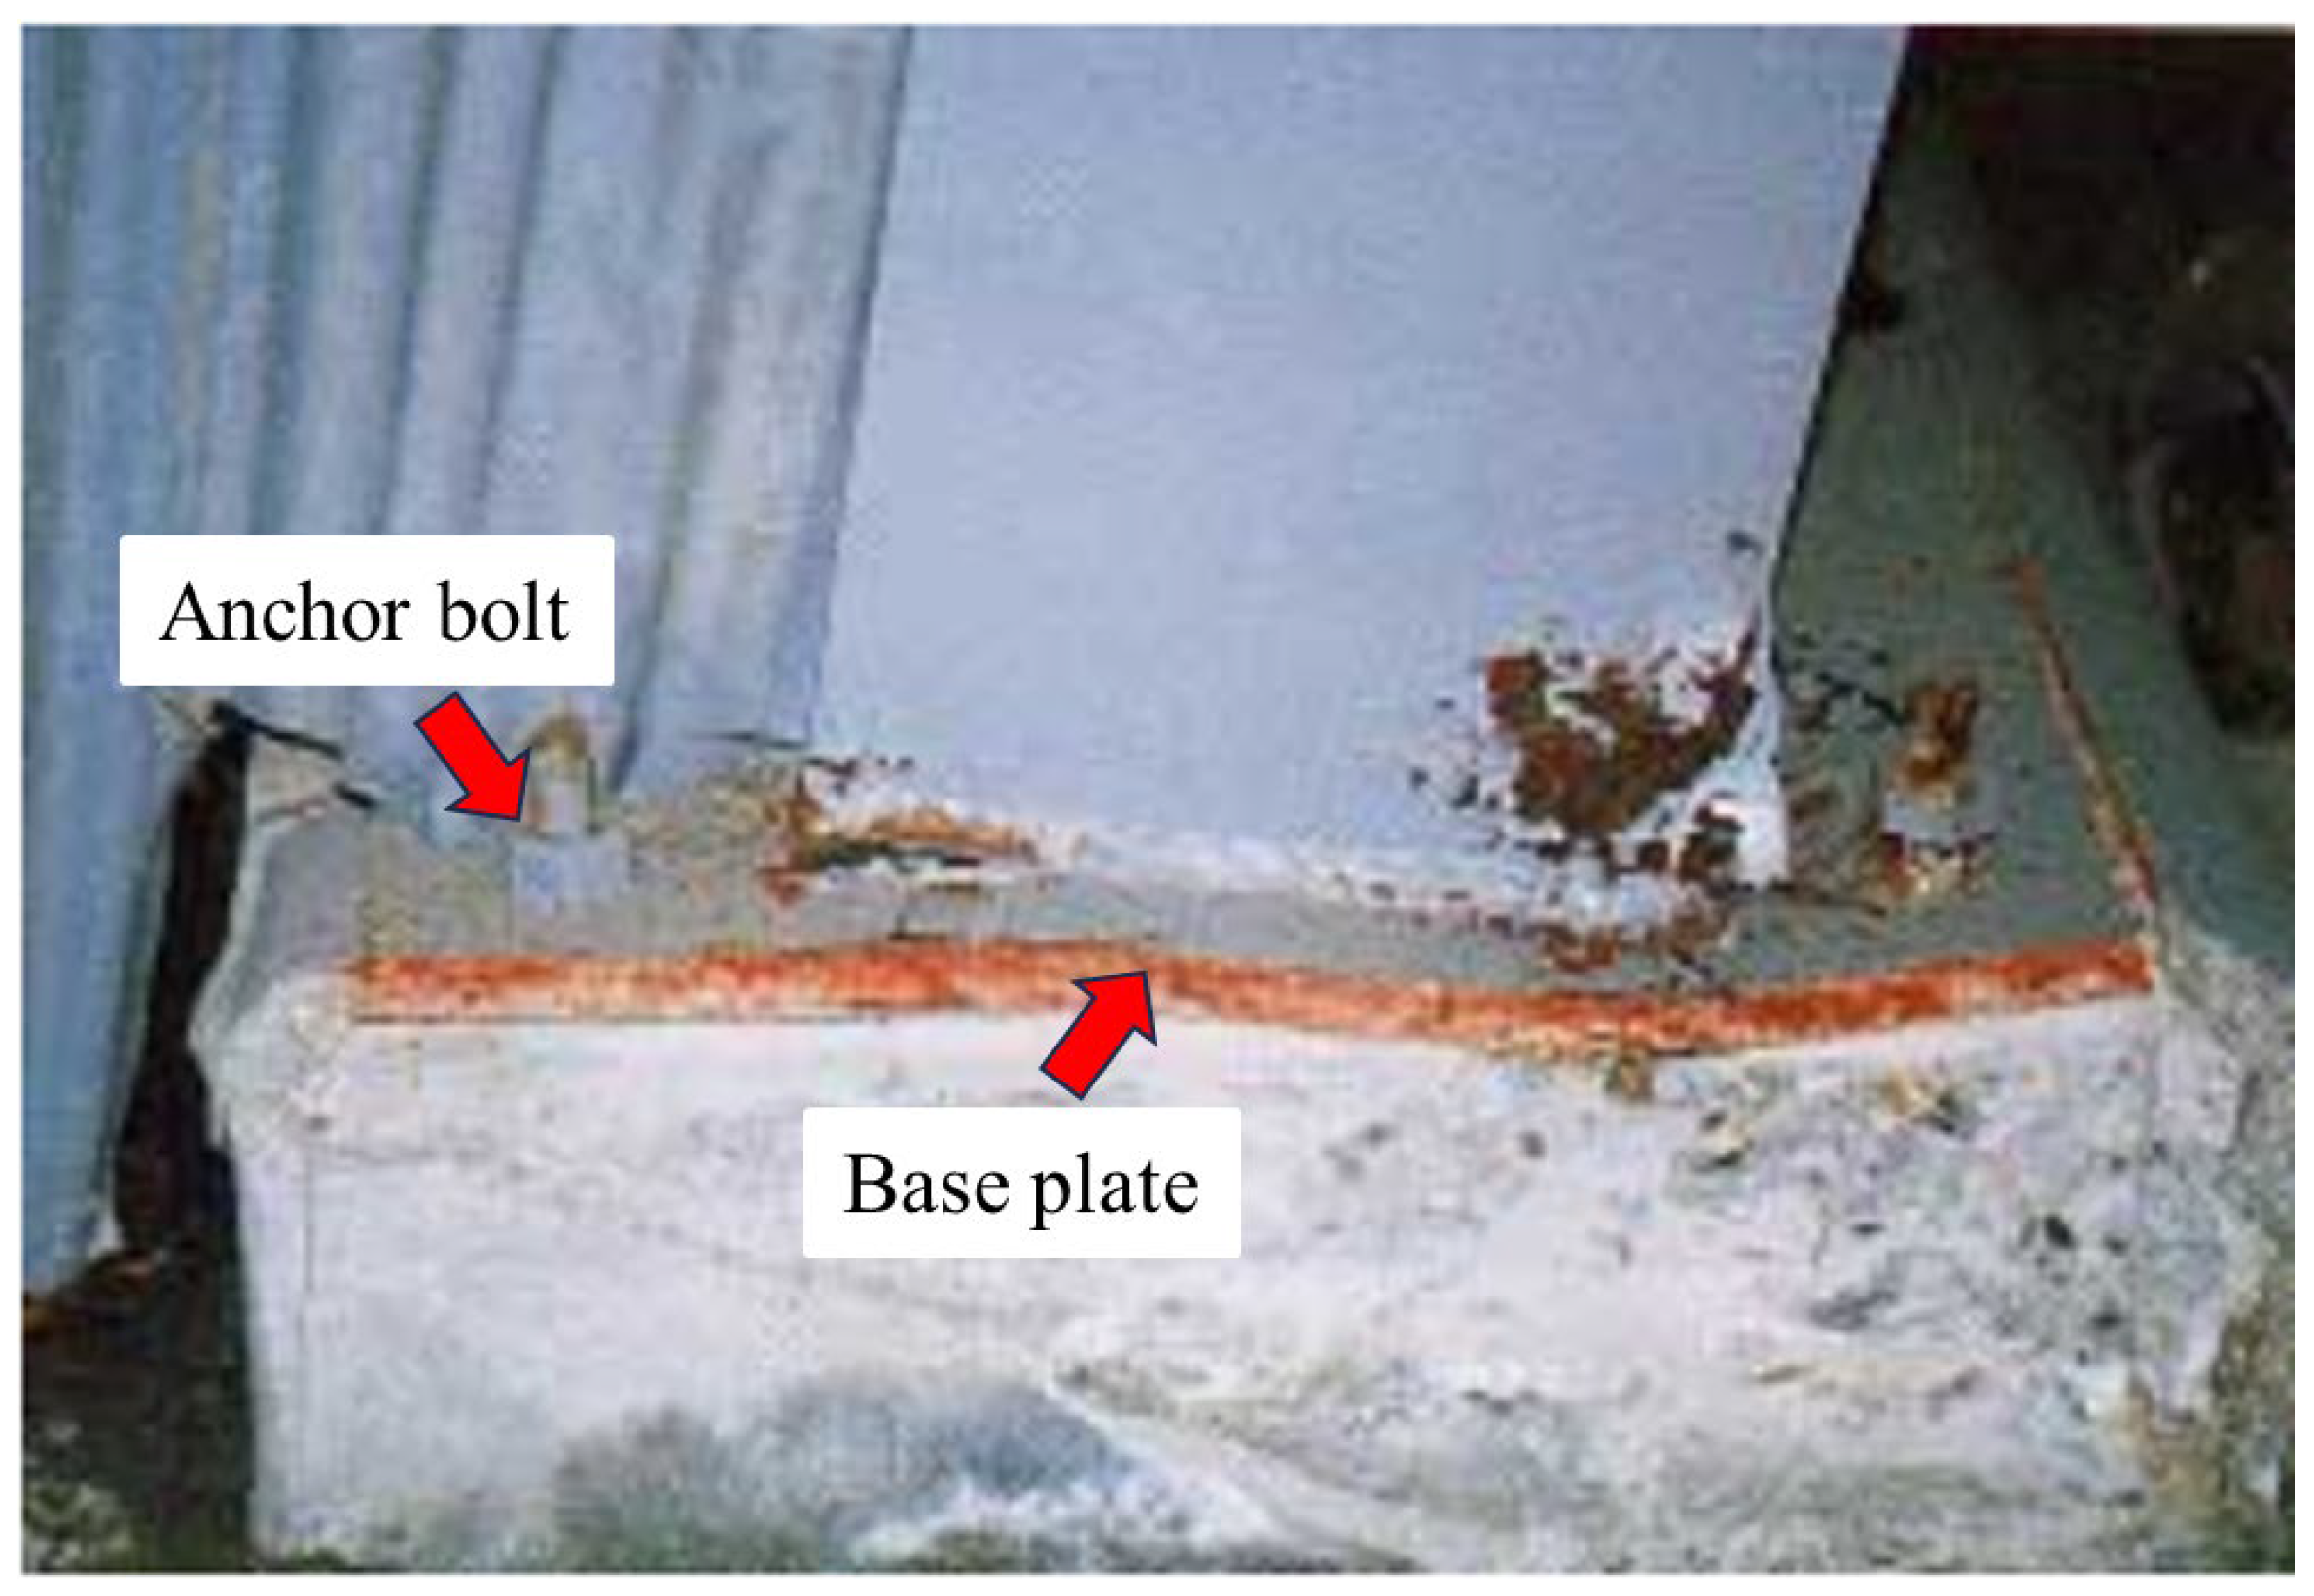
Figure 1. Damage of an exposed column base (reprinted from [1]).
Buildings 14 03881 g001
Figure 2. Number of parts in exposed column bases in steel structures damaged by the Kobe earthquake (data from [1]).
Buildings 14 03881 g002
Figure 3. Test specimen.
Buildings 14 03881 g003
Figure 4. Base plates and locations of strain gauges (in mm).
Buildings 14 03881 g004
Figure 5. Loading apparatus (setup 1).
Buildings 14 03881 g005
Figure 6. Loading apparatus (setup 2).
Buildings 14 03881 g006
Figure 7. Test results: (a) S1, (b) S2, (c) S3, and (d) S4.
Buildings 14 03881 g007aBuildings 14 03881 g007b
Figure 8. Relationship between lateral force and local strain at P-4 of S1.
Buildings 14 03881 g008
Figure 10. Boundary condition and loading direction for the FEM analysis.
Buildings 14 03881 g010
Figure 11. Stress–strain relationship.
Buildings 14 03881 g011
Figure 12. Von Mises yield criterion.
Buildings 14 03881 g012
Figure 13. Analysis results: (a) S1; (b) S2; (c) S3; (d) S4.
Buildings 14 03881 g013
Figure 14. Analytical von Mises stress contours for S1 and S2 (at R = 0.01 rad).
Buildings 14 03881 g014
Figure 15. Analytical Y-directional stress contours for S1 and S2 (at R = 0.01 rad).
Buildings 14 03881 g015
Figure 16. Analytical Mises stress contours for S3 and S4 (at R = 0.01 rad).
Buildings 14 03881 g016
Figure 17. Analytical Y-directional stress contours for S3 and S4 (at R = 0.01 rad).
Buildings 14 03881 g017
Figure 18. Comparison of the strain at the plate versus lateral force between the test and the analysis.
Buildings 14 03881 g018
Figure 19. Deformation of the test specimen at drift angle R.
Buildings 14 03881 g019
Figure 20. Local deformation of the base plate.
Buildings 14 03881 g020
Figure 21. Hinging lines and tensile strain distribution areas on the base plate (plan view).
Buildings 14 03881 g021
Figure 22. Relationship between the strain on the base plate and the drift angle.
Buildings 14 03881 g022
Figure 23. Calculation models for lateral force versus drift angle.
Buildings 14 03881 g023
Table 1. Material properties of the columns.
Specimenσy (N/mm2)σu (N/mm2)E (kN/mm2)
S1348 446 194
S2
S3352 449 205
S4
Table 2. Dimensions and material properties of the base plate.
SpecimenBP (mm)DP (mm)t (mm)σy (N/mm2)σu (N/mm2)E (kN/mm2)
S12203356.00 344 440 205
S2
S32203355.60 294 454 199
S4
Table 3. Material properties of concrete.
Specimenσc (N/mm2)Ec (kN/mm2)
S147.6 31.7
S2
S349.5 30.2
S4
Table 5. Comparison of the test, calculated, and analytical values of yield strengths.
Test
(kN)
Calculation
(kN)
Analysis
(kN)
Exp./Cal.
(%)
Exp./Ana.
(%)
S116.0 16.7 16.8 95.8 95.2
S215.8 16.8 94.6 94.0
S38.69 8.41 9.23 103 94.1
S48.54 9.23 102 92.5
Disclaimer/Publisher’s Note: The statements, opinions and data contained in all publications are solely those of the individual author(s) and contributor(s) and not of MDPI and/or the editor(s). MDPI and/or the editor(s) disclaim responsibility for any injury to people or property resulting from any ideas, methods, instructions or products referred to in the content.