Article

Liquid-Water Transfer Coefficients of Porous Building Materials Under High-Humidity Conditions

1
School of Architecture and Urban Planning, Suzhou University of Science and Technology, Suzhou 215009, China
2
Jiangsu Provincial Construction Carbon Neutral Technology Engineering Research Center, Suzhou 215009, China
*
Author to whom correspondence should be addressed.
Buildings 2024, 14(12), 3865; https://doi.org/10.3390/buildings14123865
Submission received: 14 October 2024 / Revised: 26 November 2024 / Accepted: 28 November 2024 / Published: 30 November 2024
(This article belongs to the Special Issue Construction Materials: Performance Analysis and Assessment)

Abstract

:
The moisture transfer coefficient is a key parameter for analyzing the moisture-based physical properties of materials and studying the heat–moisture coupling process within building envelopes. The liquid-water transfer coefficient, as an important aspect of this process, plays a significant role, especially under high-humidity conditions. However, the global research on liquid-water transfer coefficients is still far from complete. To further enhance the research on liquid-water transfer coefficients, this study conducted capillary water absorption experiments on seven traditional and new porous building materials, focusing on testing the moisture transfer coefficients, primarily the liquid-water transfer coefficient. A novel analysis regarding the impact of sealing materials was proposed, based on the experimental results. Based on the experimental data, the concept of a critical value related to the variation in the capillary moisture content and the liquid-water diffusion coefficient was raised, and, building upon traditional empirical models, a completely new computational model was proposed. Data processing was carried out using methods such as variability analysis, correlation analysis, and nonlinear regression for model fitting. The research findings indicate the following: (1) The capillary water absorption rate and capacity of a material are influenced by its density and porosity. (2) In terms of sealing materials, self-adhesive films performed better than non-adhesive films. (3) The concept of critical capillary moisture content was proposed, based on the rate of change in the liquid-water diffusion coefficient. For the threshold of w ≤ 80%, a new calculation model with a higher correlation coefficient was proposed which can meet the calculation requirements of the diffusion coefficient under the vast majority of relative-humidity conditions.

1. Introduction

The moisture transfer coefficient of porous building materials is an important parameter for perfecting the database of moisture physical properties and analyzing the coupled heat and moisture effects in building enclosures. It not only influences the energy efficiency of the enclosure but is also closely related to the service life of the building and indoor comfort. On the one hand, moisture erosion reduces the thermal efficiency of the enclosure and increases building energy consumption [1]. On the other hand, moisture erosion degrades the performance of building materials [2,3], damages the structure of the enclosure, shortens the service life of the building, and reduces indoor comfort. Therefore, studying the moisture transfer coefficient of materials is crucial for optimizing the thermal performance of the enclosure, extending the building’s life cycle, and improving indoor comfort.
Moisture transfer in building-envelope materials mainly involves the transfer of water vapor and liquid water. In his study, Rose divided the moisture transfer within porous materials into four stages based on the relative humidity of the surrounding environment [4]. When the relative humidity is not greater than 60%, the porous material is in the first stage, where it is fully in an adsorptive state. As the relative humidity continues to rise, the material transitions through the second, third, and fourth stages: from the phase where moisture transfer occurs through the conduction of water vapor (simultaneously adsorbed and desorbed), to the phase where both water vapor and liquid-water flow concurrently, and finally to the high-humidity stage where the moisture inside the material exists entirely in the form of liquid water. Carmeliet and Roels found in their research that the capillary sensitivity coefficient necessary for achieving the optimal moisture absorption state varies among different materials [5]. The specific value largely depends on the chosen material, but in their study, the relative humidity range in which the materials achieved the maximum capillary sensitivity coefficient was between 90% and 100%. In this relative humidity range, the liquid-water diffusion coefficient, driven by capillary pressure, cannot be ignored. When studying the impact of moisture transfer on building heat transfer, Luo and others found that the liquid-water diffusion coefficient significantly influences moisture transfer [6], especially in high-humidity conditions such as rainy days. When the relative humidity exceeds 95%, simply using the maximum constant value for liquid-water diffusion leads to a relative computational error of up to 80%. Therefore, under high-humidity conditions, the impact of liquid-water transfer on moisture transfer in building envelopes cannot be overlooked. However, previous studies have often neglected this aspect, focusing primarily on the research and calculation of vapor permeation coefficients.
In the Jiangnan region, located south of the Yangtze River in China, due to special climatic phenomena such as the plum rain season and “returning south days”, when air humidity approaches saturation, as well as frequent continuous rainfall during seasonal transitions, dampness is a recurring issue. The external moisture intrusion often leads to excessively high indoor relative humidity, resulting in frequent condensation and dew formation [7]. Buildings in this region are thus constantly exposed to high-humidity weather conditions. On the one hand, water vapor condenses on the surface of the building envelope into small droplets or forms flowing water layers, causing erosion on the surface. On the other hand, the moisture penetrating from the surface into the building envelope reduces the thermal performance of the material components [8], indirectly leading to the formation of thermal bridges within the envelope. Furthermore, the high-humidity environment promotes the growth and reproduction of mold and other bacteria, significantly increasing the likelihood of humans contracting diseases such as typhoid, dysentery, various digestive system disorders, and skin diseases [9]. In some regions, this environment even becomes a breeding ground for building pests. In such a high-humidity environment, the study of moisture transfer and its impact on the thermal performance of building envelopes is of great significance. However, the current research on moisture transfer worldwide is not yet comprehensive, especially regarding the testing and study of the liquid-water diffusion coefficient, which remains to be improved.
Research on moisture transfer coefficients abroad began earlier. As early as the mid-20th century, scholars established partial differential equations to describe the heat and moisture transfer within porous building materials [10,11,12]. Before the 1990s, the steady-state vapor permeation model proposed by Glaser was the mainstream method for calculating heat and moisture transfer. After the 1990s, the HAM model became the dominant tool for heat and moisture transfer analysis. Scholars, such as Hens and Kumaran, from 14 Western countries participated in two joint projects, IEA Annex 14 and IEA Annex 24, testing the heat- and moisture-based physical properties of commonly used building materials. They compared 29 HAM models that analyze heat and moisture transfer in building enclosures and tested most of the moisture transfer and storage functions across 44 and 32 materials [13,14]. Subsequent projects, such as the ASHRAE 1018RP project [15], supplemented the test results of 32 materials, improving earlier research findings. To date, a relatively comprehensive database of moisture physical properties has been established [16], providing data support for the development of empirical models for calculating moisture transfer coefficients. However, the test results regarding liquid-water transfer coefficients are incomplete, with some materials lacking data on liquid-water diffusion coefficients and capillary absorption coefficients, and most materials missing data on capillary-saturation moisture content. Furthermore, the moisture transfer coefficients of some newer building materials have not yet been included in this database. Moreover, due to differences in manufacturing processes and raw materials, this database is not entirely applicable to regions outside of Europe, such as China [17]. In recent years, more scholars have questioned the accuracy of empirical models used in heat and moisture analysis software like WUFI 6, highlighting the need for supplementary experimental data to adjust the models.
China has made significant progress in the theoretical study of moisture transfer coefficients. In the early stages, scholars like Wang conducted related research based on moisture transfer coefficients [18,19,20,21,22], while scholars like Yan tested the vapor permeability coefficients and isothermal moisture sorption curves [23,24,25]. In recent years, China has made notable advancements in theoretical research on heat and moisture transfer in porous building materials [26,27,28], with scholars like Kong developing various HAM models for analyzing heat and moisture transfer [29]. In terms of practical testing, since the beginning of the 21st century, different scholars have successively tested the moisture transfer coefficients of various materials. For example, Jin et al. conducted capillary absorption experiments and obtained the curves [30] showing the variation of water content with time and height for four different mortar concretes, before using these curves to establish theoretical models to estimate the liquid-water diffusion coefficients of mortar. Feng et al. tested various moisture transfer coefficients of porous building materials [31,32,33,34,35], mainly including aerated concrete (both domestic and Belgian), ceramic tiles, calcium silicate boards, and sintered glass. Due to the limited variety of materials tested and some debatable details in the experimental procedures, the generalizability of these conclusions requires further discussion. In summary, current domestic research on moisture transfer coefficients faces issues such as limited material selection, insufficiently comprehensive moisture transfer coefficient types, and a lack of standardized experimental procedures. As a result, a complete research system and a large-scale database have yet to be formed. Thus, testing more porous building materials, promoting the applicability of moisture transfer coefficient research findings, and establishing a complete database of moisture physical properties are essential tasks for advancing moisture transfer research in China.
In conclusion, the current research on moisture transfer coefficients, especially liquid-water transfer coefficients, both domestically and internationally, still requires improvement and updates. On the one hand, the liquid-water transfer coefficients of more untested porous building materials from different regions and with different manufacturing processes need to be measured. On the other hand, the data obtained from these tests should be used to further adjust the empirical models currently employed by mainstream heat and moisture analysis software for calculating liquid-water transfer coefficients. This paper will consider the factors mentioned above and select appropriate materials in order to test their liquid-water transfer coefficients Appendix A.

2. Experimental Plan

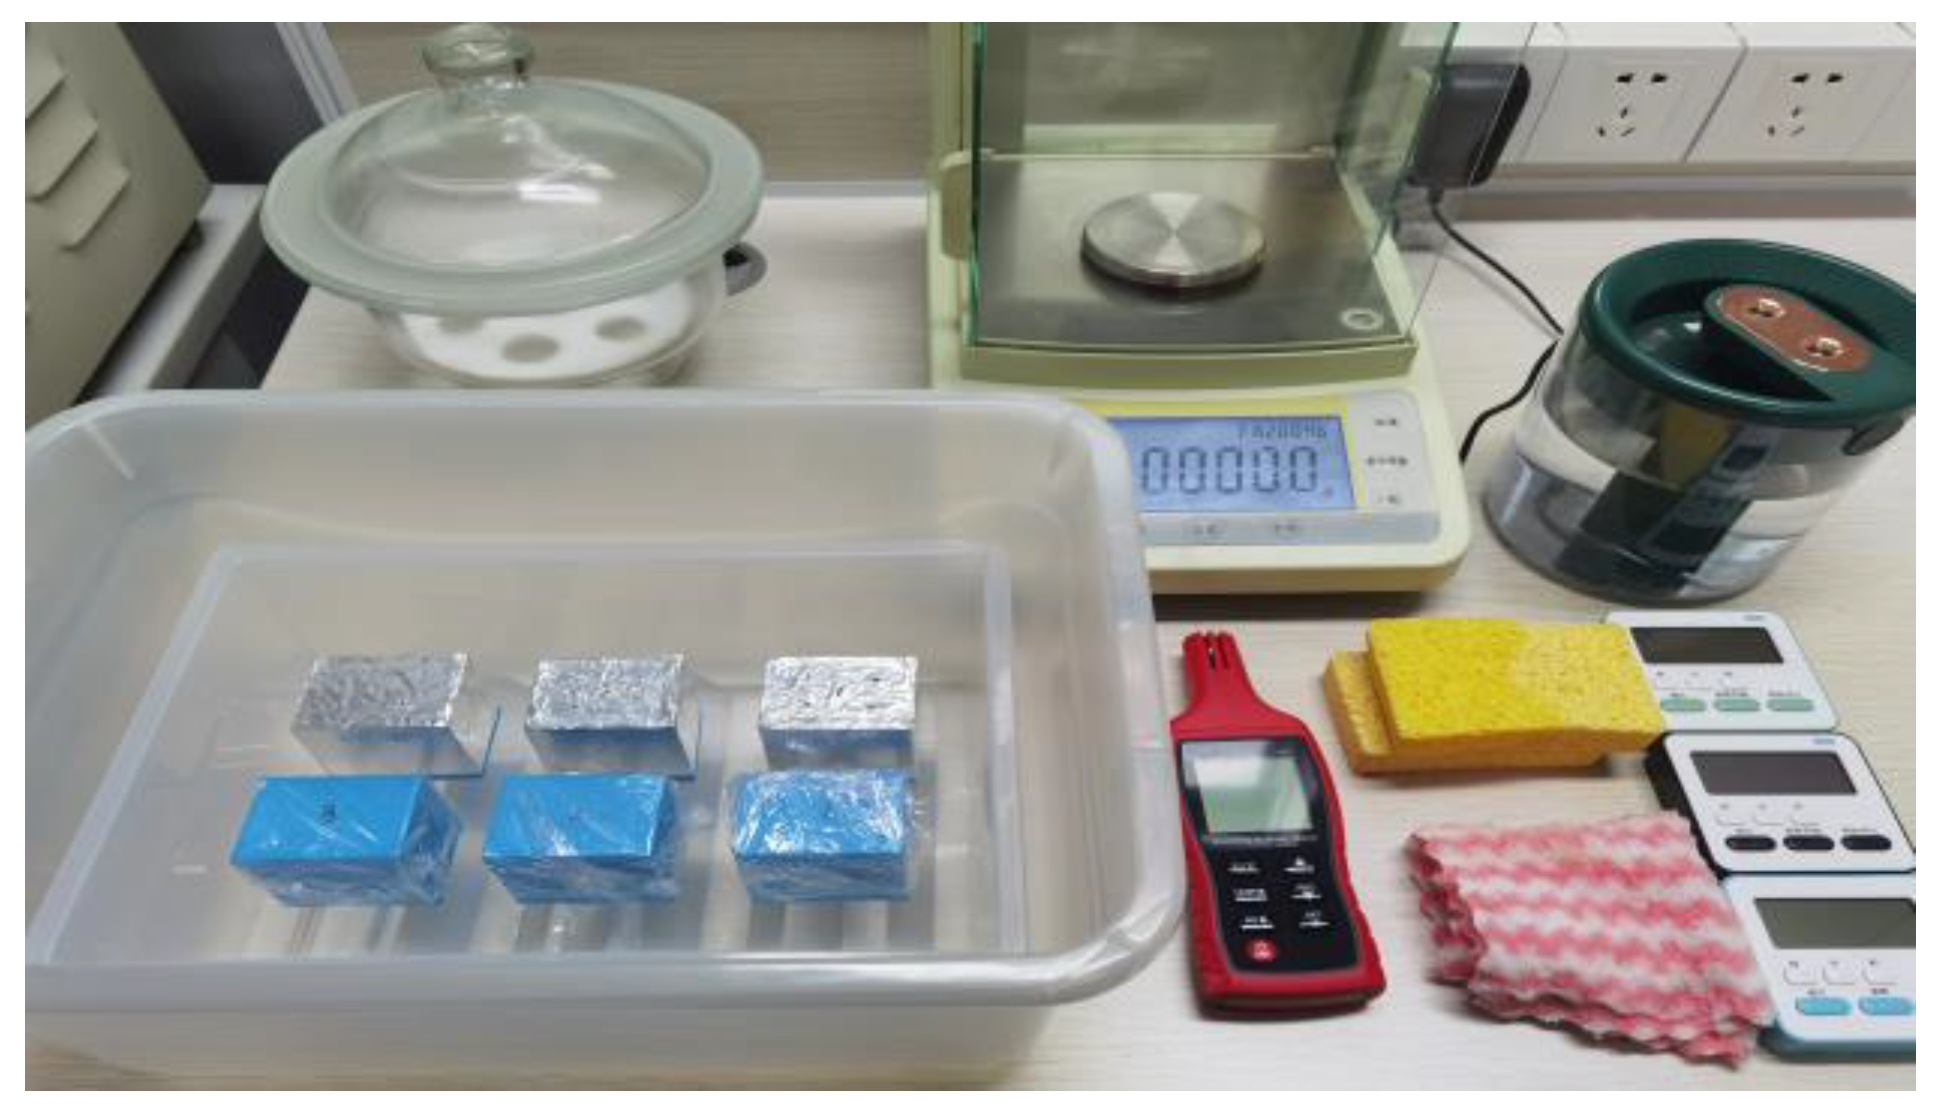
2.1. Capillary Water Absorption Experiment

The liquid-water diffusion coefficient D l   ( m 2 / s ) , liquid-water permeability coefficient K l   ( k g / m · s · P a ) , and capillary absorption coefficient A c a p  ( k g / ( m 2 · s 0.5 )) are the main components of the liquid-water transfer coefficient. Among them, the capillary absorption coefficient can be directly measured through experiments, while the liquid-water permeability coefficient is generally derived from the liquid-water diffusion coefficient. However, the liquid-water diffusion coefficient itself is difficult to measure continuously using conventional experimental methods. Non-destructive experimental methods that support continuous measurements, such as gamma-ray or nuclear magnetic resonance (NMR) methods, require expensive equipment and involve complex operational procedures and subsequent calculations, making them difficult to popularize [36]. In practical applications, known moisture transfer coefficients and moisture storage coefficients are typically substituted into empirical models related to liquid-water transfer for conversion. For example, the K i e β l K ü n z e l empirical model in the WUFI series software only requires the input of the material’s capillary absorption coefficient A c a p and capillary-saturation moisture content w c a p to obtain a fitted curve of the liquid-water diffusion coefficient relative to the moisture content. These two parameters need to be obtained by establishing a one-dimensional moisture transfer process within the capillary range through experimentation.
Capillary absorption experiments, using the material’s own capillary pressure as the driving force, were conducted for this study. By measuring the transient distribution of moisture content in the specimens, a one-dimensional moisture transfer process was established. Specific experimental methods and equipment settings refer to the current international standard ISO 15148:2002 (E) [37]. Before the experiment began, it was necessary to dry and cure the specimens and measure and record their initial weights m d r y  ( k g ), soaking surface areas A ( m 2 ), and heights H ( m ). Specimens were weighed at regular intervals during the experiments to determine the moisture-content weight m m o i s t u r e  ( k g ), and the weight-change of the moisture content inside the specimens at the corresponding time point was calculated as Δ m = m d r y   m m o i s t u r e  ( k g ). The experimental setup is shown in Figure 1.
The linear fitting of experimental results takes the square root of different measurement periods t ( s 0.5 ) as the X-axis and the water absorption per unit area Δ m /A ( k g / m 2 ) as the Y-axis. Linear fitting was performed for the two stages of the capillary water absorption process. The slope of the fitting line in the rapid water absorption stage (the first stage) is the capillary water absorption coefficient A c a p ( k g / ( m 2 · s 0.5 )) of the porous material, and its calculation formula is shown in Equation (1):
A c a p = Δ m A t
The material undergoes a rapid water-absorption stage (first stage) and a slow water-absorption stage (second stage) when it reaches a critical point and is in a capillary-saturation state [38]. The capillary-saturation moisture content w c a p ( k g / m 3 ) of the material is determined by dividing the intersection ordinate of the two stages of fitting the straight line by the height H of the specimen [39]. The calculation formula is shown in Equation (2).
w c a p = Δ m A H
The liquid-water diffusion coefficient D l   ( m 2 / s ) of porous building materials can be obtained by substituting the above calculation results into theoretical or empirical models for transformation and solution.

2.2. Improvement of Experimental Methods

The current international standard, ISO 15148:2002 (E), specifies the constant temperature and humidity conditions required for experiments [37]. However, some scholars at home and abroad have not tested the liquid-water transfer coefficient of the material under the required conditions, and the accuracy of their results is questionable [40,41]. In this study, capillary water absorption experiments were conducted on materials that were pre-dried and cured under constant temperature and humidity conditions, which, to some extent, reduced the errors in the experimental results caused by changes in environmental conditions.
Non-permeable materials are typically used to seal the sides and top of the specimen to simulate approximately one-dimensional transfer process of liquid water inside the material. For the selection of sealing materials, international standards generally specify several options for scholars, or, in some cases, there are no clear requirements. For example, ISO 15148:2002 (E) requires that the sealing material does not undergo chemical reactions with the tested material or significantly penetrate its pores [37]. For convenience, most researchers use epoxy resin to seal the specimen. Chi Feng and Janssen conducted tests on the water absorption coefficient A c a p and capillary-saturation moisture content w c a p of ceramic tiles sealed with different materials, such as epoxy resin, in their research, and the test results exceeded the thresholds for repeatability errors and statistical similarity. This may be owing to the penetration of the epoxy resin into the sample before solidification, which reduces the effective cross-sectional size of the capillary absorption process of porous materials [35]. Owing to the presence of polystyrene in the test material in this study, to avoid any reaction between the sealing material and the specimen that would affect the experimental results, we decided to use a thin film as the sealing material.

2.3. Selection of Experimental Materials

In selecting test materials, this study considered both field surveys and literature analysis. A survey of the exterior wall construction types of 100 residential buildings in Suzhou, a representative city in the Jiangnan region, showed that 40% of these buildings primarily use clay brick blocks, 20% use cement mortar blocks, and the remainder use other block materials. The main insulation materials used are EPS and XPS boards.
In recent years, with the global emphasis on energy efficiency and environmental protection in buildings, certain insulation materials originally used in product packaging, industrial equipment, and pipelines have found their way into building applications—such as exterior walls, roofs, and foundations—thanks to advancements in application technologies. These materials, including foam glass boards and expanded perlite boards, offer excellent thermal insulation properties, lightweight characteristics, and durability. Their use helps reduce heating and cooling energy consumption, thereby lowering the carbon footprint of buildings, a feature increasingly relevant with the rise of energy-efficient buildings. Moreover, these materials meet standards for pollution reduction, energy saving, renewability, and minimized health risks throughout their production, use, and disposal life-cycles, leading to them being recognized as green building materials. Their application is becoming more widespread in the construction industry, and their use holds a key position in the energy-saving codes of multiple countries, proving valuable for the design and implementation of building-envelope systems. However, data on the hygrothermal properties of these new insulation materials remain incomplete in current databases.
In summary, considering both the practical application of building-envelope materials in high-humidity regions and the development and promotion of new green building materials, and in conjunction with the catalog of porous materials included in the IEA Annex 24 and ASHRAE 1018RP projects [14,15], as well as the research advancements made by scholars domestically and internationally, seven commonly used enclosure materials were chosen for testing: expandable polystyrene (EPS), extruded polystyrene (XPS), foam glass (FG), expanded perlite (EP), cement mortar (treated with JCT2329 standard interface agent [42]) (CM), clay brick (CB), and gypsum board (GP). The basic physical properties of the tested materials are shown in Table 1.

3. Data Reliability Analysis

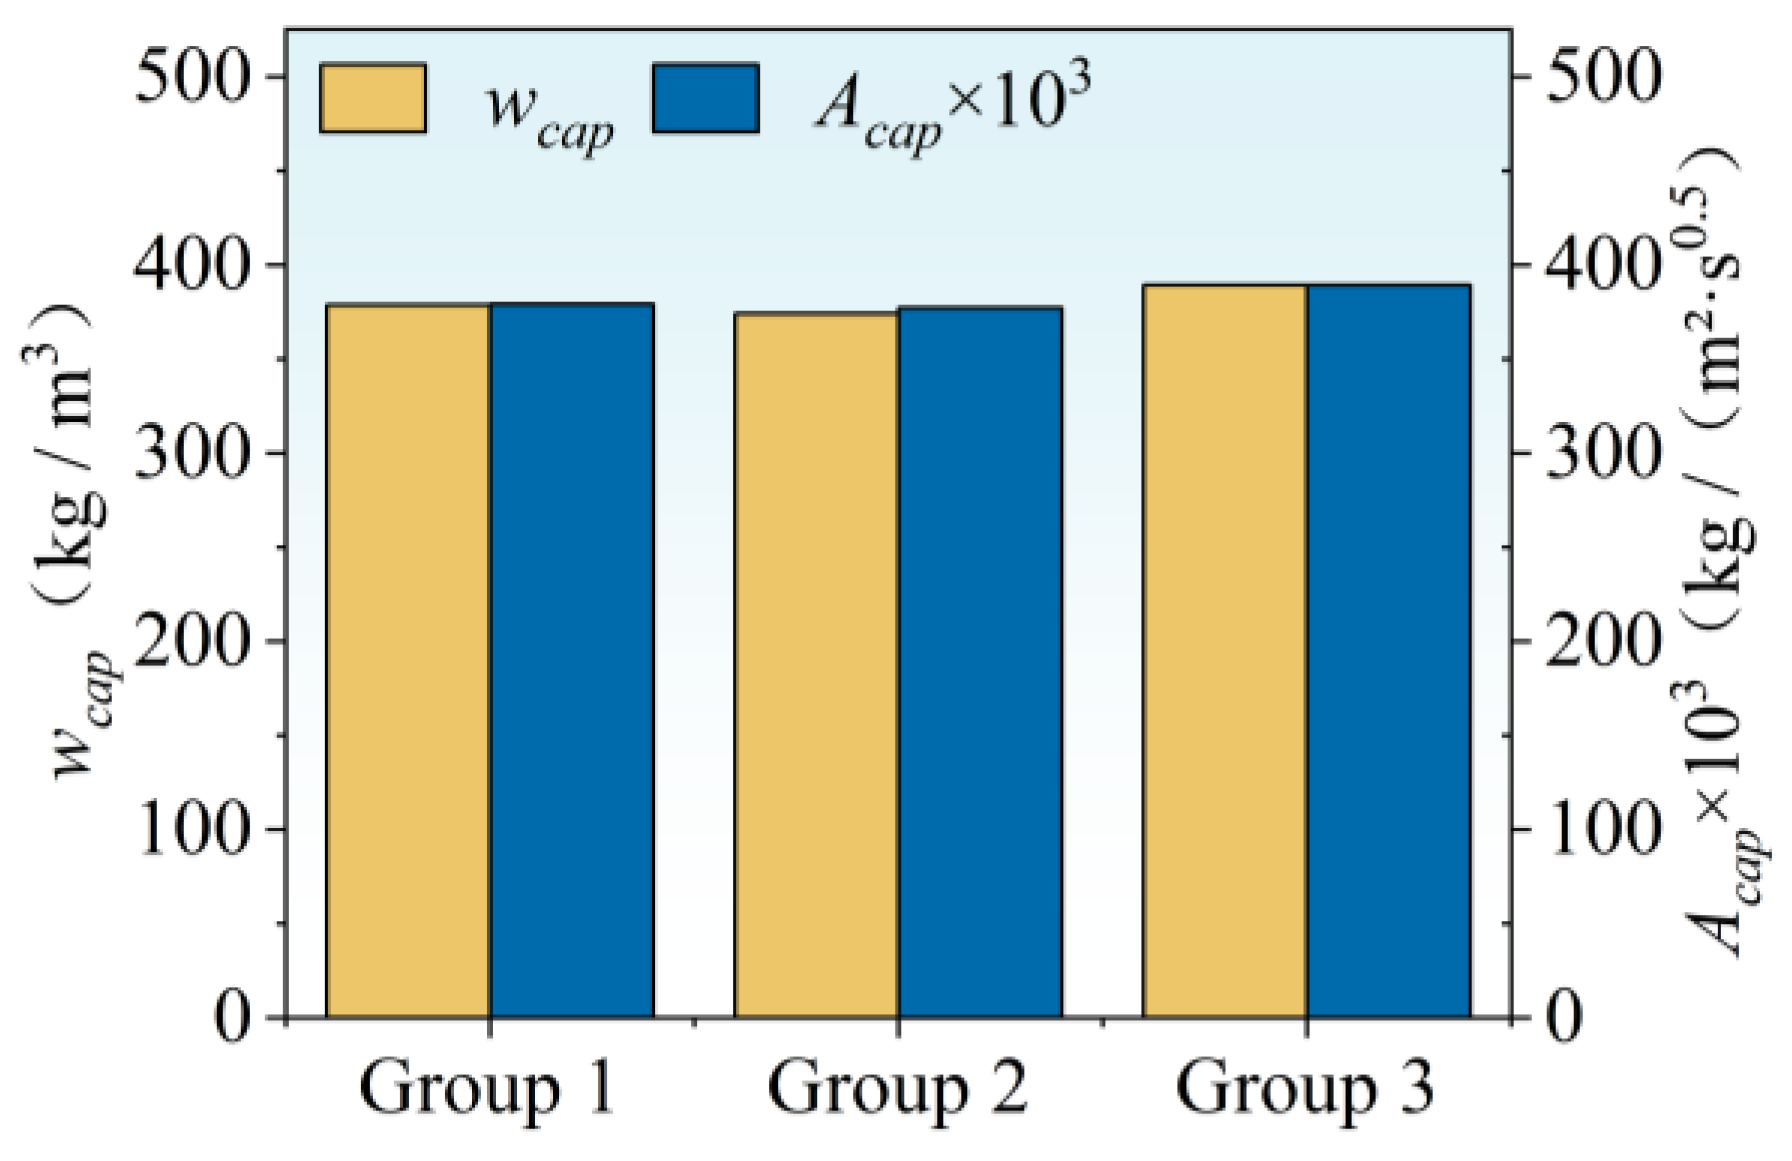
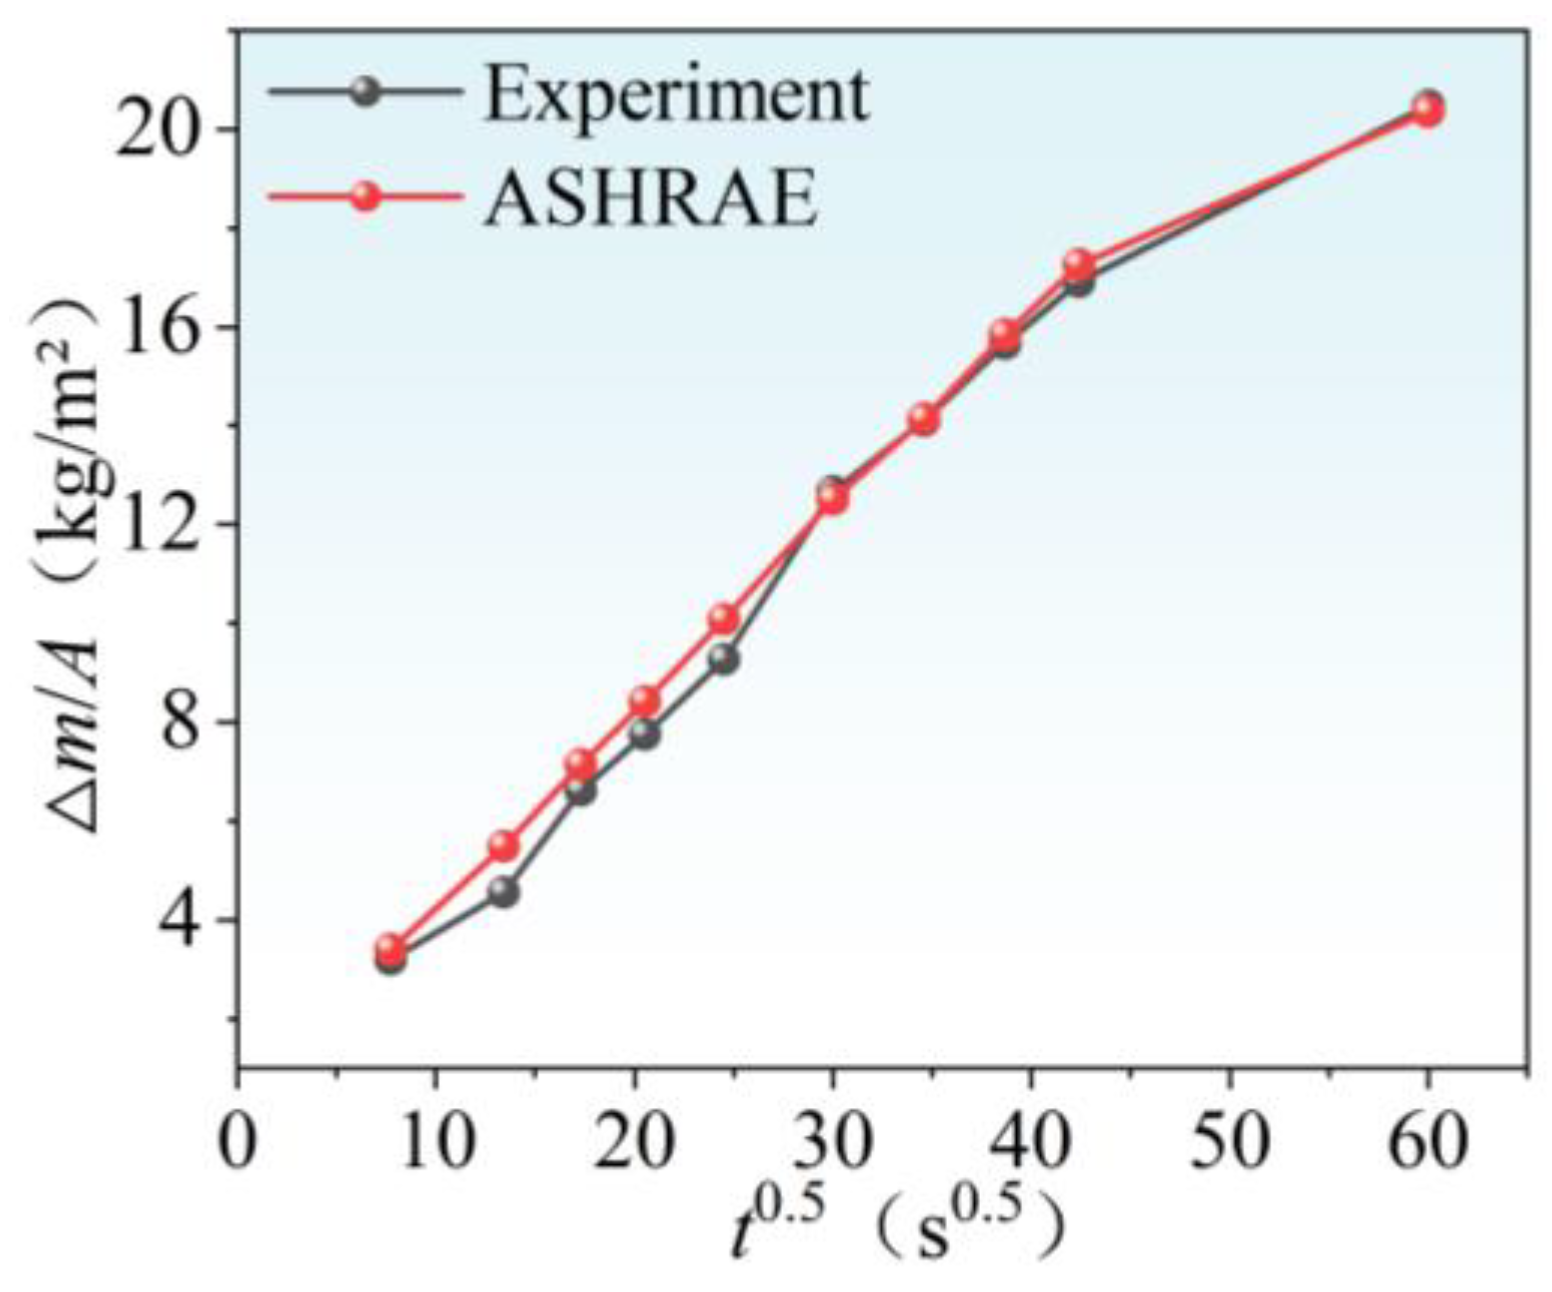
3.1. Control Experiment Results

To verify the reliability of the subsequent experimental results, gypsum was selected as the control material for the capillary water absorption experiments. The measurements of the specimens are mentioned in Table 1, above. After drying and curing, the test piece is sealed with the same sealing material. Two specimens are grouped together, and parallel experiments are conducted in three groups under the constant temperature and humidity conditions of 21 °C and 50% relative humidity. During the experiment, the water level in the tank was closely monitored, and the water lost through evaporation was regularly replenished. Based on the average of the experimental results for each group, the water absorption coefficient A c a p and capillary-saturation moisture content w c a p were calculated, as shown in Figure 2.
The differences between the three sets of experimental data were within the allowable range of the experimental repeatability error. The average value was used for curve fitting and compared with the data from the measurements in the ASHRAE 1018RP project [15]. The comparison results of the water absorption coefficient A c a p are shown in Figure 3 and Table 2.
Figure 3 and Table 2 clearly show that the fitting curves of the two sets of experimental data yield similar results. The calculated result for the water absorption coefficient of gypsum board in the ASHRAE 1018RP project [15] is 0.399 ( k g / ( m 2 · s 0.5 )), with an error rate of 3.5–4.9%. The average result after calculating the data from three experiments in this article is 0.396 ( k g / ( m 2 · s 0.5 )), which is within the allowable range of experimental repeatability error. Additionally, the capillary absorption coefficient of clay brick from this experiment was found to be 0.121 ( k g / ( m 2 · s 0.5 )), which is very close in magnitude to the test result of 0.112 ( k g / ( m 2 · s 0.5 )) for a similar-density sample tested by the NRC of Canada in IEA ANNEX 24 [14]. (Since the document does not provide detailed test data, it is not possible to plot a fitting curve like that in Figure 3). Based on the fitting and calculation results from the comparative experiment charts mentioned above, the experimental results of this study can be considered reliable.

3.2. Results of Capillary Water Absorption Coefficients for Different Materials

To compare the capillary water absorption capacities of different materials under the same temperature and humidity conditions, capillary water absorption experiments were conducted on six materials—EPS, XPS, FG, EP, CM, and CB—under identical operating conditions. Each material was divided into three groups for testing, with each group consisting of two specimens. The specimens were subjected to the same treatment method and tested under identical conditions. The averages of the results from the three experiments were then calculated, and the final results are shown in Figure 4 and Table 3.
The different results in the water absorption rates over time for the six materials can be clearly observed in Figure 4 and Table 3. Among all the materials, CB exhibited the highest capillary water absorption rate, and CM, which has a density second only to CB, also demonstrated strong water absorption capacity. This suggests that these materials have significant potential for applications in building insulation or humidity control. Compared to the other four materials, EPS and XPS showed very low capillary water absorption rates, indicating that their porosity is much lower than those of the other materials, making it difficult for moisture to penetrate through capillary particles. This aligns with the definition of closed-cell structures in porous materials. Typically, these materials are widely used as low-hygroscopic insulation materials due to their excellent waterproof properties. As for the other four materials, they all displayed a rapid linear increase in water absorption rate in the initial stages, which then gradually leveled off. This pattern is characteristic of capillary water absorption, and the time points at which they reached capillary saturation were very close. Notably, FG and EP, which had similar mass and water absorption coefficients, exhibited highly similar capillary water absorption curves, both in shape and as to the time points at which they reached capillary saturation. This indicates that the capillary absorption characteristics of materials are closely related to their basic physical properties, as also reflected in the calculated results shown in Table 3.
In conclusion, the differences in water absorption rates among the materials highlight their significant distinctions in moisture transfer performance. This underscores the importance of selecting appropriate materials based on their moisture transfer characteristics to meet practical needs such as moisture resistance and insulation.

4. The Influence of Sealing Materials on the Test Results for the Capillary Water Absorption Coefficient

To avoid a reaction between the epoxy resin and the specimens, which might affect the experimental results, and considering the practice of using waterproof construction layers in actual engineering, we decided to use self-adhesive and non-adhesive films as sealing materials for comparative experiments. Regarding the influence of these two types of films on the results of capillary water absorption experiments, some scholars have studied the effects of different thin films on the test results for A c a p and ω c a p of four materials, including calcium silicate. They concluded that the experimental results obtained using different films were similar [35]. Owing to the limited variety of samples tested and the fact that the difference between the two experimental results for the autoclaved aerated concrete, among the four test materials, was much greater than the repeatability error, it cannot be asserted that the two films have no effect on the experimental results. In this study, under identical conditions, each test material was divided into three groups, with each group consisting of two specimens of the same type, each specimen was treated with different sealing materials, using both self-adhesive and non-adhesive films, to conduct a comparative experiment; the experimental results are shown in Figure 5.
As shown in Figure 5, data obtained from experiments using self-adhesive film for sealing generally exhibit greater stability compared to those from experiments using non-adhesive film. To further refine the analysis, the standard deviation and coefficient of variation were calculated for the two sets of data for each test material. The results are presented in Table 4.
The calculation results are presented in Table 4, and the results further support the intuitive conclusion obtained from the chart, which shows that the dispersion of the experimental data obtained using self-adhesive films is significantly smaller than that obtained using non-viscous films. It is worth noting that there appears to be a correlation between the data dispersion of the two thin-film experimental results and the density of the porous materials. Owing to the limited sample size in this study, further research and analysis are needed.

5. Investigation of the Calculation Model of the Liquid-Water Diffusion Coefficient

5.1. Discussion of the Fitting Results of Three Empirical Models

Since calculating the liquid-water diffusion coefficient using theoretical models generally requires obtaining the moisture front migration distance during capillary water absorption experiments, this method was employed in the ASHRAE 1018RP project. In that project, the liquid-water diffusion coefficient of materials was derived by first obtaining the moisture front migration distance using the Gamma ray method, and then substituting it into the Boltzmann variable for solving [15]. However, the equipment used in this method is expensive, and the operations and calculations are complex, making it difficult to apply in practical situations. As a result, many researchers have proposed empirical models for calculating the liquid-water diffusion coefficient based on experimental data. The model used in the coupled heat and moisture transfer analysis software WUFI 6 was taken as an example, as it only requires the input of the capillary water absorption coefficient and capillary saturation moisture content of the material. From this, a function describing the variation of the liquid-water diffusion coefficient with moisture content can be derived, as shown in Formula (3).
D l = 3.8 × A c a p w c a p 2 × 1000 w w c a p 1
Among these terms, w   ( k g / m 3 ) is the mass-to-volume ratio of the moisture content.
In earlier work, Krus and Künzel proposed an empirical model in their research to estimate the average water diffusion coefficient based on the water transport equation; this is not an accurate value at different moisture contents, but the calculated results are considered correct within an order of magnitude [44], as shown in Formula (4):
D l A c a p w c a p 2
Subsequently, considering the shape of the moisture-content front, Krus and Künzel revised the formula [45], as shown in Formula (5):
D l = π 4 × A c a p w c a p 2
The calculation results of the liquid-water diffusion coefficients for the five materials, obtained using the three different empirical models, are shown in Figure 6 and Table 5.
As shown in Figure 6 and Table 5, the fitting curves for the five materials, as obtained using Formula (3), closely match the curves obtained from estimations using Formula (4) and Formula (5) in terms of magnitude before the material reaches its capillary-saturation moisture content. Moreover, compared to estimation of Formula (4), the modified estimation of Formula (5) provides a closer fit to the liquid-water diffusion coefficient results calculated from Formula (3), as moisture content varies. Further analysis reveals that the interval where the liquid-water diffusion coefficient begins to increase sharply occurs near the intersection points of the three fitting curves (as shown in the magnified sections of Figure 6). Based on this observation, the concept of critical capillary moisture content is introduced. Before reaching this critical value, the results obtained from a constant model and a variable model differ only slightly in magnitude, making it feasible to use the constant model to simplify calculations in practical applications. The capillary moisture-content values at the intersection points of the fitting curves for the six materials were calculated, and the results are shown in Table 6.
Table 6 presents the calculated capillary moisture content at the intersection points of the three empirical model fitting curves. According to the results, the critical capillary moisture content at which the liquid-water diffusion coefficient fitting curves for the six materials undergo a sudden change is approximately 80% (considering practical applications, taking integers here is convenient for discussion). Using this point as the first boundary and the capillary-saturation moisture content as the second, the average liquid-water diffusion coefficient in the interval before the boundary was calculated using Formula (3), with the results shown in Table 7.
Further correlation analysis was conducted on the diffusion coefficient calculation results obtained from three empirical models for the six materials in Table 5 and Table 7. The results of the analysis are shown in Table 8.
The data presented in Table 8 clearly reflect the correlation analysis between the average calculation results obtained from Formula (3) and those from Formulas (4) and (5) for the six materials, using different capillary moisture-content levels as boundaries. Compared to using the fully saturated capillary moisture content as a boundary, when the 80% capillary moisture content is used as the boundary, the average calculation results from Formula (3) more closely match the results from the constant models given by Formulas (4) and (5). This further supports the rationality of segmenting the calculation model for liquid-water diffusion coefficients based on the 80% capillary moisture content as a critical point. Additionally, when w ≤ 80%, the p-values between the average calculation results of Formula (3) and those of Formulas (4) and (5) are all less than 0.05, indicating that the correlation between them is significant and not due to random factors. This means that, when the material’s capillary moisture content has not yet reached the critical point of 80%, Krus and Künzel’s empirical formulas (Formulas (4) and (5)) can be used to reliably calculate the liquid-water diffusion coefficient. Moreover, compared to the empirical Formula (3) used in the WUFI 6, these two formulas are constant models that only depend on the material’s absorption coefficient and capillary-saturation moisture content, making them simpler to calculate and more applicable in practical situations.

5.2. Segmented Discussion on the Calculation Model of the Liquid-Water Diffusion Coefficient

Due to the fact that the correlation coefficient R values between the average calculation results of Formula (3) in Table 7 and those from Formulas (4) and (5) are too close, it is difficult to determine which of the two formulas, (4) or (5), more accurately matches the average results from Formula (3). Therefore, this study uses Formula (4) as the baseline, and based on the experimental test and calculation results of the six materials in Table 6 and Table 7, a nonlinear regression fitting method is applied to propose a constant calculation model for the liquid-water diffusion coefficient D l , one related to A c a p and w c a p , when w   80 % , as shown in Formula (6):
D l = 1.716 × 10 5 A c a p w c a p 4 + 0.2692 A c a p w c a p 2
The liquid-water diffusion coefficients of the six materials were calculated using Formula (6), and the results are shown in Table 9.
The correlation analysis for the calculated result from Formula (6) and the average calculation result obtained from Formula (3) above ( w 80 % ) is shown in Table 10.
As shown in Table 10, the correlation coefficient R between the diffusion coefficient values of the six materials obtained from Formula (6) and the average data obtained from Formula (3) ( w 80 % ) is 0.8517, with a p-value of 0.03135. This indicates that the correlation between the results is superior to those from Formulas (4) or (5). Although Formula (6) demonstrates better correlation, the limited number of tested materials constrains its generalization. Therefore, future tests on a wider range of materials are anticipated to further refine and optimize the coefficients used in the model, enhancing its accuracy and applicability in practical engineering scenarios.
To further verify the reliability of Formula (6) in calculations, this paper selected some test results from the domestic and international literature for additional validation. The basic physical properties of the materials, capillary water absorption test results, and liquid-water diffusion coefficients calculated using different empirical models are shown in Table 11.
As shown in Table 11, the calculation results of Equation (6) are closer to the average calculation results of Equation (3), compared to Equation (4). This further corroborates the reliability of Equation (6) in adapting to different types of porous building materials. It also implies that in practical applications, when the moisture-content range within the building envelope meets the specified conditions, there is no need for complex calculations. Instead, by providing the fixed values of parameters A c a p and w c a p for the material, the proposed estimation formula can yield a more accurate estimation of the liquid-water diffusion coefficient D l .
When the capillary moisture content inside the material is >80%, although the WUFI formula is relatively simple to calculate, it is not always accurate [47]. Therefore, this study plans to propose a new empirical model for calculating the liquid-water diffusion coefficient based on the test results obtained using gamma rays in IEA Annex 24 and ASHRAE 1018RP. In these two projects, most of the tested materials did not provide the capillary-saturation moisture content required for the calculation in Equation (5), and some materials had not undergone tests to determine their capillary absorption coefficient and liquid-water diffusion coefficient. Based on these screening conditions, this paper selects clay brick and gypsum board to fit the test results from the IEA Annex 24 and ASHRAE 1018RP projects, as well as the calculated results using the WUFI formula under the corresponding moisture content. The obtained results are shown in Figure 7.
As can be seen from Figure 7, when the moisture content of the two materials has not yet reached capillary saturation in the early stage, the calculated results of the liquid-water diffusion coefficient using the WUFI formula are relatively close in magnitude to the actual test values. This is consistent with the conclusions obtained in Figure 7 and Table 6, further supporting the rationality of the segmented discussion mentioned earlier. Therefore, when the capillary moisture content inside the material is ≥80%, the calculation results using the K i e β l - K ü n z e l model are no longer accurate, and a new calculation model that better aligns with the measured data should be proposed. Based on both some empirical models cited in the literature referenced in IEA Annex 24 and the K i e β l - K ü n z e l model, the following fitting formula is proposed:
D l = K × A c a p w c a p 3 × exp ( ( w w c a p ) / b ) + c
Using Equation (7), multiple nonlinear curve-fitting procedures were performed on the gamma-ray test results for clay brick and gypsum board. Error functions and nonlinear least squares methods were employed to adjust and optimize the fitting formulas. The final results are presented in Table 12.
Due to the uncertainty in the estimation of moisture diffusion rate, which can be as high as 30–50% when obtaining the moisture front distribution inside the material using gamma rays [15], the diffusion coefficient data obtained through Boltzmann variable transformation is unstable; this also leads to a temporary uncertainty in the correction coefficient K. It is speculated that this value is a constant related to the material density and porosity. More materials need to be selected for testing in future research to further limit the range of K values.
In practical projects, the capillary moisture content within materials generally cannot reach saturation. As mentioned earlier, in the study by Carmeliet and Roels [5], it was determined that when the relative humidity ranges between 90% and 100%, materials achieve the maximum value of their capillary sensitivity coefficient. However, even under these conditions, the capillary moisture content of the material often does not reach saturation. Taking gypsum board and concrete as examples, the moisture sorption isotherm experimental data shows that the capillary moisture content accounts for about 30–50% of the total moisture content when the relative humidity is below 90%. However, in high-humidity environments, those with a relative humidity above 90%, the capillary moisture content gradually becomes the main moisture content; this is especially the case when the relative humidity is above 95%, when the proportion of capillary moisture content will be around 60% [48,49,50]. Therefore, in practical scenarios, the capillary moisture content within materials cannot reach full saturation. It is typically lower than, but approaches, 80% of the capillary-saturation moisture content. Carmeliet and Roels also pointed out that while the influence of relative humidity on capillary moisture content varies across different materials, most porous building materials studied so far fall within this range. Consequently, Formula (6) is sufficient for calculating the liquid-water diffusion coefficient in the moisture transport coefficient of enclosure structures under most practical relative-humidity conditions in humid regions.

6. Conclusions

Based on the progress in the research of hygroscopic properties databases, and taking into account the practical applications for both traditional building materials and green building materials in building enclosures, this paper selects seven commonly used porous building materials as test subjects: expanded polystyrene (EPS), extruded polystyrene (XPS), foam glass (FG), expanded perlite (EP), cement mortar (CM), clay brick (CB), and gypsum board (GP). The following conclusions are drawn:
  • The study measured and calculated several liquid-water transfer coefficients and moisture storage coefficients for seven materials, including capillary water absorption coefficients   A c a p ( k g / ( m 2 · s 0.5 )), capillary saturated moisture content w c a p   ( k g / m 3 ) , and liquid-water diffusion coefficient D l   ( m 2 / s ) . These findings supplement both domestic and international moisture physical property databases by filling in previously unrecorded or missing data on the moisture properties of these materials (see Table 2, Table 3 and Table 5 for details).
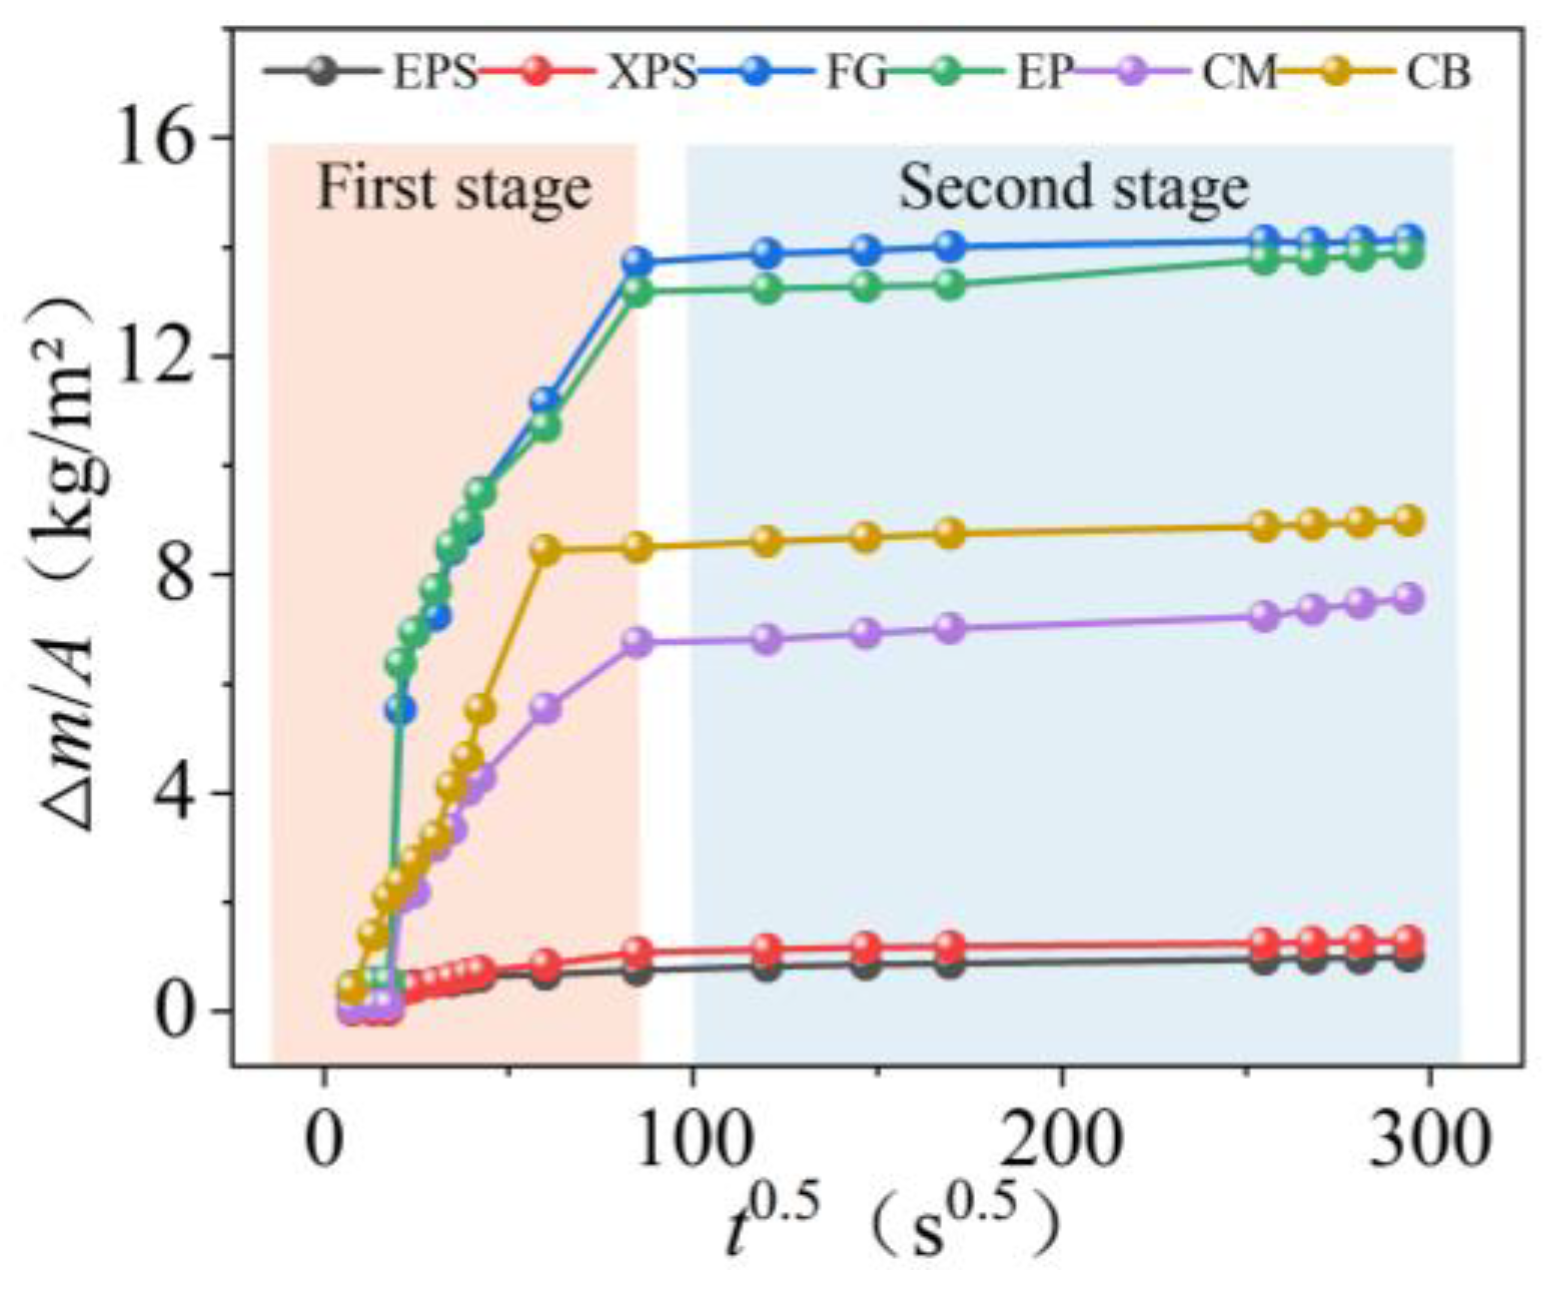
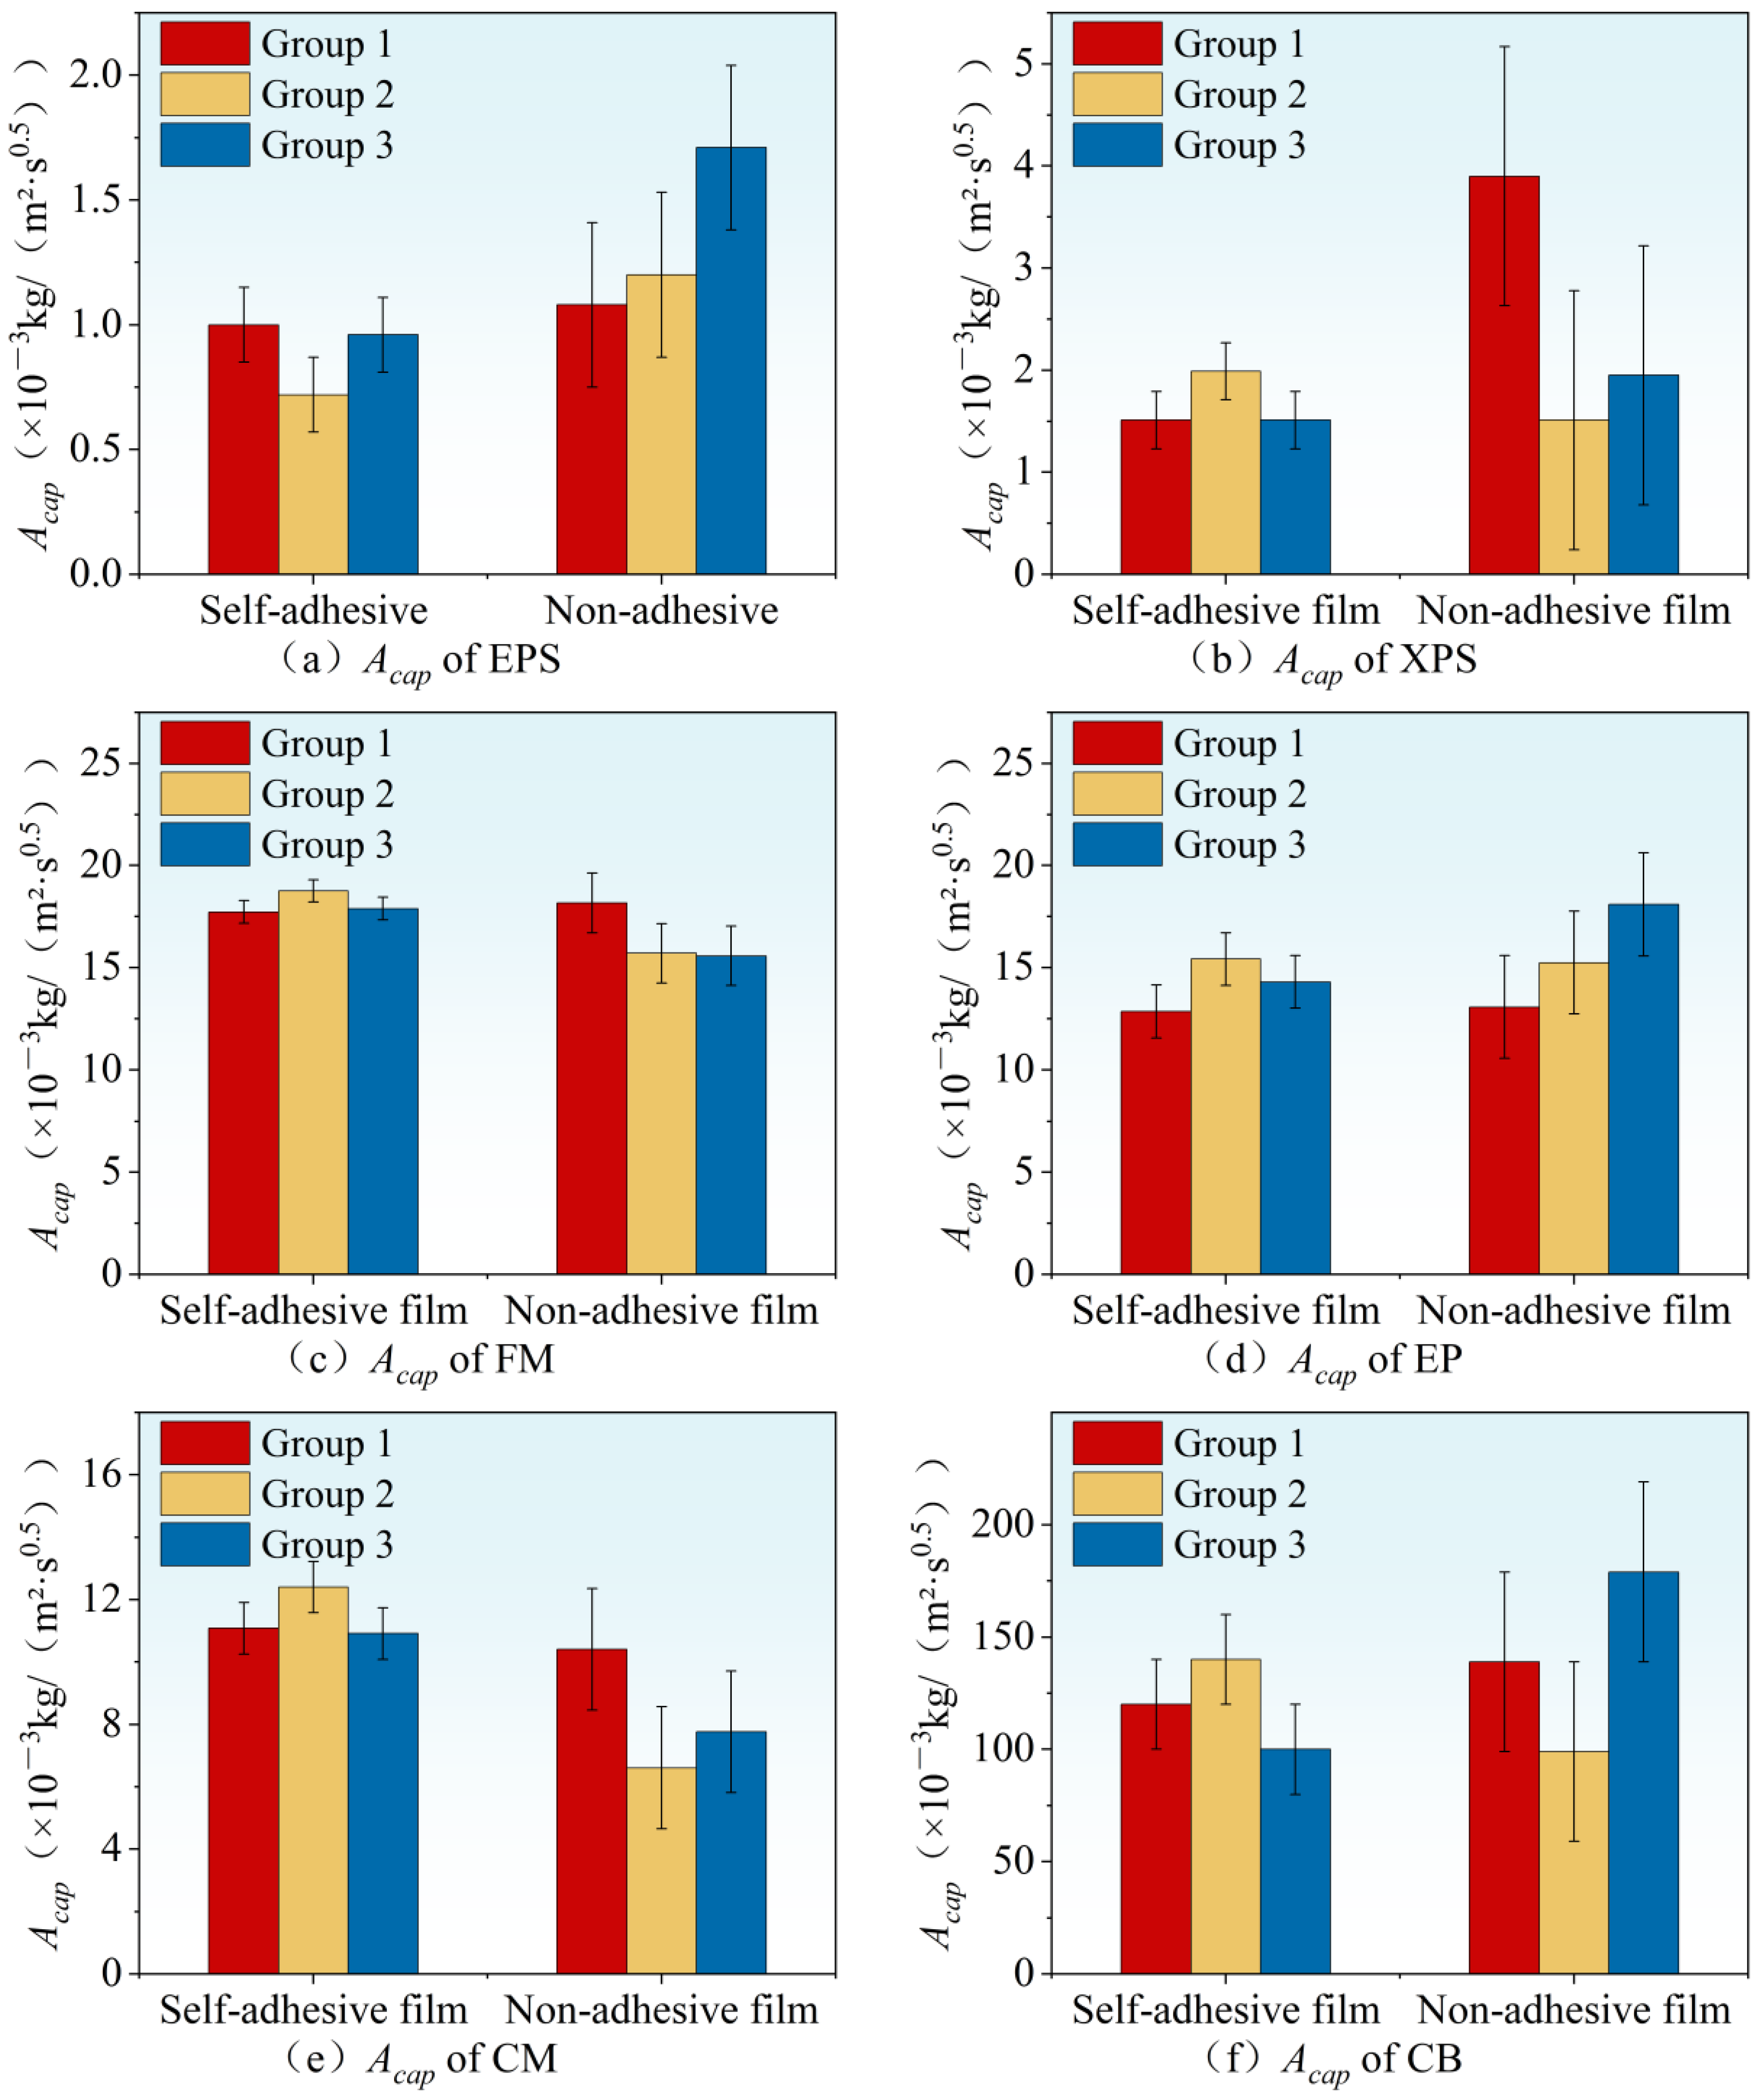
  • A comparison of the capillary water absorption rates and water absorption capacities of six of the materials was performed (see Figure 5 and Table 4). In terms of capillary water absorption rate, CB showed the highest rate, followed by FG, EP, and CM, with EPS and XPS having the lowest rates. In terms of water absorption capacity, FG and EP performed best, followed by traditional materials CB and CM, while EPS and XPS, both with closed-cell structures, exhibited the weakest water absorption capacity, which reflects the determination that the water absorption capacity of the material is related to both porosity and density.
  • The effects of the two types of sealing materials used during the capillary water absorption experiment on the experimental results were compared. The dispersion of the data was analyzed (see Figure 5 and Table 4). Based on this analysis, it was concluded that the experimental data obtained using self-adhesive film as the sealing material had better stability than those obtained using non-adhesive film.
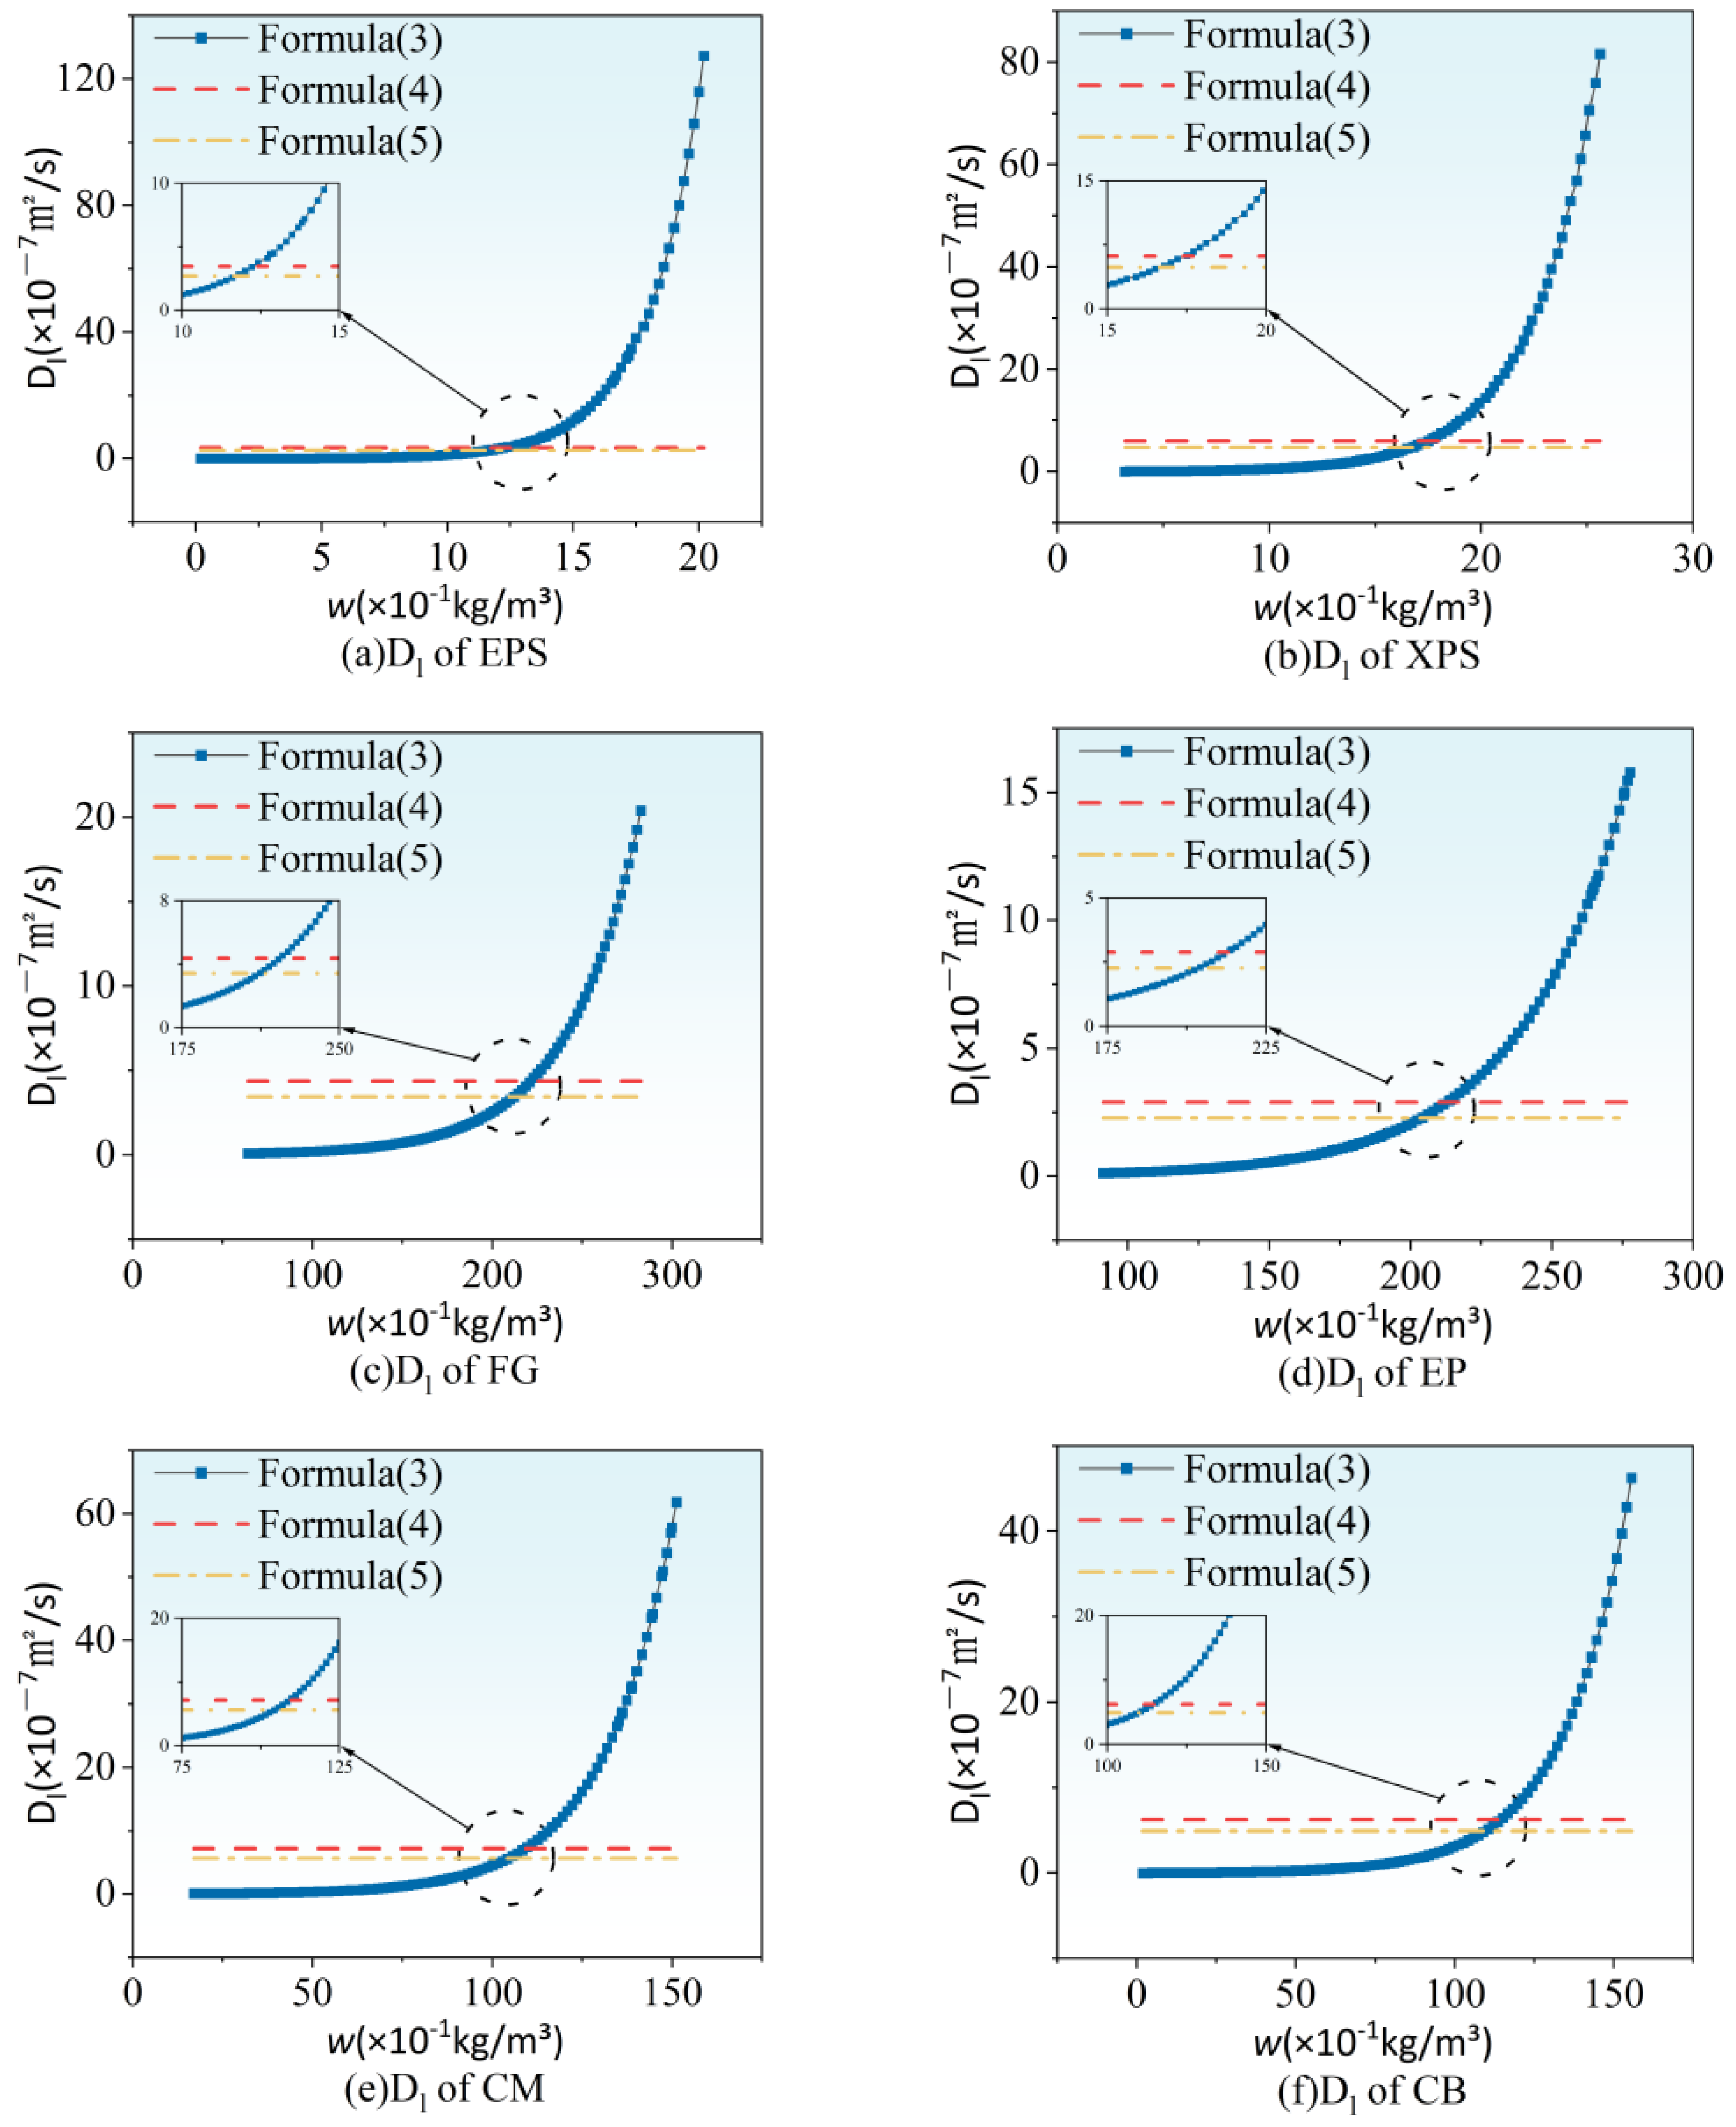
  • The liquid-water diffusion coefficients of the six materials, calculated using three different empirical models, were compared (see Figure 6, Table 5 and Table 7). Based on the rate of change in the diffusion system of liquid water, the concept of critical capillary moisture content was proposed, with a moisture percentage of 80% set as the boundary point, and the rationale for selecting this threshold was analyzed (see Table 6 and Table 8). Based on this analysis, a segmented discussion of the liquid-water diffusion coefficient calculation models was conducted. A more correlated constant calculation model for w ≤ 80% was proposed, based on the fitting results of the six materials (see Formula (6)). The calculation results of Formula (6) were verified by combining the domestic and international existing research. Based on the analysis and discussion of capillary moisture content within materials under actual relative-humidity conditions, the vast majority of high-humidity scenarios fall within the applicable range of Formula (6).
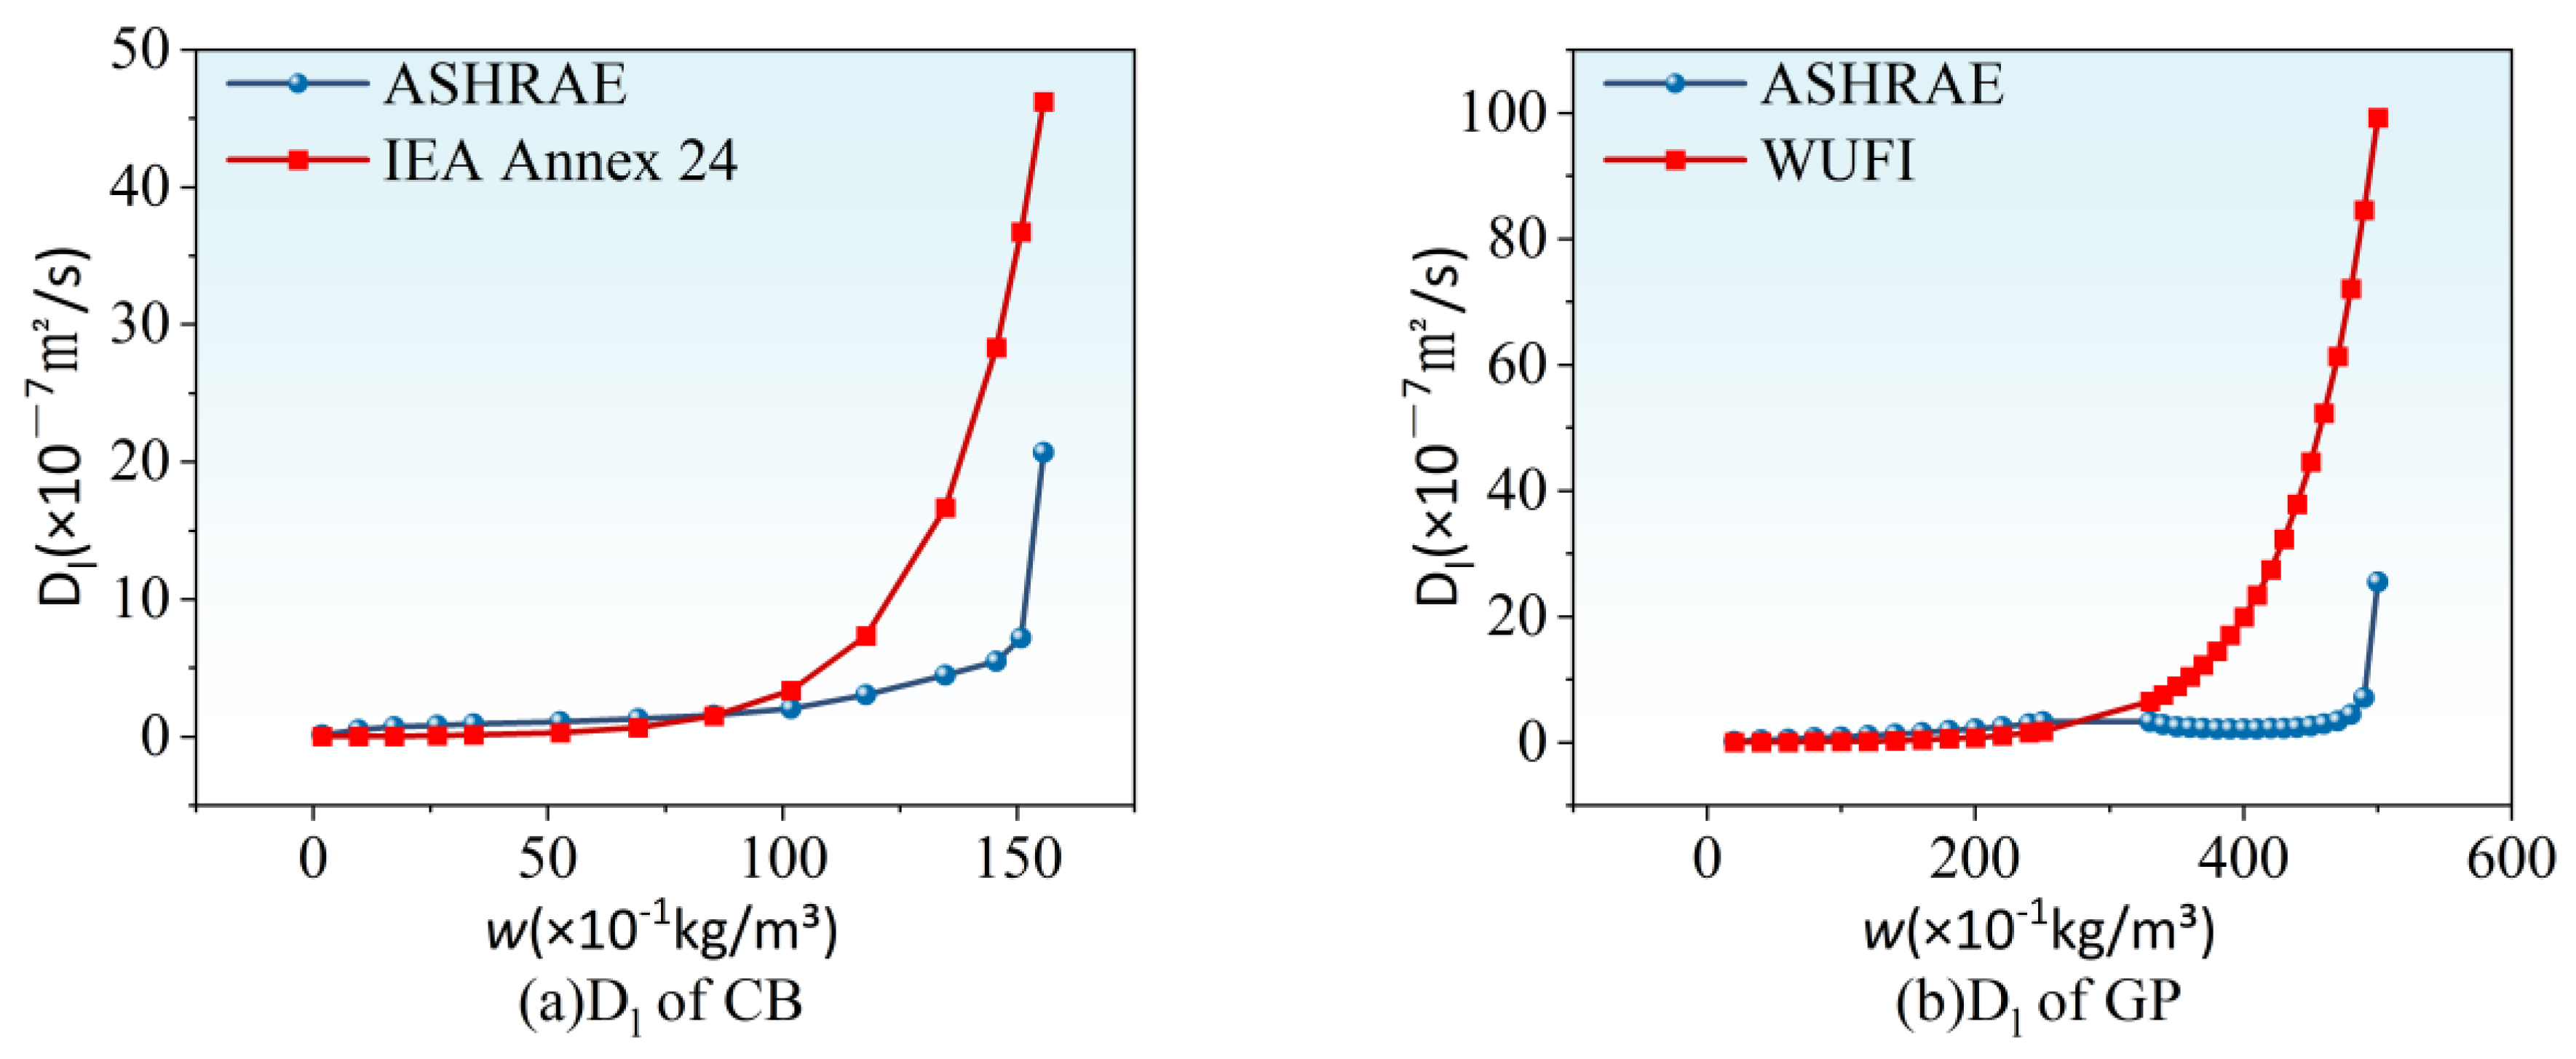
  • A comparison of the experimental results from IEA Annex 24 and ASHRAE 1018RP with the data calculated using Formula (3) was conducted. A revised empirical model for w ≤ 80% was proposed. A more correlated fitting function formula for the liquid-water diffusion coefficient, using the capillary water absorption coefficient and capillary-saturation moisture content as parameters, and moisture content as the independent variable, was proposed based on the existing empirical models (see Formula (7) and Table 12). Further refinement of the coefficients in this formula will require expanding the range of materials studied in the future.

Author Contributions

Conceptualization, Y.L. and D.L.; methodology, Y.L.; software, Y.L.; validation, Y.L.; formal analysis, Y.L.; investigation, Y.L.; resources, Y.L. and D.L.; data curation, Y.L.; writing—original draft preparation, Y.L.; writing—review and editing, Y.L.; supervision, D.L.; project administration, Y.L.; funding acquisition, Y.L. All authors have read and agreed to the published version of the manuscript.

Funding

This research was funded by the National Natural Science Foundation of China (No. 51908393) and the Postgraduate Research & Practice Innovation Program of Suzhou University of Science and Technology (SJCX23_1693).

Data Availability Statement

Additional data will be made available upon request.

Conflicts of Interest

The authors declare no conflicts of interest.

Appendix A

Table A1. Source of Experimental Equipment and Materials.
Equipment and MaterialSources
PhytotronSuzhou University of Science and Technology, Suzhou, China
Electric hot blast drying oven 101-0A typeTianjin Test Instrument Co., Ltd., Tianjin, China
Electronic Analytical Balance FA2004bShanghai Yueping Scientific Instrument Co., Ltd., Shanghai, China
Industrial temperature and humidity meter THM-01Delixi Electric Co., Ltd., Zhejiang, China
HumidifierShenzhen Maske Trading Co., Ltd., Shenzhen, China
Gypsum boardWeifang Tianxiang Building Materials Co., Ltd., Shandong, China
EPS and XPSHebei Jimeilin Foam Plastic Products Co., Ltd., Hebei, China
Foam glassLangfang Rongjin Environmental Protection Technology Co., Ltd., Hebei, China
Expanded perliteHubei Keluda Building Materials Co., Ltd., Hubei, China
Cement mortarXuzhou Chengyi Precision Technology Co., Ltd., Xuzhou, China
Clay brickYixing Shenyun Ceramics Co., Ltd., Wuxi, China

References

  1. Zhong, H. Study on Thermal and Moisture Physical Properties of Porous Building Materials and Their Applications. Ph.D. Thesis, Southwest Jiaotong University, Chengdu, China, 2011. [Google Scholar] [CrossRef]
  2. Huang, B.; Qian, C. Capillary Absorption Phenomenon of Concrete with Admixtures. Concr. Cem. Prod. 2008, 4, 14–16. [Google Scholar] [CrossRef]
  3. Wang, L. Theoretical Analysis of the Relationship between Capillary Coefficient and Water Absorption Rate in Building Materials. J. Hydraul. Eng. 2009, 39, Z2. [Google Scholar] [CrossRef]
  4. Rose, D.A. Water movement in porous materials: Part 2-The separation of the components of water movement. Br. J. Appl. Phys. 1963, 14, 491. [Google Scholar] [CrossRef]
  5. Carmeliet, J.; Roels, S. Determination of the moisture capacity of porous building materials. J. Therm. Envel. Build. Sci. 2002, 25, 209–237. [Google Scholar] [CrossRef]
  6. Luo, D.; Liu, J. Effect of Hygrothermal Property Parameters of Masonry Materials on Thermal Calculations in Hot and Humid Climates. J. Xi’an Univ. Archit. Technol. 2022, 54, 930–939. [Google Scholar] [CrossRef]
  7. Zhu, Z. Research on Damp-Proof and Anti-Mildew Technology for Ground Floor and Underground Space of Brick-Concrete Buildings in the Jiangnan Region. Master’s Thesis, Southeast University, Nanjing, China, 2022. [Google Scholar]
  8. Litavcova, E.; Korjenic, A.; Korjenic, S.; Pavlus, M.; Sarhadov, I.; Seman, J.; Bednar, T. Diffusion of Moisture into Building Materials: A Model for Moisture Transport. Energies 2014, 68, 558–561. [Google Scholar] [CrossRef]
  9. Zeng, S. Analysis of Heat and Moisture Transfer and Mold Growth Risk in Underground Buildings. Master’s Thesis, Hunan University, Changsha, China, 2013. [Google Scholar] [CrossRef]
  10. Philip, J.R.; De Vries, D.A. Moisture Movement in Porous Materials under Temperature Gradients. Trans. Am. Geophys. Union 1957, 38, 222–232. [Google Scholar] [CrossRef]
  11. Luikov, A.V. Heat and Mass Transfer in Capillary-Porous Bodies. Adv. Heat Transf. 1964, 1, 123–184. [Google Scholar] [CrossRef]
  12. Luikov, A.V. Systems of Differential Equations of Heat and Mass Transfer in Capillary-Porous Bodies. Int. J. Heat Mass Transf. 1975, 18, 1–14. [Google Scholar] [CrossRef]
  13. Hens, H. IEA Annex 14: Condensation and Energy. J. Therm. Insul. 1992, 15, 261–273. [Google Scholar] [CrossRef]
  14. Kumaran, M.K. IEA-Annex 24: Heat Air and Moisture Transfer in Insulated Envelope Parts—Final Report; International Energy Agency: Paris, France, 1996; Volume 3. [Google Scholar]
  15. Kumaran, M.K.; van Reenen, D.; Carette, G. A Thermal and Moisture Transport Property Database for Common Building and Insulating Materials. ASHRAE Res. Proj. 2002, 1018, 1–229. [Google Scholar]
  16. Kumaran, M.K. Moisture Diffusivity of Building Materials from Water Absorption Measurements. J. Therm. Envel. Build. Sci. 1999, 22, 349–355. [Google Scholar] [CrossRef]
  17. Huang, X.; Li, X.; Feng, C. Review of Prediction Methods for Moist Physical Properties of Porous Media. Mater. Rev. 2023, 37, 21080186–21080187. [Google Scholar] [CrossRef]
  18. Wang, B.; Fang, Z. Investigation on the Heat and Mass Transfer and Methods for Measuring the Characteristics of Heat-Moisture Migration in Moist Capillary Porous Media. J. Eng. Thermophys. 1985, 1, 1–13. [Google Scholar]
  19. Wang, B.; Yu, W. Methods for Measuring Heat-Moisture Migration Characteristics in Moist Porous Media under Third Kind Boundary Conditions. J. Eng. Thermophys. 1987, 4, 4–14. [Google Scholar]
  20. Gui, K.; Han, J.; Shi, M. Determination of Heat and Mass Transfer Parameters in Porous Media Using the Constant Heat Flux Method. Acta Metrol. Sin. 1995, 16, 252–256. [Google Scholar]
  21. Han, J.; Gui, K.; Shi, M. Parameter Estimation Method for Simultaneous Determination of Heat-Moisture Migration Characteristics in Moist Porous Media. Acta Metrol. Sin. 1995, 16, 153–160. [Google Scholar]
  22. Lu, J.; He, X.; Jiang, Z. Study on Heat-Moisture Migration Parameters in Moist Porous Media. J. Chongqing Jianzhu Univ. 2000, 22, 83–86. [Google Scholar]
  23. Yan, Z.; Liu, J.; Wang, R. Experimental Study on Isothermal Hygroscopic Properties of Rammed Earth Enclosures. J. Xi’an Univ. Arch. Technol. Nat. Sci. Ed. 2003, 35, 347–349. [Google Scholar] [CrossRef]
  24. Li, K.; Zhang, L.; Zhang, Z. Experimental Study on Isothermal Moisture Absorption and Desorption Curves of Building Materials. J. Build. Mater. 2009, 12, 81–84. [Google Scholar] [CrossRef]
  25. Pei, Q.; Chen, Z. Experimental Study on Isothermal Moisture Absorption and Desorption Lines of Several Common Building Materials. J. Hunan Univ. Nat. Sci. Ed. 1999, 26, 96–99. [Google Scholar] [CrossRef]
  26. Guo, X.; Chen, Y. Analysis of Heat and Moisture Performance of Multi-Layer Walls in Hot and Humid Climate Regions. J. Hunan Univ. Nat. Sci. Ed. 2008, 35, 1–4. [Google Scholar]
  27. Zheng, M.; Kong, F.; Han, Z. Coupled Heat and Moisture Transfer in External Insulation Enclosures of Newly Constructed Buildings. J. Harbin Inst. Technol. 2009, 41, 118–122. [Google Scholar]
  28. Wang, Q.; Xu, W.; Zhao, X. Study on the Heat-Moisture Coupled Migration Characteristics of Bamboo Composite Wall Components. In Proceedings of the 2010 National HVAC & Refrigeration Academic Conference, Hangzhou, China, 8–12 November 2010. [Google Scholar] [CrossRef]
  29. Kong, F.; Han, Z.; Li, Y. Impact of Heat and Moisture Transfer in Newly Built Building Enclosures on Indoor Temperature and Humidity Environment. Build. Sci. 2008, 24, 94–97. [Google Scholar] [CrossRef]
  30. Jin, S.; Yang, Z.; Zhang, X. Study on Methods for Determining the Diffusion Coefficient of Water in Concrete. J. Wuhan Univ. Technol. 2009, 16, 31–35. [Google Scholar]
  31. Feng, C.; Feng, Y.; Meng, Q. Variable Property Method for Determining the Vapor Permeability Coefficient of Aerated Concrete. J. Civ. Arch. Environ. Eng. 2013, 35, 132–136. [Google Scholar] [CrossRef]
  32. Feng, C. Research on Testing Methods for Hygrothermal Properties of Porous Building Materials. Ph.D. Thesis, South China University of Technology, Guangzhou, China, 2014. [Google Scholar]
  33. Feng, C.; Zhong, H.; Feng, Y.; Sun, L. Progress in Testing Hygrothermal Properties of Porous Building Materials. In Proceedings of the 12th National Building Physics Academic Conference, Wenzhou, China, 3–4 November 2016. [Google Scholar]
  34. Feng, C.; Yu, X.; Wang, D. Determination of the Moist Physical Properties of Aerated Concrete. J. Civ. Arch. Environ. Eng. 2016, 2, 125–131. [Google Scholar]
  35. Feng, C.; Janssen, H. Hygric Properties of Porous Building Materials (III): Impact Factors and Data Processing Methods of the Capillary Absorption Test. Build. Environ. 2018, 134, 21–34. [Google Scholar] [CrossRef]
  36. Carmeliet, J.; Roels, S. Determination of the Liquid Water Diffusivity from Transient Moisture Transfer Experiments. J. Therm. Envel. Build. Sci. 2004, 27, 277–305. [Google Scholar] [CrossRef]
  37. ISOEN-15148:2002; Hygrothermal Performance of Building Materials and Products—Determination of Water Absorption Coefficient by Partial Immersion. ISO: Geneva, Switzerland, 2002.
  38. ASTM-C1585-13; Standard Test Method for Measurement of Rate of Absorption of Water by Hydraulic-Cement Concretes. ASTM International: West Conshohocken, PA, USA, 2013. [CrossRef]
  39. Roels, S.; Carmeliet, J. Interlaboratory Comparison of Hygric Properties of Porous Building Materials. J. Therm. Envel. Build. Sci. 2004, 27, 307–325. [Google Scholar] [CrossRef]
  40. Binder, A.H.M.; Künzel, H.M.; Zirkelbach, D. A New Approach to Measure Liquid Transport in Capillary Active Interior Insulation. 2013. Available online: https://publica.fraunhofer.de/entities/publication/7019026f-3fdd-451f-9559-42f3ff9620c7 (accessed on 10 October 2024).
  41. Janetti, M.; Bianchi, F. Heat Flux Measurements for Determination of the Liquid Water Diffusivity in Capillary Active Materials. Int. J. Heat Mass Transf. 2016, 97, 954–963. [Google Scholar] [CrossRef]
  42. JC/T 2329-2015; Interface Agent for Cement-Based Self-Leveling Mortar. China Building Materials Industry Press: Beijing, China, 2015.
  43. Kuila, U. Measurement and Interpretation of Porosity and Pore-Size Distribution in Mudrocks: The Hole Story of Shales. Ph.D. Thesis, Colorado School of Mines, Golden, CO, USA, 2013. [Google Scholar]
  44. Krus, M.; Künzel, H.M. Determination of Dw from A-value. IEA Annex XXIV Rep. 1993, T3-D-93/02. [Google Scholar]
  45. Kunzel, H.M. Simultaneous Heat and Moisture Transport in Building Components. Fraunhofer Inst. Build. Phys. 1995, 1–65. [Google Scholar] [CrossRef]
  46. Yang, H.; Huang, X.; Tang, M.; Feng, C. A Simplified Prediction Method for the Liquid Water Diffusion Coefficient of Porous Building Materials. J. Build. Sci. 2022, 38, 37–43. [Google Scholar] [CrossRef]
  47. Ren, P.; Chi, F.; Janssen, H. Hygric Properties of Porous Building Materials (V): Comparison of Different Methods to Determine Moisture Diffusivity. Build. Environ. 2019, 164, 106344. [Google Scholar] [CrossRef]
  48. Krus, M. Moisture Transport and Storage Coefficients of Porous Mineral Building Materials. Theoretical Principles and New Test Methods; Fraunhofer IRB: Stuttgart, Germany, 1996. [Google Scholar]
  49. Carmeliet, J.; Roels, S. Determination of the Isothermal Moisture Transport Properties of Porous Building Materials. J. Therm. Envel. Build. Sci. 2001, 24, 183–210. [Google Scholar] [CrossRef]
  50. Janssen, H.; Carmeliet, J.; Hens, H. The Influence of Soil Moisture in the Unsaturated Zone on the Heat Loss from Buildings via the Ground. J. Therm. Envel. Build. Sci. 2002, 25, 275–298. [Google Scholar] [CrossRef]
Figure 1. Capillary water absorption experimental device.
Buildings 14 03865 g001
Figure 2.   A c a p and w c a p test results for gypsum board.
Buildings 14 03865 g002
Figure 3. Comparison of gypsum board A c a p test results.
Buildings 14 03865 g003
Figure 4. Test results for the water absorption coefficients of different materials.
Buildings 14 03865 g004
Figure 5. Influence of different thin films on the material testing results.
Buildings 14 03865 g005
Figure 6. The liquid-water diffusion coefficients of the materials, as calculated by different empirical models.
Buildings 14 03865 g006
Figure 7. Fitting results of the diffusion coefficients for clay brick and gypsum board.
Buildings 14 03865 g007
Table 1. The basic physical properties and measurements of the experimental materials.
EPSXPSFGEPCMCBGP
Density   ( kg · m 3 )29.33 ± 0.236.57 ± 0.2190.31 ± 5202.76 ± 52293 ± 301713 ± 30712 ± 30
Thermal conductivity
(W·(m·K)−1)
0.0280.0170.0450.0650.2380.540.17
Specimen
measurements
(m)
0.05 × 0.05 × 0.030.05 × 0.05 × 0.0350.05 × 0.05 × 0.030.05 × 0.05 × 0.030.05 × 0.05 × 0.030.05 × 0.05 × 0.060.06 × 0.06 × 0.02
Porosity (%)0.750.117.8130.321.0428.2042.09
Notes: Due to experimental constraints, porosity was estimated using the water immersion method [43], resulting in some discrepancy between the estimated and actual values. The provided porosity values serve only as a reference for the capillary water absorption experiments and subsequent analyses of the materials.
Table 2. Physical properties and test results for the gypsum board.
Density
(kg·m−3)
Heat Capacity
(W·(m·K)−1)
A c a p
(kg/(m2·s0.5))
ASHRAE 1018RP project625 ± 70.163.99 × 10−1
Experiment conducted
by authors
712 ± 300.173.96 × 10−1
Table 3. Test results for the water absorption coefficients of different materials.
EPSXPSFGEPCMCB
A c a p
( k g / ( m 2   s 0.5 ))
0.89   ×   10 3 1.67   ×   10 3 18.13   ×   10 3 14.19   ×   10 3 11.46   ×   10 3 121   ×   10 3
Table 4. Analysis of the data dispersion degree of the capillary water absorption coefficient data for six materials.
EPSXPSFGEPCMCB
σ · 10 3
(Self-adhesive Film)
0.150.280.551.290.8220.00
σ · 10 3
(Non-adhesive Film)
0.331.271.462.521.9540.00
c u · 10 3
(Self-adhesive Film)
16.95%16.59%3.06%9.08%7.12%16.67%
c u · 10 3
(Non-adhesive Film)
25.15%51.85%8.87%16.30%23.59%28.78%
Table 5. Calculation results for diffusion coefficients, using different empirical models.
EPSXPSFGEPCMCB
w c a p   ( k g / m 3 ) 1.522.1627.4426.3813.52141.82
Formula   ( 3 )   D l   results   ( m 2 / s ) 1.31   ×   10 6   ×   1000 w 1.52 1 2.27   ×   10 6   ×   1000 w 2.16 1 1.66   ×   10 6   ×   1000 w 27.44 1 1.1   ×   10 6   ×   1000 w 26.38 1 2.73   ×   10 6   ×   1000 w 13.52 1 2.37   ×   10 6   ×   1000 w 141.82 1
Formula   ( 4 )   D l   results   ( m 2 / s ) 3.45 × 10−75.98 × 10−74.37 × 10−72.89 × 10−77.19 × 10−76.24 × 10−7
Formula   ( 5 )   D l   results   ( m 2 / s ) 2.71 × 10−74.69 × 10−73.43 × 10−72.27 × 10−75.65 × 10−74.90 × 10−7
Table 6. Capillary moisture content at the intersections of curves fitted by different empirical models.
EPSXPSFGEPCMCB
Intersection   w of Formula (4) and Formula (3)
( k g / m 3 )
1.221.7522.1321.2810.91114.40
Percentage   of   w c a p 80.26%81.02%80.65%80.67%80.70%80.67%
Intersection   w of Formula (5) and Formula (3)
( k g / m 3 )
1.171.6721.1820.3610.43109.44
Percentage   of   w c a p 76.97%77.31%77.19%77.18%77.14%77.17%
Average   percentage   of   w c a p 78.62%79.17%78.92%78.93%78.92%78.92%
Table 7. Average calculation result of Formula (3) at different boundary points.
EPSXPSFGEPCMCB
Formula   ( 3 )   D l average results
when   w 80 %
( m 2 / s )
1.25 × 10−71.30 × 10−71.11 × 10−78.62 × 10−81.40 × 10−71.36 × 10−7
Formula   ( 3 )   D l average results
when   w w c a p
( m 2 / s )
3.14 × 10−73.25 × 10−72.51 × 10−71.78 × 10−73.76 × 10−74.88 × 10−7
Table 8. The correlation between the calculated results of the three models at different moisture-content boundary points.
Formula (4) and Formula (3)
Average Results
(w ≤ 80%)
Formula (5) and Formula (3)
Average Results
(w ≤ 80%)
Formula (4) and Formula (3)
Average Results
(wwcap)
Formula (5) and Formula (3)
Average Results
(wwcap)
Correlation coefficient R0.837040.83710.76020.7604
Value   of   p 0.037670.037640.079360.07923
Table 9. The liquid-water diffusion coefficient values of each material, calculated using Formula (6).
EPSXPSFGEPCMCB
Formula   ( 6 )   D l   results   ( m 2 / s ) 7.24 × 10−89.96 × 10−88.49 × 10−86.35 × 10−81.05 × 10−71.01 × 10−7
Table 10. The correlation between the calculation results of three models at different moisture-content boundary points.
Formula (4) and
Formula (3) Average
Results (w ≤ 80%)
Formula (5) and
Formula (3) Average
Results (w ≤ 80%)
Formula (6) and
Formula (3) Average
Results (w ≤ 80%)
Correlation coefficient R0.837040.83710.8517
Value of p 0.037670.037640.03135
Table 11. Validation of domestic and international testing results of porous building materials by substitution into Formula (6).
ResearchersTest
Materials
DensityPorosity A c a p w c a p Formula   ( 3 )   D l
Average Results
(w ≤ 80%)
Formula (4)
D l Results
Formula (5)
D l Results
Formula (6)
D l Results
Unit kg · m 3 % ( k g /
( m 2 s 0.5 ))
k g / m 3 ( m 2 / s ) ( m 2 / s ) ( m 2 / s ) ( m 2 / s )
IEA
ANNEX 24 [14]
Concrete2200150.0181105.27 × 10−92.68 × 10−82.10 × 10−87.09 × 10⁻⁹
Sand–lime
brick
1728\0.1211907.99 × 10−84.06 × 10−73.19 × 10−78.10 × 10⁻⁸
Lightweight
concrete
975\0.081903.49 × 10−81.77 × 10−71.39 × 10−74.23 × 10⁻⁸
Clay
brick
1676\0.1122703.39 × 10−81.72 × 10−71.35 × 10−74.12 × 10⁻⁸
ASHRAE
1080RP [15]
Aerated concrete460\0.0363821.76 × 10−98.89 × 10−96.98 × 10−92.38 × 10⁻⁹
Gypsum
board
625\0.3994311.69 × 10−78.59 × 10−76.74 × 10−71.05 × 10⁻⁷
Chi Feng [32]Lime mortar180431.30.322702.77 × 10−71.40 × 10−61.10 × 10−63.96 × 10⁻⁸
Hanyu
Yang [46]
Concrete2000.4160.03491311.40 × 10−87.10 × 10−85.57 × 10−81.82 × 10⁻⁸
Base coat1409270.05492569.05 × 10−94.60 × 10−83.61 × 10−81.20 × 10⁻⁸
Table 12. The final fitting result of Formula (7).
Fitting Formula (Substitute Data)KbcR2
CBK × 4.9254 × 10−10
exp((x − 141.82)/b) + c
33.9033.44 × 10−7 0.98
GPK × 7.95465 × 10−10
exp((x − 430.625)/b) + c
2.22 × 10−733.44 × 10−70.95
Disclaimer/Publisher’s Note: The statements, opinions and data contained in all publications are solely those of the individual author(s) and contributor(s) and not of MDPI and/or the editor(s). MDPI and/or the editor(s) disclaim responsibility for any injury to people or property resulting from any ideas, methods, instructions or products referred to in the content.

