Author Contributions
Conceptualization, J.B.; methodology, L.J.; software, J.B.; validation, Z.H. and P.P.; formal analysis, L.J.; investigation, Z.H., J.W. and P.P.; resources, J.B.; data curation, J.B.; writing—original draft preparation, J.B., Z.H. and P.P.; writing—review and editing, J.B., Z.H. and L.J.; visualization, J.B.; supervision, J.B.; project administration, J.B.; funding acquisition, J.B. and L.J. All authors have read and agreed to the published version of the manuscript.
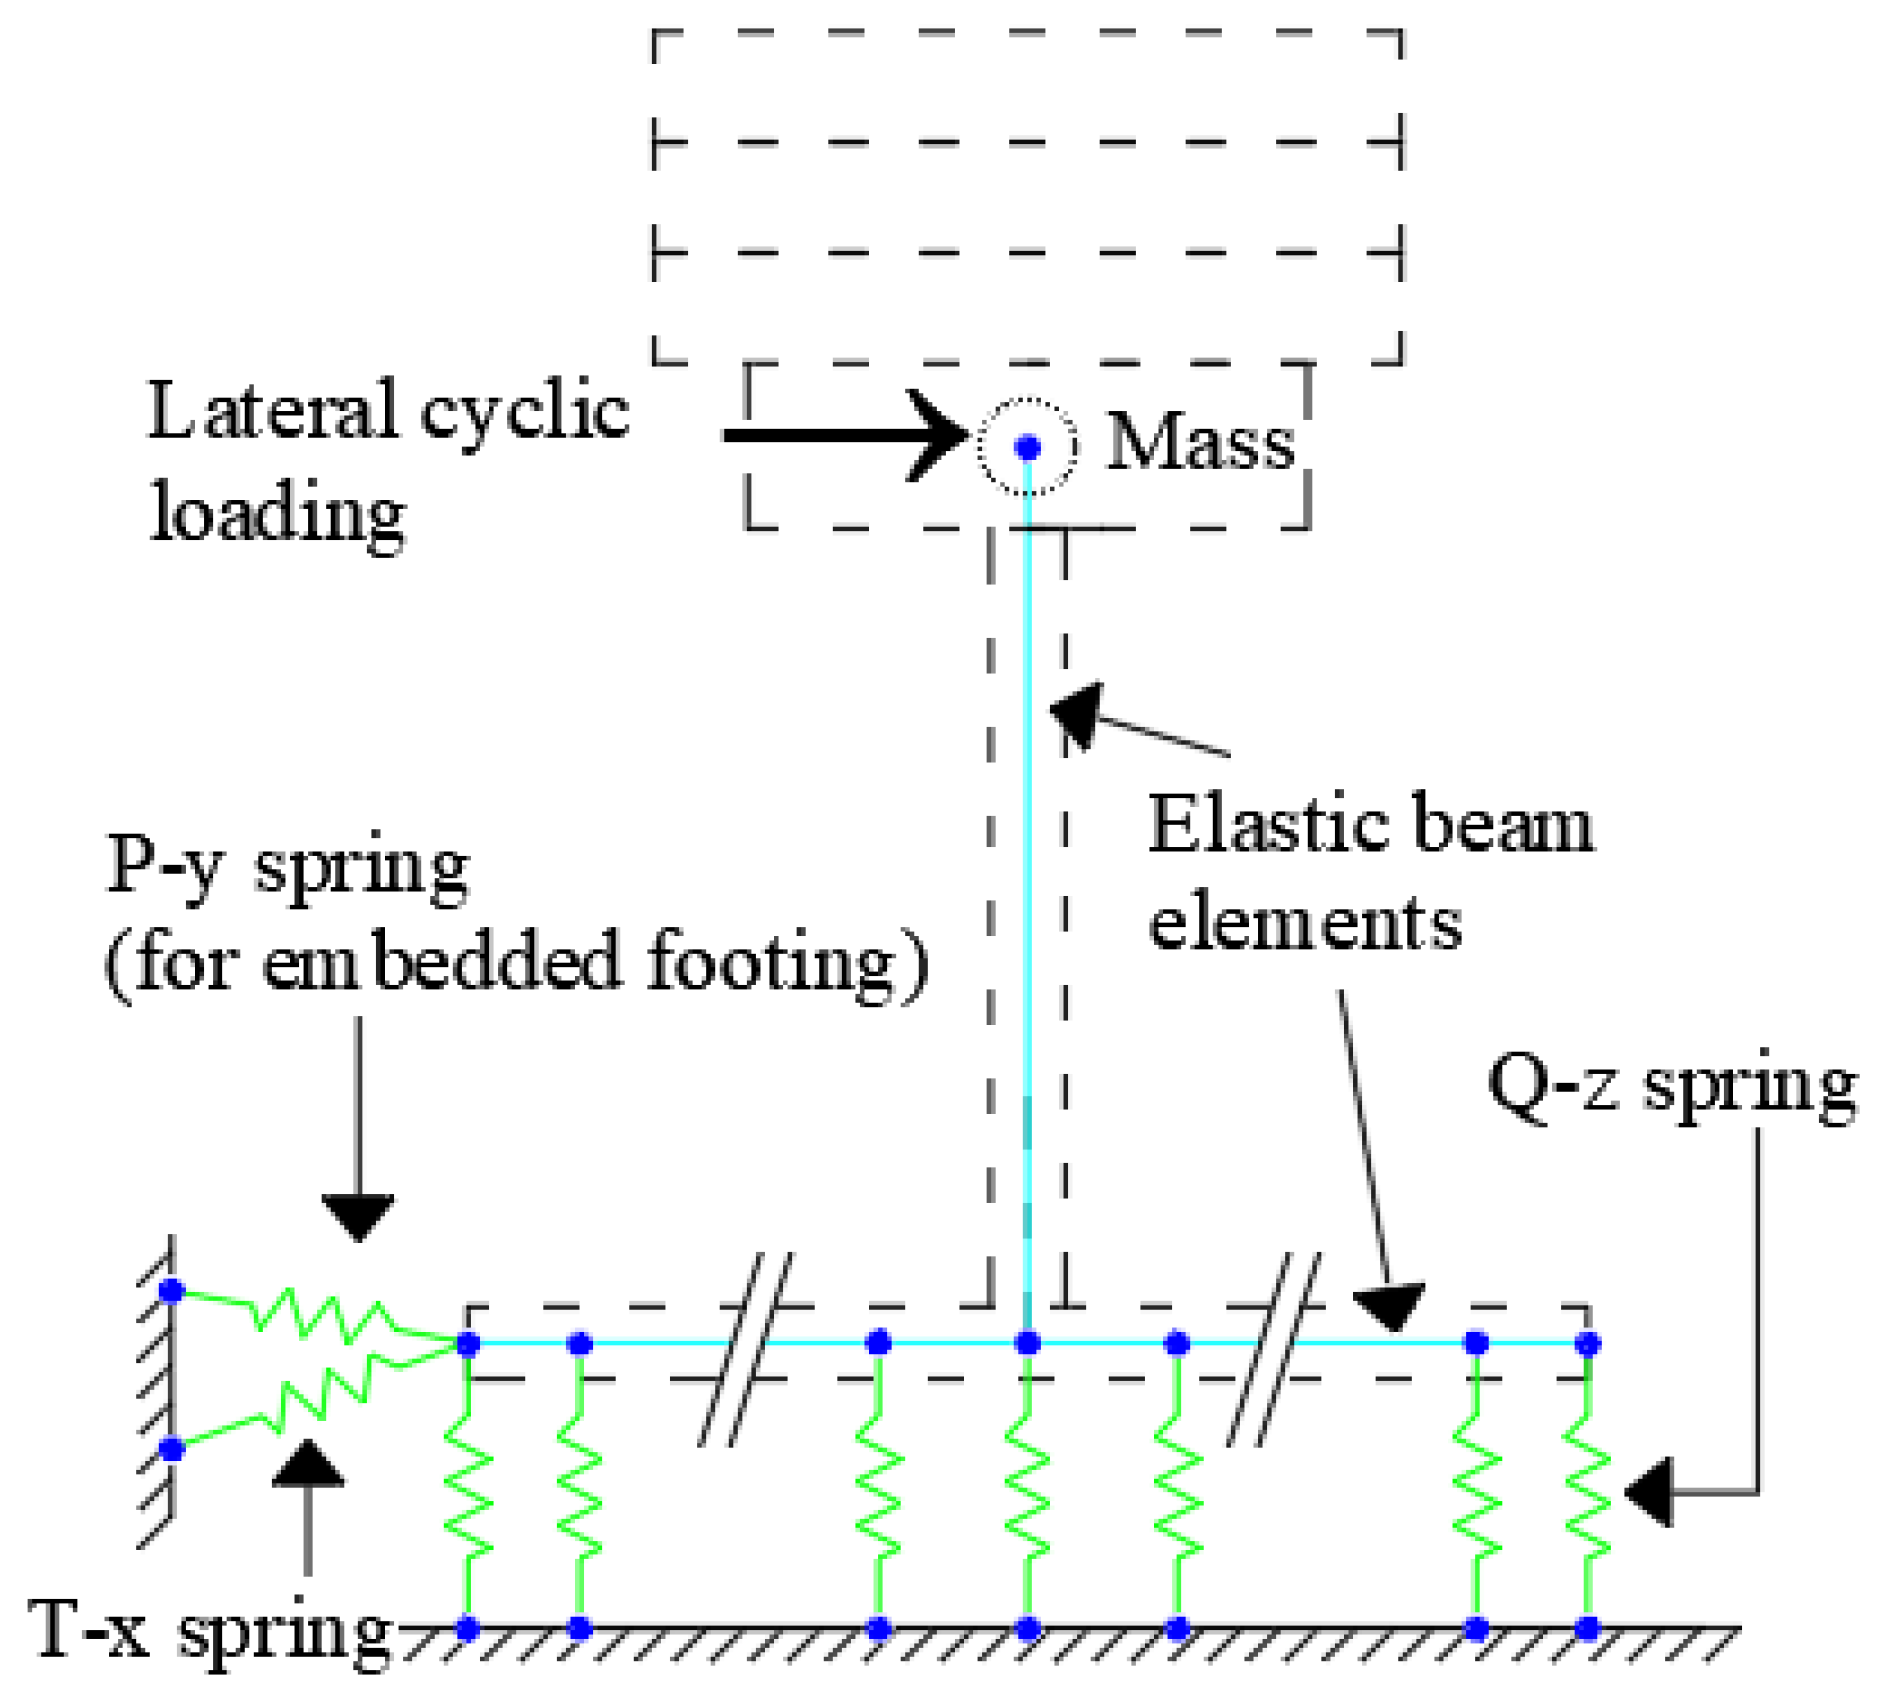
Figure 1.
Rocking Shallow Foundation OpenSees Model.
Figure 1.
Rocking Shallow Foundation OpenSees Model.
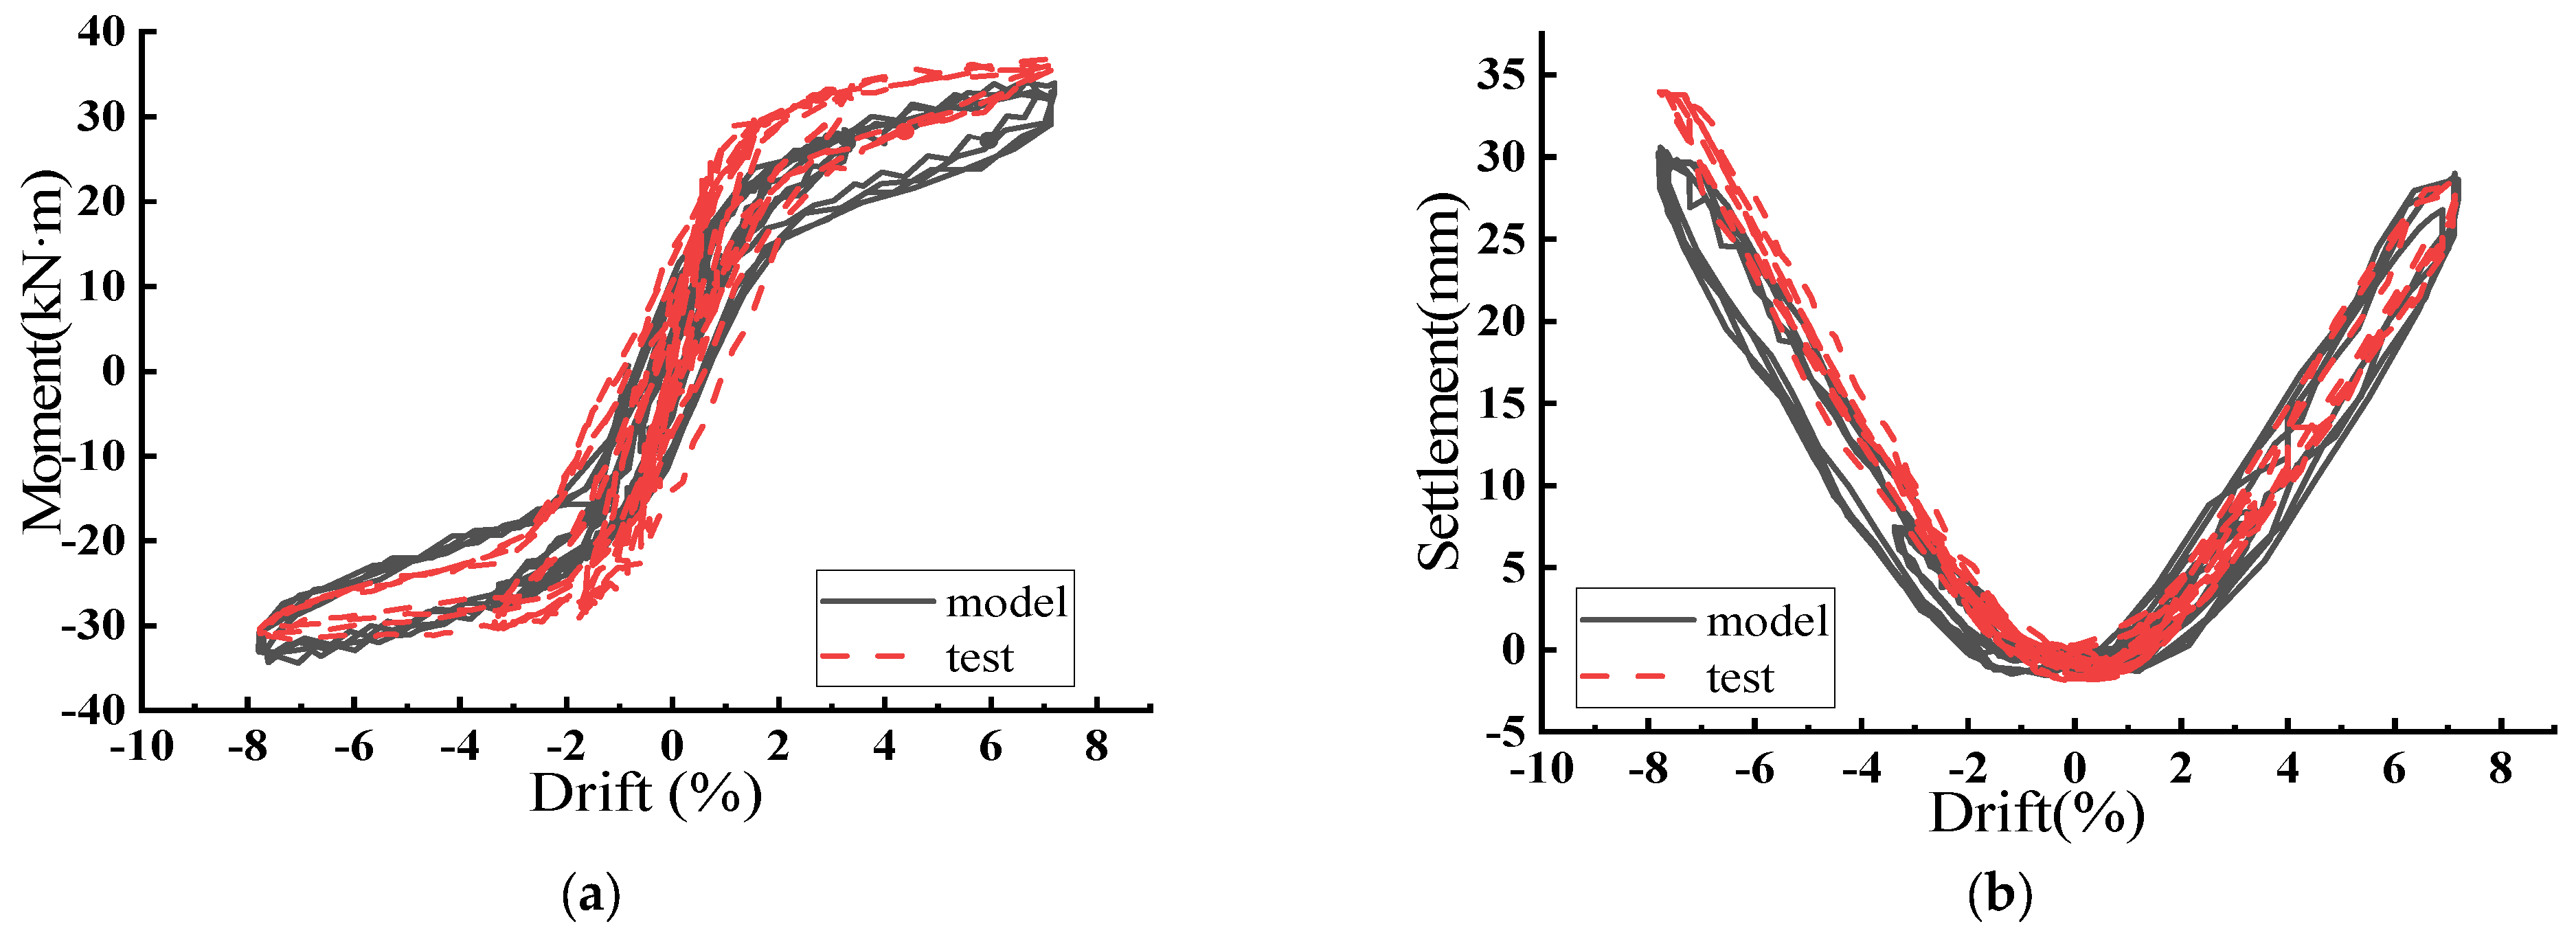
Figure 2.
Comparison of Finite Element Calculation Results with Test Results for Rocking Shallow Foundation. (a) Displacement Ratio–Moment; (b) Displacement Ratio–Foundation Settlement.
Figure 2.
Comparison of Finite Element Calculation Results with Test Results for Rocking Shallow Foundation. (a) Displacement Ratio–Moment; (b) Displacement Ratio–Foundation Settlement.
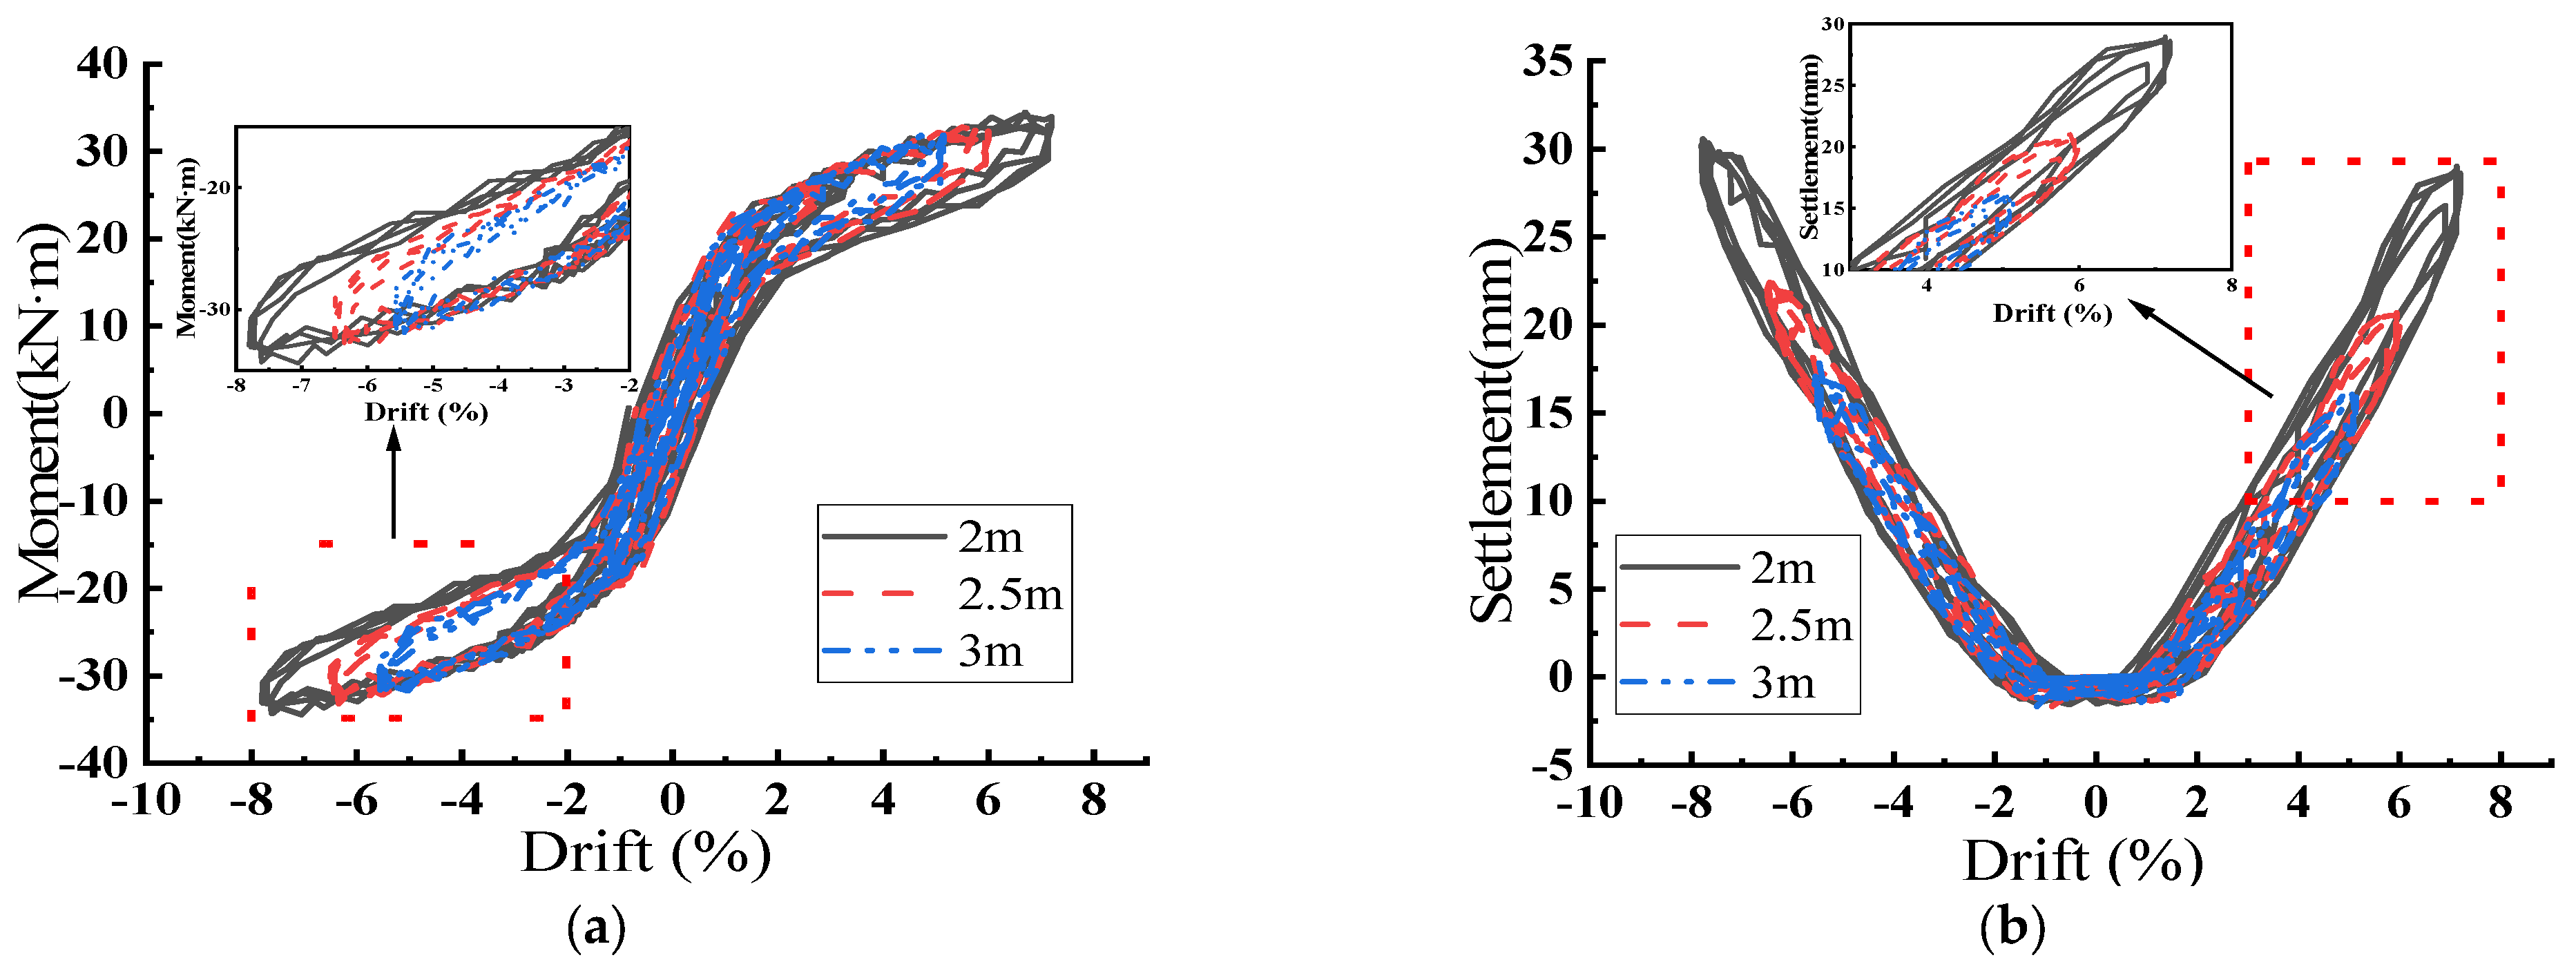
Figure 3.
Moments and Foundation Settlements for Rocking Shallow Foundations with Columns of 2m, 2.5m, 3m Heights. (a) Displacement Ratio–Moment; (b) Displacement Ratio–Foundation Settlement.
Figure 3.
Moments and Foundation Settlements for Rocking Shallow Foundations with Columns of 2m, 2.5m, 3m Heights. (a) Displacement Ratio–Moment; (b) Displacement Ratio–Foundation Settlement.
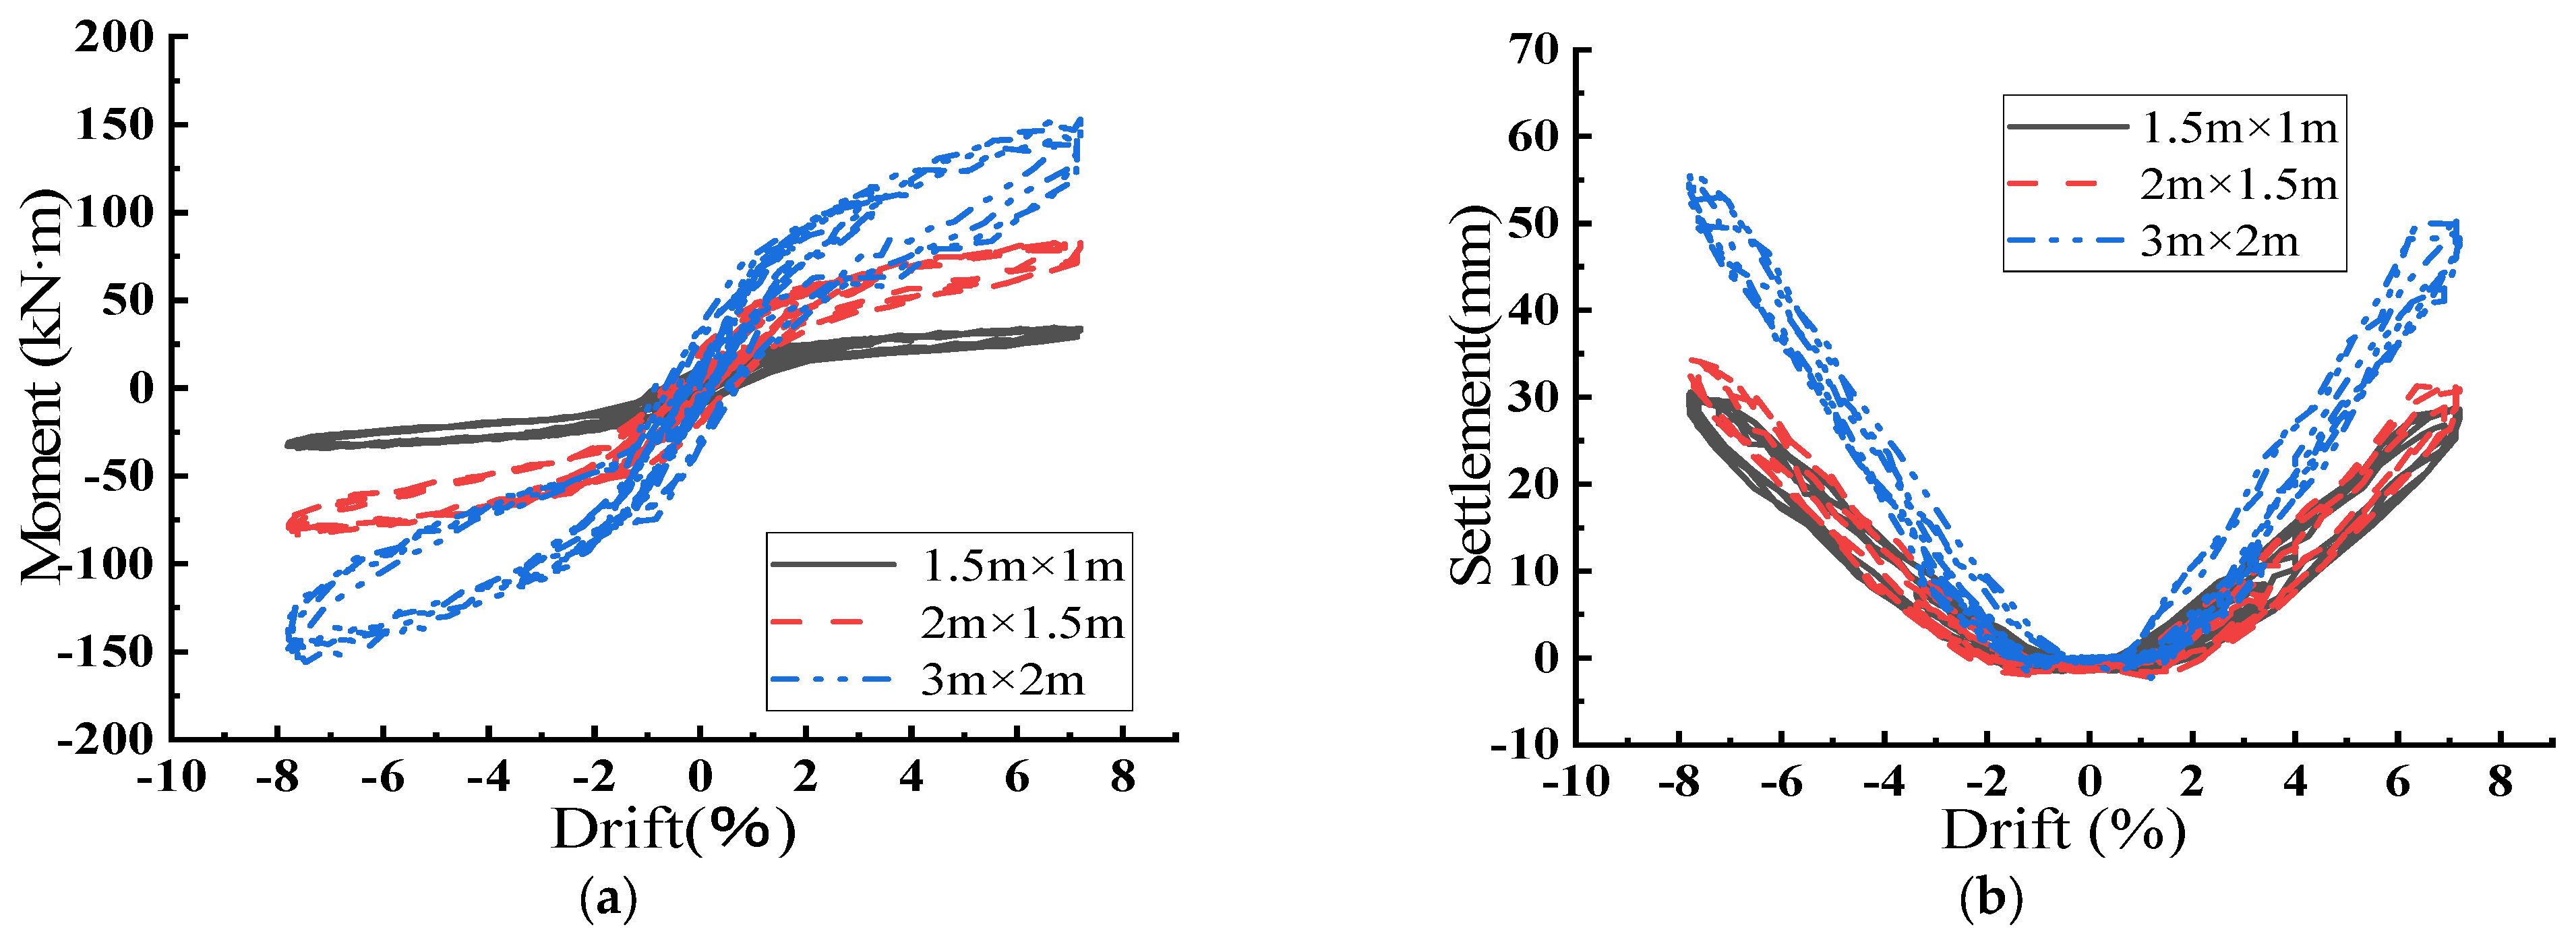
Figure 4.
Moments and Foundation Settlements for Rocking Shallow Foundations with Different Foundation Sizes. (a) Displacement Ratio–Moment; (b) Displacement Ratio–Foundation Settlement.
Figure 4.
Moments and Foundation Settlements for Rocking Shallow Foundations with Different Foundation Sizes. (a) Displacement Ratio–Moment; (b) Displacement Ratio–Foundation Settlement.
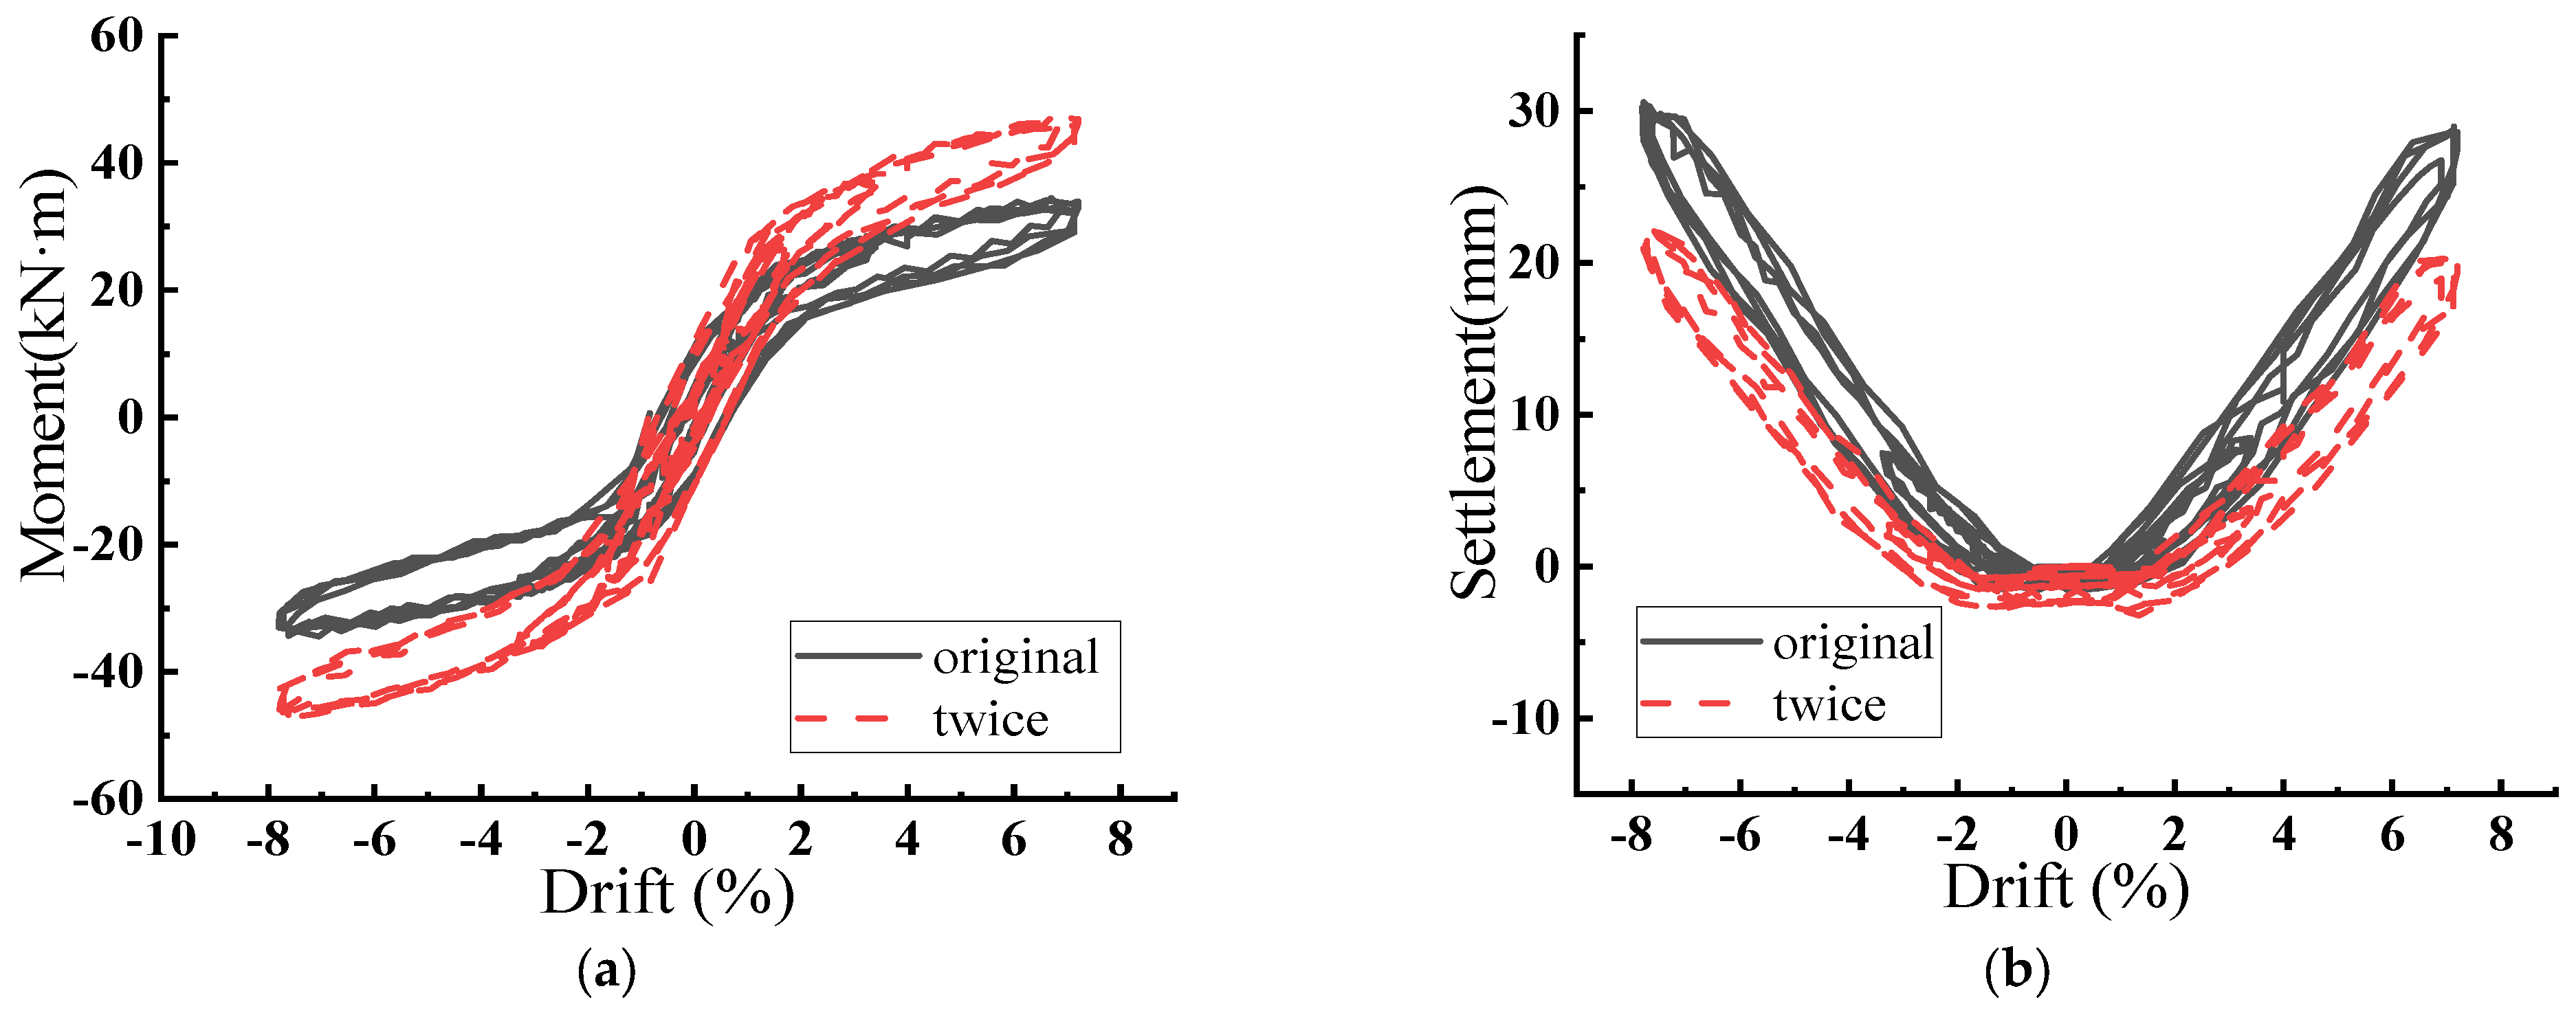
Figure 5.
Moments and Foundation Settlements for Rocking Shallow Foundations with Different Top Masses. (a) Displacement Ratio–Moment; (b) Displacement Ratio–Foundation Settlement.
Figure 5.
Moments and Foundation Settlements for Rocking Shallow Foundations with Different Top Masses. (a) Displacement Ratio–Moment; (b) Displacement Ratio–Foundation Settlement.
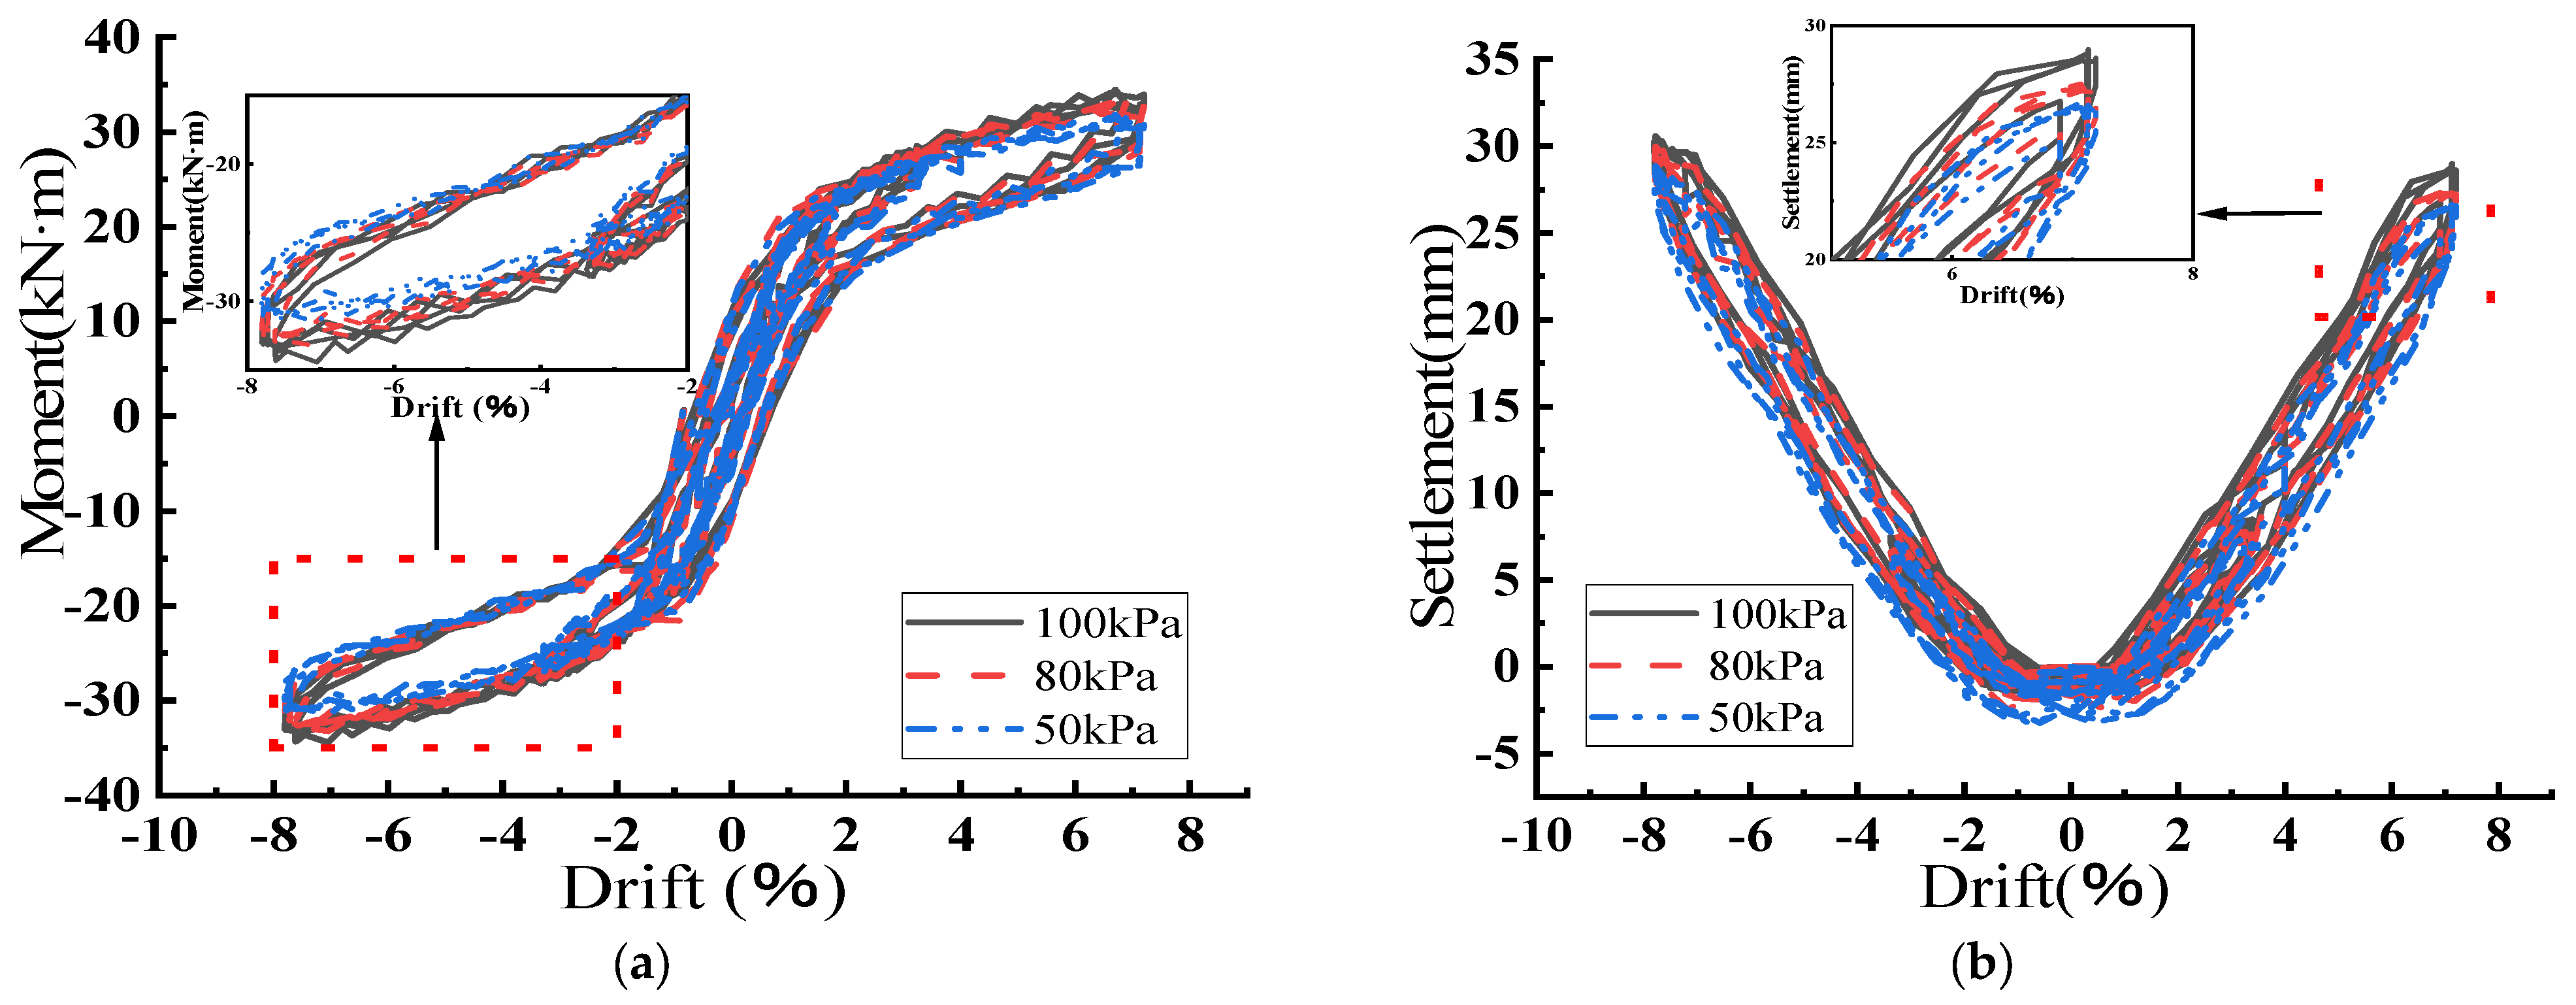
Figure 6.
Moment and Settlement Graphs for Models in Different Soft and Hard Soils. (a) Displacement Ratio–Moment; (b) Displacement Ratio–Foundation Settlement.
Figure 6.
Moment and Settlement Graphs for Models in Different Soft and Hard Soils. (a) Displacement Ratio–Moment; (b) Displacement Ratio–Foundation Settlement.
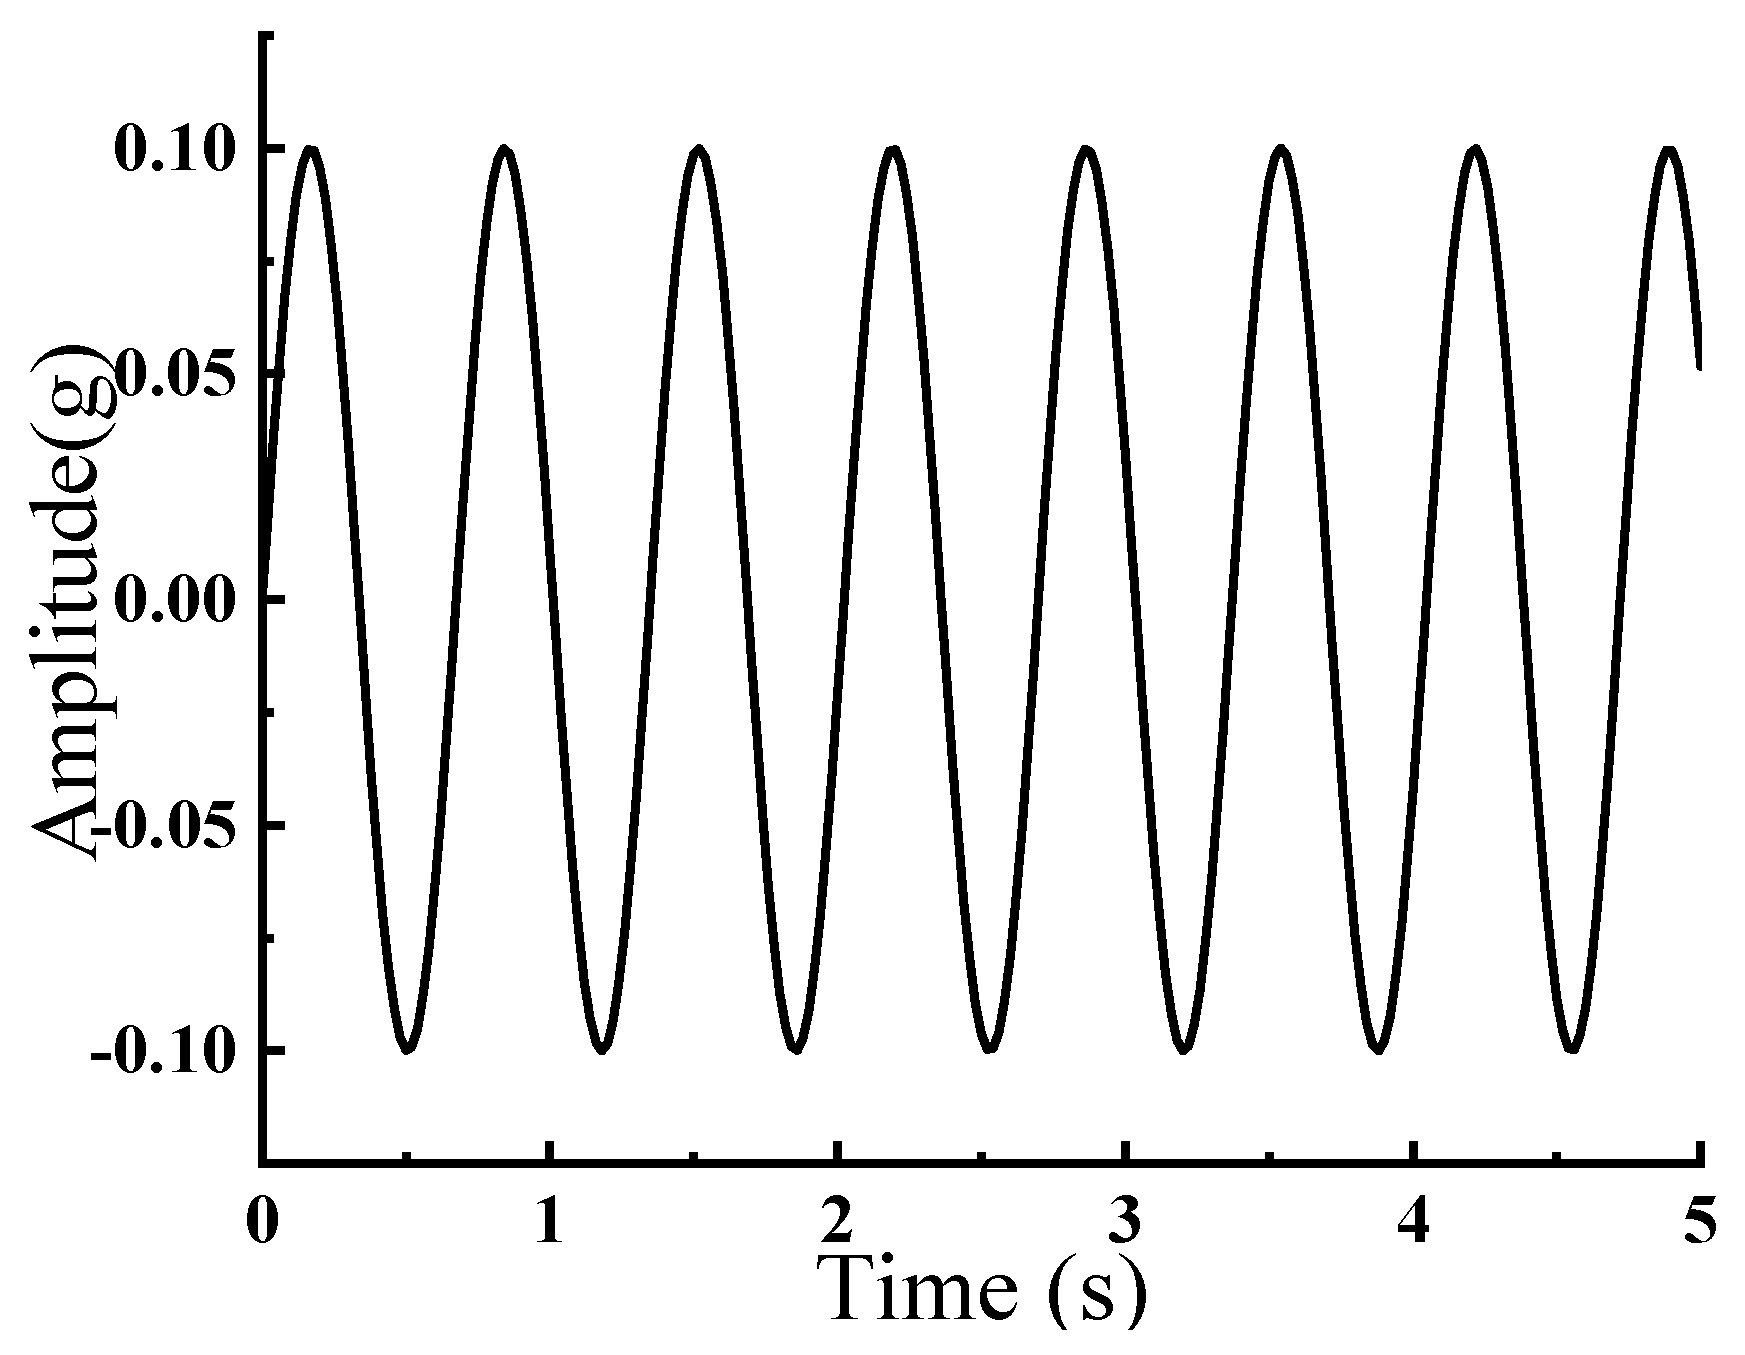
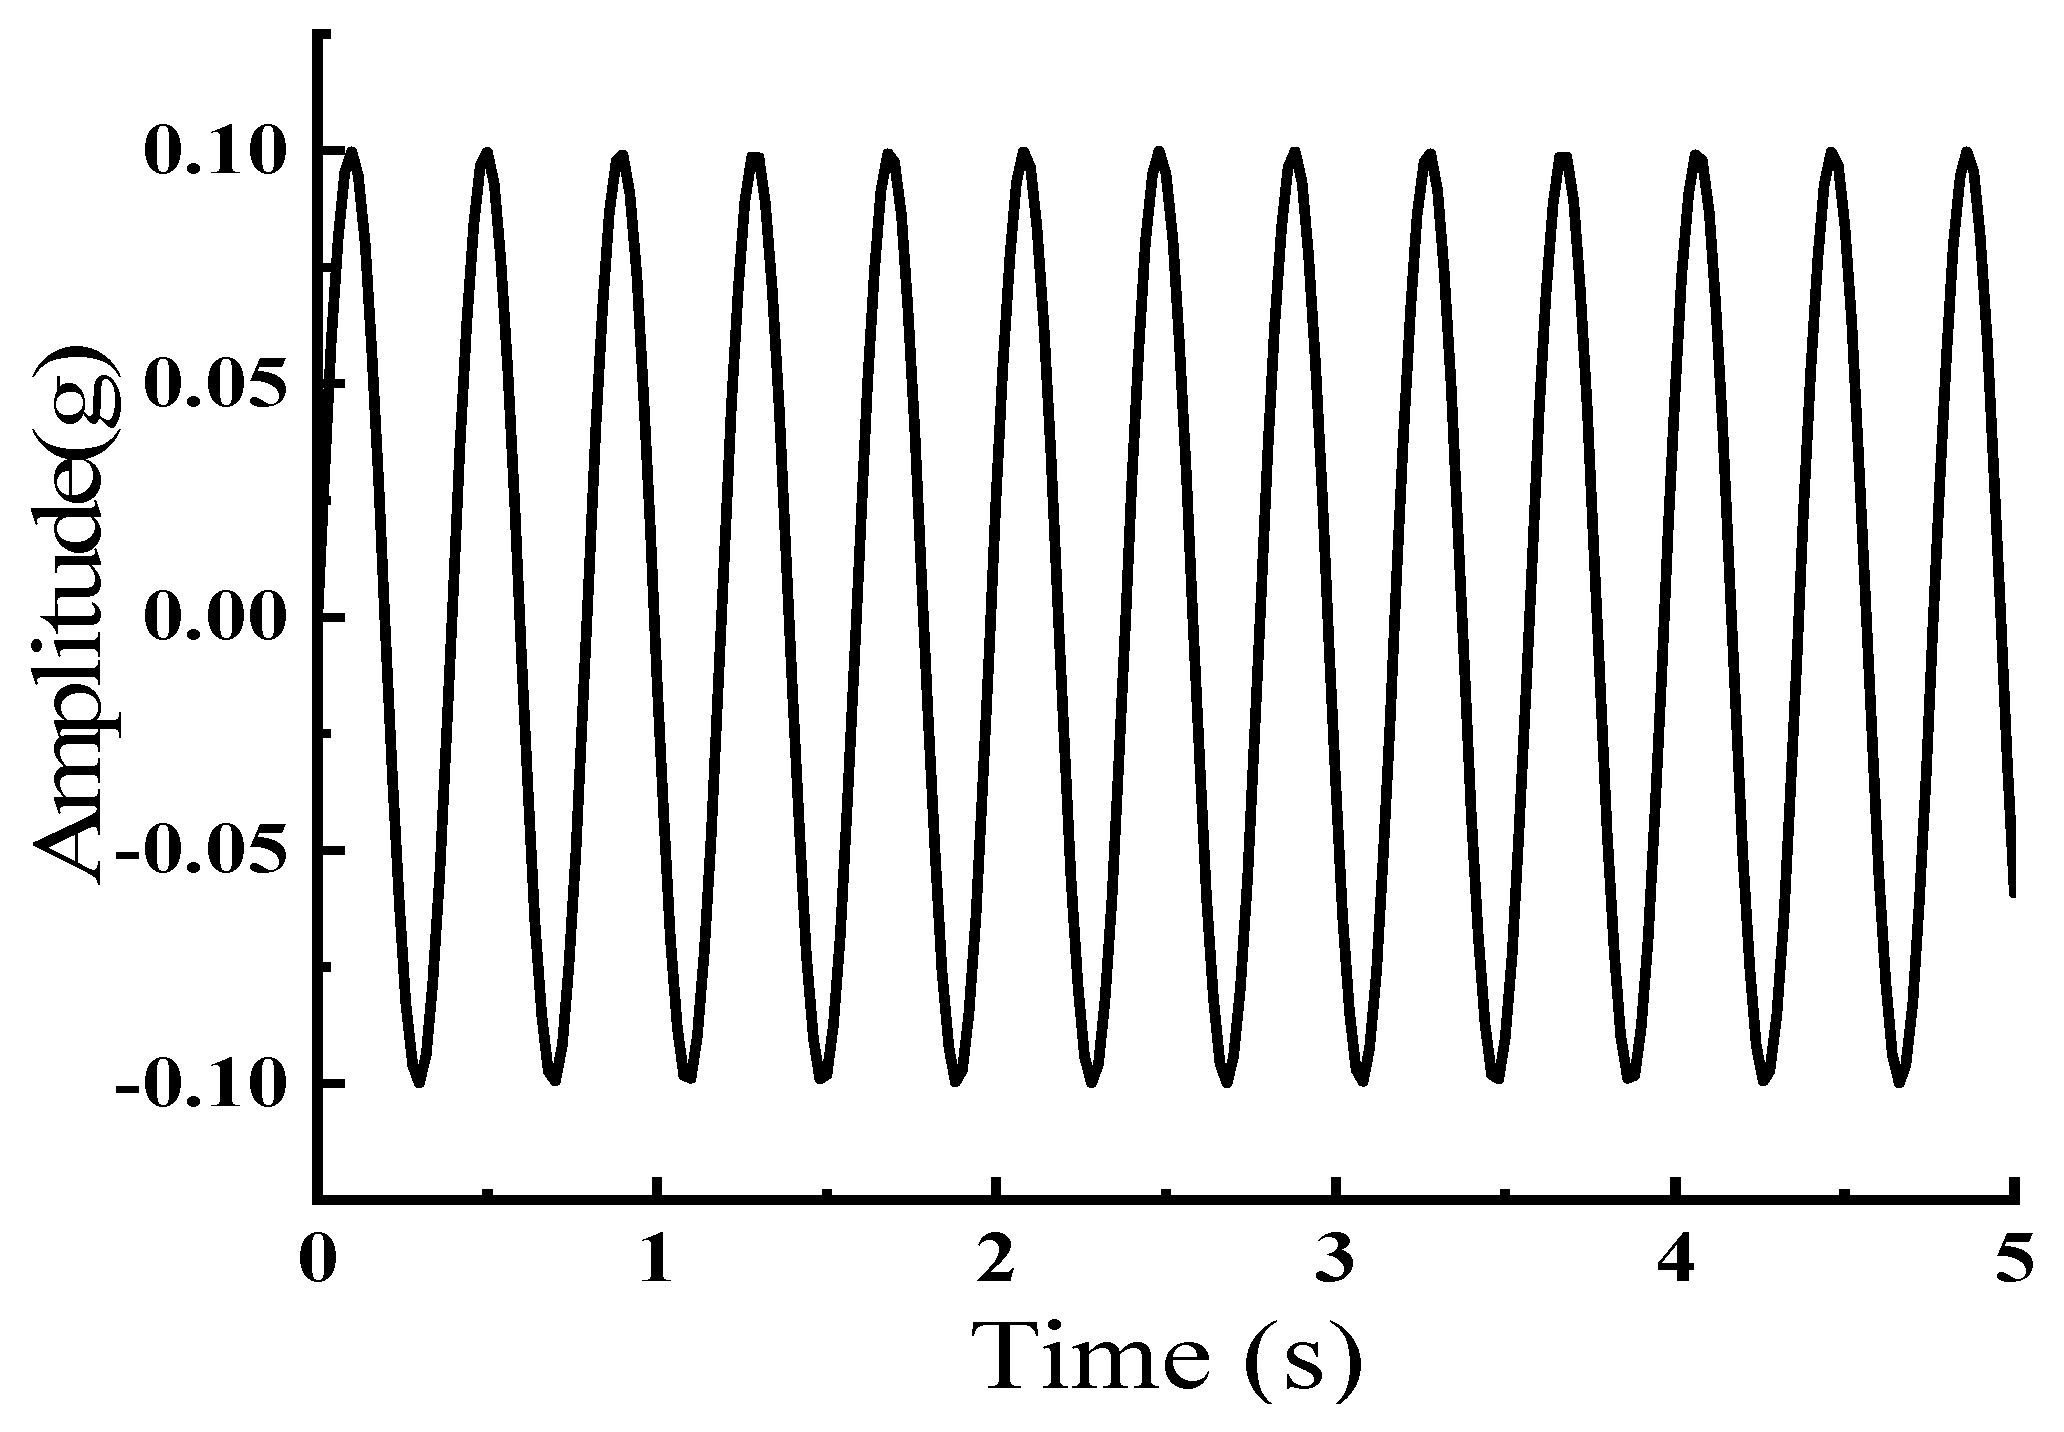
Figure 7.
Sine Wave Function Graph.
Figure 7.
Sine Wave Function Graph.
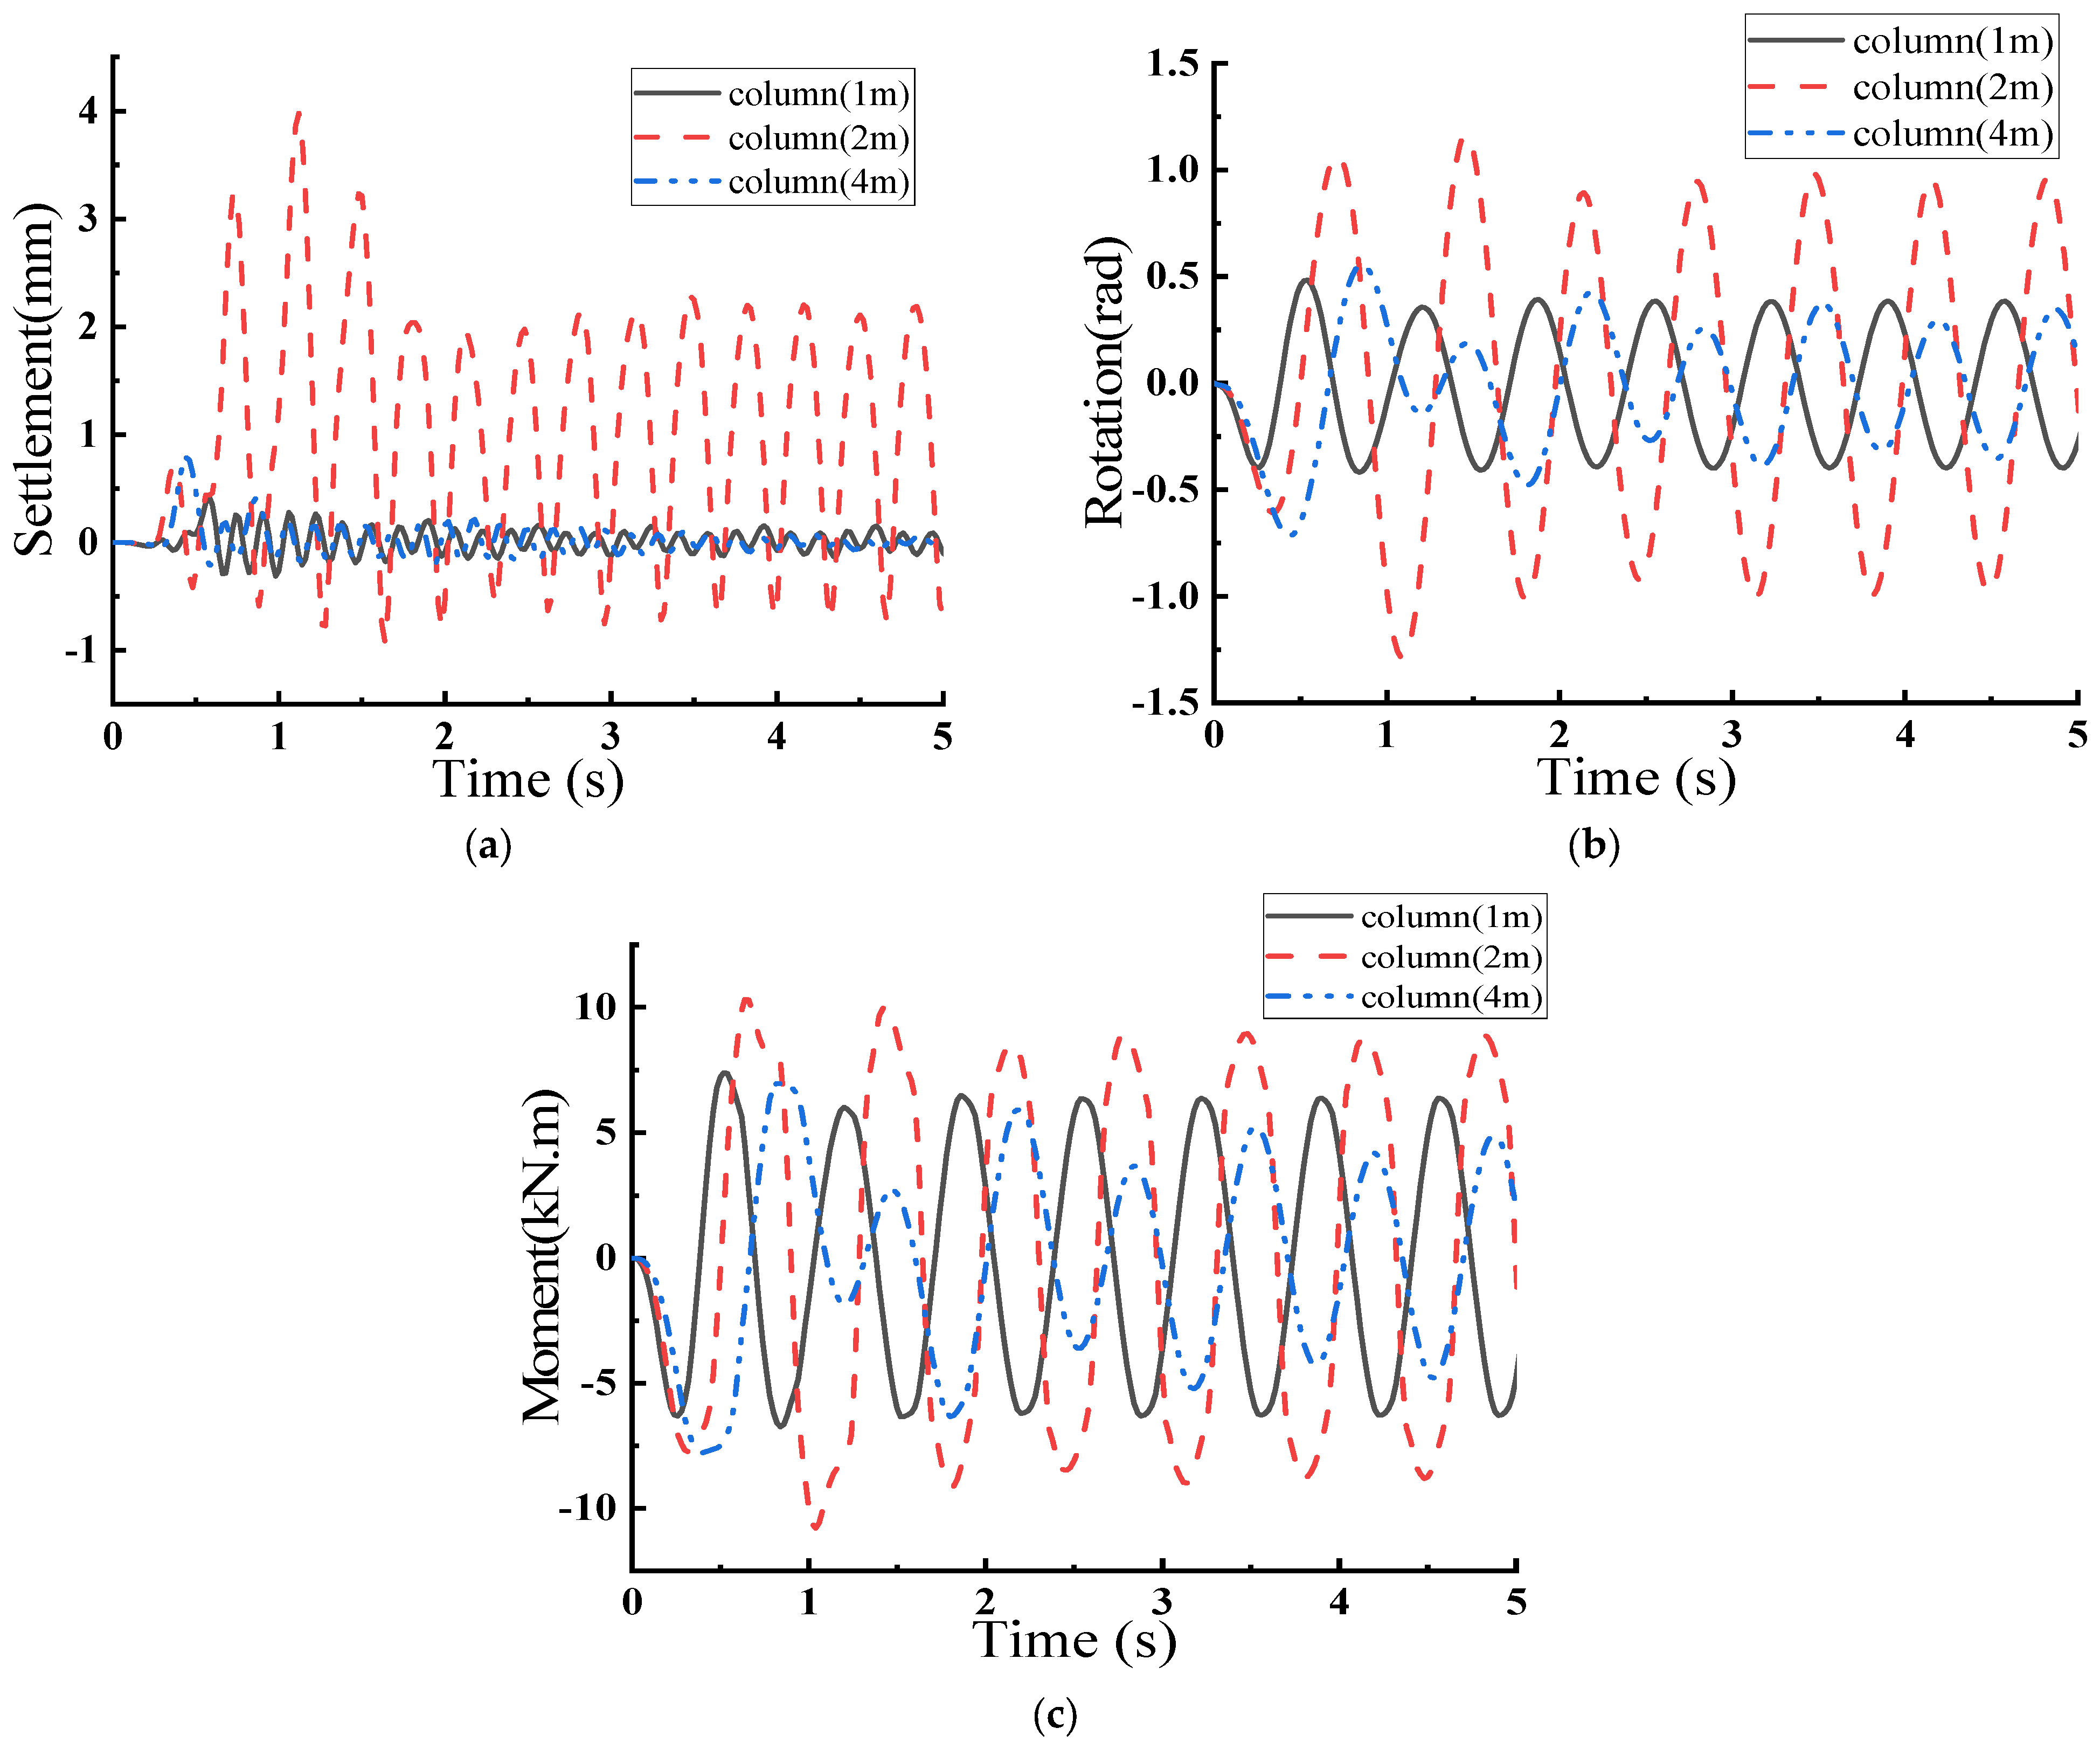
Figure 8.
Response of Rocking Shallow Foundation under the Action of Sine Wave y = 0.1sin (2.96πt). (a) Foundation Settlement–Time; (b) Top Rotation–Time; (c) Moment–Time.
Figure 8.
Response of Rocking Shallow Foundation under the Action of Sine Wave y = 0.1sin (2.96πt). (a) Foundation Settlement–Time; (b) Top Rotation–Time; (c) Moment–Time.
Figure 9.
Sine Wave Graph.
Figure 9.
Sine Wave Graph.
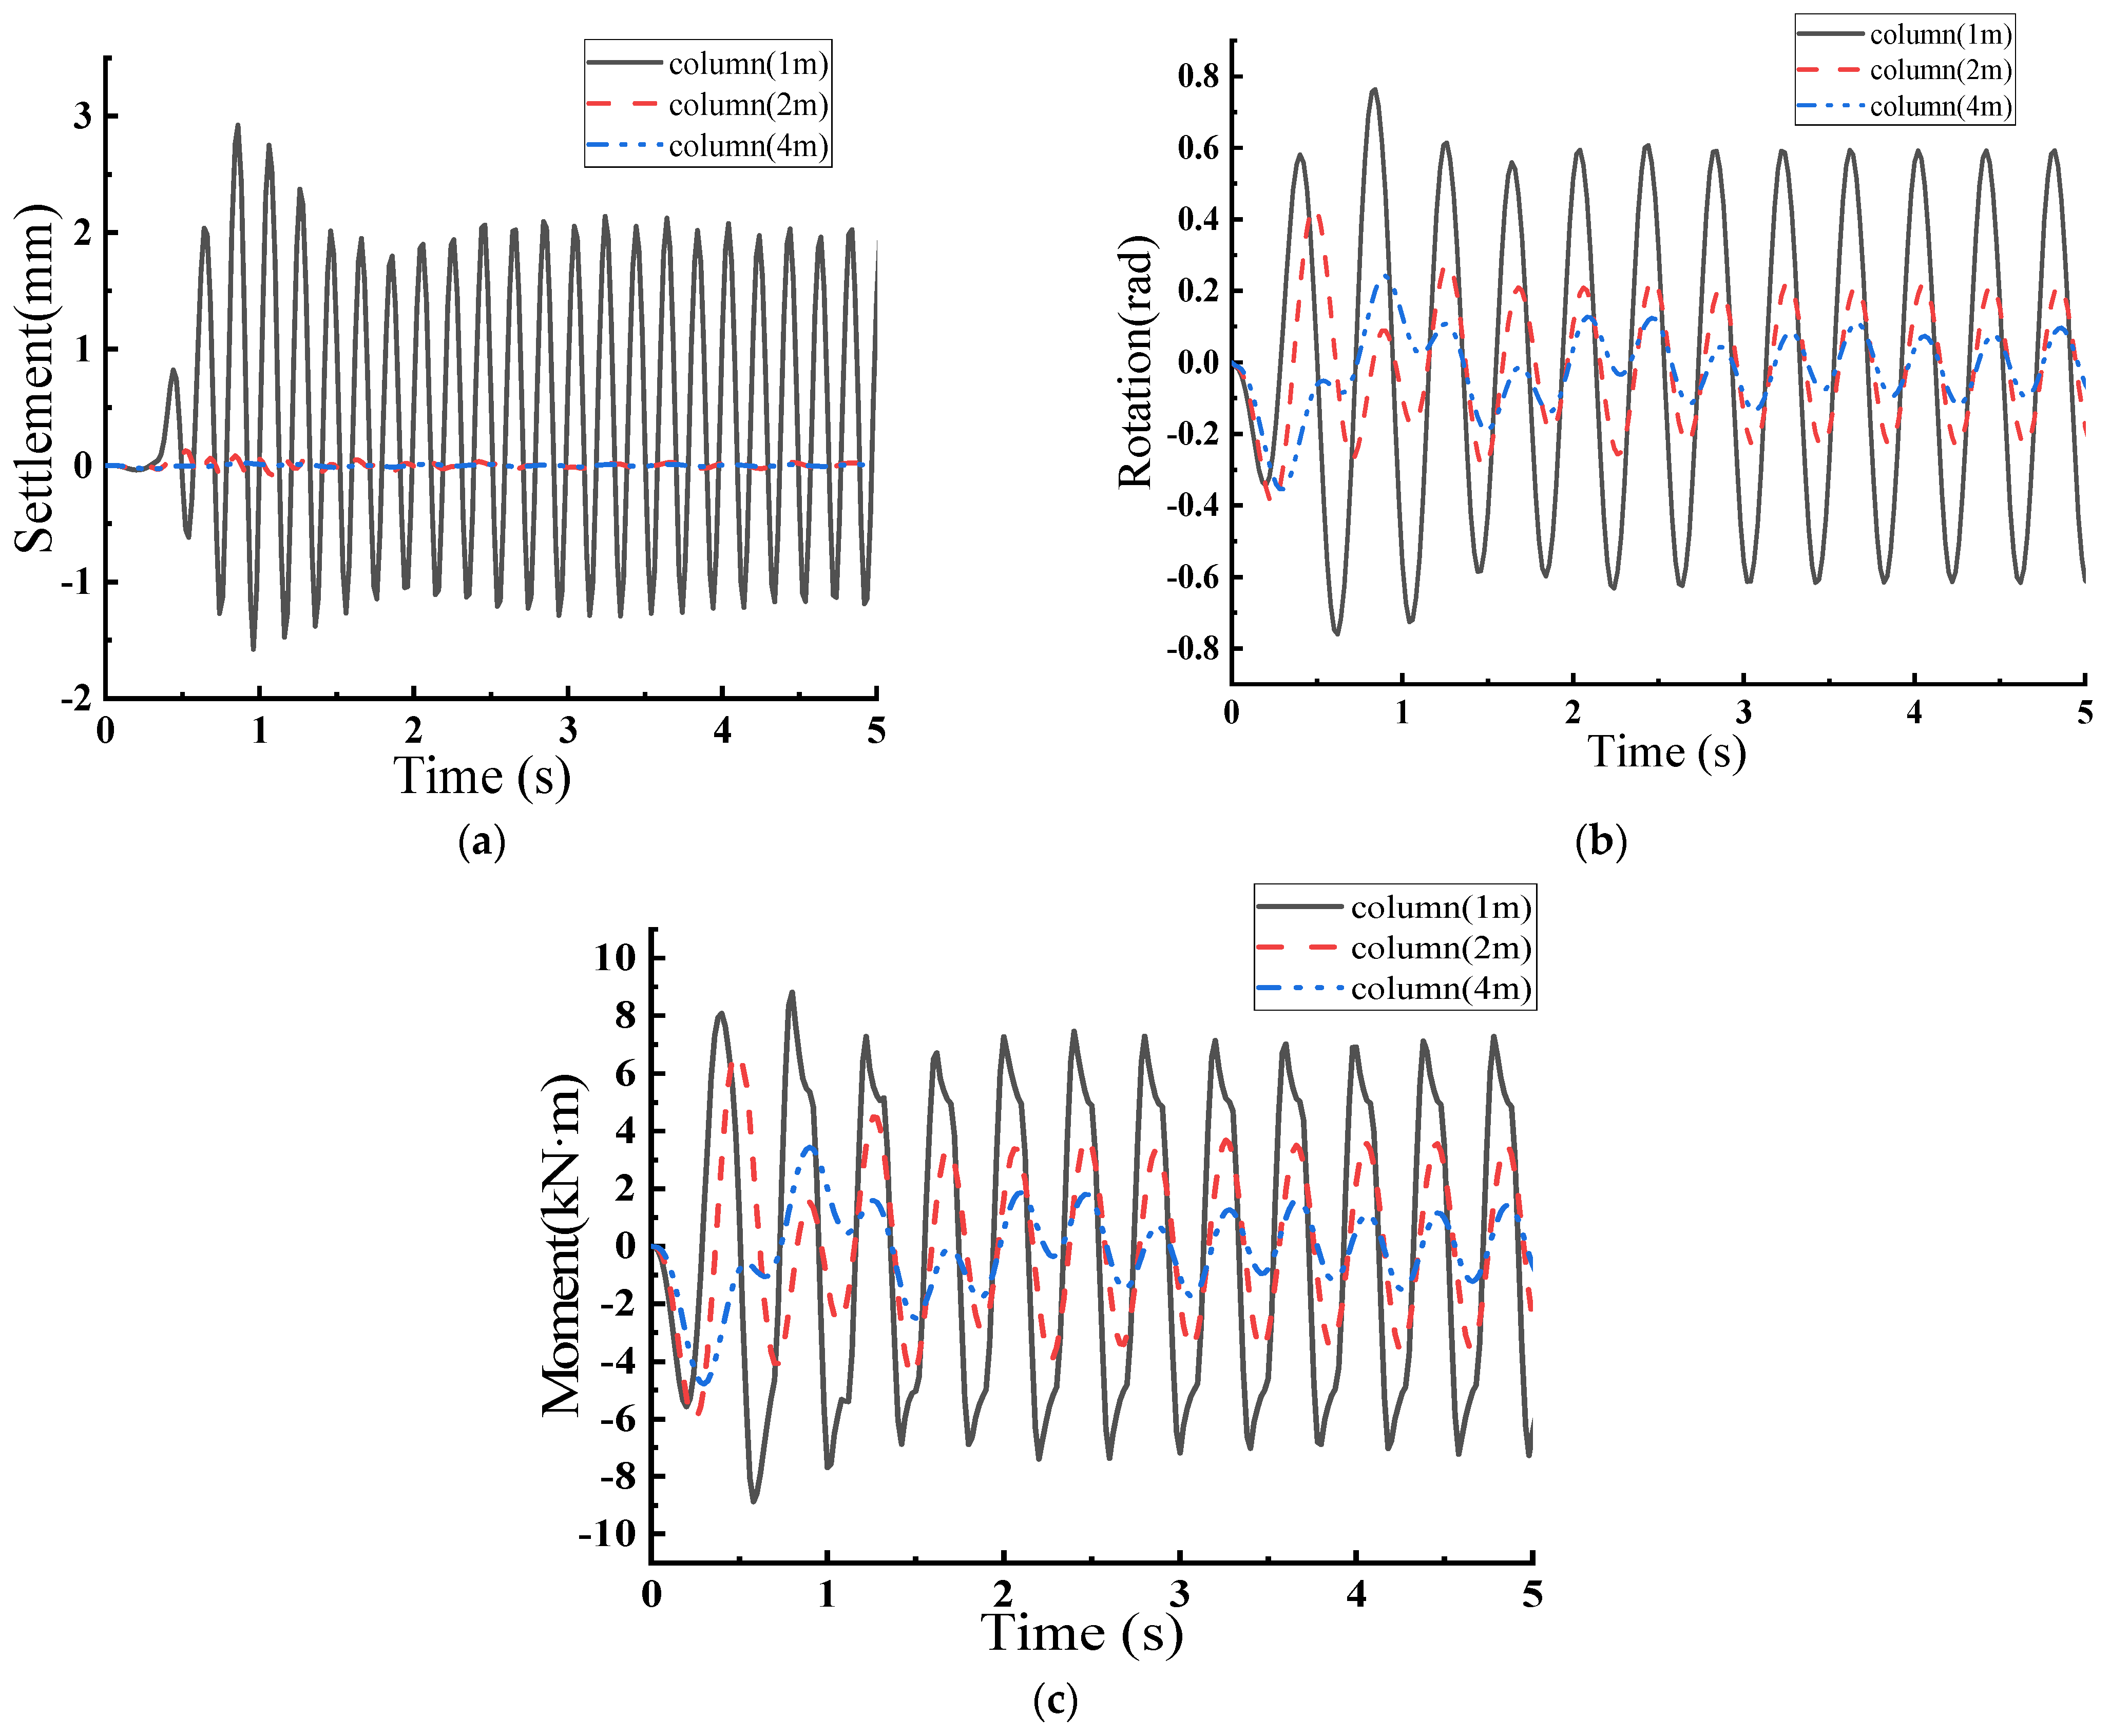
Figure 10.
Response of Rocking Shallow Foundation under the Action of Sine Wave y = 0.1sin (5.04πt). (a) Foundation Settlement–Time; (b) Top Rotation–Time; (c) Moment–Time.
Figure 10.
Response of Rocking Shallow Foundation under the Action of Sine Wave y = 0.1sin (5.04πt). (a) Foundation Settlement–Time; (b) Top Rotation–Time; (c) Moment–Time.
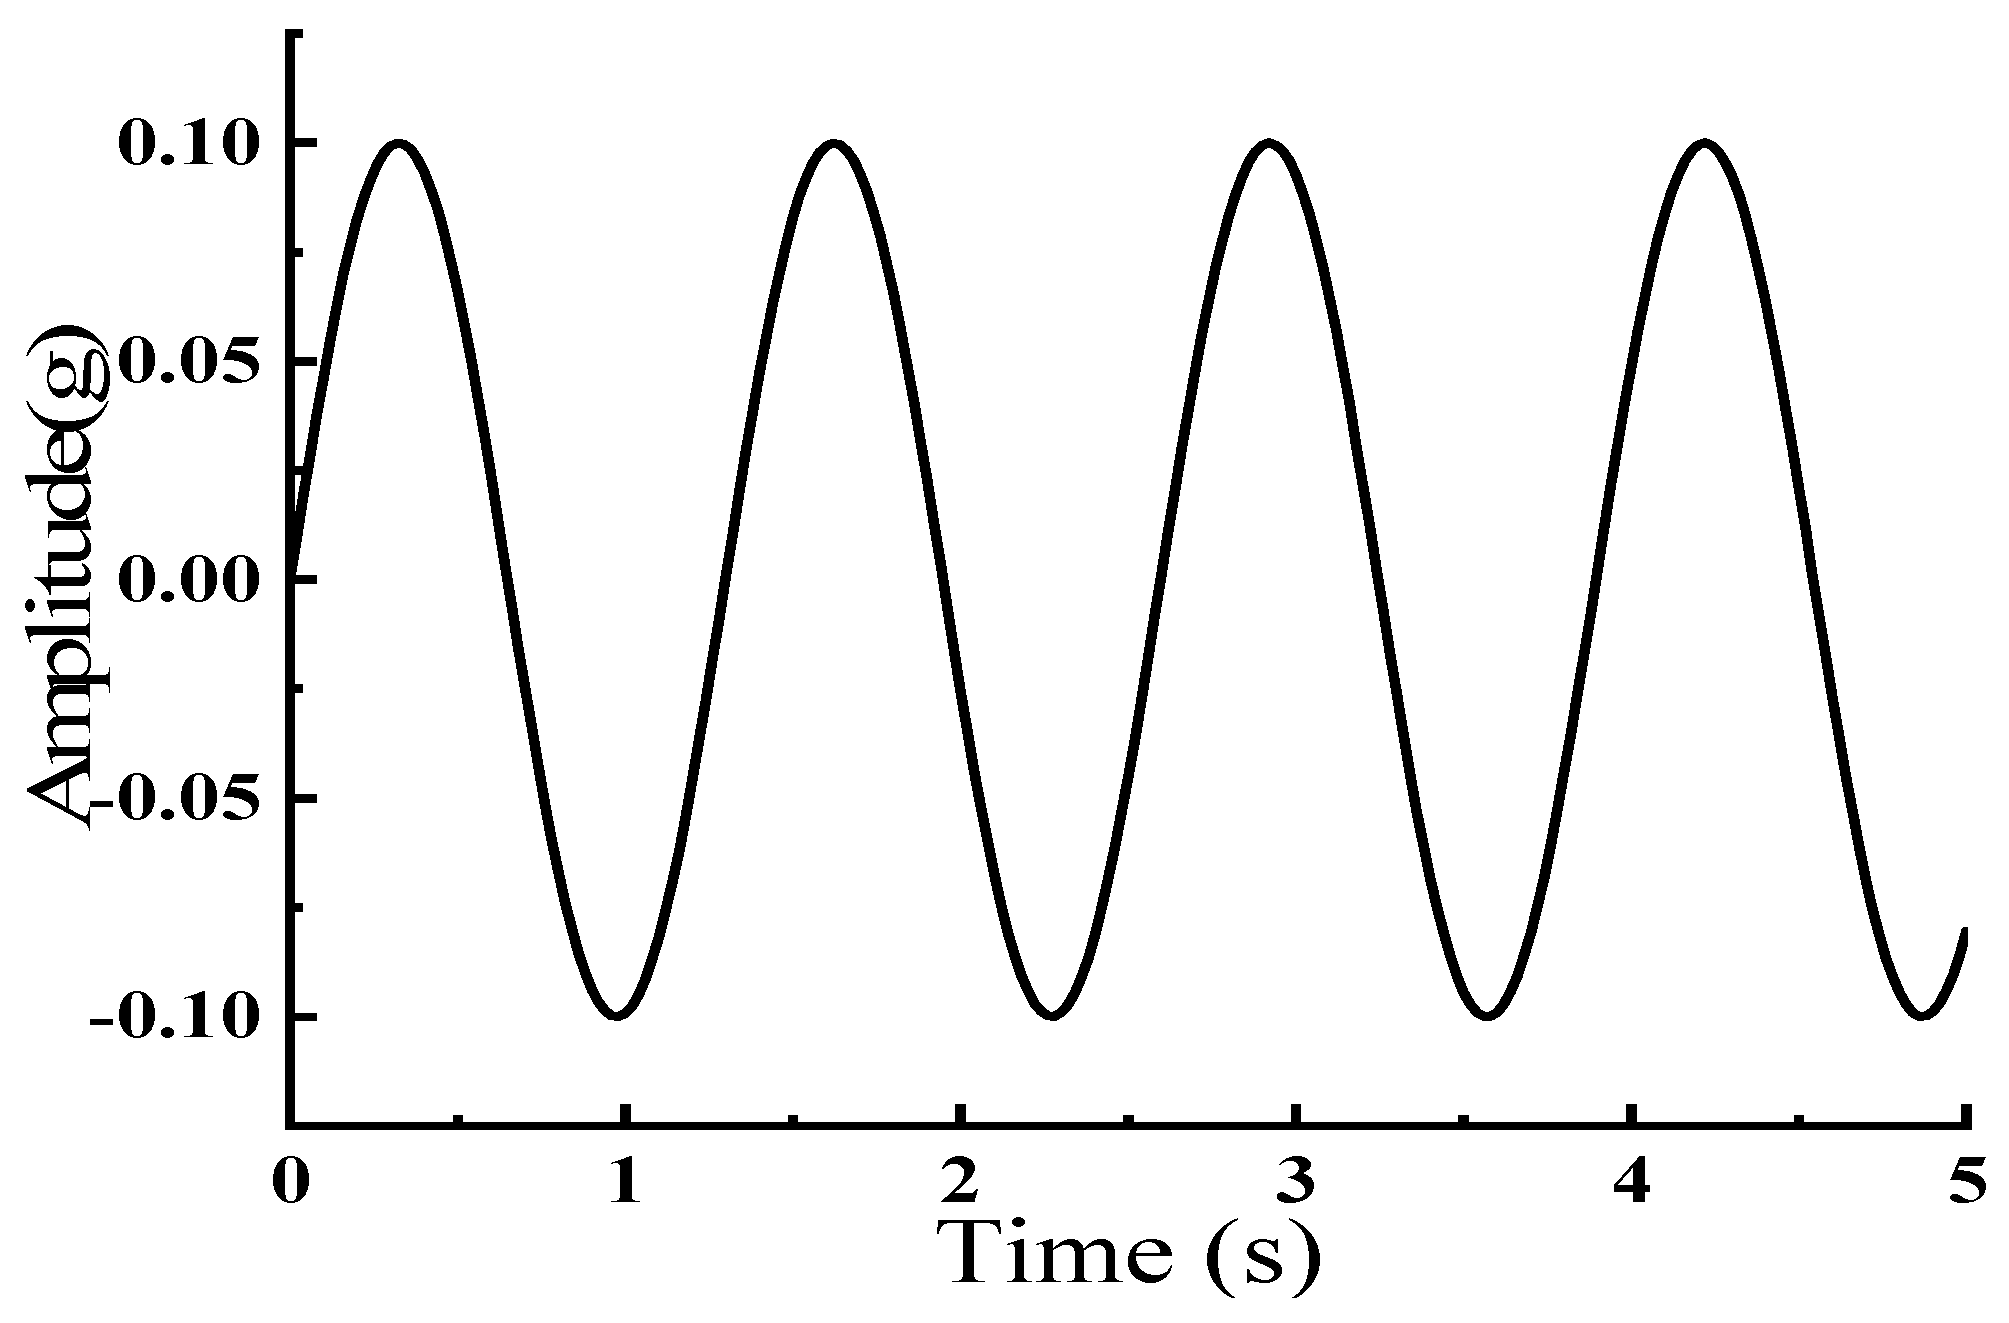
Figure 11.
Sine Wave Graph.
Figure 11.
Sine Wave Graph.
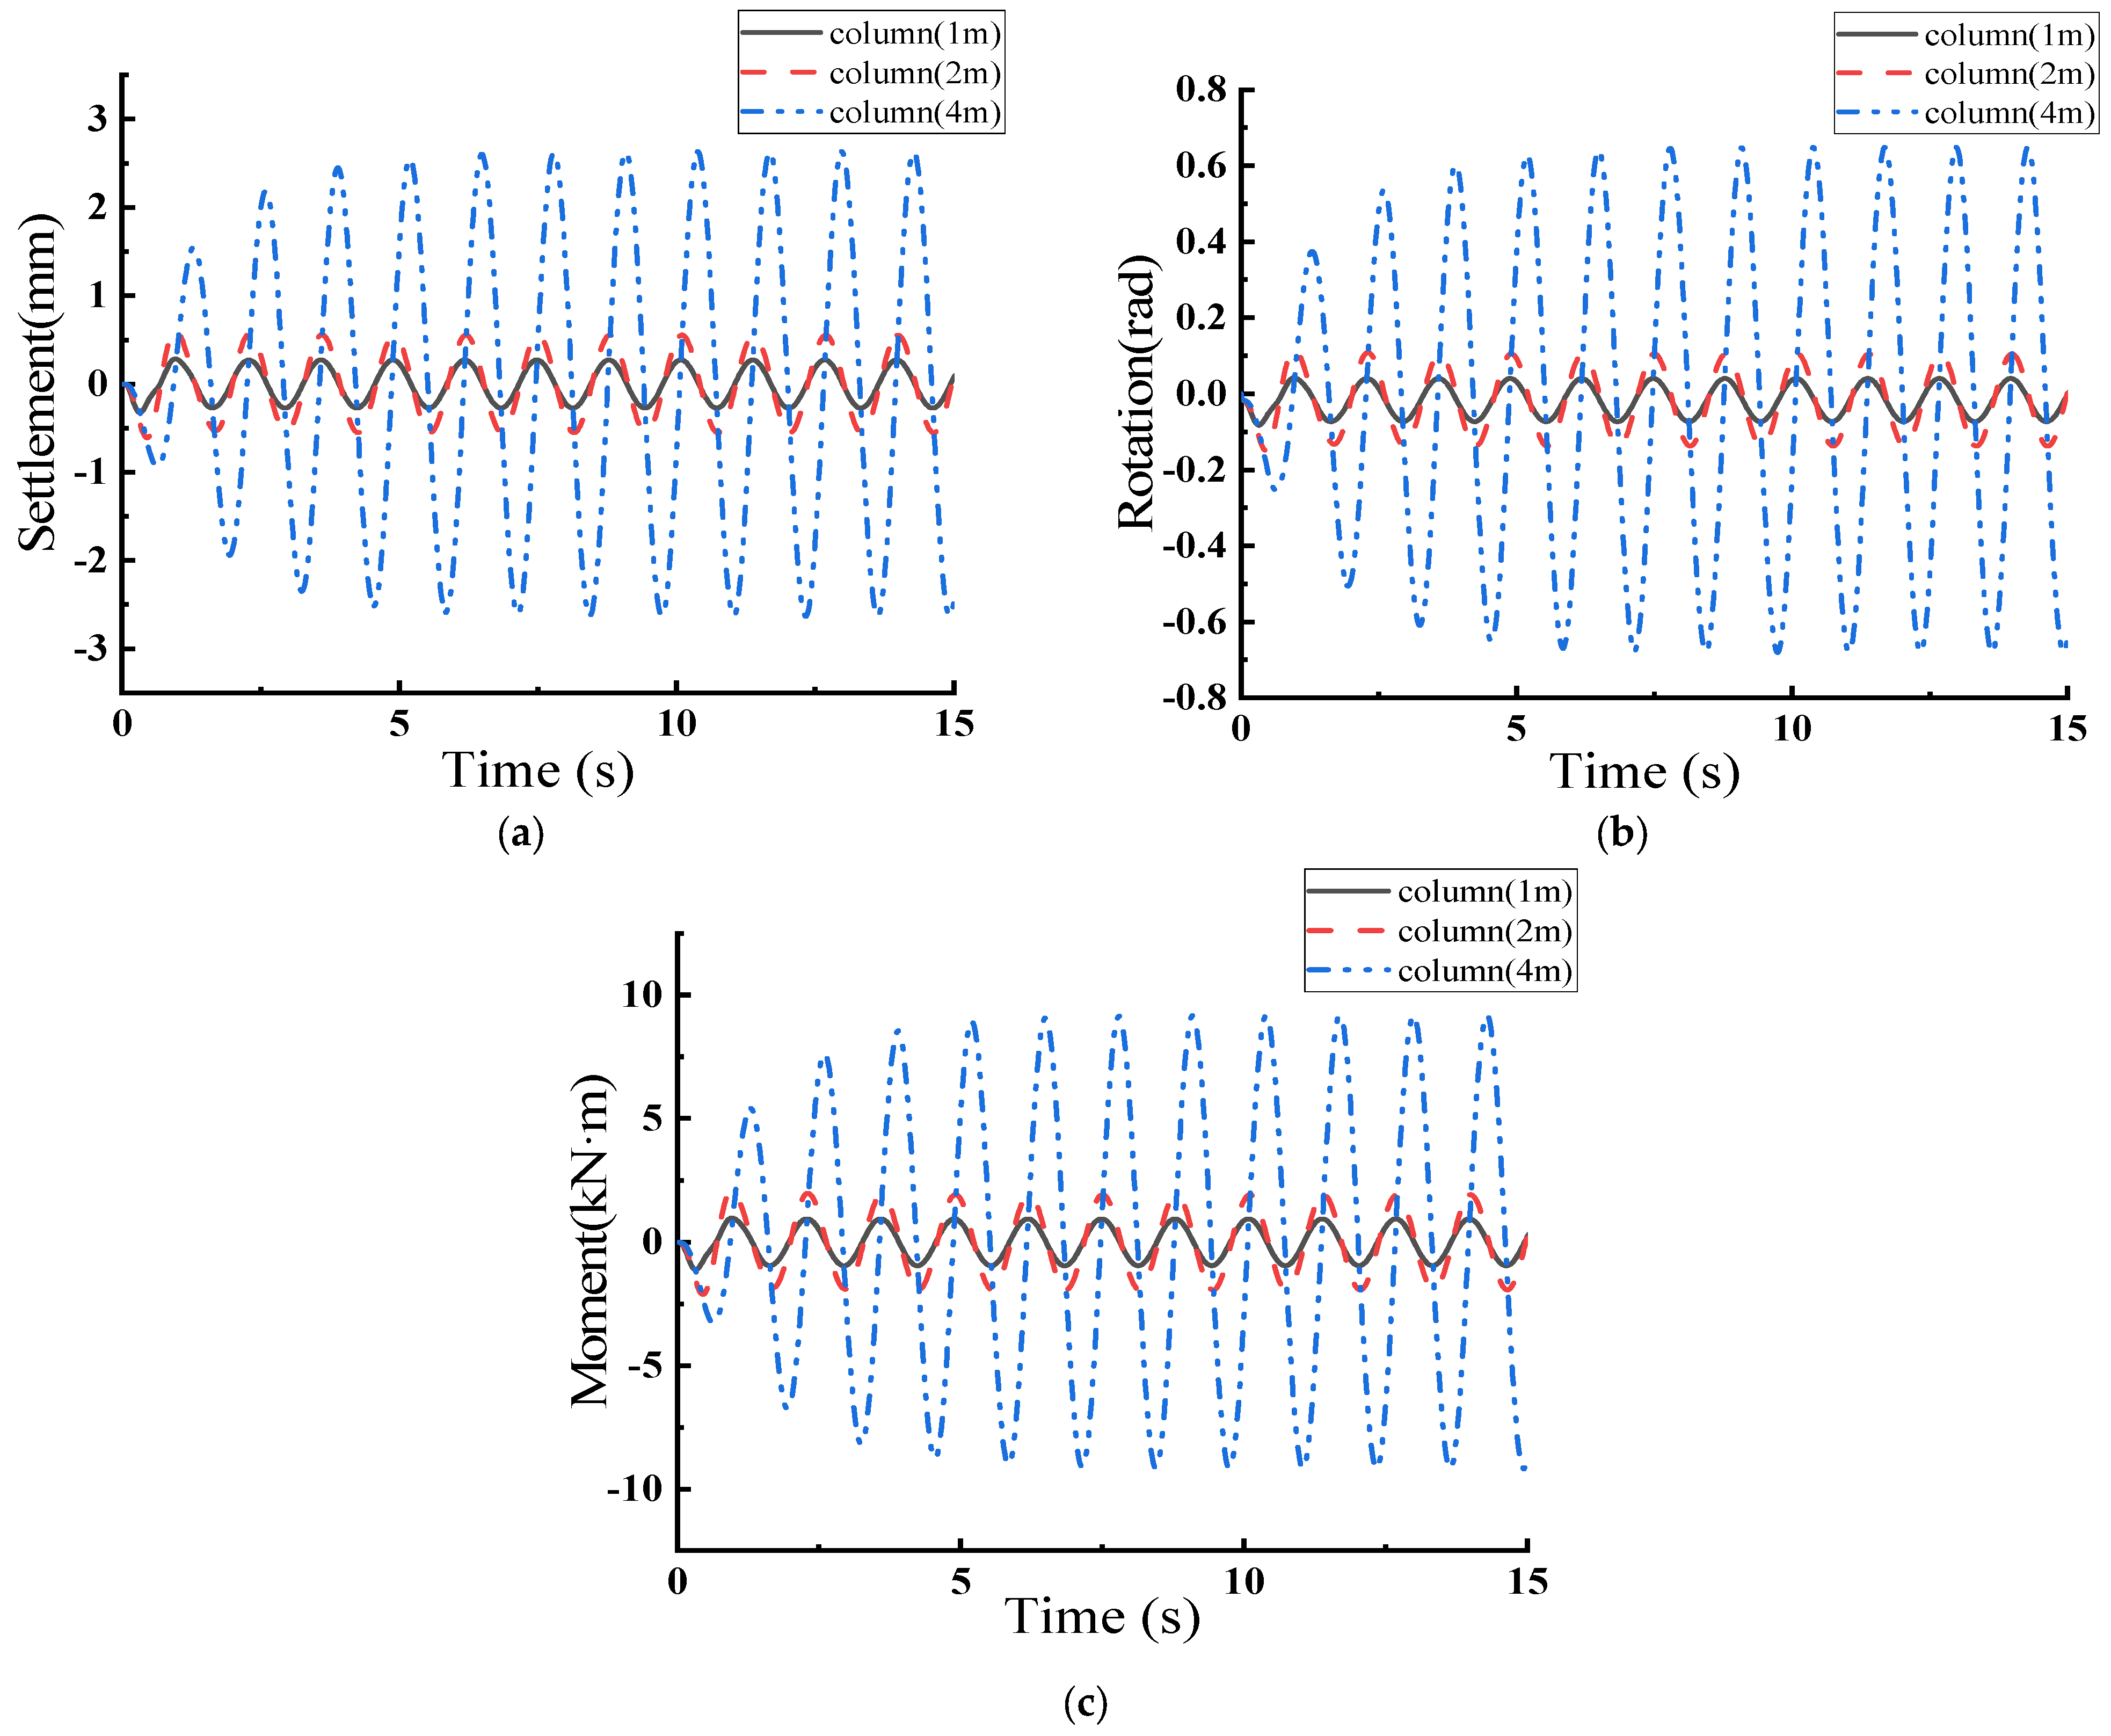
Figure 12.
Response of Rocking Shallow Foundation under the Action of Sine Wave y = 0.01sin (1.54πt). (a) Foundation Settlement–Time; (b) Top Rotation–Time; (c) Moment–Time.
Figure 12.
Response of Rocking Shallow Foundation under the Action of Sine Wave y = 0.01sin (1.54πt). (a) Foundation Settlement–Time; (b) Top Rotation–Time; (c) Moment–Time.
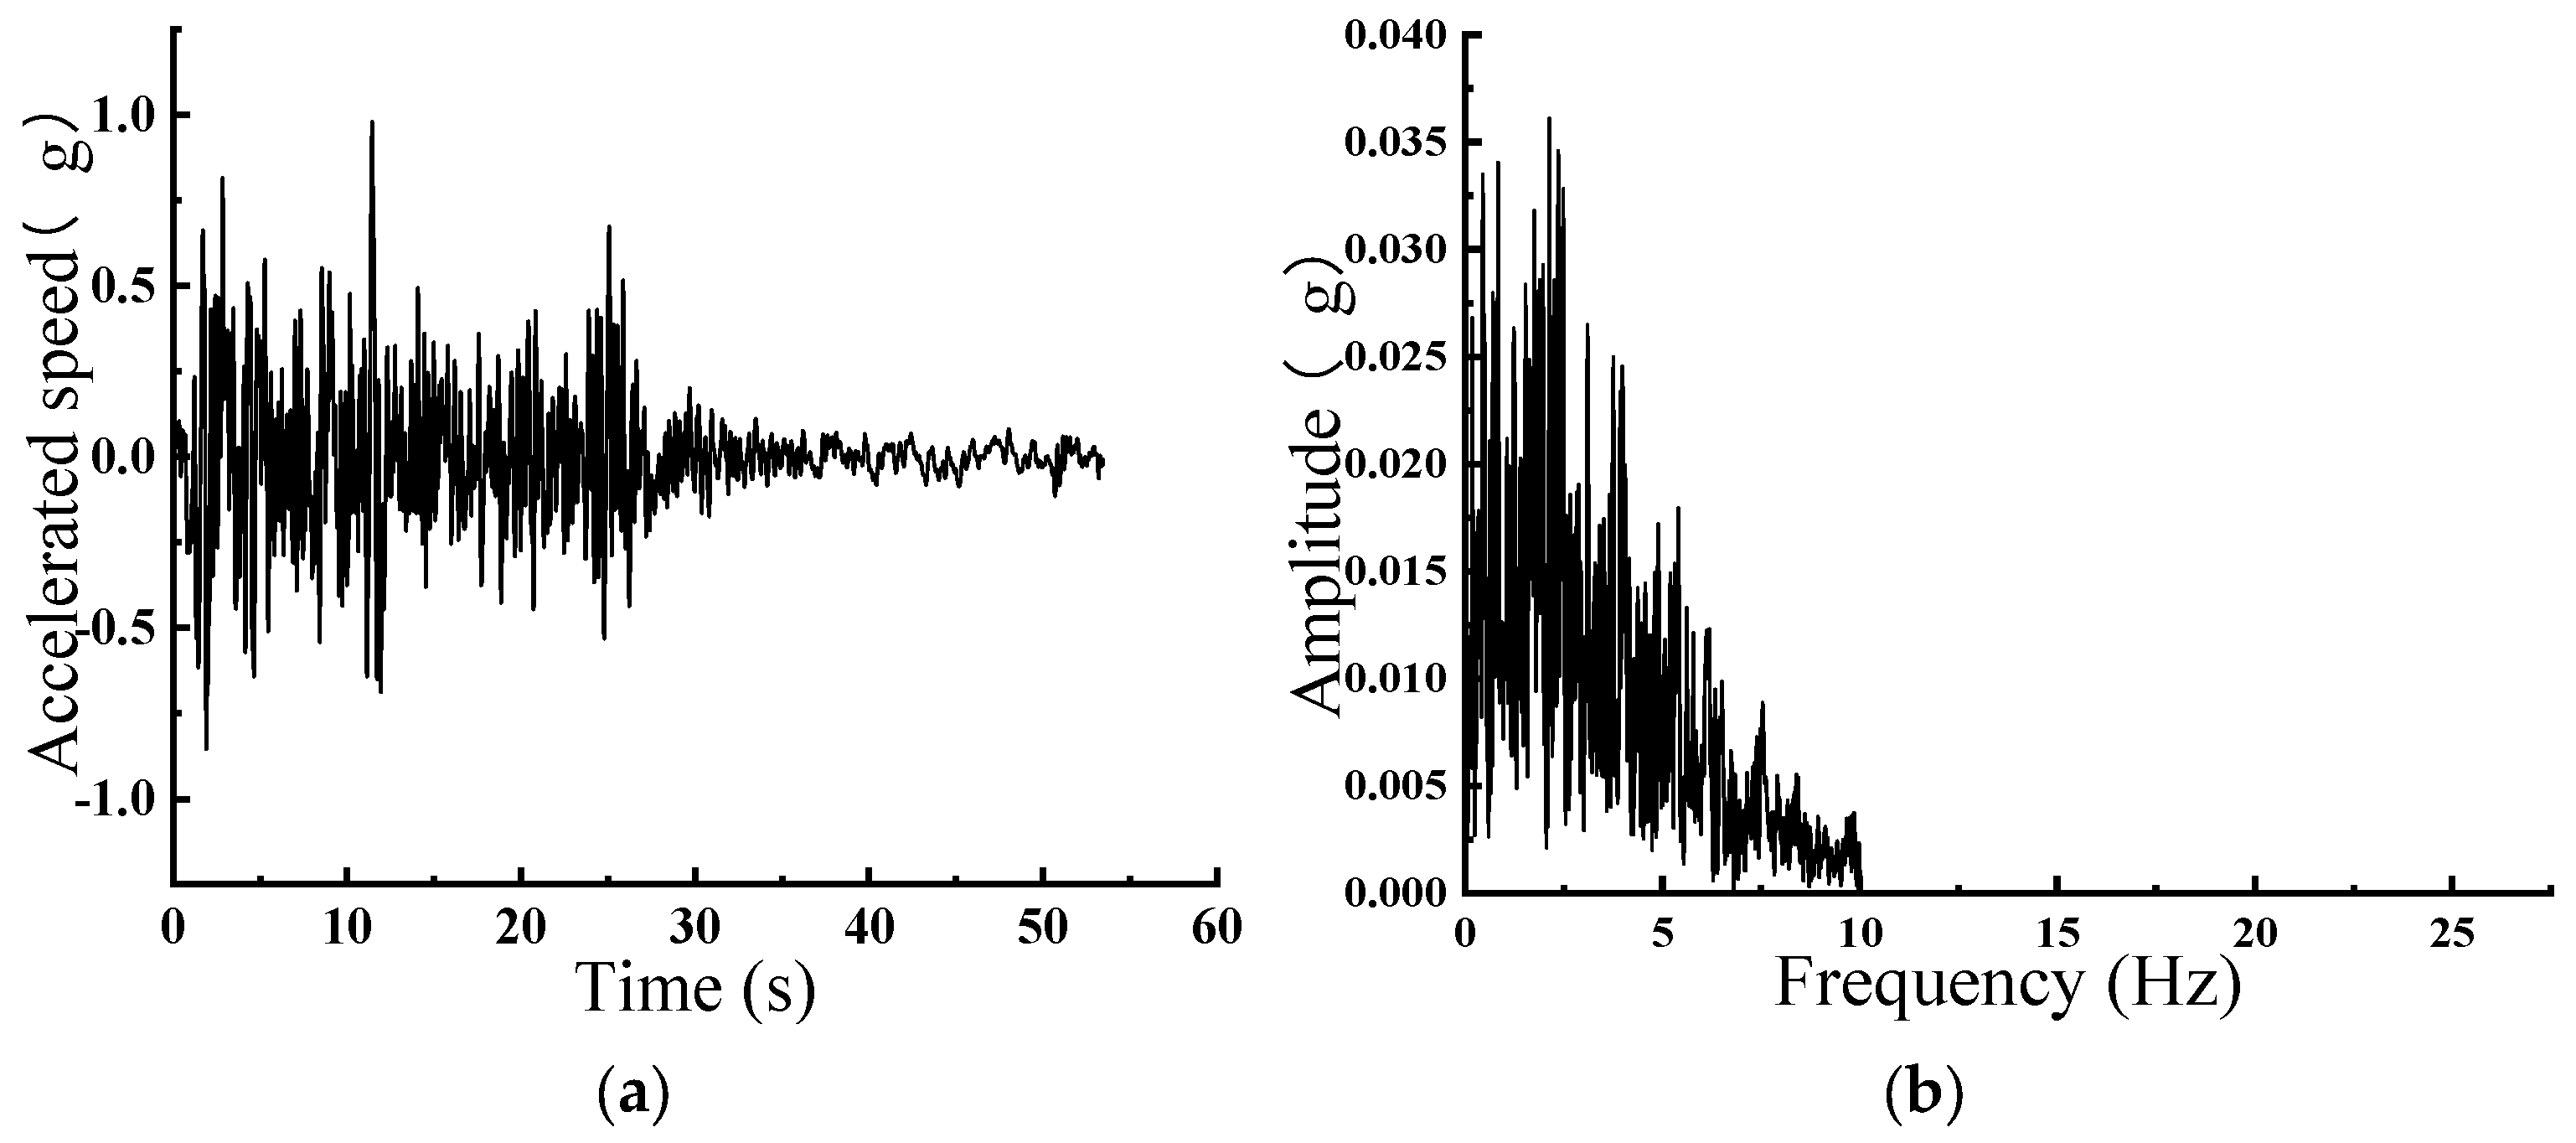
Figure 13.
1 g El Centro Earthquake Wave. (a) Acceleration Time History; (b) Fourier Spectrum.
Figure 13.
1 g El Centro Earthquake Wave. (a) Acceleration Time History; (b) Fourier Spectrum.
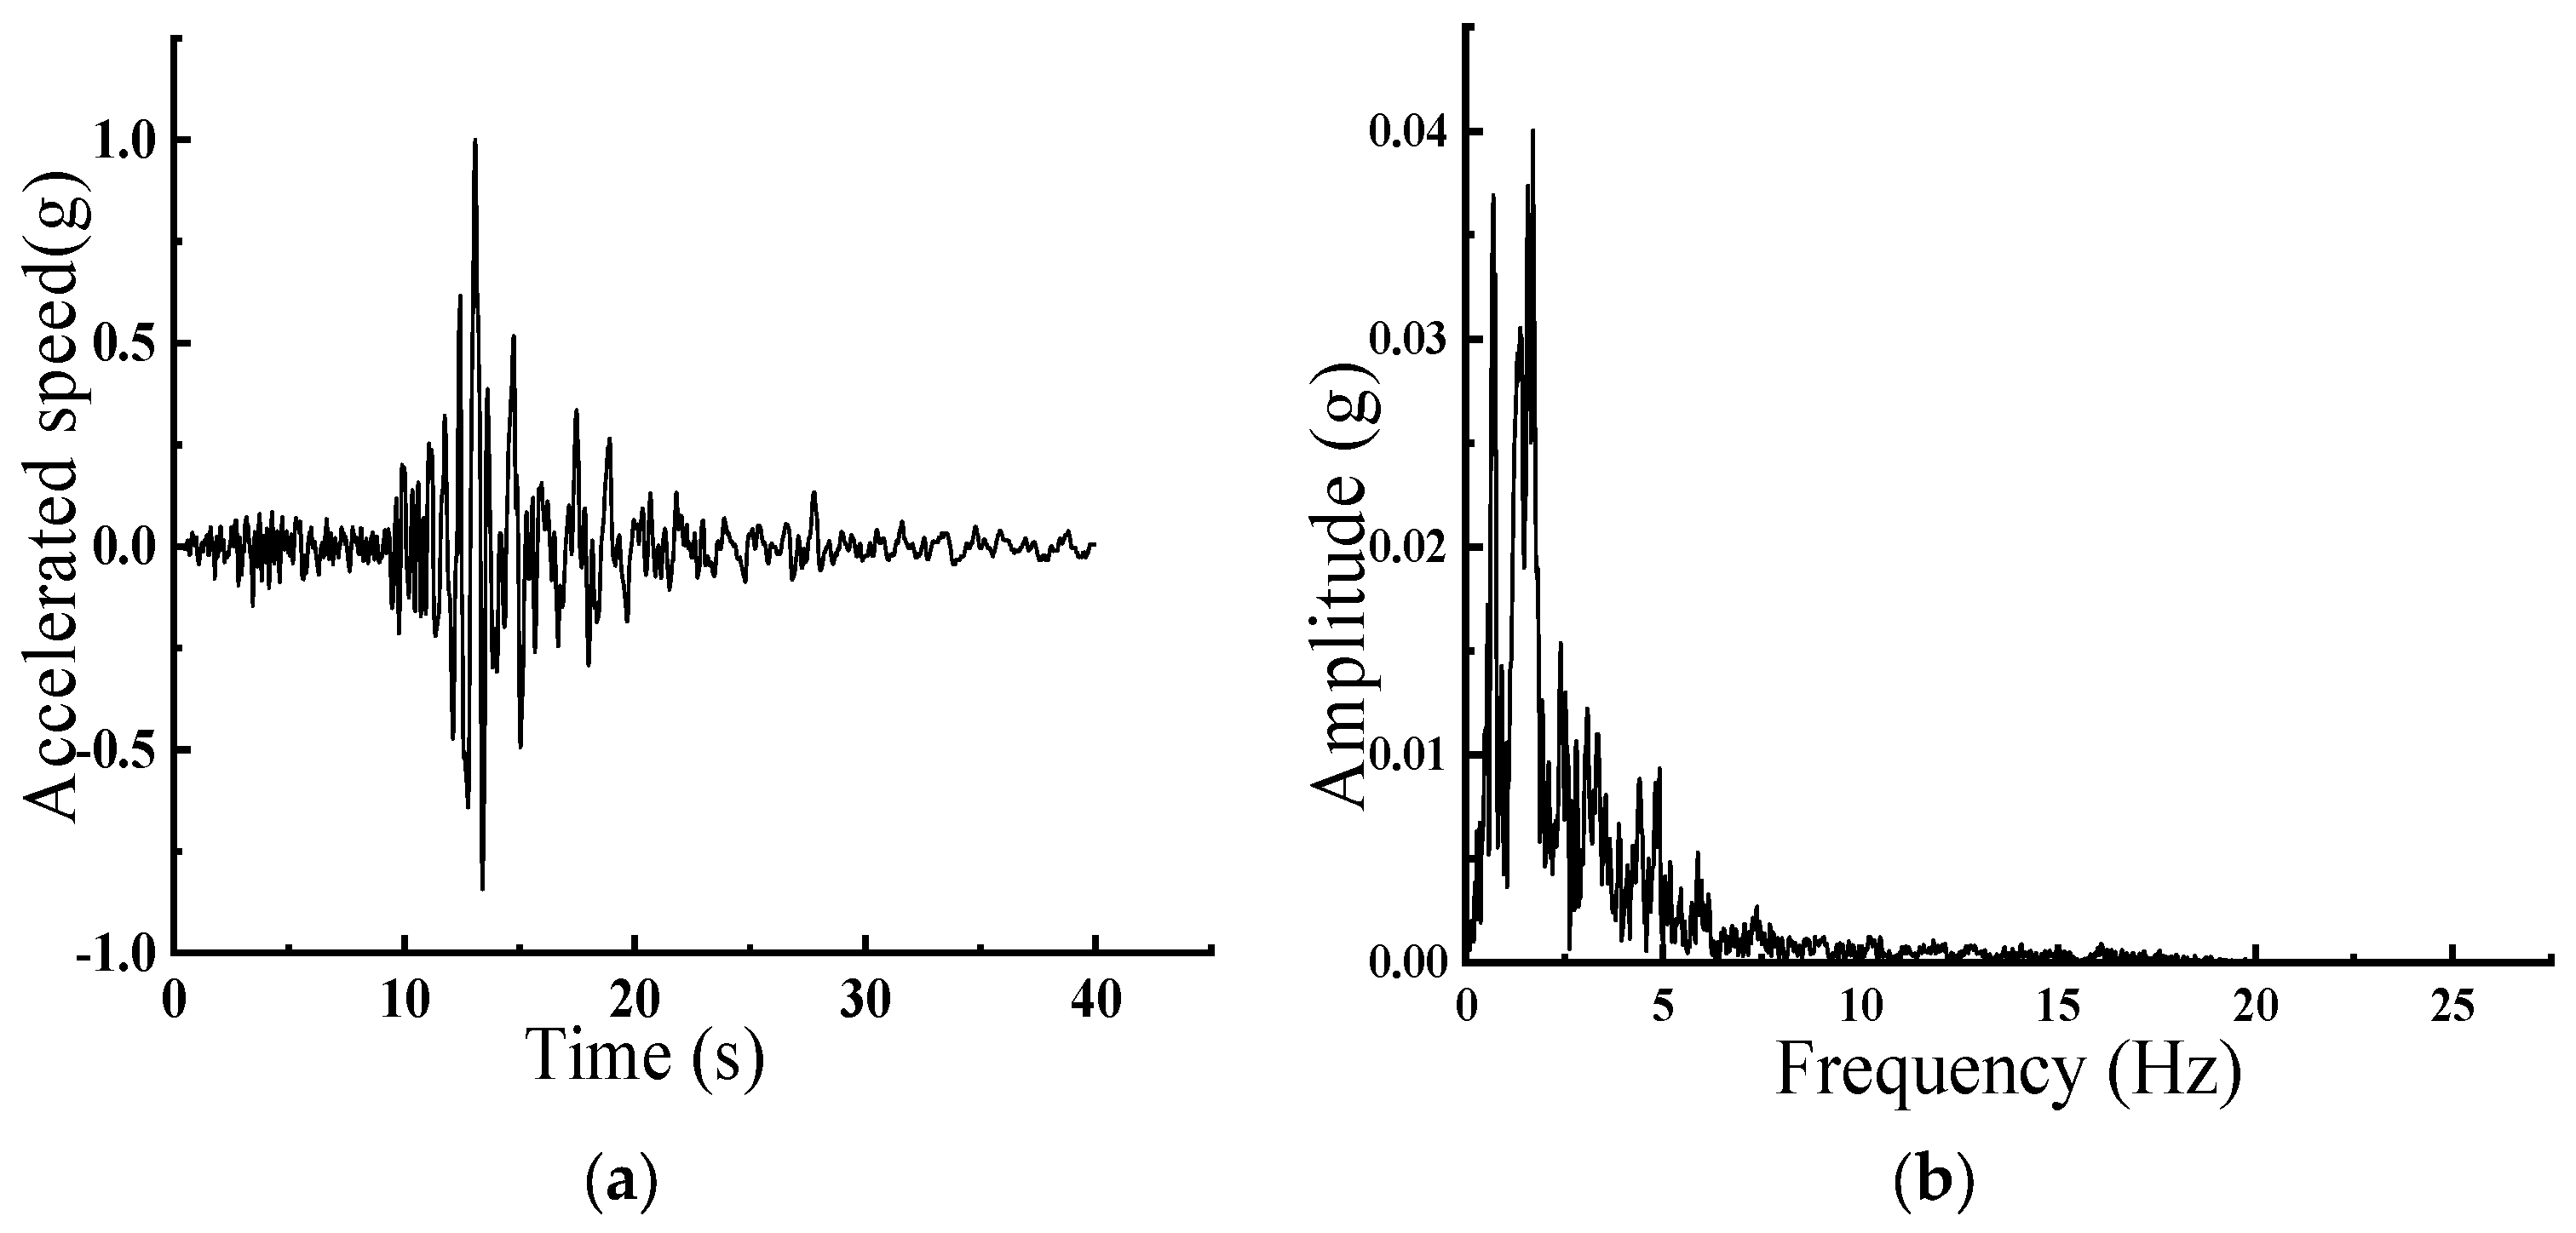
Figure 14.
1 g Loma Earthquake Wave. (a) Acceleration Time History; (b) Fourier Spectrum.
Figure 14.
1 g Loma Earthquake Wave. (a) Acceleration Time History; (b) Fourier Spectrum.
Figure 15.
1 g Taft Earthquake Wave. (a) Acceleration Time History; (b) Fourier Spectrum.
Figure 15.
1 g Taft Earthquake Wave. (a) Acceleration Time History; (b) Fourier Spectrum.
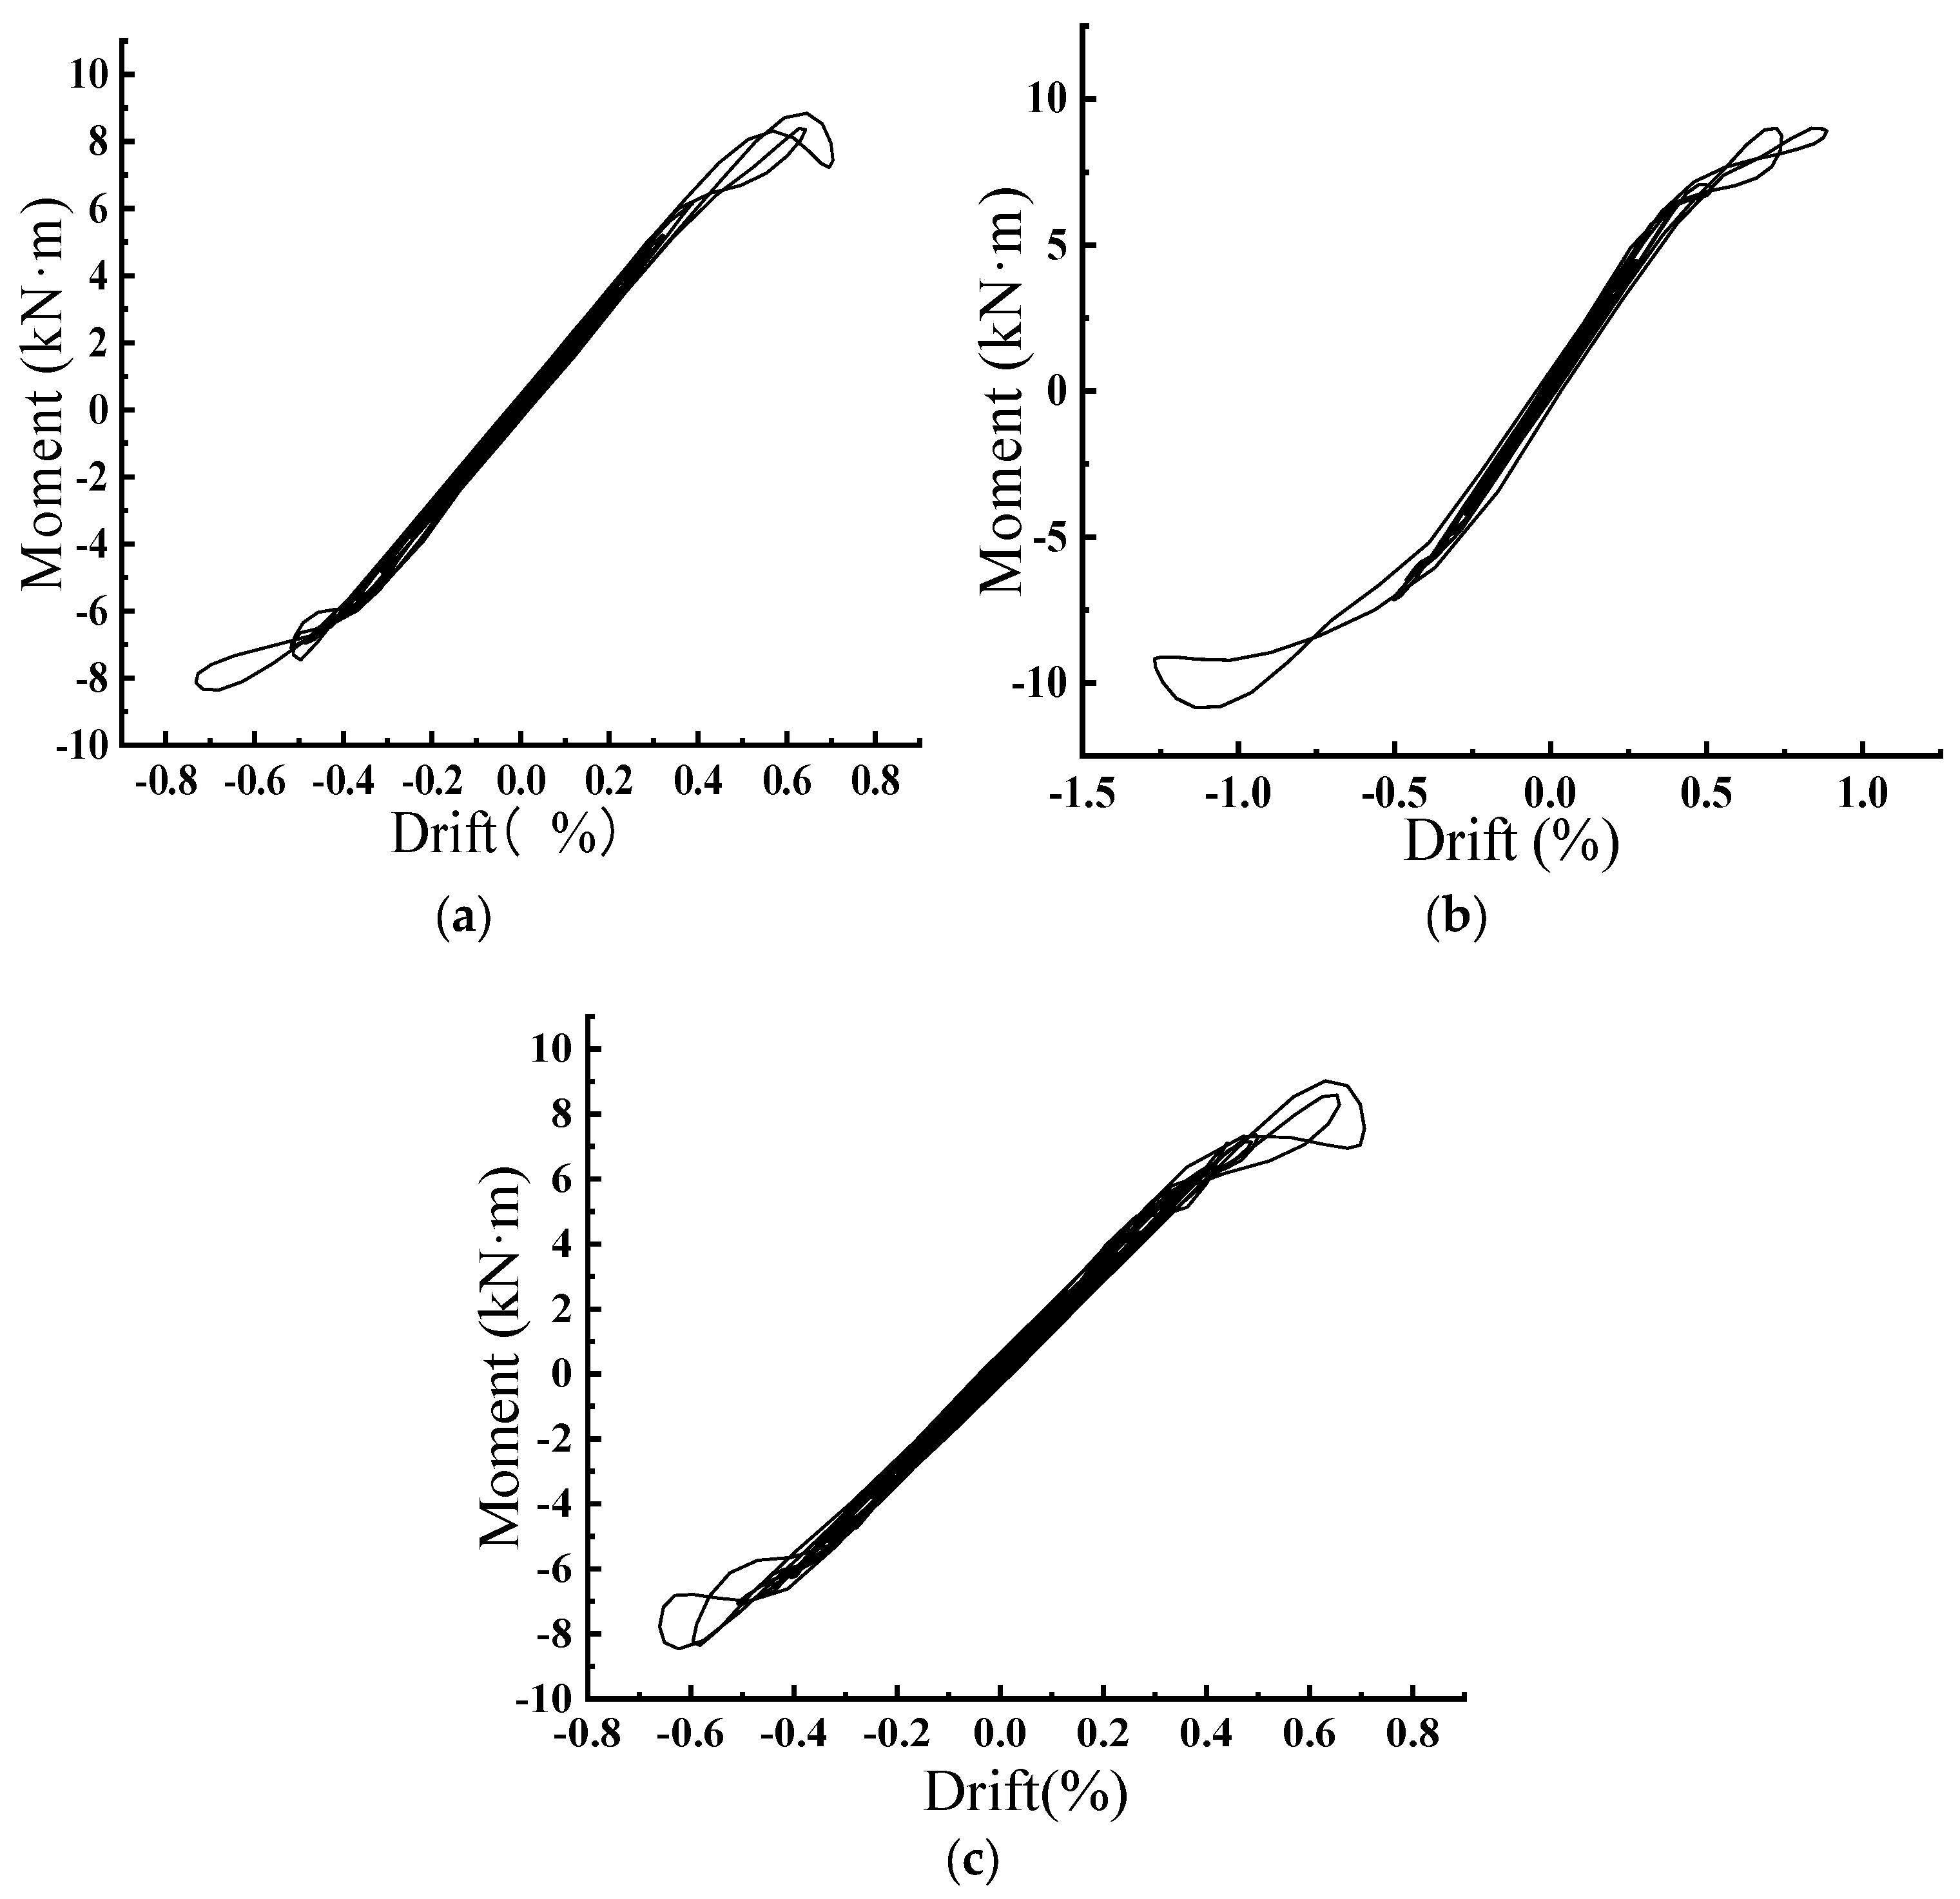
Figure 16.
Displacement Ratio–Moment Graphs under Different Earthquake Waves with a Peak Acceleration of 0.1 g. (a) Displacement Ratio–Moment under 0.1 g El Centro Wave; (b) Displacement Ratio–Moment under 0.1 g Loma Wave; (c) Displacement Ratio–Moment under 0.1 g Taft Wave.
Figure 16.
Displacement Ratio–Moment Graphs under Different Earthquake Waves with a Peak Acceleration of 0.1 g. (a) Displacement Ratio–Moment under 0.1 g El Centro Wave; (b) Displacement Ratio–Moment under 0.1 g Loma Wave; (c) Displacement Ratio–Moment under 0.1 g Taft Wave.
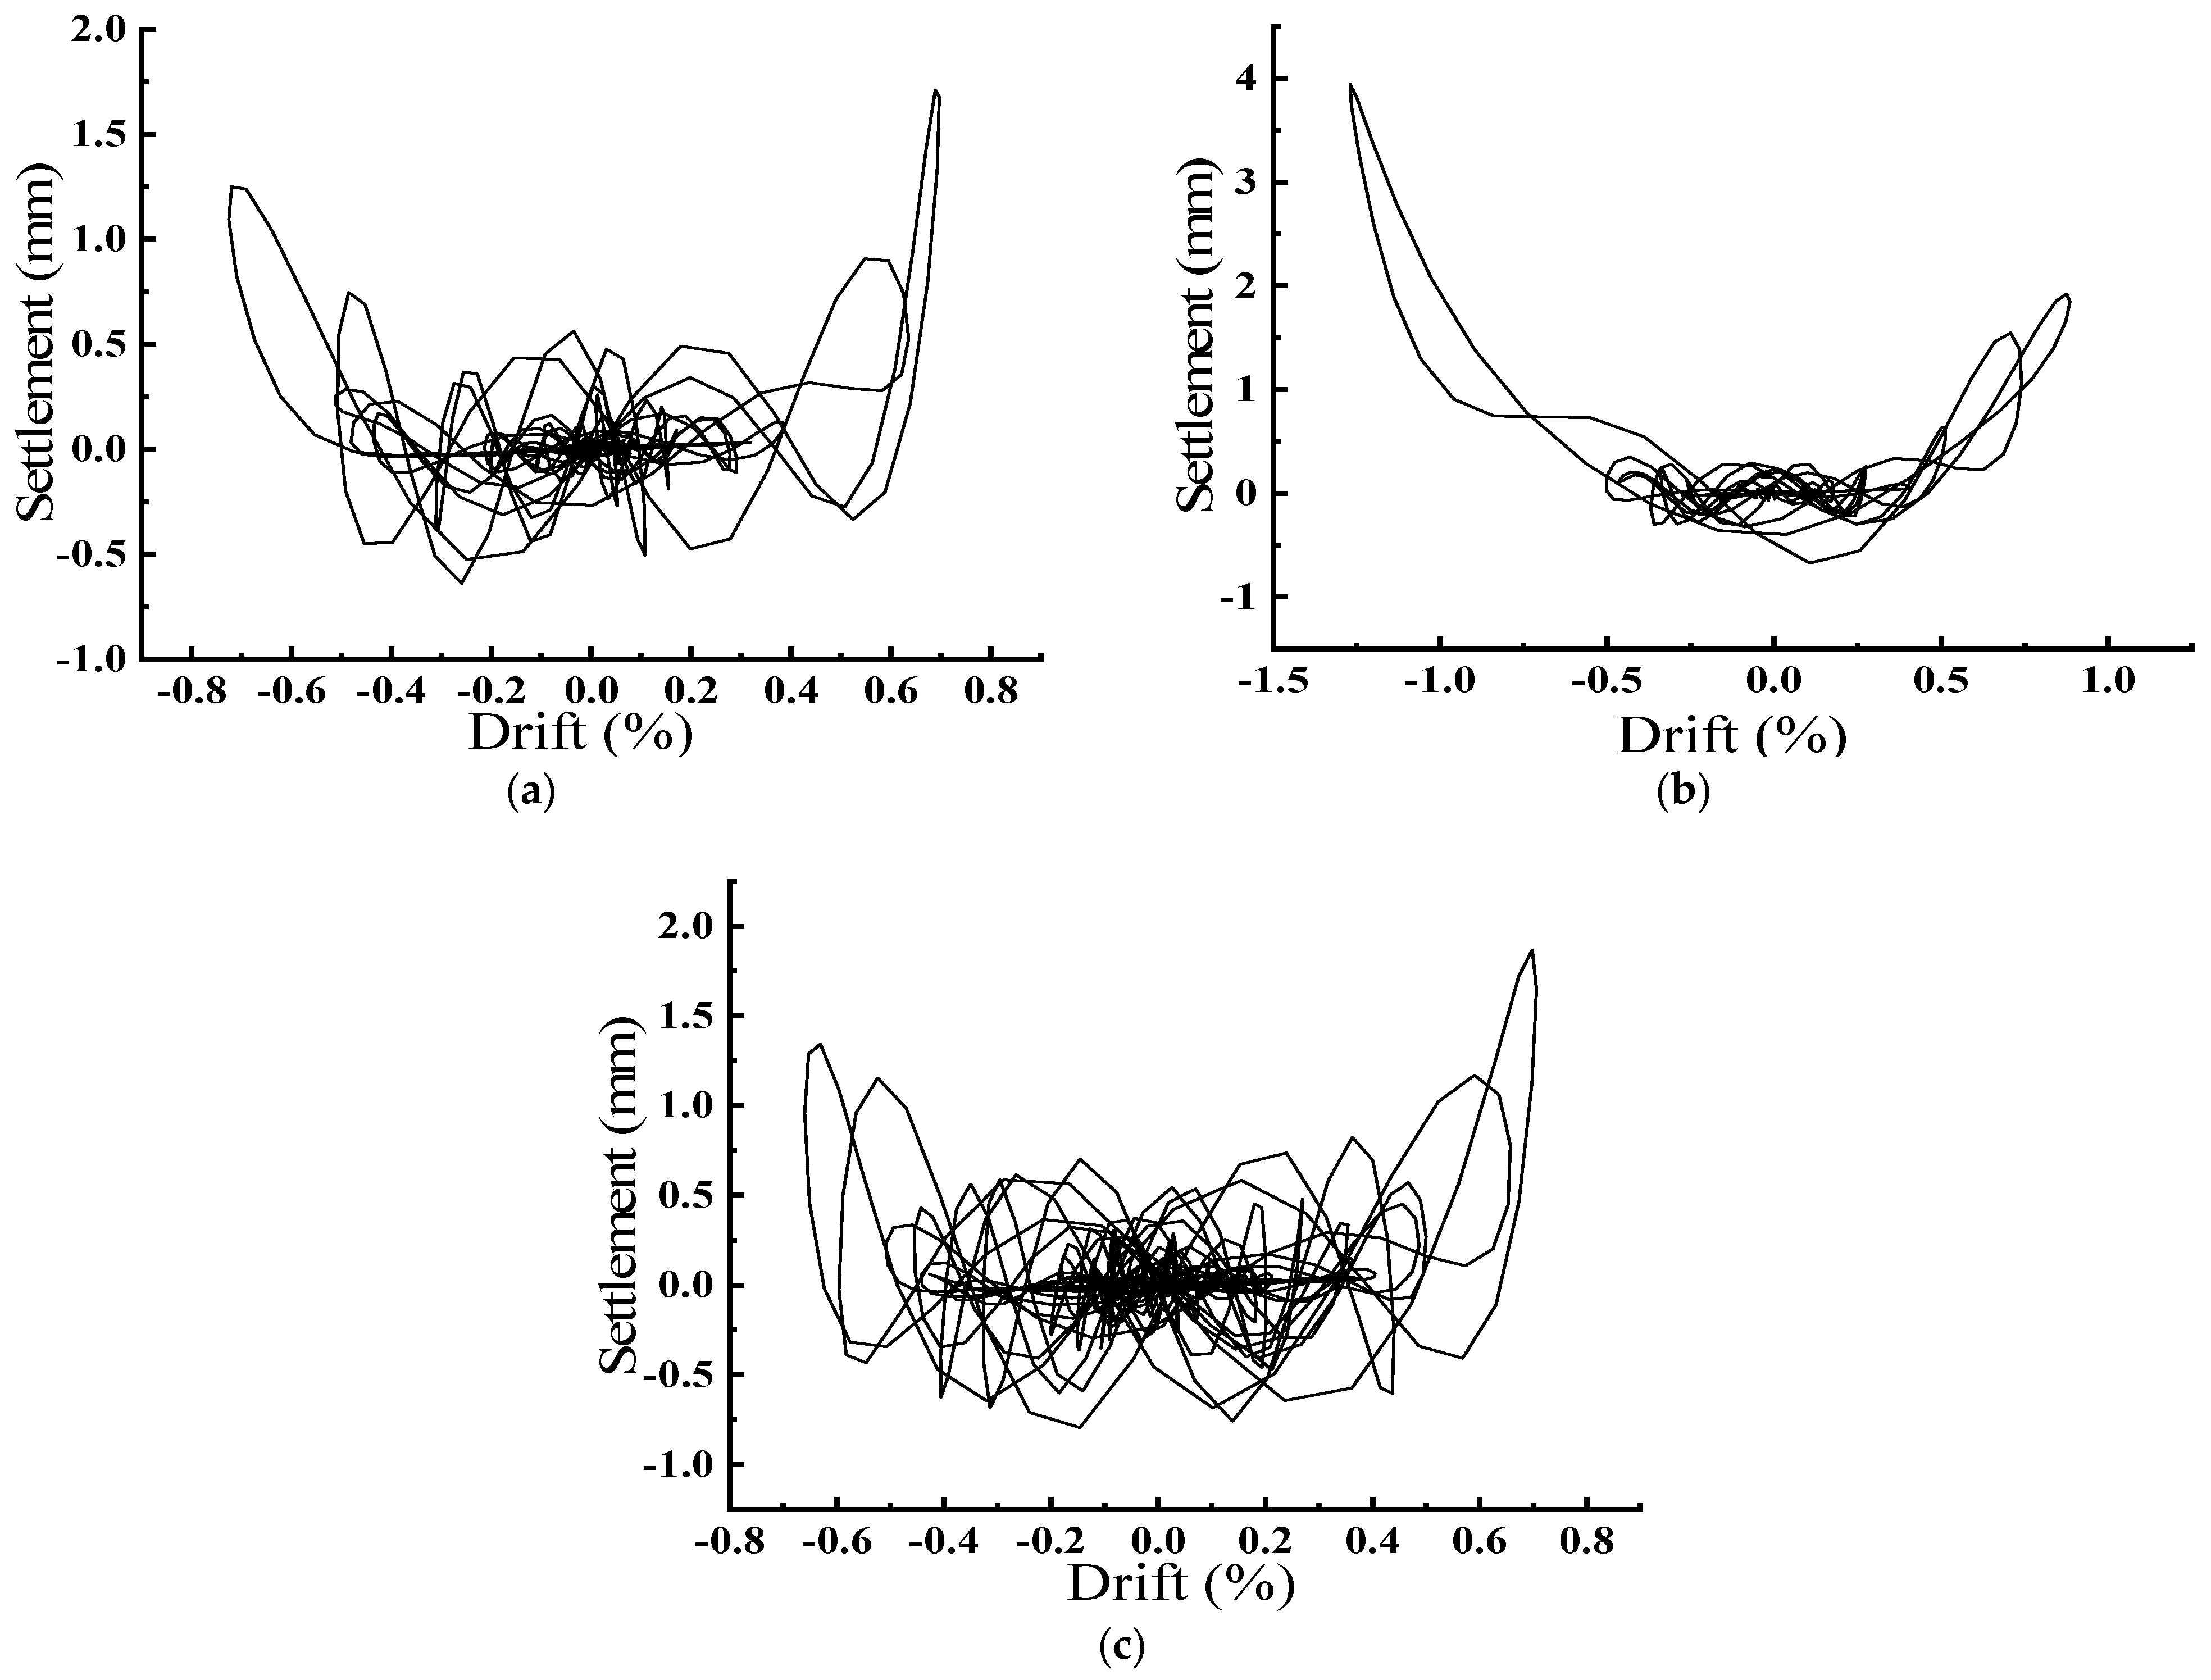
Figure 17.
Displacement Ratio–Settlement Graphs under Different Earthquake Waves with a Peak Acceleration of 0.1 g. (a) Displacement Ratio–Settlement under 0.1 g El Centro Wave; (b) Displacement Ratio–Settlement under 0.1 g Loma Wave; (c) Displacement Ratio–Settlement under 0.1 g Taft Wave.
Figure 17.
Displacement Ratio–Settlement Graphs under Different Earthquake Waves with a Peak Acceleration of 0.1 g. (a) Displacement Ratio–Settlement under 0.1 g El Centro Wave; (b) Displacement Ratio–Settlement under 0.1 g Loma Wave; (c) Displacement Ratio–Settlement under 0.1 g Taft Wave.
Table 1.
Parameters of P–y Spring Model.
Table 1.
Parameters of P–y Spring Model.
| OpenSees Command Parameters | Annotation | Value |
|---|
| soilType | Soil types | 1 |
| pult | ultimate bearing capacity of P–y material | 61,890 |
| Y50 | displacement corresponding to half of the ultimate soil resistance | 0.004 |
| Cd | lifting capacity | 0.03 |
| c | radiation damping | 0.05 |
Table 2.
Parameters of Q–z Spring Model.
Table 2.
Parameters of Q–z Spring Model.
| OpenSees Command Parameters | Annotation | Value |
|---|
| qzType | Q–z spring categories | 1 |
| qult | unit length bearing capacity | 6502 |
| Z50 | displacement corresponding to half of the ultimate soil resistance | 0.12 |
| suction | lifting capacity | 0.03 |
| c | radiation damping | 0.05 |
Table 3.
Parameters of T–x Spring Model.
Table 3.
Parameters of T–x Spring Model.
| OpenSees Command Parameters | Annotation | Value |
|---|
| txType | Soil types | 1 |
| tult | ultimate bearing capacity of T–x material | 150,000 |
| Z50 | displacement corresponding to half of the ultimate soil resistance | 0.01 |
| c | radiation damping | 0.05 |
Table 4.
Maximum Moments for Models with Different Column Heights.
Table 4.
Maximum Moments for Models with Different Column Heights.
| Column Height (m) | Maximum Bending Moment Under Positive Loading (kN·m) | Maximum Bending Moment Under Negative Loading (kN·m) |
|---|
| 2 | 34.09 | −34.42 |
| 2.5 | 32.77 | −33.17 |
| 3 | 32.16 | −31.92 |
Table 5.
Maximum Foundation Settlements for Models with Different Column Heights.
Table 5.
Maximum Foundation Settlements for Models with Different Column Heights.
| Column Height (m) | Maximum Foundation Settlement Under Positive Loading (mm) | Maximum Foundation Settlement Under Negative Loading (mm) |
|---|
| 2 | 28.99 | 30.58 |
| 2.5 | 21.03 | 22.97 |
| 3 | 16.39 | 17.84 |
Table 6.
Maximum Moments for Models with Different Foundation Sizes.
Table 6.
Maximum Moments for Models with Different Foundation Sizes.
| Foundation Sizes | Maximum Bending Moment Under Positive Loading (kN·m) | Maximum Bending Moment Under Negative Loading (kN·m) |
|---|
| 1.5 m × 1 m | 34.09 | −34.42 |
| 2 m × 1.5 m | 82.86 | −83.38 |
| 3 m × 2 m | 152.75 | −195.93 |
Table 7.
Maximum Foundation Settlements for Models with Different Foundation Sizes.
Table 7.
Maximum Foundation Settlements for Models with Different Foundation Sizes.
| Foundation Sizes | Maximum Foundation Settlement Under Positive Loading (mm) | Maximum Foundation Settlement Under Negative Loading (mm) |
|---|
| 1.5 m × 1 m | 28.99 | 30.58 |
| 2 m × 1.5 m | 31.34 | 34.29 |
| 3 m × 2 m | 50.70 | 55.48 |
Table 8.
Maximum Moments for Models with Different Top Masses.
Table 8.
Maximum Moments for Models with Different Top Masses.
| Top Mass | Maximum Bending Moment Under Positive Loading (kN·m) | Maximum Bending Moment Under Negative Loading (kN·m) |
|---|
| original | 34.09 | −34.42 |
| twice | 47.13 | −47.38 |
Table 9.
Maximum Foundation Settlements for Models with Different Top Masses.
Table 9.
Maximum Foundation Settlements for Models with Different Top Masses.
| Top Mass | Maximum Foundation Settlement Under Positive Loading (mm) | Maximum Foundation Settlement Under Negative Loading (mm) |
|---|
| original | 28.99 | 30.58 |
| twice | 20.41 | 22.54 |
Table 10.
Maximum Moments in Different Soft and Hard Soils for the Model.
Table 10.
Maximum Moments in Different Soft and Hard Soils for the Model.
| Cohesion of Soil | Maximum Bending Moment Under Positive Loading (kN·m) | Maximum Bending Moment Under Negative Loading (kN·m) |
|---|
| 100 kpa | 34.09 | −34.42 |
| 80 kpa | 33.45 | −33.29 |
| 50 kpa | 31.83 | −31.53 |
Table 11.
Foundation Settlements in Different Soft and Hard Soils for the Model.
Table 11.
Foundation Settlements in Different Soft and Hard Soils for the Model.
| Cohesion of Soil | Foundation Settlement Under Positive Loading (mm) | Foundation Settlement Under Negative Loading (mm) |
|---|
| 100 kpa | 28.99 | −1.56 | 30.58 | −1.44 |
| 80 kpa | 27.51 | −2.46 | 30.00 | −2.33 |
| 50 kpa | 25.55 | −3.21 | 28.86 | −3.22 |
Table 12.
Settlement, Rotation, and Moment for Rocking Shallow Foundation under Sine Wave Action.
Table 12.
Settlement, Rotation, and Moment for Rocking Shallow Foundation under Sine Wave Action.
| Column Height | Maximum Foundation Settlement (mm) | Maximum Rotation (θ) | Maximum Bending Moment (kN·m) |
|---|
| 1 m | 0.42 | 0.48 | 7.38 |
| 2 m | 3.98 | 1.17 | 10.31 |
| 4 m | 0.79 | 0.56 | 6.96 |
Table 13.
Settlement, Rotation, and Moment for Rocking Shallow Foundation under Sine Wave y = 0.1sin (5.04πt) Action.
Table 13.
Settlement, Rotation, and Moment for Rocking Shallow Foundation under Sine Wave y = 0.1sin (5.04πt) Action.
| Column Height | Maximum Foundation Settlement (mm) | Maximum Rotation (θ) | Maximum Bending Moment (kN·m) |
|---|
| 1 m | 2.92 | 0.76 | 8.81 |
| 2 m | 0.13 | 0.44 | 6.75 |
| 4 m | 0.02 | 0.24 | 3.45 |
Table 14.
Settlement, Rotation, and Moment for Rocking Shallow Foundation under Sine Wave y = 0.1sin (1.54πt) Action.
Table 14.
Settlement, Rotation, and Moment for Rocking Shallow Foundation under Sine Wave y = 0.1sin (1.54πt) Action.
| Column Height | Maximum Foundation Settlement (mm) | Maximum Rotation (θ) | Maximum Bending Moment (kN·m) |
|---|
| 1 m | 0.3 | 0.04 | 0.90 |
| 2 m | 0.6 | 0.12 | 2.12 |
| 4 m | 2.6 | 0.64 | 9.16 |


