Article

Strength- and Moisture-Related Studies of Historical Building Materials: A Case Study from Southern Estonia

1
Department of Cultural Heritage & Conservation, Faculty of Art and Culture, Estonian Academy of Arts, Põhja Puestee 7, 10412 Tallinn, Estonia
2
Tartu College, School of Engineering, Tallinn University of Technology (TalTech), Puiestee 78, 51008 Tartu, Estonia
*
Author to whom correspondence should be addressed.
Buildings 2024, 14(11), 3565; https://doi.org/10.3390/buildings14113565
Submission received: 23 August 2024 / Revised: 25 October 2024 / Accepted: 28 October 2024 / Published: 8 November 2024
(This article belongs to the Section Building Materials, and Repair & Renovation)

Abstract

Demolition of existing buildings turns building products into waste. The amount of demolition waste is increasing globally. The current case study is an example of fulfilling the EU Waste Framework Directive of reducing demolition waste by reuse of historical materials in their original structures. The aim of this paper is to investigate construction materials from 19th and 20th centuries and their mechanical and physical properties in a case study building from the conservation area of Võru city, South Estonia. Timber structures of the case study building were non-destructively tested on-site using a resistive method. Ceramic brick plinth and basement walls, as well as concrete and granite ceiling, were tested in situ non-destructively (rebound hammer test) for compressive strength estimation. Previously dismantled timber logs, slats and ceramic bricks were tested in the laboratory for compression and bending, respectively. The logs and slats matched the European timber bending strength classes C22 and C40, respectively. The compressive strength of the studied ceramic bricks was comparable to that of newly produced bricks. The non-destructive moisture content of timber structures varied in spring (5–20%) but was steady in the autumn (5–7%) tests. The rebound hammer test overestimated by 1.5…2 times the compressive strength of the studied materials compared to laboratory tests.

1. Introduction

Construction results in the production of construction and demolition waste (C&DW). Annual demolition waste is expected to reach 2.2 billion tonnes globally by 2025 [1]. Demolition represents more than 90 percent of total C&DW generation in the US. In 2018, construction and demolition activities generated 1.13 billion tonnes of waste in China [2], 850 million tonnes of waste in the EU [3] and over 600 million tonnes in the US [4]. Through demolition, massive amounts of original building products are turned into demolition waste. Therefore, the management of C&DW has already become a growing challenge for modern societies.
Current European policies have identified the efficient management of C&DW as a priority area. The EU Waste Framework Directive (WFD) set a target for reuse and the recycling of municipal waste, which should be increased to a minimum of 55%, 60% and 65% by weight by 2025, 2030 and 2035, respectively. The WFD should also be followed for national heritage buildings. Heritage buildings constitute substantial historical, cultural [5] and social capital for any country [6]. For example, industrial heritage buildings in Norway [7], heritage buildings in the Gaza conflict zone [8] and socio-religious historic buildings in Pakistan [9] have been previously studied.
In Estonia, there are more than 5000 buildings under heritage protection. The National Heritage Board of Estonia defines a heritage building under national protection, along with its interior (including interior design elements and fittings related to the building’s original function), as a facility or a building complex that is an important signifier of Estonian architectural history, the development of the spatial environment and a guardian of a diverse living environment [10]. The population and housing censuses of Estonia have registered the decrease in population in the regions of Ida-Virumaa, Valgamaa and Võrumaa. This has resulted in unoccupied residential buildings which require demolition after years of abandonment. The restoration of historical buildings consists of more challenges than that of buildings with non-historical values [11]. Many historical buildings have been constructed with materials and techniques that are no longer used or available [12]. It can be more complex to restore these building without compromising their historical integrity [13]. The properties of old, historical construction materials are often not known and, therefore, widely replaced with newly produced copies during restoration practice. However, the moisture content in historical building structures should be checked and predicted to avoid the deterioration of the materials [14]. The service life and the durability of wooden structures are closely related to the moisture content of the materials [15]. This paper draws attention to the physical (density, moisture content) and mechanical (bending tensile and compressive strength) properties of historical materials, discussing their prolonged use in existing structures in the example of a case study building in the heritage conservation area of south-east Estonia. Two parts (net areas of 47.3 m2 and 241.9 m2) of the building consist of the following historical materials as load-bearing structures: granite stone (88.5 m3), ceramic solid brick masonry (9.8 m3), reinforced concrete (1.1 m3), logs (38.9 m3) and structural timber (16.3 m3) [16]. A visual inspection of the technical condition [17] and cultural heritage value of the structures, as well as the cost of different restoration scenarios and the environmental impact, was performed and reported by the authors in 2023–2024 [16].
The main aim of this paper is to comprehensively assess and compare the strength and durability properties of the case study building’s materials. It evaluates whether the bending and compressive strengths of the studied historical materials can be classified as meeting the requirements of modern use (declaration of performance, strength classes). A crucial aspect of the conservation process is the characterisation and analysis of historical masonry [18], which involves the evaluation of the material properties, construction techniques and structural behaviour. The types of techniques available to evaluate mechanical (strength) properties can be roughly categorised into destructive testing (DT), minor destructive testing (MDT) and non-destructive testing (NDT), depending on the amount of damage that they cause to the original material [18]. Many researchers use NDT techniques as reliable and effective methodologies to investigate the current condition of historic buildings [19]. In the current study, the evaluation includes two methods: on-site non-destructive and destructive testing in the laboratory, as adhering to the requirements for new structural materials using European standard (EVS-EN)-defined strength classes. On-site testing consists of two moisture content measurement methods (NDT microwave and MDT resistive), which took place in May and October 2023, and rebound hammer NDT to estimate compressive strength, which was performed in May 2023. In situ testing was carried out without dismantling construction materials from the structures. Rebound hammer testing is widespread for assessing concrete structures [20,21], but it is the only non-destructive testing device for brick units [20]. Different strength predicting formulae from the literature can be appropriately combined. In the technical literature, multiple applications of the rebound hammers are reported for the field testing of masonry, but there is no consensus about the reliability of the strength estimation for vintage clay bricks based on rebound hammer testing [22]. DT of previously dismantled (by the owner) construction materials of the case study building took place in 2023. Ceramic bricks, logs and slats were tested for compressive and tensile strength. Testing results were compared for compliance with valid construction materials standards.

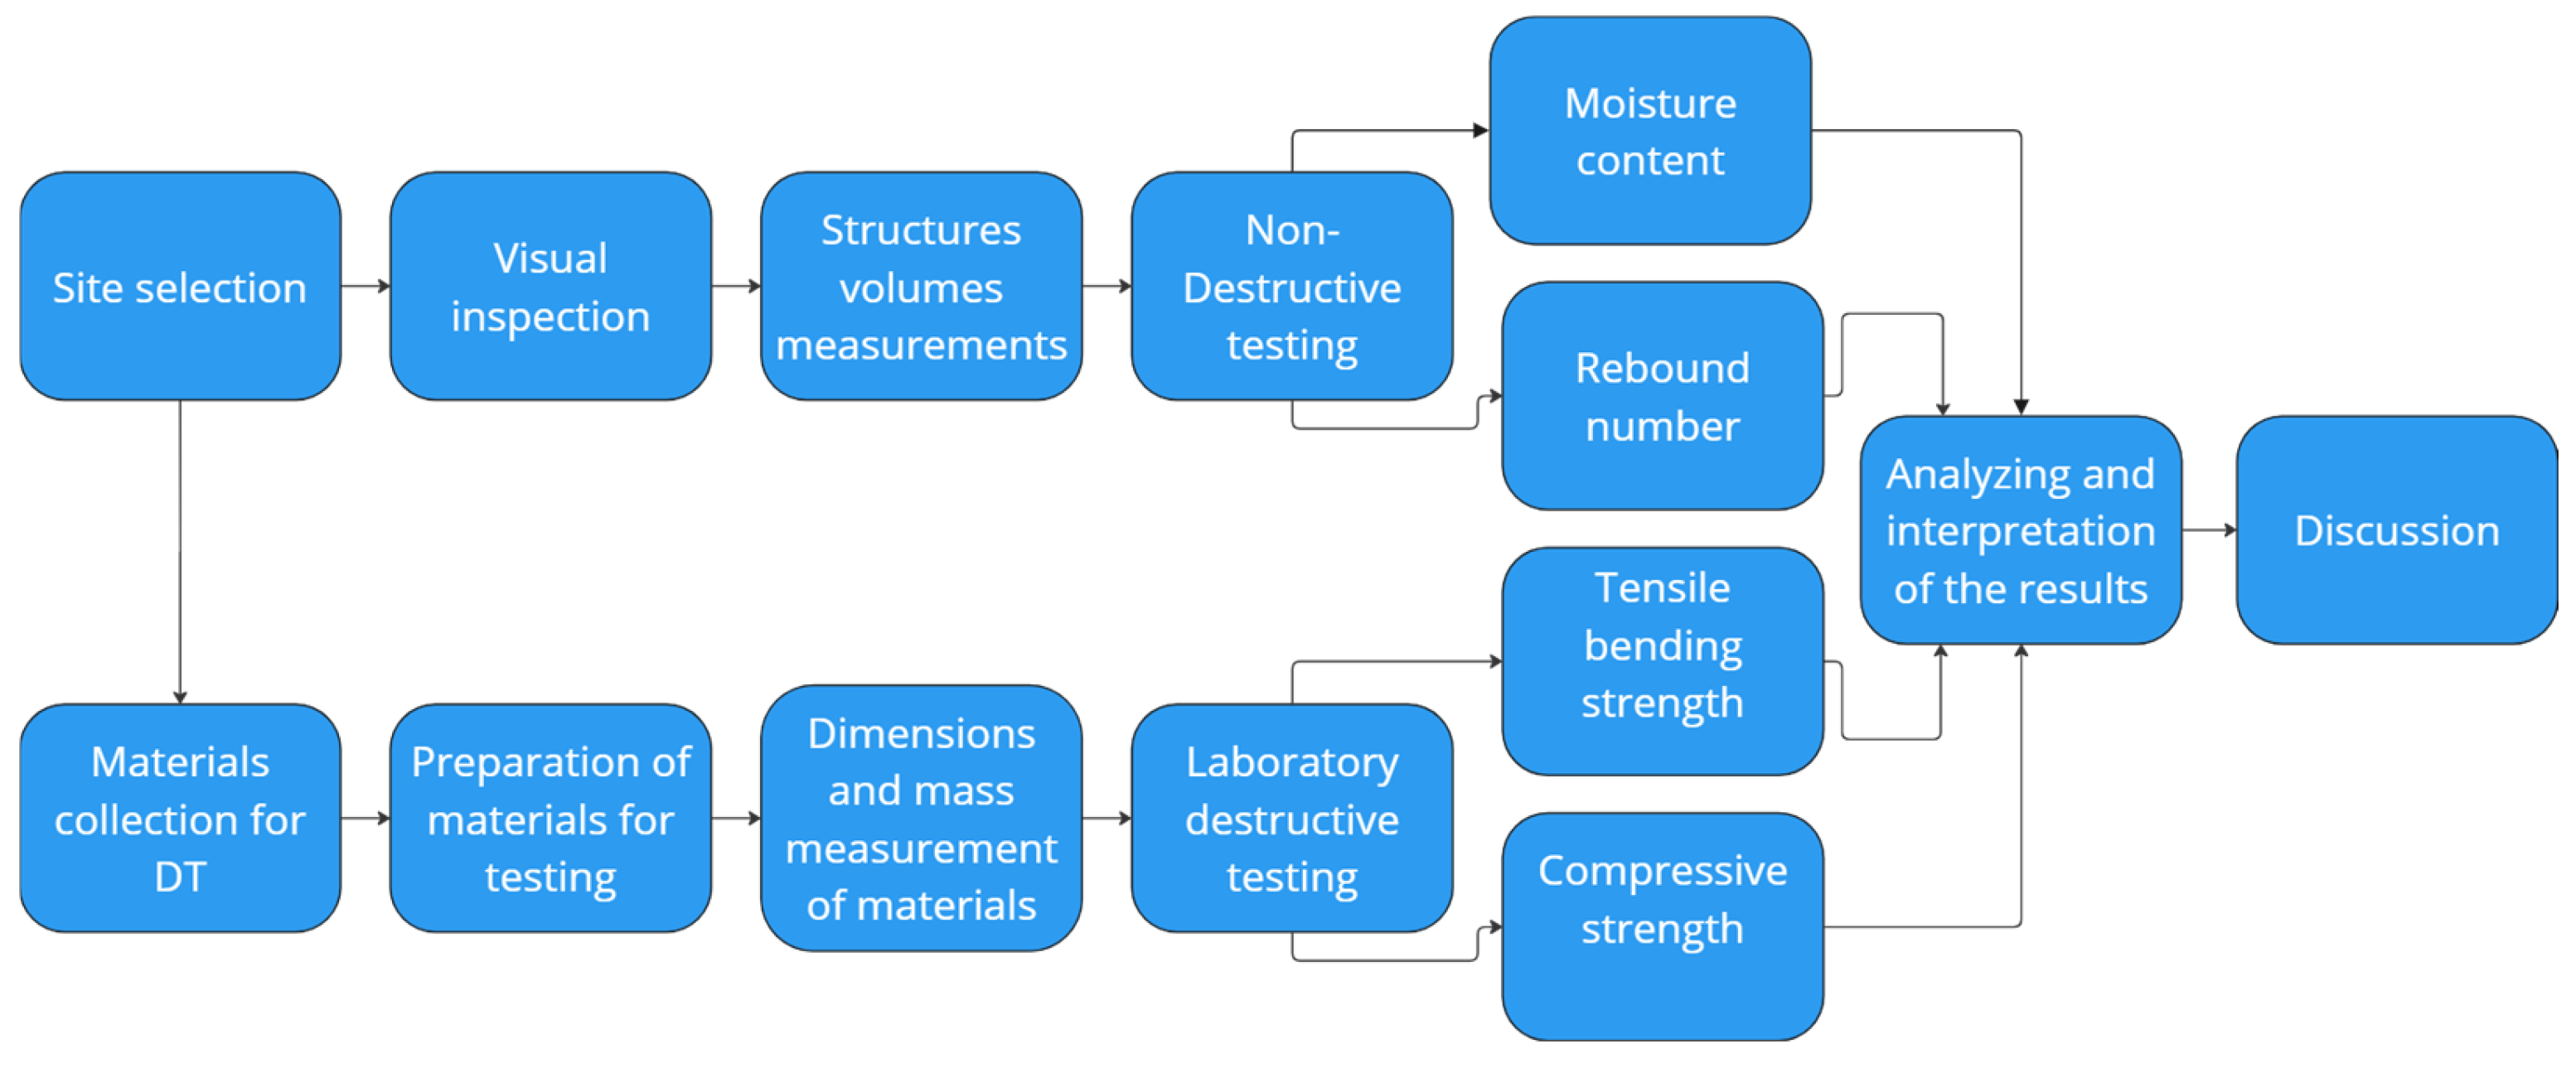
2. Materials and Methods

The various steps of the current research methodology are visualized in a flow chart (Figure 1).

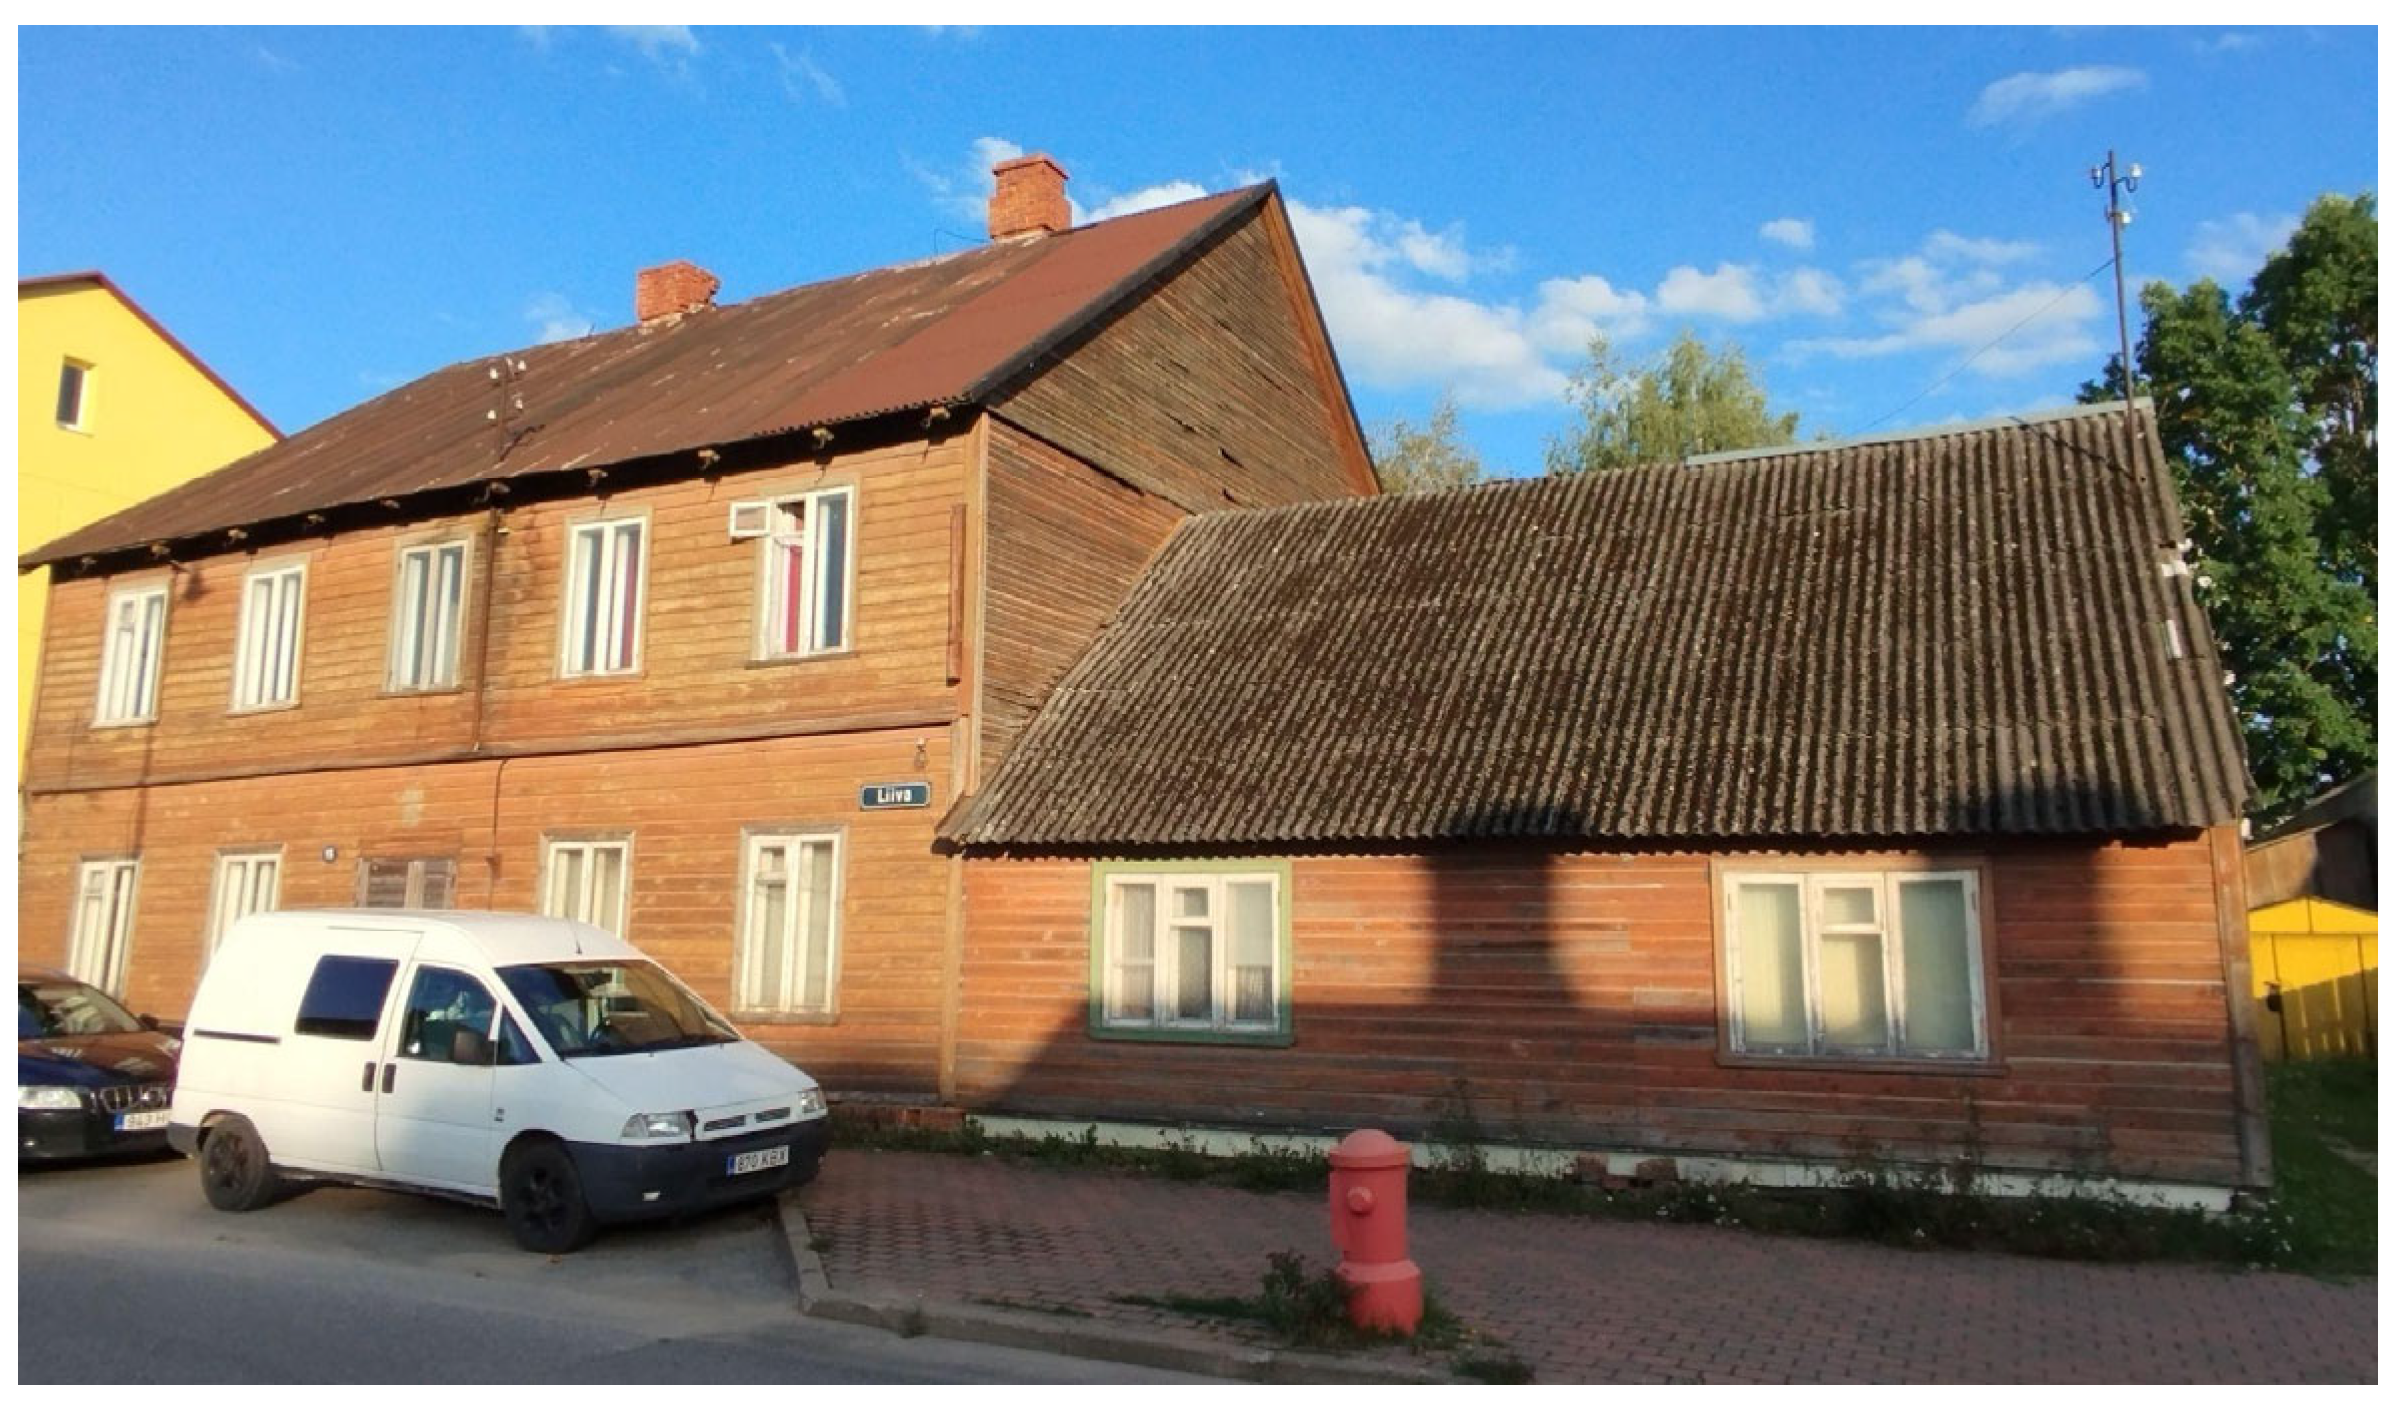
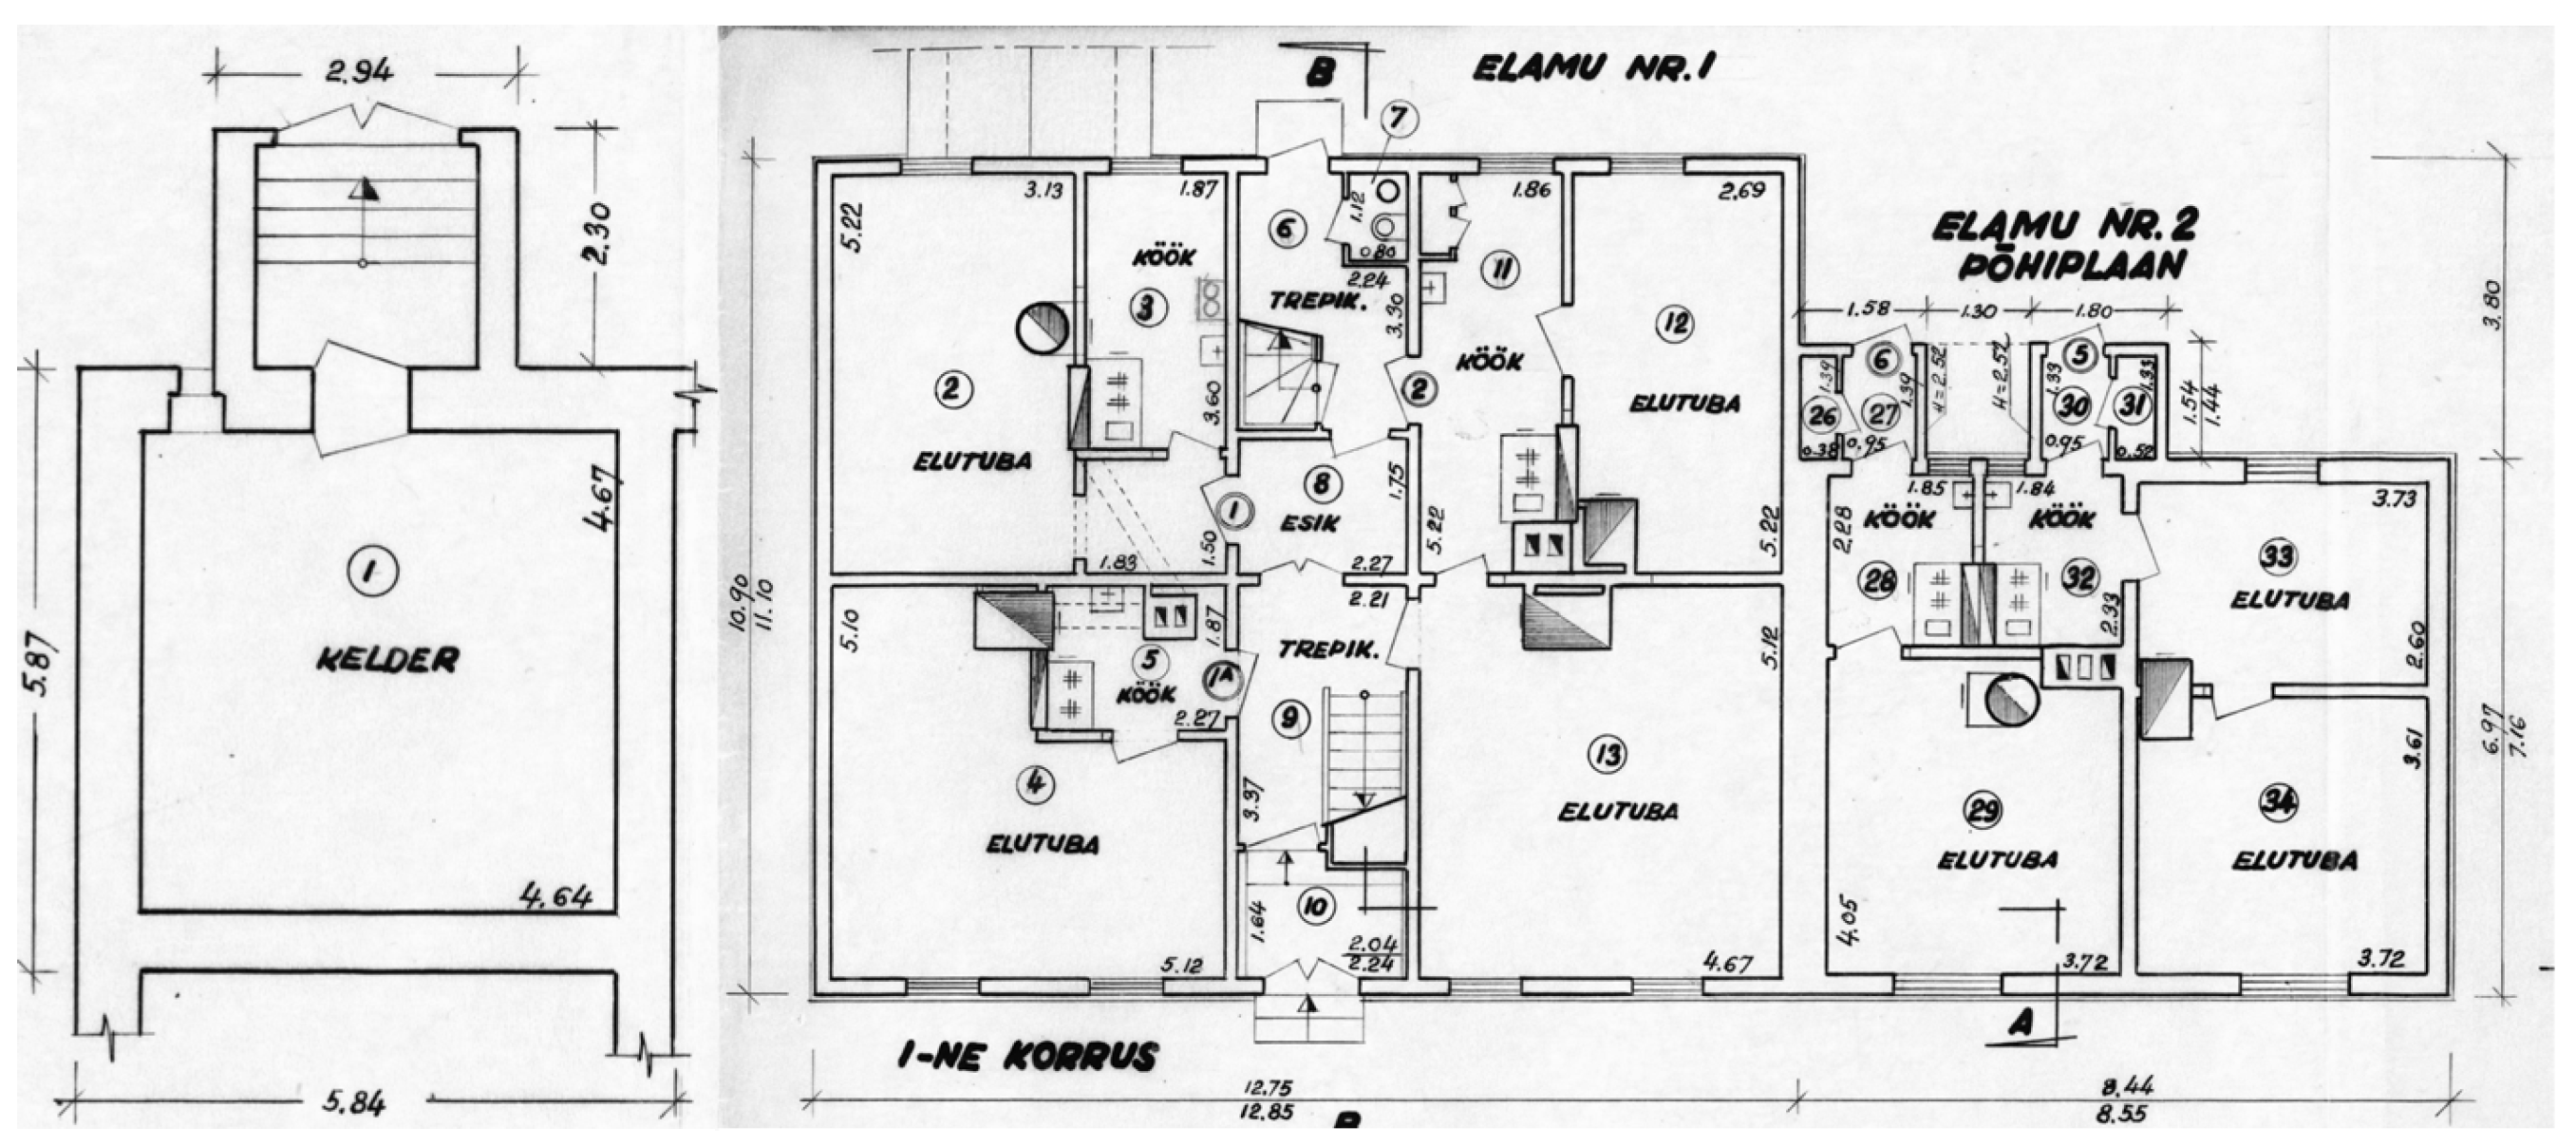
2.1. Case Study Building

The case study building is located in the historical city centre of Võru. In 2022 the building was part of the Renovation Marathon held by the Life IP BuildEST project. Part of the first storey of the case study building was built in the IV quarter 19th century and the two-storey section was built in the II quarter of the 20th century (Figure 2). The building has not been occupied for the last few years due to the lack of basic living conditions. Both parts of the building have an original granite stone foundation fastened with mortar and ceramic brick plinths. The original load bearing structures of the building are log walls and timber roof rafters (19th century), and queen posts (20th century). The external covering of the log walls consists of timber facade boards (partially missing). The internal covering consists of plaster on a wooden mesh, which is partially uncovered. The basement yard (southeast facing) entrance has ceramic brick stairs, a concrete basement floor (thickness ~0.005 m), granite stone walls (thickness ~0.6 m) with partial plaster and a vaulted concrete ceiling (Figure 3 on the left).

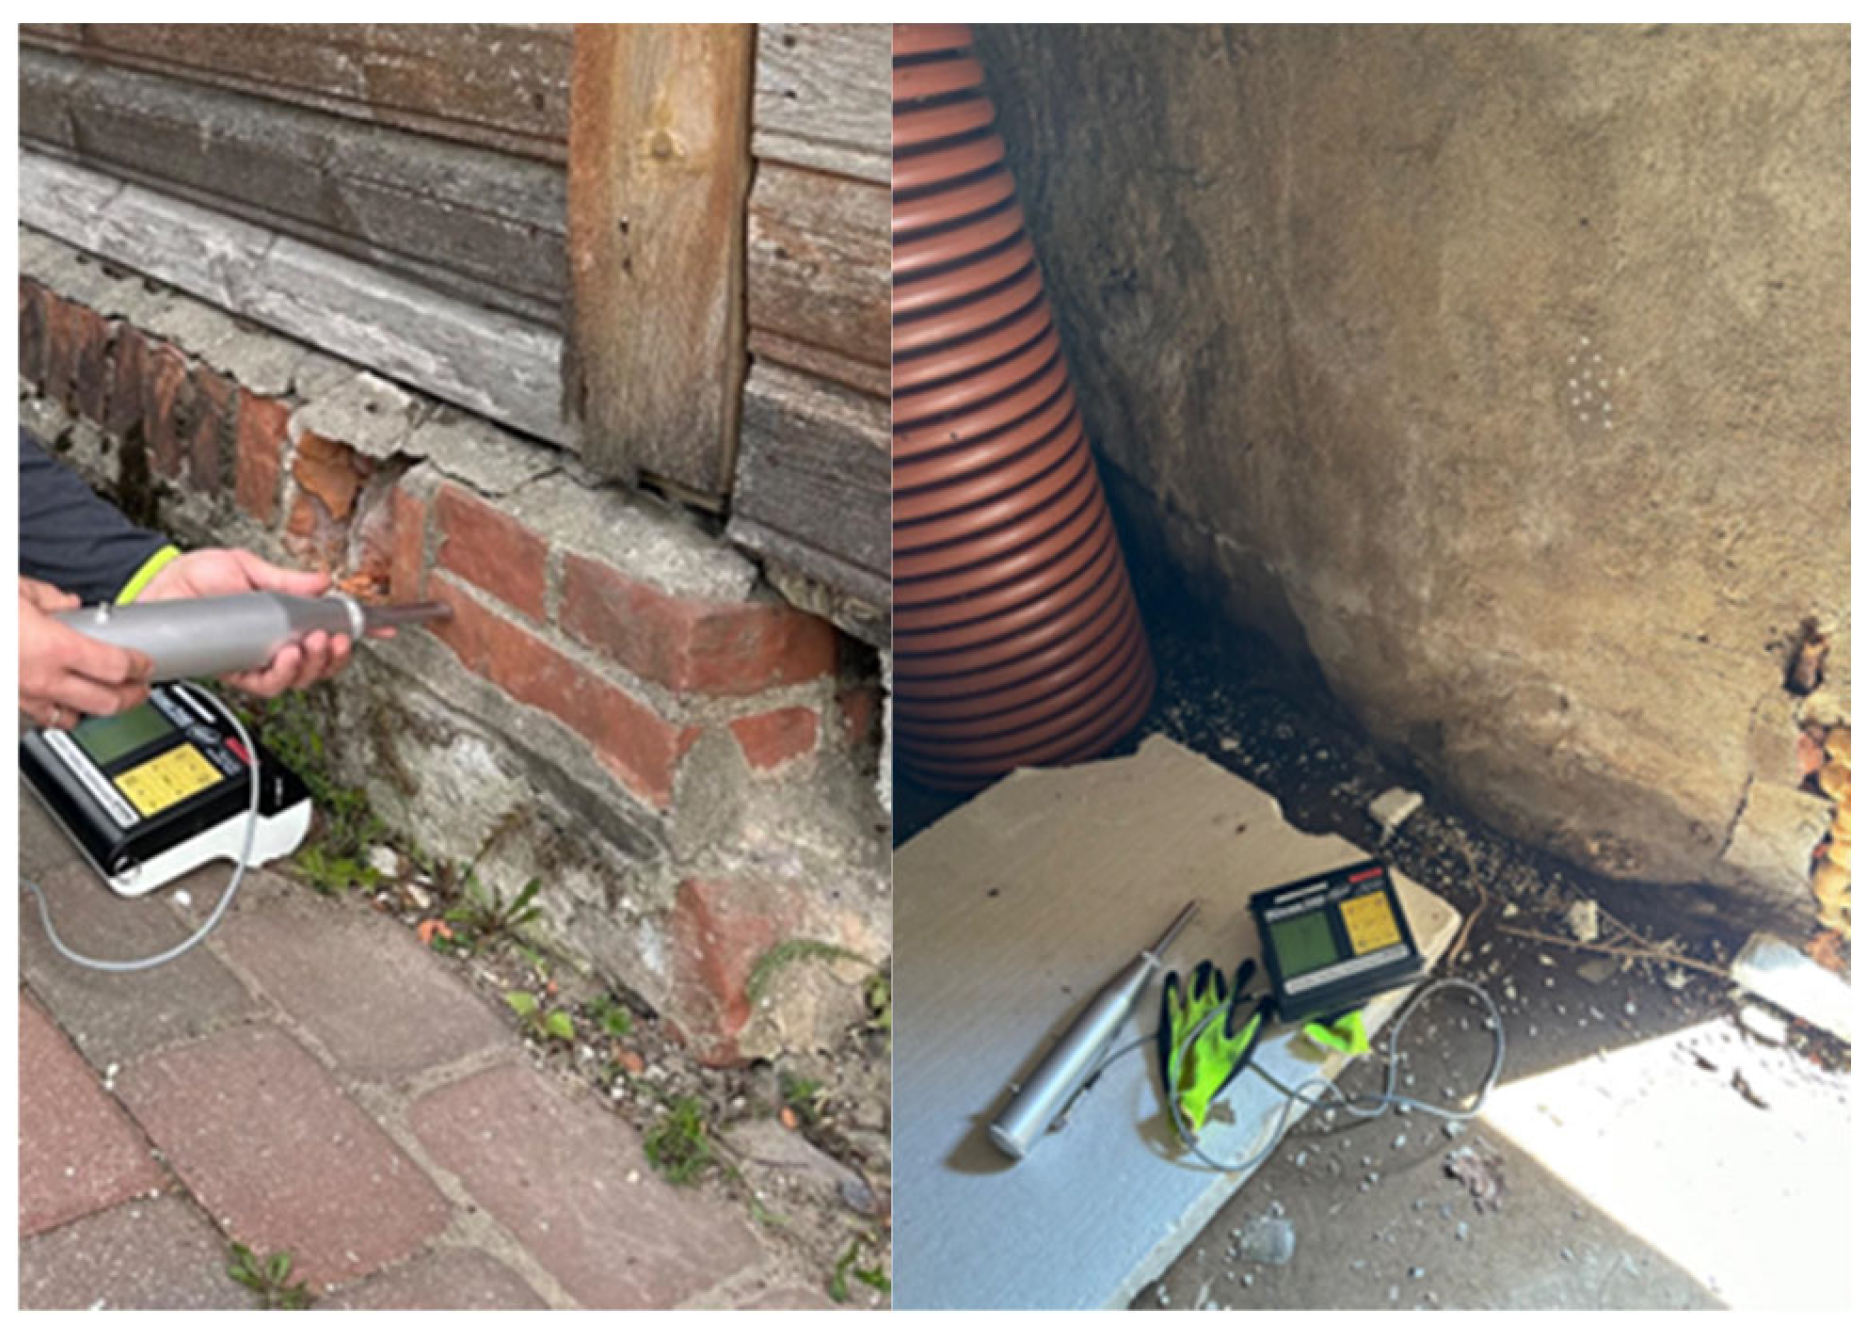
2.2. In Situ Non-Destructive Testing

In general, DT of material samples or drilled cores is the most accurate method for measuring the strength of materials from existing structures. However, drilling cores from materials was not allowed in the studied historical building. Therefore, non-destructive testing methods were applied on ceramic and chamotte bricks, granite stone and concrete structures of the studied building.
To have a full picture of the moisture content in the materials (timber, ceramic brick, granite stone, mortar, plaster) and structures (basement walls, foundation, log walls, roof rafters) of the case study building, two methods of non-destructive moisture content testing were applied in different spots and on a variety of materials.

2.2.1. Rebound Hammer Testing of Stone and Concrete Structures

Non-destructive rebound hammer testing was based on the EVS-EN 12504–2:2021 standard and conducted with the rebound test hammer Proceq Digi-Schmidt 2000. Each testing series consisted of 12 hammer strokes, which left slight marks on the surface (Figure 4 on the right). The testing of ceramic brick and plaster on ceramic brick is shown in Figure 4. For the basement walls (brick, plastered brick, stones, mortar between stones), a horizontal position and different conversion curve were used. For the vaulted ceiling and concrete floor (thickness 0.05 m), a vertical (upward and downward, respectively) rebound hammer position and a conversion curve for concrete was applied. The exterior side of the plinth and the chimney made of chamotte brick were also tested (horizontal position). In addition to the basement, the foundations were tested (horizontal rebound hammer position). The tests were performed by M. Kiviste and A. Gineiko at the studied building on 22–23 May 2023 [24].

2.2.2. Moisture Content Testing of Timber Structures by Resistive Method

Two methods for in situ moisture content conduction were carried out: microwave and resistive. The resistive method was based on the EVS-EN 13183-2:2002 standard [25]. A calibrated portable pin-type moisture meter (Logica Holzmeister model LG 9 NG) was used for the measurements. Testing was conducted to evaluate the local moisture content of the timber structures of both the studied parts of the building: the inside and outside surfaces of the wooden load-bearing walls, roof load-bearing structures (rafters, beams, queen posts), and exterior facade boards. The logs were tested from the lowest point on the ceramic brick plinth to the highest point reachable near the ceiling. Teflon insulated pins, 60 mm long with 3 mm uninsulated peaks, were attached to the ram-in electrode. The device only left 3 mm holes in the studied structures; therefore, it could be considered as MDT or NDT. The pin type of moisture meters gives the maximum moisture between pins, regardless of whether it is on the surface or in the middle of the timber. A sensitivity suitable for both pine and spruce species of timber (group 3 from 7 different sensitivities, density 0.43 to 0.59 g/cm3) was chosen for the moisture meter prior to measurement. The ambient temperature was entered into the instrument. A total of 151 and 52 moisture content tests by resistive method were performed in May 2023 and October 2023, respectively.

2.2.3. Moisture Level Testing of Timber Structures by Microwave Method

Moisture level testing using a non-destructive microwave method [26] was conducted in May 2023 using the Trotec Materialfeuchte Messgerät T610 device. The device is widely used in cultural heritage buildings [27], especially for studying structures that cannot be dismantled for laboratory testing. It causes no damage to the structures during testing. The device functions as a capacitance meter, capable of measuring up to 0.3 m in depth. It has to be positioned on a flat surface (as smooth as possible) of a structure with a thickness of at least 200 mm. The measurements are based on the dielectric properties of water [28].
The Trotec T610 self-calibrates every time it is turned on (in ambient air with no objects/obstacles) before the measurements. The Trotec T610 was placed and held on a smooth surface until the reading on display was stabilised (at least 30 s) for each measurement. The materials (structures) studied included the following: log walls from the newer building part (interior/plastered and exterior/uncovered); timber façade boards from the old building part; a ceramic brick plinth; basement walls (including a plastered ceramic brick wall, an uncovered ceramic brick wall, granite stones and mortar between the stones). Eight tests were performed on materials and structures located on the southeast side of the case study building.

2.3. Destructive Testing (DT) in Laboratory

By the beginning of the inspection in May 2023, all the materials used as samples (ceramic bricks, timber logs and slats) had already been dismantled by the owner of the case building. The materials collected for the destructive testing were not the same as those that were non-destructively tested. The static loading of timber and ceramic materials was imitated. Bending and compressive DT were performed using the Form-Test Mega 7-2000-100 D (max force 2000/100 kN) testing machine [29] at the laboratory of TalTech Tartu College by M. Kiviste and A. Gineiko. The testing machine meets quality class 1 accuracy standards and is in accordance with the international ISO 7500-1:2018 [30] and the European EVS-EN 12390-4 [31] standard. The 4…100 kN (measuring range) hydraulic cylinder was inset for a 3-point bending test according to the EVS-EN 12390-5 [32] standard. The 80…2000 kN (measuring range) hydraulic cylinder with a 4-column testing frame was used for compressive strength tests. Force measurement was performed using an electronic liquid pressure transducer.

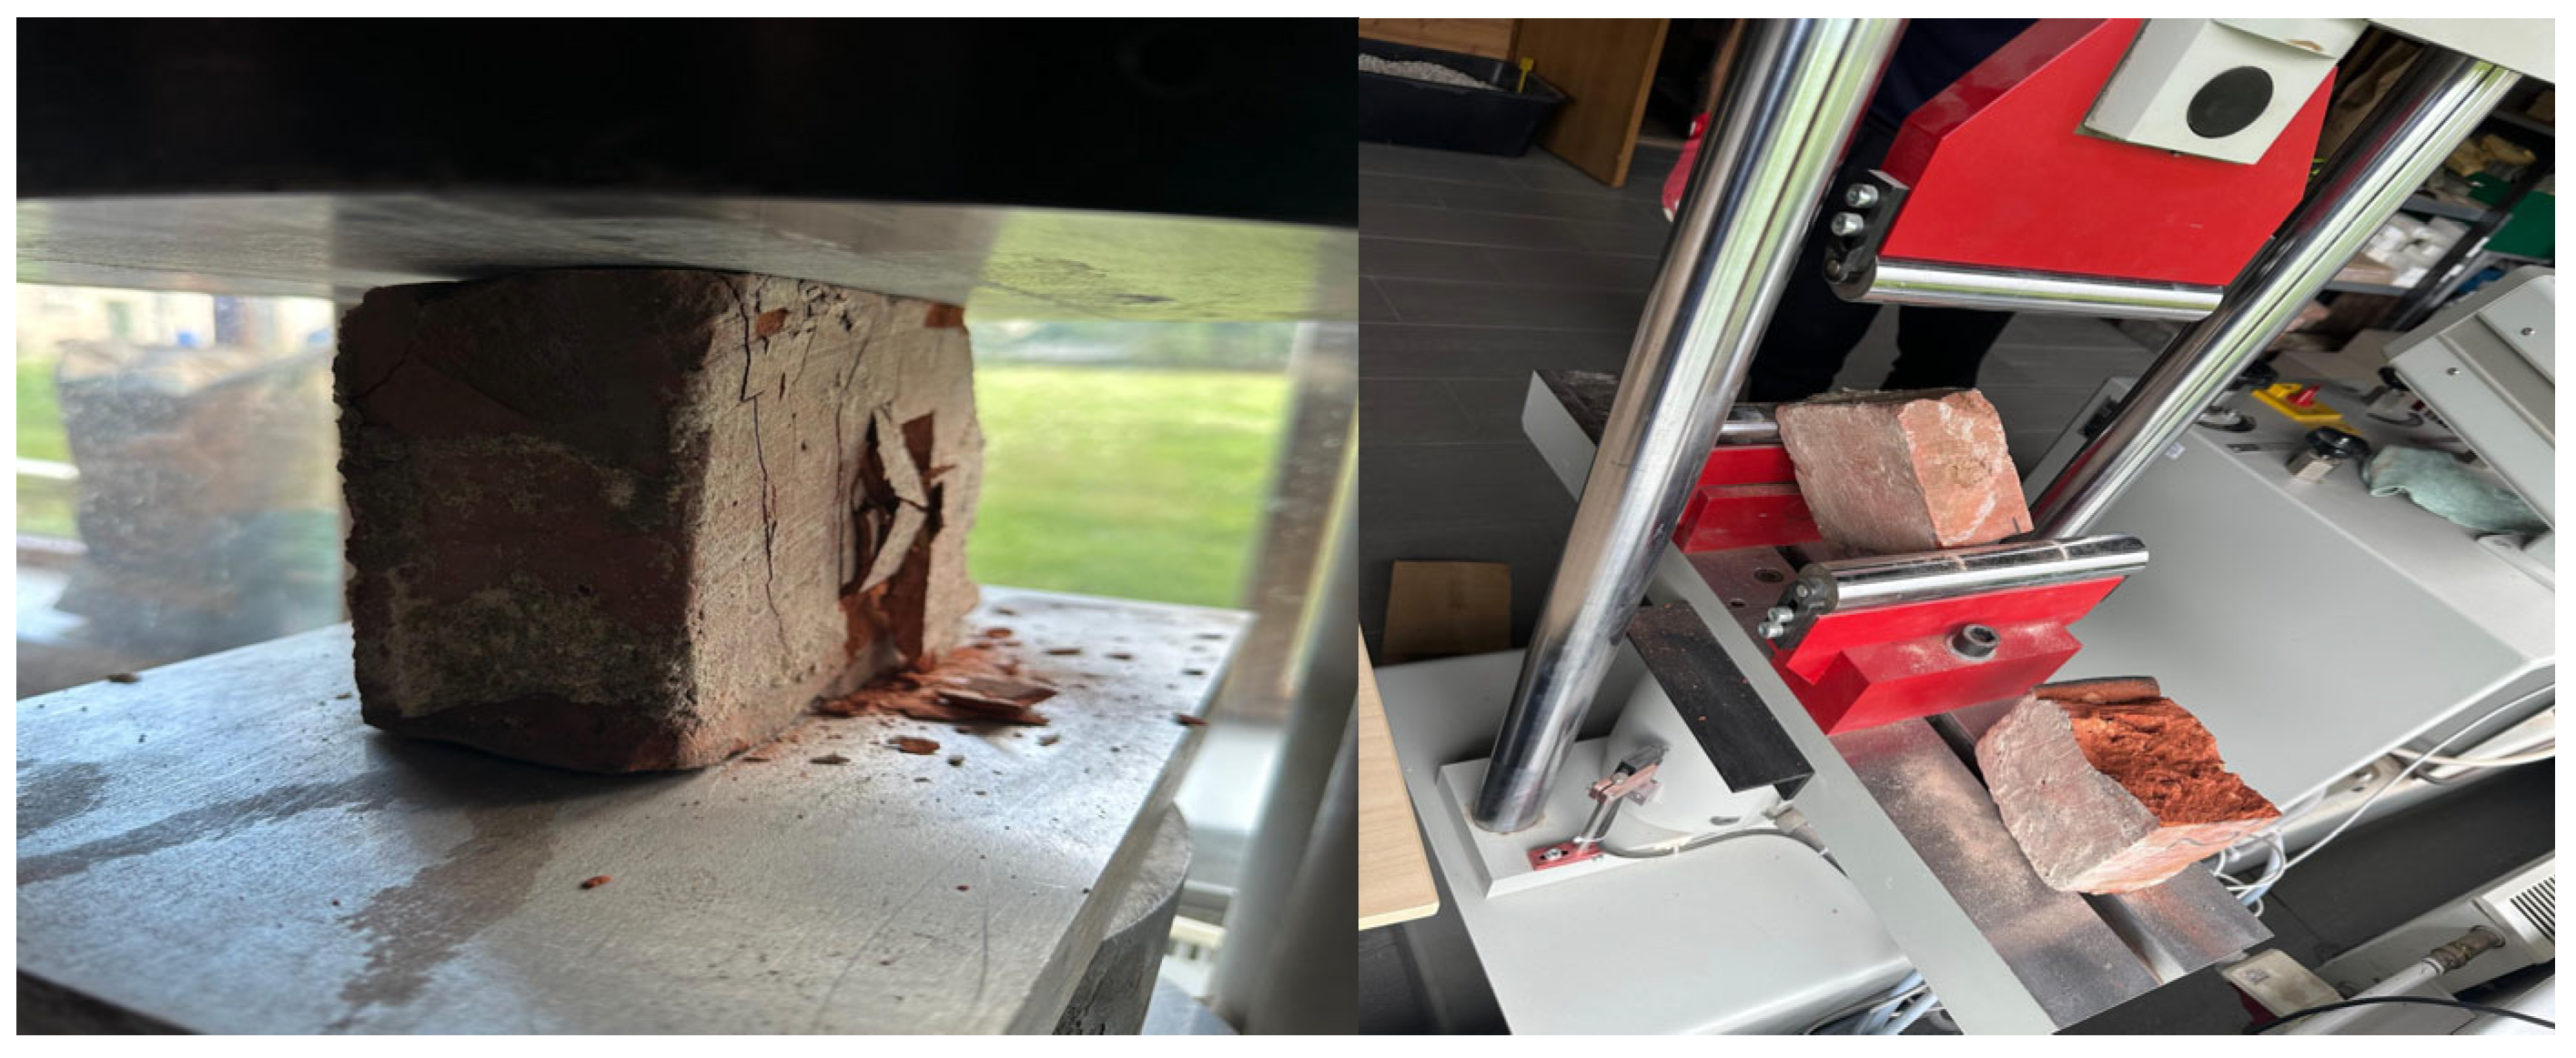
2.3.1. Ceramic Brick Testing

The testing of twelve ceramic bricks was conducted at the laboratory according to the following standards: EVS-EN 772-16:2011 [33]; EVS-EN 771-1:2011+A1:2015 [34]; EVS-EN 772-6:2005 [35]; and EVS-EN 772-1:2011+A1:2015 [36]. The dimensions of the bricks were measured by calliper with an accuracy of 0.1 mm. The dimensions were recorded as an average of three measurements for length, width and height, from which the volume of the ceramic bricks was calculated. The ceramic bricks were dried in a ventilated oven at a temperature of 105 °C until a constant dry mass was reached. The mass of bricks was weighed using a Kern EW6200-2NM digital balance with an accuracy of 0.01 g. Then, the net dry density of ceramic bricks was calculated (to the nearest 10 kg/m3 for densities over 1000 kg/m3) [37]. For the bending and compressive test, the ceramic bricks were conditioned at a laboratory temperature of 21 °C and relative humidity of 22%. The bending tensile strength of the ceramic bricks was determined through a three-point bending test, where the failure load was recorded. Eleven bricks were tested for bending in a flatwise position, as they would be used in masonry, and one brick was tested in an edgewise position, reflecting its placement in the plinth of the case building. The bricks failed, breaking into two pieces, which were then used for a compressive test. Therefore, 22 pieces of brick were tested flatwise for compression and 2 pieces edgewise, respectively. The loading rate fluctuated between 0.06 and 0.1 N/mm2, which complied with the requirements of EVS-EN 772-1.2011+A1:2015 [34]. For the compressive strength testing of the ceramic bricks at about half the expected maximum load, the rate was adjusted so that the maximum load was reached in approximately 2 min. The EVS-EN 772-1:2011 [36] requires that the maximum load be reached in no less than approximately 1 min.
The failure type and location of the bricks was also noted both for bending and compression. Then, the edges and surfaces of the brick pieces were ground until the requirement for planeness and parallelism for the compressive test was reached [34]. The gross area of the loaded surface was calculated by multiplying the length by the width of the previously measured brick pieces. The compressive strength of the brick pieces was calculated by dividing the maximum load by its loaded area.

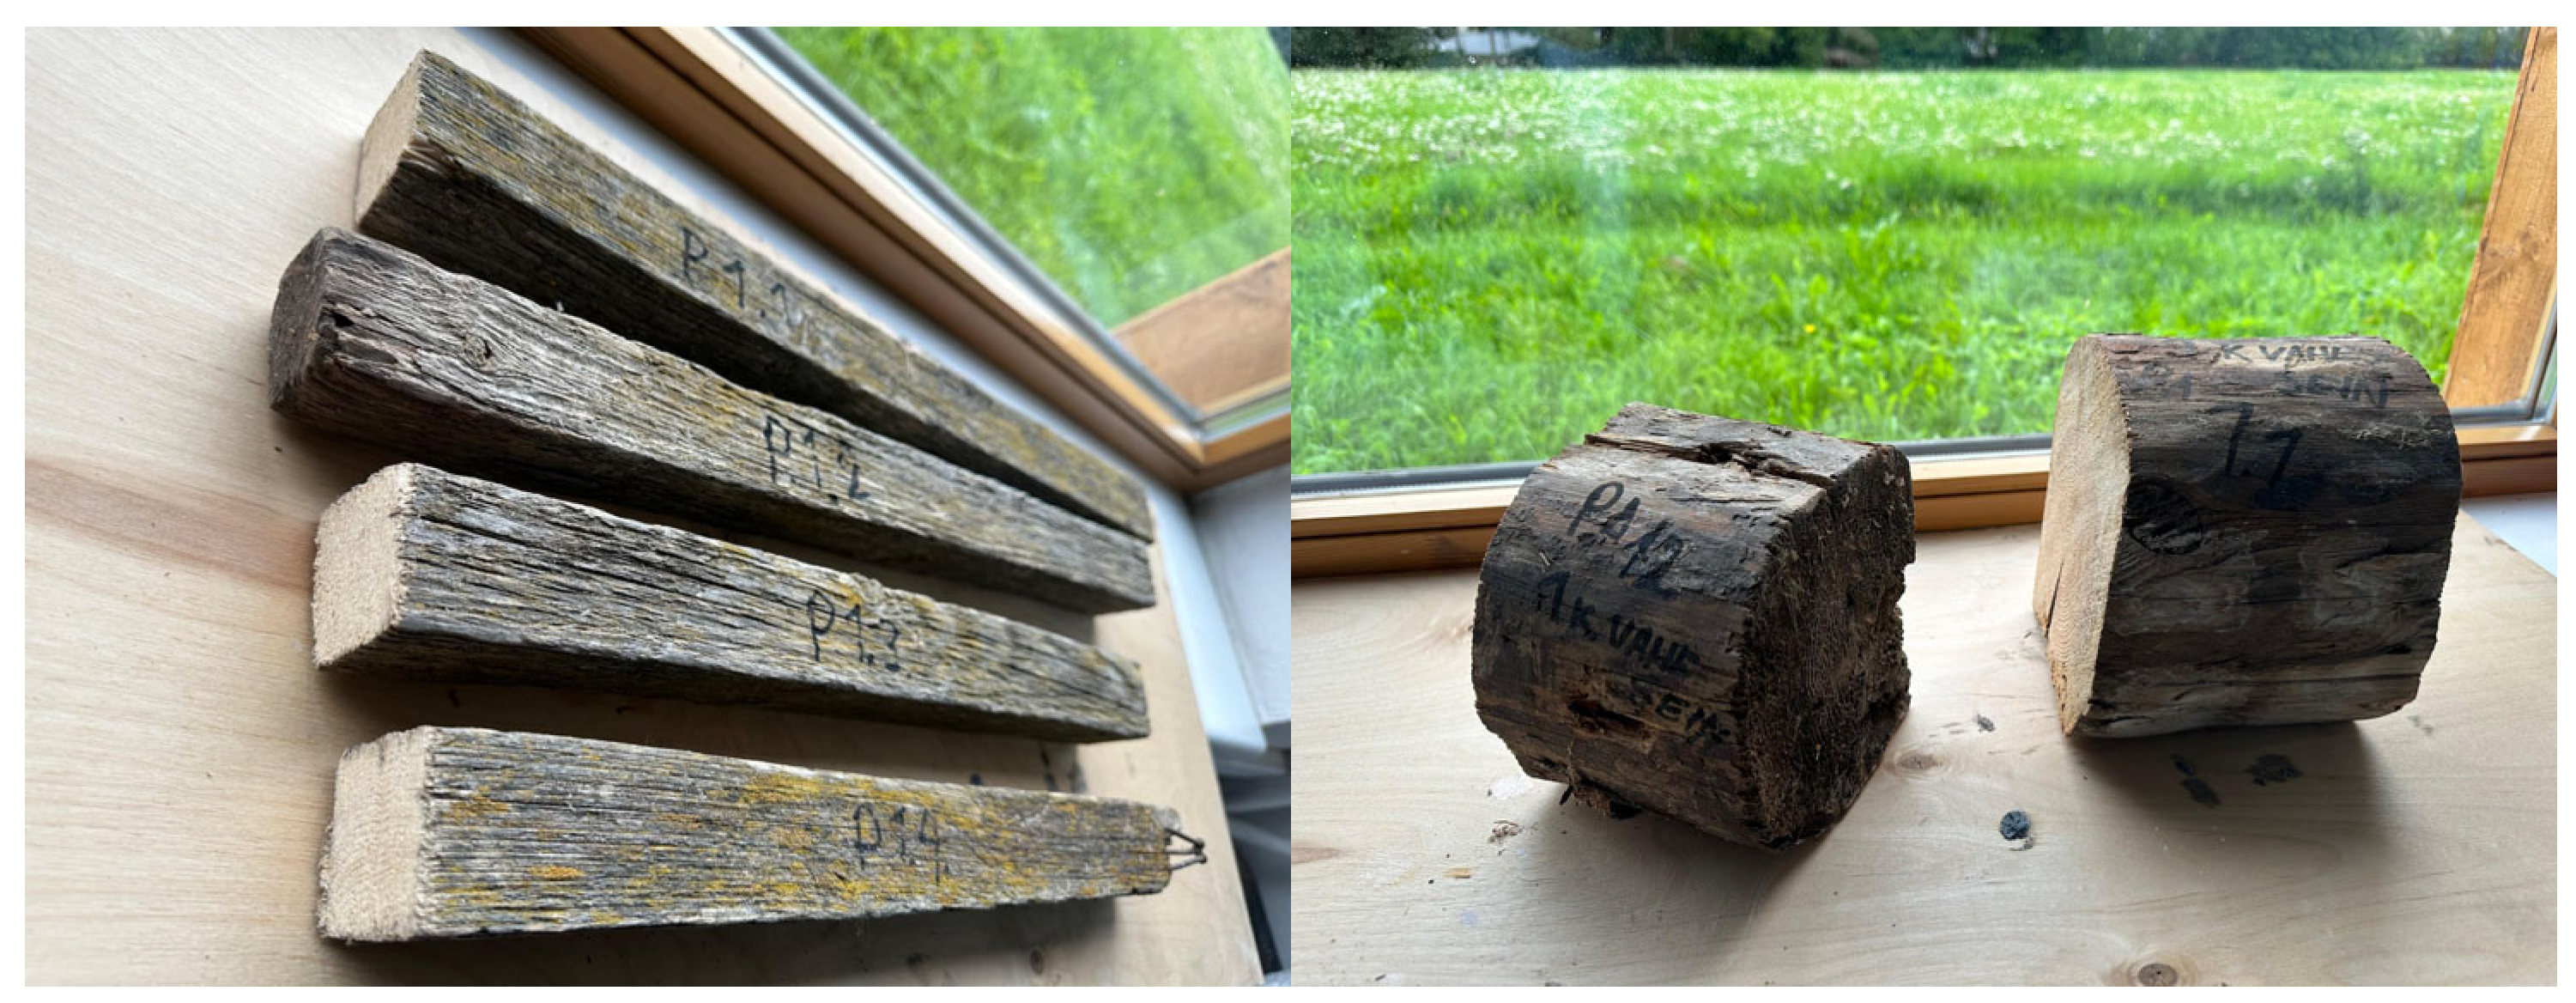
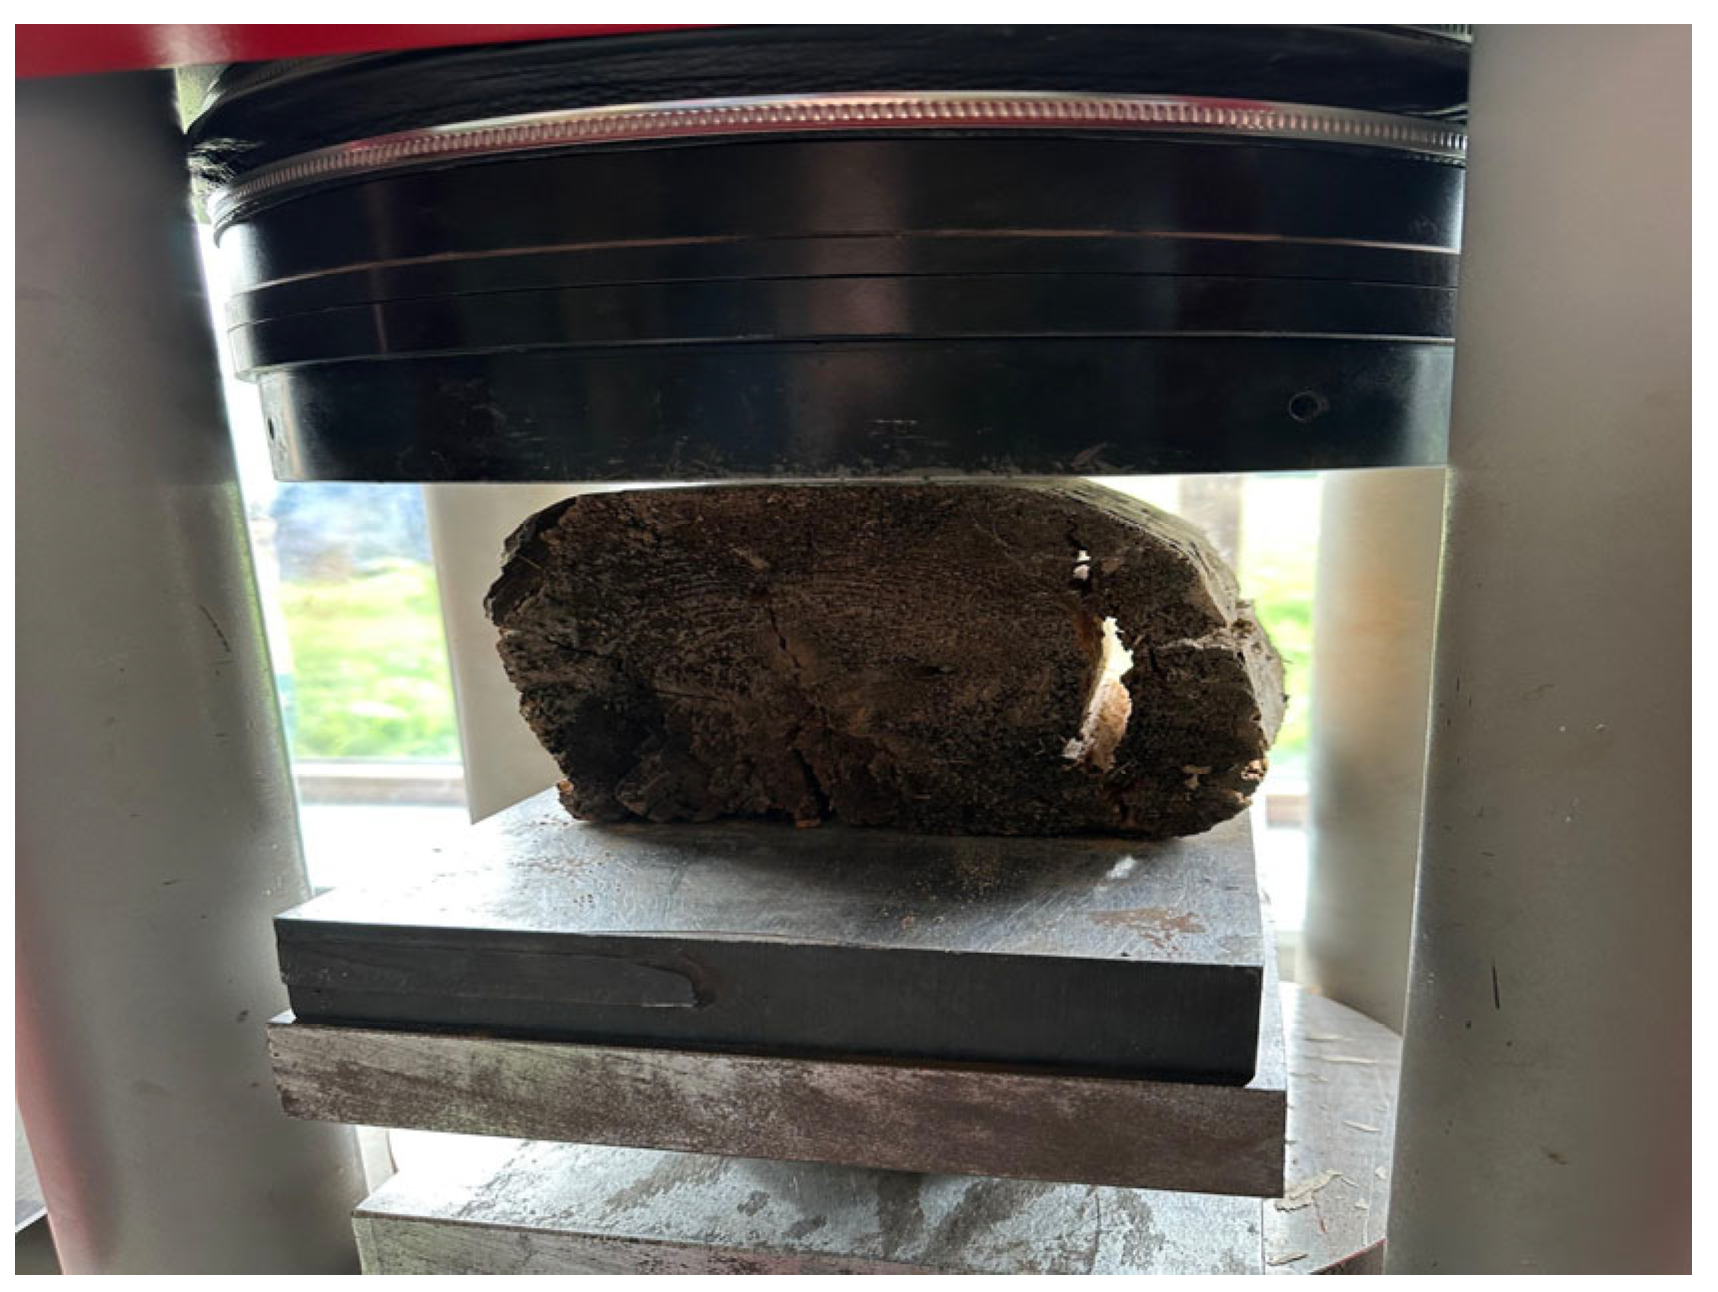
2.3.2. Timber Testing

The source of the timber samples was the original load-bearing log walls and outdoor battens (under the missing facade boards) of the studied building. The density and bending and compressive strength of four slat samples and three logs (Figure 5), cut into six samples, was determined according to EVS-EN 408:2018 standard [38].
The dimensions were recorded as an average of three measurements for length, width and height, from which the volume of the timber samples was calculated. The samples were conditioned in a standard environment at 20 ± 2 °C and 65 ± 5% relative humidity until a constant mass was attained [38]. The mass of the timber samples was weighed using a Kern EW6200-2NM digital balance (accuracy of 0.01 g). The density was calculated from the measured mass and volume of the timber samples. The bending strength of the timber samples was determined based on a three-point bending test, where the maximum load was recorded. The maximum compression force perpendicular to the grain was determined at a 1% deformation of the initial height of the timber sample [38]. The rate of loading was determined from preliminary tests. The EVS-EN 408:2020 timber standard specifies that, both for compression perpendicular to the grain and bending strength parallel to grain, the load should be applied at a constant loading-head movement, adjusted so that the maximum load is reached within 300 ± 120 s. In the current tests, the requirement for loading was recorded and met. To determine the compressive strength, the force was divided by the compressed area of timber samples. The strength and density of the timber samples were compared with the structural timber strength classes currently used in Europe and specified in EVS-EN 338:2026 [38].

3. Results and Discussion

3.1. Non-Destructive Rebound Hammer Testing

The rebound hammer test has been widely used for concrete structures, where many test results have been gathered and evaluated in detail. Therefore, the interpretation of rebound numbers on compressive strength classes is available in the German National Annex [39] to the EVS-EN 13791:2020 standard [40] (Table 1).
Today, many researchers have demonstrated that the rebound hammer test could be applicable to brick masonry. However, the conversion is different from concrete as the properties of these materials are significantly different. Therefore, the models established by Roknuzzaman et al. [41] and Mengistu et al. [42] are used to convert the experimental rebound numbers into the estimation of compressive strength of historical solid clay bricks. The relationship established by Aliabdo et al. [43] is used to convert the rebound numbers into the estimated compressive strength of ceramic bricks. Buyuksagis and Goktan [44] have studied the effect of rebound numbers on the compressive strength of different rocks, including different types of granite. According to 47 test series, the basement walls (round-shaped granite stones and ceramic bricks fastened with lime mortar) have retained a good estimated compressive strength.
The on-site NDT results were more relative compared to the precise destructive laboratory tests. However, in situ NDT revealed the satisfactory condition of the studied structures, where no visibly distinguishable major cracks were detected. NDT could still be used in circumstances where the dismantling of historical materials is impossible. The estimated non-destructive compressive strengths of brick, stone and concrete in Table 2 are varied, but sufficient to carry the loads of a two-storey building.

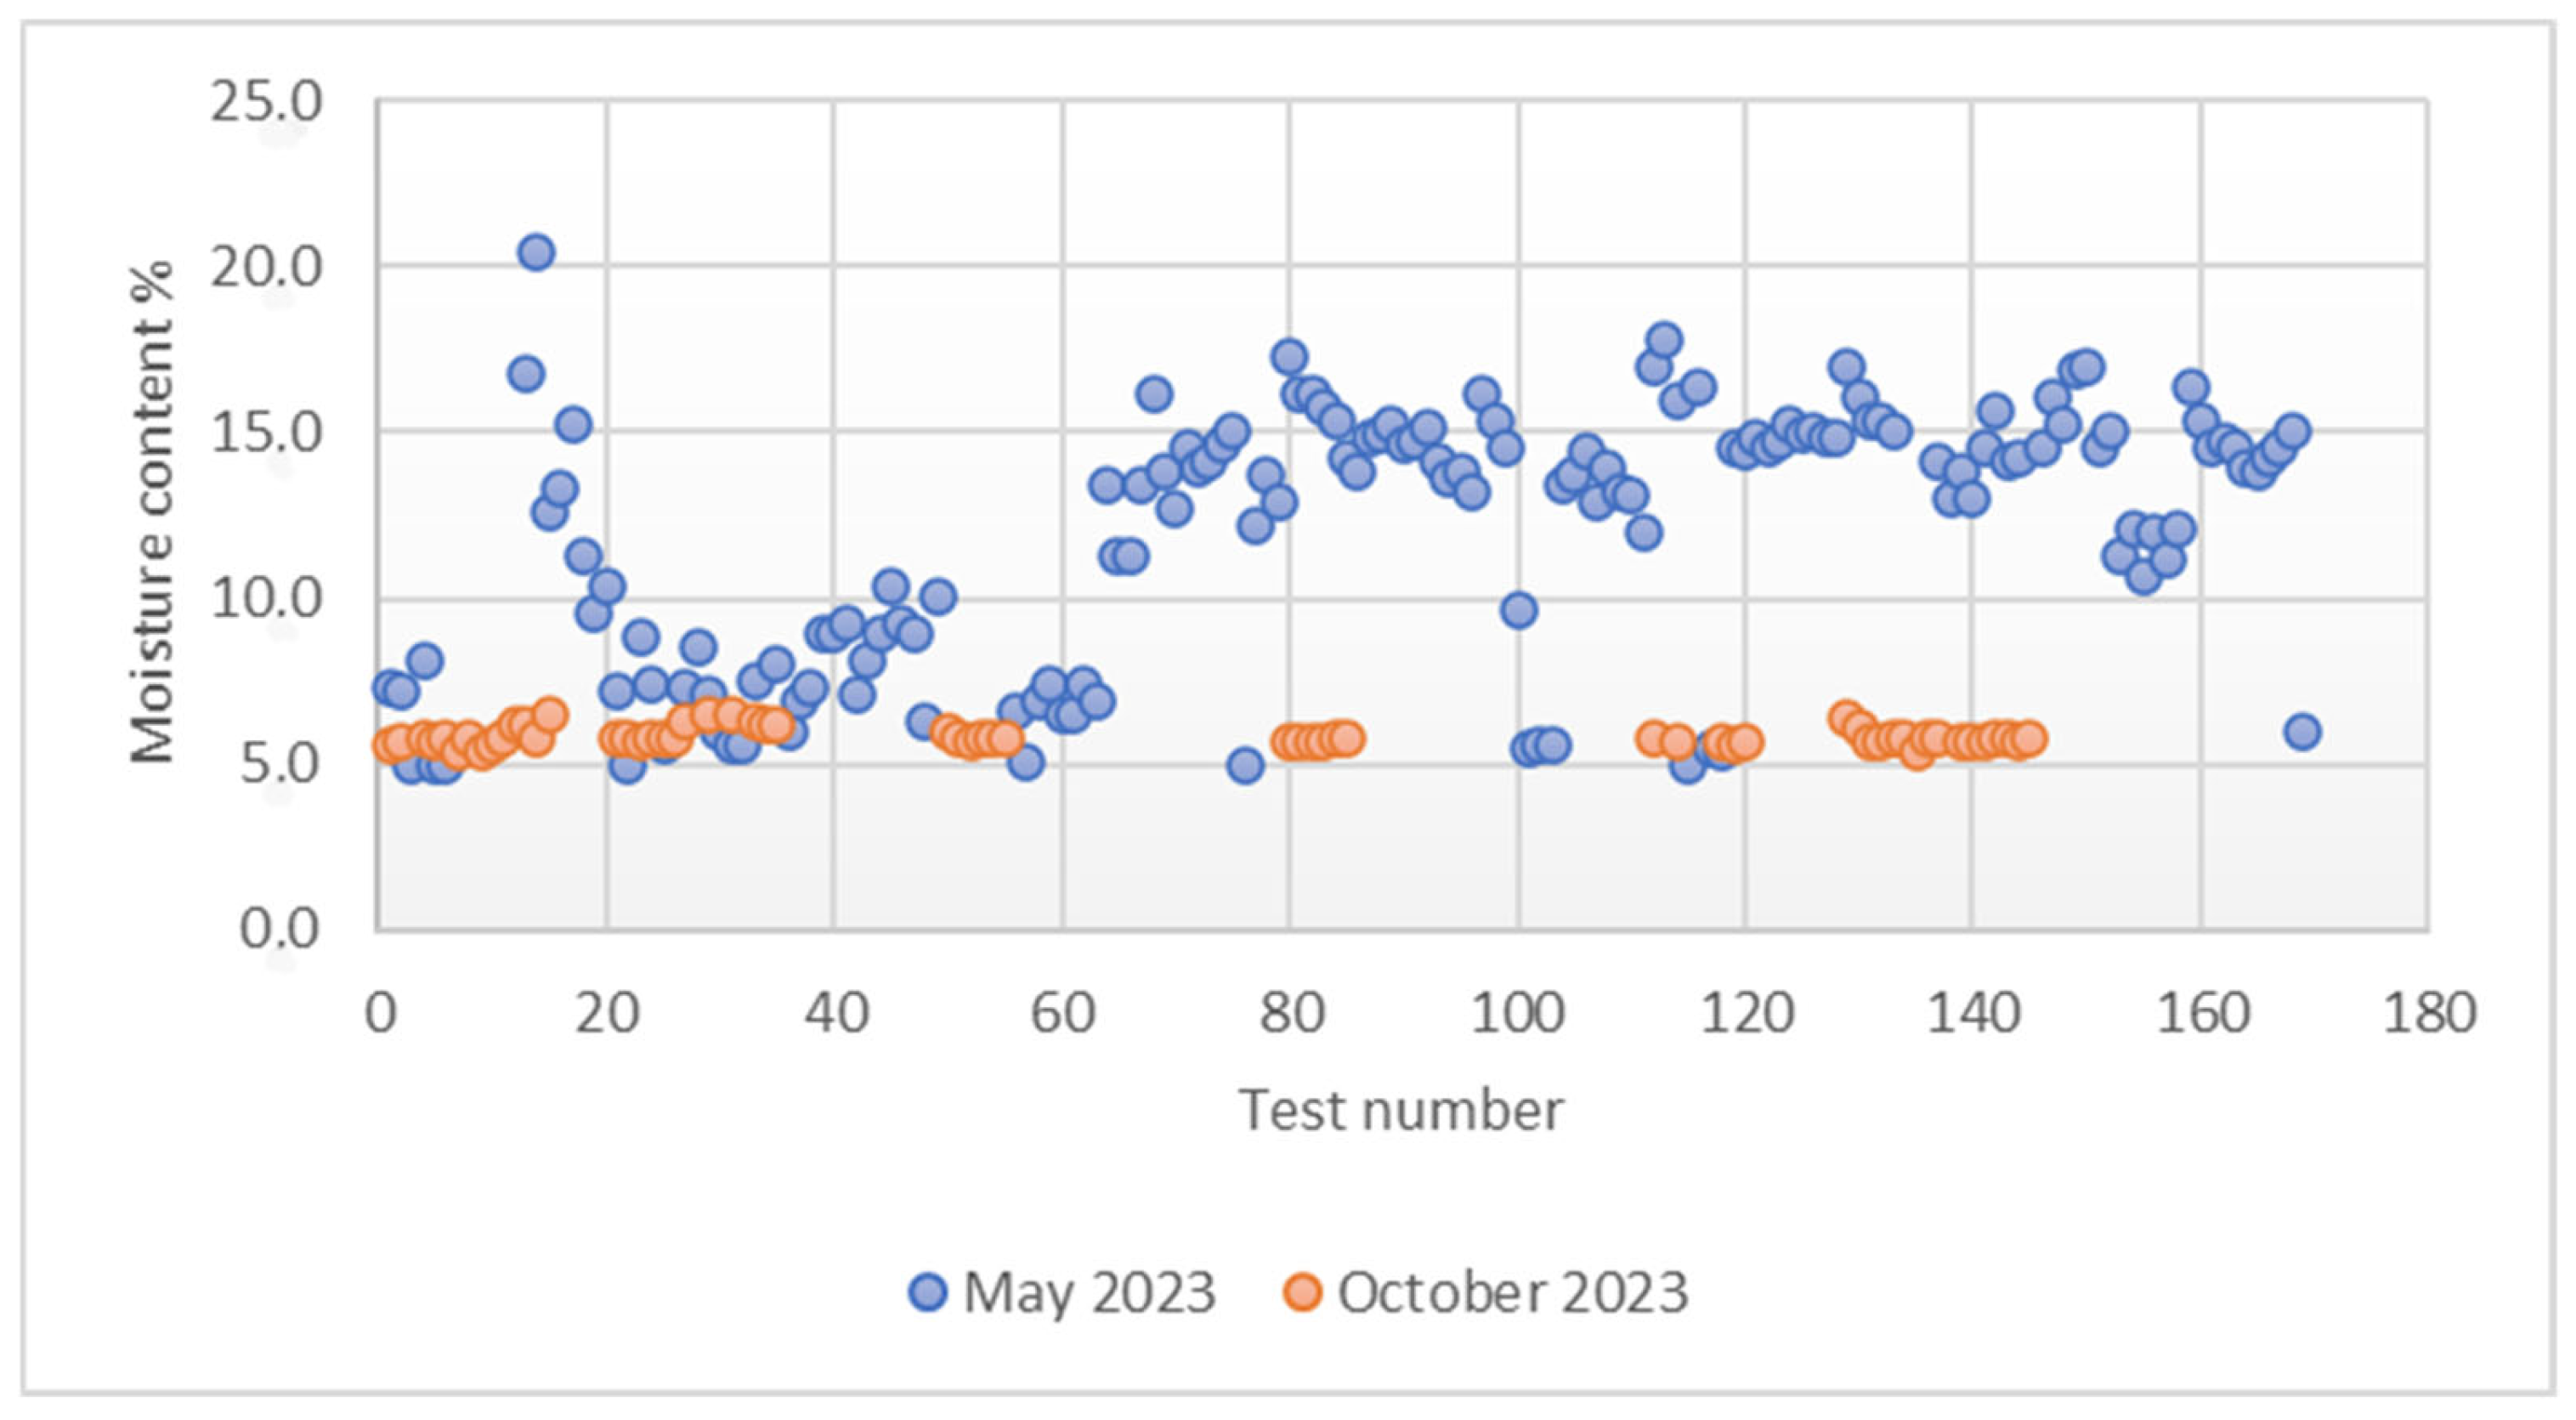
3.2. Moisture Content of Timber Structures by Resistive Method

During testing, the outdoor air temperature at the vicinity of the studied building was 18.4 °C in May and 15 °C in October. The relative humidity in May (51%) was much lower than in October (85%), as was the absolute humidity, which measured 0.007736 [kg/m3] and 0.010902 [kg/m3], respectively. The comparison of 150 May and October test results is presented in Figure 6 and Table 3.
The moisture content of wood in equilibrium with the stated temperature and relative humidity [45] was 9.3% in May and 18.2% in October. The first reason for this difference is likely the inconsistency of relative humidity throughout the year due to buildings not being heated and therefore being very sensitive to relative humidity changes and precipitation occurrence. Secondly, the tests conducted in May revealed a higher moisture content in the lower log layers situated on the ceramic brick plinth compared to the upper logs. This difference may have been due to soil moisture saturation through the foundation to the log walls influenced by the lack of hydroisolation. October testing showed more homogenous moisture content results ranging from 5.4 to 6.5% in all the timber structures, regardless of their position. In summary, the moisture content test results showed average values even after the winter season, with regular precipitation and frequent temperature fluctuations above and below zero, while values were low after the summertime.

3.3. Moisture Content Testing by Microwave Method

The moisture levels of the structures and materials of the case study building, measured by microwave method, are presented in Table 4.
The measured values are relative and mostly suitable for quickly comparing moisture content in materials or structures. When comparing the results for the structures, the basement walls made with different materials show higher moisture content in the lime mortar between the granite stones and lower moisture content in the unplastered ceramic bricks. The timber walls on the south-east side consistently showed the same moisture content in different materials. When comparing the same material, the ceramic bricks in the basement showed higher moisture content than the same bricks used in the exterior. In general, materials with higher porosity, such as lime mortar, showed higher moisture content. When comparing the moisture content in structures, relatively lower results were found in the logs, facade boards, and the interior plaster on wooden mesh in the southeastern side of the building.

3.4. Density, Flexural and Compressive Strengths of Ceramic Bricks

Due to the absence of stamped bricks in the original structures, determining the manufacturer of the case study bricks was not possible. Stamped historical Võrukivi bricks (factory established in 1938 [46]) were found in earlier reconstruction activities in the case study building; one of them (Brick T5 in Table 5) was selected for laboratory testing.
The samples were tested as they were arranged in the structure—edgewise for sample T2 (Figure 7) and flatwise for all other samples—and left with a natural surface (results in Table 5).
The average and standard deviations of the compressive strengths of the bricks in a flatwise position (Table 5) were 26.0 ± 7.74 MPa, respectively. The average and standard deviations of flexural strength of the bricks were 5.46 ± 2.90 MPa, respectively. The characteristic compressive strength was 15.2 MPa. The properties of the ceramic brick in the edgewise position were significantly lower. The average and standard deviations of the brick samples’ density were 1874 ± 114 kg/m.
Nowadays, the quality of new ceramic bricks is consistent (approx 10% variability in one batch) and easily controllable. Historically, there was no standard for ceramic brick production, so a comparison of the compliance of the original parameters with current ones is not possible. In order to determine comparability using the compressive strength results of the historical bricks and newly produced ones, a brick manufacturer’s (Wienerberger AS, Estonian factory located in Aseri) declarations of performance were used. Wienenberger AS belongs to Wienenberger Group, which is the world’s largest producer of bricks. The declared dimensions and compressive strength from the producer were compared to the average testing data of the samples. The received compressive strength data were in accordance with the standard EVS-EN 771-1:2011+A1:2015 [44] and are presented in Table 6.
The old bricks show a lower average compressive strength (27 MPa) compared to newly produced bricks (35 MPa with holes and 45 MPa for solid) in this particular factory (Wienerberger AS, located in Aseri, Estonia). The reasons for the lower compressive strength of the historical ceramic bricks compared to the newly produced ones could be the following: different types of clay, burning temperature, time and force of compression, and difficulties for quality control. The standard deviation of compressive strengths is found to be 8 MPa. According to the compressive strength test results of the brick samples processed with percentile command, the compressive strength is 15.2 MPa.

3.5. Density, Bending and Compressive Strength of Timber

Nowadays, according to the EVS-EN 338:2016 standard [38], structural timber is divided into strength classes based on the bending strength (MPa) of softwoods (conifer): C14, C16, C18, C20, C22, C24, C27, C30, C35, C40, C45, and C50. The most common strength class in Europe is C24. The current reference for the strength class of structural timber is a 5-percentile characteristic value of edgewise bending strength. The species of samples of battens (slat) and logs were found to be spruce (Picea Abies) and Baltic pine (Pinus sylvestris), thus belonging to softwood, respectively. The relative humidity in the testing laboratory ranged from 21.1% to 22.7%, and the temperature from 21.2 °C to 22.1 °C, respectively.
Bending strength test results (Table 7) were processed using the percentile command in MS Excel software 2408; the characteristic flexural strength was 44.1 MPa for the slat, matching the C40 strength class, and 22.6 MPa (Table 7) for the log, matching the C22 class. The timber slat corresponds to a much higher strength class compared to new timber constructions that mainly use C24 (flexural strength = 24 MPa) class timber.
Additionally, the perpendicular compression test results were compared to the standard, showing higher values for logs and slats in the matched strength classes (Table 8).
The mean with standard deviation and characteristic bending strength for slats (battens, Table 7) was 50.2 ± 4.65 MPa and 44.1 MPa, respectively, indicating conformity to a structural strength class of C40. A single result of perpendicular compressive strength was found to correspond to an even higher strength class (>C50). The mean density of the slats (battens) with standard deviation was found to be 440 ± 31.0 kg/m3.
The mean with standard deviation and characteristic bending strength for logs (Table 9) was 25.3 ± 4.59 MPa and 22.6 MPa, indicating a strength class of C22. The mean perpendicular compressive strength of two log samples was 3.84 MPa. The mean density of the logs was found to be 491± 62.7 kg/m3. The fracture of a log sample was found to be typical for perpendicular compression (Figure 8).

4. Discussion on Strength and Moisture Estimates of Materials

The lack of information about the properties of historical materials from the construction period to the present leads to the replacement of old materials with new materials without investigation. The current paper draws attention to the necessity of research on historical construction materials’ properties through a variety of testing opportunities before decisions are made.
Non-destructive rebound hammer testing could be practiced on different historical structures and materials. In the case study building, granite stones (62.1…86.3 MPa), ceramic bricks (34.4…70.6 MPa), plastered ceramic bricks (34.4…42.5 MPa), lime mortar (23.1…30.1 MPa), and concrete (23.1…45.3 MPa) were studied for estimated compressive strength. NDT rebound hammer results were interpreted using the B-Proceq conversion curve, which was intended for early age concrete (28…56 days). Comparison with destructive test results showed that the B-Proceq conversion curve of the rebound hammer test overestimated the compressive strength of the ceramic bricks by 1.5…2 times.
The laboratory destructive testing of the ceramic bricks yielded relevant data to be compared with newly produced solid ceramic bricks with compressive strength (45 MPa) and perforated bricks (35 MPa). The studied historical bricks are characterised by compressive strength in a range of 10.0…40.5 MPa and an average 27 MPa in a flatwise position and 7.40…8.11 MPa in edgewise position. According to this finding, laboratory testing of historical bricks is recommended during restoration to avoid the replacement of old bricks with new bricks without research. However, the impossibility of collecting testing materials from historical buildings could be one of the limitations.
Water distribution in bricks was previously studied using the neutron radiography method [50] and John R. Philip’s porous materials’ sorptivity [51]. Water absorption in clay bricks depends on the water absorption coefficient and absorption capacity, but does not work the same in mortar joints [52]. In situ moisture content testing showed how environmental conditions affect construction materials’ physical properties during a period of time. Tested relative moisture content data (Logica LG 9 NG) showed higher water absorption in structures located closer to the ground such as the foundation and basement. When compared by material, porous lime mortar presented a higher humidity saturation degree. Moisture content in the timber structures measured using the Trotec Materialfeuchte Messgerät T610 device showed more exact data: a higher humidity saturation in May (5…20.4%) for exterior logs without covering and lower layers of logs in the exterior and interior walls. Homogenous data gathered in October were in the range of 5.6 to 6.5% for all structures.
The data collected during compressive and bending laboratory testing of timber matched the timber strength class. The log sample test results matched the C22 strength class and C40 for slats (battens). The C40 strength class is even stronger compared to the C24 timber strength class that is nowadays widely used in new timber structures. The characteristic strengths of the existing timber, masonry and concrete have been proven to be sufficient to carry the loads of a two-storey building over time. This is a decent result considering that the older part of the case building has reached—and the other is about to reach—a service life of 100 years. The visual inspection of the studied load-bearing structural materials showed that they have not significantly deteriorated with time. On the other hand, restoration should be undertaken with proper materials. Unsuitable non-load-bearing renovation materials, e.g., vapour-impermeable (vinyl) floor cover, have already resulted in the deterioration of the wood-based boards underneath them.
Bending tensile and compressive strengths tested in the laboratory are more exact and trustworthy. Non-destructive estimate compressive strength testing is usually an interpretation matter. If non-destructive testing results match the same strength class as destructive test results, as the majority did in this case study, non-destructive testing could continue to be used alongside destructive testing, or without it when dismantling materials from structures is not possible.
The testing of historical materials is more demanding, but as the current paper showed, it provides an overview of materials’ properties and the prerequisites for their prolonged use. Continuing to use historical materials in their original places helps not only save authenticity for future generations, but also fulfils the EU Directive by reducing construction and demolition waste.

5. Conclusions

This study of historical materials’ properties with a variety of methods draws attention to their condition. It gives a prescription for them to remain in structures instead of replacing them during restoration or maintenance. Moisture content of different construction materials and structures of the case study building was determined non-destructively using microwave and resistive methods. Moisture content testing with a resistive method took place in two stages in May and October 2023. The collected data illustrated how moisture content varies within seasons in timber structures and how changes in environmental conditions affect historical buildings’ structures. As the study showed, both methods could be applied for moisture content testing when the dismantling of materials is not possible.
The mechanical properties of the case study building’s construction materials were studied destructively and non-destructively. In situ non-destructive estimated compressive testing was carried out on ceramic bricks, granite stone, plaster and concrete. Ceramic bricks, timber logs and battens (slats) collected from the case study building were destructively tested for bending tensile and compressive strength in the laboratory. The results of both destructive and non-destructive testing were compared. As the comparison showed, non-destructive testing, which is usually less reliable, could be also used to estimate compressive strength when the dismantling of materials from structures is not planned.
The destructive compressive strength results for ceramic bricks were compared to the compressive strength of newly produced ceramic bricks, according to the declarations of performance of an Estonian brick manufacturer.
The destructive tensile bending and compressive strength results for logs and slats were compared to valid construction material standards. The slats matched an even higher timber strength class (C40) than that commonly used for new construction (C24) nowadays. The logs’ compressive strength results matched class C22, which is a good premise for existing logs to remain in structures.
This paper promotes the testing of historical materials during restoration decision-making. Non-destructive testing, which leaves no or slight damage to the surfaces of materials, could be more regularly practiced for heritage buildings and historical buildings in heritage conservation areas, because it does not require permission from the Heritage Board and saves the historical authenticity of original materials for future generations.

Author Contributions

Conceptualisation, A.G. and M.K.; methodology, M.K. and A.G.; software: A.G. and M.K.; validation: M.K. and A.G.; formal analysis, A.G. and M.K.; investigation, A.G. and M.K.; resources, M.K. and A.G.; data curation, A.G. and M.K.; writing, review and editing, A.G. and M.K.; visualisation, A.G. and M.K.; supervision, M.K.; project administration: M.K. and A.G.; funding acquisition: M.K. All authors have read and agreed to the published version of the manuscript.

Funding

This research was funded by the Bridging grant support project (SSGF24012); Tallinn University of Technology (TalTech) and LIFE IP BuildEST project (LIFE20 IPC/EE/000010, Pursuing Estonian national climate ambition through smart and resilient renovation); Estonian Academy of Arts.

Data Availability Statement

The experimental data presented in this study are available on request from the corresponding authors due to privacy reasons related to the owner of the case study building.

Conflicts of Interest

The authors declare no conflicts of interest.

Nomenclature

DTDestructive testing
EVS-ENEuropean Standard adopted by Estonian Centre for Standardisation and Accreditation
FWFoundation wall
MDTMinor destructive testing
NDTNon-destructive testing
NEnorth-east orientation
NWnorth-west orientation
PPlinth (structure)
SEsouth-east orientation

References

  1. Construction Waste Market Share, Research Insights by 2025. (n.d.). Transparency Market Research. Available online: https://www.transparencymarketresearch.com/construction-waste-market.html (accessed on 15 October 2024).
  2. Lu, W.; Webster, C.; Peng, Y.; Chen, X.; Zhang, X. Estimating and calibrating the amount of building-related construction and demolition waste in urban China. Int. J. Constr. Manag. 2016, 17, 13–24. [Google Scholar] [CrossRef]
  3. Eurostat (2019) Waste Statistics—Statistics Explained. Available online: http://ec.europa.eu/eurostat/statistics-explained/index.php/Waste_statistics (accessed on 16 October 2024).
  4. Advancing Sustainable Materials Management: 2015 Fact Sheet. 2018. U.S. Environmental Protection Agency. Available online: https://www.epa.gov/sites/production/files/2018-07/documents/2015_smm_msw_factsheet_07242018_fnl_508_002.pdf (accessed on 15 October 2024).
  5. Diagnosis of Heritage Buildings by Non-Destructive Techniques. 2024. ScienceDirect. Available online: https://www.sciencedirect.com/book/9780443160011/diagnosis-of-heritage-buildings-by-non-destructive-techniques#book-description (accessed on 18 October 2024).
  6. Murzyn-Kupisz, M.; Dziazek, J. Cultural heritage in building and enhancing social capital. J. Cult. Herit. Manag. Sustain. Dev. 2013, 3, 35–54. [Google Scholar] [CrossRef]
  7. Haupt, T. A case study of industrial heritage buildings at the Rjukan and Notodden Site in Norway (1905–1929). Proc. Inst. Civ. Eng. Eng. Hist. Herit. 2024, 177, 16–30. [Google Scholar] [CrossRef]
  8. Amro, D.K.; Ammar, S. Rehabilitation of heritage buildings in conflict zones: A case study of Al-Khader Library in Gaza Strip and its impact on sustainable development. Buildings 2024, 14, 2759. [Google Scholar] [CrossRef]
  9. Imtiaz, S.; Arif, S.; Nawaz, A.; Shah, S.a.R. Conservation of Socio-Religious Historic Buildings: A Case study of Shah Yousuf Gardez Shrine. Buildings 2024, 14, 2116. [Google Scholar] [CrossRef]
  10. Ehitismälestised. (2024). Muinsuskaitseamet. In Estonian. Available online: https://www.muinsuskaitseamet.ee/kultuuriparand-eestis/malestised/ehitismalestised (accessed on 5 April 2024).
  11. Nair, G.; Verde, L.; Olofsson, T.A. Review on Technical Challenges and Possibilities on Energy Efficient Retrofit Measures in Heritage Buildings. Energies 2022, 15, 7472. [Google Scholar] [CrossRef]
  12. Panakaduwa, C.; Coates, P.; Munir, M. Identifying sustainable retrofit challenges of historical Buildings: A systematic review. Energy Build. 2024, 313, 114226. [Google Scholar] [CrossRef]
  13. Brahmi, B.F.; Sassi Boudemagh, S.; Kitouni, I.; Kamari, A. IPD and BIM-focussed methodology in renovation of heritage buildings. Constr. Manag. Econ. 2022, 40, 186–206. [Google Scholar] [CrossRef]
  14. Pinchin, S.E. Techniques for monitoring moisture in walls. Rev. Conserv. Int. Inst. Conserv. Hist. Artist. Work. 2008, 9, 33–45. [Google Scholar] [CrossRef]
  15. Hafsa, W.; Nguyen, T.A.; Angellier, N.; Ulmet, L.; Takarli, M.; Pop, O.; Dubois, F. Assessment of moisture content profile in Douglas-fir wood using electrical resistivity-based tomography. Constr. Build. Mater. 2023, 366, 130193. [Google Scholar] [CrossRef]
  16. Gineiko, A.; Kiviste, M. Condition of Historical Materials, Restoration Scenarios Cost Comparison and Environmental Impact: Case Study from Võru, Estonia. Archit. Civ. Eng. Environ. 2024. submitted on 5 June 2024. [Google Scholar]
  17. Gineiko, A.; Kiviste, M. Protocol of the Technical Condition of Case Study Building in Võru and On-Site Non-Destructive Testing (May and October 2023). 2024. Zenodo. Available online: https://doi.org/10.5281/zenodo.13358295 (accessed on 17 September 2024).
  18. Cabané, A.; Pelà, L.; Roca, P. Laboratory and in-situ mechanical characterisation of masonry components by comparing destructive and minor destructive testing techniques. Constr. Build. Mater. 2024, 411, 134474. [Google Scholar] [CrossRef]
  19. Boccacci, G.; Frasca, F.; Bertolin, C.; Siani, A.M. Diagnosis of historic reinforced concrete buildings: A Literature Review of Non-Destructive Testing (NDT) Techniques. Procedia Struct. Integr. 2024, 55, 160–167. [Google Scholar] [CrossRef]
  20. Ali-Benyahia, K.; Kenai, S.; Ghrici, M.; Sbartaï, Z.; Elachachi, S. Analysis of the accuracy of in-situ concrete characteristic compressive strength assessment in real structures using destructive and non-destructive testing methods. Constr. Build. Mater. 2023, 366, 130161. [Google Scholar] [CrossRef]
  21. Kumavat, H.R.; Chandak, N.R.; Patil, I.T. Factors influencing the performance of rebound hammer used for non-destructive testing of concrete members: A review. Case Stud. Constr. Mater. 2021, 14, e00491. [Google Scholar] [CrossRef]
  22. Borosnyoi-Crawley, D. Non-destructive strength estimation of vintage clay bricks based on rebound hardness in architectural heritage buildings. J. Build. Eng. 2023, 80, 108055. [Google Scholar] [CrossRef]
  23. Võru Technical Inventory bureau. (1966). Inventory project of Liiva 19 nr. 162, inventory folder nr. 2. In Estonian.
  24. Gineiko, A.; Kiviste, M. (2023) Test report. Rebound hammer tests of the materials and structures of Liiva 19, Võru city. In Estonian.
  25. EVS-EN 13183-2:2002; Moisture Content of a Piece of Sawn Timber—Part 2: Estimation by Electrical Resistance Method. EVS: Tallinn, Estonia, 2002. Available online: https://www.evs.ee/et/evs-en-13183-2-2002 (accessed on 5 October 2023).
  26. EVS-EN 12504-2:2021; Testing Concrete in Structures—Part 2: Non-Destructive Testing—Determination of Rebound Number. EVS: Tallinn, Estonia, 2021. Available online: https://www.evs.ee/en/evs-en-12504-2-2021 (accessed on 5 October 2023).
  27. Camuffo, D. Microclimate for Cultural Heritage. Measurement, Risk Assessment, Conservation, Restoration, and Maintenance of Indoor and Outdoor Monuments; Elsevier Science: Amsterdam, The Netherlands, 2019; Volume 19, pp. 459–482. Available online: https://www.sciencedirect.com/book/9780444641069/microclimate-for-cultural-heritage (accessed on 17 October 2024).
  28. Trotec. (n.d). Material moisture measuring device T660. Operating manual. Available online: https://uk.trotec.com/fileadmin/downloads/Messgeraete/Feuchte/T660/TRT-BA-T660-TC-003-EN.pdf (accessed on 7 November 2024).
  29. Compression and Bending Testing Machine Type MEGA 7—FORM+TEST. (n.d.). Available online: https://www.formtest.de/en/Products/Machine-Series/MEGA-7-Series.php (accessed on 5 June 2024).
  30. ISO 7500-1:2018; Metallic Materials—Calibration and Verification of Static Uniaxial Testing Machines. Part 1: Tension/Compression Testing Machines—Calibration and Verification of the Force-Measuring System. ISO: Geneva, Switzerland, 2018. Available online: https://www.iso.org/standard/72572.html (accessed on 5 June 2024).
  31. EVS-EN 12390-4:2019; Testing Hardened Concrete—Part 4: Compressive Strength—Specification for Testing Machines. EVS: Tallinn, Estonia, 2019. Available online: https://www.evs.ee/en/evs-en-12390-4-2019 (accessed on 15 October 2023).
  32. EVS-EN 12390-5:2019; Testing Hardened Concrete—Part 5: Flexural Strength of Test Specimens. EVS: Tallinn, Estonia, 2019. Available online: https://www.evs.ee/en/evs-en-12390-5-2019 (accessed on 15 August 2023).
  33. EVS-EN 772-16:2011; Methods of Test for Masonry Units—Part 16: Determination of Dimensions. EVS: Tallinn, Estonia, 2011. Available online: https://www.evs.ee/en/evs-en-772-16-2011 (accessed on 15 August 2023).
  34. EVS-EN 771-1:2011+A1:2015; Specification for Masonry Units—Part 1: Clay Masonry Units. EVS: Tallinn, Estonia, 2015. Available online: https://www.evs.ee/en/evs-en-771-1-2011-a1-2015-consolidated (accessed on 17 October 2023).
  35. EVS-EN 772-6:2005; Methods of test for masonry units - Part 6: Determination of bending tensile strength of aggregate concrete masonry units. EVS: Tallinn, Estonia, 2005. Available online: https://www.evs.ee/en/evs-en-772-6-2005 (accessed on 18 October 2023).
  36. EVS-EN 772-1:2011+A1:2015; Methods of Test for Masonry Units—Part 1: Determination of Compressive Strength. EVS: Tallinn, Estonia, 2015. Available online: https://www.evs.ee/en/evs-en-772-1-2011-a1-2015-consolidated (accessed on 18 October 2023).
  37. EVS-EN 772-13:2004; Methods of Test for Masonry Units—Part 13: Determination of Net and Gross Dry Density of Masonry Units (Except for Natural Stone). EVS: Tallinn, Estonia, 2004; EVS. Available online: https://www.evs.ee/en/evs-en-772-13-2004 (accessed on 18 October 2023).
  38. EVS-EN 338:2016; Structural Timber—Strength Classes. EVS: Tallinn, Estonia, 2016. Available online: https://www.evs.ee/en/evs-en-338-2016 (accessed on 20 October 2023).
  39. DIN EN 13791/A20-2017-02-Beuth.de; Assessment of In-Situ Compressive Strength in Structures and Precast Concrete Components; Amendment A20. DIN Media: Berlin, Germany, 2017. Available online: https://www.beuth.de/en/standard/din-en-13791-a20/263605032 (accessed on 15 October 2023).
  40. EVS-EN 13791:2020; Assessment of In-Situ Compressive Strength in Structures and Precast Concrete Components. EVS: Tallinn, Estonia, 2020. Available online: https://www.evs.ee/en/evs-en-13791-2020 (accessed on 2 May 2023).
  41. Roknuzzaman Hossain, B.; Mostazid, I.; Haque, R. Application of Rebound Hammer Method for Estimating Compressive Strength of Bricks. J. Civ. Eng. Res. 2017, 7, 99–104. [Google Scholar]
  42. Mengistu, G.M.; Gyurkó, Z.; Nemes, R. The Influence of the Rebound Hammer Test Location on the Estimation of Compressive Strength of a Historical Solid Clay Brick. Solids 2023, 4, 71–86. [Google Scholar] [CrossRef]
  43. Aliabdo, A.; Elmoaty, A.E.M.A. Reliability of using nondestructive tests to estimate compressive strength of building stones and bricks. Alex. Eng. J. 2012, 51, 193–203. [Google Scholar] [CrossRef]
  44. Buyuksagis, S.I.; Goktan, M.R. The effect of Schmidt hammer type on uniaxial compressive strength prediction of rock. Int. J. Rock Mech. Min. Sci. 2007, 44, 299–307. [Google Scholar] [CrossRef]
  45. Glass, V.S.; Zelinka, L.S. Wood Moisture Relations Andneral Technical Report FPL–GTR–282; 2021 The Society of Friends of Võrumaa, NGO: Võru, Estonia, ch.4; pp. 1–22.
  46. The Society of Friends of Võrumaa, NGO. 10 December 2022. Brief Historical Overview of the City of Võru (In Estonian). Available online: https://www.vorumaa.eu/projektid/voru-linn/#google_vignette (accessed on 15 June 2024).
  47. Wienerberger. 2013. Declaration of Performance DoP:25100700-B1W2510. Red Ceramic Brick VTT65. Available online: https://dop.wienerberger.net/ceapp/pdf.do?parsleyId=5&sitelang=wb_ee_home_et&sis=prod&rollout_name=wb_at_zCeCert_de&pagename=WBTools%2FInterfaces%2FCEDoP%2FgetCEDopPDF&language=ET&cs.contenttype=application%2Fpdf&countrycode=EE&countryValue=wb_ee_home_et&certID=25100700-B1W2510&cachno=727933.5433095228https://dop.wienerberger.net/ceapp/pdf.do?parsleyId=5&sitelang=wb_ee_home_et&sis=prod&rollout_name (accessed on 17 June 2024).
  48. Wienerberger. 2023. Declaration of Performance DoP:25101700-B1W2510. Red ceramic Brick FTT65. Available online: https://dop.wienerberger.net/ceapp/pdf.do?parsleyId=5&sitelang=wb_ee_home_et&sis=prod&rollout_name=wb_at_zCeCert_de&pagename=WBTools%2FInterfaces%2FCEDoP%2FgetCEDopPDF&language=ET&cs.contenttype=application%2Fpdf&countrycode=EE&countryValue=wb_ee_home_et&certID=25101700-B1W2510&cachno=521355.3137260916 (accessed on 17 June 2024).
  49. Wienerberger. 2023. Declaration of Performance DoP:25101700-B1W2510. Red Ceramic Brick FAT65. Available online: https://dop.wienerberger.net/ceapp/pdf.do?parsleyId=5&sitelang=wb_ee_home_et&sis=prod&rollout_name=wb_at_zCeCert_de&pagename=WBTools%2FInterfaces%2FCEDoP%2FgetCEDopPDF&language=ET&cs.contenttype=application%2Fpdf&countrycode=EE&countryValue=wb_ee_home_et&certID=25102020-B1W2510&cachno=566615.3834129702 (accessed on 17 June 2024).
  50. El Abd, A.; Kichanov, S.E.; Taman, M.; Nazarov, K.M.; Kozlenko, D.P.; Badawy, W.M. Determination of moisture distributions in porous building bricks by neutron radiography. Appl. Radiat. Isot. 2020, 156, 108970. Available online: https://www.sciencedirect.com/science/article/abs/pii/S0969804319307067 (accessed on 25 October 2024). [CrossRef] [PubMed]
  51. Gummerson, R.J.; Hall, C.; Hoff, W.D. Water movement in porous building materials—II. Hydraulic suction and sorptivity of brick and other masonry materials. Build. Environ. 1980, 15, 101–108. Available online: https://www.sciencedirect.com/science/article/abs/pii/0360132380900153 (accessed on 25 October 2024). [CrossRef]
  52. Kahangi Shahreza, S.; Niklewski, J.; Molnár, M. Experimental investigation of water absorption and penetration in clay brick masonry under simulated uniform water spray exposure. J. Build. Eng. 2021, 43, 102583. Available online: https://www.sciencedirect.com/science/article/pii/S2352710221004411 (accessed on 25 October 2024). [CrossRef]
Figure 1. Flow chart showing the methodological steps of the current research.
Buildings 14 03565 g001
Figure 2. Street view of the case study building facade (NW orientation). The 20th century part is on the left and the l9th century part is on the right.
Buildings 14 03565 g002
Figure 3. Inventory drawings of the basement (on the left) and ground floor plans (on the right) of the case study building [23]. Measurements of the drawings are in metres.
Buildings 14 03565 g003
Figure 4. Testing bricks in the plinth and plastered ceramic bricks in the basement.
Buildings 14 03565 g004
Figure 5. Timber batten (slat) samples (on the left) and log samples (on the right).
Buildings 14 03565 g005
Figure 6. Moisture content in timber structures in May and October 2023.
Buildings 14 03565 g006
Figure 7. Brick sample during compressive (on the left) and bending (on the right) strength testing.
Buildings 14 03565 g007
Figure 8. Log sample during compressive strength testing.
Buildings 14 03565 g008
Table 1. Generic relationship between the rebound number and the compressive strength class from the German National Annex to the EVS-EN 13791:2020 [40].
Lowest Rebound Number from All Test Locations in the Test RegionMedian of the Rebound Numbers for the Test RegionCompressive Strength Class (EVS-EN 206:2014)
≥26≥30C 8/10
≥30≥33C 12/15
≥32≥35C 16/20
≥35≥38C 20/25
≥37≥40C 25/30
≥40≥43C 30/37
≥44≥47C 35/45
≥46≥49C 40/50
≥48≥51C 45/55
≥50≥53C 50/60
≥53≥57C 55/67
Table 2. Results of estimated compressive strength testing.
StructureMaterialNo of Rebound Hammer TestsLowest Rebound NumberMedian of the Rebound Numbers Estimated Compressive Strength of Material or Strength Class
[MPa]
Basement
WallsPlastered ceramic brick4835.537.011 [42]
Ceramic brick 4850.055.2543 [43]
Mortar between granite stones4824.526.758 (German annex to EN 13791) [42]
Granite stones3650.055.078 [44]
FloorReinforced concrete3629.031.0C 8/10 (German annex to EN 13791)
CeilingReinforced concrete4837.040.25C 25/30 (German annex to EN 13791)
Foundation (F)
Plinth (P), exterior, edgewise positionCeramic brick 3649.554.045…50 (German annex to EN 13791)
Foundation wall (FW), exteriorGranite stones 12 56.079 [44]
Mortar between granite stones1216.316.34 (German annex to EN 13791
P and FW, exteriorMortar between plinth and foundation wall12 31.58 (German annex to EN 13791)
P, interior, edgewise positionCeramic brick 4846.547.537 [28]
35…40 (German annex to EN 13791)
Chimney
19th century chimney Chamotte brick3648.155.538 [30]
45…50 (German Annex to EN 13791)
Table 3. Results of moisture content testing.
Structure Orientation Moisture Content (May 2023)Moisture Content (Oct. 2023)
Load-bearing structures
External surface of exterior log wall (LW) (without finishing)south-east (yard) (SE)5…8.8%5.6…6.2%
Internal surface of LWSE (yard)5.5…17.3%5.7…5.8%
External surface (shadow spot) of LW(without finishing) SE (yard)9.6…20.4%5.8…6.5%
Timber board surface of LWnorth-west (street) (NE)5.6…8.9%6.2…6.5%
Same LW from the interior NE (street)15…17%5.7…6.4%
Interior LW between old and new building, conducted from both sides perpendicular to north-west (NW) facade5…17%5.6…5.8%
19th c. exterior with newer type of facade board NW (street)5.1…10.4%5.7…6.0%
Roof structures
Exterior rafters (R), 19th c. NW (street)11…13.4%
Interior R, 19th c.NW (street)12.7…16.2%
Interior R, 19th c. SE (yard)5…14.6%
Queens posts, 20th c.parallel to NW and SE facades10.7…16.4%
LW = log walls, SE = south-east, NW = north-west, NE = north-east, R = rafters, 19c. = 19th century building part, 20c. = 20th century building part.
Table 4. Results of moisture content testing by microwave method.
Structure MaterialInstrument Orientation Moisture Level
Basement walls unplastered ceramic brickSE38…39
plastered ceramic brickSE54…56
granite stones SE58…59
lime mortarSE75…76
Foundation exteriorceramic brick plinthSE, NE44…45
Walls, exterior surface, 20th c.uncovered logs SE27
Walls, interior surface, 20th c.plaster on wooden meshSE25.5
Walls, exterior surface, 19th c.facade boards perpendicular to NW facade25…27
19c. = 19th century building part, 20c. = 20th century building part, SE = perpendicular to south-east facade, NE = perpendicular to north-east, NW = perpendicular to north-west.
Table 5. Densities, flexural and compressive strength of brick samples.
SampleAverage Dimensions
[m]
Volume
[m3]
Mass
[kg]
Density
[kg/m3]
Flexural Strength
[MPa]
Compressive Strength
[MPa]
a
(Length)
b (Width) c
(Height)
Flatwise position in structure
Brick T10.2460.1160.0640.001833.51 906.48.119.6
20.8
Brick T30.2360.1160.0630.001723.31 924.88.131.0
21.2
Brick T40.2530.1210.0610.001863.82 031.36.829.4
36.2
Brick T5 Võrukivi0.2330.1200.0640.001783.31 847.00.910.1
20.1
Brick T60.2520.1210.0660.002033.81 885.46.833.1
34.4
Brick T70.2450.1210.0630.001883.01 600.02.123.3
25.6
Brick T80.2540.1230.0640.002003.81 901.41.540.5
24.5
Brick T90.2560.1220.0650.002033.81 857.47.629.4
15.5
Brick T100.2530.1230.0650.002023.71 821.35.023.1
19.2
Brick T110.2080.1010.0530.001112.21 969.17.635.7
28.3
Edgewise position in structure
Brick T20.2660.1310.0680.002384.31 798.12.27.4
8.1
Table 6. The properties of modern ceramic bricks of Wienerberger brick factory.
Brick Dimensions
[m] *
Volume
[m3]
Mass
[kg] *
Density
[kg/m3] *
Compressive Strength
[MPa] *
a
(Length)
b
(Width)
c
(Height)
VTT65 solid [47]0.2500.1200.0650.0019542 10045.0
FTT65 solid [48]0.2500.0850.0650.001382.8210045.0
perforated FAT65 [49] 0.2500.0850.0650.0009952.08150035.0
Average of samples data0.24230.11830.06670.001913.4187227.0
* Average dimensions, mass, density and compressive strength for flatwise positioned sample bricks.
Table 7. Results of physical and mechanical properties of timber slat samples.
Sample Average Dimensions
[m]
Volume
[m3]
Mass
[kg]
Density
[kg/m3]
Bending Strength
[MPa]
Compressive Strength
[MPa]
a
(Length)
b (Width) c
(Height)
Slat
P1.1
0.6130.0470.0470.001350.6445.447.3
42.3
3.3
Slat
P1.2
0.6800.0460.0430.002370.6409.854.4
47.3
Slat
P1.3
0.5700.0460.0440.001720.5424.055.7
48.2
Slat
P1.4
0.5100.0460.0470.001850.5481.054.4
52.1
Table 8. Structural strength classes and strength properties of timber (EVS-EN 338:2016) [50].
Strength Class of Structural Timber Bending
[MPa]
Compression Perpendicular [MPa]Mean Density
[kg/m3]
C45452.9490
C40 402.8480
C35352.7470
C30302.7460
C27272.5430
C24242.5420
C22222.4410
Table 9. The density, bending and compressive strength of log samples. *: The log was cut longitudinally into three samples.
SampleAverage Dimensions
[m]
Volume
[m3]
Mass
[kg]
Density
[kg/m3]
Bending Strength
[MPa]
Compressive Strength
[MPa]
a
(Length)
b (Width) c
(Height)
Log
PA1.1
0.1460.1480.1570.003401.9547.4 4.2
Log
PA1.2
0.1360.1400.1400.002651.3481.5 3.4
Log PA1.3.11 *0.7360.0840.0770.004762.1436.124.2
22.8
25.0
Log PA1.3.12 *0.9250.0680.0750.004722.8585.135.5
Log PA1.3.13 *0.9160.0690.0840.005262.3427.024.5
22.6
22.7
Disclaimer/Publisher’s Note: The statements, opinions and data contained in all publications are solely those of the individual author(s) and contributor(s) and not of MDPI and/or the editor(s). MDPI and/or the editor(s) disclaim responsibility for any injury to people or property resulting from any ideas, methods, instructions or products referred to in the content.

