1. Introduction
The safe construction of some geotechnical engineering projects or facilities has a significant impact on the level of production and supply assurance. Among the disasters, rock burst was a destructive dynamic disaster in underground coal mines and other underground geotechnical engineering like non-coal mines and tunnels, which often caused large area roadway damage, casualties, and support system damage, bringing significant property and personnel losses [
1]. In order to prevent the occurrence of rock burst dynamic disasters, measures were often taken to reduce the power of the burst source and the ability of the impacted body to instantly damage. Underground Pressure Relief Drilling (UPRD) was the most frequently used measure to reduce the occurrence possibility of bursts of rock bodies in coal mines in China [
2]. The common practice of UPRD was to construct 110–200 mm diameter and 10–35 m depth boreholes in the side of the gateway to release the energy, reduce its elastic performance, and transfer the pressure to the deep of the hole [
3].
Previous researchers often paid more attention to evaluating the pressure relief effect of UPRD while ignoring its incidental phenomena during the drilling process, such as Coal Failure Events (CFEs), which referred to the phenomenon of coal fracturing during the drilling process, which often led to the occurrence of vibration stress waves and corresponding sound signals. There has been little research on the generation mechanism of CFEs in the past), sticking drilling (drilling lagging or stopping caused by encountering gravel during drilling), suction drilling (the phenomenon where the air pressure caused by the deep void during drilling propelled the drill rod and drill bit to continuously suck in), level of difficulty drilling (difficulty in drilling due to stress or structural reasons), and so on [
4,
5]. The above useful information was of great help for UPRD parameters, CFE generation characteristics, and pressure relief effect evaluation.
Monitoring-While-Drilling (MWD) technology aims to obtain additional information generated during construction without affecting normal build operations to reflect some useful and actual additional situations of [
6]. Our previous MWD results [
7] on UPRD showed that the external microseismic monitoring [
8,
9] system (arranged outside the drilling system, different from the measurement sensors adopted directly on the drilling system in [
10,
11]) could reflect the drilling depth, peak pressure, and evaluate the pressure relief effect when the quantity of CFEs was small. However, our recent MWD results in the study were beyond our expectations: hundreds of CFEs occurred during drilling construction, which led to the failure of the original MWD method and made it impossible to determine the foundation drilling depth. The main reason for this problem was that the large amplitudes generated by the CFEs covered up the maximum amplitudes in the original waveform, and the amplitude cluster [
12] features were submerged.
The conventional theory held that the main mechanism for the occurrence of CFEs was that the coal was damaged under high pressure [
1], and the kind of failure may then produce cracks [
13] and probably made a sound, which respected the releasing of elastic energy [
14] and the transformation of pressure concentration [
15,
16]. The stress structure formed in coal was destroyed during the construction of UPRD, and CFEs were produced when a certain volume of coal was destroyed. The pressure distribution at different depths was different before drilling [
17,
18], and previous studies usually only calculated the lateral pressure distribution and peak value in theory or based on simple phenomena [
19,
20]. The theoretical research and accurate field tests on the principle and quantity of CFEs in different depths of drilling were rarely studied, but it was very significant to study the generation principle and distribution characteristics of CFE with pressure.
The indicators used to describe CFEs included the number at different depths when drilling, the quantitative relationship between pressure distribution [
21], maximum amplitude [
22], waveform characteristics [
23], main frequency [
24,
25], duration [
26], etc. The number of CFEs produced by different boreholes varied greatly according to the field experience in this study, which may relate to the stress environment of the borehole location itself [
27]. Different drilling positions and different drilling depths would produce different numbers of CFEs, so it was necessary to summarize the rules on site. Theoretically, CFE with higher energy usually had a larger amplitude [
28], lower dominant frequency [
29], and longer duration [
30]. When the energy is too large and exceeds the testing ability of the monitoring sensor, the waveform may be distorted [
31,
32]. The scale and spectral characteristics of rupture played an important role in describing the mechanism and were worthy of further research.
The study investigated the applicability of the innovative external MWD method for underground pressure relief drilling with more coal failure events by collecting external vibration signals [
33,
34] and making quantitative statistics of the distribution and characteristics of CFEs (taking a drilling hole with a large number of CFEs as an example). The influences of CFEs on the accuracy of the MWD method were studied, and the relationship between the occurrence number of CFEs and pressure distribution was analyzed. The waveform characteristics, the amplitude distribution at different depths after removing CFEs, and the main frequency of CFEs were also discussed. Based on the generation and distribution data of CFE, the occurrence mechanism of CFE was inferred, and the fractal characteristics between pressure distribution, main frequency, and CFE were explored. The research results were of great help to the production principle of CFE, the mechanism of UPRD, drilling monitoring technology, and data indicator analysis methods of MWD, which are also beneficial for sustainable development [
35] and protecting the ecological environment [
36,
37].
2. On-Site Monitoring Methods
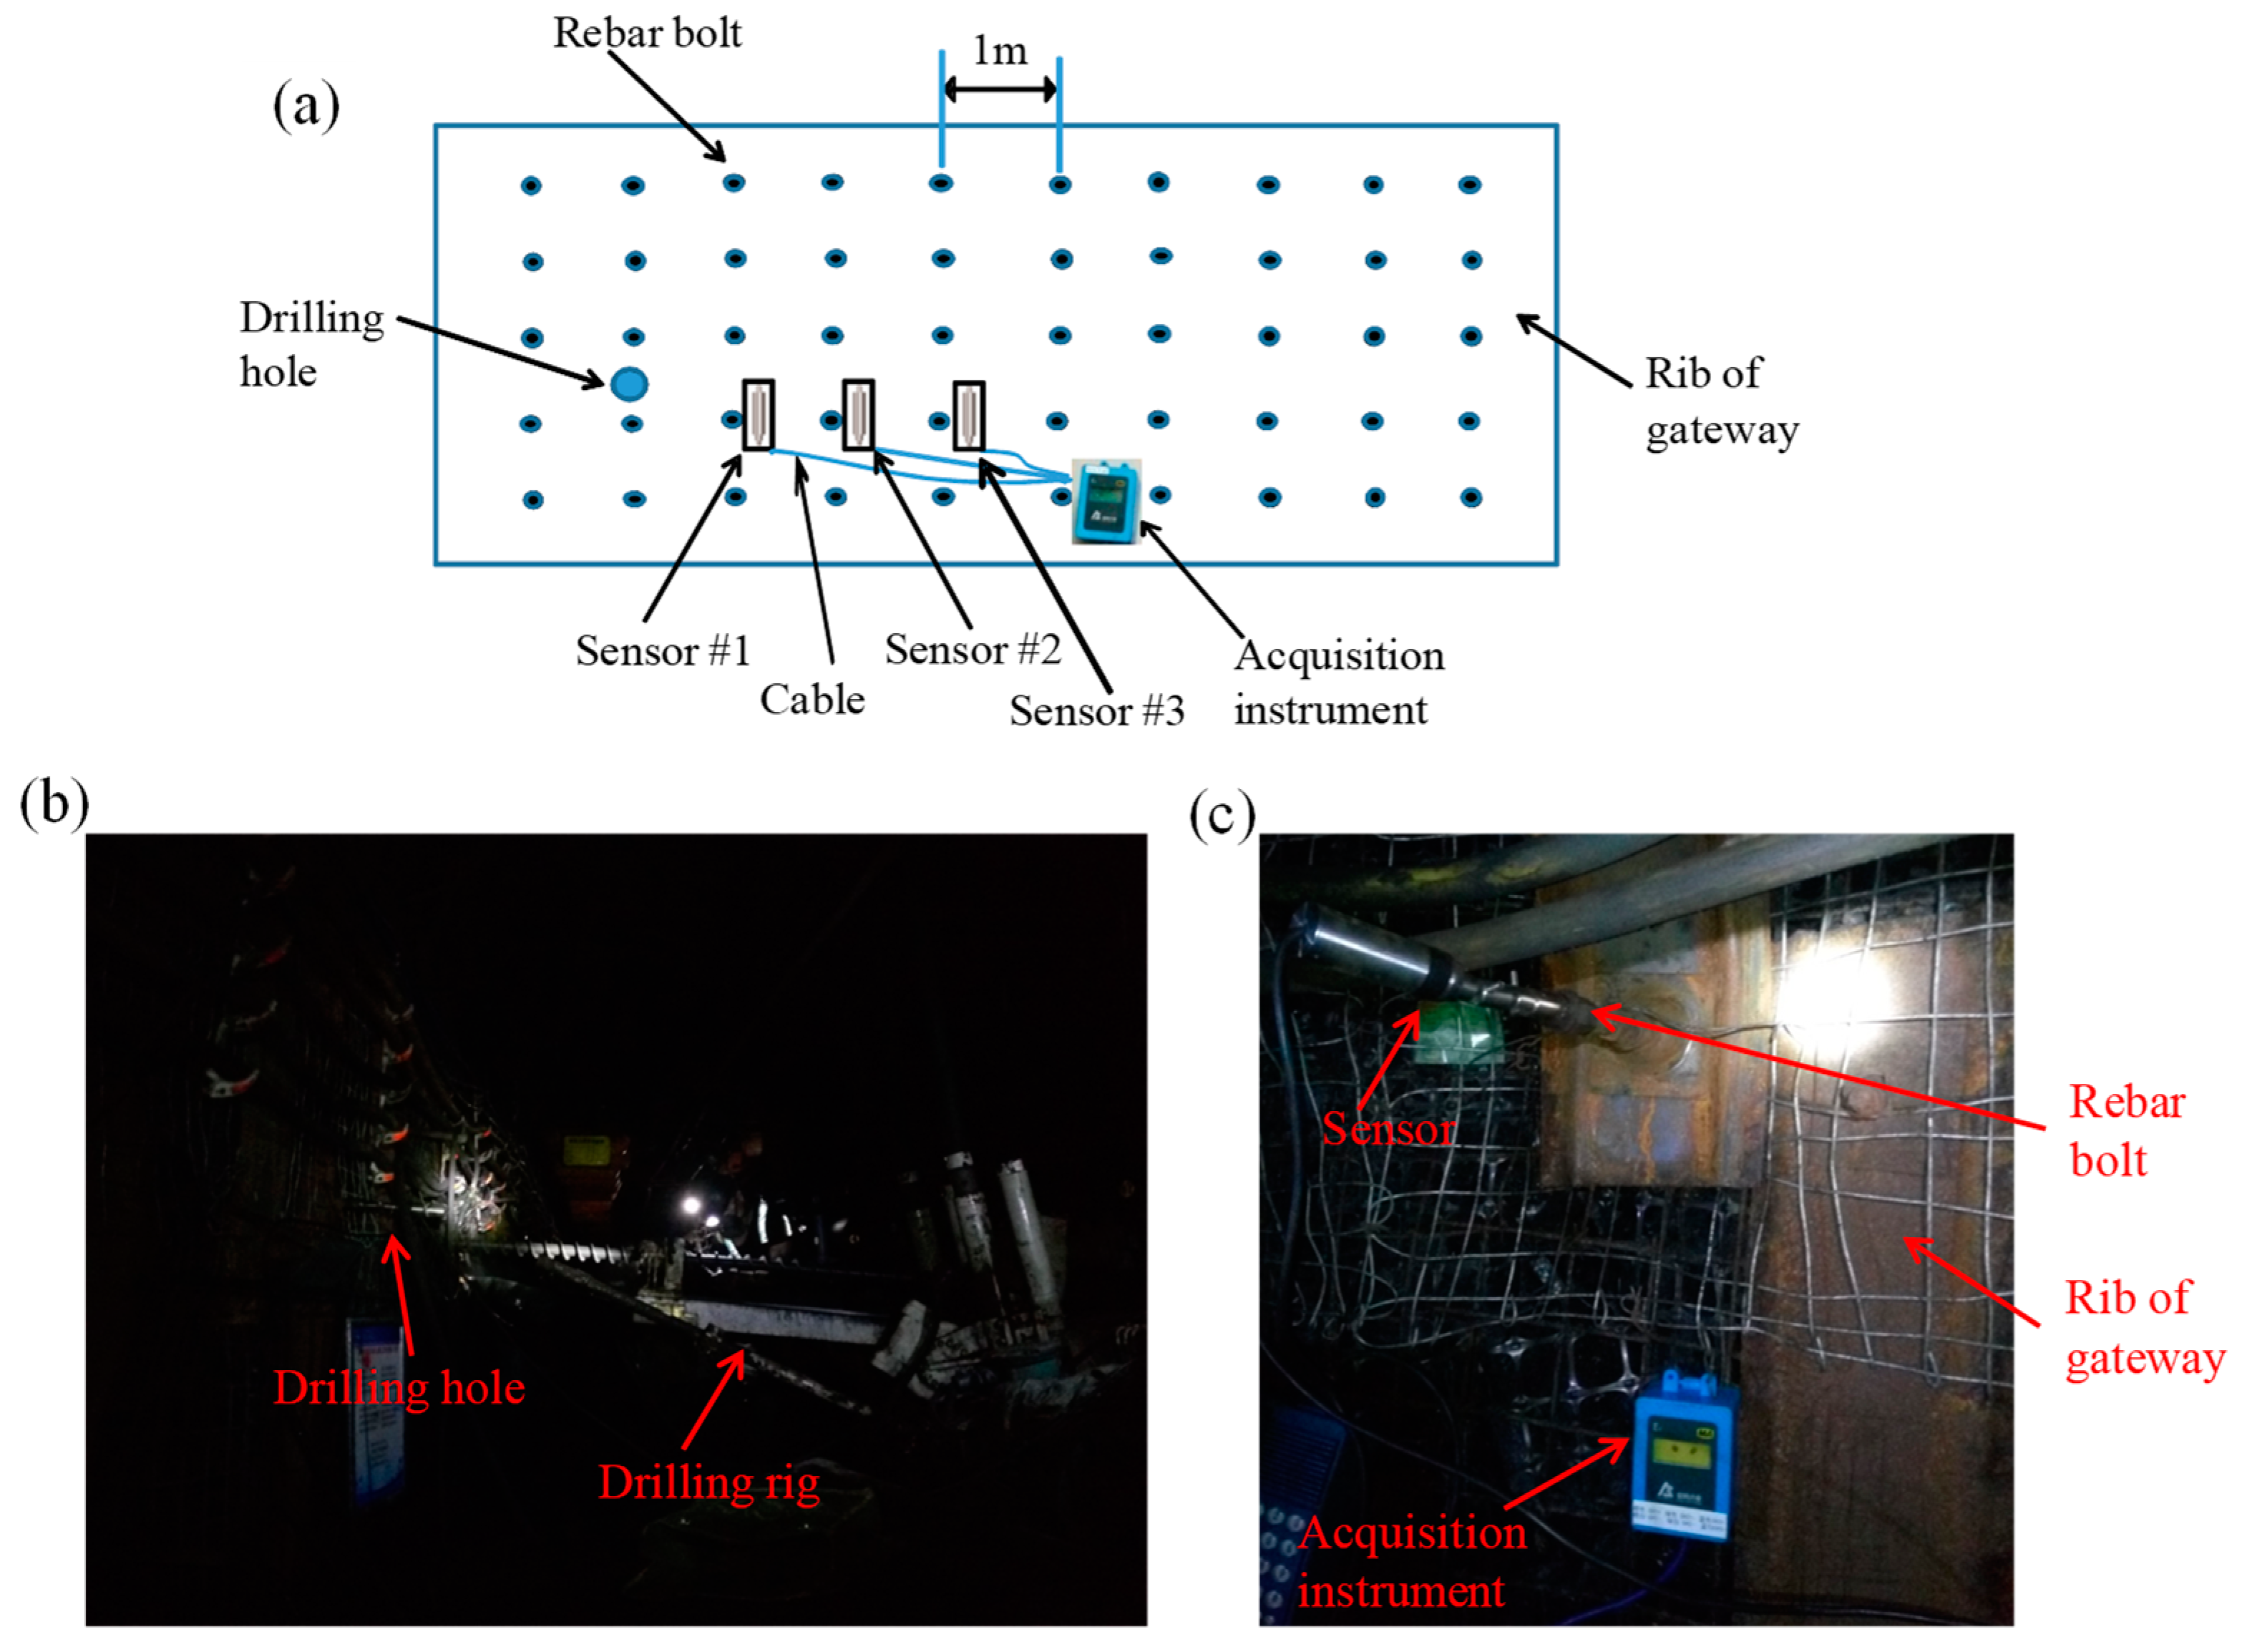
The monitored UPRD borehole was located at the rib of the 31,120 auxiliary gateway in a coal mine in Inner Mongolia, China. The monitoring system mainly included three sensors and one acquisition instrument, as shown in
Figure 1a. The distances between the three sensors and the UPRD borehole were 1 m, 2 m, and 3 m, respectively (the three sensors were named sensor #1, sensor #2, and sensor #3 in turn). The sensors were arranged horizontally to capture the attenuation law of vibration signals propagating laterally. The three sensors can mutually verify the results and provide monitoring accuracy. At the same time, the horizontal arrangement was convenient for instrument installation. The sampling frequency of the acquisition instrument was 2000 Hz, and other parameters are the same as those given in the previous studies [
7,
12]. Some important parameters include the maximum frequency response of the three sensors at 800 Hz, the sensitivity was 100 V/m/s, and the normal acceleration was 50 m/s
2.
The external vibration signals received by the three sensors were transmitted to the acquisition instrument through the respective cable, and then all were stored in the SD card in the acquisition instrument. The program was set to store a waveform file every 4 s due to the long monitoring time and a large amount of data; that is, each waveform file of corresponding sensors separately saved 8000 points every 4 s during the monitoring period. The whole MWD system was installed in advance and would continuously be monitored until the drilling construction was completed. In terms of signal and data processing, Python 3.X software was used for amplitude extraction, Origin software was used for drawing figures and displaying information, and Office software was used for statistical analysis.
The crawler-type full hydraulic drilling rig (the tape was ZDY4000LR, adopting a floor-standing set up and arranged in the middle of the gateway, drilling towards the side of the gateway) was used for construction, and the length of each drilling pipe was 1.5 m. The construction position of the UPRD borehole was at the rib of the 31,120 auxiliary gateway, 1.7 m away from the floor. The diameter of the UPRD borehole was 200 mm, the inclination angle was 0, and the drilling borehole was constructed every 1 m. The standard construction depth of UPRD boreholes was 24 m, and two drilling pipes were connected each time to adapt to the large width of the gateway. The whole drilling process was completed in coal and required the cooperation of two workers under normal circumstances, one driving the drilling rig and the other connecting the drilling pipe. After collecting the vibration information during the drilling process, all signals were stored in the SD card of the acquisition instrument, which was then taken to the ground and imported into the computer for subsequent analysis.
3. Results
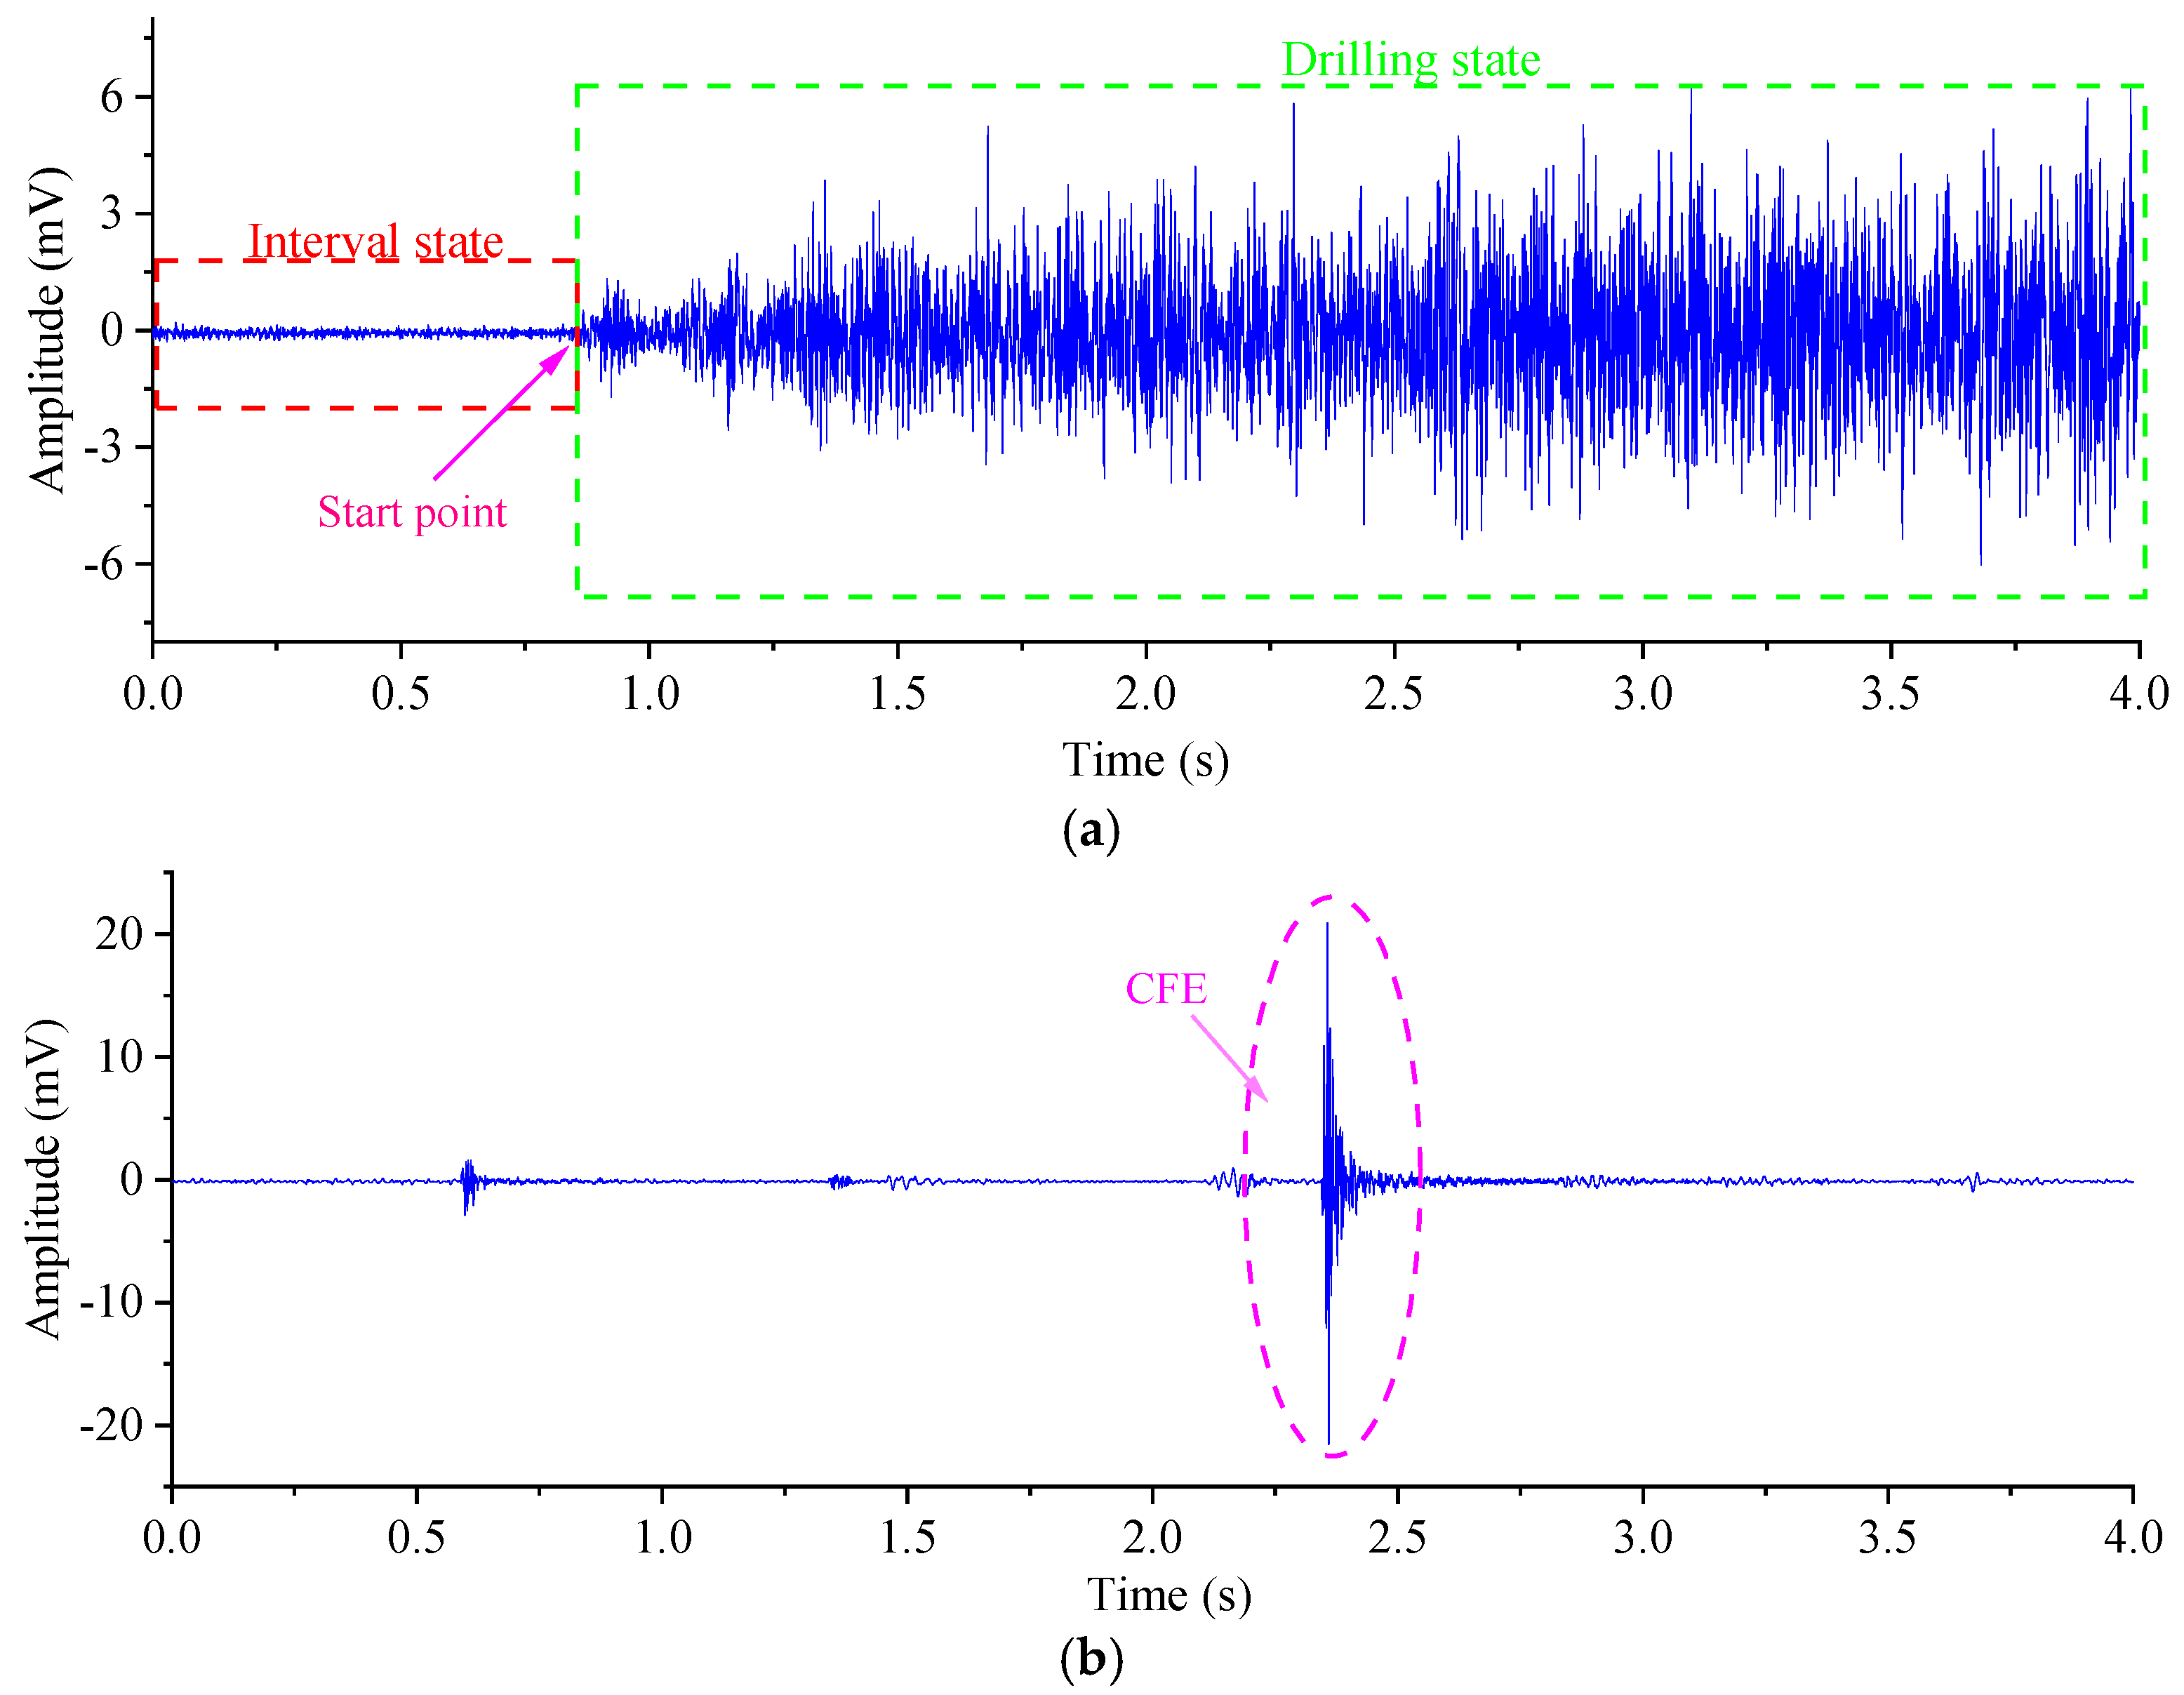
After checking the waveform files stored in the SD card of the acquisition instrument, it was found that there were mainly two kinds of waveform forms, which were drilling state and CFE, as shown in
Figure 2.
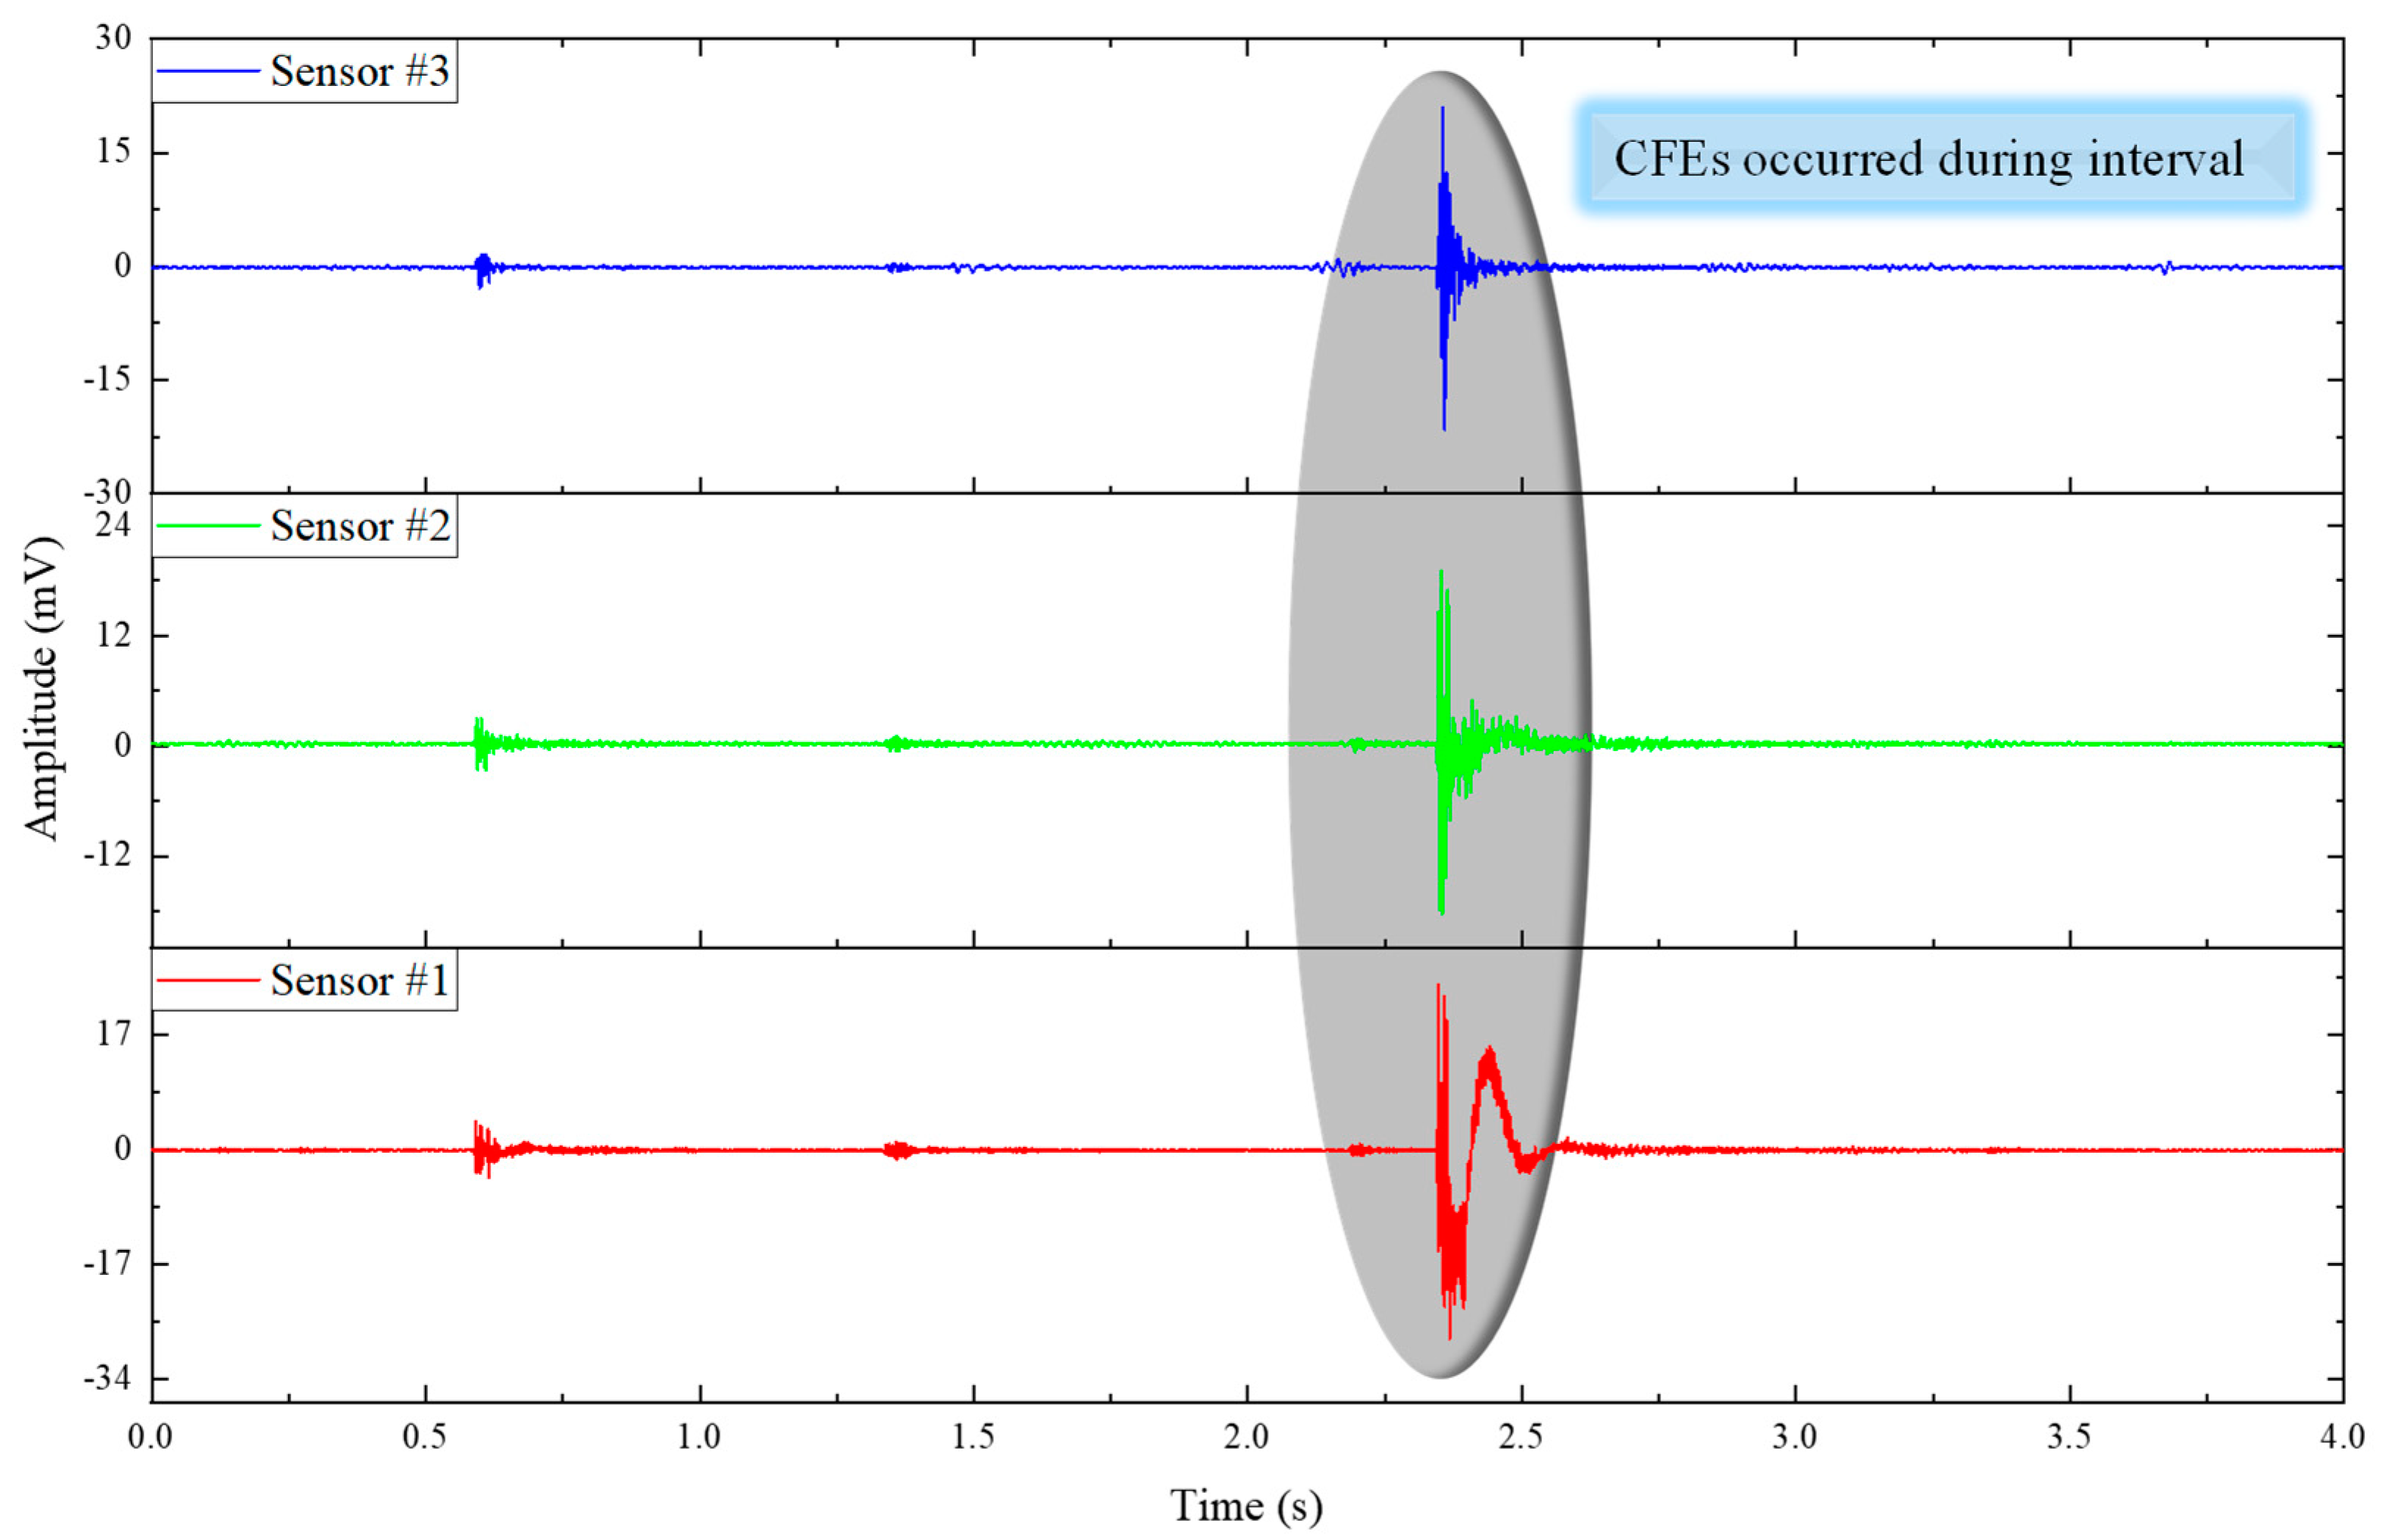
Figure 2a denoted the waveform of the interval state and drilling state. The results indicated that the amplitudes of the two states were evidently different. The smaller amplitude represented the slight vibration when the system was not drilling the medium, while the larger amplitude represented the relatively strong vibration caused by the drilling operation. From the basic waveform morphology, the waveform results of this experiment were similar to previous research findings.
Figure 2b shows another waveform of CFE, which showed that the amplitude raised abruptly (dozens of times) at about 2.4 s and then slowly returned to the normal level after 0.2 s. The physical conclusion of the drilling state could be obtained through the waveform differences between the interval state and drilling state, and the subsequent depth of CFE generation could be combined with the obtained drilling depth.
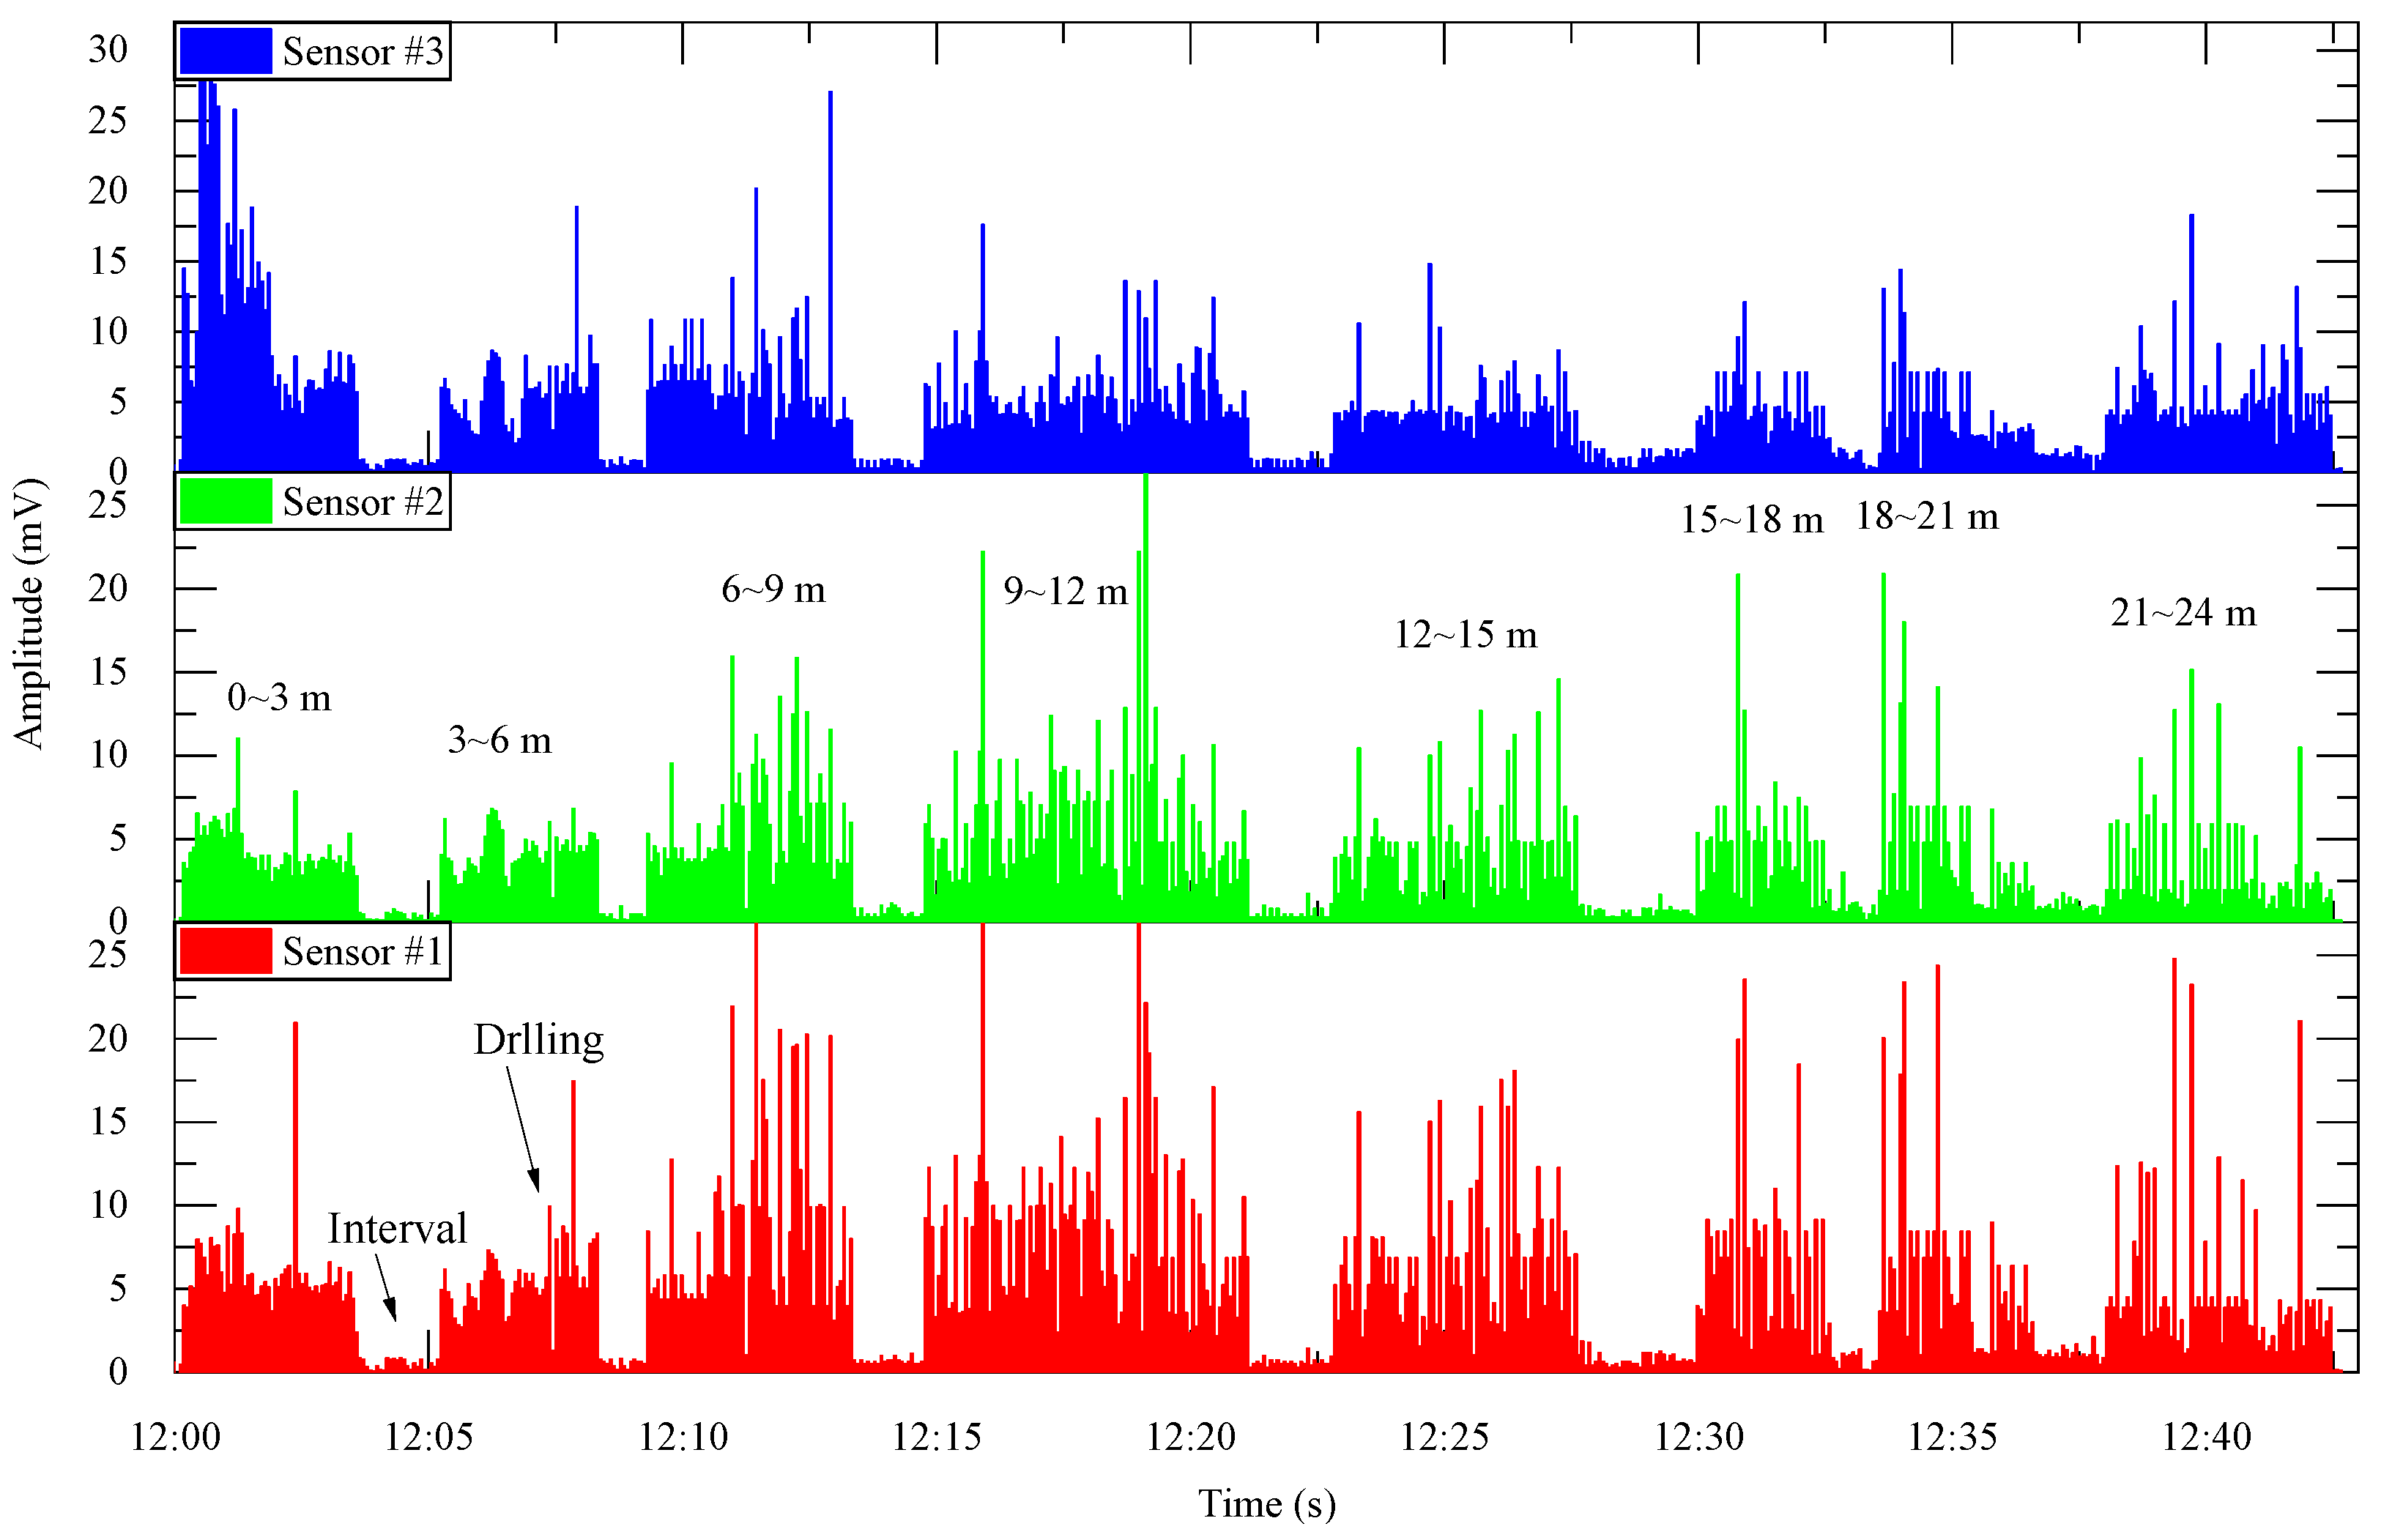
In order to more intuitively observe the changes in vibration signals with drilling status, a curve of vibration intensity over time should be created, as the results in
Figure 3, which denoted the changing trend of the amplitude of the three sensors with time in the process of drilling. The results showed that a large number of CFEs were received by the three sensors, and the events completely changed the way the original amplitude changes (the amplitude of CFEs was mostly larger than the foundation amplitude level, thus masking the useful amplitude cluster), which led to the result that it was impossible to judge the depth of the borehole (the fact was fully confirmed by the reduction of ordinate range in
Figure 4, which reduced the vertical ordinate range). The CFEs received by the three sensors were basically generated at the same time, and the relative amplitude changes were consistent, which confirmed the monitoring accuracy of CFEs. The maximum amplitudes of the three sensors were basically the same (between 245 and 290 mV), and there was no obvious attenuation phenomenon affected by the distance, which may be related to the smaller sensor spacing (especially when the CFE display occurred in the middle of sensor 2#, its amplitude was actually the highest. This may be due to some measurement errors, but fortunately, only one CFE was like this, which did not affect the basic rules). The emergence of CFEs has led to the inability to obtain depth parameters and has caused some errors in the subsequent statistical analysis of amplitude per meter, which was evident. But it also brought convenience to the research work of CFEs, which has rarely been analyzed in depth in previous studies. The main doubts lay in the principles, distribution patterns, and release effects of CFEs, and the basic data in this study provided an important foundation for answering these questions.
The interference of CFEs indicated that their influence must be removed first in order to reflect the change in useful foundation amplitude. So, after the amplitudes of CFEs were removed (selected and removed through a long short window algorithm and setting amplitude threshold), the change trends of the amplitude of the three sensors were stated in
Figure 5, which indicated the obvious difference between the drilling process and the interval process. The burrs in the amplitude cluster represented the difficulty and ease of drilling within the drilling depth range of each drill rod and did not affect the expression of the results. Since each drilling interval was two drilling pipes (the combined length of two drilling pipes was 3 m) and the number of intervals was calculated as 8, it then can be determined that the drilling depth of the monitoring UPRD borehole was 24 m. Meanwhile, it could be seen that the changing trend of the three sensors with time was basically the same, and all showed the same depth (also the same as the design depth), which confirmed the accuracy of the monitoring results. Statistical analysis indicated that the drilling depth could not be reflected without removing the amplitude of CFEs; in other words, the innovative external MWD method could reflect the drilling depth when removing the influence of CFEs amplitude.
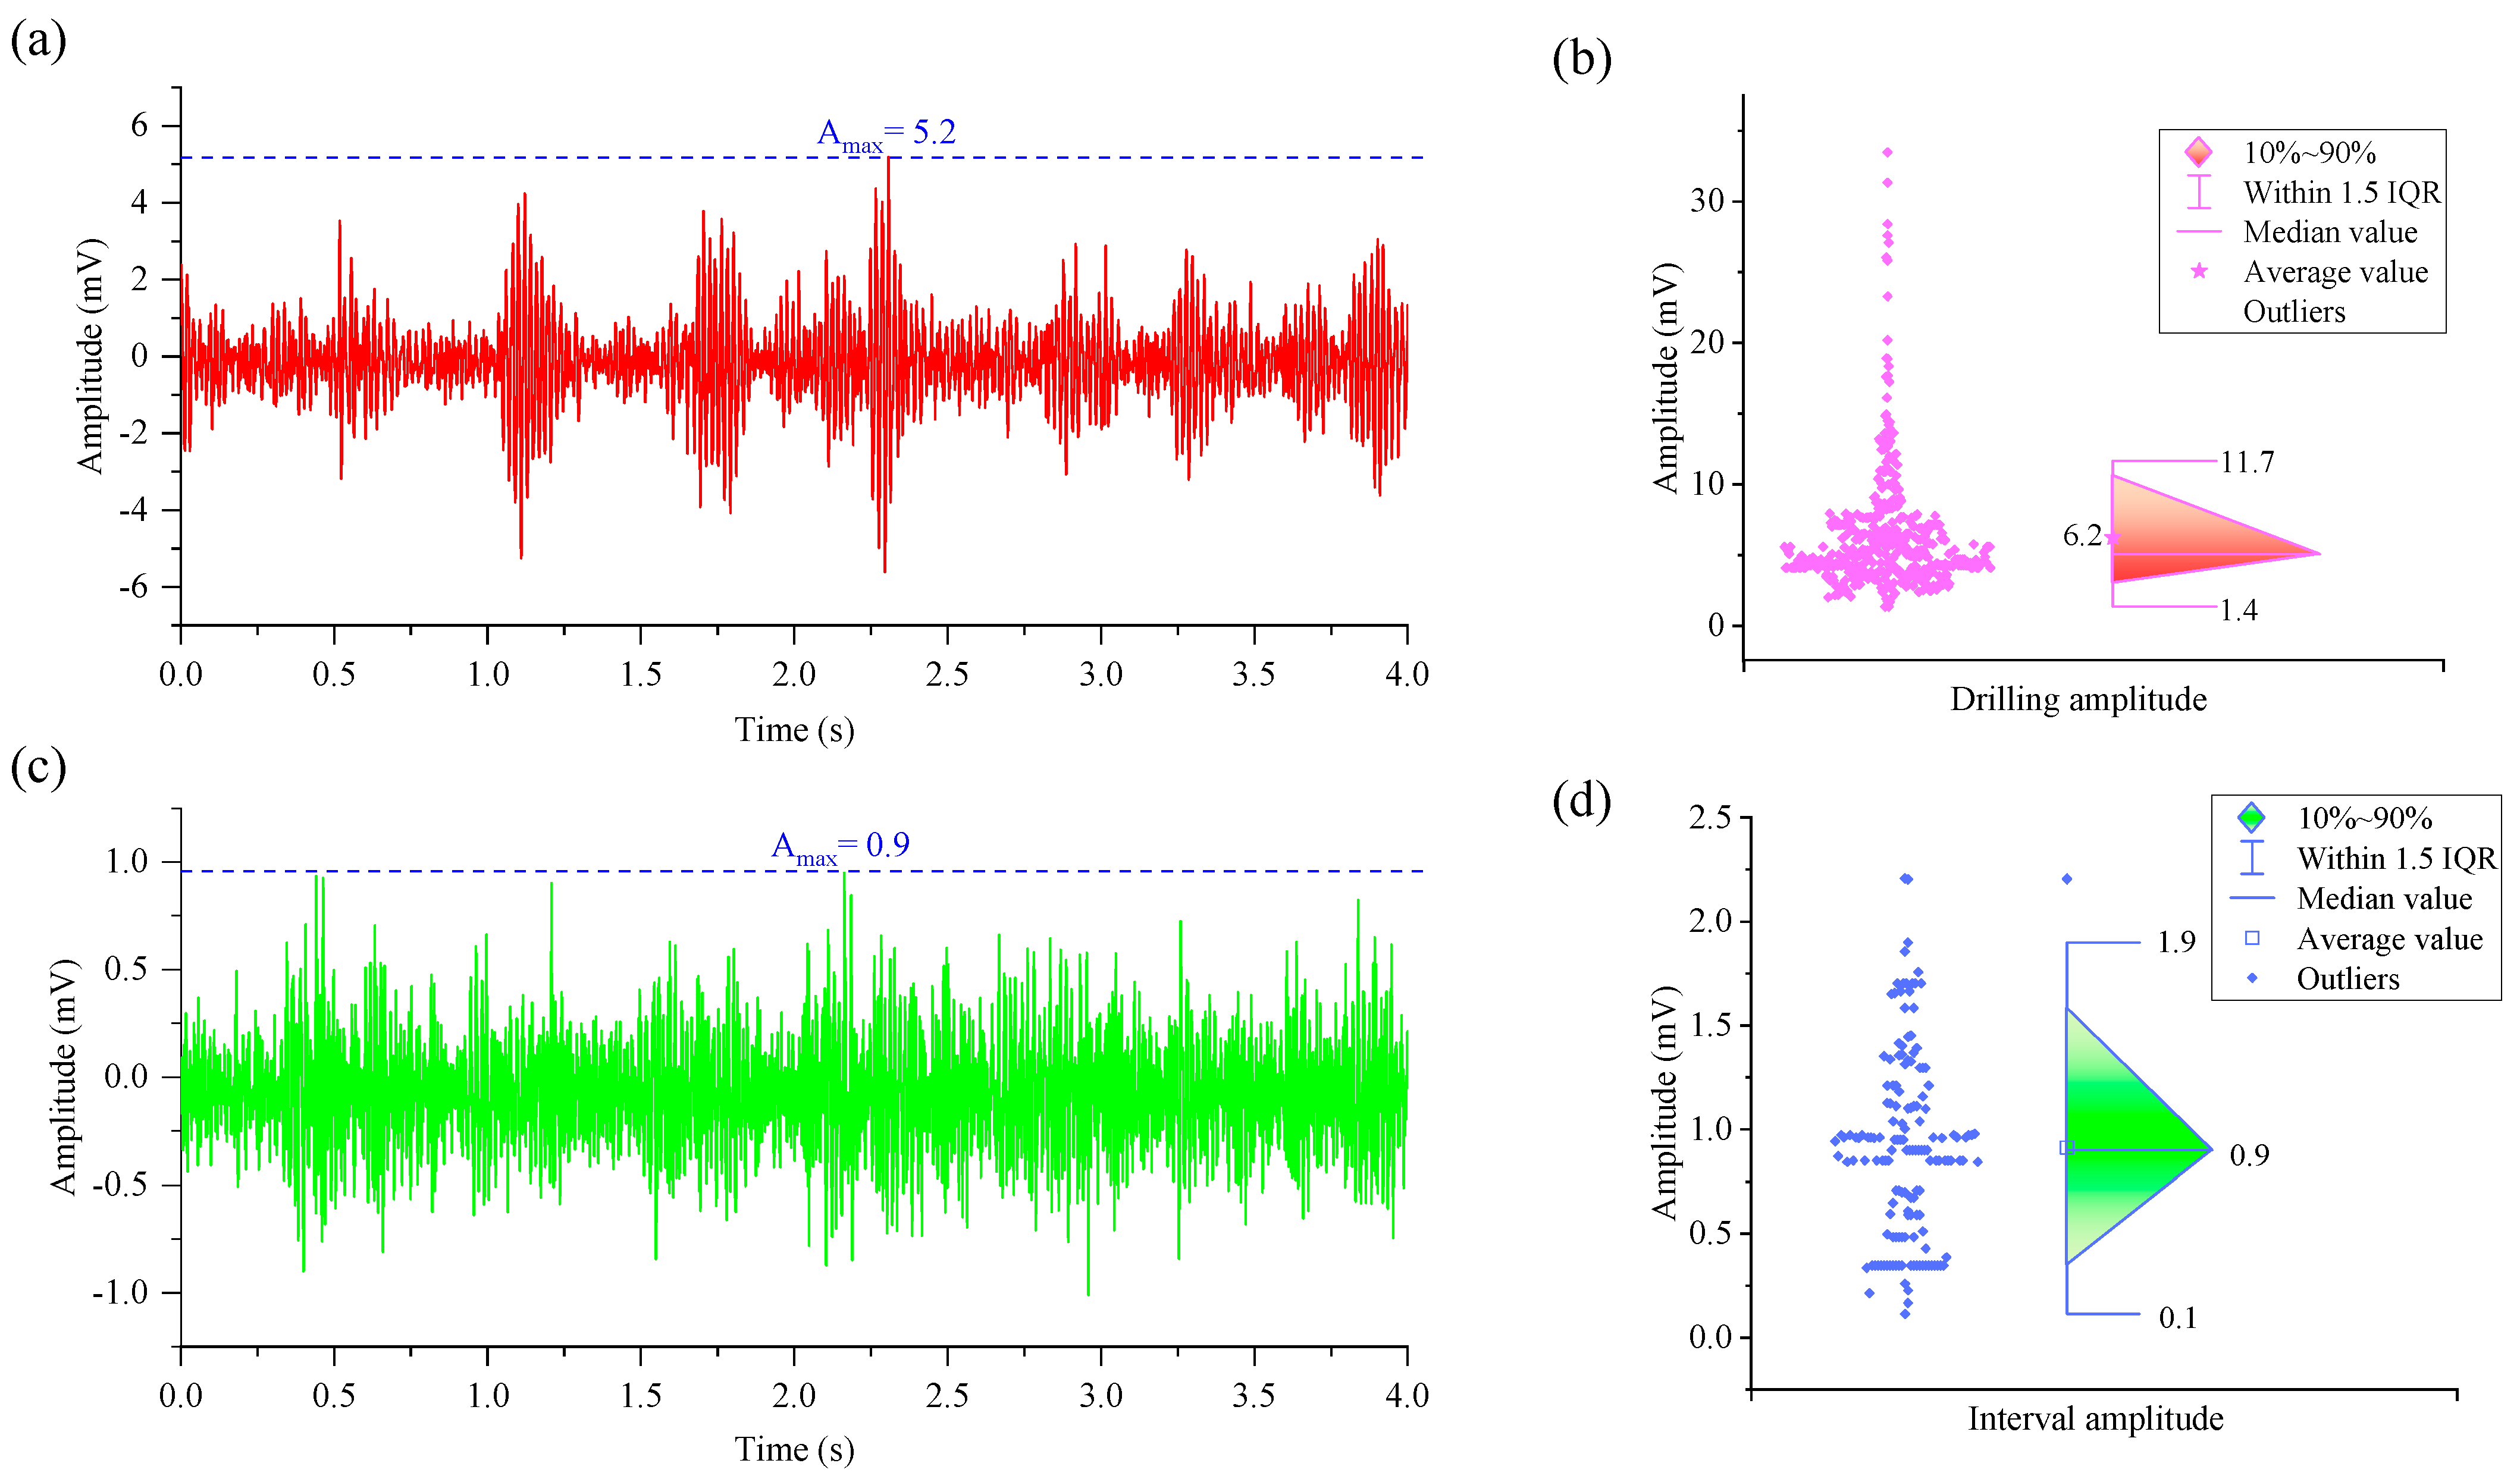
It was necessary to display the original state of the waveform and the statistical results of the related amplitude; therefore,
Figure 6a showed a case waveform during the drilling process, which indicated that the amplitude was bigger and the vibration was relatively unstable.
Figure 6b exhibited the amplitude statistics of all drilling processes during the whole UPRD borehole construction, result showed that the average amplitude was 6.2 mV, the amplitude distribution range of 25–75% was relatively small, but there were many outliers (the biggest was higher as 35 mV).
Figure 6c showed a case waveform during the interval process, which indicated that the amplitude was smaller and the vibration was relatively stable compared to the drilling process.
Figure 6d exhibited the amplitude statistics of all interval processes during the whole UPRD borehole construction. The result showed that the average amplitude of all interval processes was only 0.9 mV, the amplitude distribution range of 25–75% was relatively big, and there was only one outlier. The above facts showed that the discrimination between the drilling process and the interval process was higher after removing the influence of CFEs. That was to say, when a large number of CFEs were generated during the drilling construction, their amplitude would inevitably bring trouble to depth statistics. However, when they were identified and eliminated, depth statistics and subsequent pattern analysis could still be continued and be effective.
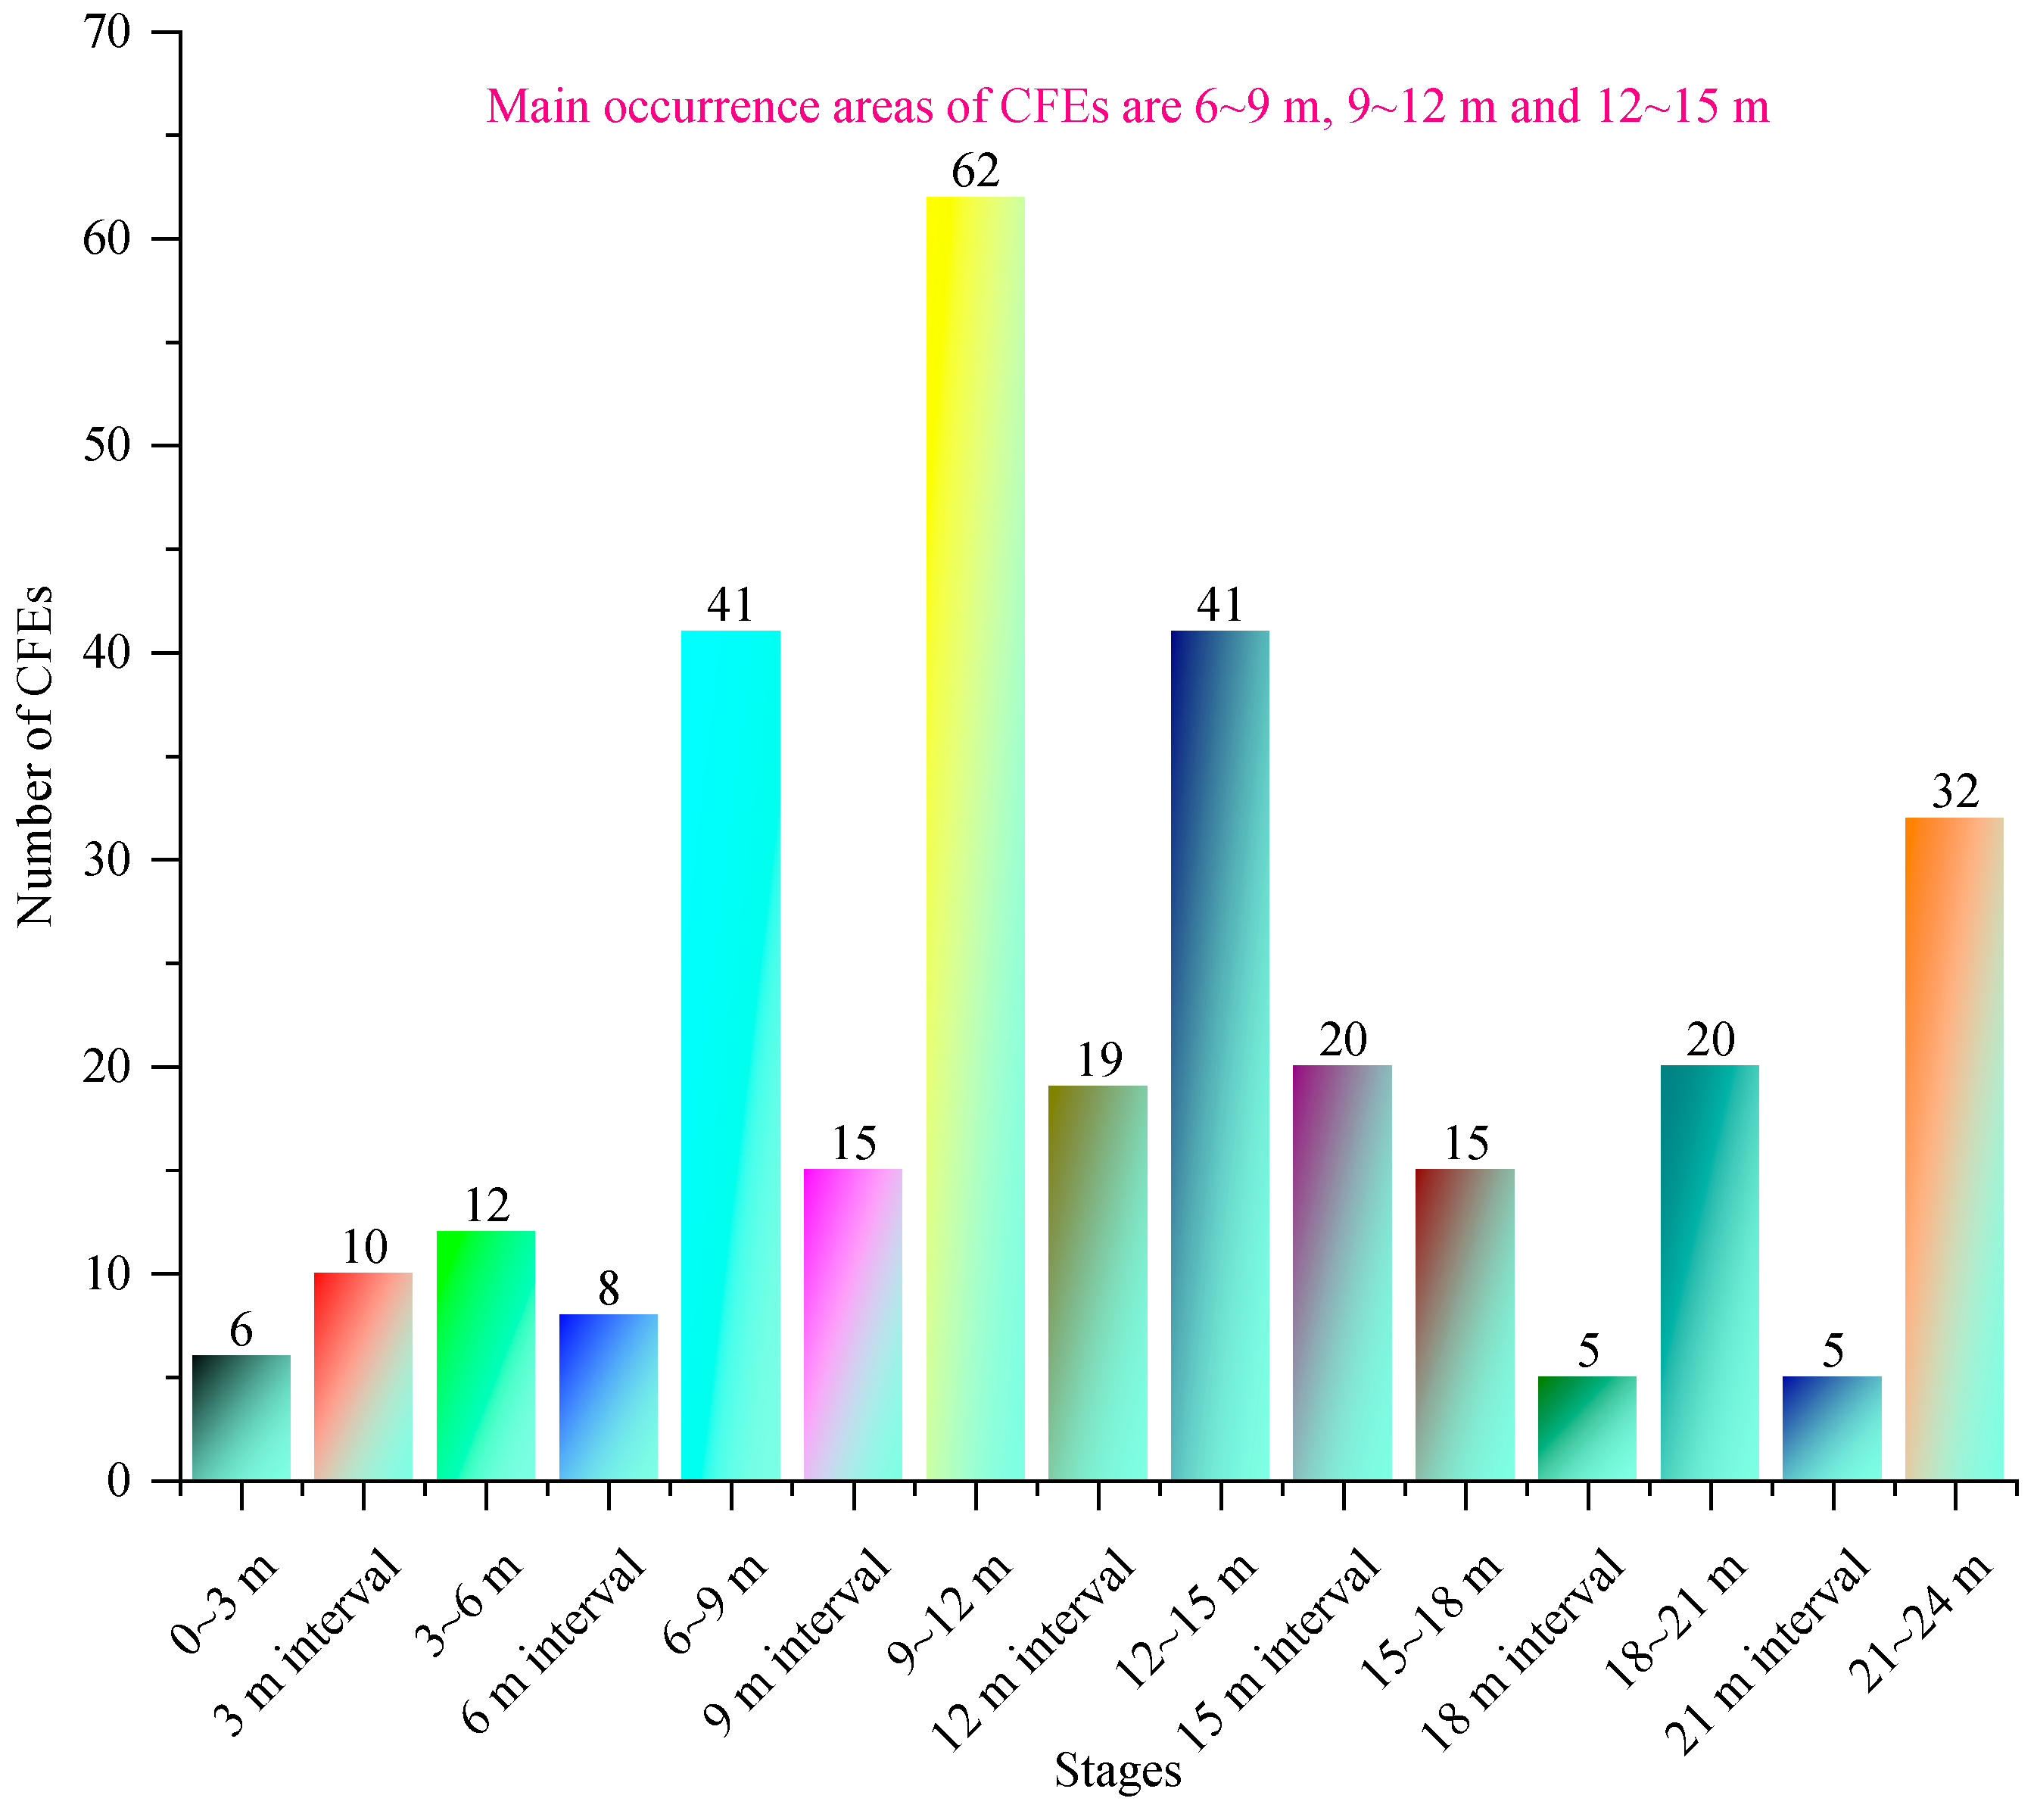
This study aimed to investigate whether the innovative methods were applicable in the presence of a large number of CFEs. And another important purpose was to study the generation characteristics of CFEs, including the mechanisms of occurrence, distribution patterns, release features, fractal results, etc. So, combined with the depth results, the numbers of CFEs of different depths during the whole UPRD borehole construction process (drilling and interval) were counted in
Figure 7. After statistics, 311 CFEs were generated during the UPRD borehole construction, of which 229 were generated in the drilling process, accounting for 74% of the total CFEs, and 82 were generated in the interval process, accounting for 26% of the total CFEs. The occurrence of so many CFEs was rare, and few on-site and research results have suggested that such a large number of CFEs would appear. Therefore, the experimental data in this study was more valuable for providing feedback on certain phenomena and patterns, laying a good foundation for further mechanism and technical research. The number of CFEs was different in different depths, and the most quantity of CFEs was produced in 6–9 m, 9–12 m, and 12–15 m, which were 41, 62, and 41, respectively (the total of the three depths was 144, accounting for 48% of the total CFEs during the drilling process). The drilling process of 21–24 m produced 32 CFEs, which was the maximum value of the remaining depth (excluding 6–9 m, 9–12 m, and 12–15 m). The above facts could preliminarily determine that the higher the drilling pressure, the more CFEs would be produced, and the two may be positively correlated.
In fact, in conventional theoretical understanding, it was difficult to cause rock fracture during the interval of drilling due to the lack of sustained rock drilling disturbance. However, the results of this study were not like this. Mechanistically, the possible reason was that drilling rocks may experience a certain degree of delay in fracturing when subjected to force rather than fracturing once force was applied. From a distribution perspective, as pressure increased, the number of CFEs produced increased, which seemed to be consistent with conventional understanding. When the surrounding stress of rocks was high, the occurrence of small fractures became more frequent and consistent; that is, more fractures with similar failure forms occurred (fractal dimension may decrease). At this time, the irregularity and complexity of damage decreased when subjected to high pressure, and resonance failure was more suitable, resulting in more CFEs. When the pressure was low, the result was completely opposite. The smaller pressure caused more forms of damage to the rock, making it impossible to achieve a more uniform outcome. The above facts may demonstrate the fractal characteristics of pressure and CFE distribution in high-pressure drilling areas.
The CFE waveforms during the drilling process and interval process were different due to different foundation amplitude levels and vibration environments,
Figure 8 and
Figure 9 showed one-case waveforms of CFE during the two processes, respectively. The CFE waveform in the drilling process was less obvious, mainly due to the larger foundation amplitude (the foundation vibration of the drilling bit, drilling rig, and drilling pipe were more obvious in the drilling process, which may relate to the high-intensity drilling activities), as the result in
Figure 8. Relatively, the CFE waveform in the interval process was more obvious, mainly due to the smaller foundation amplitude (the foundation vibration of the drilling bit, drilling rig, and drilling pipe were smaller in the interval process, which may relate to the low-intensity activities of connecting drill pipes), as shown in
Figure 9. For the amplitude of CFE, the case waveform of the interval process was larger than that of the drilling process, which indicated that the amplitude may possibly not be related to drilling or not. The above two examples of event waveforms may indicate that there was indeed a delay in rock fracture. The rock fractured under the action of force, but when the force was removed, the fracture may still occur, similar to the previously studied calm period of rock failure. When an additional and greater external force was applied to the drilling rock, the effect of the original stress may also play a certain role after the incremental external force was removed.
4. Discussion
The
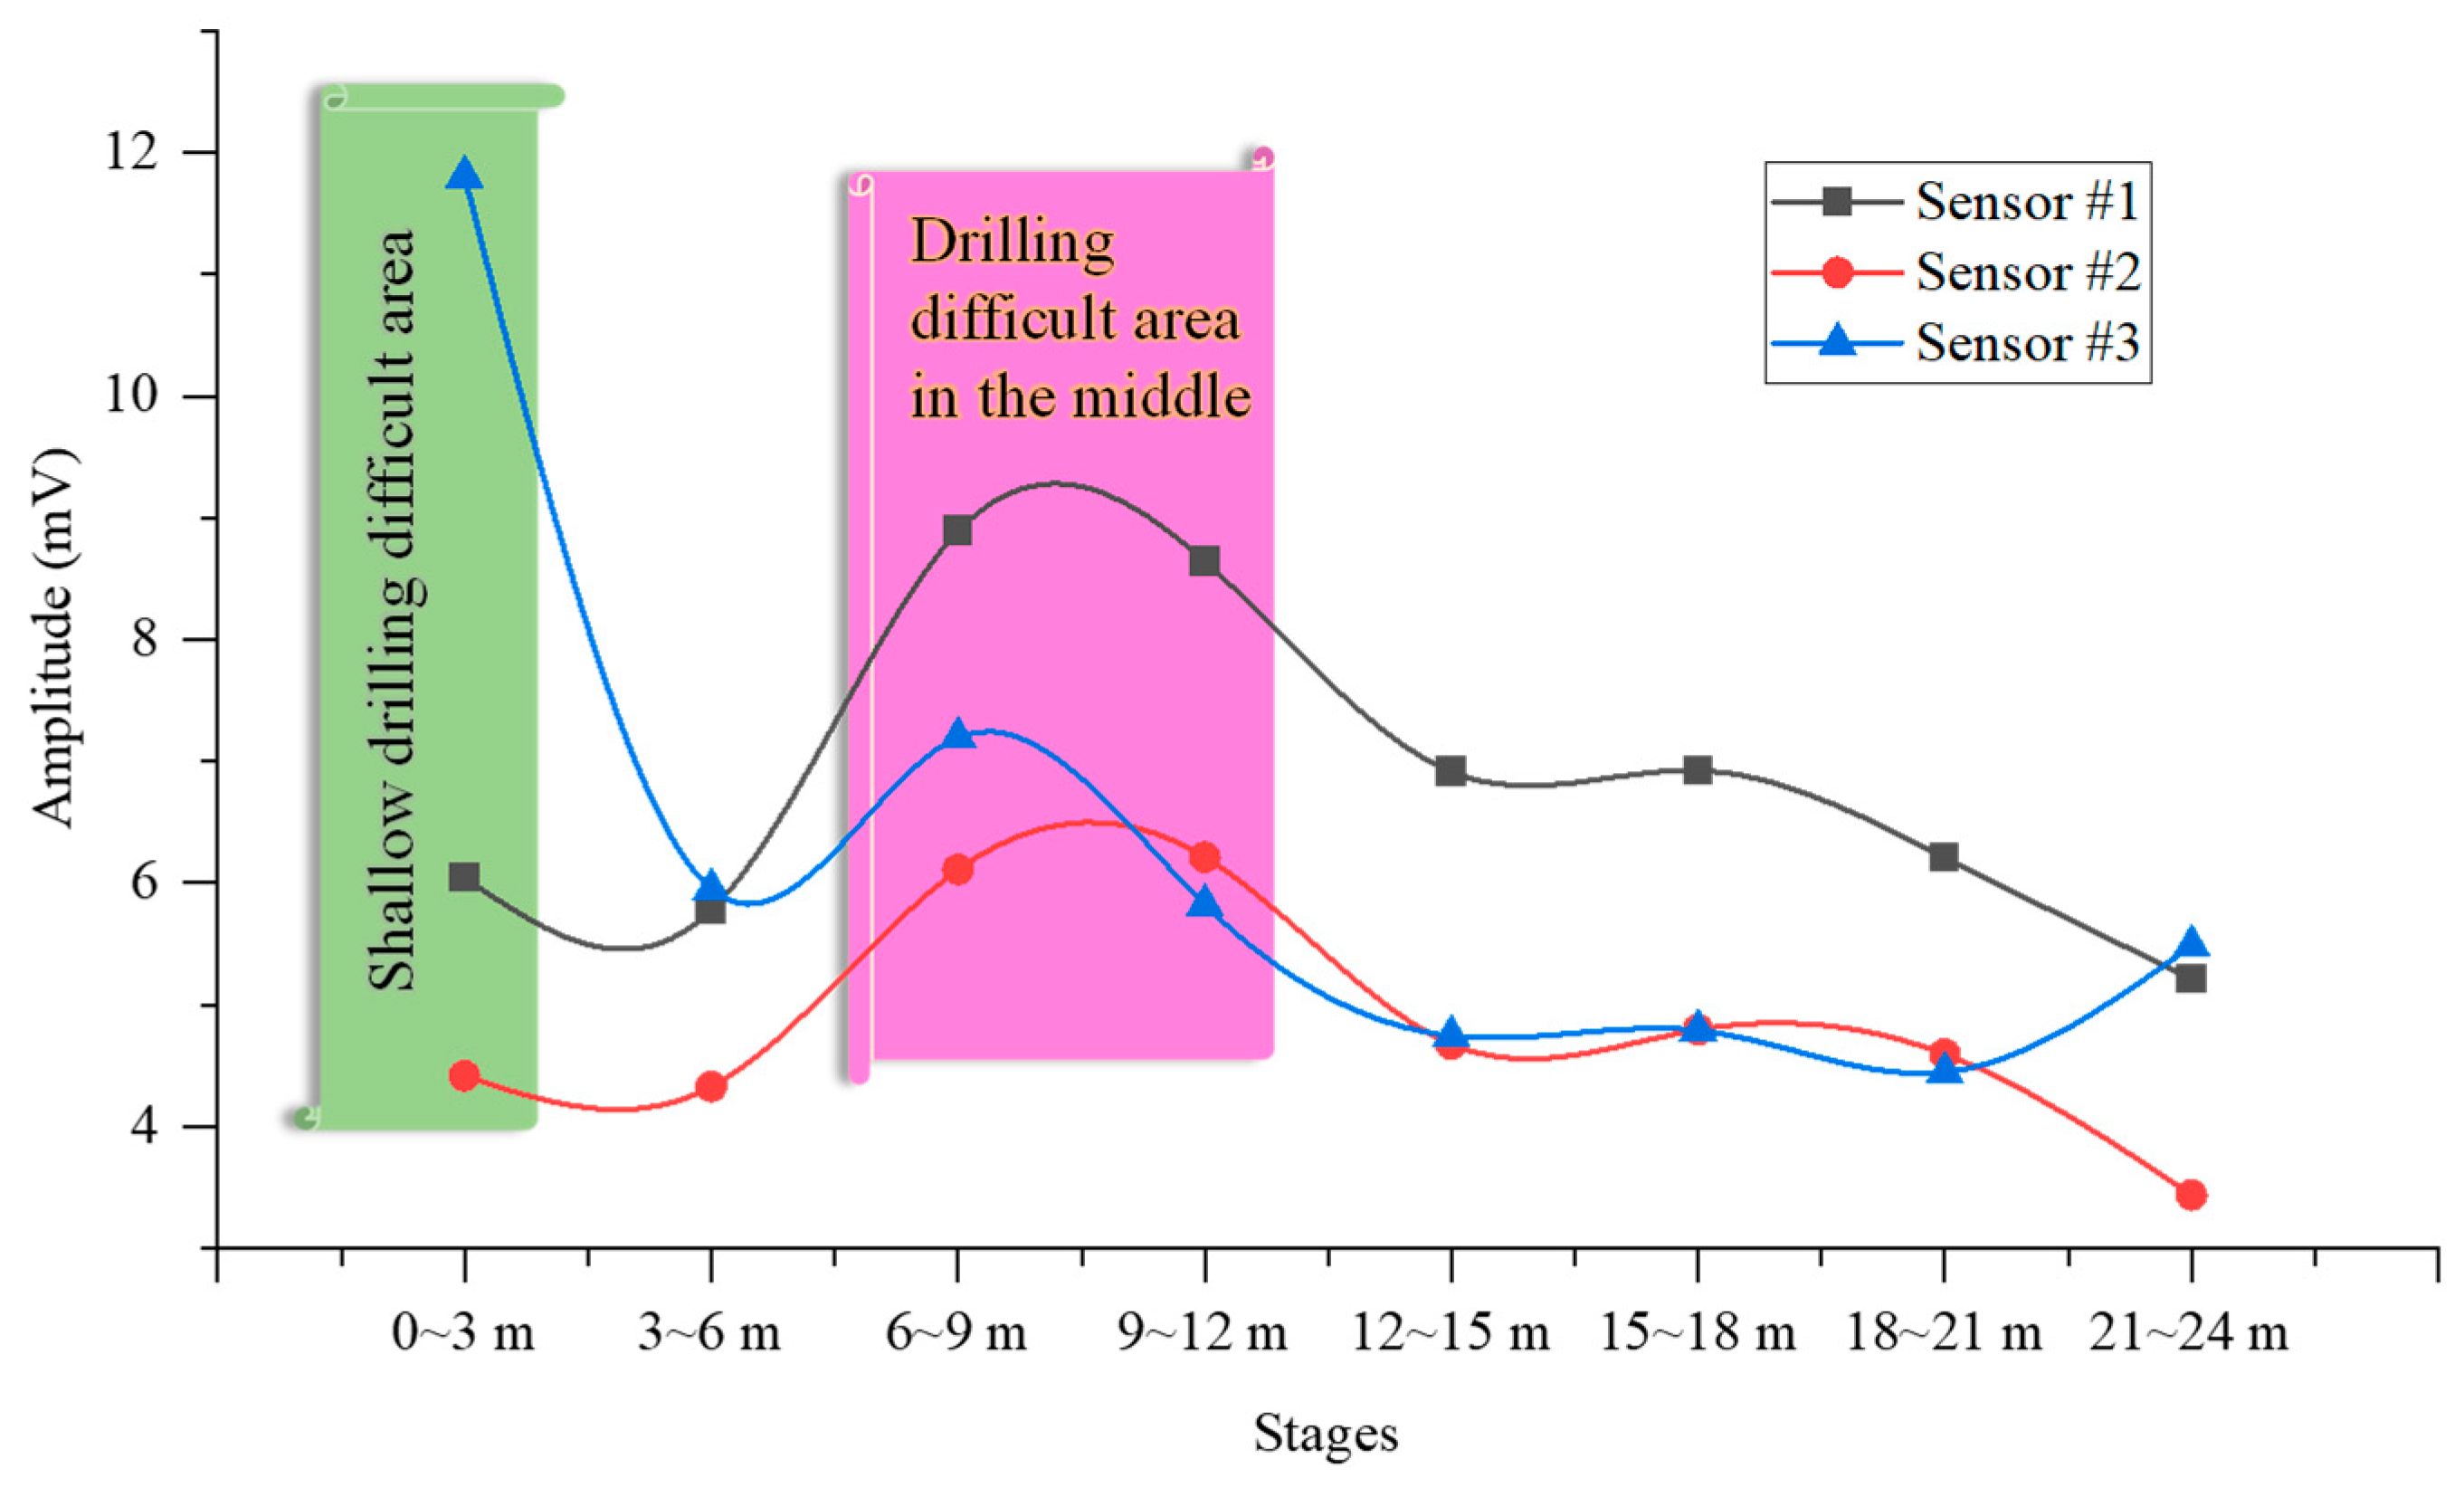
Section 3 indicated that CFEs occurred during drilling have a great influence on the normal use of the innovative external MWD method, and a large number of CFEs would cover up the characteristic of useful amplitude cluster, which results in the fuzzy judgment of drilling depth, while the MWD method can still clearly reflect the drilling depth after removing the amplitudes of CFEs. In addition, the quantity and basic characteristics of CFEs in different depths were analyzed quantitatively. This study focused on the UPRD borehole with a large number of CFEs, so the relationship between the number of CFEs in different depths and the peak pressure (difficulty or ease of drilling) was also worth studying.
Figure 10 provided the average amplitudes of different depths, which showed that sensor #3 (sensor #3 was the most prominent among the three sensors) had a shallow drilling difficulty area of 0–3 m. Sensor #3 showed the most obvious performance among the three sensors, but this seemed to be inconsistent with the correlation between the sensor and the drilling position, and the changing trend of sensor #3 was inconsistent with the other two sensors. The reason may be the non-uniformity of vibration propagation or equipment reasons, but it can still be seen that there was a certain difficulty in shallow drilling. The peak pressure appeared at 6–9 m and 9–12 m; the results were basically consistent with the peak values of CFEs of 6–9 m, 9–12 m, and 12–15 m. The consistency between CFEs and pressure distribution may indicate that under high pressure, the coal around the borehole was more prone to rupture and emit stress waves and sounds, which was consistent with conventional understanding. From a fractal perspective, high-pressure zones exert significant external forces on rocks. When the drill bit cut through this part of the rock, small fractures were more likely to occur and tend towards homogenization, resulting in the production of more CFEs.
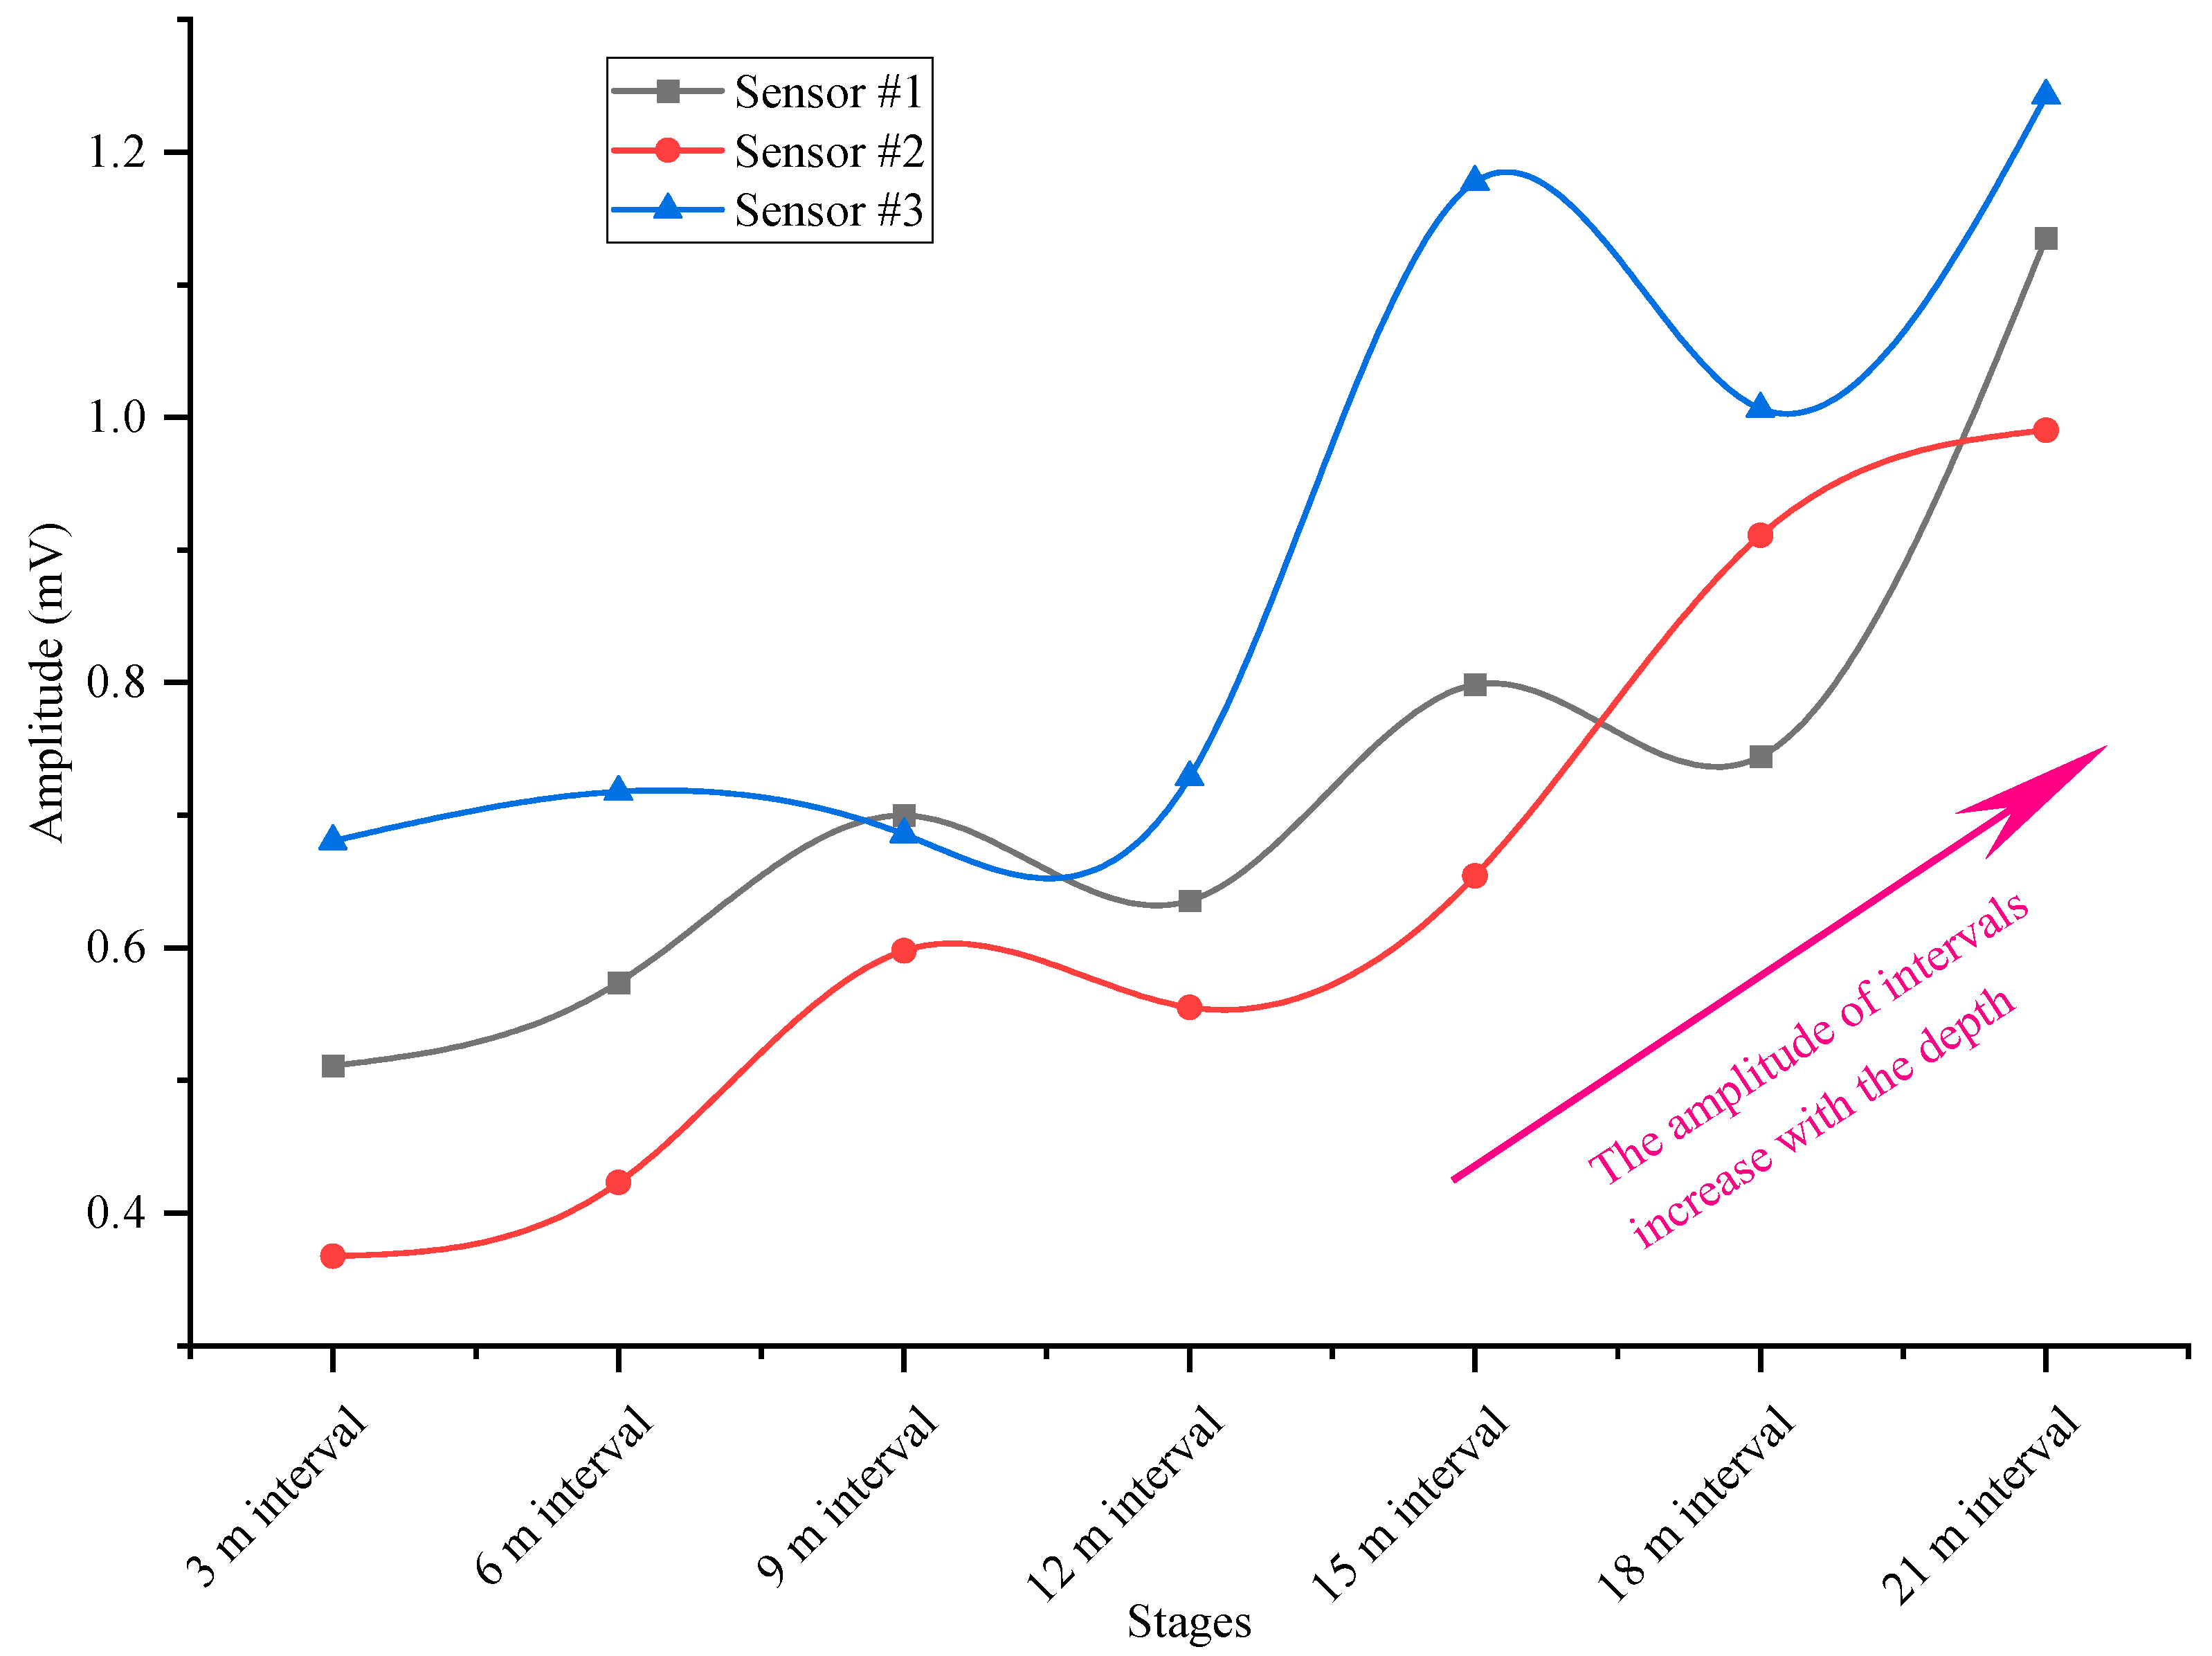
Compared with the peak amplitude phenomenon in the drilling process, the amplitude curve of the interval process showed a unilateral upward trend, as denoted in
Figure 11. The friction between the drilling pipe and the drilling bit was greater in the deeper part of the interval, which led to the situation that the greater the depth, the greater the amplitude. The result was in line with common sense, and the three sensors showed the same phenomenon, which further confirmed the correctness. The amplitude changes of the drilling and interval process reflected the peak phenomenon and unilateral upward phenomenon, respectively; however, the peak number of CFEs at different depths was not consistent with previous studies [
7,
12]. The main reason may be that the number of CFEs in previous boreholes was too small, resulting in the fact that study samples could not correctly reflect the real situation. It should also be noted that although the trends of the three sensors followed the rules, the amplitude relationship between the three sensors did not conform to theoretical understanding, which may be related to the spacing between the three sensors and the non-uniformity of the medium. The above amplitude changes regarding the drilling process and interval process indicated that after removing the influence of CFEs, previous external MWD methods were still applicable. Especially when the amplitude of CFEs is large, its influence should be removed first, and then the amplitude of the remaining signal should be counted as the basis for subsequent analysis. In addition, combined with the results in
Figure 7, it could be seen that the distribution pattern of CFEs in the drilling interval area was basically the same as that in the drilling area and did not increase with the increase in deep drilling difficulty (as in
Figure 11), indicating that the generation of CFEs may not be related to frictional resistance but is more likely to be related to surrounding rock pressure.
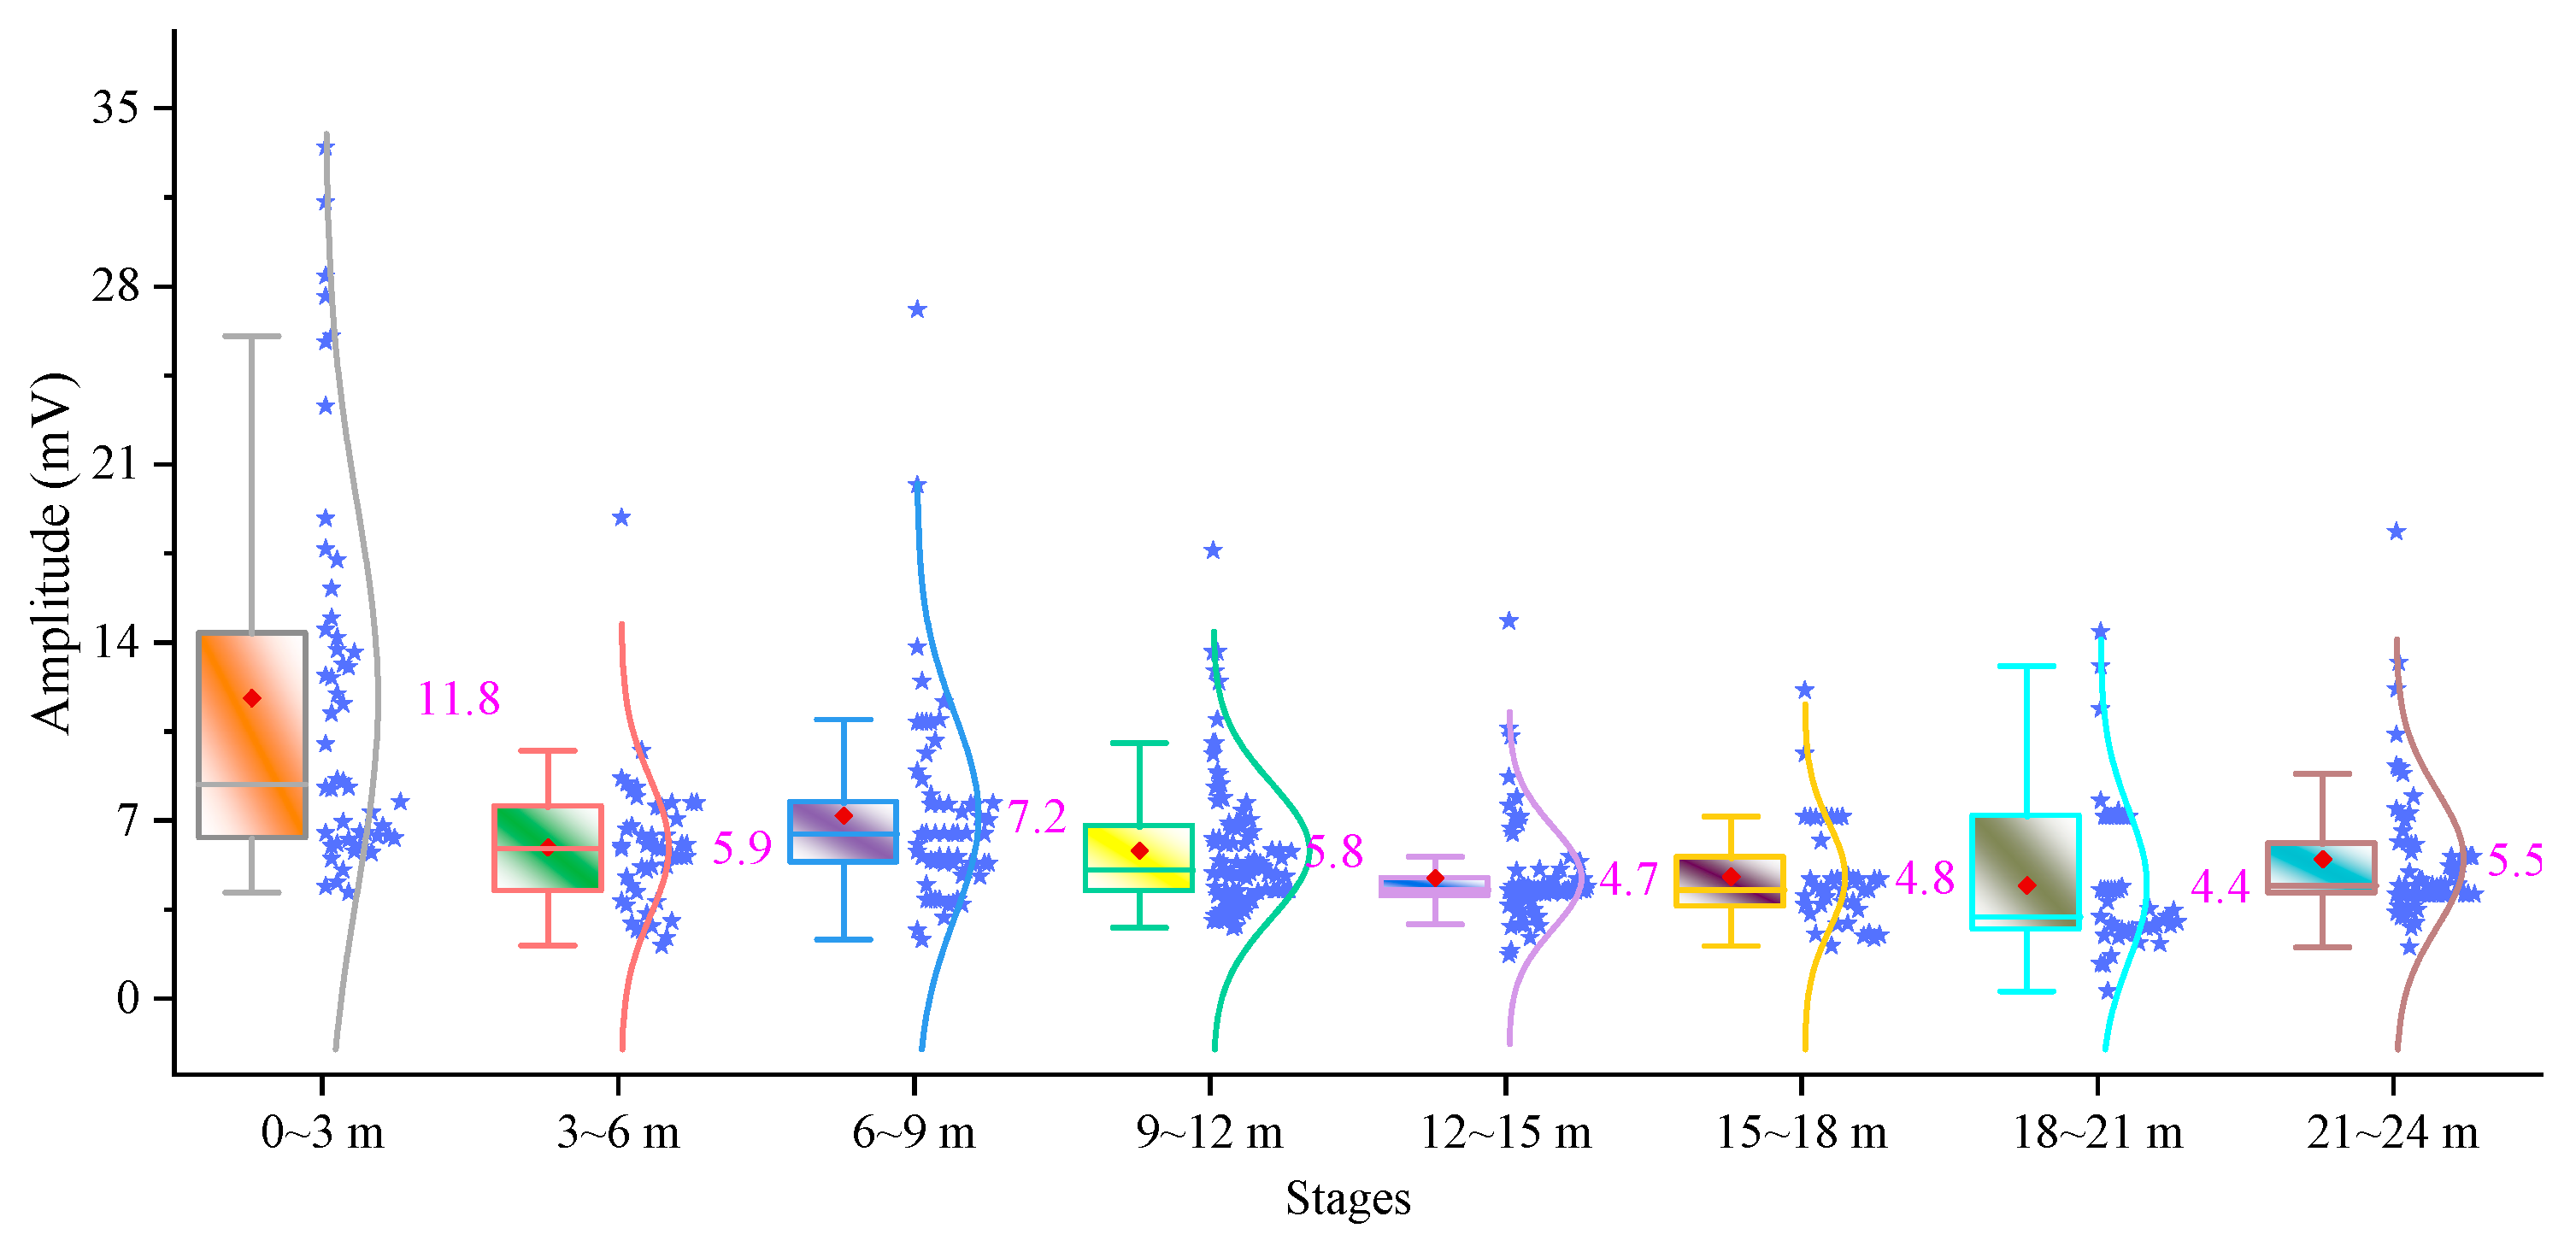
The overall statistical results of the amplitude of the drilling process and interval process were basically in line with conventional expectations, but the distribution of amplitude values within each statistical depth also needed to be studied. These could be further subdivided into different stages within each depth to reflect more detailed information. The amplitude distribution of different depths is shown in
Figure 12. The results of sensor #1 indicated that the average amplitude of shallow 0–3 m was large, and the amplitude distribution was scattered, which was directly related to the poor stability of the drilling system at the initial stage of drilling. After the shallow drilling, the drilling system gradually stabilized, and the amplitude increased at the depth of 6–9 m, but the amplitude distribution was more concentrated than that in the shallow part. There were some individual abnormal value points in different depth amplitude distributions, and the amplitude distribution range of 12–15 m was the smallest in the range of 25–75%, indicating that the drilling was the most stable at the depth. After removing the influence of CFEs, the statistical results of amplitude distribution were also basically consistent with previous understanding. Excluding the influence of shallow grinding areas (0–3 m), the average amplitude of 6–9 m reached 7.2 mV, and the average amplitudes of 3–6 m and 9–12 m were also relatively larger than those of deep areas.
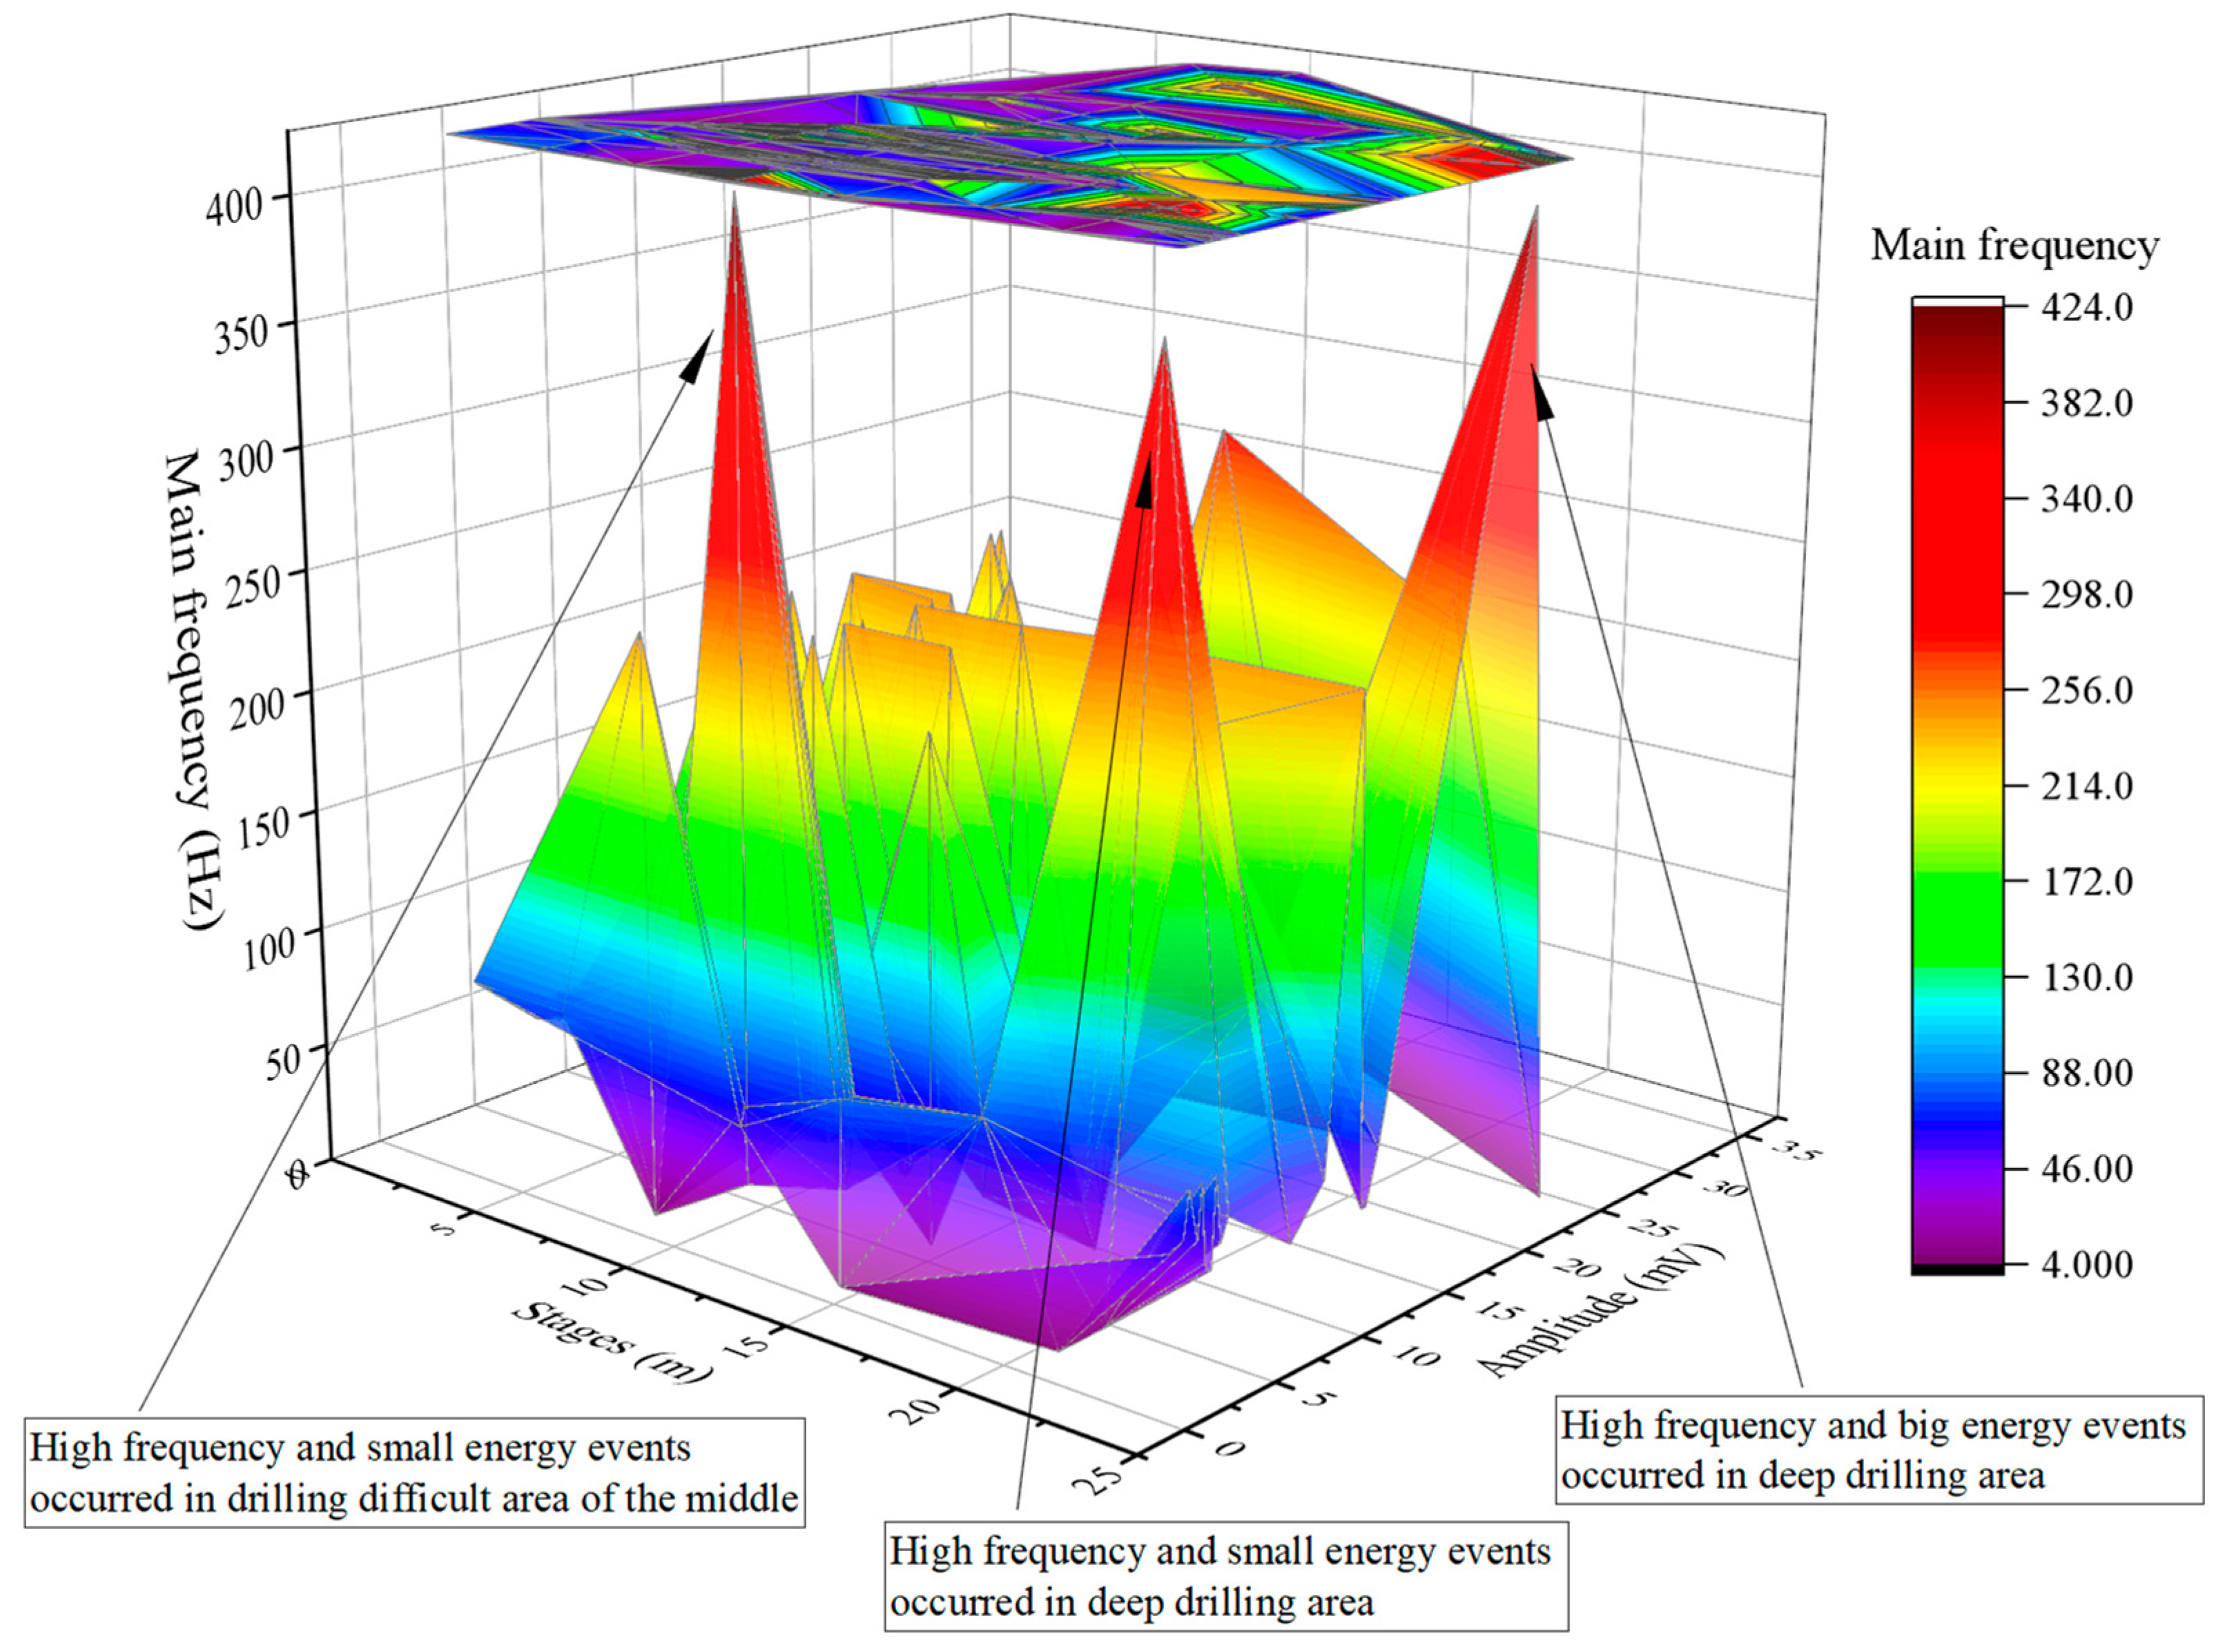
The results of the main frequency were very useful for the analysis of vibration signals, as they could reflect the components of signals at different stages and provide feedback on the complexity and frequency distribution of vibration during the drilling process. The value of the main frequency could, to some extent, reflect the size of the rupture scale. High-frequency events were generally minor ruptures, while low-frequency events were generally larger ruptures. So, the main frequencies and amplitudes of the CFEs at different stages are presented in
Figure 13. Results showed that the main frequency of different amplitudes in the shallow drilling area was low, but some high frequency and small energy events occurred in drilling difficult areas of the middle (mainly at 6–9 m, which was the peak pressure area with more CFEs). Some high-frequency events also occurred in deep drilling (21–24 m), but the events contained both small energy and large energy events. Combined with the results of CFE number distribution, the number of CFEs in the middle was obviously the largest, which indicated that the large number of CFEs contained some high-frequency events. The number of CFEs was also as large as 32 for the 21–24 m depth and similarly contained some high-frequency events. The above facts indicated a preliminary conclusion that the depths with more CFE occurrence were more likely to produce high-frequency events. From the above performance, it could be inferred that areas with higher pressure were more likely to generate a larger number of fracture events with higher frequency, and these events were more likely to be similar to each other than low-frequency events, jointly driving the formation of more CFEs in surrounding rocks. The results of both low-frequency and high-frequency events in the deep region indicated that the deep region may be greatly affected by high frictional resistance, which not only promoted the generation of high-frequency CFE but also gathered more low-frequency components for rupture.
In this paper, the applicability of an innovative external MWD method for UPRD boreholes with a large number of CFEs was studied, and after removing the influence of CFEs, the amplitude and frequency changes of subsequent drilling and interval stages were statistically analyzed, which were then compared with the distribution of CFEs. Results showed that the amplitude of CFEs covered the original amplitude cluster characteristics. In this case, the amplitudes of CFEs should be removed first to get the drilling depth and subsequent pressure distribution. After removing the influence of CFEs, the useful indicators were still effective, and the effect after removal was basically the same as previous monitoring results. The characteristics of drilling amplitudes, waveform characteristics, and main frequencies of CFEs were also analyzed. With the help of statistical data on the amplitude, pressure, and main frequency distribution of CFEs, the generation mechanism and aggregation characteristics of CFEs were inferred from a fractal perspective. Although the MWD method was still applicable after removing CFEs, it was difficult to completely select CFEs through the algorithm, so the manual selection method was adopted in the study, and the accuracy of CFE selection should be further improved through the algorithm in the future.


