Abstract
In recent years, fatigue cracking in orthotropic steel bridge deck pavements has become a significant concern, so the investigation of the mechanical response of the pavement layer has become a central focus in pavement structure design. This experiment subjected a full-scale specimen to a constant amplitude dynamic load of 60 kN to 300 kN over 2 million cycles. Throughout the testing, a circulating water bath elevated the temperature of the pavement layer from 15 °C to 50 °C. Key locations were monitored for strain and deflection data, facilitating an investigation into the mechanical response of the epoxy asphalt pavement system under the effects of temperature and load. The results indicate that the maximum transverse strain at the bottom of the steel deck occurs at the U-rib weld aligned with the load center, reaching 190% of the initial loading strain. Meanwhile, the maximum transverse strain on the pavement surface is observed at the U-rib weld adjacent to the loaded area, measuring 167% of the initial strain. The maximum longitudinal strain is lower than the maximum transverse strain. In the load zone, the longitudinal strain between the U-ribs exceeds that at the U-rib weld. Both transverse strain and relative deflection increase as the load intensifies. The relationship between transverse strain and applied load is characterized by an exponential function, while deflection exhibits a cubic relationship with the applied load. Elevated temperatures also contribute to increased transverse strains at both the bottom of the steel deck and the pavement surface, following an exponential trend. Relative deflection is primarily influenced by the applied load and remains relatively unaffected by temperature variations. When accounting for the coupling of load and temperature, the maximum transverse strains at both the bottom of the steel deck and the pavement surface can be modeled as an exponential function of the independent variables: load and temperature.
1. Introduction
Since the 21st century, orthotropic steel bridges (OSBs) have been widely used in large-span bridge engineering [1,2,3]. Epoxy asphalt concrete (EAC), as a primary paving material, has also garnered significant attention from researchers [4]. The EAC used in steel bridge decks is typically classified based on construction temperature into warm-mix epoxy asphalt concrete (WEAC) and hot-mix epoxy asphalt concrete (HEAC) [5]. WEAC is mixed at temperatures ranging from 110 °C to 121 °C, whereas HEAC is mixed at temperatures ranging from 165 °C to 190 °C. Initially, WEAC was the predominant paving material. Now, HEAC is more widely used in China due to its superior high-temperature stability, low-temperature crack resistance, and ability to accommodate steel plate deformation [6,7]. In the past two decades, the dramatic increase in traffic loads has exacerbated the issue of fatigue cracking in EAC steel bridge deck pavements. To address this problem, studying the mechanical properties of the pavement layer has become increasingly important. Researchers both domestically and internationally have conducted numerous studies on the mechanical properties of EAC steel bridge pavements [8,9,10,11]. However, most of this research has focused on the mechanical properties of EAC and the pavement performance of the EAC layer, with relatively little research on the overall stress characteristics of steel bridge pavements.
At present, the methods of analyzing the stress of steel bridge deck pavement mainly include finite element simulation and laboratory scale tests [12]. However, finite element analysis often fails to accurately reflect real conditions, and scale tests are subject to size effects that do not adequately capture the behavior of actual structures [13]. Therefore, more and more researchers agree that loading tests on full-scale structures more accurately reflect the long-term stress characteristics and deformation laws in steel bridge deck pavements [14]. However, the full-scale tests are costly and time-consuming, and studies on the mechanical properties of steel bridge deck pavement systems using this method remain limited.
The origins of full-scale testing can be traced back to the test road in Detroit in 1909 [15]. Since then, this method has been increasingly applied to the study of OSB pavement systems. Terada, H. et al. [16] investigated the durability of steel fiber reinforced concrete (SFRC) by conducting cyclic static fatigue tests on full-scale sections of SFRC composite steel decks. Ye, H. et al. [17] fabricated full-scale SFRC composite steel decks based on the design of Yibin Bridge, monitored the strain at the U-rib notches and welds in the static load-bearing area, and established a numerical model to study the stress reduction effects of pavement layers with varying thicknesses.
Shi J. et al. [18] conducted a high-temperature accelerated loading test on a full-scale section of the asphalt pavement layer based on a typical bridge. They monitored the rutting depth, uplift area, and depression area over different loading durations, evaluated rutting development, and established a rutting depth model. Anupam K. et al. [19] conducted cyclic static load tests on two full-scale PA + GA pavement steel bridge sections featuring different bonding layers. By testing the tensile strain and horizontal displacement between layers under different loading speeds and loads, the team found the influence of loading speed and load on the interlayer bonding force.
Wei C. et al. [20] conducted a full-scale fatigue loading test on a steel bridge featuring reinforced high-performance concrete (UHPC) pavement. This study examined the deformation and cracking behavior of the reinforced UHPC composite bridge deck pavement under load. Shi Z. et al. [21] designed a full-scale orthotropic steel-UHPC composite deck specimen for cyclic loading fatigue tests and found that the U-rib butt panel and the U-rib butt weld were the most susceptible to fatigue.
Chen, F. et al. [22] performed an accelerated loading test on a full-scale section of the epoxy resin system steel bridge deck pavement, assessing rut depth, water permeability coefficient, and friction coefficient. Following 2.05 million loading cycles, no cracks were observed on the pavement surface, and it demonstrated excellent anti-rutting performance. Li, H. T et al. [23] first introduced the OSB ‘EA + GA’ pavement structure in China. This study monitored longitudinal strain above the diaphragm and transverse strain above the stiffener of a full-scale structure across three distinct loading positions. The analysis identified the most unfavorable loading position, concluding that the transverse strain is the primary factor influencing the ultimate strain of the pavement layer. Most existing studies primarily focus on the mechanical properties and road performance of materials, leaving a gap in the research concerning the overall mechanical response characteristics of pavement systems. Furthermore, investigations into the mechanical response of the OSB pavement system that account for the coupling effects of temperature and load are scarce. While full-scale tests involve the primary OSB pavement structure, there remains a significant deficit in research exploring the application of full-scale tests to EAC steel bridge deck pavements.
This experiment is the first to integrate a heating device for the pavement in full-scale fatigue loading tests, allowing for the study of the mechanical response of HEAC steel bridge deck pavements under the coupled effects of temperature and load. Moreover, an orthogonal experimental approach was utilized for the first time to analyze and derive the expression for the maximum strain value of the pavement system. This research addresses the gap in full-scale experimental studies on the mechanical response of EAC steel bridge deck pavements. Additionally, it provides valuable experimental data for evaluating the fatigue life of HEAC steel bridge deck pavements and serves as a foundational document for studying fatigue cracking in EAC paving layers.
2. Materials and Methods
2.1. Raw Materials
The mineral powder and aggregate for this test were sourced from a factory in Nanjing. The aggregate consists of basalt with specifications of 9.5–13.2 mm, 4.75–9.5 mm, 2.36–4.75 mm, 0.6–2.36 mm, and 0–0.6 mm, marked as No.1, No.2, No.3, No.4, and No.5, respectively. The asphalt utilized is 70# matrix asphalt. The epoxy resin consists of a main agent A and a curing agent B, mixed in a ratio of 60:40. Both the waterproof bonding layer and the bonding layer of the paving are composed of second-order epoxy resin binders.
2.2. Mix Proportion and Specimen Making
2.2.1. Mix Proportion Design
This full-scale test was based on the deck pavement maintenance project of a representative bridge, and the mix ratio used in the test was selected from the HEAC mix ratio employed in the maintenance project. The gradation composition of the epoxy asphalt (EA-10) concrete for the pavement layer is shown in Table 1. With an oil–stone ratio of 6.5%, the bulk specific gravity of bituminous mixtures is 2.584. Marshall stability test results are presented in Table 2.

Table 1.
EA-10 bituminous mixture gradation composition.

Table 2.
EA-10 bituminous mixture Marshall stability test results.
2.2.2. Sample Preparation
The longitudinal influence area of the load is defined as the span between two adjacent diaphragms, while the transverse impact width is approximately three times the width of the U-ribs. Based on a representative orthotropic steel bridge, the full-scale structure of the steel box girder comprised two longitudinal single-span diaphragms and five transverse U-ribs. The steel bridge model measured 4 × 3 × 0.8 m. The deck plate was 14 mm thick, and the U-rib was 300 mm wide, 280 mm high, and 8 mm thick. The material used was Q345qD bridge steel. The pavement layer employed a double-layer domestic HEAC (EA-10) structure. The upper layer had a thickness of 30 mm, the lower layer was 25 mm thick, and the bonding layer consisted of a second-order epoxy resin.
The full-scale steel box girder structure model was manufactured in the steel box girder processing workshop of China Railway Bao Qiao. The production process includes sandblasting for rust removal, strain gauge and optical fiber layout, adhesive layer application, mixture paving and leveling, and curing.
2.3. Test Procedure
2.3.1. Loading Equipment and Methods
The accelerated loading test on the full-scale section was conducted in the laboratory of the Department of Civil Engineering at Nanjing University of Aeronautics and Astronautics. The loading apparatus used was a multi-functional structural testing system, with a 300 kN servo actuator selected for the experiment. Its key technical specifications are as follows: a maximum push force of 540 kN, a maximum pull force of 334 kN, and an actuator stroke of ±200 mm. The testing equipment is illustrated in Figure 1a.
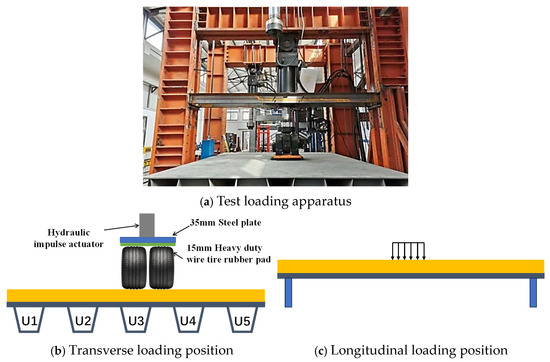
Figure 1.
Loading device and loading position.
According to the fatigue load model outlined in the Code for Design of Steel Highway Bridges (JTG D64-2015) [24], the loading area was 600 mm × 200 mm. To simulate the effect of wheel action, a 35 mm steel plate with 13 mm of tire rubber was placed under the loading apparatus. The most unfavorable position under the most adverse loading conditions was selected as the loading position. The center of transverse loading was aligned with the U-rib weld. The longitudinal loading position was situated at mid-span. The loading position is provided in Figure 1b,c.
According to Eurocode 3: Design of Steel Structures (EN 1993-1-3:2006) [25], a cyclic loading of 2 million cycles is proposed. The test is divided into two parts: the static load test and the dynamic load test. The maximum test load for the static load test is 300 Kn, and the load is applied incrementally from 0 Kn to 300 Kn. The dynamic load test utilizes a cyclic loading range of 60 Kn to 300 Kn, with a specified test loading frequency of 1.6 Hz.
Before the test began, a pre-loading procedure was conducted, utilizing a static loading method that incrementally increased the load from 0 Kn to 300 Kn and then subsequently unloaded it in a stepwise manner. After the pre-loading, a static load test was performed, with a maximum test load of 300 Kn. Following the initial static load test, the dynamic load test commenced, employing a constant amplitude fatigue load ranging from 60 Kn to 300 Kn as the control method for cyclic loading. During the fatigue loading process, a static load test was required once per day. Prior to each static load test, the fatigue loading was halted, and the load position was maintained constant for the static loading test.
2.3.2. Test Temperature Control
To investigate the influence of temperature on the mechanical response of the pavement system, the pavement layer’s temperature was modified using a circulating water bath. The water bath heated at a rate of approximately 2 °C/h, while the pavement layer achieved a heating rate of about 0.4 °C/h. The temperature of the pavement layer increased from 15 °C to 50 °C through the heating of the circulating water bath.
The test commenced loading at a pavement temperature of 15 °C. After approximately 24,074 load cycles, the pavement layer was heated using a circulating water bath. During the test, the pavement surface reached a maximum temperature of 50 °C after approximately 528,800 load cycles. Subsequently, the temperature of the pavement surface remained constant at 50 °C until the conclusion of the test. The water bath heating device is shown in Figure 2.
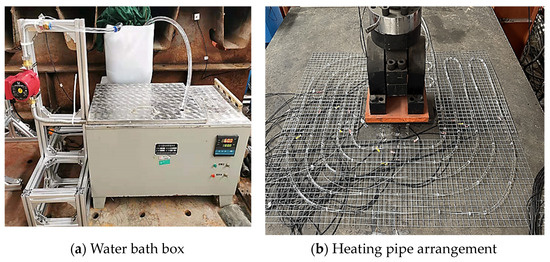
Figure 2.
Water bath circulating heating device.
2.3.3. Test Monitoring Scheme
Monitoring points were arranged in the transverse and longitudinal directions of the key components of the full-scale structure, and sensors were installed accordingly. The primary mechanical indices monitored included the strain at the bottom of the steel bridge deck, the strain on the surface of the steel bridge, the strain on the pavement surface, as well as the relative deflection and absolute displacement. Data collected by the sensors were recorded using the TST3826F-L dynamic and static signal test instrument.
Figure 3 illustrates the configuration of the monitoring points. As illustrated in Figure 3a–c, the transverse bridge strain monitoring points are positioned at the mid-span in the following locations: the butt weld between the U-rib and the steel bridge deck, between two adjacent U-ribs, and inside the U-rib. As shown in Figure 3d, the longitudinal bridge strain monitoring points are arranged at the diaphragm, 1/4 span, 3/8 span, and 1/2 span. The relative deflection monitoring points in the transverse direction are arranged between two adjacent U-ribs and inside a U-rib, as shown in Figure 3e. The absolute displacement monitoring points in the transverse direction are arranged at the following positions in the middle of the span: the butt weld between the U-rib and the steel bridge deck and between two adjacent U-ribs, as shown in Figure 3f.
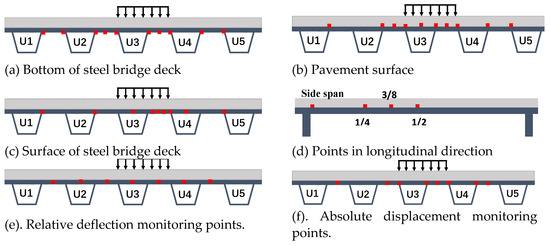
Figure 3.
Layout of monitoring points.
3. Results and Discussion
3.1. Mechanical Response of Static Load Test
3.1.1. Strain at Bottom of Steel Bridge Deck
Figure 4a illustrates the transverse strain distribution at the bottom of the steel bridge deck under a 300 kN static load applied at mid-span during various loading stages. The positive axis in the figure represents tensile strain, while the negative axis represents compressive strain. This rule applies to all subsequent figures involving strain. The figure shows that the transverse strain distribution at the bottom of the steel bridge deck remains largely consistent across different loading stages. The transverse strain value increases as the number of loading cycles rises. The maximum transverse compressive strain occurs where the load center aligns with the U-rib weld, reaching 816 με, an increase of 529 με from the initial loading, corresponding to a 190% rise. Additionally, the maximum tensile strain, located between two U-ribs in the load zone, reaches approximately 643 με, representing a 273 με increase, or 74%, compared to the first loading. These results indicate that the most critical stress point at the bottom of the steel bridge deck is where the load center aligns with the U-rib weld. There are two primary reasons for this result. First, the geometric shape mutation or welding defects at the weld will lead to stress concentration, which makes the strain at the weld increase significantly. Second, the residual stress generated during the welding process will also accumulate at the weld, resulting in an increase in the strain in this area.
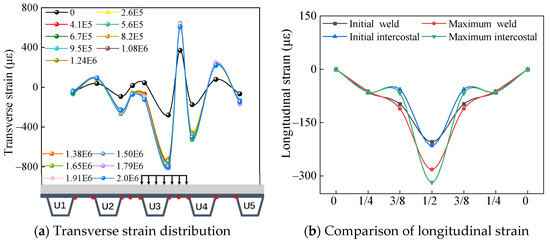
Figure 4.
Strain distribution at the bottom of steel bridge deck.
Figure 4b depicts the distribution of longitudinal strain at the bottom of the steel bridge deck, along the longitudinal direction of both the weld in the load area and the center of the U-ribs in the load zone. The longitudinal strain at the bottom of the steel bridge deck is compressive and tends to increase with loading. The maximum longitudinal compressive strain occurs at mid-span and gradually decreases toward the two side spans, exhibiting a symmetrical distribution. This is due to the uneven stress distribution within the steel plate during the loading process. The stress is greatest near the loading point, while it gradually decreases with increasing distance from that point. This distribution results in strain inhomogeneity; specifically, the strain near the loading point is larger, whereas the strain further away is smaller.
Comparing the longitudinal strain values at the weld and between the two ribs within the load zone, as shown in Figure 4b, the maximum longitudinal compressive strain at the weld is approximately 281 με, which is 104 με higher than that observed during the initial static loading, reflecting a 49% increase. The maximum longitudinal compressive strain between the two ribs is approximately 318 με, also 104 με higher than that observed during the initial static loading, reflecting a 49% increase. The test results indicate that the maximum longitudinal compressive strain at the bottom of the steel bridge deck occurs at the location between the U-ribs in the mid-span load zone. U-ribs enhance the stiffness of the steel bridge deck. During loading, the additional stiffness provided by the U-shaped ribs amplifies the strain in the surrounding areas, leading to the maximum strain occurring between the adjacent U-ribs.
In summary, the maximum transverse strain at the bottom of the steel bridge deck is compressive strain, with a value of 816 με, which is 2.6 times greater than the maximum longitudinal strain. This also validates previous research that transverse strain is a key parameter for evaluating the stress at the bottom of the steel bridge deck [26,27].
3.1.2. Strain on the Surface of Steel Bridge Deck
Figure 5a illustrates the transverse strain on the surface of the steel bridge deck at different loading stages. The data indicate that the surface of the steel bridge deck primarily exhibits tensile strain. The maximum transverse tensile strain occurs at the weld in the load zone, measuring approximately 4873 με. This maximum strain represents an increase of 4339 με, corresponding to an 800% increase compared to the initial static loading. Before reaching 1.38 million cycles of loading, the transverse strain remains relatively stable at about 800 με. However, at the beginning of 1.5 million cycles, the lateral tensile strain increases significantly by 1877 με, reflecting a 234% increase compared to 1.38 million cycles. Subsequently, the maximum transverse strain gradually increases with additional loading, ultimately reaching its peak value. As described in previous research, this phenomenon can be attributed to the uneven distribution of transverse and longitudinal stiffness, which results in pronounced local effects on the steel bridge deck under load [28]. The EAC pavement can distribute stress, reduce stress concentrations, and contribute to the overall stiffness of the steel plate. After 1.38 million cycles of loading, reduction in pavement layer strength leads to a reduction in its stiffness contribution and an increase in local stress concentrations in the steel bridge deck.
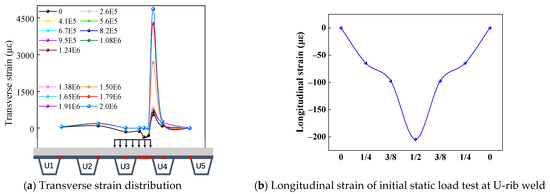
Figure 5.
Strain distribution on the surface of steel bridge deck.
Due to the failure of the strain gauge monitoring the longitudinal strain on the steel bridge deck, only the longitudinal strain distribution at the central weld of the load zone was recorded following the initial static load. As shown in Figure 5b, the longitudinal strain on the steel bridge surface is compressive, with the maximum value occurring at mid-span. The maximum compressive strain reaches 300 με, approximately 0.56 times the maximum transverse tensile strain.
3.1.3. Strain of Pavement Surface
Figure 6a illustrates the transverse strain distribution of the pavement surface at the mid-span. It can be seen that the transverse strain remains consistent across different loading stages. The strain distribution is unaffected by the number of load cycles. However, the strain value increases with the increasing number of loading cycles. The maximum transverse tensile strain occurs at the aligned U-rib weld adjoin the load zone, measuring approximately 1848 με. This maximum tensile strain represents an increase of 1131 με compared to the initial static load, indicating a rise of 167%. The maximum tensile strain of the pavement surface is the primary cause of longitudinal cracking in the pavement layer and serves as the most critical mechanical index for this layer. Additionally, the maximum transverse compressive strain of the pavement surface is about 512 με, symmetrically located on both sides of the load center weld. Compared to the initial static load, this compressive strain increased by 447 με, which is nearly a ninefold increase. With continuous loading, the pavement layer at the load center weld gradually transitions from compression to tension due to the reverse stress from the U-rib. When the U-rib is subjected to loading, it experiences deformation. This deformation is transmitted through the weld to the pavement layer, causing the pavement layer to be affected. As the load increases, the U-rib may experience reverse deformation, causing the pavement layer, initially under compressive stress, to gradually shift to tensile stress. This occurs because the deformation of the U-rib can induce a local warping effect, altering the stress distribution at the weld. In the early stages of loading, due to the high stiffness of the pavement layer, the resulting stress is primarily compressive. However, as stress concentration increases at the weld, reverse torque may develop, leading to a transition from compressive stress to tensile stress.
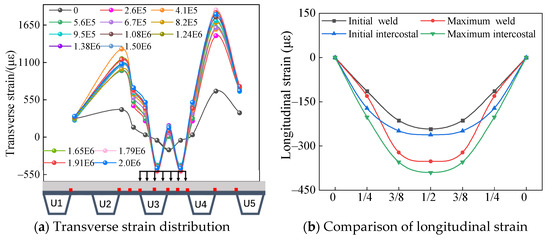
Figure 6.
Strain distribution at the pavement surface.
As illustrated in Figure 6b, the longitudinal strain on the pavement surface is compressive and smaller than the transverse strain, gradually increasing as the number of load cycles rises. The maximum longitudinal strain on the pavement surface occurs at the mid-span; this finding is consistent with the conclusions of Academician Huang Wei [29]. In addition, the experiment revealed that the strain gradually decreased toward the side spans and displayed a symmetrical distribution. The maximum longitudinal compressive strain at the weld is approximately 352 με, which is 109 με higher than the initial static load, representing a 45% increase. Similarly, the maximum longitudinal compressive strain between the ribs reaches around 369 με, 137 με higher than the initial static load, reflecting a 60% increase. The maximum longitudinal strain on the pavement surface occurs at the mid-span, located in the center of the U-ribs within the loading area.
3.1.4. Relative Deflection and Absolute Displacement
Figure 7a illustrates the relative deflection distribution of the mid-span of the steel bridge under different loading stages. The positive axis in the figure denotes the upward direction of the relative deflection, while the negative axis indicates the downward direction. This convention is applied consistently across all figures depicting relative deflection throughout this manuscript. The deflection distribution remains consistent across these stages, with the value of deflection increasing progressively as the load increases. Due to the reinforcing effect of the U-ribs on the steel bridge, the maximum relative deflection occurs between the two U-ribs in the loaded area. The peak relative deflection reaches 1.74 mm, directed downward, which is 0.83 mm higher than that observed under the initial static load, representing a 91% increase. The relative deflection between the two U-ribs in the load area serves as a critical mechanical indicator for assessing the deformation of the bridge deck pavement.
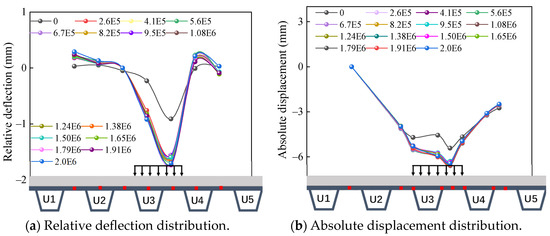
Figure 7.
Deformation law of pavement system.
Figure 7b illustrates the absolute displacement distribution across the mid-span of the steel bridge at various loading stages. The positive axis in the figure indicates the upward direction of absolute displacement, while the negative axis represents the downward direction. This convention is consistently applied to all figures illustrating absolute displacement throughout this manuscript. The data indicate a generally consistent displacement pattern across different loading conditions. Notably, the absolute displacement in the loaded area is significantly greater than in the non-loaded area. This suggests that the load is the primary factor contributing to pavement deformation. The maximum absolute displacement of 6.58 mm, directed downward, occurs at the midpoint between the two U-ribs within the load zone. Compared to the initial static loading displacement of 5.48 mm, this represents an increase of 1.1 mm, or approximately 20%.
3.2. Mechanical Response of Dynamic Load Test
3.2.1. Transverse Strain at the Bottom of Steel Bridge Deck
Figure 8 illustrates the transverse strain distribution at the bottom of the steel bridge deck under a 300 kN static load and a 300 kN dynamic load, applied over 260,000 and 1.91 million load cycles, respectively. The figure shows that the transverse strain distribution trend is similar for both loading conditions; however, the strain induced by static loading is greater than that induced by dynamic loading. This suggests that while the form of loading does not affect the distribution trend, it significantly influences the magnitude of the strain.
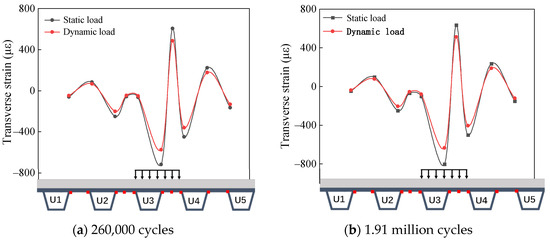
Figure 8.
Comparison of transverse strain at the bottom of steel bridge under dynamic and static loads.
Figure 8a shows that after 260,000 cycles, the maximum transverse compressive strain observed under dynamic loading is approximately 485 με, which is about 0.81 times the maximum strain recorded under static loading. Figure 8b shows that after 1.91 million cycles, the maximum transverse compressive strain under static loading is approximately 575 με, roughly 0.8 times the maximum strain observed during dynamic loading. In summary, the mechanical response distribution for dynamic and static loading is consistent under identical loads, and the strain induced by static loads is greater than that caused by dynamic loads. The transverse strain at the bottom of the steel bridge deck resulting from dynamic loading is approximately 0.8 times that of the strain observed under static loading.
3.2.2. Transverse Strain of Steel Bridge Deck Surface
Figure 9 illustrates the transverse strain distribution on the surface of the steel bridge deck resulting from both a 300 kN dynamic load and a 300 kN static load after 260,000 cycles and 1.91 million cycles of loading.
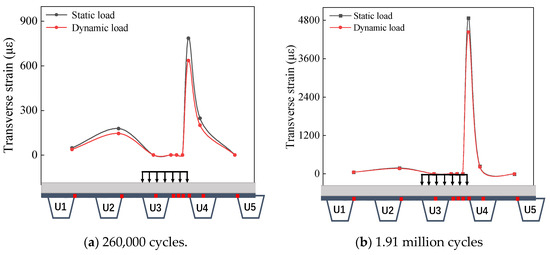
Figure 9.
Comparison of transverse strain at the surface of steel bridge under dynamic and static loads.
Figure 9a shows that the maximum transverse tensile strain on the surface of the steel bridge deck reaches approximately 706 με under 260,000 cycles of dynamic loading, which is about 0.9 times the maximum tensile strain observed under static loading. Figure 9b indicates that the maximum tensile strain produced by the dynamic load is approximately 4434 με, which is about 0.91 times the maximum tensile strain under static load. In summary, when subjected to the same load, the transverse strain on the surface of the steel bridge deck generated by the dynamic load is approximately 0.9 times that produced by the static load.
3.2.3. Transverse Strain of Pavement Surface
Figure 10a,b illustrates the transverse strain distribution of the pavement surface caused by a 300 kN dynamic load and a 300 kN static load after 260,000 cycles and 1.91 million cycles of loading.
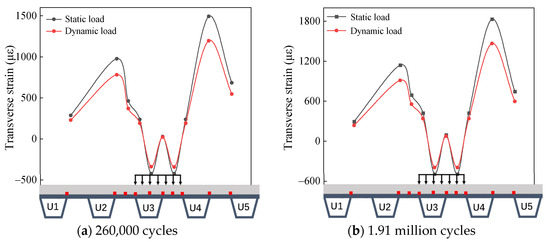
Figure 10.
Comparison of transverse strain at the pavement surface under dynamic and static loads.
Figure 10a shows that the maximum transverse tensile strain on the pavement surface is approximately 1194 με under 260,000 cycles of dynamic loading, which is about 80% of that observed under static loading. Figure 10b shows that the maximum transverse tensile strain induced by dynamic loading is approximately 1465 με, which is about 0.8 times the maximum transverse tensile strain resulting from static loading. In summary, under identical loading conditions, the transverse strain of the pavement surface generated by dynamic loading is approximately 0.8 times that of static loading.
3.2.4. Relative Deflection and Absolute Displacement
Figure 11a,b depicts the relative deflection distribution resulting from a 300 kN dynamic load and a 300 kN static load applied over 260,000 and 1.91 million cycles, respectively.
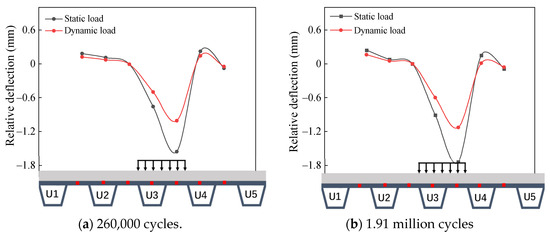
Figure 11.
Comparison of relative deflection under dynamic and static loads.
Notably, under the same load level, the trends in relative deflection distribution generated by dynamic and static loading are consistent. Figure 11a shows that the maximum relative deflection caused by dynamic loading is approximately 0.22 mm, while the maximum relative deflection from static loading is about 0.14 mm. Figure 11b illustrates that at 1.91 million cycles, the maximum deflection caused by dynamic loading is approximately 0.25 mm, while the maximum deflection resulting from static loading is about 0.16 mm. In summary, under identical loading conditions, the relative deflection generated by the dynamic load is approximately 0.64 times that of the static load.
Figure 12a,b depicts the absolute displacement distributions resulting from a 300 kN dynamic load and a 300 kN static load after 260,000 and 1.91 million load applications, respectively.
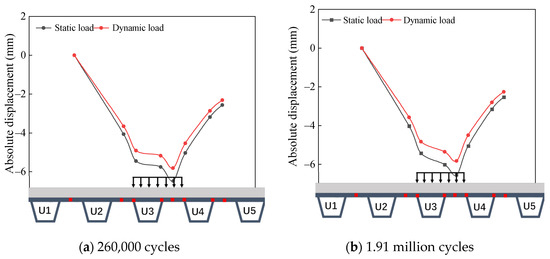
Figure 12.
Comparison of absolute displacement under dynamic and static load.
It is evident that when the test load is consistent, the trends in absolute displacement distribution for both static and dynamic loading are similar. At 260,000 load applications, the maximum absolute displacement induced by the dynamic load is approximately 5.82 mm, corresponding to 0.9 times the maximum absolute displacement observed under static loading. When subjected to 1.91 million load applications, the maximum absolute displacement resulting from the dynamic load reaches about 5.9 mm, which is 0.89 times that recorded for static loading. It can be seen that, when subjected to the same load, the absolute displacement caused by dynamic loading is approximately 0.9 times that of static loading.
3.3. Influence of Load on Mechanical Response
Focusing on load as a single variable, this test analyzes the mechanical index of the epoxy asphalt steel bridge deck pavement system under static load as the load changes while maintaining the pavement layer temperature at 50 °C.
3.3.1. Transverse Strain at the Bottom of Steel Bridge Deck
Figure 13a shows the relationship between transverse strain at the bottom of the steel bridge deck (at the weld of the load center) and the load applied across different loading stages.
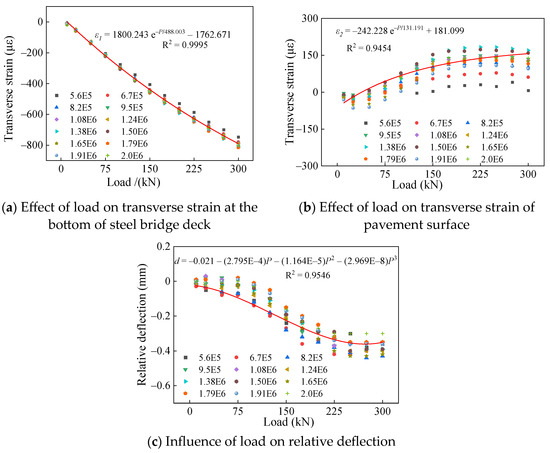
Figure 13.
Effect of load on mechanical response.
This transverse strain increases with the applied load across different loading stages, and the trend of change is consistent across each stage. As the number of loading cycles increases, the strain value induced by the same test load gradually rises, indicating that the strength of the EAC paving layer gradually decreases with the increase in the number of loading cycles. Thus, the stiffness provided by the paving layer to the steel bridge deck diminishes over time. The relationship between the transverse strain at the bottom of the steel bridge deck and the applied load follows an exponential distribution, with a gentle curve in the fitting relationship, as shown in Figure 13a. This indicates a high elastic modulus for the steel bridge and strong resistance to deformation. At the end of the loading period, the steel bridge deck does not exhibit signs of fatigue.
Based on the fitting analysis of strain values under varying loads, the regression relationship between the maximum transverse strain at the bottom of the steel bridge deck and the applied load is described in Equation (1).
where P represents the load (kN) and represents transverse strain at the bottom of the steel bridge (με).
Equation (1) reflects the relationship between and P; theoretically, when P is 0, should also be 0. Substituting P = 0 into Equation (1) yields a value of 37.572 με. Considering that a pre-loading test was conducted before the official loading, it has little effect on the initial strain value on the bottom surface of the steel plate. Further analysis shows that the fit between the equation and the experimental data is quite high, and it is concluded that Equation (1) can generally reflect the relationship between and P. The equation is applicable; however, when the load is zero, there is a certain deviation between the calculated value and the actual measurement.
3.3.2. Transverse Strain of Pavement Surface
Figure 13b reflects the variation in transverse strain of the pavement surface at the U-rib weld in the load zone as the load changes across different loading stages.
Overall, the trend of transverse strain at various loading stages remains consistent. As the load increases, the transverse strain continuously rises, and the relationship between the transverse strain of the pavement surface and the load follows an exponential distribution. When the load reaches 75 kN, the increase in transverse strain on the pavement surface diminishes as the load continues to rise. After 560,000 cycles of loading, at the same load level, the transverse strain of the pavement surface significantly increases with additional loading cycles, indicating that the EAC pavement has lost its elasticity.
According to the fitting analysis of the test data, the relationship between the maximum transverse strain of the pavement surface at the U-rib weld in the load area and the load satisfies Equation (2).
where represents transverse strain of pavement surface (με).
3.3.3. Relative Deflection
Figure 13c reflects the effect of load on the relative deflection of the U-rib weld.
It can be seen that the trend of relative deflection with the increase in load in each loading stage is basically the same. As the load increases, the relative deflection gradually increases and then tends to be stable and without further increase. The relative deflection changes with the load following a cubic curve distribution, and the regression relationship between the relative deflection and the load satisfies Equation (3).
where d represents relative deflection (mm) and E represents the exponent with a base of 10.
3.4. Effect of Temperature on Mechanical Response
It is generally accepted that under a load of less than 500,000 cycles, the pavement system remains in the stage of elastic deformation and the influence of the load on the mechanical response can be considered negligible. This test analyzes the influence of different temperatures on the mechanical properties of key details in the EAC steel bridge deck pavement system under a 300 kN dynamic load, with temperatures ranging from 15 °C (loading for 240.74 million cycles) to 48 °C (loading for 500 million cycles).
3.4.1. Transverse Strain at the Bottom of Steel Bridge Deck
As illustrated in Figure 14a, it describes the transverse strain at the bottom of the steel bridge deck (at the welds) in both the loaded and non-loaded regions across different temperatures.
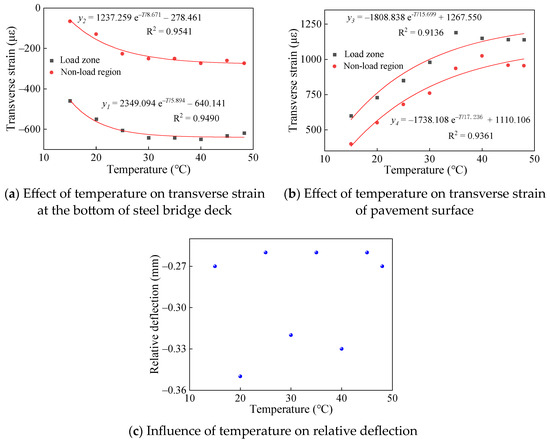
Figure 14.
Effect of temperature on mechanical response.
It can be seen that the trends of transverse strain with temperature in both the loaded and non-loaded zones are quite similar. This indicates that the steel bridge deck remains in the elastic deformation stage for fewer than 500,000 loading cycles, allowing the load effect to be considered negligible. The strain progressively increases with rising pavement temperature, displaying an exponential distribution. After reaching 30 °C, the strain increment progressively decreases as the temperature rises, and the strain gradually tends to stabilize.
Based on the test data, there is an established relationship between the transverse strain at the bottom of the steel bridge deck and the pavement temperature. Equation (4) describes the regression model relating the transverse strain at the bottom of the steel bridge deck (at the weld) in the load zone to the pavement temperature.
where T represents pavement surface temperature (°C) and represents transverse strain of steel bridge bottom in load area (με).
Equation (5) presents the regression model that relates the transverse strain at the bottom of the steel bridge deck (at the weld) in the non-load zone to the pavement temperature.
where represents transverse strain of the steel bridge bottom in the non-load zone (με).
3.4.2. Transverse Strain of Pavement Surface
Figure 14b illustrates the variation in transverse strain at the pavement surface (at the welds) of both the load zone and the non-load zone as the temperature increases.
Figure 14b shows that the transverse strain of the pavement surface in both the load area and the non-load area exhibits a similar trend with increasing temperature. This suggests that the strain is primarily influenced by the pavement temperature during the elastic deformation stage. The transverse strain of the pavement surface in both regions increases with temperature and follows an exponential distribution. Below 30 °C, the strain increases linearly with temperature; however, beyond this threshold, the rate of strain increase gradually diminishes.
A comparison of Figure 14a,b reveals that the strain growth rate of the pavement layer is significantly greater than that of the steel bridge deck’s bottom during the initial heating stage. This observation further supports the conclusion that the thermal expansion coefficient of the EAC is greater than that of steel, indicating a higher sensitivity to temperature.
Based on the fitting analysis of the test data, Equation (6) represents the regression relationship between the transverse strain of the pavement surface (at the weld) in the load zone and the pavement temperature, while Equation (7) describes the regression relationship for the non-load zone.
where represents the transverse strain of the pavement surface in the load area (με).
where represents the transverse strain of the pavement surface in the non-load zone (με).
3.4.3. Relative Deflection
Figure 14c illustrates the relationship between relative deflection and temperature of the pavement surface.
Within the temperature range of 15 °C to 48 °C, the relative deflection direction is downward, varying primarily between 0.26 mm and 0.35 mm. Several factors influence the distribution of relative deflection. First, temperature changes have a minimal effect on relative deflection, with deflection primarily driven by the applied load. Second, the modulus of the steel bridge deck is greater than that of EAC, resulting in a coupling structure that is less sensitive to temperature variations than the EAC.
3.5. Regression Analysis of Mechanical Index
3.5.1. Maximum Transverse Strain at the Bottom of Steel Bridge Deck
The maximum transverse strain at the bottom of a steel bridge deck is a critical mechanical index for evaluating the fatigue performance of orthotropic steel bridge decks. The regression relationships between the maximum transverse strain at the bottom of the steel bridge deck and both load and temperature were established using the orthogonal design method.
To analyze the influence of temperature and load on the transverse strain at the bottom of the steel bridge deck, four levels were established for each factor, as shown in Table 3.

Table 3.
Two-factor four-level table.
An orthogonal test was designed for these two factors at four levels. The orthogonal table L16 (42) and the measured values of the maximum transverse strain at the bottom of the steel bridge deck are shown in Table 4.

Table 4.
Orthogonal design table and measured value of maximum transverse strain at the bottom of steel bridge deck.
A multiple regression model was established based on the relationship between the transverse strain at the bottom of the steel bridge deck and the independent variables: temperature and load. This model was linearized and presented in matrix form, as shown in Equation (8).
where f is the response variable ln(), is the maximum transverse strain at the bottom of steel bridge deck, is a linear polynomial in relation to the input variables (temperature and load), and and are constant terms.
The linear regression model for the maximum transverse strain at the bottom of the steel bridge deck, influenced by temperature and load, is presented in Equation (9).
where λ1 and λ2 are constant terms.
The linear regression model relating the maximum transverse strain at the bottom of the steel bridge deck to temperature and load was derived from the measured results in the orthogonal test design table using SPSS 27 software, as presented in Equation (10).
At a significance level of 0.05, the R² value is 0.9540, indicating a strong linear correlation. The equation effectively captures the relationship between the maximum transverse strain at the bottom of the steel bridge deck and the variables of temperature and load.
Equation (11) is the mathematical model of the maximum transverse strain at the bottom of the steel bridge deck.
The model was employed to estimate the original sample, and the fitted values were compared with the measured values to evaluate the simulation effect of the model, as shown in Figure 15. The figure illustrates that the mathematical model exhibits a strong fitting accuracy.
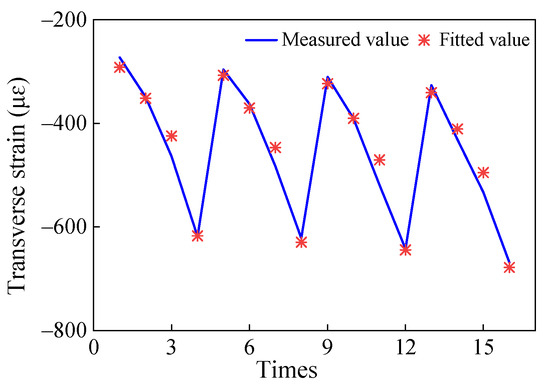
Figure 15.
Maximum transverse strain at the bottom of steel bridge deck.
3.5.2. Transverse Strain of Pavement Surface
Previous studies have shown that the maximum transverse strain of the pavement surface is a significant factor contributing to the longitudinal cracking of pavement [30,31]. The regression relationships between the maximum transverse strain of pavement surface and both load and temperature were established using the orthogonal design method.
Using the orthogonal experiment mentioned above to analyze the impact of temperature and load coupling on pavement surface strain, the experiment is designed using the same two-factor, four-level table, as shown in Table 3.
The orthogonal table L16 (42) and the measured strain values are shown in Table 5.

Table 5.
Orthogonal design table and measured value of maximum transverse strain at the pavement surface.
To obtain a regression model for the maximum transverse strain on the pavement surface in relation to temperature and load, the model can first be linearized, as illustrated in Equation (12).
where is the response variable ln(), is the maximum transverse strain of the pavement surface, is a linear polynomial in relation to the input variables (temperature and load), and and are constant terms.
The linear regression model for the maximum transverse strain is presented in Equation (13).
where λ3 and λ4 are constant terms.
Based on the measured values of transverse strain in Table 5, a linear regression equation relating the maximum transverse strain of the pavement surface to temperature and load can be fitted using SPSS 27 software, as presented in Equation (14).
At a significance level of 0.05, the R² value is 0.9344, indicating a strong linear correlation. The equation accurately represents the relationship between the maximum transverse strain of the pavement surface and the variables of temperature and load.
Equation (15) is the mathematical model of the maximum transverse strain of the pavement surface.
As shown in Figure 16, the mathematical model exhibits a strong fitting accuracy.
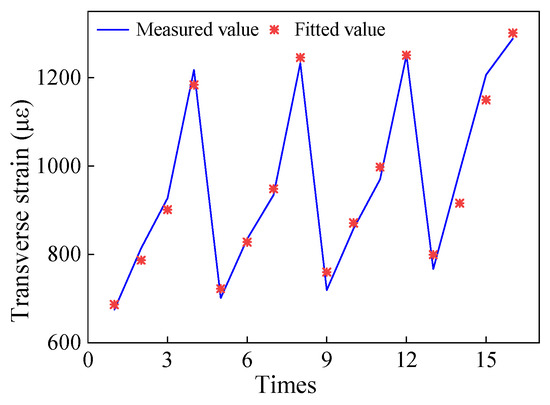
Figure 16.
Maximum transverse strain of pavement surface.
4. Conclusions
In this paper, the mechanical response characteristics of a domestic hot-mix epoxy asphalt concrete steel bridge deck pavement system under temperature and load are explored through the accelerated loading fatigue test of a full-scale section of orthotropic steel bridge. The following conclusions are obtained.
- (1)
- The weld aligned with the center of the load zone, the U-rib weld near the load zone, and the area between two adjacent U-ribs in the load zone are the three locations where the maximum strain or deflection occurs. These are also the areas most prone to fatigue failure.
- (2)
- The maximum longitudinal strain is lower than the maximum transverse strain and occurs at the center of the U-ribs within the loading area. Furthermore, the longitudinal strain between the U-ribs is greater than that at the U-rib welds.
- (3)
- Under identical operating conditions, the loading type does not influence the distribution of the mechanical response, but it does affect the mechanical effects, with strains and deflections generated under static loading being greater than those produced under dynamic loading.
- (4)
- Considering only the load effect, both the transverse strain and relative deflection increase with the increase in load. The strain exhibits an exponential relationship with the load, while the relative deflection follows a cubic function. When examining the effects of temperature alone, the transverse strain rises exponentially with temperature. The relative deflection is primarily influenced by the load and shows limited sensitivity to temperature variations.
- (5)
- Considering the coupled effects of temperature and load as independent variables, an orthogonal experiment was designed to yield exponential equations for the maximum lateral strain on the bottom surface of the steel bridge and the maximum lateral strain on the pavement surface. However, the limited experimental data and discrepancies between the experimental conditions and real-world scenarios necessitate further validation of these equations. Moving forward, the research team will analyze monitoring data from this full-scale experimental bridge to investigate the equations’ applicability.
Author Contributions
Methodology, R.L.; Investigation, G.L. and M.L.; Data curation, L.C.; Writing—original draft, X.X.; Supervision, P.G.; Project administration, H.Z. All authors have read and agreed to the published version of the manuscript.
Funding
The project was supported by the National Key R&D Program of China (2021YFB1600300).
Data Availability Statement
Data are contained within the article.
Conflicts of Interest
Authors Hui Zhang, Lei Cui and Ruilin Luo were employed by the company Jiangsu SinoRoad Engineering Technology Research Institute Limited Company. The remaining authors declare that the research was conducted in the absence of any commercial or financial relationships that could be construed as a potential conflict of interest.
References
- Huang, W.; Zhang, X.C.; Hu, G.W. New Advance of Theory and Design on Pavement for Long-Span Steel Bridge. J. Southeast Univ. 2002, 32, 480–487. [Google Scholar]
- Qin, S.Q.; Gao, Z.Y. Developments and Prospects of Long-Span High-Speed Railway Bridge Technologies in China. Engineering 2017, 3, 787–794. [Google Scholar] [CrossRef]
- Apaydin, N.M.; Bas, S. Long-Span Orthotropic Steel Deck Bridges of Turkey. In Proceedings of the 9th International Symposium On Steel Bridges, Prague, Czech Republic, 10–11 September 2018; IOP Publishing Ltd.: Bristol, UK, 2018; p. 419. [Google Scholar] [CrossRef]
- Han, Y.J.; Zhang, Z.; Tian, J.H.; Ni, F.J.; Gu, X.Y. Long-Term In Situ Performance Evaluation of Epoxy Asphalt Concrete for Long-Span Steel Bridge Deck Pavement. Coatings 2023, 13, 545. [Google Scholar] [CrossRef]
- Luo, S.; Liu, Z.M.; Yang, X.; Lu, Q.; Yin, J. Construction Technology of Warm and Hot Mix Epoxy Asphalt Paving for Long-Span Steel Bridge. J. Constr. Eng. Manag. 2019, 145, 04019074. [Google Scholar] [CrossRef]
- Nie, W.; Wang, D.Y.; Yan, J.J.; Zhang, X.N. Optimal Design of Mix Proportion of Hot-Mix Epoxy Asphalt Mixture for Steel Bridge Decks and Its Anti-Slip Performance. Buildings 2022, 12, 437. [Google Scholar] [CrossRef]
- Cong, P.; Luo, W.; Xu, P.; Zhang, Y. Chemical and Physical Properties of Hot Mixing Epoxy Asphalt Binders. Constr. Build. Mater. 2019, 198, 1–9. [Google Scholar] [CrossRef]
- Nie, W.; Wang, D.; Sun, Y.; Xu, W.; Xiao, X. Integrated Design of Structure and Material of Epoxy Asphalt Mixture Used in Steel Bridge Deck Pavement. Buildings 2021, 12, 9. [Google Scholar] [CrossRef]
- Yin, C.; Zhang, H.; Pan, Y. Cracking Mechanism and Repair Techniques of Epoxy Asphalt on Steel Bridge Deck Pavement. Transp. Res. Rec. J. Transp. Res. Board 2016, 2550, 123–130. [Google Scholar] [CrossRef]
- Zhang, H.; Mao, Q.; Zhu, Z.; Zhang, Z.; Pan, Y.; Wan, J.; Zhou, C.; Qian, J. Experimental Study on Service Performance of Epoxy Asphalt Steel Deck Pavement of Cable Stayed Bridge. Case Stud. Constr. Mater. 2020, 13, e00392. [Google Scholar] [CrossRef]
- Wang, Z.; Zhang, S. Fatigue Endurance Limit of Epoxy Asphalt Concrete Pavement on the Deck of Long-Span Steel Bridge. Int. J. Pavement Res. Technol. 2018, 11, 408–415. [Google Scholar] [CrossRef]
- Xue, Y.C.; Qian, Z.D. Development and Performance Evaluation of Epoxy Asphalt Concrete Modified with Mineral Fiber. Constr. Build. Mater. 2016, 102, 378–383. [Google Scholar] [CrossRef]
- Huang, R.J.; Zhang, H.; Cui, L. Research Status of Full-Scale Structural Fatigue Test of Steel Bridge Deck System. Low Temp. Build. Technol. 2021, 43, 91–95, 103. [Google Scholar] [CrossRef]
- Yang, S.Q. Experimental Study on Accelerated Loading of Steel Bridge Deck Pavement; Chang’an University: Xi’an, China, 2010. [Google Scholar]
- Pan, Y.Q.; Yan, J. Overview of Full-Scale Accelerated Pavement Test Research at Home and Abroad. China Foreign Highw. 2005, 25, 137–140. [Google Scholar]
- Terada, H.; Maeno, H.; Nakamura, M.; Koyama, S.J.D.G.R. An Experimental Study on SFRC Composite Steel Deck. Doboku Gakkai Ronbunshu 1986, 374, 301–308. [Google Scholar] [CrossRef] [PubMed][Green Version]
- Ye, H.; Huang, A.; Jiang, C.; Wang, W. Experimental Investigation on Fatigue Improvement of Orthotropic Steel Bridge Deck Using Steel Fiber Reinforced Concrete. Int. J. Concr. Struct. Mater. 2023, 17, 41. [Google Scholar] [CrossRef]
- Shi, J.; Cong, L. Testing and Evaluating the High-Temperature Rutting Development of Steel Deck Asphalt Pavement Using Full-Scale Accelerated Pavement Testing. J. Test. Eval. 2023, 51, 1094–1104. [Google Scholar] [CrossRef]
- Anupam, K.; Liu, X.; Scarpas, T.; Apostolidis, P.; Erkens, S.; Van Aggelen, M. Accelerated Evaluation of Membranes for Pavement Structures on Orthotropic Steel Bridge Decks. Int. J. Pavement Eng. 2022, 24, 2083619. [Google Scholar] [CrossRef]
- Wei, C.; Zhang, Q.; Yang, Z.; Li, M.; Cheng, Z.; Bao, Y. Flexural Cracking Behavior of Reinforced UHPC Overlay in Composite Bridge Deck With Orthotropic Steel Deck Under Static and Fatigue Loads. Eng. Struct. 2022, 265, 114537. [Google Scholar] [CrossRef]
- Shi, Z.; Su, Q.; Veljković, M. Behavior of Orthotropic Steel-UHPC Composite Bridge Deck under Cyclic Loading. In Proceedings of the IABSE Symposium, Prague 2022: Challenges for Existing and Oncoming Structures, Prague, Czech Republic, 25–27 May 2022; pp. 810–819. [Google Scholar] [CrossRef]
- Chen, F.; Zhong, K.; Wei, X.H. Pavement Evaluation for ERS Steel Deck Pavement Using Accelerated Loading Test. Key Eng. Mater. 2017, 744, 97–104. [Google Scholar] [CrossRef]
- Li, H.T. Study on New Steel Deck Pavement Structure of Long Span Suspension Bridge; Southeast University: Nanjing, China, 2006. [Google Scholar]
- JTG D64-2015; Code for Design of Steel Highway Bridges. Ministry of Transport of the People’s Republic of China: Beijing, China, 2015.
- EN 1993-1-3:2006; Eurocode 3: Design of Steel Structures. European Committee for Standardization: Brussels, Belgium, 2006.
- Di, J.; Ruan, X.Z.; Zhou, X.H.; Wang, J.; Peng, X. Fatigue assessment of orthotropic steel bridge decks based on strain monitoring data. Eng. Struct. 2021, 228, 111437. [Google Scholar] [CrossRef]
- Hoang, V.H.; Nguyen, Q.T.; Tran, A.T.; Tran, T.C.H.; Do, T.A. Mechanical behavior of the asphalt wearing surface on an orthotropic steel bridge deck under cyclic loading. Case Stud. Constr. Mater. 2022, 16, e00836. [Google Scholar] [CrossRef]
- Zhang, R.Y. Study on Bending Performance of Steel-ECC Composite Bridge Deck Under Negative Bending Moment; Chongqing University: Chongqing, China, 2022. [Google Scholar]
- Huang, W. Design Theory and Methods for Pavement of Steel Decks on Long-Span Bridges; China Building Industry Press: Beijing, China, 2006; p. 7-112-08721-X. [Google Scholar]
- Zhong, K.; Chen, F.; Wei, X.H.; Liu, L. The Study on the Performance of Steel Bridge Deck Pavement Based on Accelerated Loading Test. Highw. Traffic Technol. 2017, 34, 50–56. [Google Scholar]
- Xu, X.; Gu, Y.; Huang, W.; Chen, D.; Zhang, C.; Yang, X. Structural Optimization of Steel—Epoxy Asphalt Pavement Based on Orthogonal Design and GA—BP Algorithm. Crystals 2021, 11, 417. [Google Scholar] [CrossRef]
Disclaimer/Publisher’s Note: The statements, opinions and data contained in all publications are solely those of the individual author(s) and contributor(s) and not of MDPI and/or the editor(s). MDPI and/or the editor(s) disclaim responsibility for any injury to people or property resulting from any ideas, methods, instructions or products referred to in the content. |
© 2024 by the authors. Licensee MDPI, Basel, Switzerland. This article is an open access article distributed under the terms and conditions of the Creative Commons Attribution (CC BY) license (https://creativecommons.org/licenses/by/4.0/).