1. Introduction
Studies of the spectral content of seismic ground motion and response spectra have concluded that a definitive seismic predominant period is challenging and even impossible to define [
1,
2,
3]. This conclusion is based on the levels of standard deviation and standard error previously found [
1,
3,
4]. The novel view here is that the main reason for these negative results can be the persistent use in most of the literature of the common acceleration, both as input (record Fourier spectra) and as output (structural response spectra). Indeed, the question is if a clear and definite predominant frequency is possible if the focus is on displacement response rather than on the typical acceleration response spectra; as a matter of fact, on the input side, a clear or highly narrow band of dominant frequencies has been observed when Fourier analysis is performed on the ground displacement record instead of the acceleration one [
5,
6].
As indicated by previous authors, a single spectral parameter, if possible, would be very useful [
1] and advantageous [
2] in earthquake engineering practice; however, a definite and reliable single frequency or period has proved to be very elusive; in fact, “to date, there are no commonly acknowledged parameters for representing frequency content” [
2]. Moreover, as introduced above, past attempts to define a predominant frequency of earthquakes, which by far were mostly based on acceleration (either of the ground or as response spectra), had solid difficulties in obtaining clear results or reasonable standard deviations [
1,
3,
4]; indeed, the “scatter” in results were “excessively large” [
1], or “the dispersion of the S
a spectrum is remarkable” [
4]; in addition, Krishna and Bhattacharjee [
7] reported “predominant” frequencies ranging from 0.67 all the way to 5.44 Hz for earthquakes (magnitude > 6.0) in 3 continents, performing FFT analysis of ground acceleration, which corroborates the dispersion and scatter found in the other references.
On the contrary, by Fourier analysis of the ground
displacement record, a more reasonable dispersion has been found at predominant frequencies [
5,
6]. In fact, the results have been considered “highly narrowbanded” and, based on this characteristic, a successful optimization of isolated structures with tuned mass dampers (TMD) has been possible, considering that TMD is very sensitive to the input frequency [
8]. Those previous results were obtained by directly obtaining the power spectral density (PSD) of real seismic displacement records [
5,
6]. However, these are signals that are not considered fully reliable [
9]; that is, the displacement record is seldom obtained directly; it is mostly gotten by integration of the acceleration one, but this technique is not a simple calculus computation. In fact, it is such a complex procedure that an important part of the topic of seismic record processing is devoted to it. Signal noise and the unknown baseline are difficult problems in that field; actually, the computed displacements can be quite unphysical and even wild [
9].
Consequently, the spectral results based on ground displacement PSD [
5,
6] required validation or confirmation by a more reliable method [
10]. One such proposal or methodology is to consider displacement response spectra, which are based on the more physical and dependable ground acceleration record [
10]. Nevertheless, in this last reference, there is no attempt to define a predominant period in seismic ground motion, which is the main objective of this work. For this endeavor, or to increase the possibility of positive statistical results, the set of strong-motion records will be limited to near-field signals, which was not the case in the previous work as the objective was to corroborate the predominant frequencies observed when computing PSD of diverse ground displacement records [
10].
A central idea here and in those previous works is that clearer seismic predominant frequencies can be observed if the study is on the most basic motion quantity: displacement, either directly as ground displacement or as the displacement response, which is the means proposed in this work to assert, or not, one predominant frequency in seismic action. The procedure presented here is novel and valuable because past attempts to define a seismic predominant frequency were analyses of (a) acceleration response spectra [
1], (b) ground acceleration power spectra [
3] or Fourier spectra [
1], and (c) ground displacement power spectra [
5,
6], techniques that implied all the disadvantages or difficulties discussed in the first part of this introduction, being the unreliability of ground displacement records the main problem in method c. It is noted that the velocity response spectrum has also been considered for the same objective [
11,
12], but as far as the author has reviewed in the literature, the displacement response spectrum, either absolute or relative, has not been considered before for this undertaking.
Therefore, this work attempts to assert numerically and statistically one predominant frequency of seismic action by means of the deformation response spectrum concept, which depends on the measured or more dependable acceleration record. These spectra will be computed and analyzed for a notable set of near-field records, that is, from twenty events with magnitudes greater than 6.5 and from four continents. A dominant frequency will be obtained from each case or spectrum; then, a statistical or dispersion analysis will be performed to finally conclude if a single and definite predominant frequency for earthquake action is well established. The effect of site geology will, of course, be considered in the analysis. The work is divided simply, or in standard form, as follows: method, results and discussion. In the first part, the novel methodology to attain predominant periods is presented, which is based on displacement response spectra; in the second part, the results are presented as response spectra plots to highlight the narrowbanded characteristic, and then a statistical characterization is presented of the predominant frequencies; finally, the results are discussed and conclusions are drawn.
2. Method
Direct spectral content studies (i.e., Fourier analysis) of seismic ground
displacement have produced singular results [
5,
6], as compared to the more common results on ground acceleration frequency content [
1,
3]. The peculiarity of the results is that much clearer dominant frequencies can be noted. However, working directly with displacement records comes with some caution because these seismic signals are not as dependable as the corresponding or original acceleration ones. As explained earlier, most seismic recorders measure acceleration; thus, double integration of the measured record is first required to get ground displacement, but the resulting signal is, in general, plagued with a low signal-to-noise ratio and large offsets in the baseline of records [
9]. Although correction and filtering procedures have been developed and improved continuously in order to get physical or reasonable displacement records, any result or conclusion based directly on ground displacement signals is still received with reservation by many in the earthquake engineering and seismology communities.
Therefore, a study of seismic predominant frequencies that is not based either on the problematic ground displacement or on the usual input or output acceleration that does not render positive results is proposed. It is proposed that the analysis or predominant period definition be based on the displacement response spectrum concept, whose computation involves a more reliable ground acceleration record. Specifically, resonant or predominant frequencies will be searched for in displacement response spectra. The hypothesis of this research is that clear resonant frequencies will be observed because neat predominant frequencies exist in Fourier or power spectra of ground displacement [
5,
6]. A theoretical basis for this, based on a generalized transmissibility concept, has been given by Morales recently (2023) [
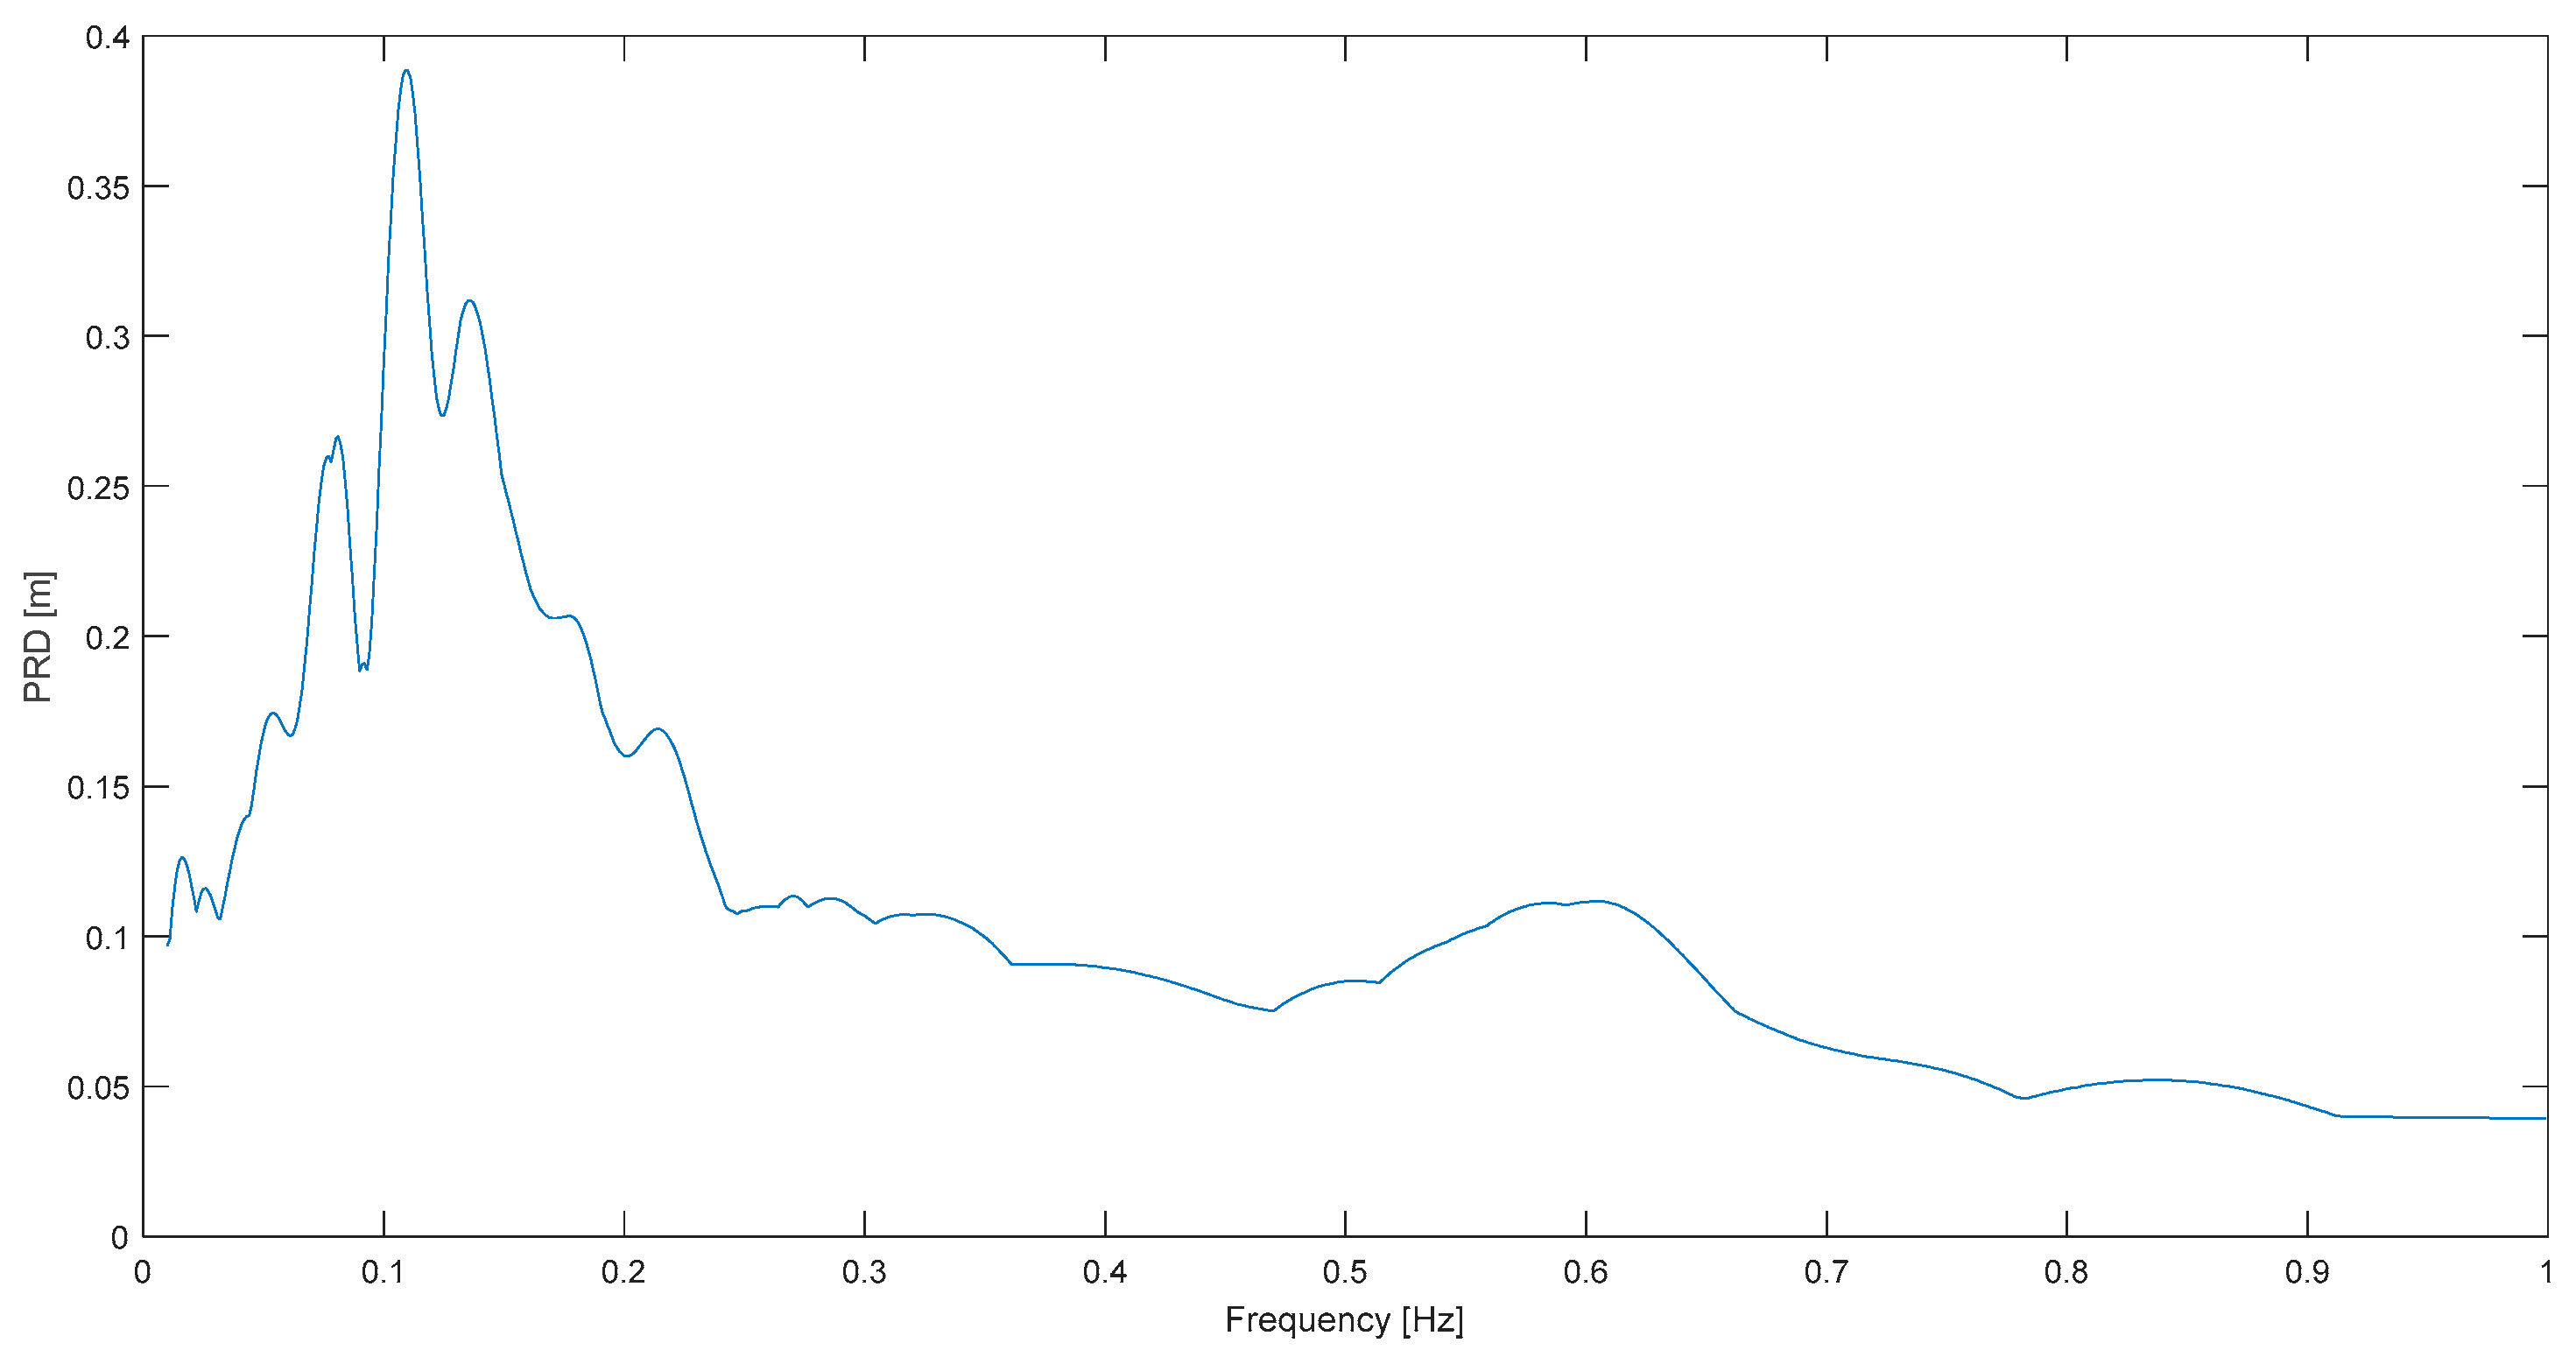
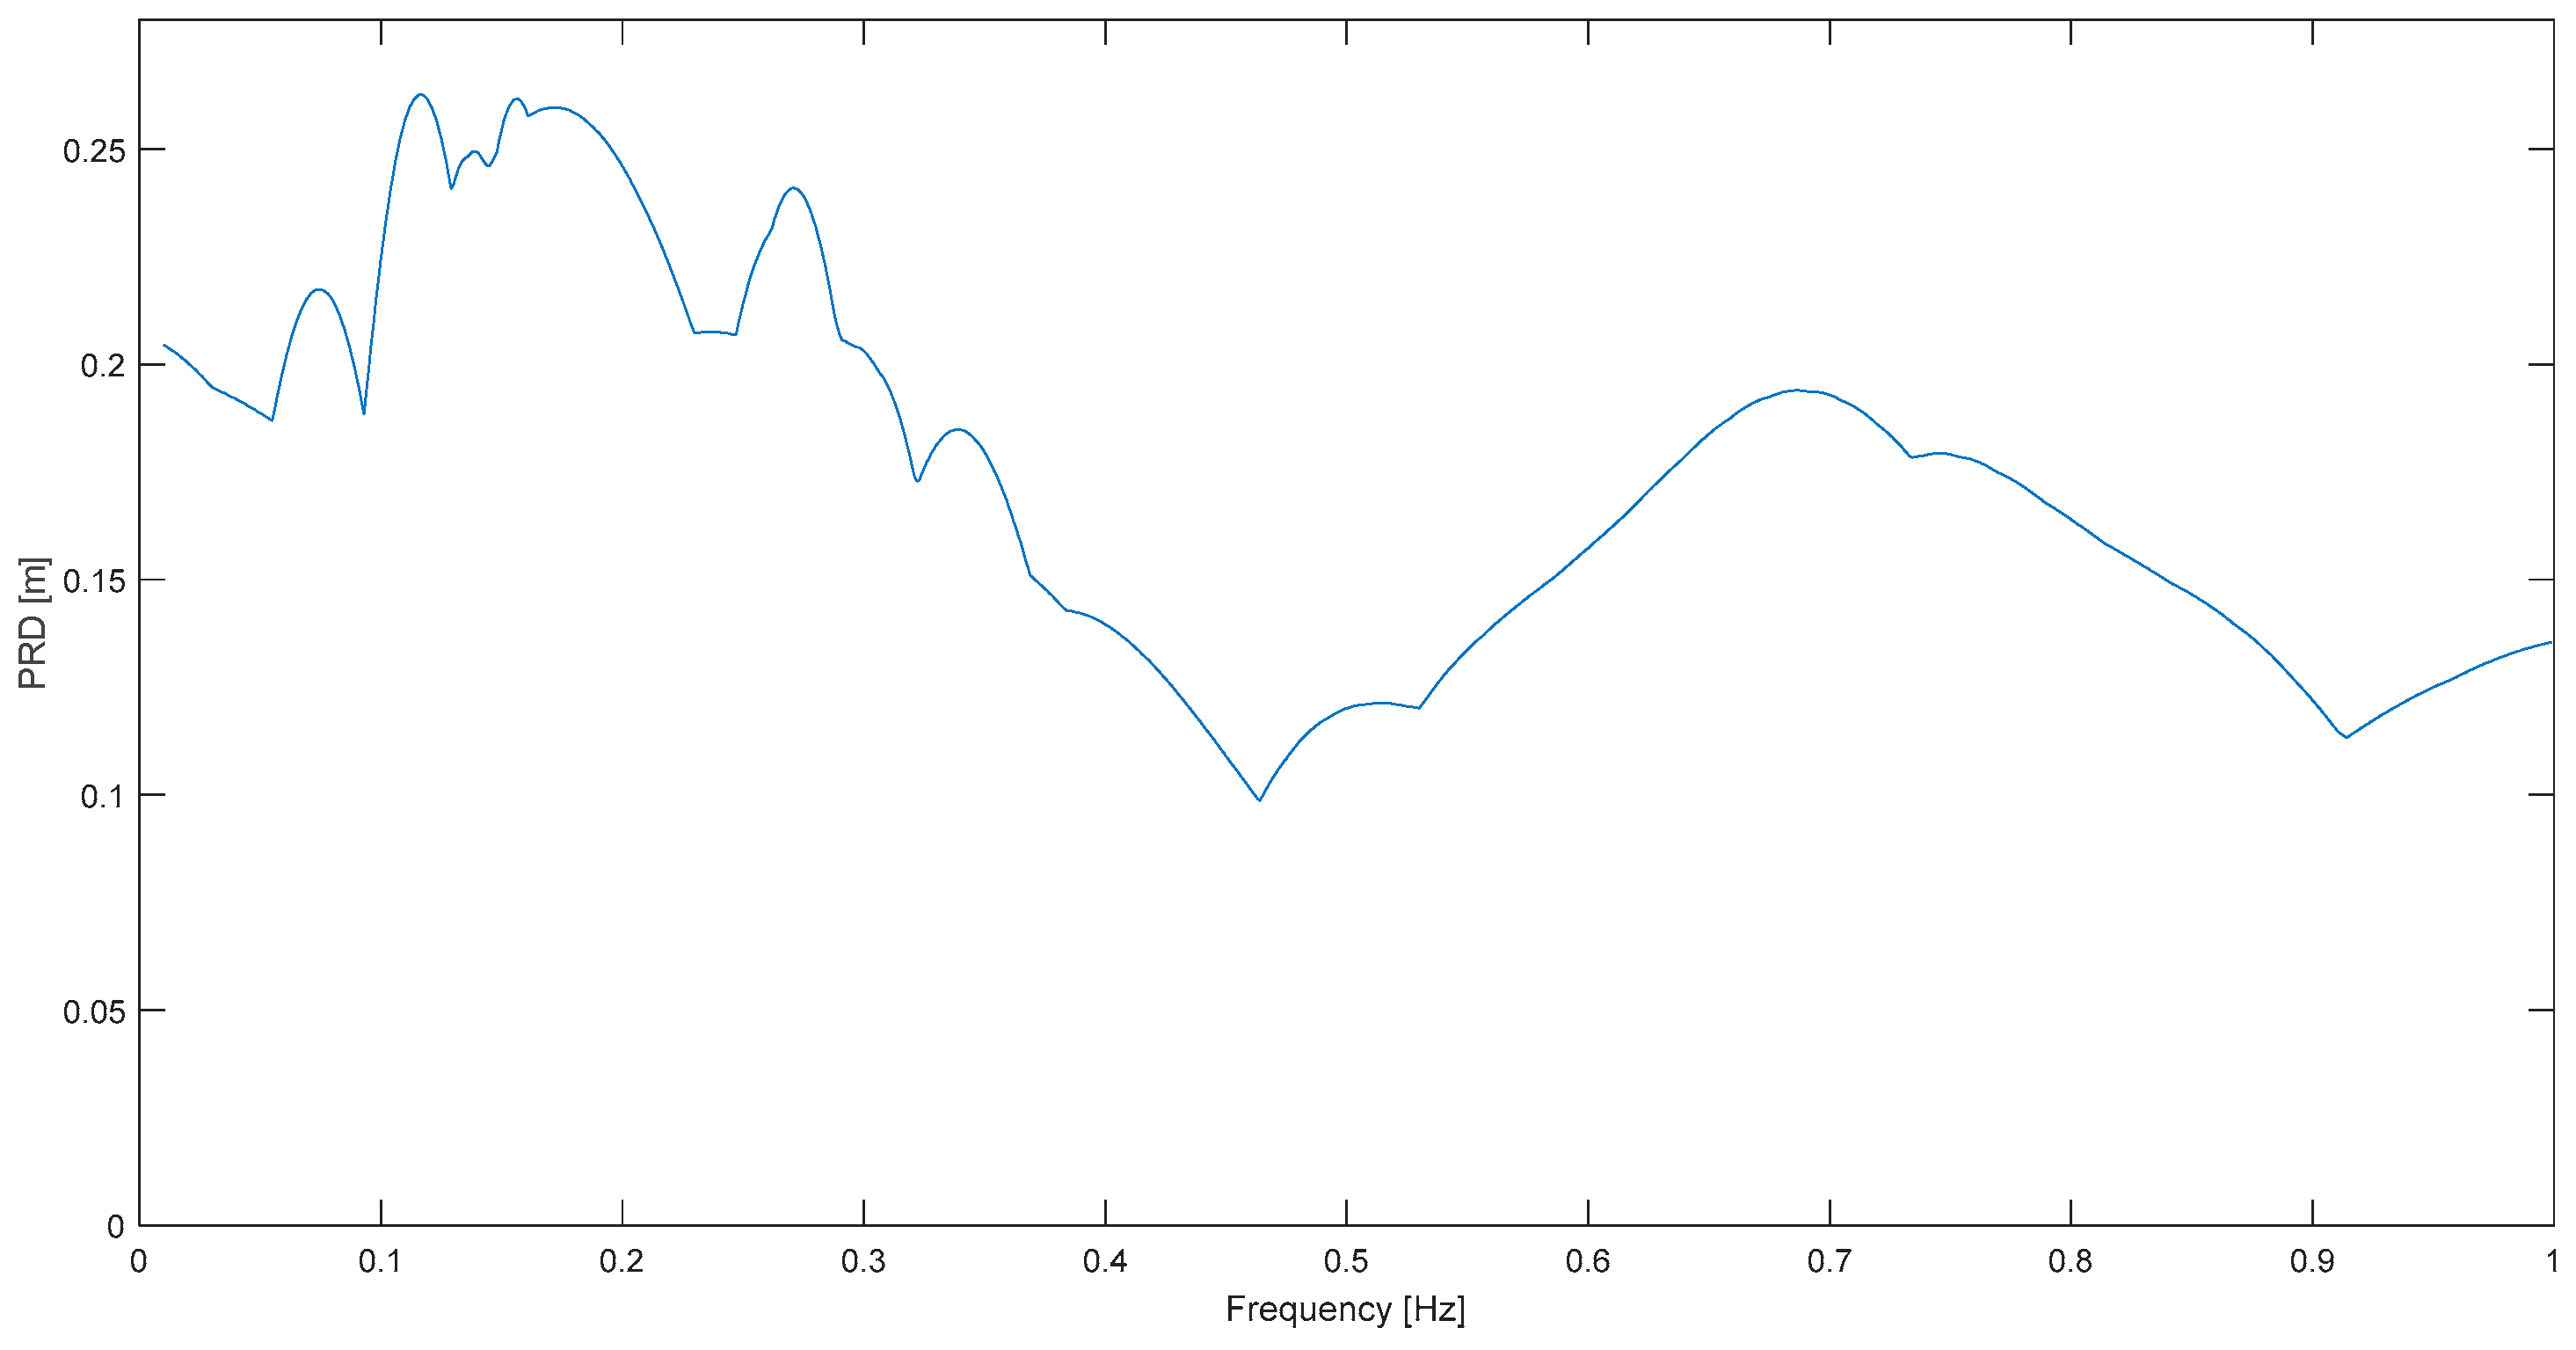
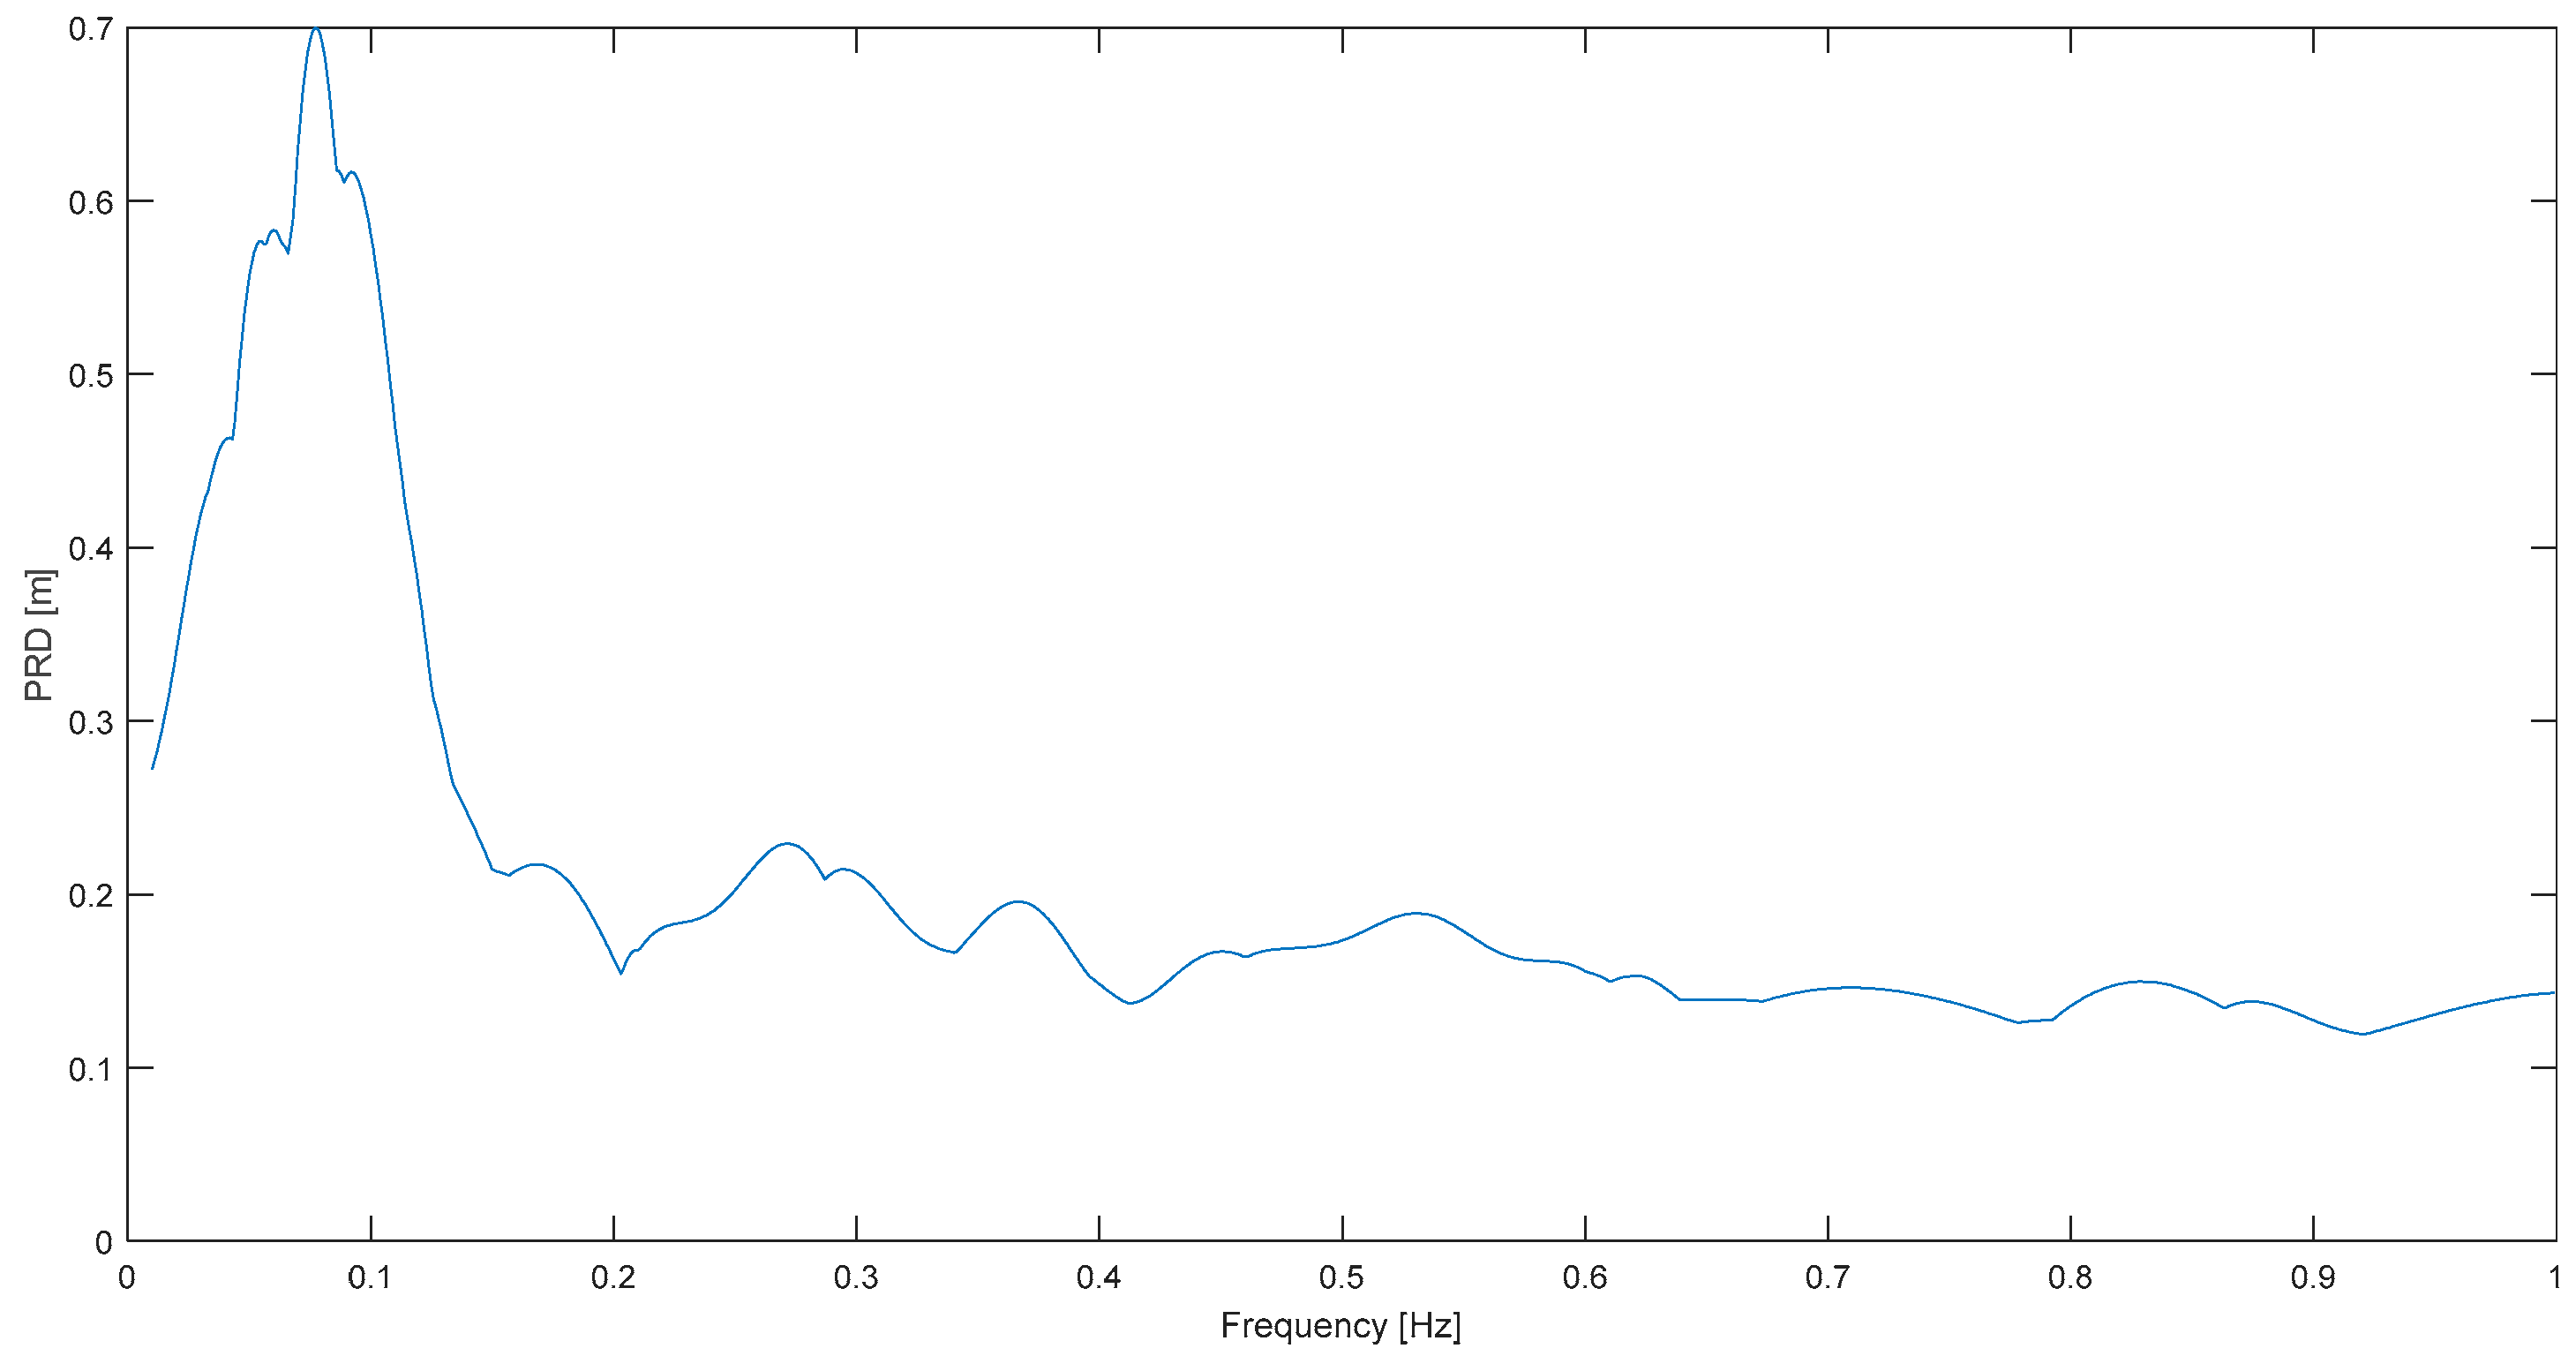
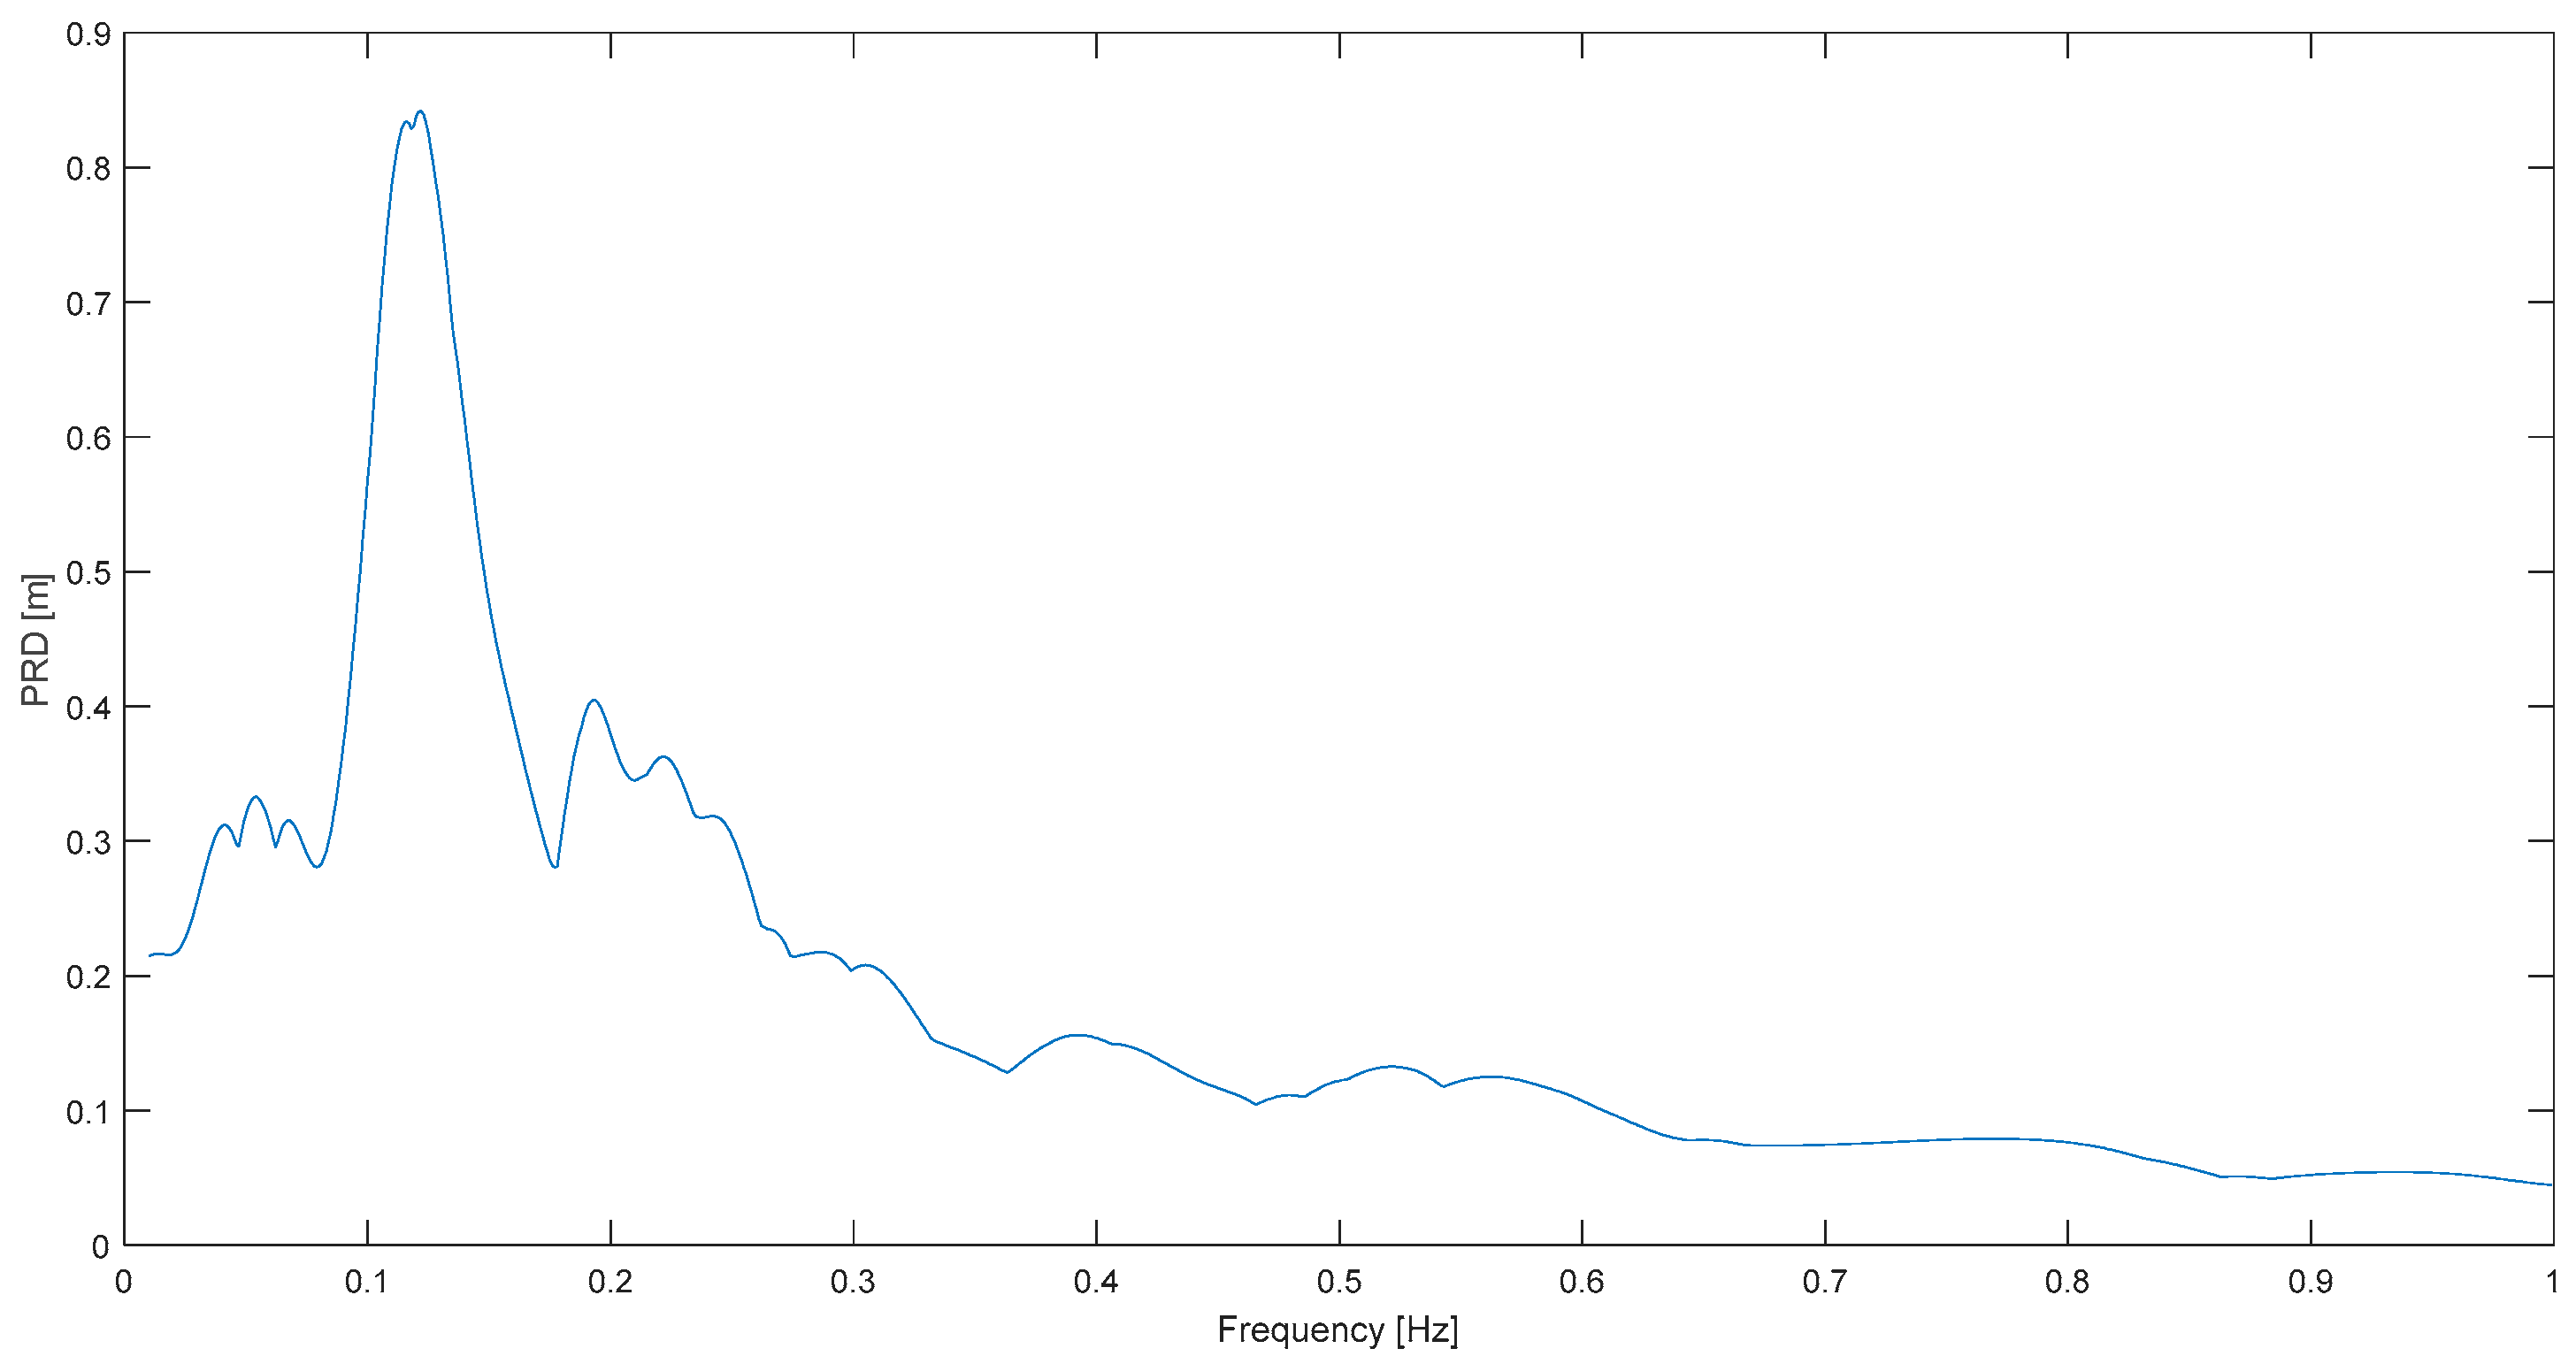
10]. Therefore, deformation response spectrum plots will be constructed, and an evident and clean predominant frequency will be observed, as shown in
Figure 1, where peak response displacement (
PRD) is plotted against natural frequency (instead of natural period, which is the other option).
Here, the
predominant frequency,
ωp, is defined as the structural natural frequency at which the maximum peak displacement occurs for 5% damping, following the common definition in the case of acceleration response spectra [
13]. This parameter is obtained for a meaningful and notable set of real earthquakes and subsequently subjected to statistical analysis, where the focus is on the dispersion of the results because the hypothesis is that the deviation from the mean value will be more limited and controlled than when acceleration is considered, either of the ground or of the response. Thus, the standard deviation and coefficient of variation will be compared with previous results based on acceleration [
1,
3,
4]. It is emphasized that a main novelty is this consideration of displacement response spectra instead of acceleration response, which has been the norm in earthquake engineering.
An important point of the method is that corrected or processed records are employed; moreover, both digital and analog seismic records are considered because the interest is in the low frequency range; that is, cutoff frequencies are diverse in order to conclude if this factor has any effect in the results. Moreover, the effect of site condition is also taken into account, which requires more work than just reporting the geological information of the seismic stations because international codes and even national ones differ in this type of classification, so uniformization had to be performed as stations and seismic processing entities in different parts of the world use different codes.
Finally, from previous work, it is expected that the dominant frequencies obtained by this new method will be lower than those obtained by the classic approaches based on acceleration; therefore, in professional practice, this methodology or proposal will have applications in isolated buildings, a topic that will be discussed further in
Section 4.
3. Results
The relative displacement response spectrum is first computed and plotted for a selected set of twenty very strong earthquakes around the world. In fact, the selected events are of moment magnitudes (
MW) larger than 6.5 and from four continents; 63% are of
MW > 7. These international earthquakes and their respective record identifications are shown in
Table 1, along with epicentral and/or fault distance and site geology. The records are near-field in the sense that either the epicentral or fault distances are under 60 km [
14]; other related and advanced phenomena such as fault rupture directivity [
15] or fling step are not considered in the selection. The deformation response spectra, computed employing records from the CESMD database (
www.strongmotioncenter.org (accessed on 1 December 2023) are shown in
Figure 2,
Figure 3,
Figure 4,
Figure 5,
Figure 6,
Figure 7,
Figure 8,
Figure 9,
Figure 10,
Figure 11,
Figure 12,
Figure 13,
Figure 14,
Figure 15,
Figure 16,
Figure 17,
Figure 18,
Figure 19 and
Figure 20, from which the predominant frequency for each case is afterwards obtained. These frequencies
ωp are shown in column 6 of
Table 1.
The first positive comment is that in most cases we observe a clear predominant frequency; that is, a resonance peak is easily discernible above the secondary ones. Nonetheless, more remarkable is the fact that the predominant frequencies are in the very limited band between 0.1 and 0.2 Hz, if the three
liquefaction instances are excluded, which will be later discussed. As indicated in the Introduction, similar results cannot be obtained employing the usual acceleration response spectra [
1,
4], or the ground acceleration Fourier spectra [
3]. Indeed, these previous works found not only high levels of dispersion in predominant periods but also that the resonances found were not clear peaks; as a result, the possibility of defining a or one predominant frequency was hindered.
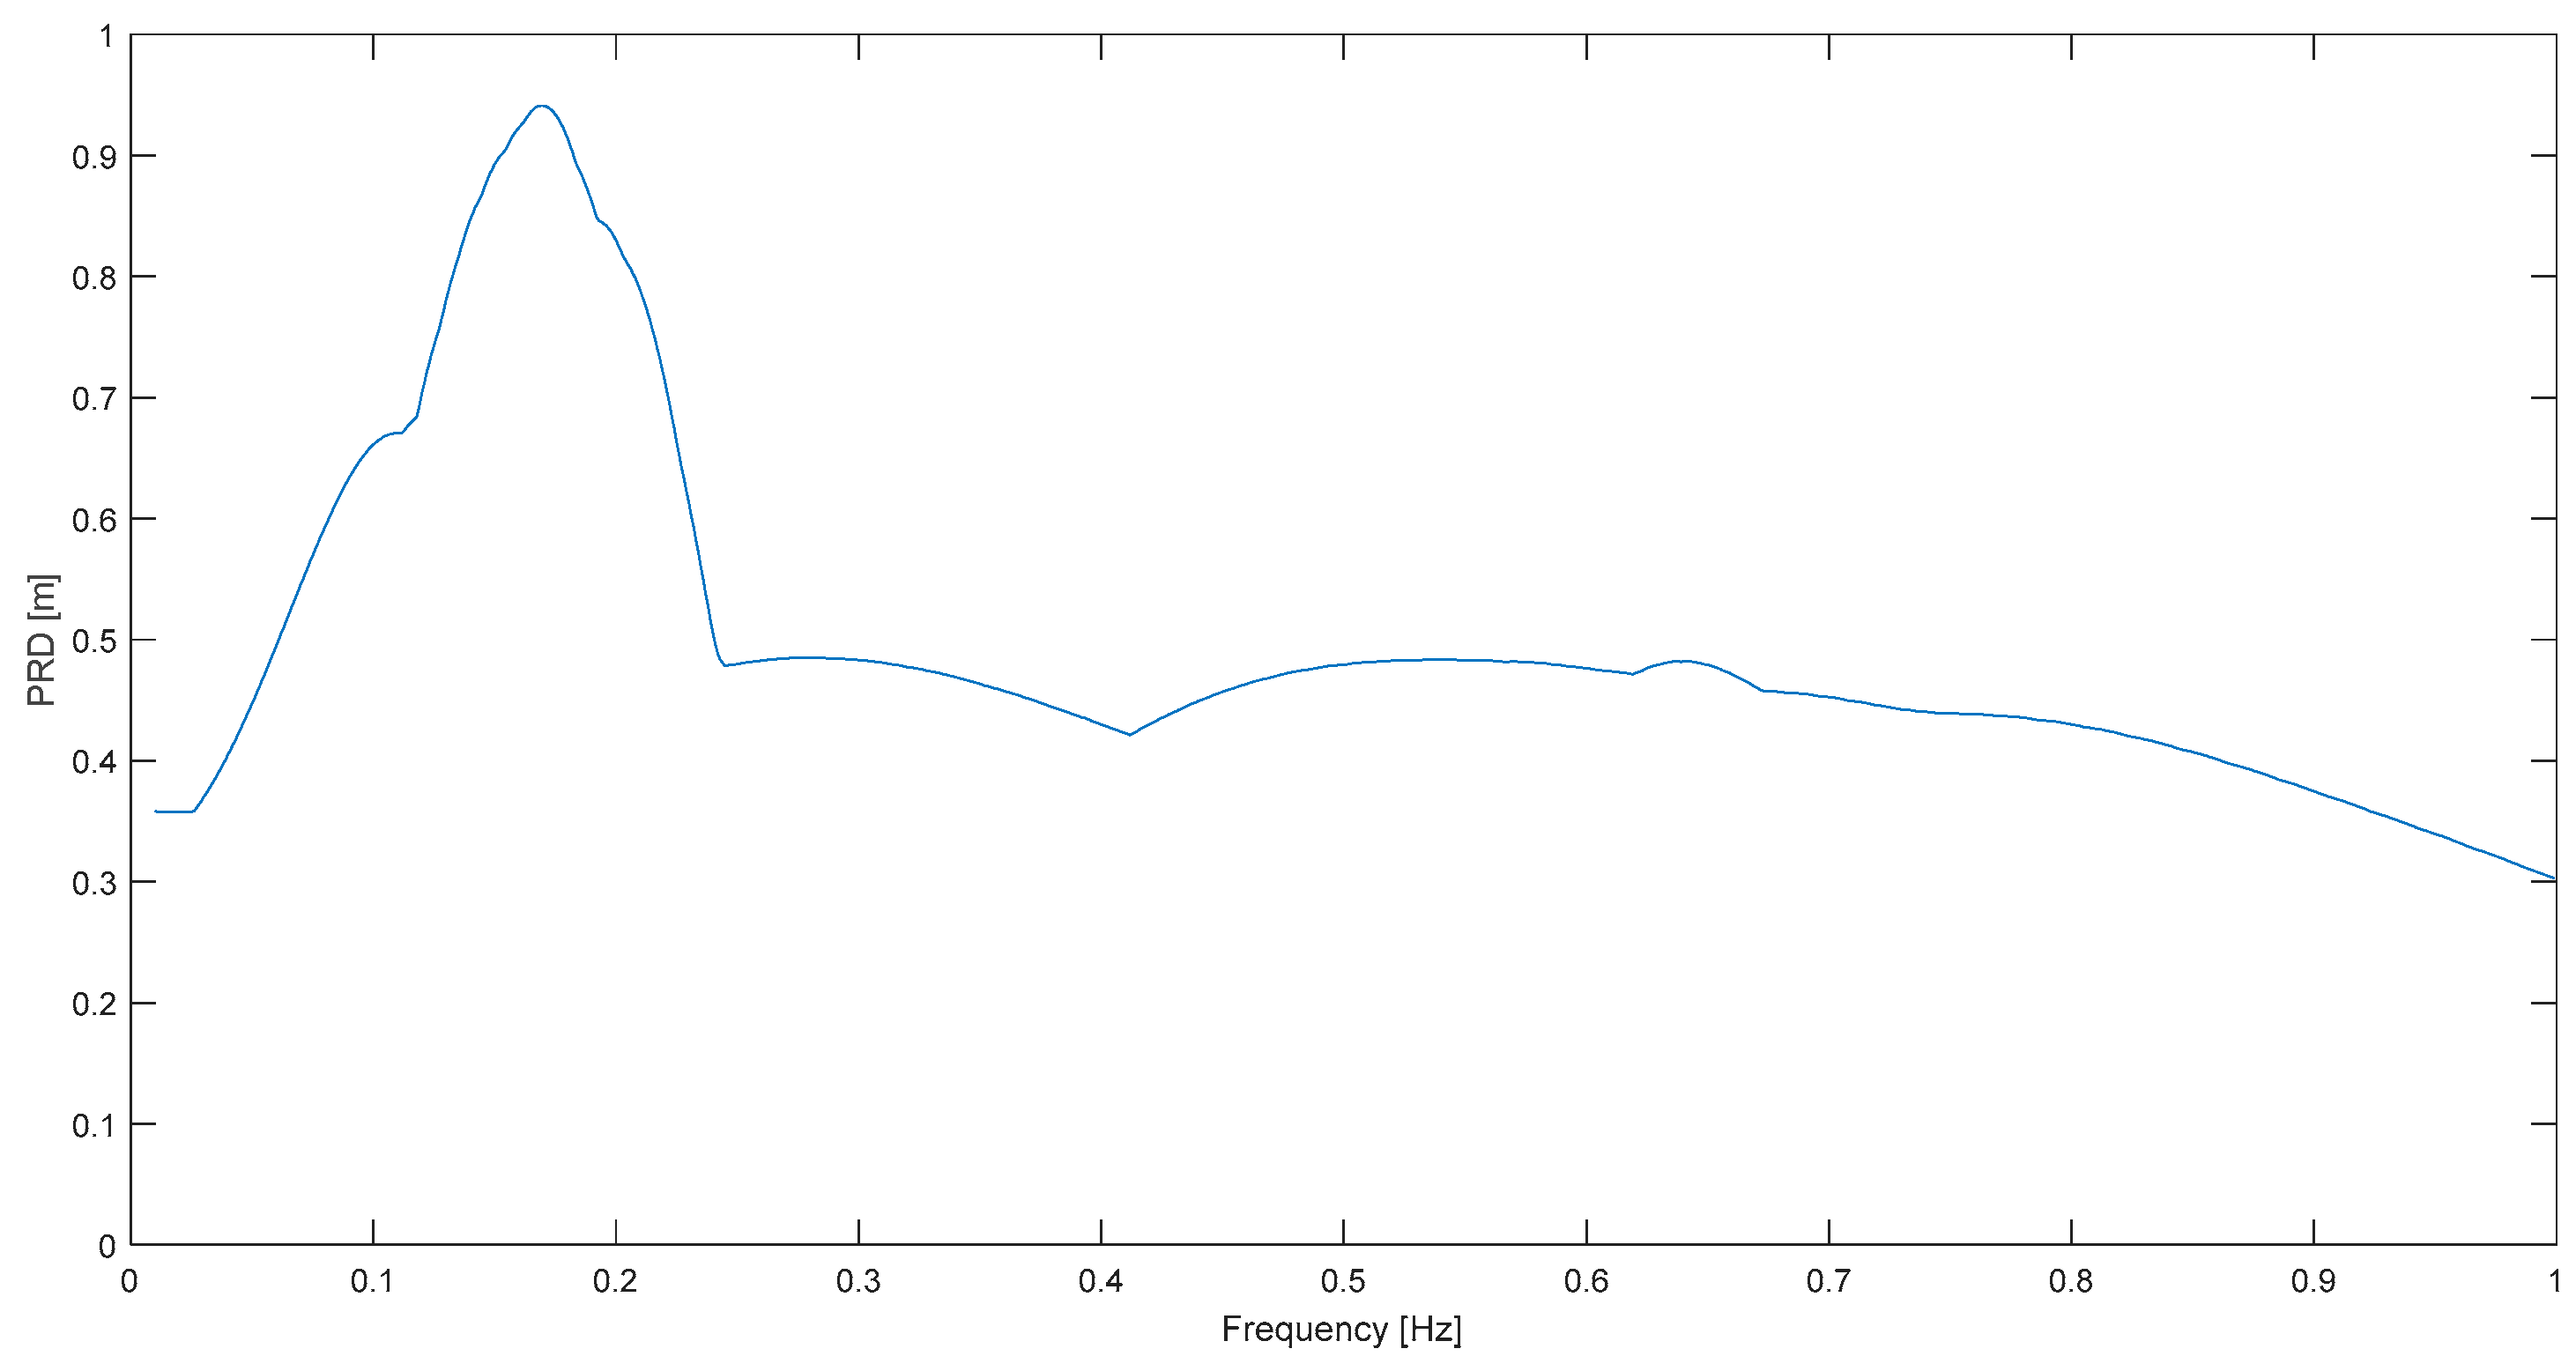
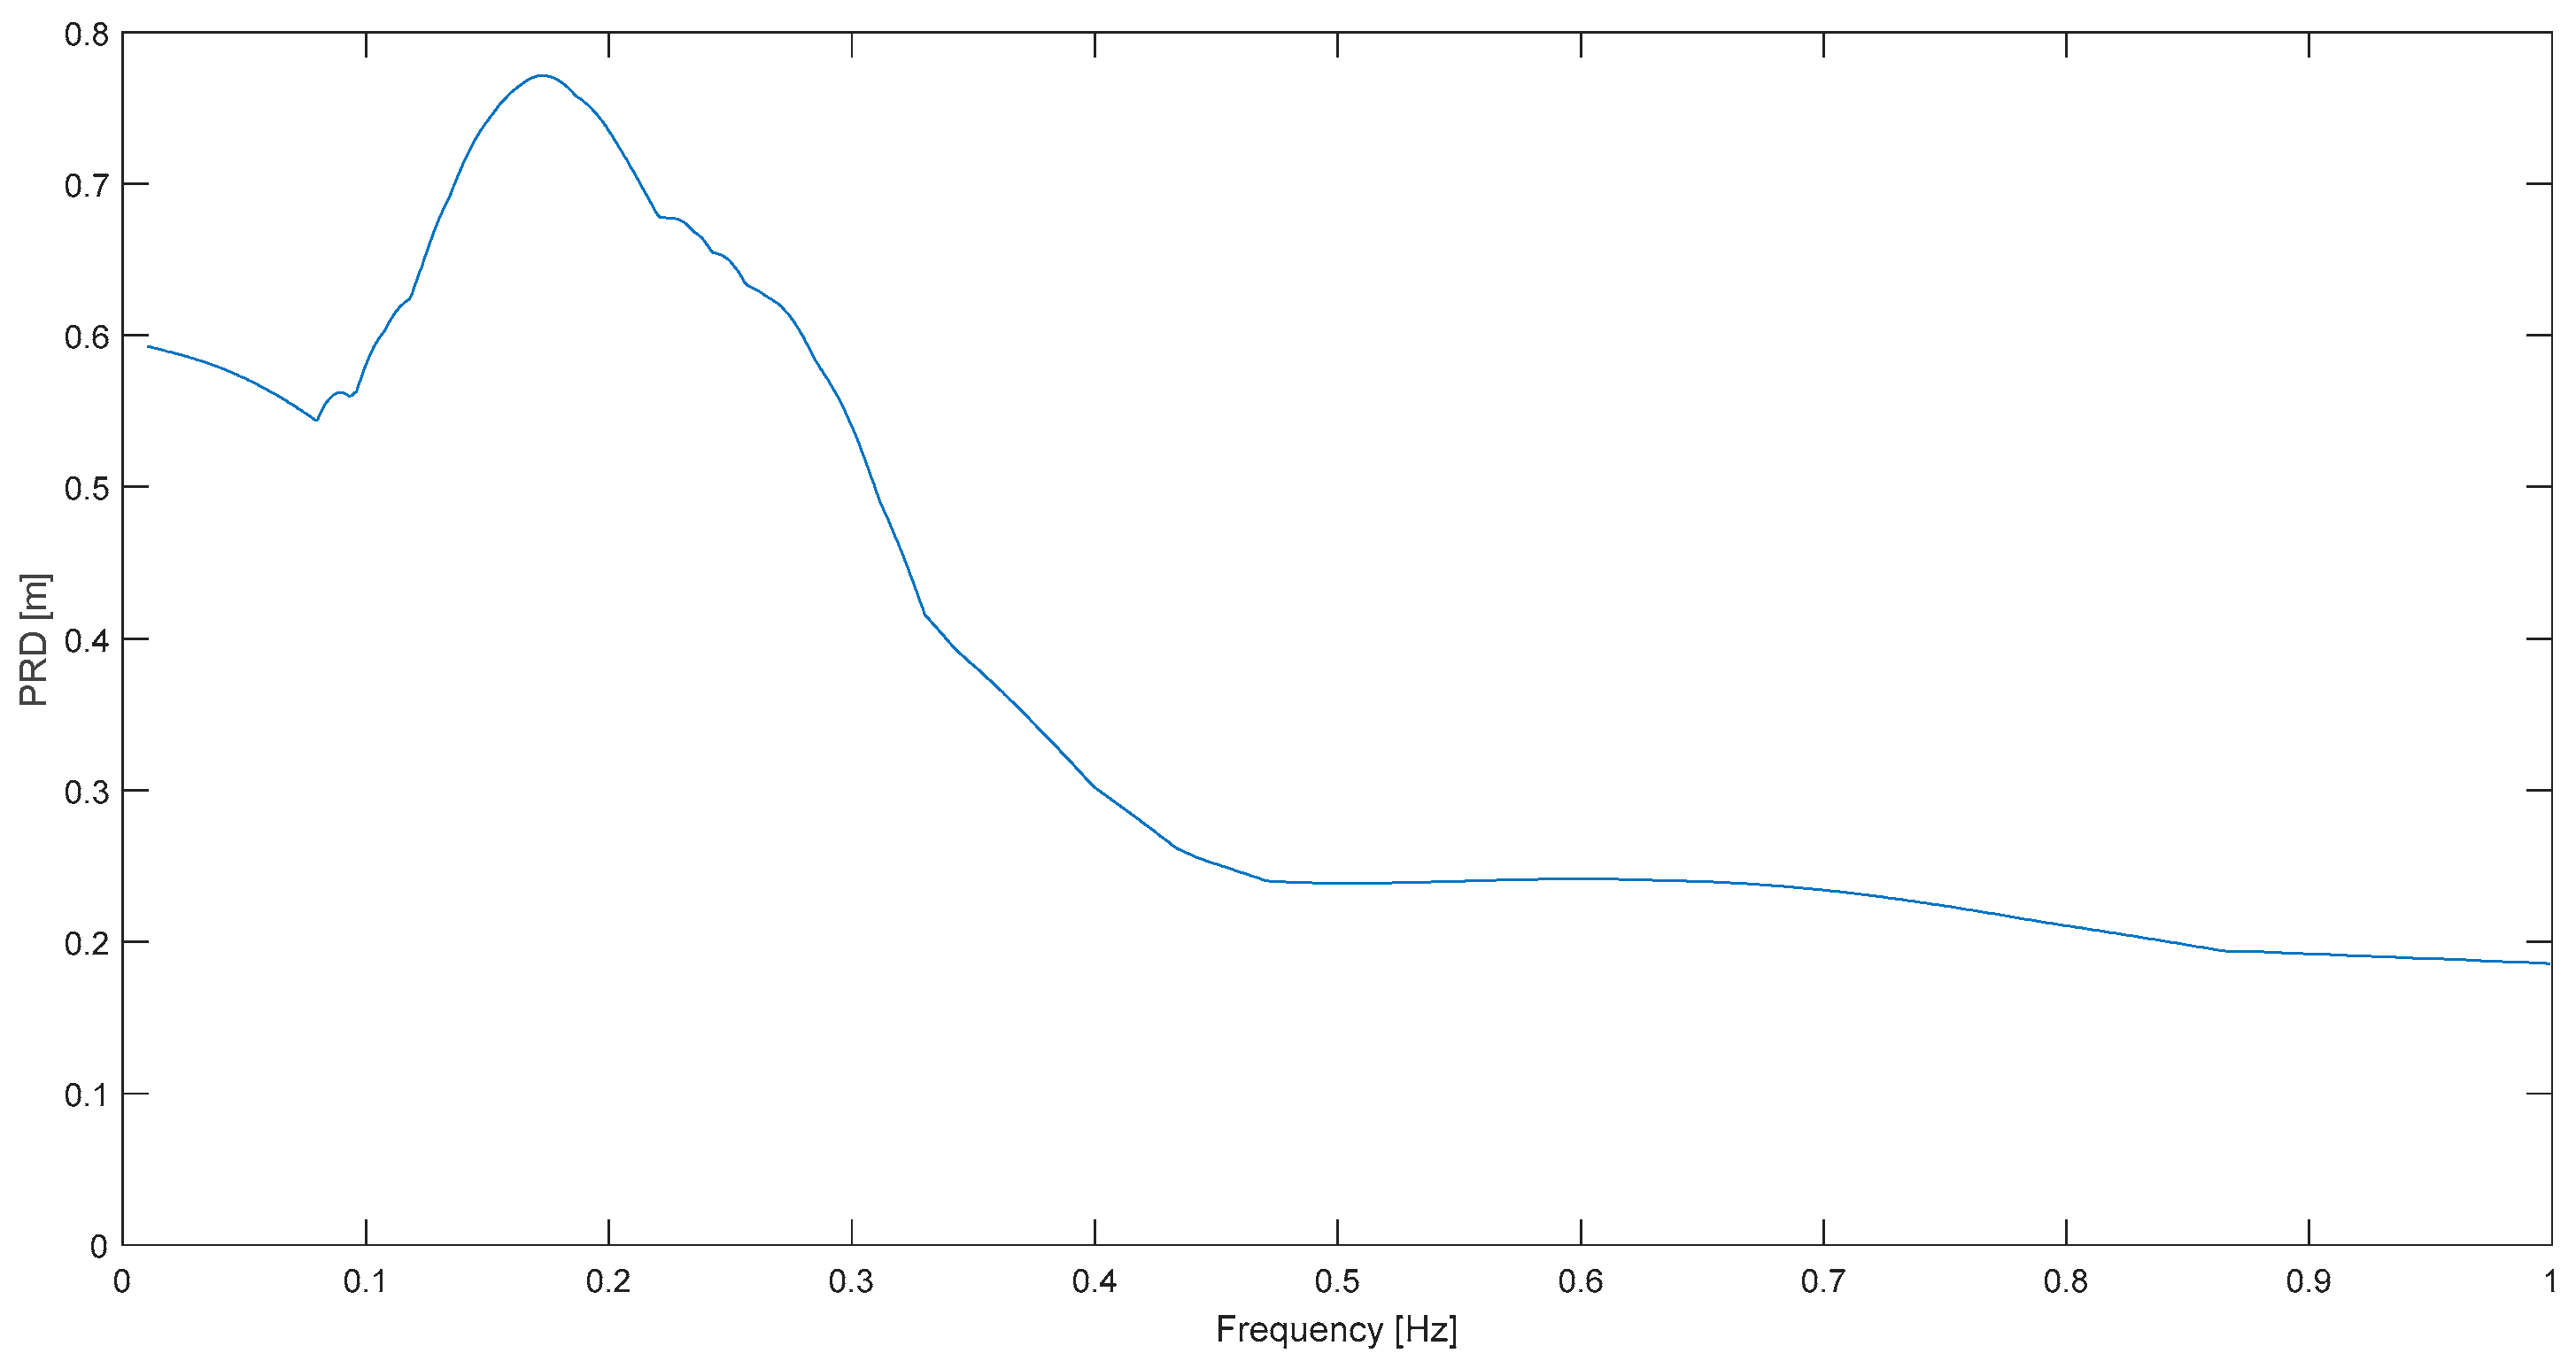
Examples of very positive results are Sierra Cucapá (
Figure 15), Chi Chi (
Figure 11) and Kern County (
Figure 2). In the first case, a very clear resonance peak at 0.12 Hz predominates over the rest of this spectrum of S. Cucapá measured at Bond’s C.; in other words, a highly narrowband characteristic can be well appreciated in this case. Note that the full plot domain is a mere 1 Hz but still a strong spectral concentration is observed at 0.12 Hz. In the other two spectra for Chi Chi and Kern C. a dominant frequency is clear as well, although it is not as neat as in
Figure 15. It is emphasized that to observe so clearly spectral predominance was previously impossible by means of acceleration response spectrum, which is or has been in most works so far, the common response spectrum employed for the objective.
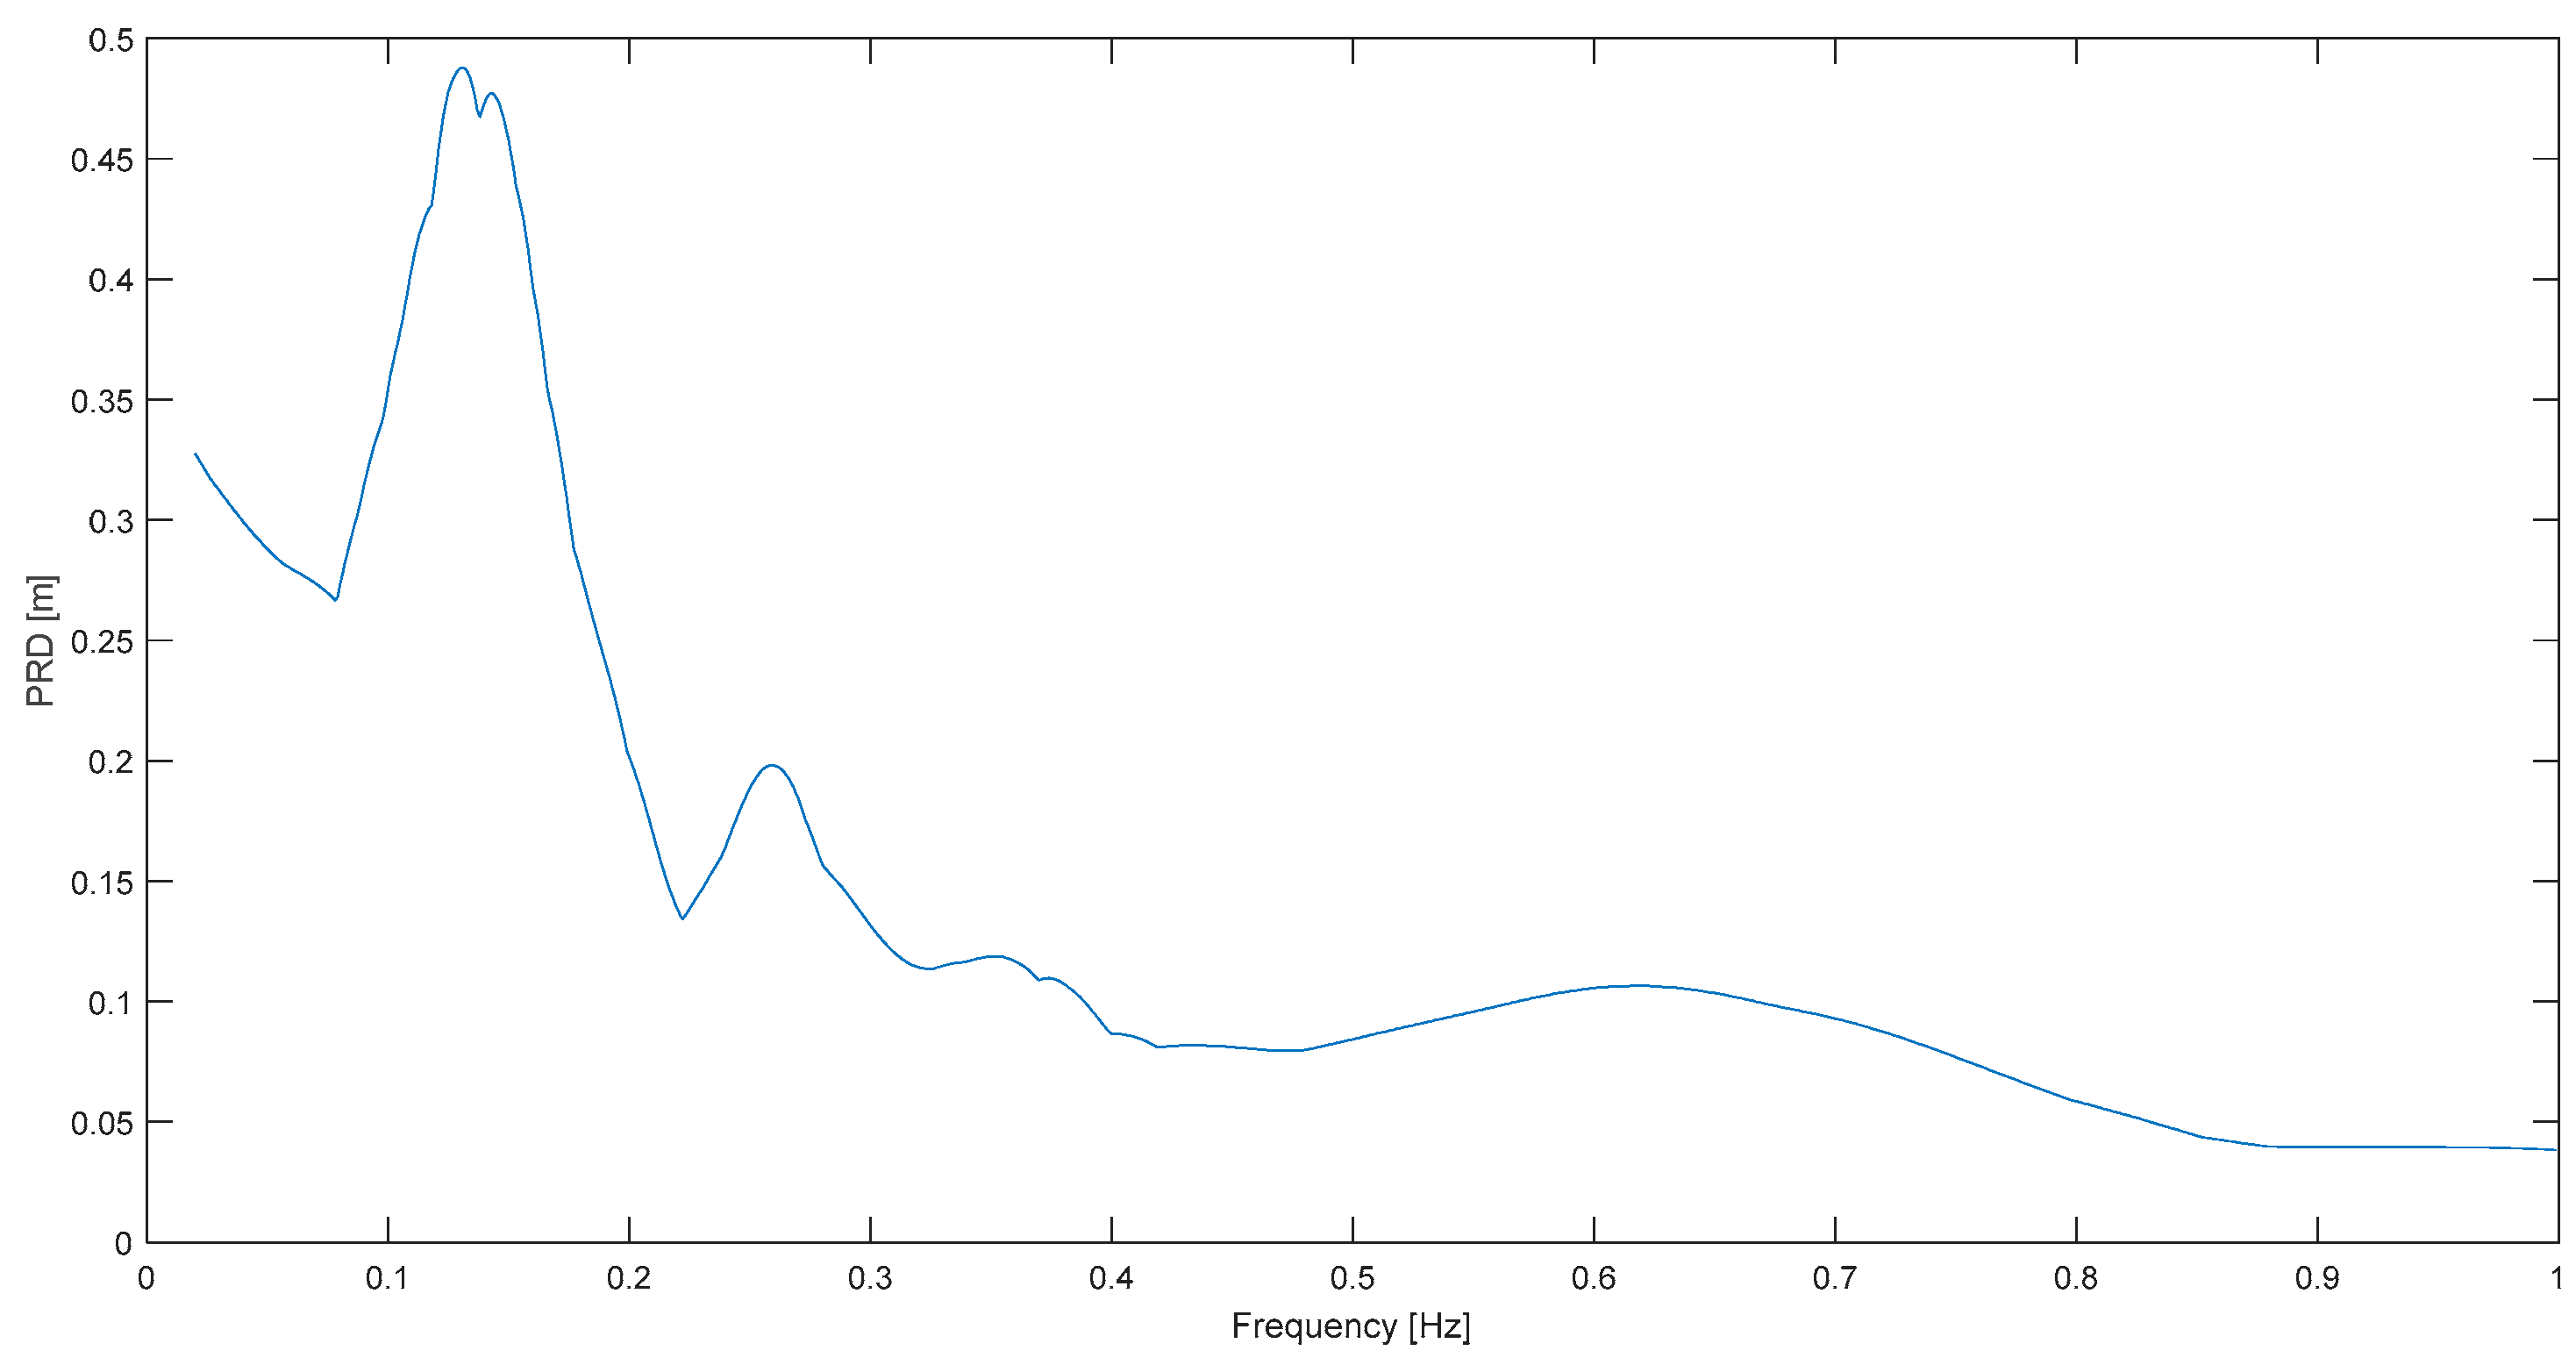
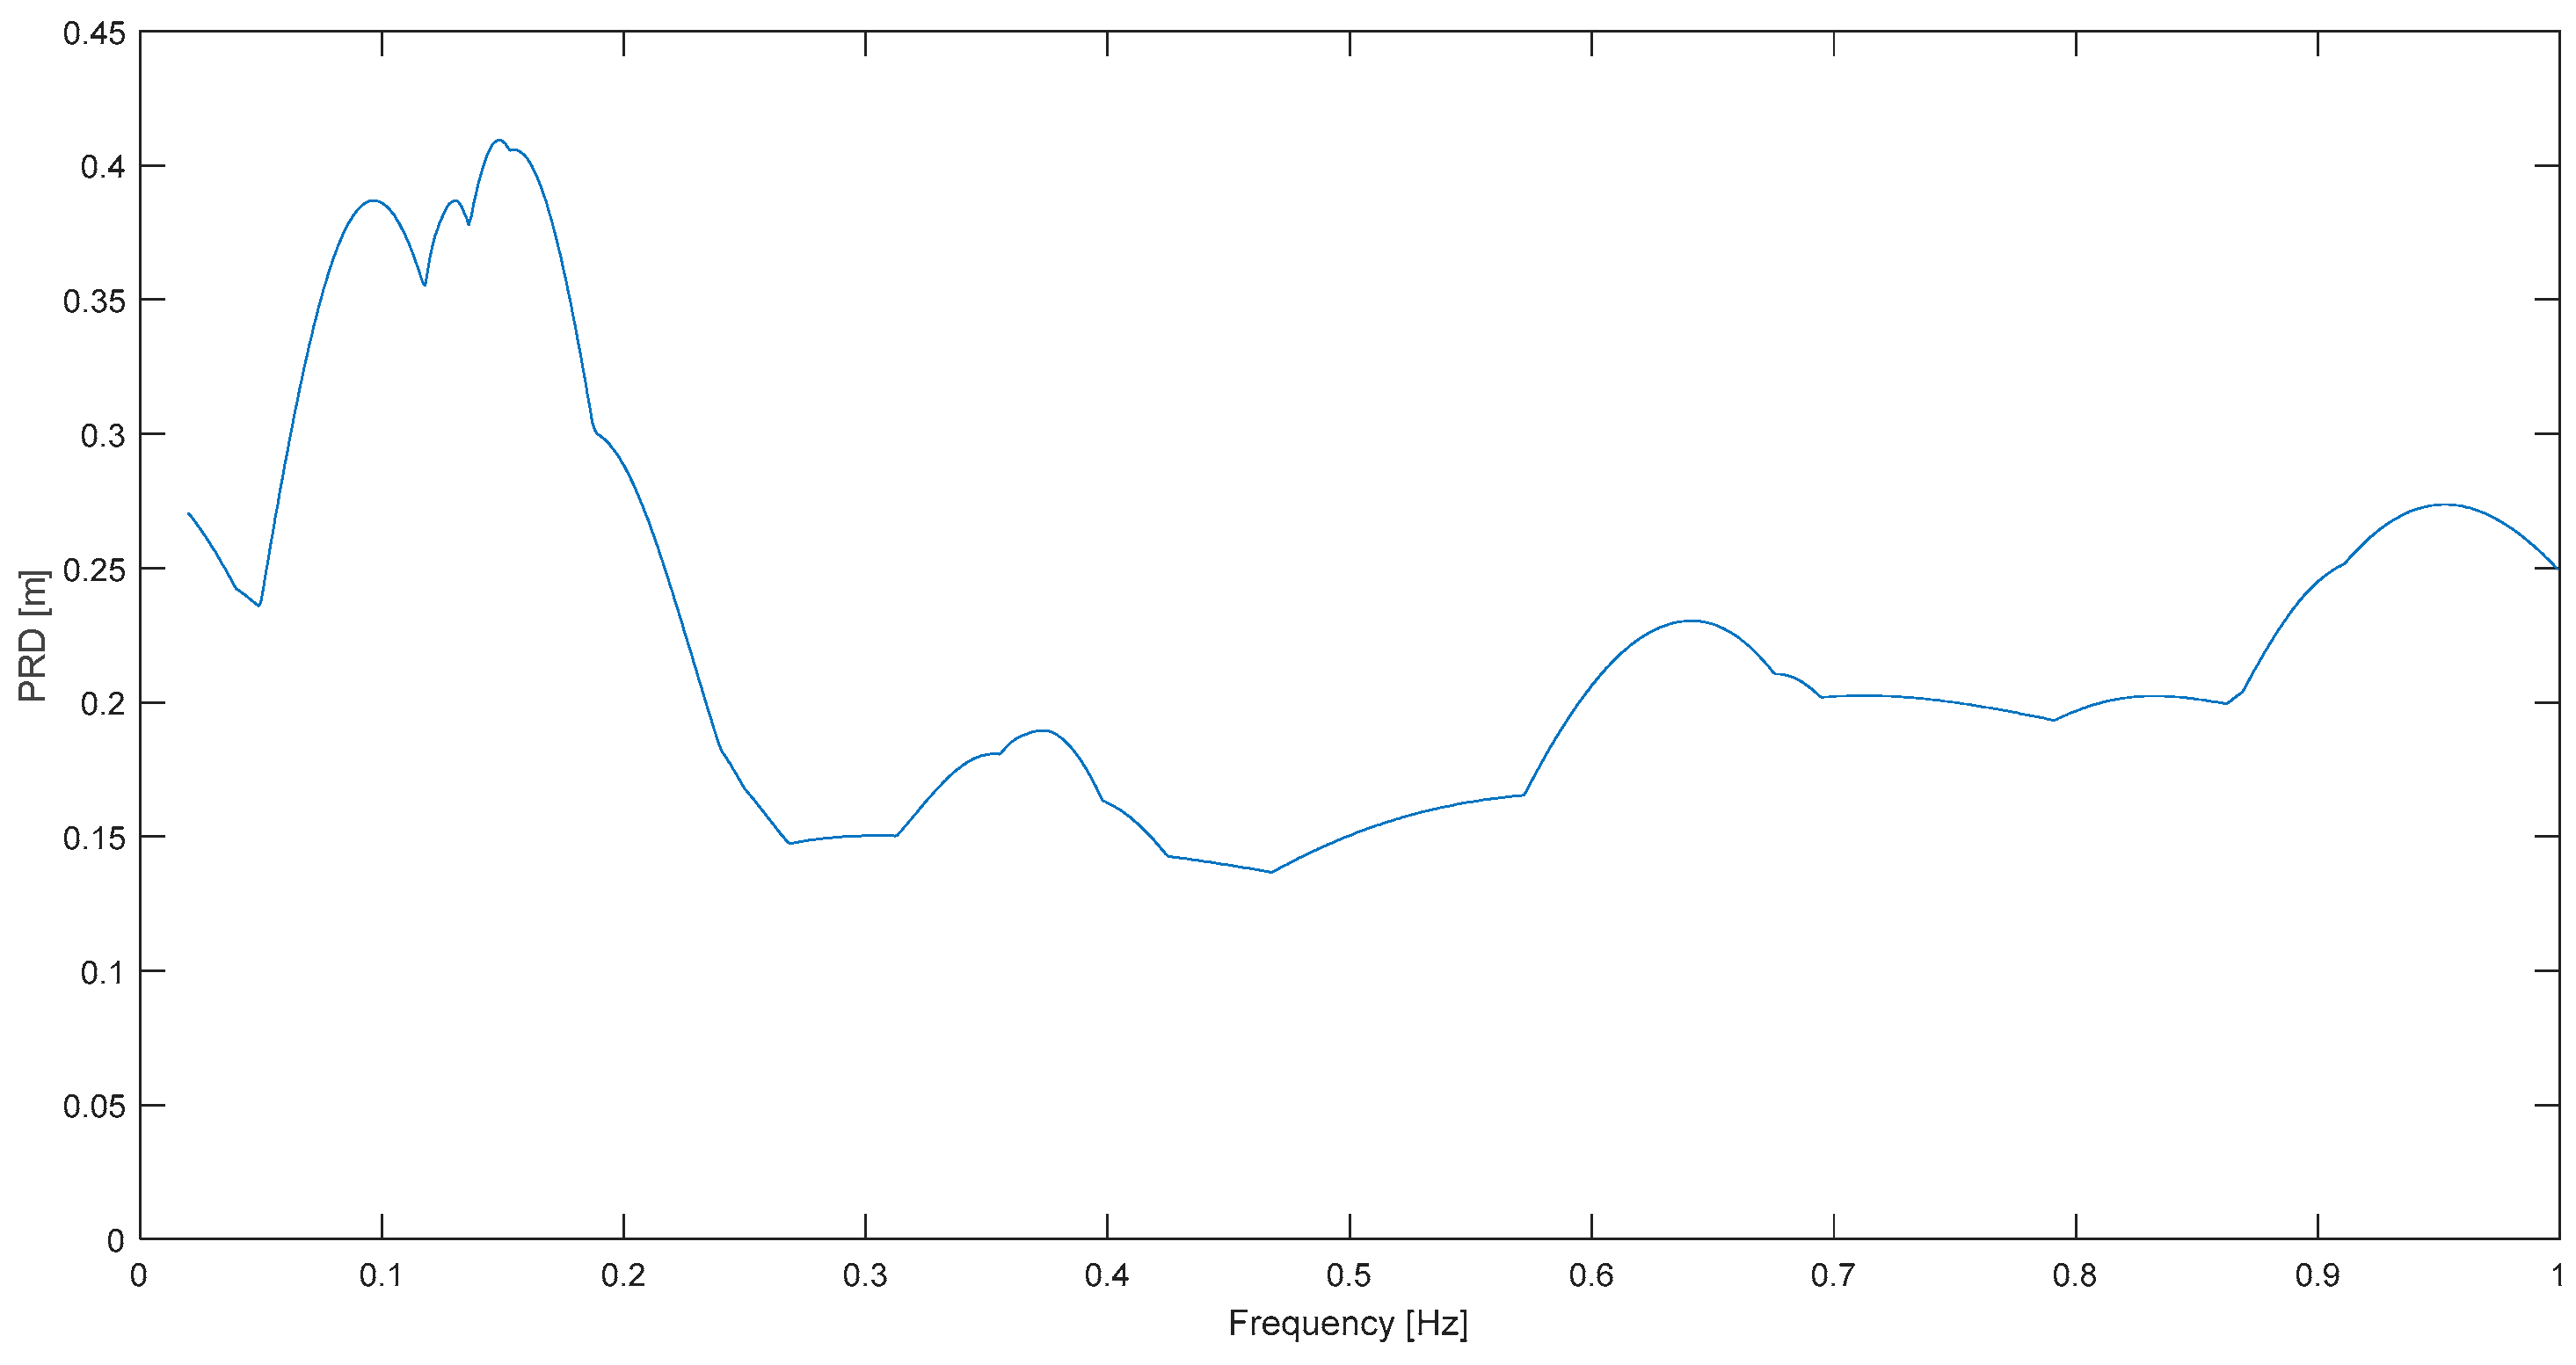
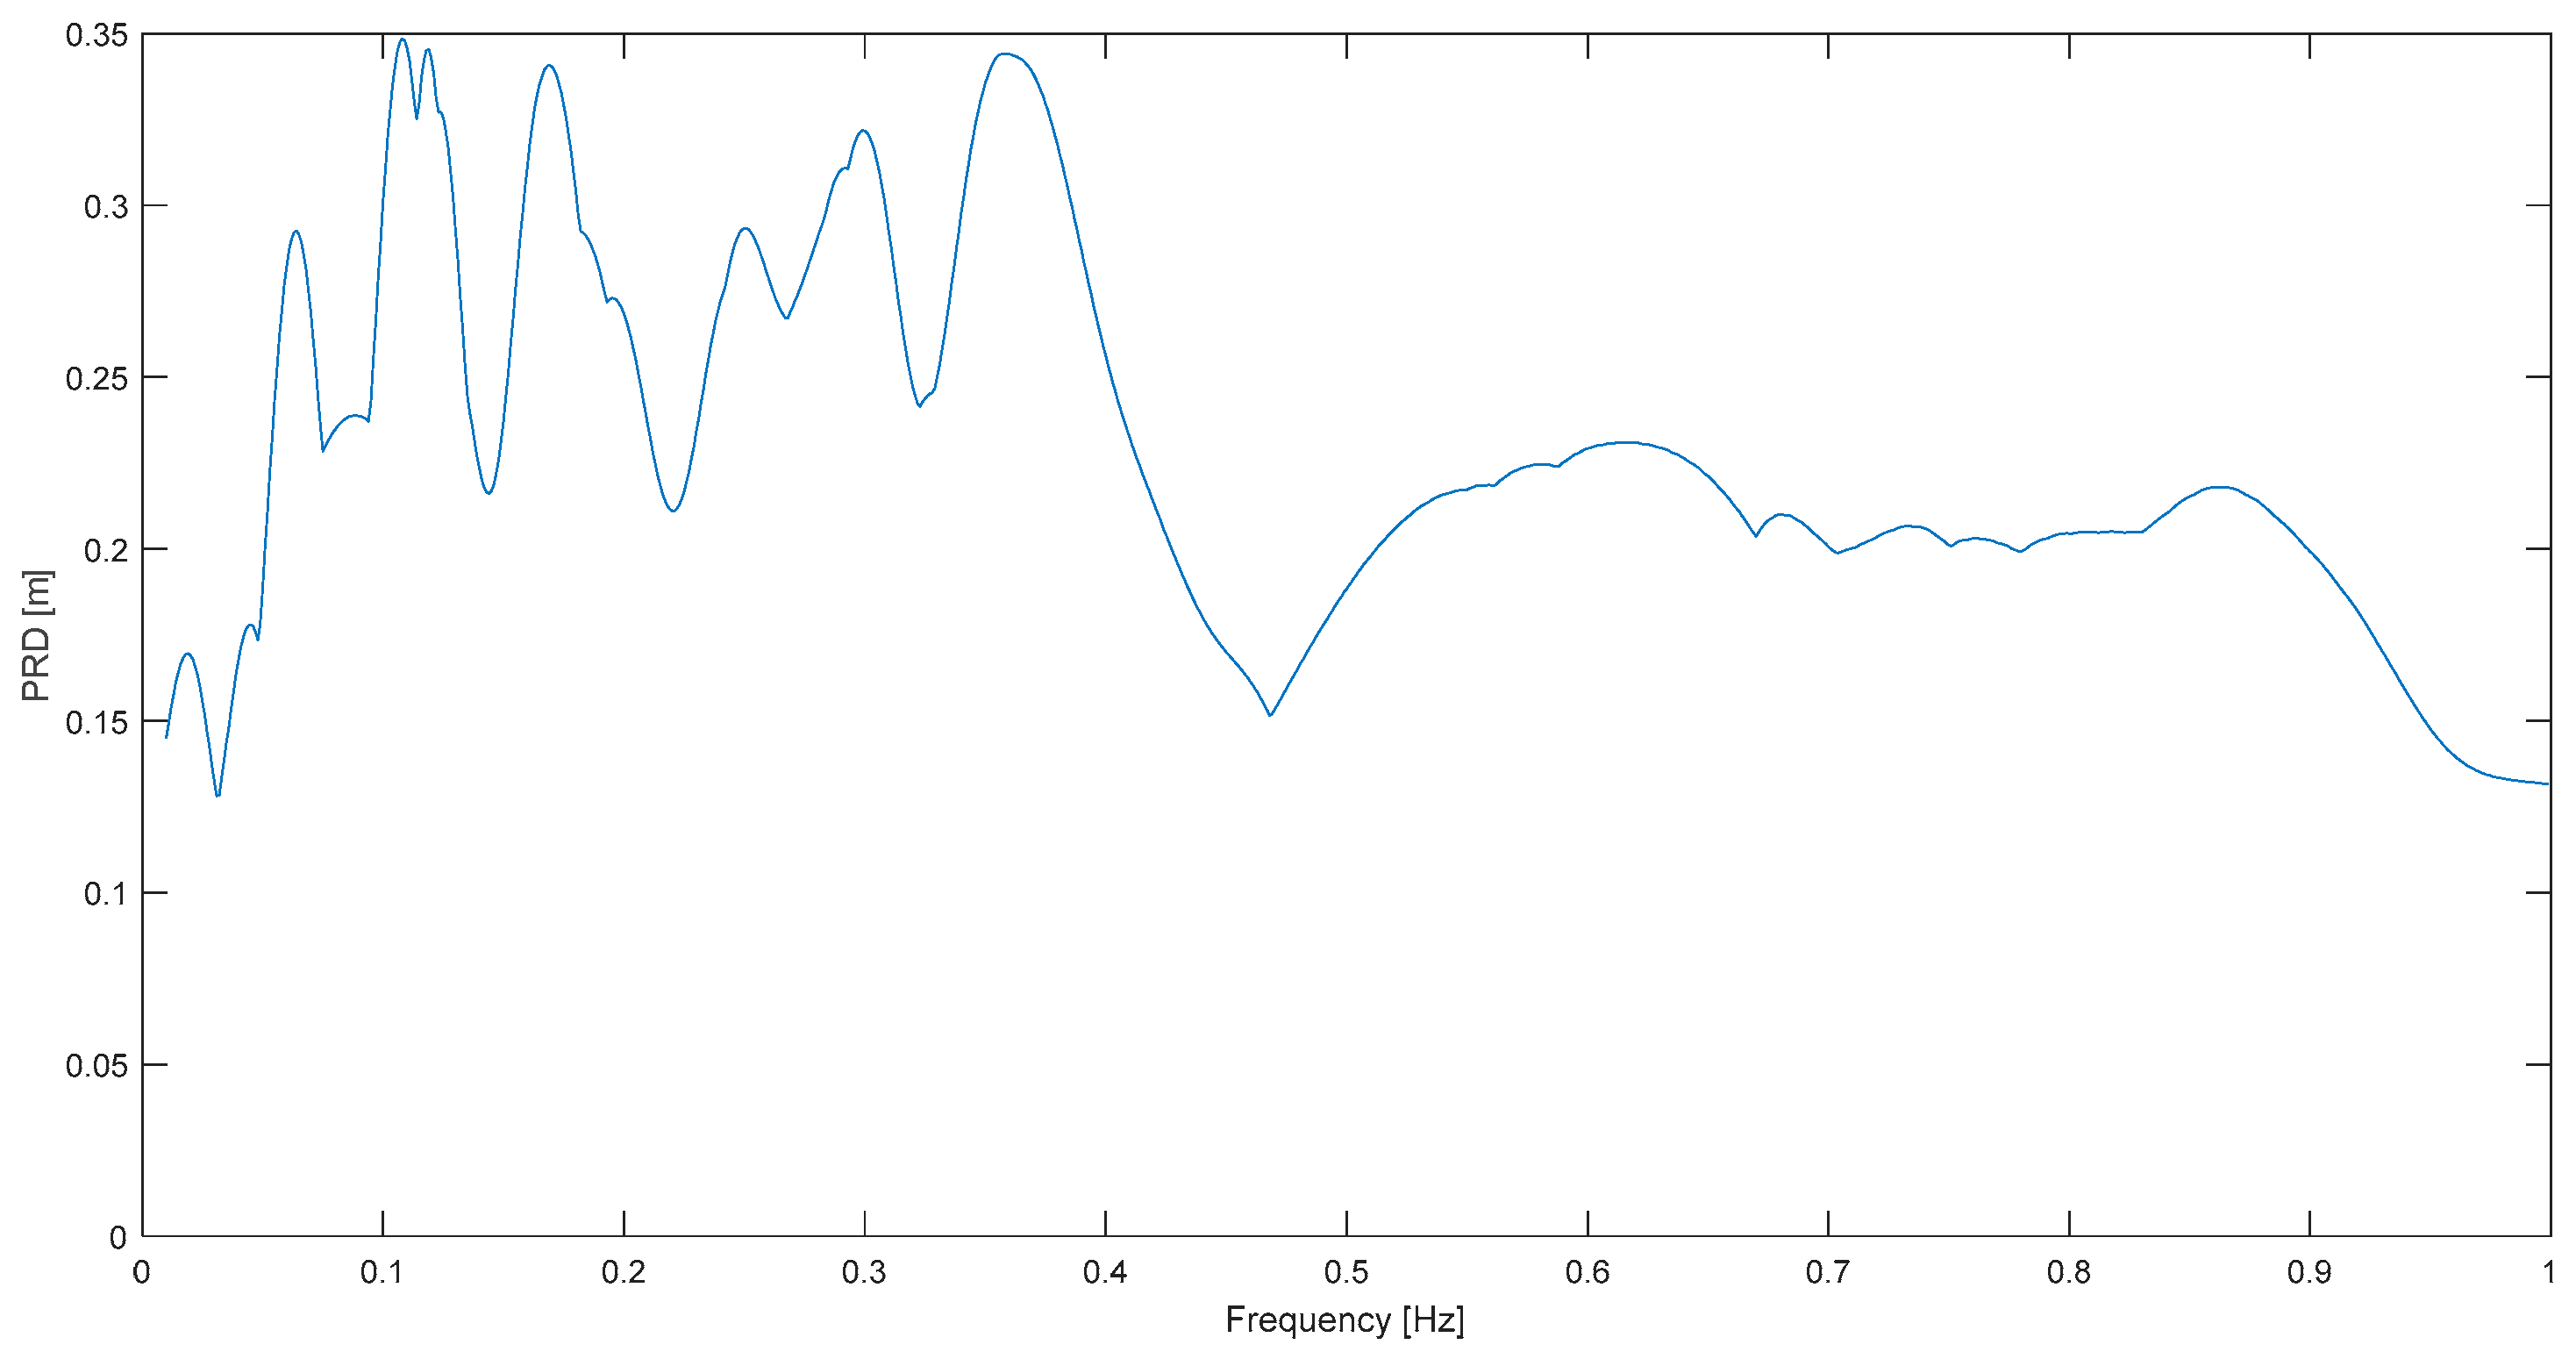
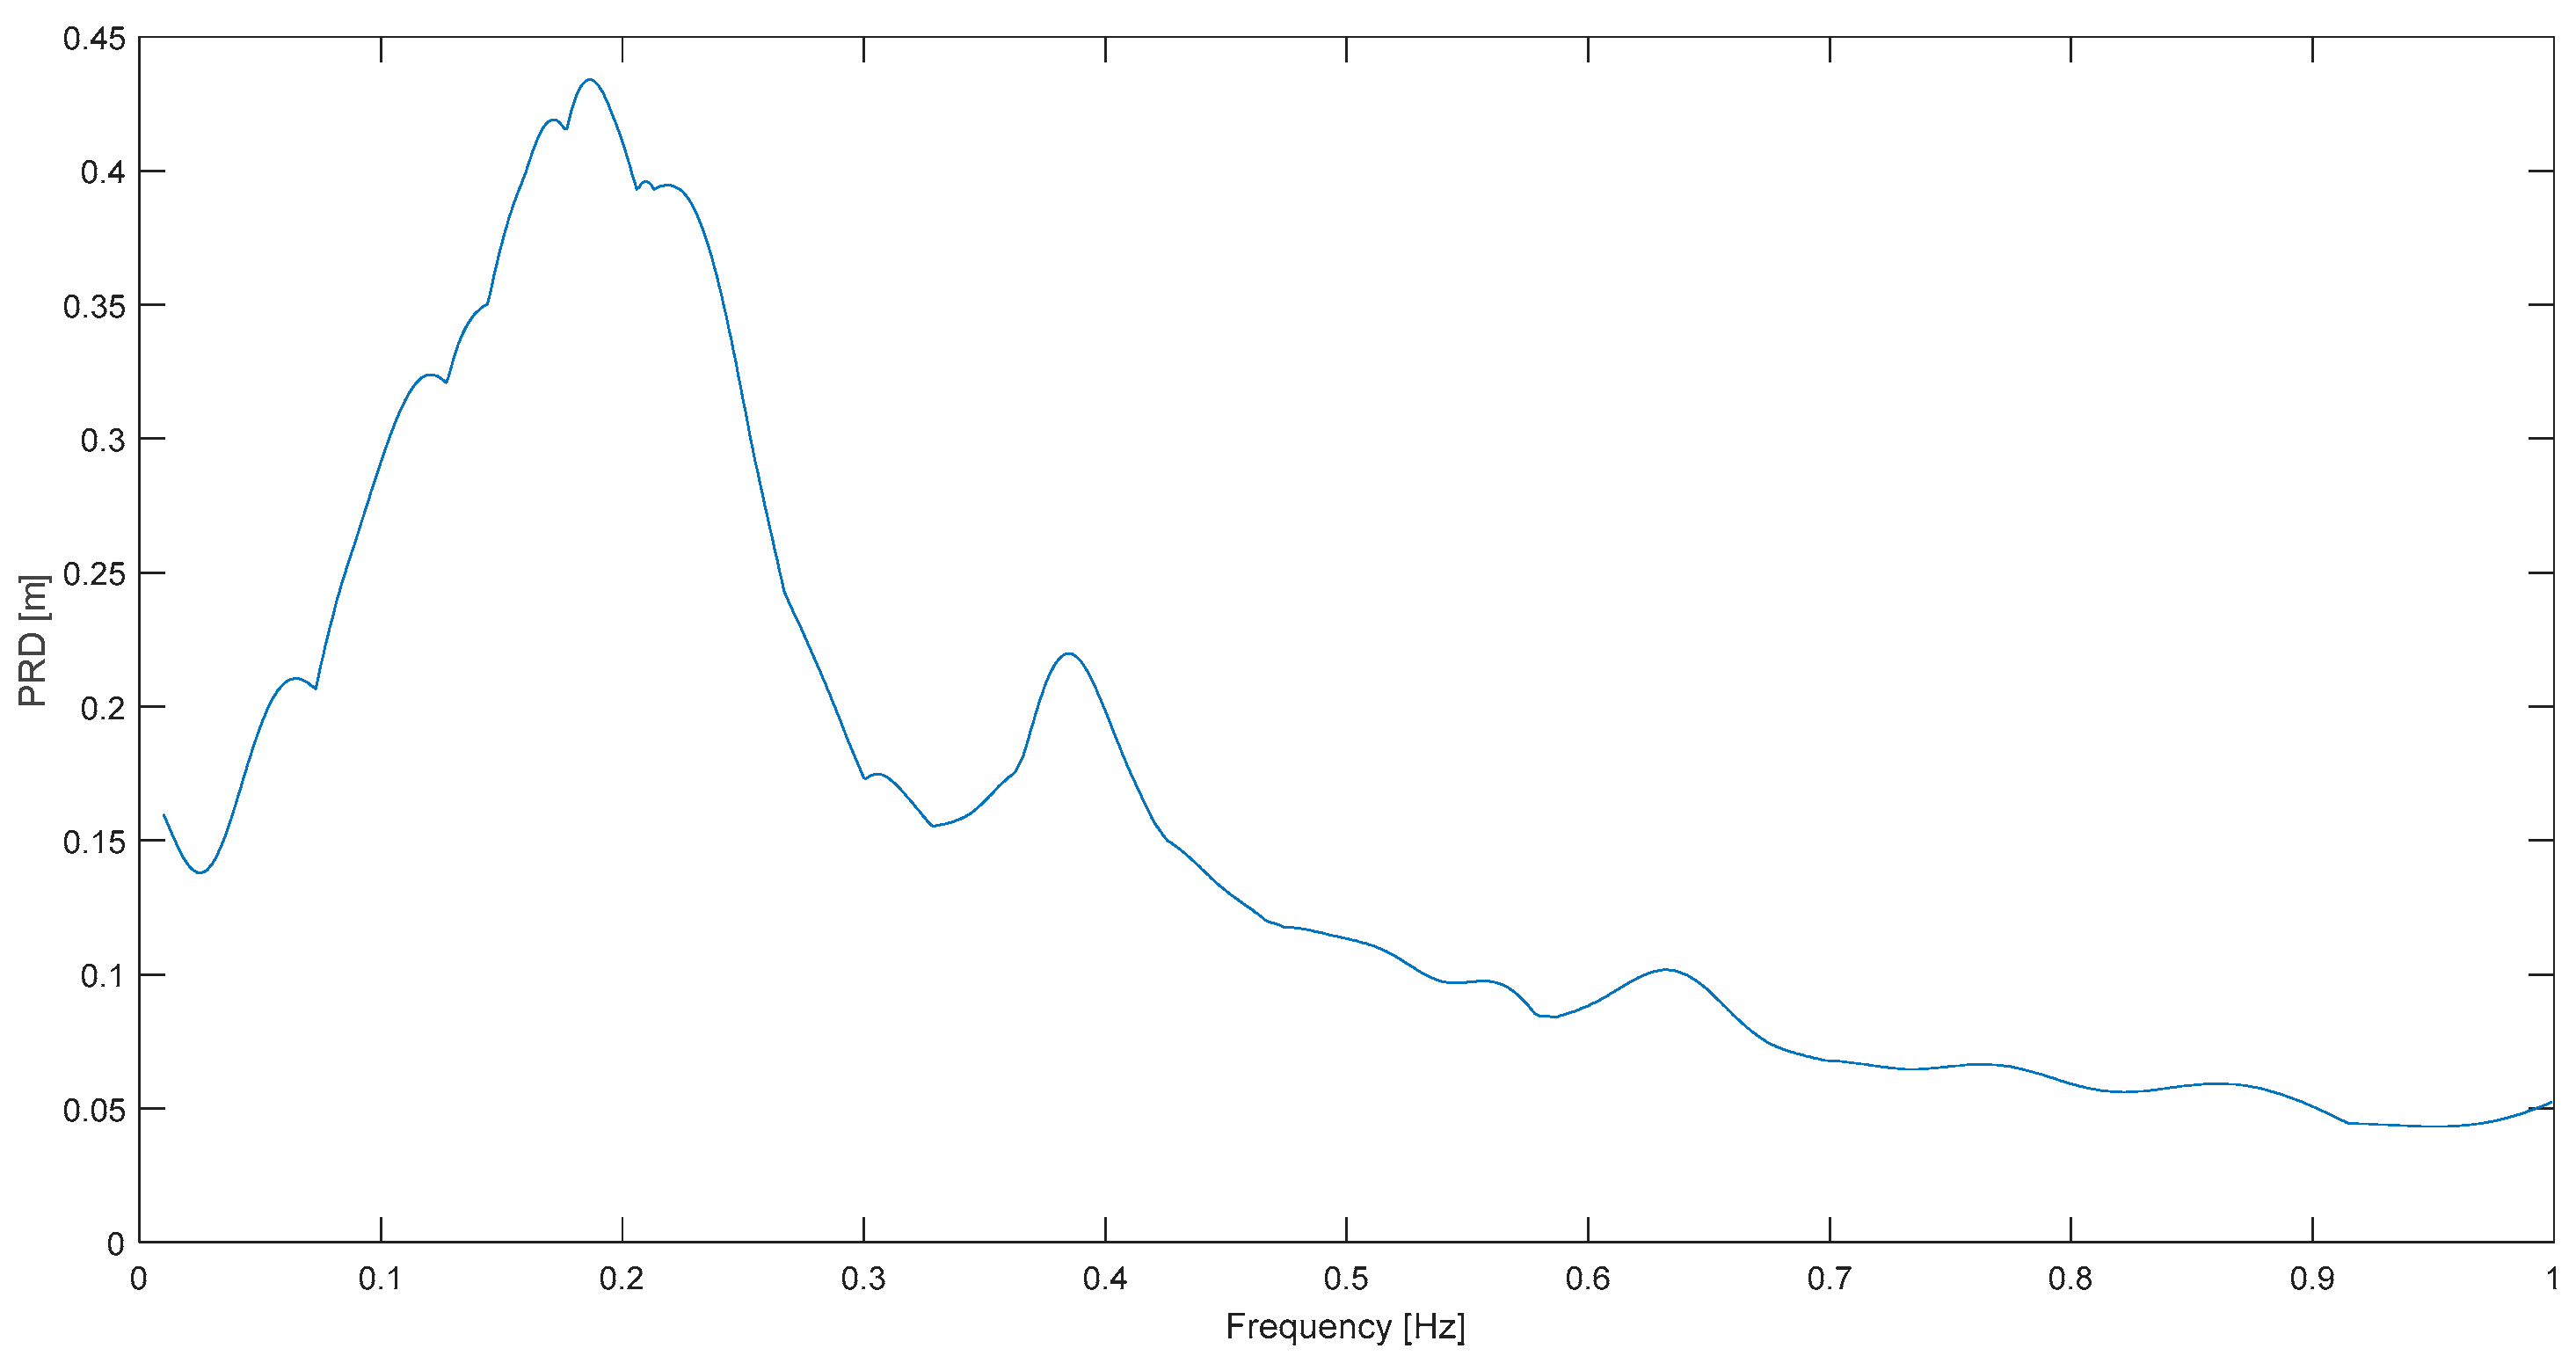
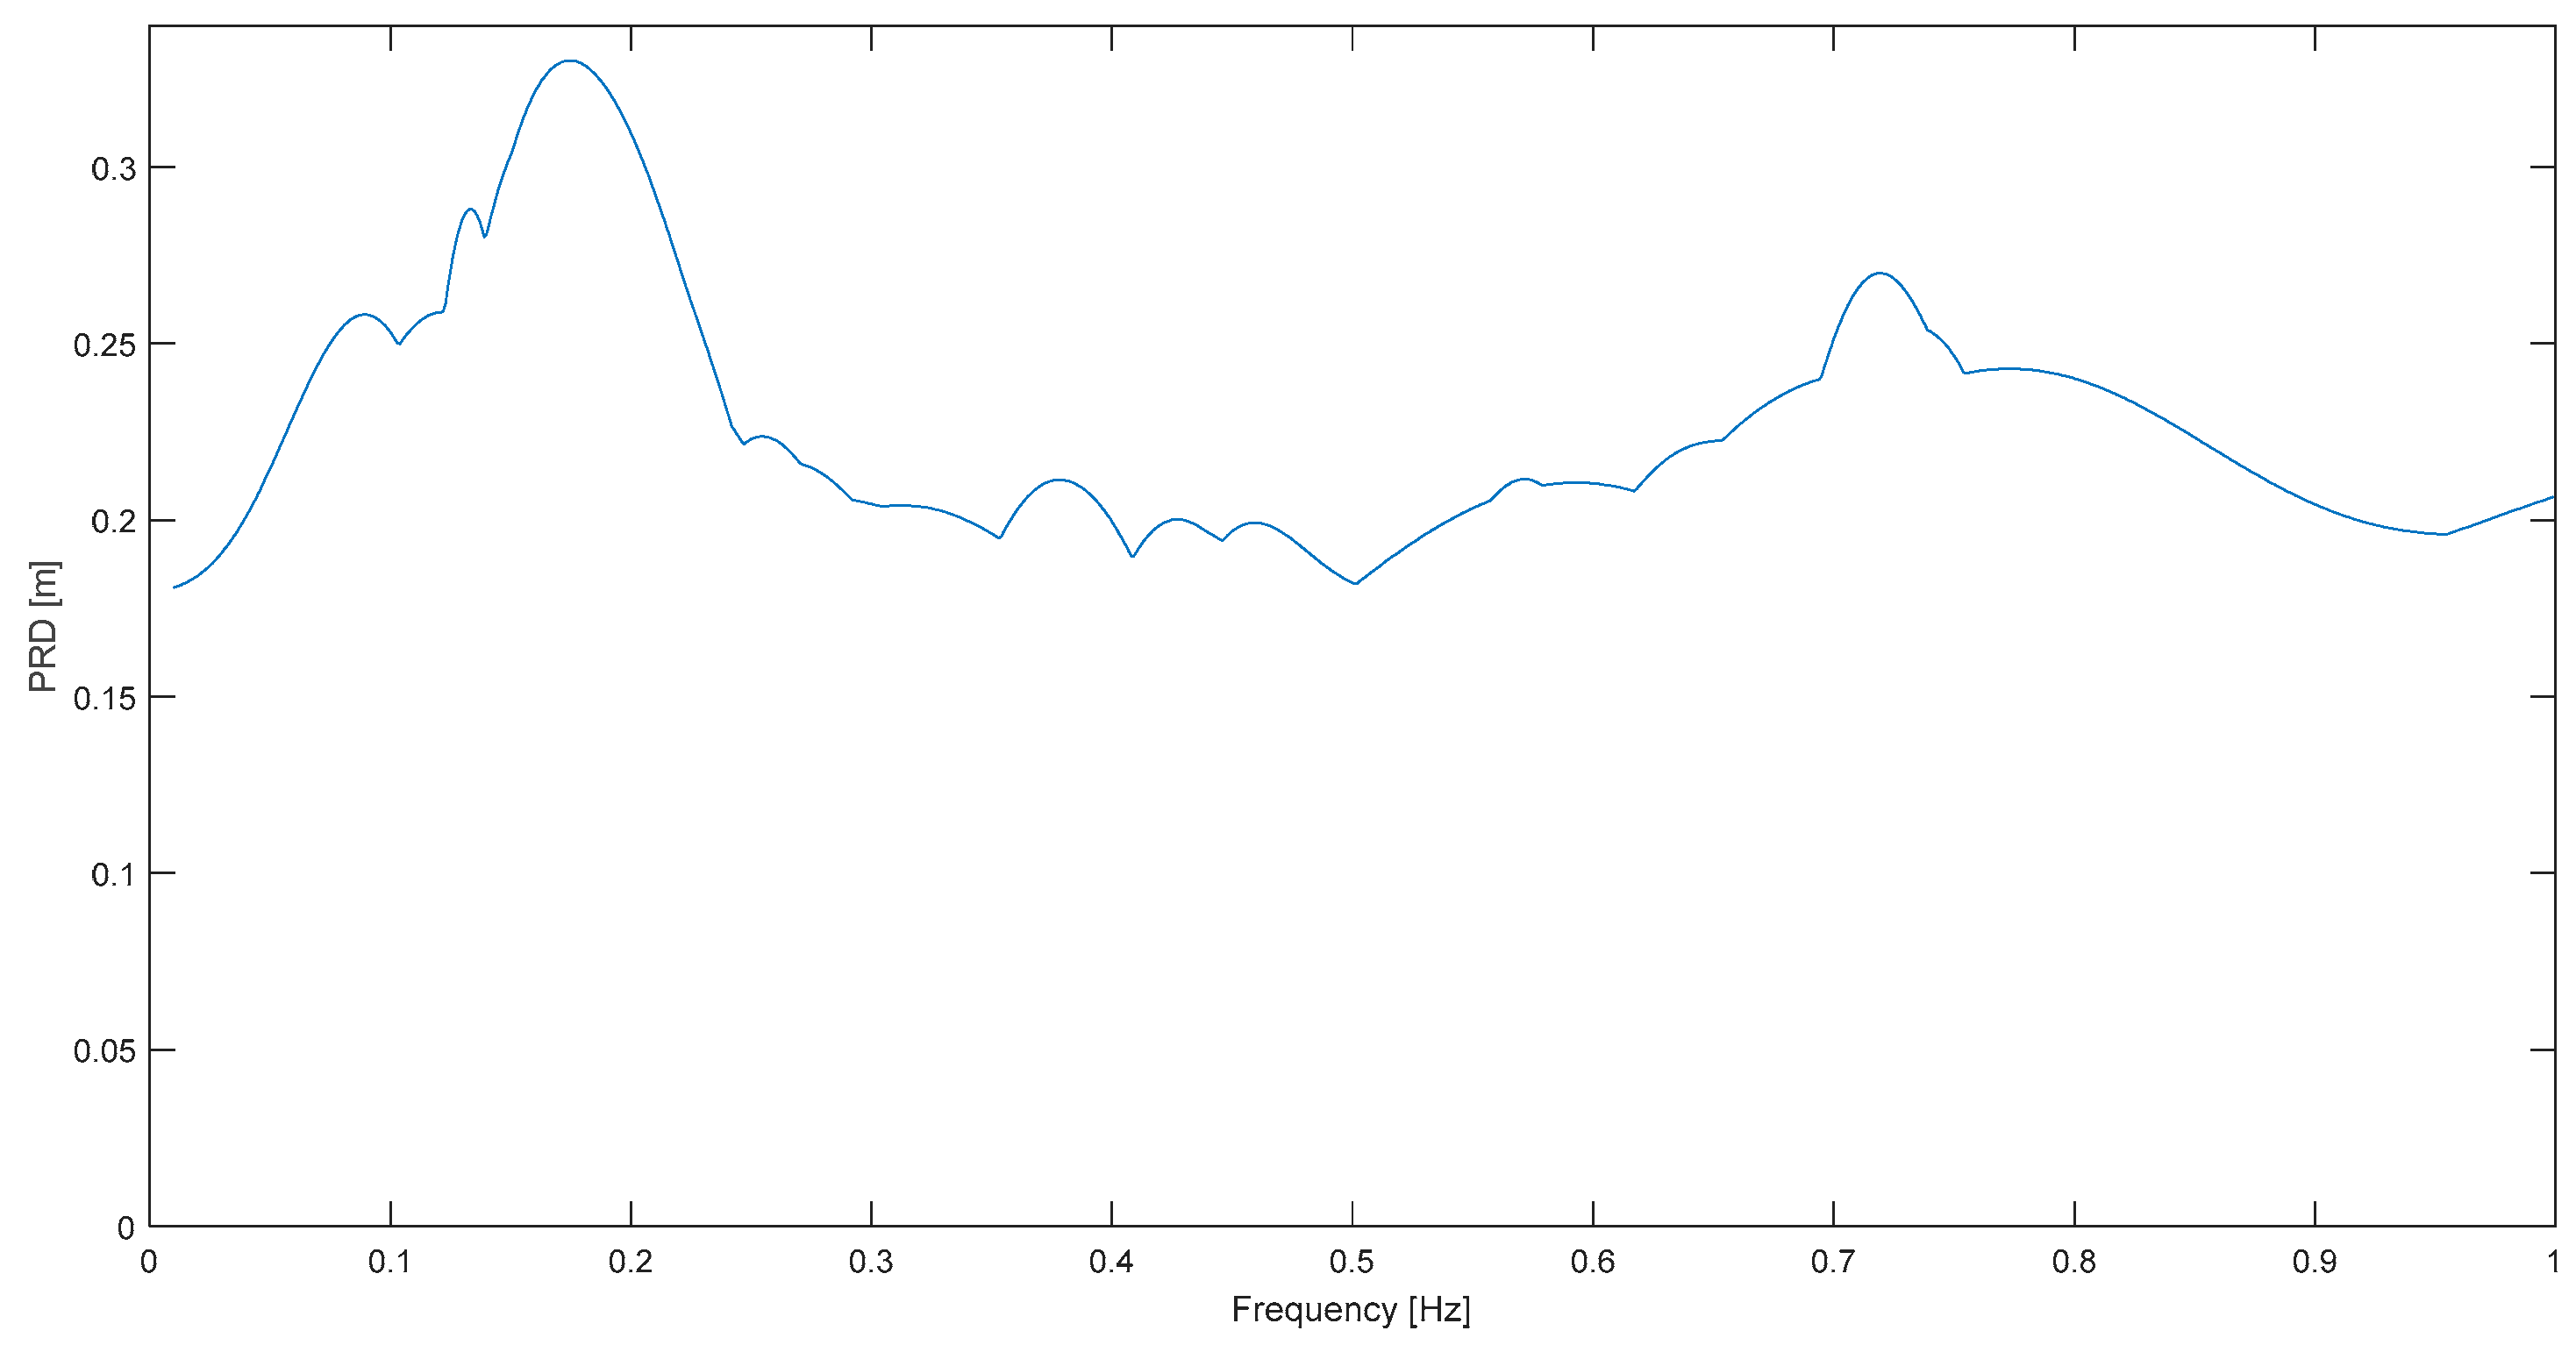
On the other hand, two not-so-neat results are highlighted as well. One is L. Prieta at Corralitos (
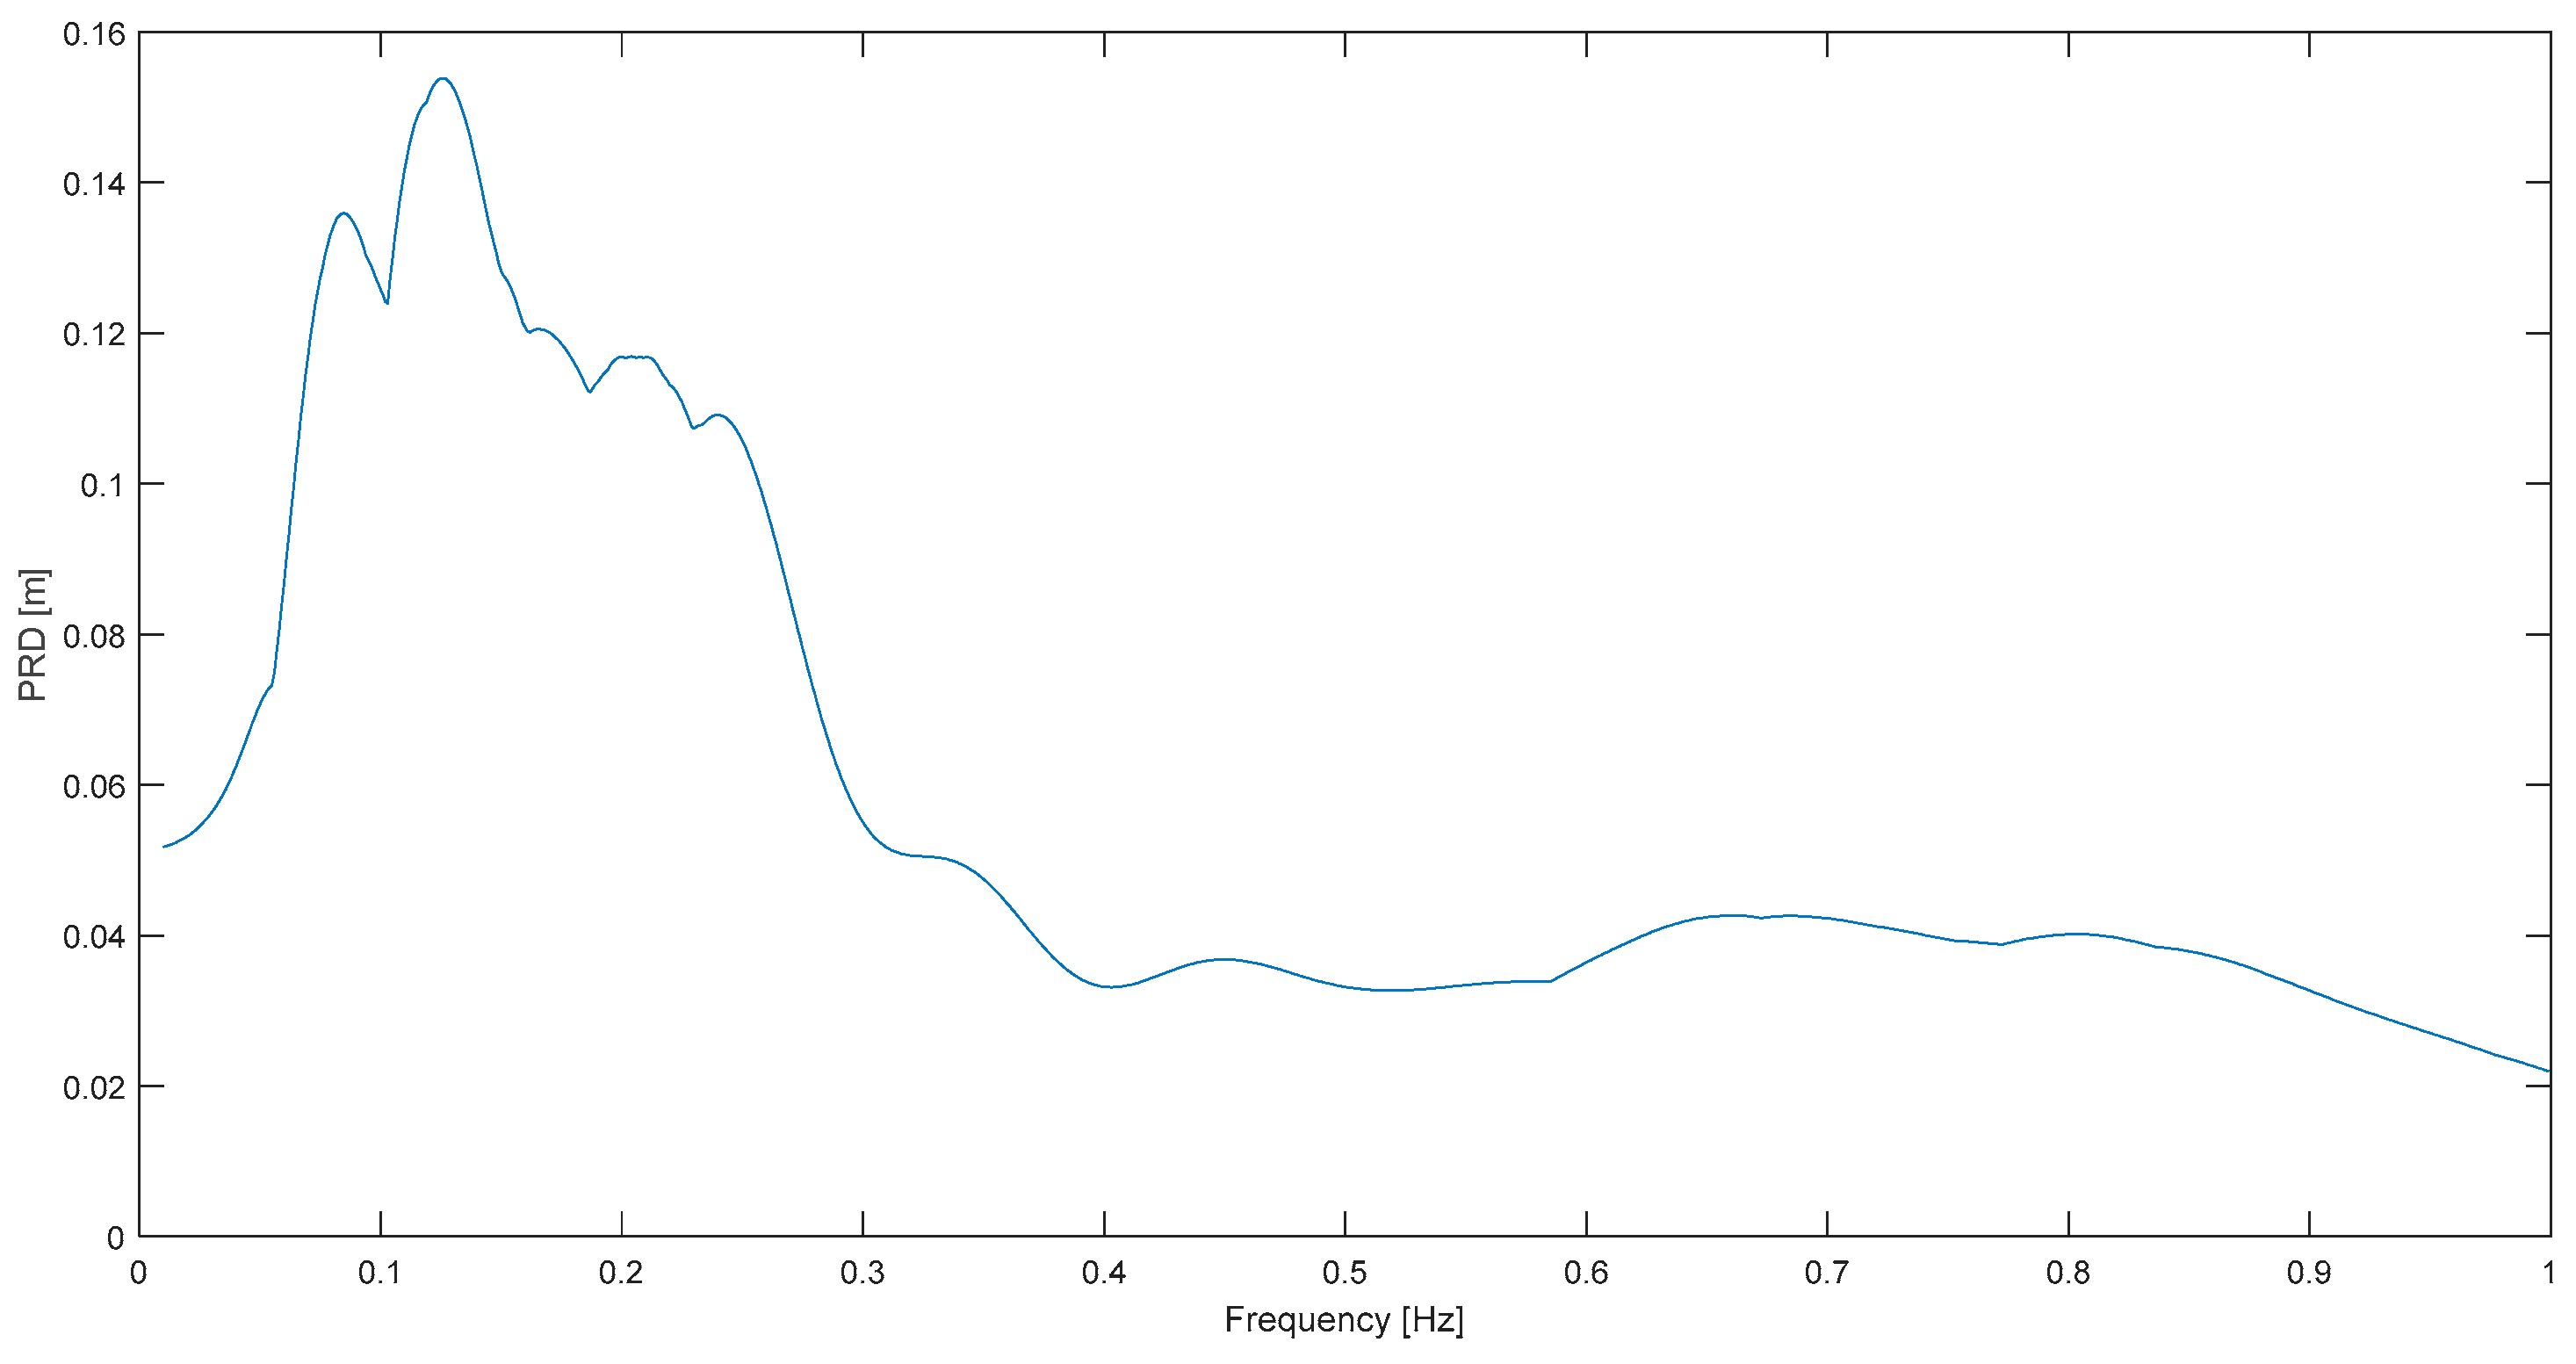
Figure 7), where there is no narrowband characteristic, or there are dominant frequencies on a more extended band: 0.11–0.19 Hz. However, according to the definition, 0.12 Hz is also the predominant frequency in this case, the same as in S. Cucapá. Landers at Joshua T. (
Figure 9) is the other example in which it is also difficult to talk about a predominant frequency because there are actually 4 or 5 dominant frequencies; but again, it is emphasized that the main one or the “predominant” one (0.11 Hz), is still in the 0.1–0.2 Hz limited, expected, and general band.
Let us now perform a more detailed analysis of the results, which is a statistical characterization of the predominant frequency. First, considering that the liquefaction cases have consistently above-average predominant frequencies—fact that will be discussed in the next paragraph—these 3 instances are taken out of the first analysis. Thus, the predominant frequency mean value is 0.147 Hz, and the standard deviation is 0.042 Hz for a favorable coefficient of variation of 28.4%. In contrast, working with power spectra of ground acceleration, Lai [
3] obtained variation coefficients of 44% for the Kanai-Tajimi frequency and 34% for central frequency. More recently, Yongfeng and Genshu [
4] reported larger standard deviations, or coefficients of variation between 46 and 71% depending on the site geology; in this paper, the study was on
acceleration response spectra or the predominant frequency thereof (called “characteristic” frequency). Moreover, in one of the most important works on this subject of predominant frequencies [
1] it is concluded: “An important observation about these frequency content parameters is the significant scatter in the data… There is considerable scatter in the [mean frequency] and this is reflected in the relatively wide range between the plus one and minus one standard errors.” Unfortunately, a direct comparison with our results is not possible in this case because coefficients of variation cannot be retrieved or are not available; as a matter of fact, an additional difficulty for a comparison is the presentation of results as the logarithm of predominant periods rather than
arithmetic or ordinary frequencies. Rathje et al. did present an improvement of that work [
15]; however, the three main enhancements were more on a larger set of events, a consideration of fault rupture directivity and application of a new regression for the empirical model proposed rather than on defining a predominant frequency of earthquakes, perhaps because by sticking to acceleration, it is not possible to define clear predominant periods, which is the main argument in the present work.
It can be argued that the results from analog records (the first half or older ones in
Table 1) are questionable because of the cutoff frequencies around 0.2 Hz in their processing; however, the same or very similar
ωp and response spectra are observed as results for the digital or newer records. Indeed, in the middle of
Table 1, which is in chronological order, we have the Chi Chi and Hector M. events which were recorded digitally predominantly [
9]. In fact, the low-cut frequency reached 0.02 Hz for Hector M. seismic records [
10]. Moreover, for the later (in
Table 1) Latin American events, including Sierra Cucapá, the cutoff frequency was around 0.03 Hz [
6]. It must be recalled that S. Cucapá, Chi Chi and Kern C. are our best results, and Kern C. is the oldest, or let us say, the most analog of all the examples, but its results are the same or very similar to the digital or newer ones.
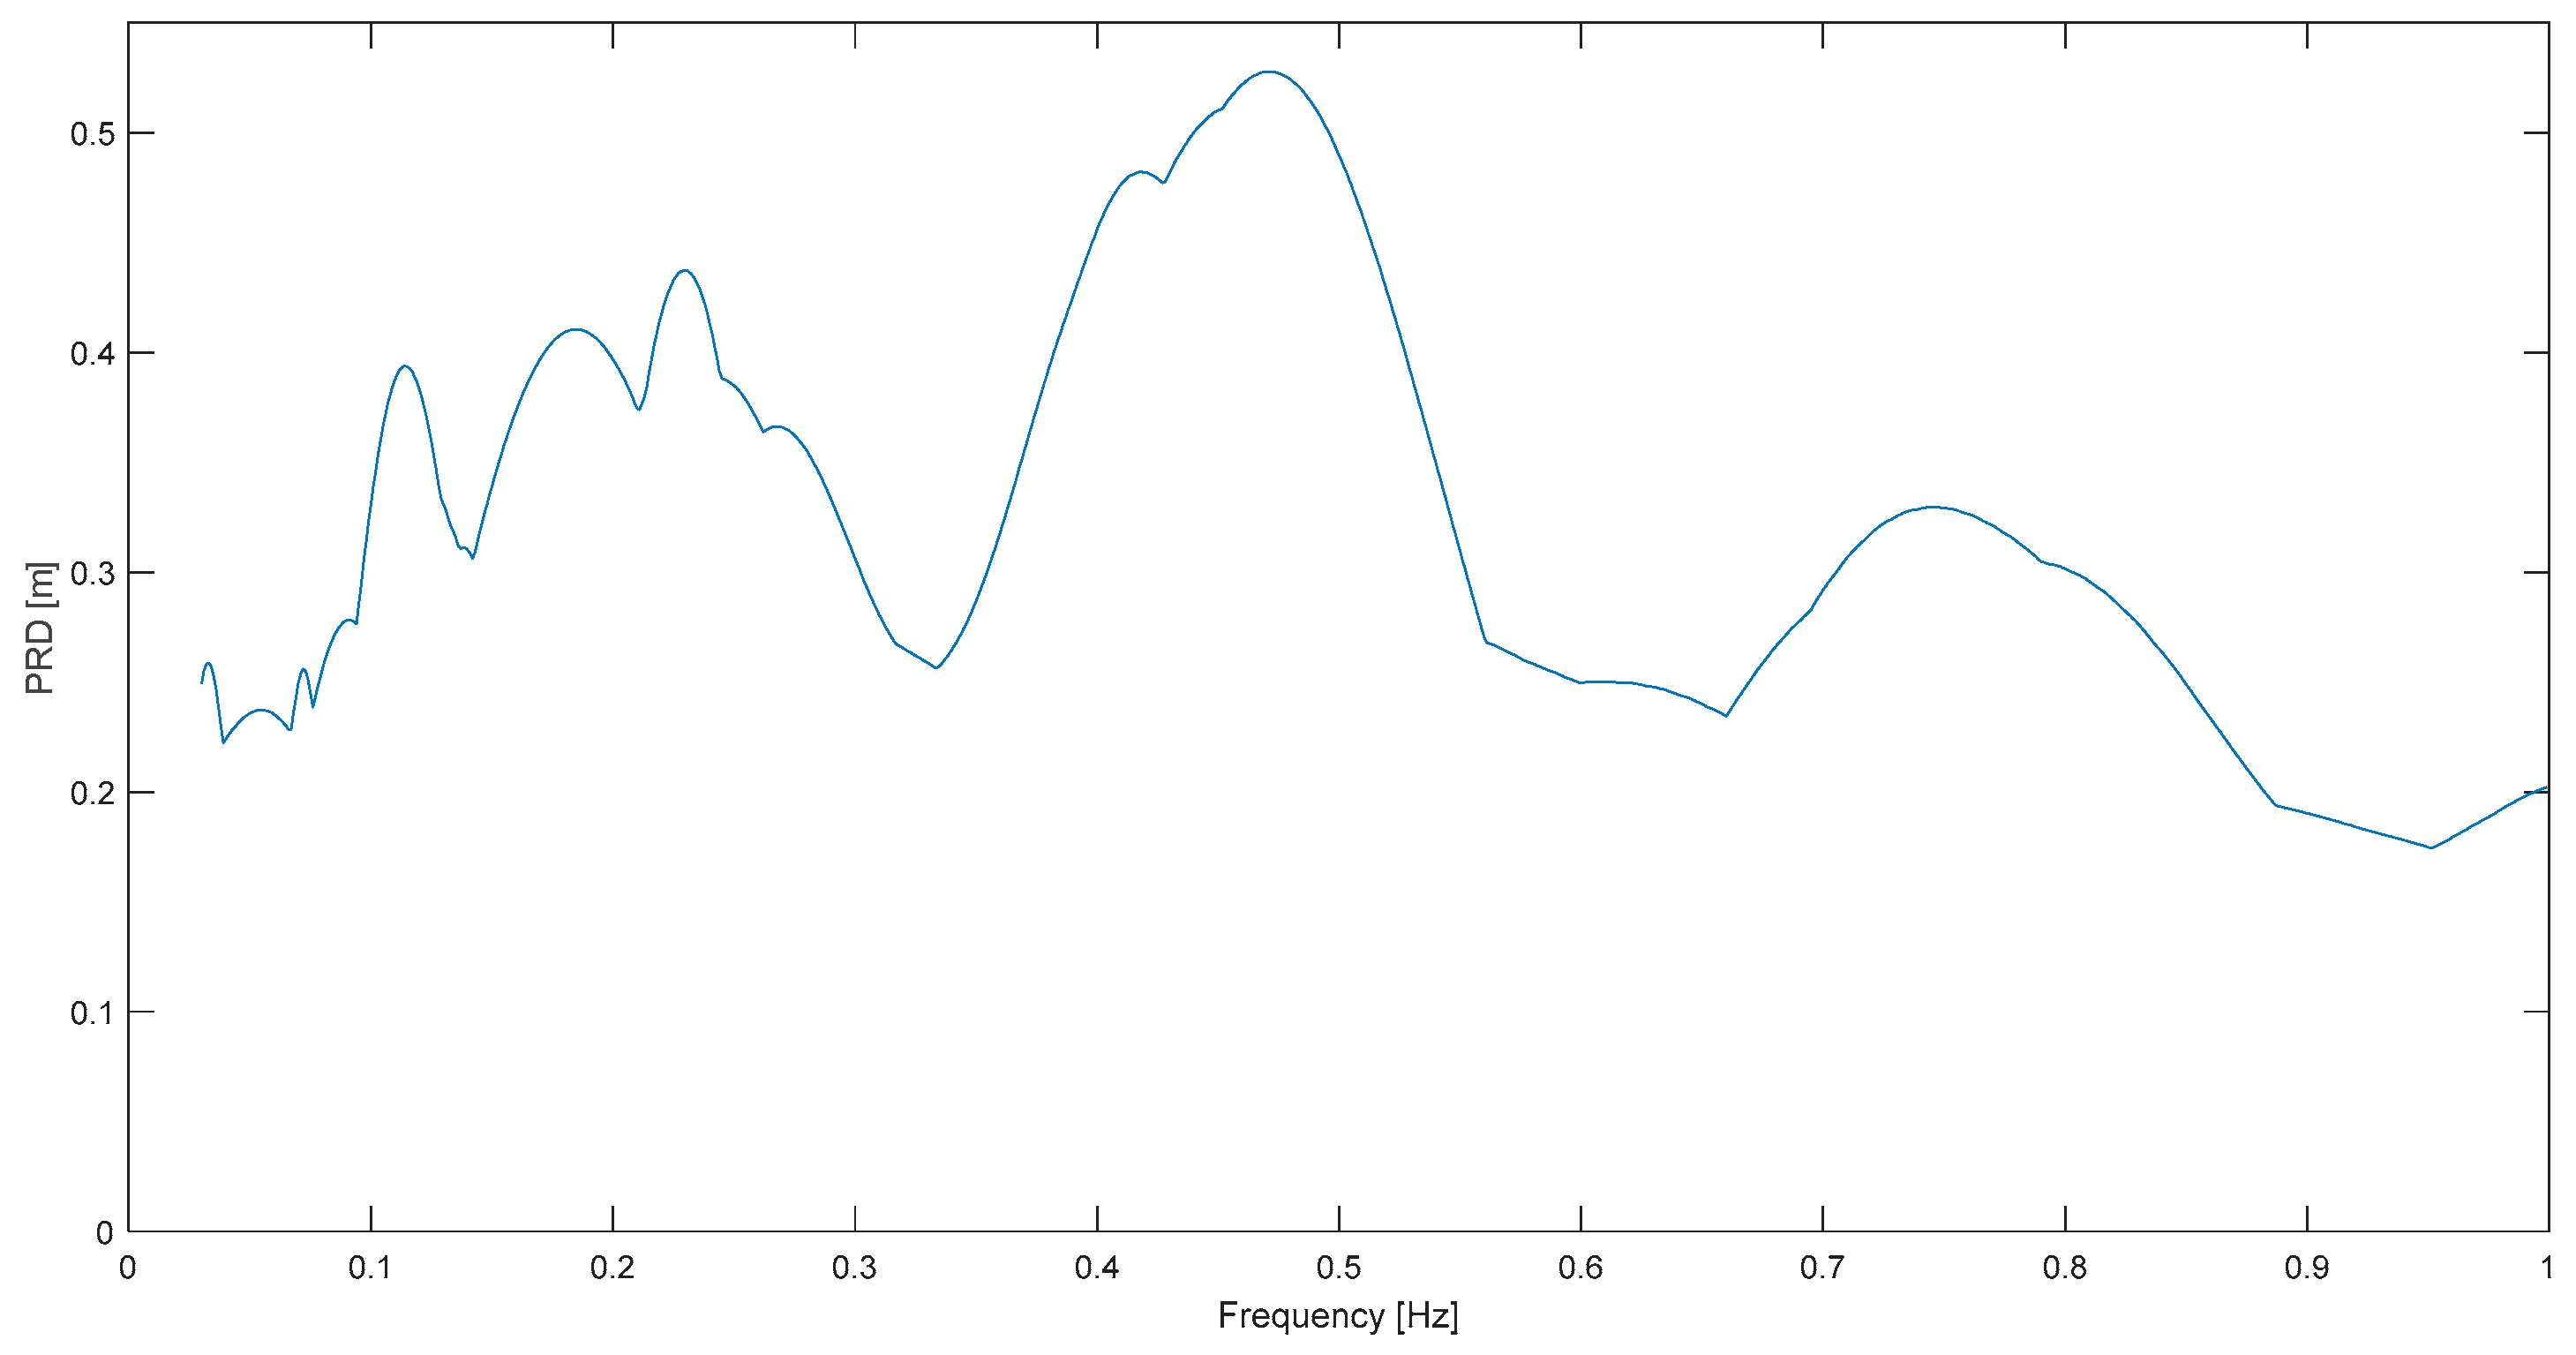
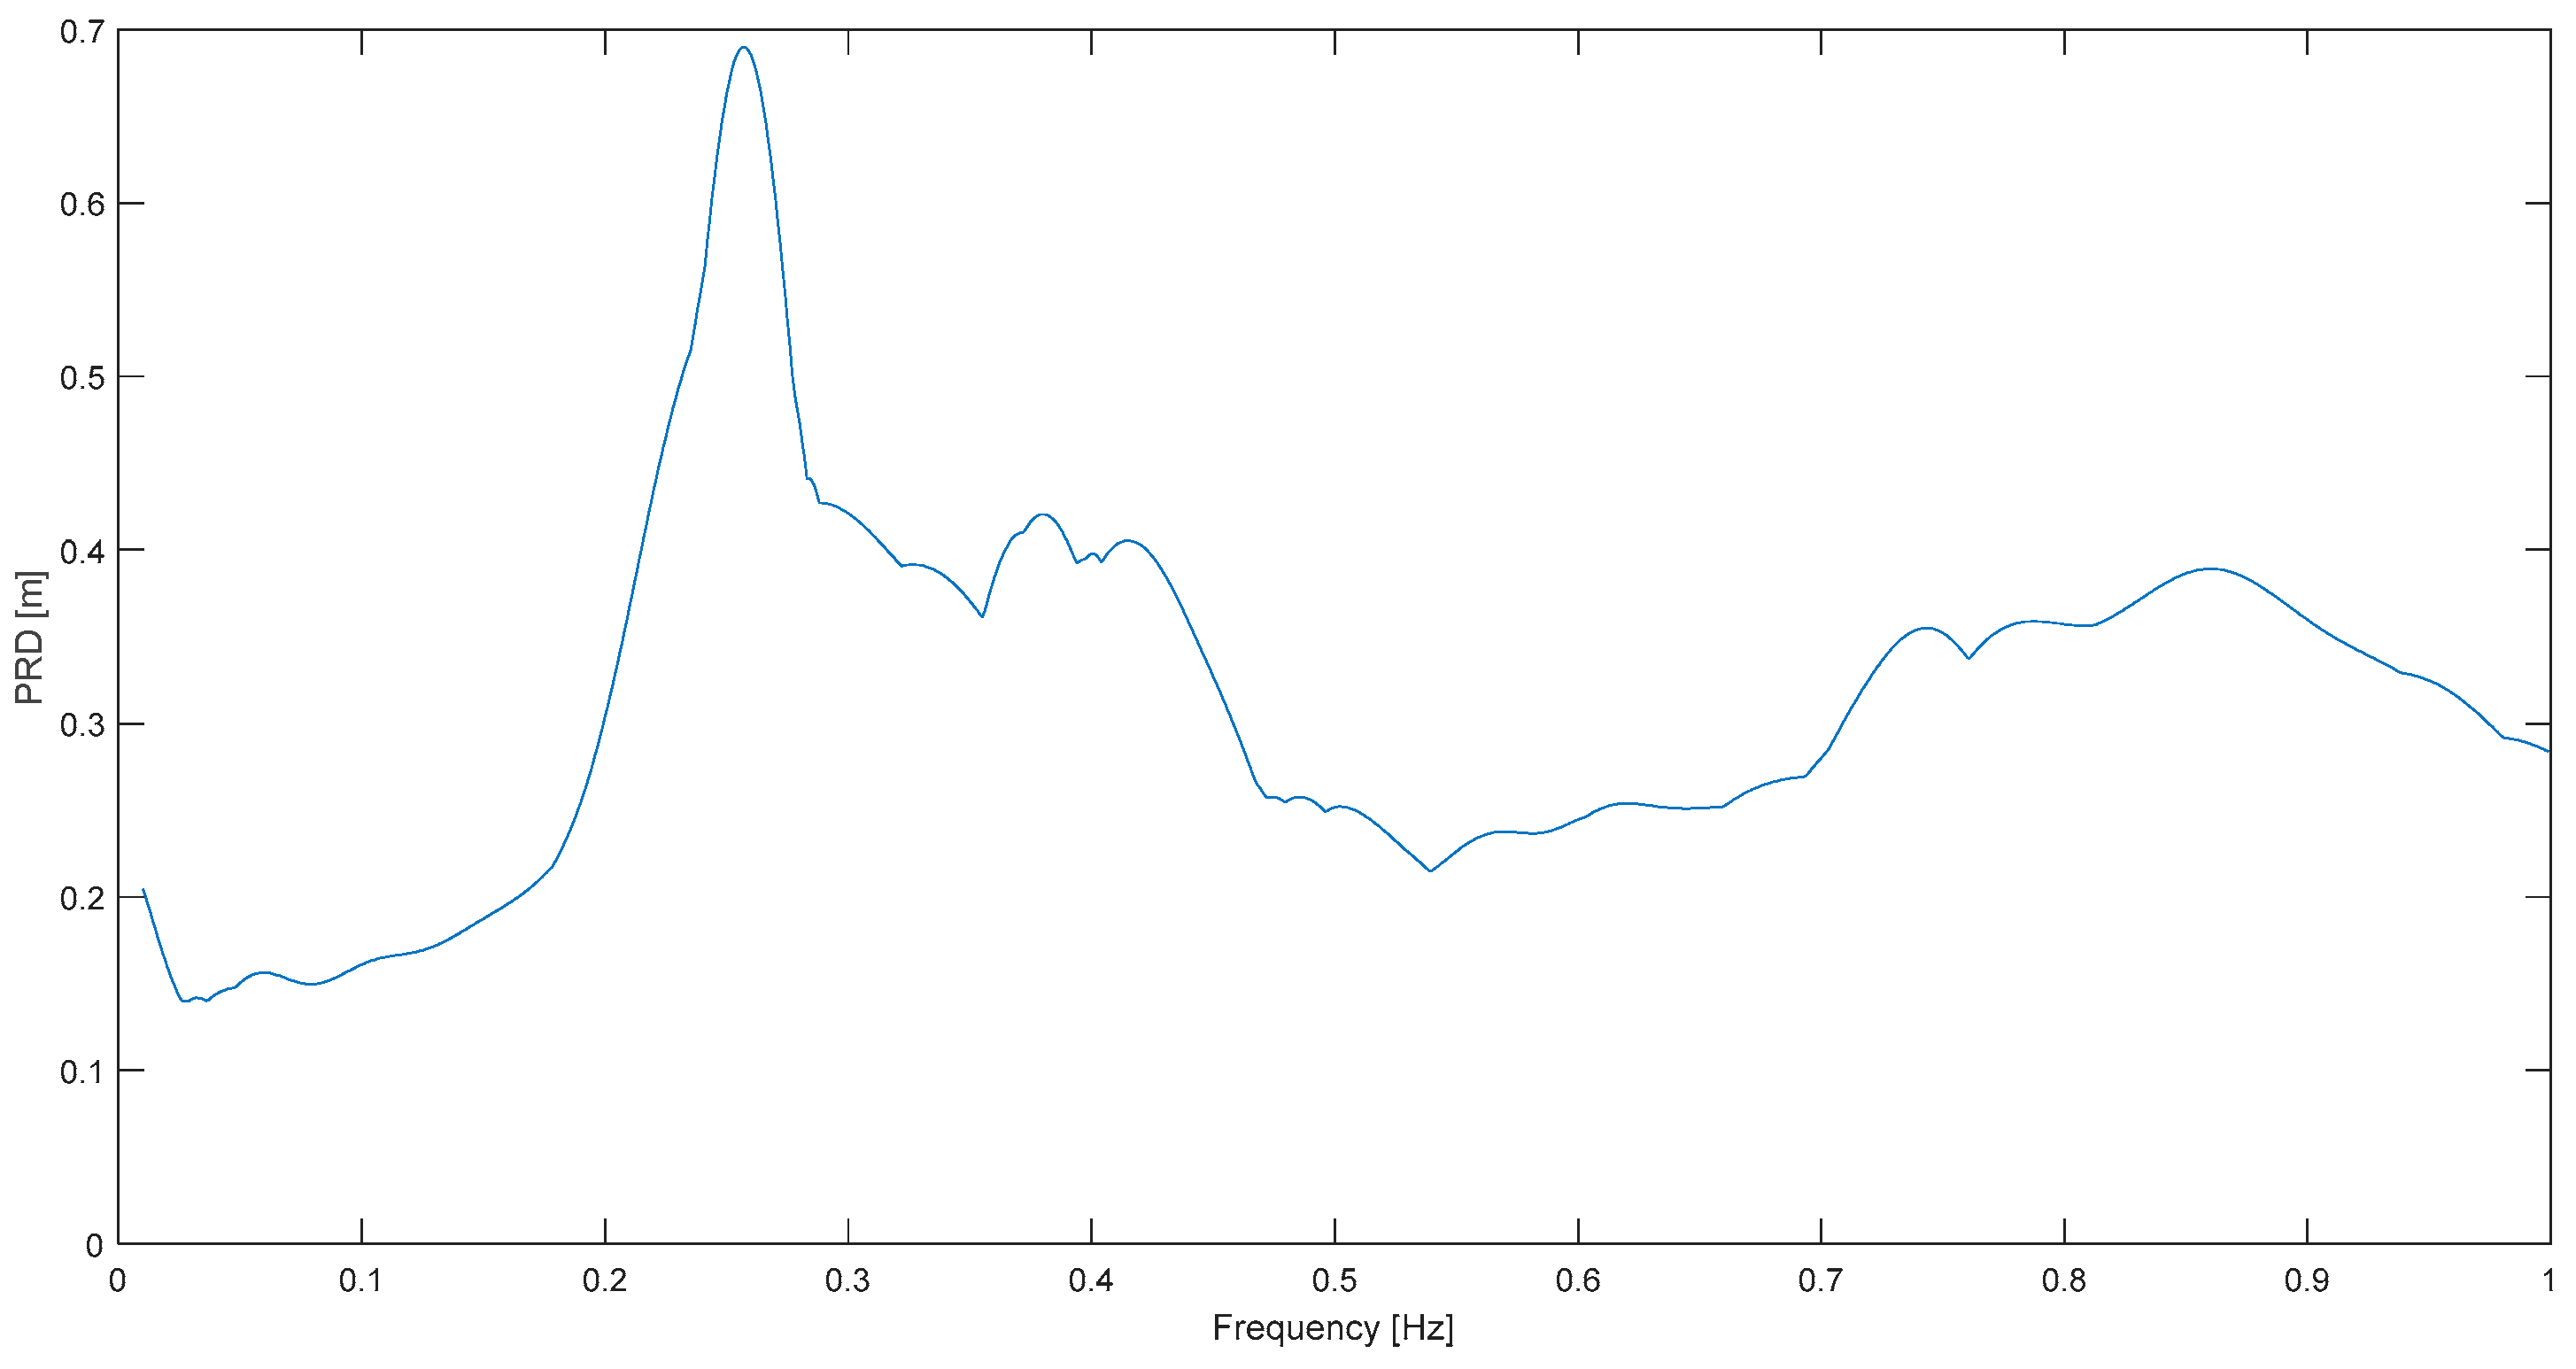
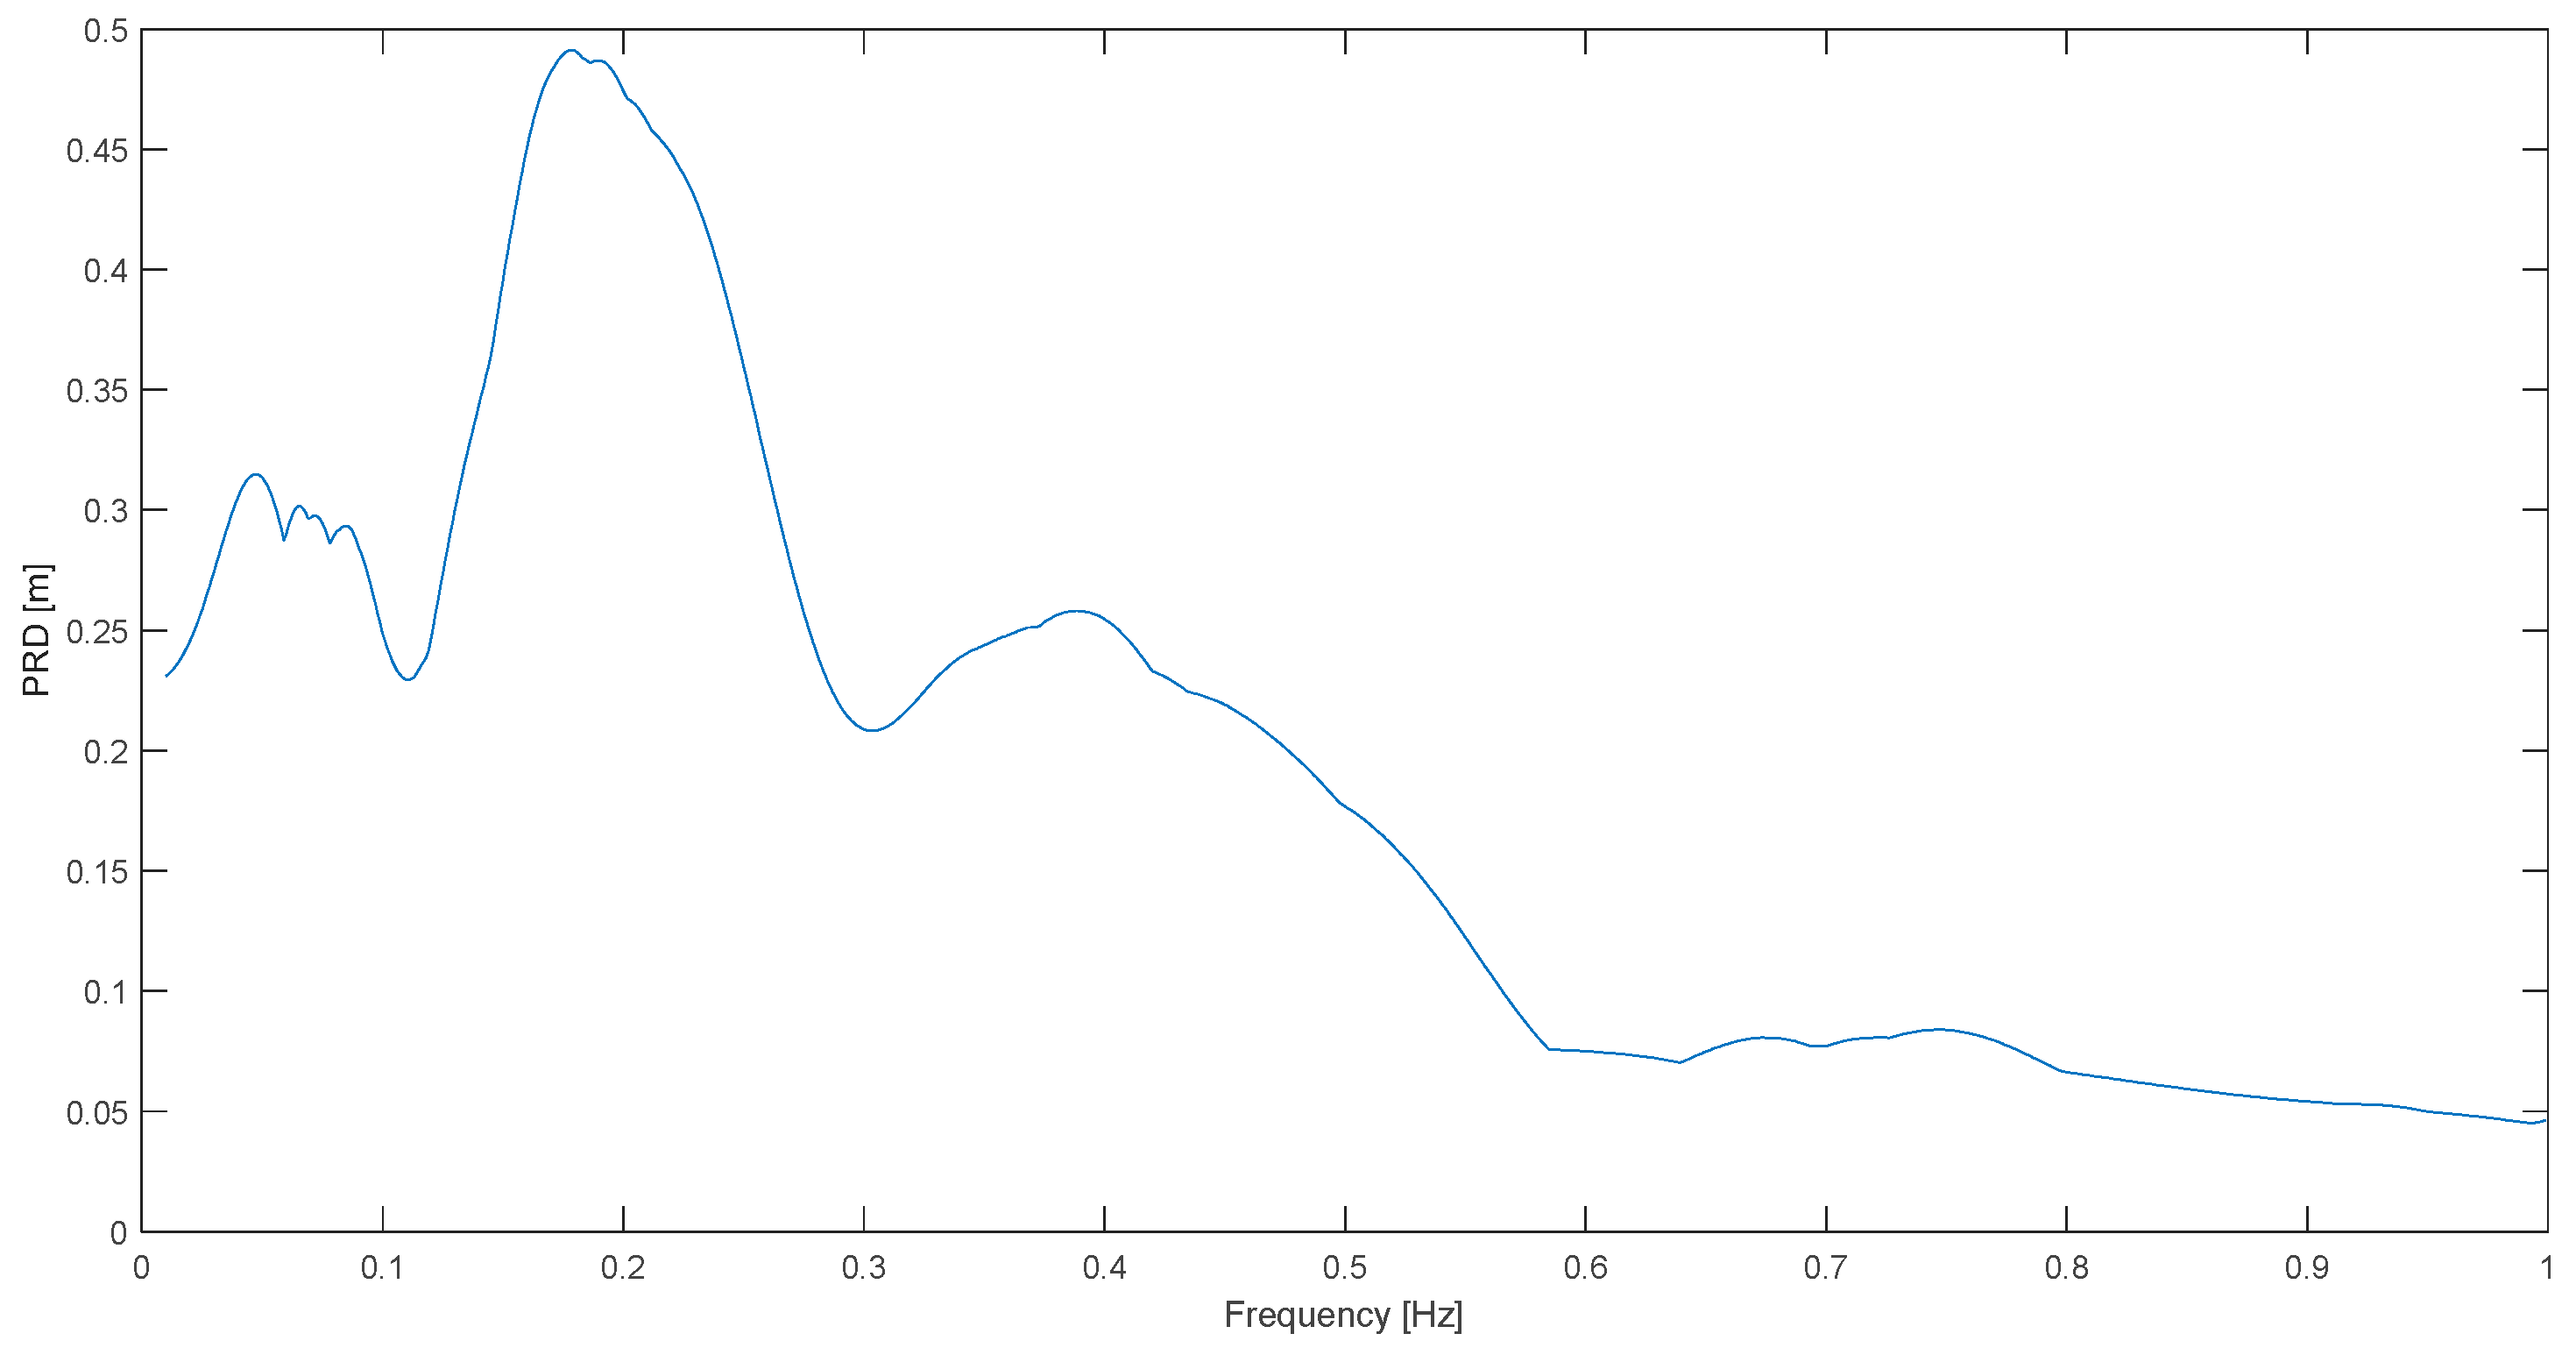
Now, the three liquefaction cases will be investigated. It can be concluded that in these instances, the predominant frequency is above 0.25 Hz. In two cases, it is right between 0.26 and 0.29 Hz, but in the Northridge case, it is as high as 0.47 Hz. The fact that liquefaction occurred around the Imperial Wildlife (Superstition H. 1987), Northridge Church (Northridge 1994) and Constitución (Maule 2010) seismic stations was reported by Morales [
5], Holzer et al. [
16] and Verdugo and Gonzalez [
17], respectively. As the liquefaction instances are few, it is not an objective here to statistically analyze predominant frequencies for such phenomena; however, another important conclusion is that the above results corroborate previous studies in which for liquefied site displacement records larger frequencies, and similar to the ones here, were observed [
5,
6].
Focusing now on site geology, it can be concluded interestingly that for the general
Alluvium class, the two important results are almost the same as for the full set; that is, the mean value and the coefficient of variation are 0.148 Hz and 28.0% for this geology. For the condition
Rock, a very interesting result is that for 3 cases (S. Fernando, Petrolia and Ridgecrest), the predominant frequency is right between 0.170 and 0.179 Hz. The mean value is 0.16 Hz but again, the most interesting result is the much lower dispersion in this site class, shown by a superior coefficient of variation of 13%. Yet another result is the corroboration that predominant frequencies for
Rock are higher than for other site classes, which is in line with previous results [
1,
3,
4,
15]; however, it is not by any considerable margin in this displacement response study, which as main result has, indeed, a lower scatter in predominant frequencies.
The important conclusion is that, focusing on displacement rather than on the common acceleration, we obtain predominant frequencies near 0.15 Hz independently of site classification. It is stressed that when considering acceleration, to define a general predominant frequency is very difficult if not impossible. This is a consequence of the fact that the dispersion in the results is significant; in fact, that scatter is large even when the statistics was performed within a particular site classification or geology [
1,
3,
4]. The idea of this research is that one predominant frequency of earthquakes can be defined—if there is a shift in focus towards displacement—and this short analysis on site effects reinforces this idea. However, this site analysis is limited and must be taken as an initial report on the effect of site on the new predominant frequency concept. More samples for
Rock, for example, will be required in further work on this specific subject.
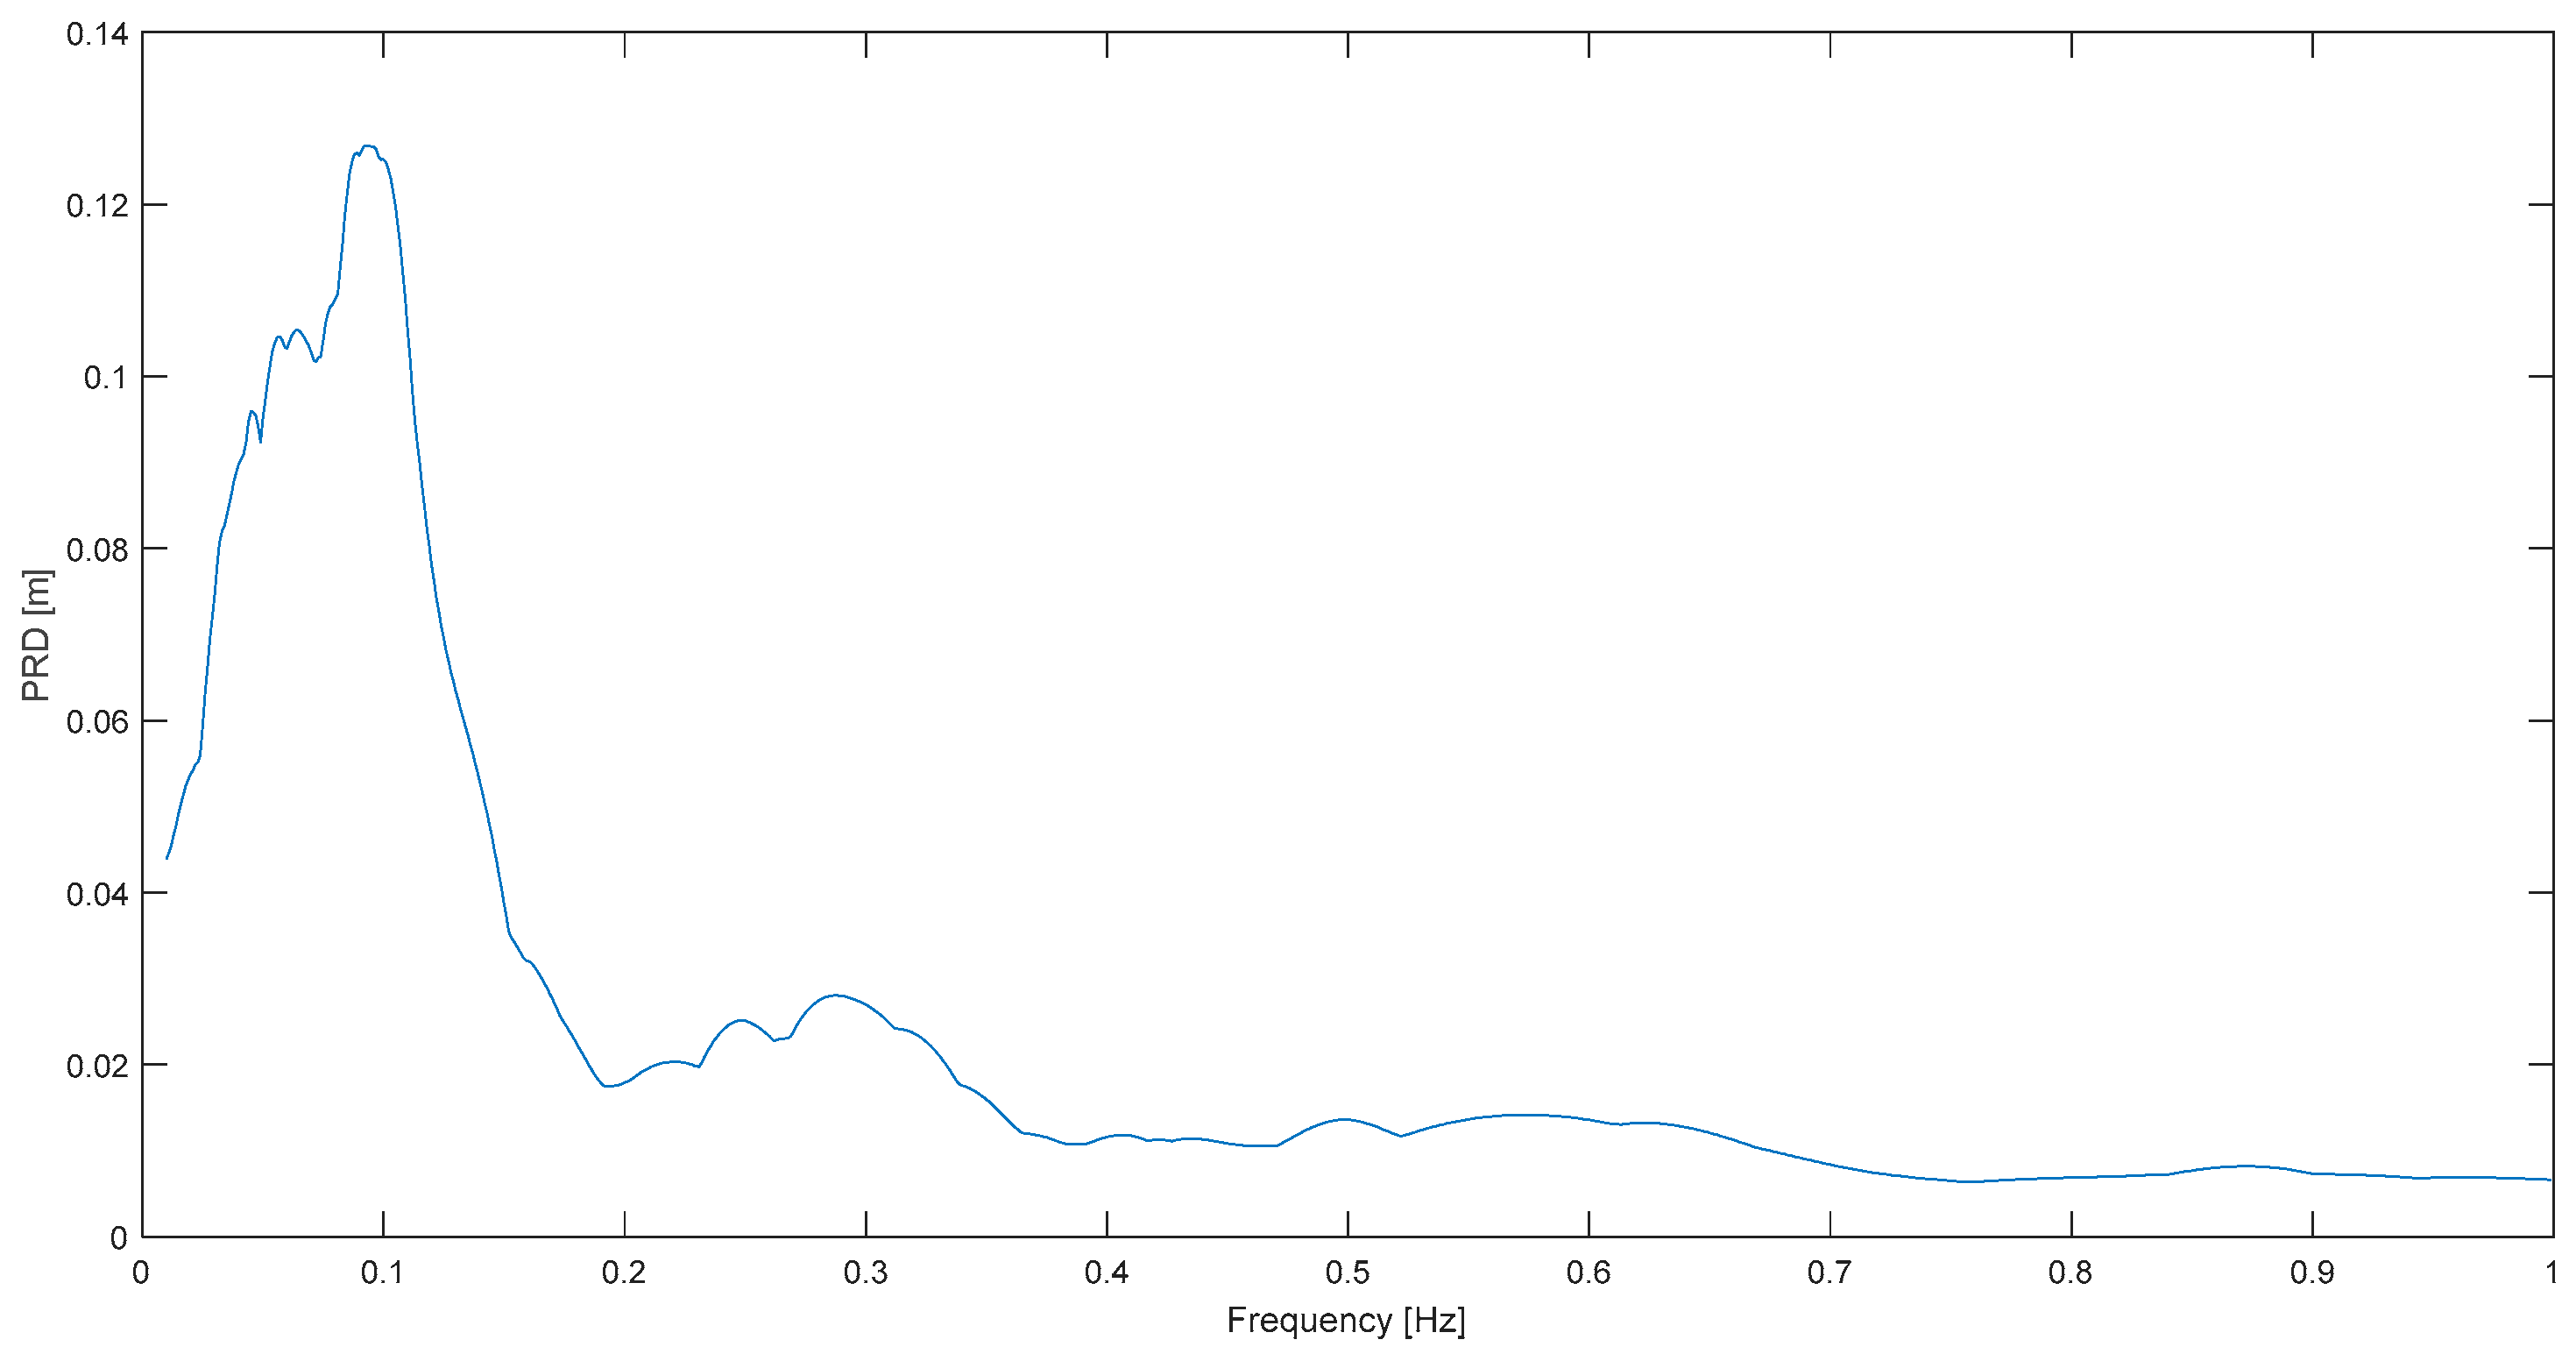
Finally, regarding distance, one example is presented of frequency content in a far-field case, even though the focus of the paper is the critical near field. The event and record is Haiti at P. Sabaneta and its deformation response spectrum is shown in
Figure 13. The spectral shape is similar to all the other cases, or to
Figure 1; that is, still a clear predominant frequency (0.09 Hz) can be procured. It is lower than the mean value of 0.15 Hz for the near-field cases (excluding liquefaction) which is in agreement with previous conclusions by other authors on the effect of distance on predominant periods [
3,
15]. Now, if only near-field signals are considered, including liquefaction ones, the predominant frequency is 0.182 Hz (mean).
It is underscored that the records are not arbitrary at all: these were selected systematically. In fact, the set is composed by truly major world earthquakes (ISO country abbreviation used in
Table 1) of above 6.5 in magnitude; moreover, the selected stations were the closest to either epicenter or fault. As a matter of fact, these events are very famous, or infamous, in each country or continent seismic history, as the majority in the set are of magnitudes, indeed, larger than 7 (
MW).
4. Discussion and Conclusions
A standard deviation of 0.042 Hz for a mean predominant frequency of 0.147 Hz was obtained for an important set of international earthquakes (
MW > 6.5) and respective near-field records. These statistics do not include the few liquefaction records in
Table 1. If it is the case that these liquefaction samples are included, the resultant predominant frequency is 0.182 Hz. The main result, a seismic predominant frequency of 0.15 Hz with a 28% variation coefficient, can be compared with what has been or, more properly, has not been obtained before. Morales [
5] obtained a mean value of 0.13 Hz as predominant frequency when analyzing ground displacement power spectral density (near-field records); therefore, there is an important level of mutual validation with the present results. On the other hand, previous spectral research considering either ground acceleration or acceleration response, has failed to provide a single predominant frequency of earthquakes, mainly because of the large standard deviations or important dispersion in the results [
1,
3,
4].
Now, even though there is a similarity with previous results, from which a predominant frequency of 0.13 Hz could be retrieved, the present results were imperative; first, because the main objective in previous works was not obtaining a predominant frequency of seismic action but demonstrating a narrowband characteristic in spectral content of ground displacement records [
5,
6], or validating this narrowbandness [
10]. As a matter of fact, there is a weakness in directly Fourier analyzing seismic ground displacement in that these records are not as reliable as the original ground acceleration ones; this because in synthetizing displacement from acceleration, signal noise and the unknown baseline are difficult problems which may imply computed displacements not representing well the actual seismic ground displacement, as explained before. Moreover, seismic record processing and power spectral density calculation are not absolute or unique procedures; on the other hand, there is much more agreement on acceleration records and the deformation response spectrum concept whose computation is based on those more reliable signals.
It can be argued that in some cases the displacement response plots do not show a very clear predominant frequency, as
Figure 7 and
Figure 9; however, even in these instances the predominant frequencies obtained (0.11 and 0.12 Hz) are near the mean value (0.15 Hz). On the other hand, acceleration response spectrum has a more problematic disadvantage, its “remarkable dispersion” [
4] which prevents the definition of a meaningful seismic predominant period, and this scatter problem is present even if one analyses within each site classification [
4]. In this regard, another important result of this investigation is that the proposed displacement-based predominant frequency is not strongly dependent on site geology. Concerning this, it is highlighted that strong dependence on site type, that has been encountered previously, has also prevented the definition of one (1) predominant frequency for earthquakes [
4].
It can also be argued that the predominant period obtained of ~7 s may not be very useful in earthquake engineering or in design codes, because there are basically no standard buildings that have that level of natural period [
18]; however, newer isolated structures can have their periods in that range [
19]; therefore, a first application of the main result is in seismic base isolation. As matter of fact, we finish this paper by highlighting that this one or single seismic predominant frequency has been validated by other means, or applied to solve a structural engineering problem: a successful structural control of isolated buildings through tuned mass damper [
8] which is a device particularly sensitive to input frequency; that is, the passive control proposed was successful because near-field ground displacement does have one predominant frequency, at 0.13 Hz as assumed in that work due to the results available last year [
5]. The present results suggest an adjustment and improvement towards 0.15 Hz, or 0.18 if liquefaction is considered; we talk about improvement because the results are based on a more robust and reliable method, as explained. Moreover, a similar isolation design methodology has been presented lately but with a more advanced device, the inerter, and also great results are attained in controlling the base displacement [
20]. These 2 successful solutions in time domain on controlling isolator deformation would have been impossible if seismic excitation did not have one predominant period near 7 s as this is the main hypothesis in those 2 frequency-domain optimization procedures.
As more than 20 or 50 events may be required to establish a stronger predominant period, future work will deal with a larger set of earthquakes, but in that case, the concentration will be on ωp only; that is, in this work we limited the number of strong motions to 20 because the interest or concentration was not only in the peaks but also on the spectral content or shape, which takes space.


