1. Introduction
The ballasted track of the railway system consists of aggregates of gravel particles of various sizes and shapes. The finite element method (FEM) has been widely used in ballast modelling and simulation due to its reliability and convenience. However, FEM is performed under the assumption that the deformation of individual elements is small, and elements sharing nodes cannot be separated, so if large deformation occurs, there is a limit to accuracy, and it cannot provide information about physics that occurs between gravels. The discrete element method provides an ideal tool for simulating the behavior of granular materials and can provide more detailed information than the FEM [
1]. DEM is a numerical model or computer simulation approach that can simulate materials in a granular state, allowing the study of detailed parameters that cannot be performed in experiments, such as friction and contact forces between particles. Additionally, complete particle information such as displacement and acceleration are available during simulation [
2]. In addition, DEM can reasonably reproduce the micro–macro mechanical behavior of granular materials if realistic particle shapes are achieved [
3]. Recently, with advancements in computational capabilities, many studies have employed discrete element method (DEM) to simulate individual movements between gravel pieces in ballast. However, there is a high computational cost due to the replication of the high shape reality of gravel, and the complexity of additional analysis procedures due to high contact interlocking or packing for the settlement of gravel. First, studies on gravel particle generation and packing using the discrete element method were analyzed. A method for generating sand samples, including particle size distribution, packing density, particle direction, particle shape, and stacking of 2D particles, is presented using the DEM [
4]. Through a discrete element analysis model, gravel particles of arbitrary shape and size are simulated as rigid bodies through the overlap between particles of different sizes. Moreover, the tamping process of the gravel layer is simulated and compared with the actual tamping operation [
5]. Gravel is connected to the two particles and is randomly located in a defined space. Subsequently, the work of stabilizing the gravel layer is simulated by loading a cycling rod onto a sleeper located at the top [
6]. Gravel shapes are formed by combining randomly generated discrete elements using the Delaunay triangulation function. Gravel is packed to form a gravel layer, and the collision simulation between the train wheel and the gravel layer is compared with that of the experiment [
7]. Gravel particles are randomly generated in a defined space, and a ballast is formed by tamping with the cycling load. In addition, permanent deformation owing to particle crushing is implemented for a ballast subjected to a cycling load [
8]. An algorithm randomly generates and stacks particles repeatedly according to a set number of stacks. Further, a nonoverlapping multidimensional particle layer is quickly formed by compression [
9]. Random numbers are used to arrange the combined particles and simulate the ballast through a tamping process. Performance degradation owing to permanent deformation and ballast deterioration is evaluated under a periodic train load [
10]. To investigate the factors affecting ballast settlement, the ballast is formed by stacking individually bonded particles. Subsequently, the ballast is evaluated in terms of the gravel shape, porosity, and load combination [
11].
Gravels are implemented as simple spheres and 8-ball cubic clumps, and a ballast is formed through a compaction process. The simulation model is verified through comparison with a laboratory box test [
12]. Particles of predefined shapes were randomly placed and the porosity was adjusted by tamping to form a gravel layer. Direct shear test simulations were compared and analyzed experimentally [
13]. Irregularly shaped gravel samples are scanned to generate crushable bonded particles. The influence of particle breakage on the dynamic and deformation behaviors of the ballast is simulated [
14]. Clumps are created by scanning the actual gravel shapes. Direct shear and large-scale process simulation tests were simulated and compared with the experimental results [
15]. The ballast is simulated using four models (spheres with and without rolling resistance, clumps, and 3D scanned gravel). The importance of implementing gravel in a nonspherical shape is confirmed by the cycling load for each analysis model [
16]. Finally, Guo et al. [
2] reviewed studies that implemented ballasts using the discrete element method. Previous studies have mainly focused on the shape of the gravel, degradation, and contact models. Based on the studies mentioned above, to form a ballast using the discrete element method, it is essential to focus on the shape of the gravel and correct the contact model definition. In addition, a tamping process is applied to the gravel layer to form a reliable ballast analysis model. Therefore, applying the aforementioned process when implementing track simulations that include ballast results in the analysis complexity reduces the usability. This study focuses on simplifying the analysis procedures and analysis model formation used in previous studies. Discrete elements packed into the defined shape of the ballast are used to form an analysis model that simulates the interlocking of gravel without tamping using the parallel bond method. Subsequently, the parallel bond method analysis model is verified based on the vertical stiffness of the ballast according to design standards.
2. Suggestion of the Simplified DEM-Based Modelling for the Track Ballast
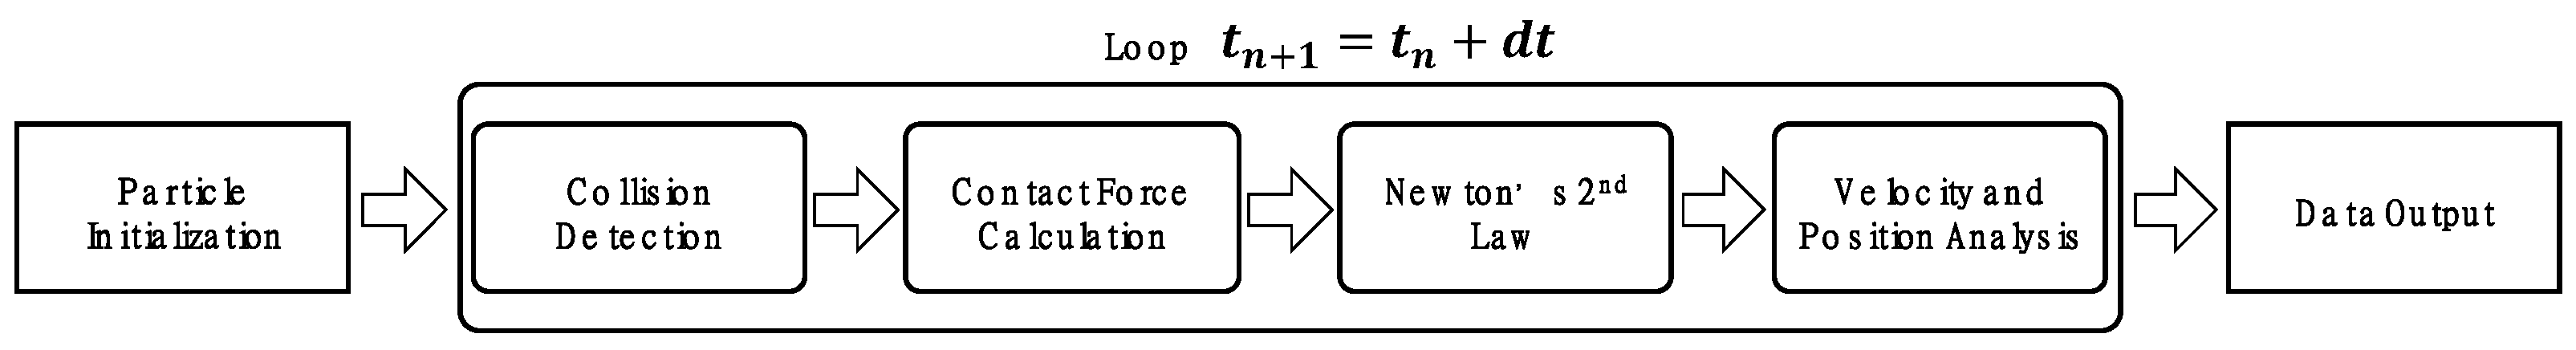
The DEM is appropriate for dynamic problems because the displacement increments are calculated by integrating the acceleration increments. Each particle was treated as an individual entity and modelled as a sphere of a specific size. Once the initial position, velocity, and boundary conditions of each particle are defined, a dynamic analysis can be performed to obtain the dynamic structural response of all objects in the analysis model. The interactions between discrete elements are assumed to occur independently. The contact and friction conditions between the particles were used to calculate the force exerted on each particle by neighboring particles or boundaries. At each analysis time increment step, the contact and collision between the particles were checked, and the contact and collision loads were calculated. Newton’s second law was applied to calculate the velocities and rotational velocities of the particles. Subsequently, a time-domain dynamic analysis was performed that repeated the movement of all the placed particles to a new position at every time increment. The process is shown in
Figure 1 below.
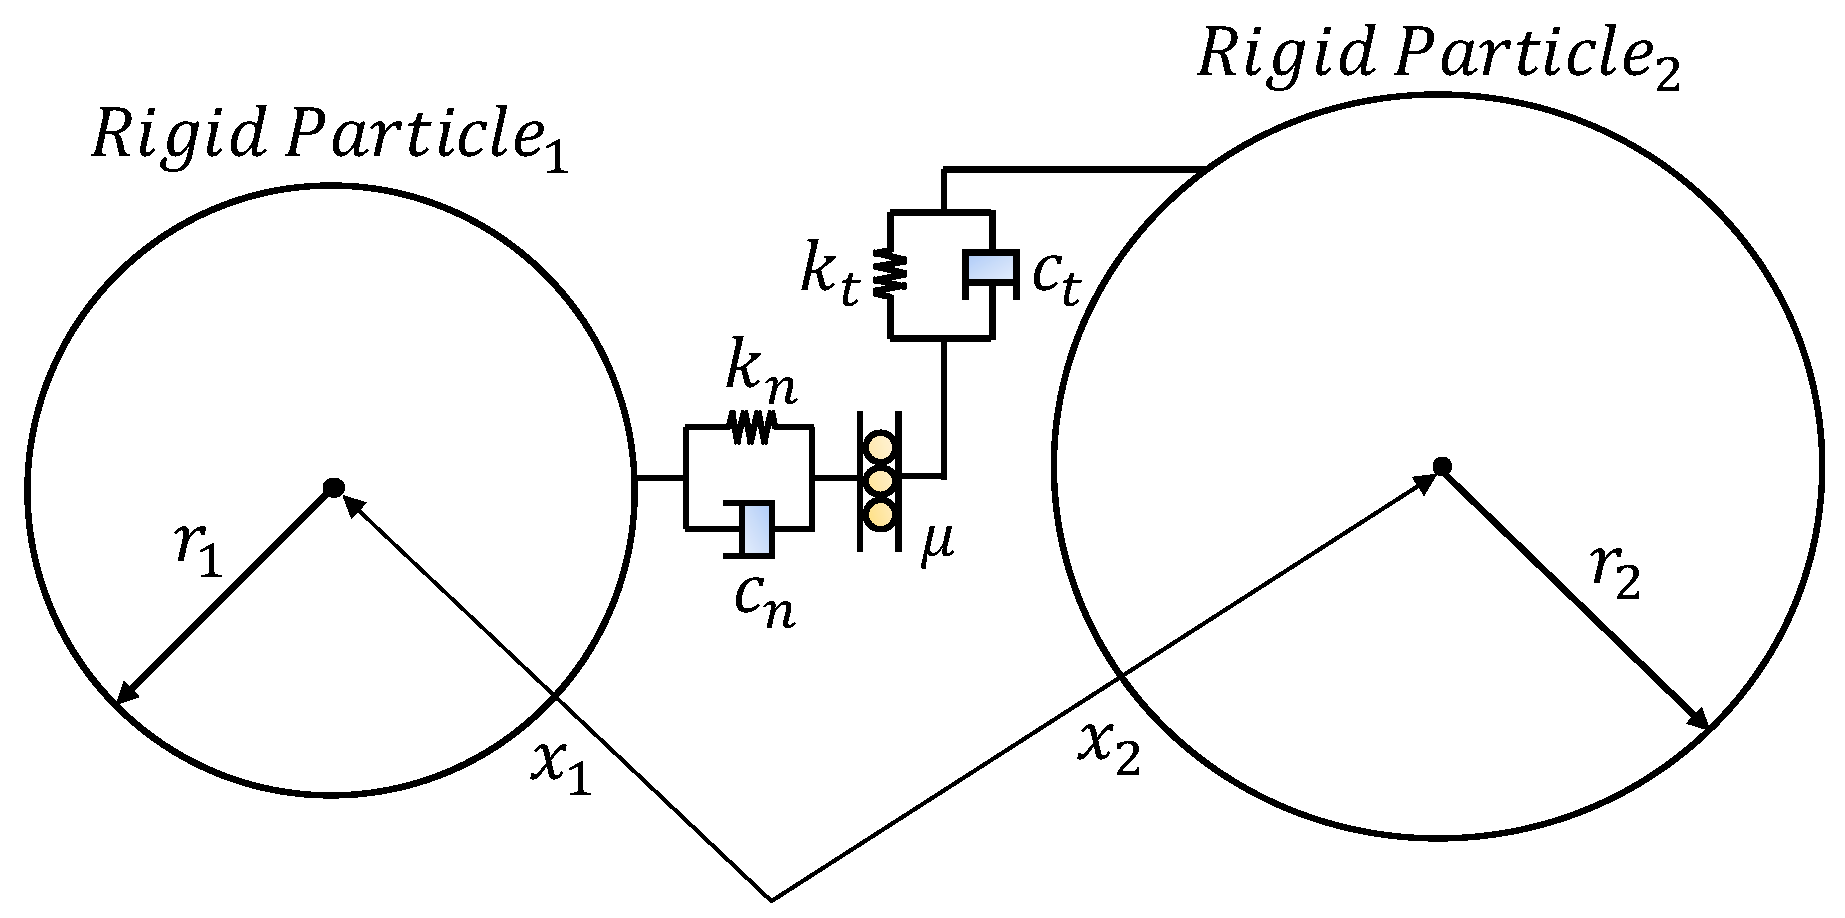
First, a contact model was defined to calculate the contact force during the contact between particles.
Figure 2 shows a conceptual diagram of the Cundall–Strack contact model based on the LS-DYNA V4.8.29 software reported earlier [
17]. This contact model can define the stiffness and damping effects for vertical and normal contact between particles, as well as the static friction and rotational friction in the tangential direction between particles. For simplicity of analysis, even if it is modelled as a rigid body that does not consider the deformation of individual particles, the elastic behavior of the particles can be simulated using a contact model.
The normal and tangential contact forces between particles are calculated as the force generated by the compression of the contact stiffness through the force–displacement relationship of Hooke’s law and can be deduced using Equation (1).
where the parameter
means the interaction distance between the i-th and the j-th particles, and is the penetration distance between particles in the normal and tangential directions.
The normal contact stiffness was calculated by considering the elastic moduli and radii of the particles in contact. The vertical spring constant
is defined as Equation (3).
where
and
are the bulk modulus and radius of the particle, respectively, according to the isotropic elasticity rule for the i-th particle.
is a user-specified stiffness parameter of the spring connected in series. Equation (3) shows that the parameter affects the normal stiffness between the contacted particles. As well as the analysis result, it also affects the calculation time. In general, it is adopted to be 1.0. However, there was no significant difference in the result when 0.01 was adopted to reduce the calculation time for the ballast analysis. Therefore, 0.01 was adopted for an effective parametric study.
The tangential spring constant
is defined in Equation (4). The value of the stiffness parameter
was set to a default value of 2/7.
The shear contact force between the particles was calculated from the normal contact force once the friction coefficient of the contacting particles was defined. The friction coefficient
for defining the roughness of the spherical particle surface or approximating the polygonal particle shape is a user input value. It operated equally under both static and dynamic conditions. Vibrations occur at a relative speed when there is contact between particles or between particles and objects. The damping force that attenuates the amplitude of the contacting particles is defined by Equation (6):
The mass of the particles determines the damping, and the damping constant is defined by Equation (7): here, is the input value for normal damping (0 ≤ ≤ 1.0). Moreover, tangential damping is implemented with the same equation.
The actual ballast was composed of an aggregation of particles randomly arranged in an irregular shape. In a previous study, multiple combined particles were simulated to express the gravel shape of ballast. The resistance to the separation distance between gravel particles due to loading is defined by the surface contact. In addition, for an actual ballast, a tamping process is essential to prevent gravel scattering and increase the ballast stiffness before use. However, in the analytical procedure, the formation of gravel (clumps) and the tamping process are complex. Therefore, in this study, excluding the clump formation and gravel tamping processes, the interlocking from the surface contact of the gravel (clumps) was replaced by the bonding force between particles. The concept is to resist the spread of gravel due to load through the surface contact of the clump, and replace this with the bonding force between particles. Therefore, the ballast is formed through an equivalent material model using an analysis method called the parallel-bonded method (PBM) or bonded particle model.
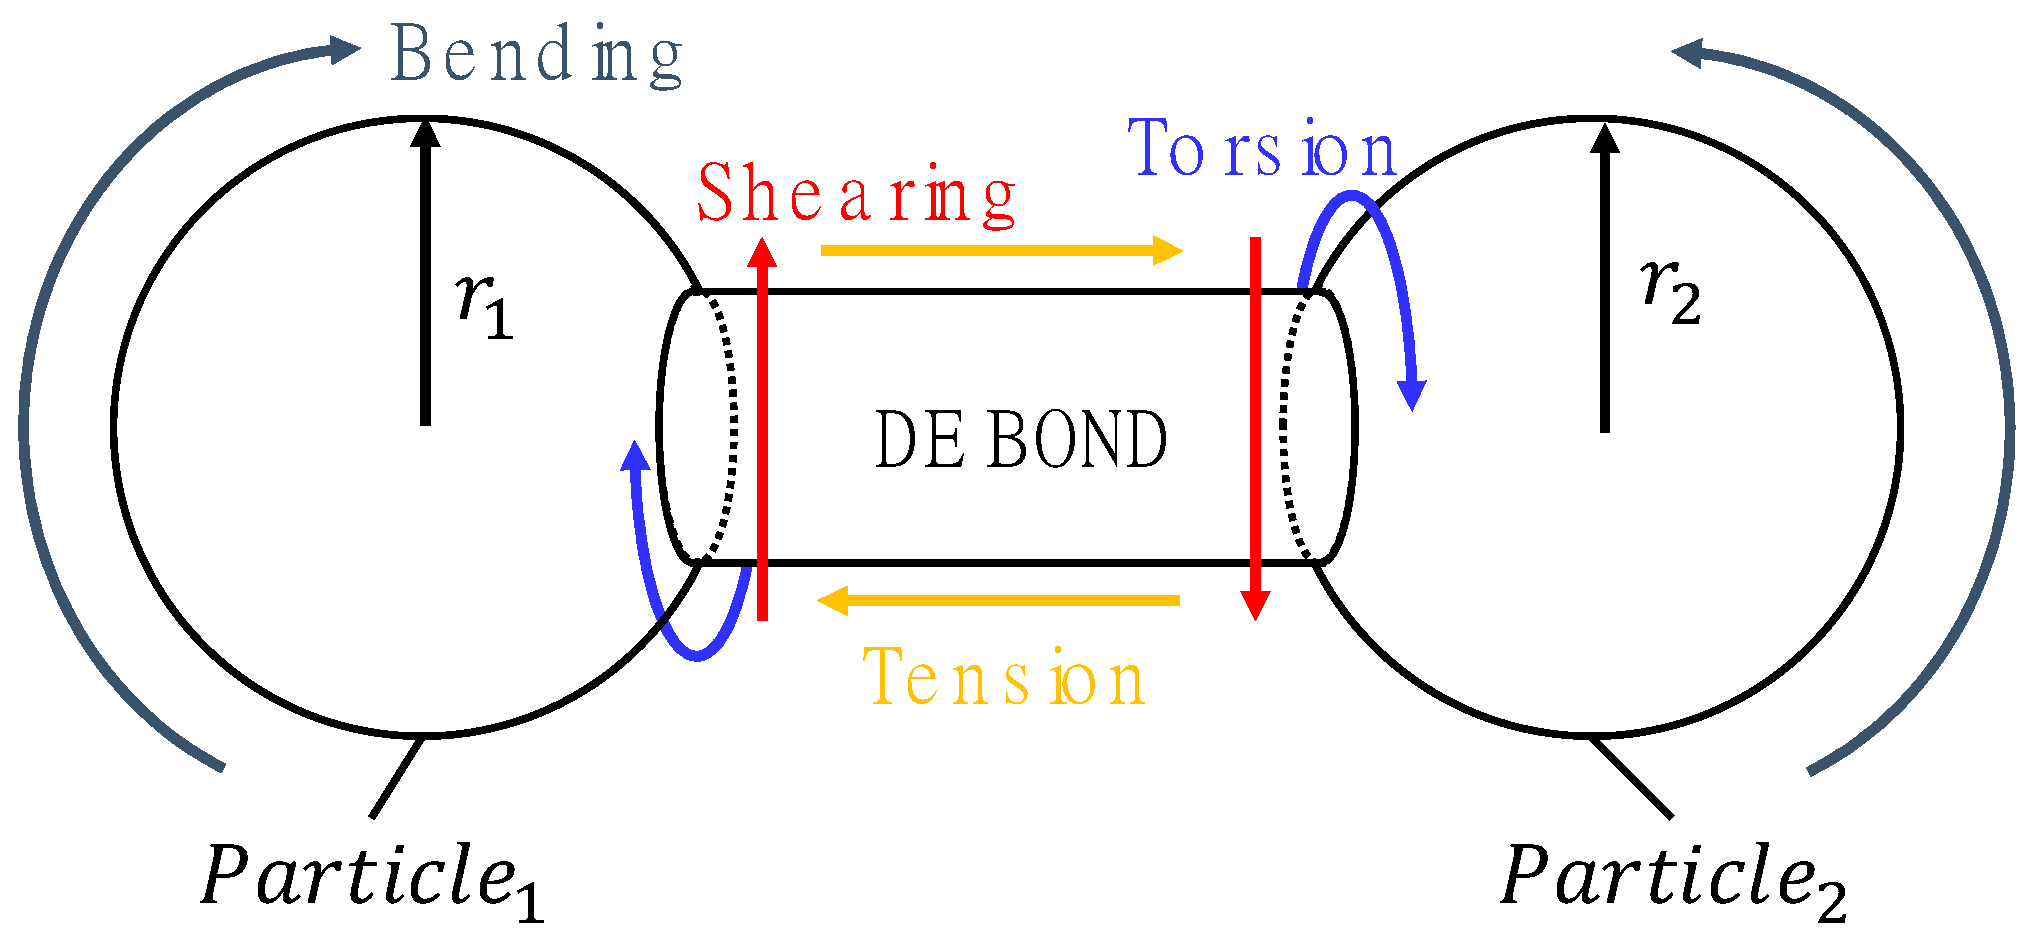
The general contact model of the DEM can transfer force based on the point contact between particles. However, the parallel bond model can transfer not only the force but also the torque and moment between particles based on the assumption that particles are connected through an invisible cylinder using LS DYNA’s DE_BOND option, as shown in
Figure 3. The parallel bond model is an analysis technique primarily used to simulate the mechanical behavior of elastic solids and the initiation and propagation of material failure [
18]. The parallel bond model was defined by the parameters of normal and shear stiffness, tensile and shear strength, and bond radius per cylinder area. First, the bonding contact force
applied at each time increment in the normal direction in a parallel bond is expressed as Equation (8).
where
is an abbreviation for parallel bond normal stiffness and is a parameter that determines bond elasticity. As shown in Equation (9), A represents the cross-section of the cylinder created between the bonding particles.
is defined as the product of the radii of the smaller particles among the radii of the particles to be bonded,
and
, and the
, which adjusts the scale of the bonding cross-sectional area.
The bonding contact force
in the tangential direction is expressed as Equation (11). Parallel bond shear stiffness (
) is applied as a parallel bond stiffness ratio to the normal bonding contact force
.
The allowable strengths for the normal and tangential forces acting on the cylinder bonded between the particles were defined. The maximum allowable tensile stress
and maximum allowable shear stress
acting on the parallel bond are given in Equations (12) and (13).
where
and
are the definitions of the bond strength that determine the separation of the bond of the spheres in the normal and shear directions, respectively, and the separated spheres are converted into discrete elements and act individually.
and
denote the moment of inertia and polar moment of inertia of the cylinder, respectively.
and
are the torsional torque and bending moment, respectively, and reflect the structural behavior due to the applied tension, torsion, bending, and shearing.
3. Ballasted Track Analysis Model
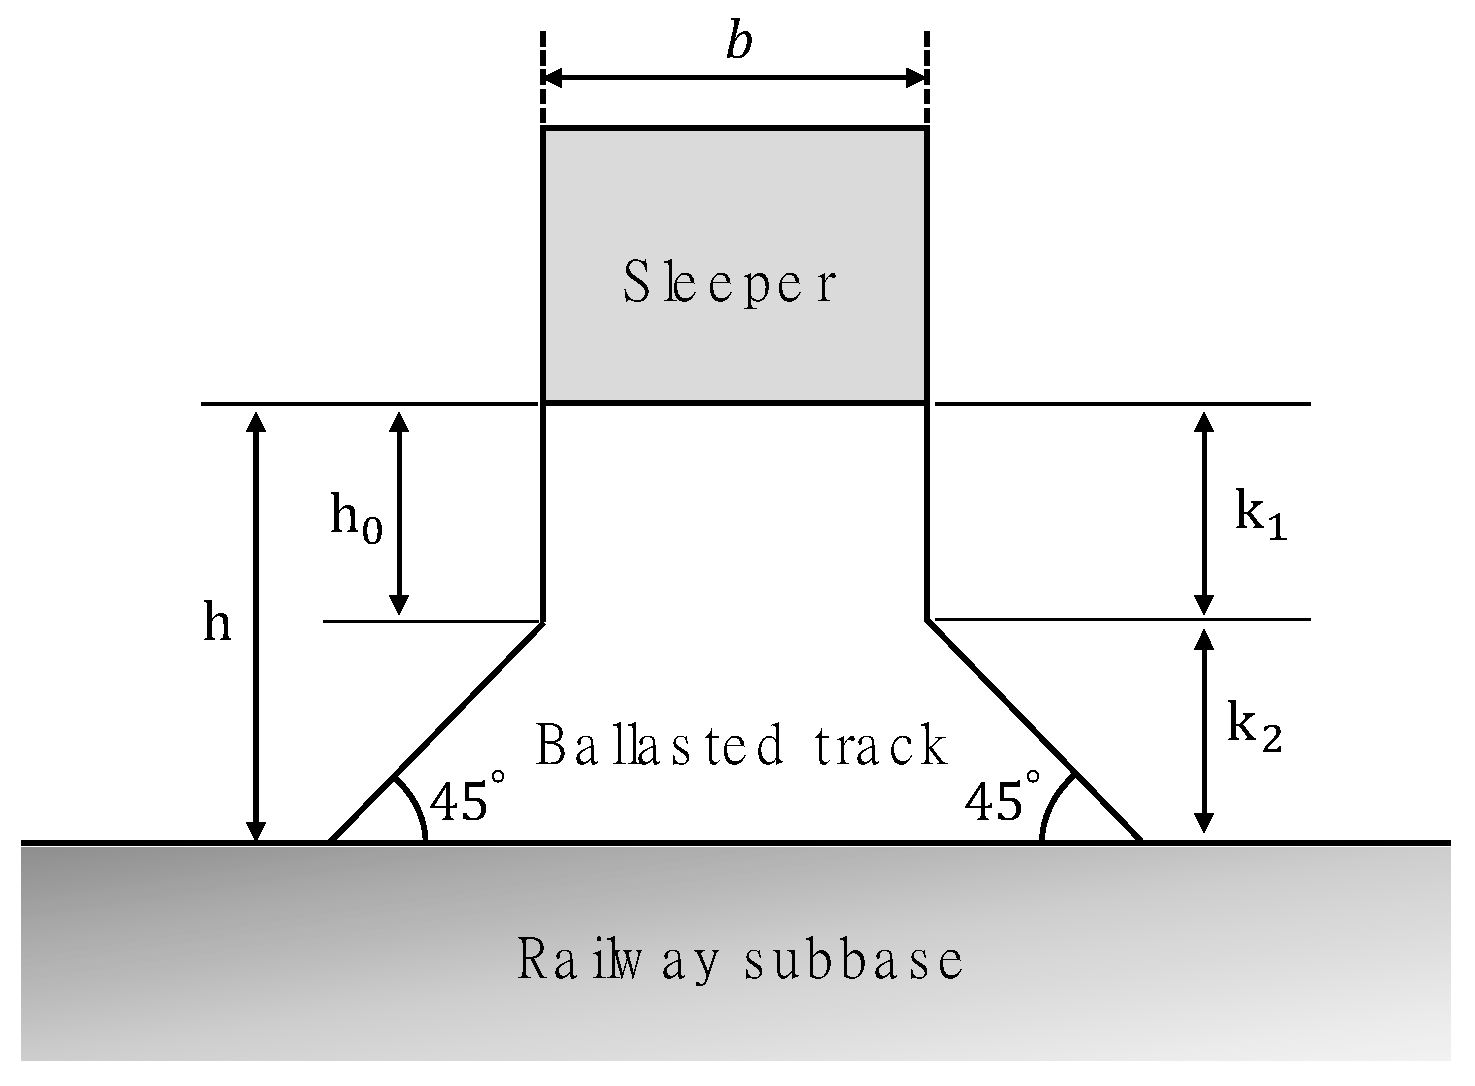
To establish the ballast, sufficient vertical stiffness is required for the train and track system to be positioned. Therefore, it is necessary to verify whether a parallel bond model based on the DEM is appropriate for implementing ballast. First, the vertical stiffness of the ballast required for the track system was calculated using design standard (KR C_14030) for Korean ballasted track structures [
19]. As shown in
Figure 4, it is assumed that the stress distribution at the bottom of the sleeper is the general condition of the ballast and that the stress does not spread up to 150 mm, and spreads at a 45° angle at a depth of more than 150 mm. In addition, the vertical stiffness of the ballast gravel was calculated as 20.12 kN/mm according to the presented formula, reflecting the shape of the sleeper in the analysis model, and the thickness of 300 mm of the ballast.
DEM was applied to the ballast, which is made up of an aggregation of gravel, to simulate the characteristics of individual gravel pieces. A conventional finite element method (FEM) is applied to the sleeper and ground, and a DEM–FEM combined analysis model was adopted in this study. Contact between two areas is achieved by surface coupling. It is divided into two nonoverlapping areas, and no load transfer occurs unless the two areas overlap. A penalty contact algorithm was used to calculate the normal force, and the tangential force was calculated through the law of friction [
20]. Once the conditions for contact and damping are defined between the two regions, contact between the moving DEM particle and the FEM is detected and a new force acts on the DEM particle. Conversely, the same force (opposite direction) affects the FEM element, and the FEM is treated as a boundary condition.
Figure 5 shows the flow chart of the DEM–FEM coupling method.
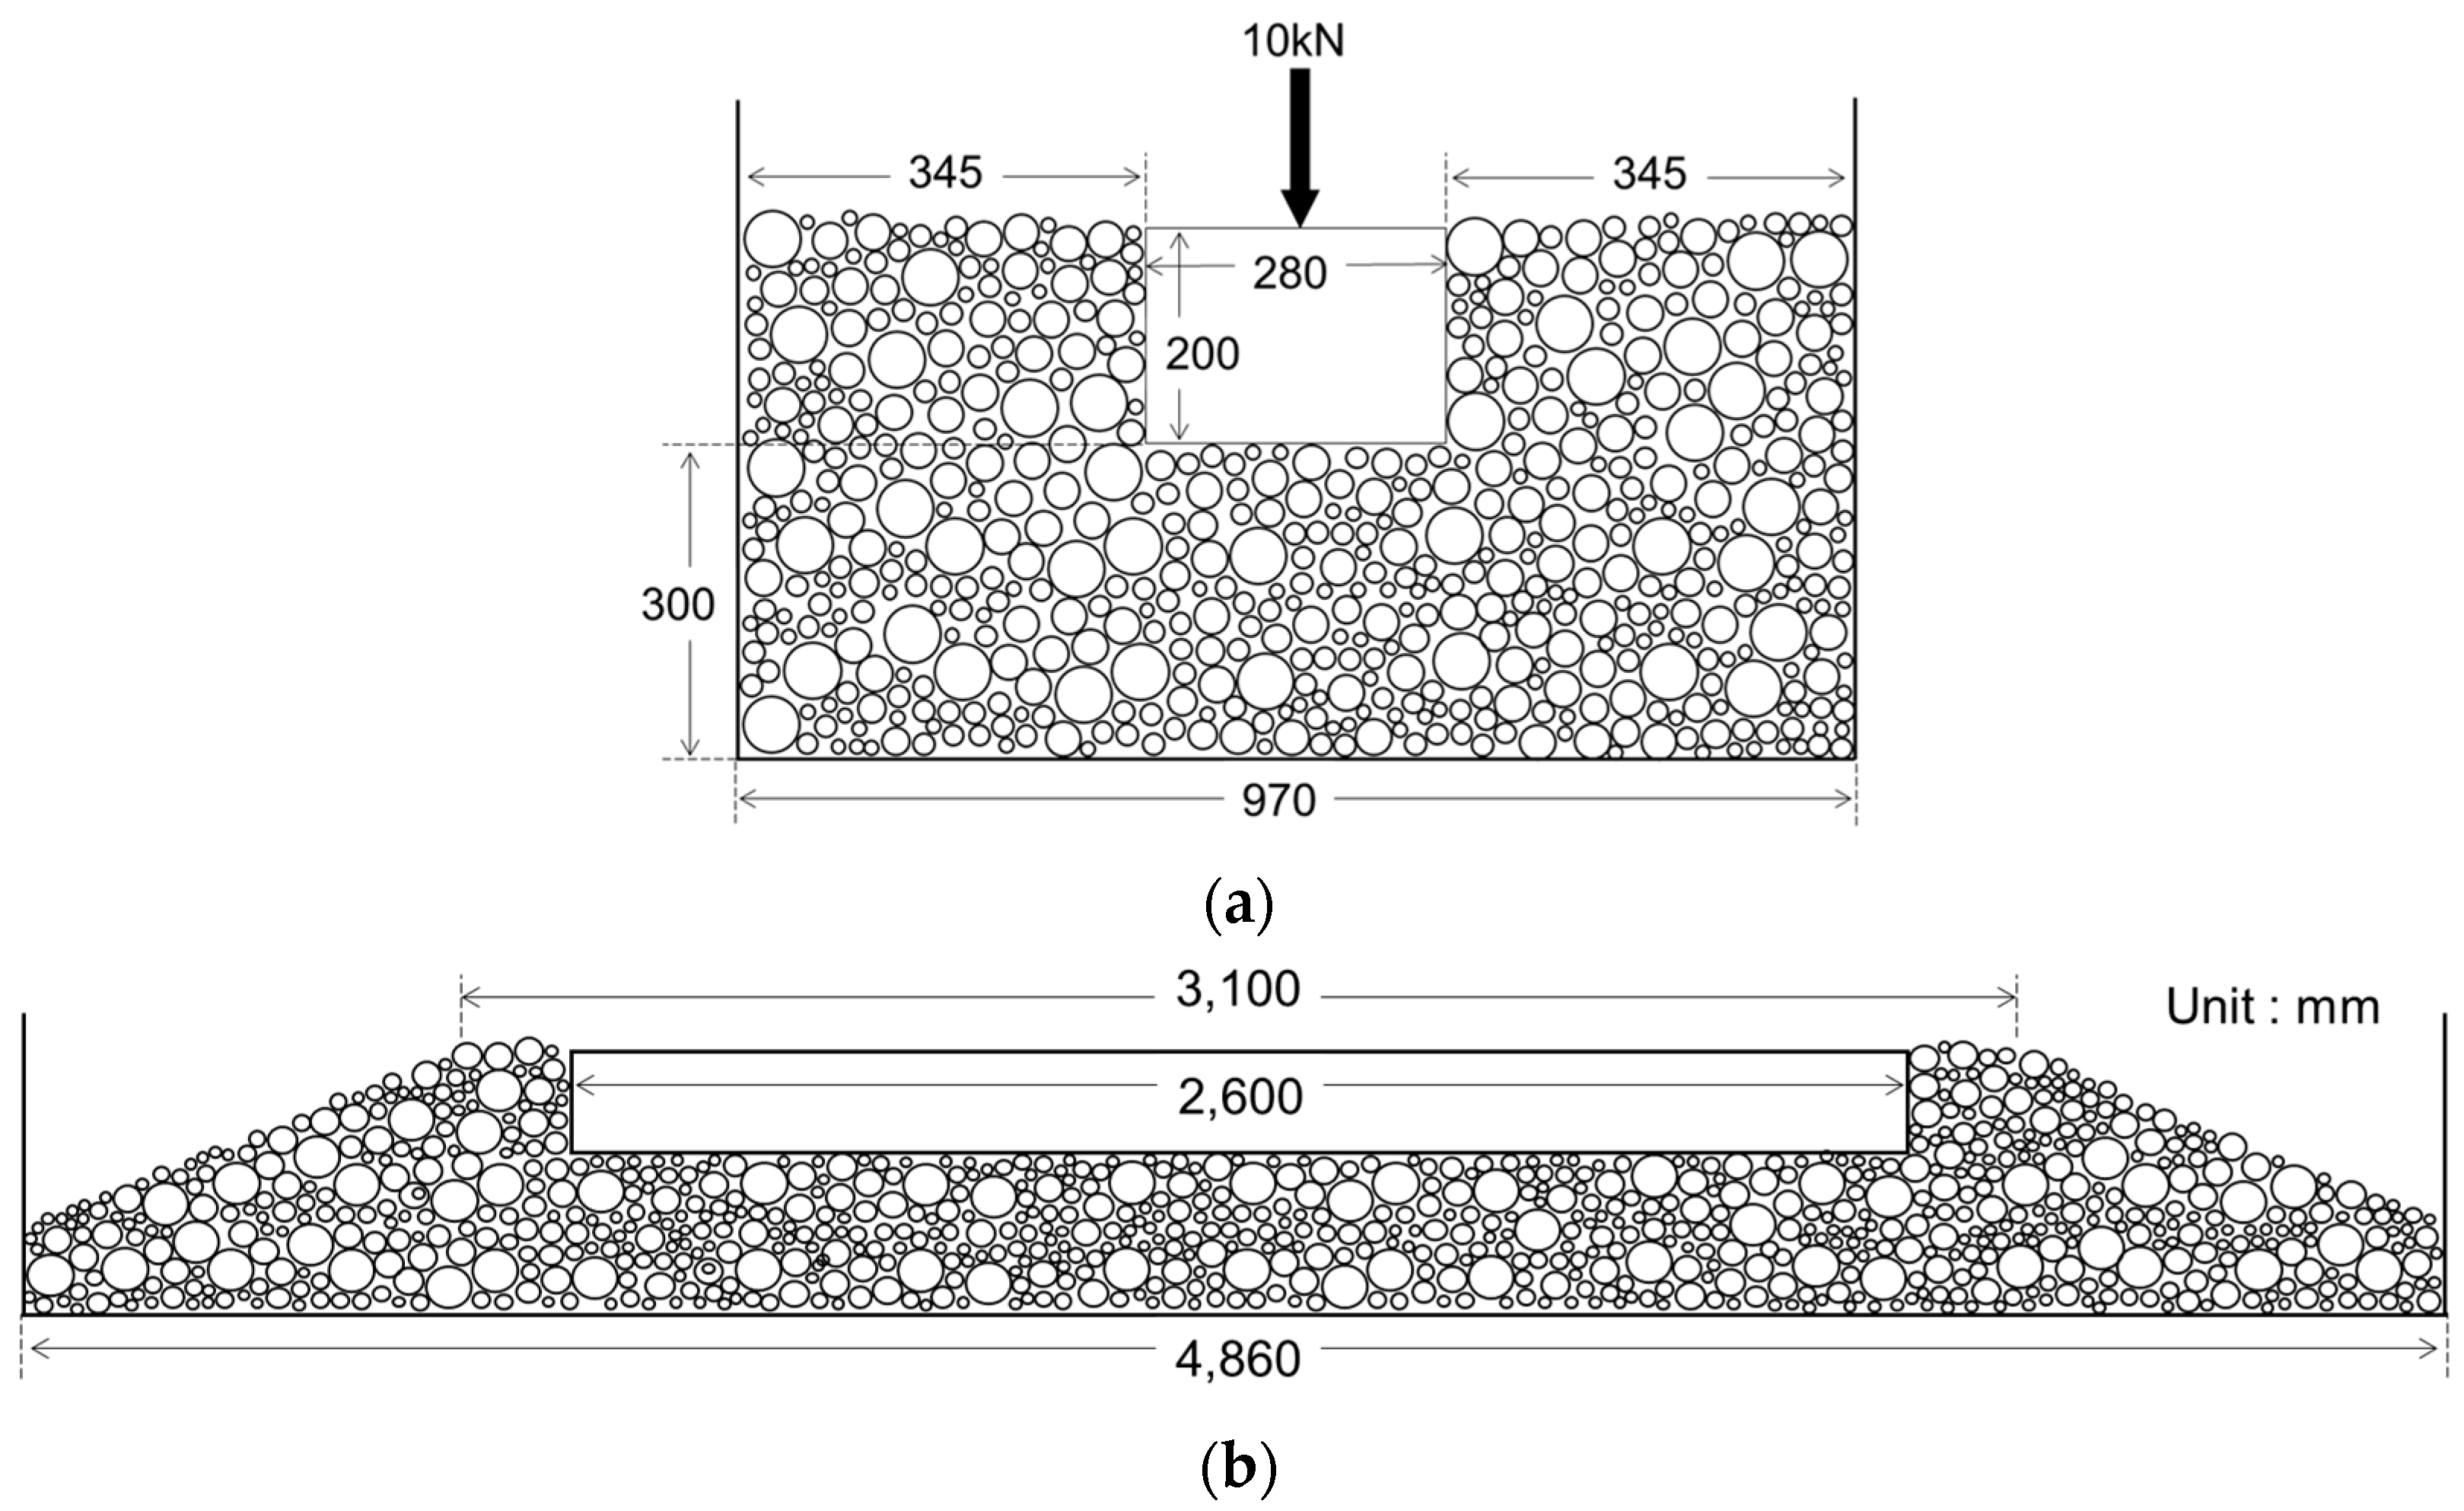
Discrete elements were packed according to the LS-DYNA algorithm according to the defined shape of the ballast. According to the ratio entered into the program, particles of different sizes are randomly packed to minimize voids. Therefore, gravel tamping to reduce voids can be omitted using a basic packing algorithm. The shape of an actual concrete sleeper is considered, which is composed of a solid element and the ground supporting the gravel ballast and the wall to express the longitudinally continuous track are composed of shell elements (
Figure 6).
The gravel on the ballast was not expressed as a clump according to the real gravel shape, but as a single particle according to the size of the gravel. The particle size distribution of the particles corresponds to that of Case 1, as shown in
Table 1. In the parallel bonding method, the particles bond with adjacent particles and behave as a continuum. The friction coefficient between particles is 0.5. This study aims to confirm the stiffness of the ballast by analyzing the instantaneous displacement of sleepers rather than explosive behavior. It is judged that the damping coefficient does not significantly affect the results, and for the efficiency of analysis, the damping coefficient between particles is not considered. The friction and damping coefficients for the contact between the gravel particle (DEM) region and the sleeper and ground (FEM) region are set to 0.5 and 0.3, respectively. Initially, a vertical separation distance of 0.1 mm was set between the bottom of the sleeper and gravel to exclude rapid vertical displacement and vibration caused by the overlap between the sleeper and discrete elements. The material models of the sleepers, gravel, and floor plates used in the analysis were modelled as rigid bodies so that the local deformation of each structure was not reflected in the analysis results. The material properties of the concrete and gravel were set according to Gere et al. [
21] and are summarized in
Table 2. The ground boundary condition was constrained for all six degrees of freedom of translation and rotation, and no boundary conditions were provided for the sleeper or gravel. The total simulation time was 1000 ms, and the vertical displacement of the sleeper was stabilized by continuously applying a 1 g gravity load.
The vertical displacement was checked at the center of the top of the sleeper.
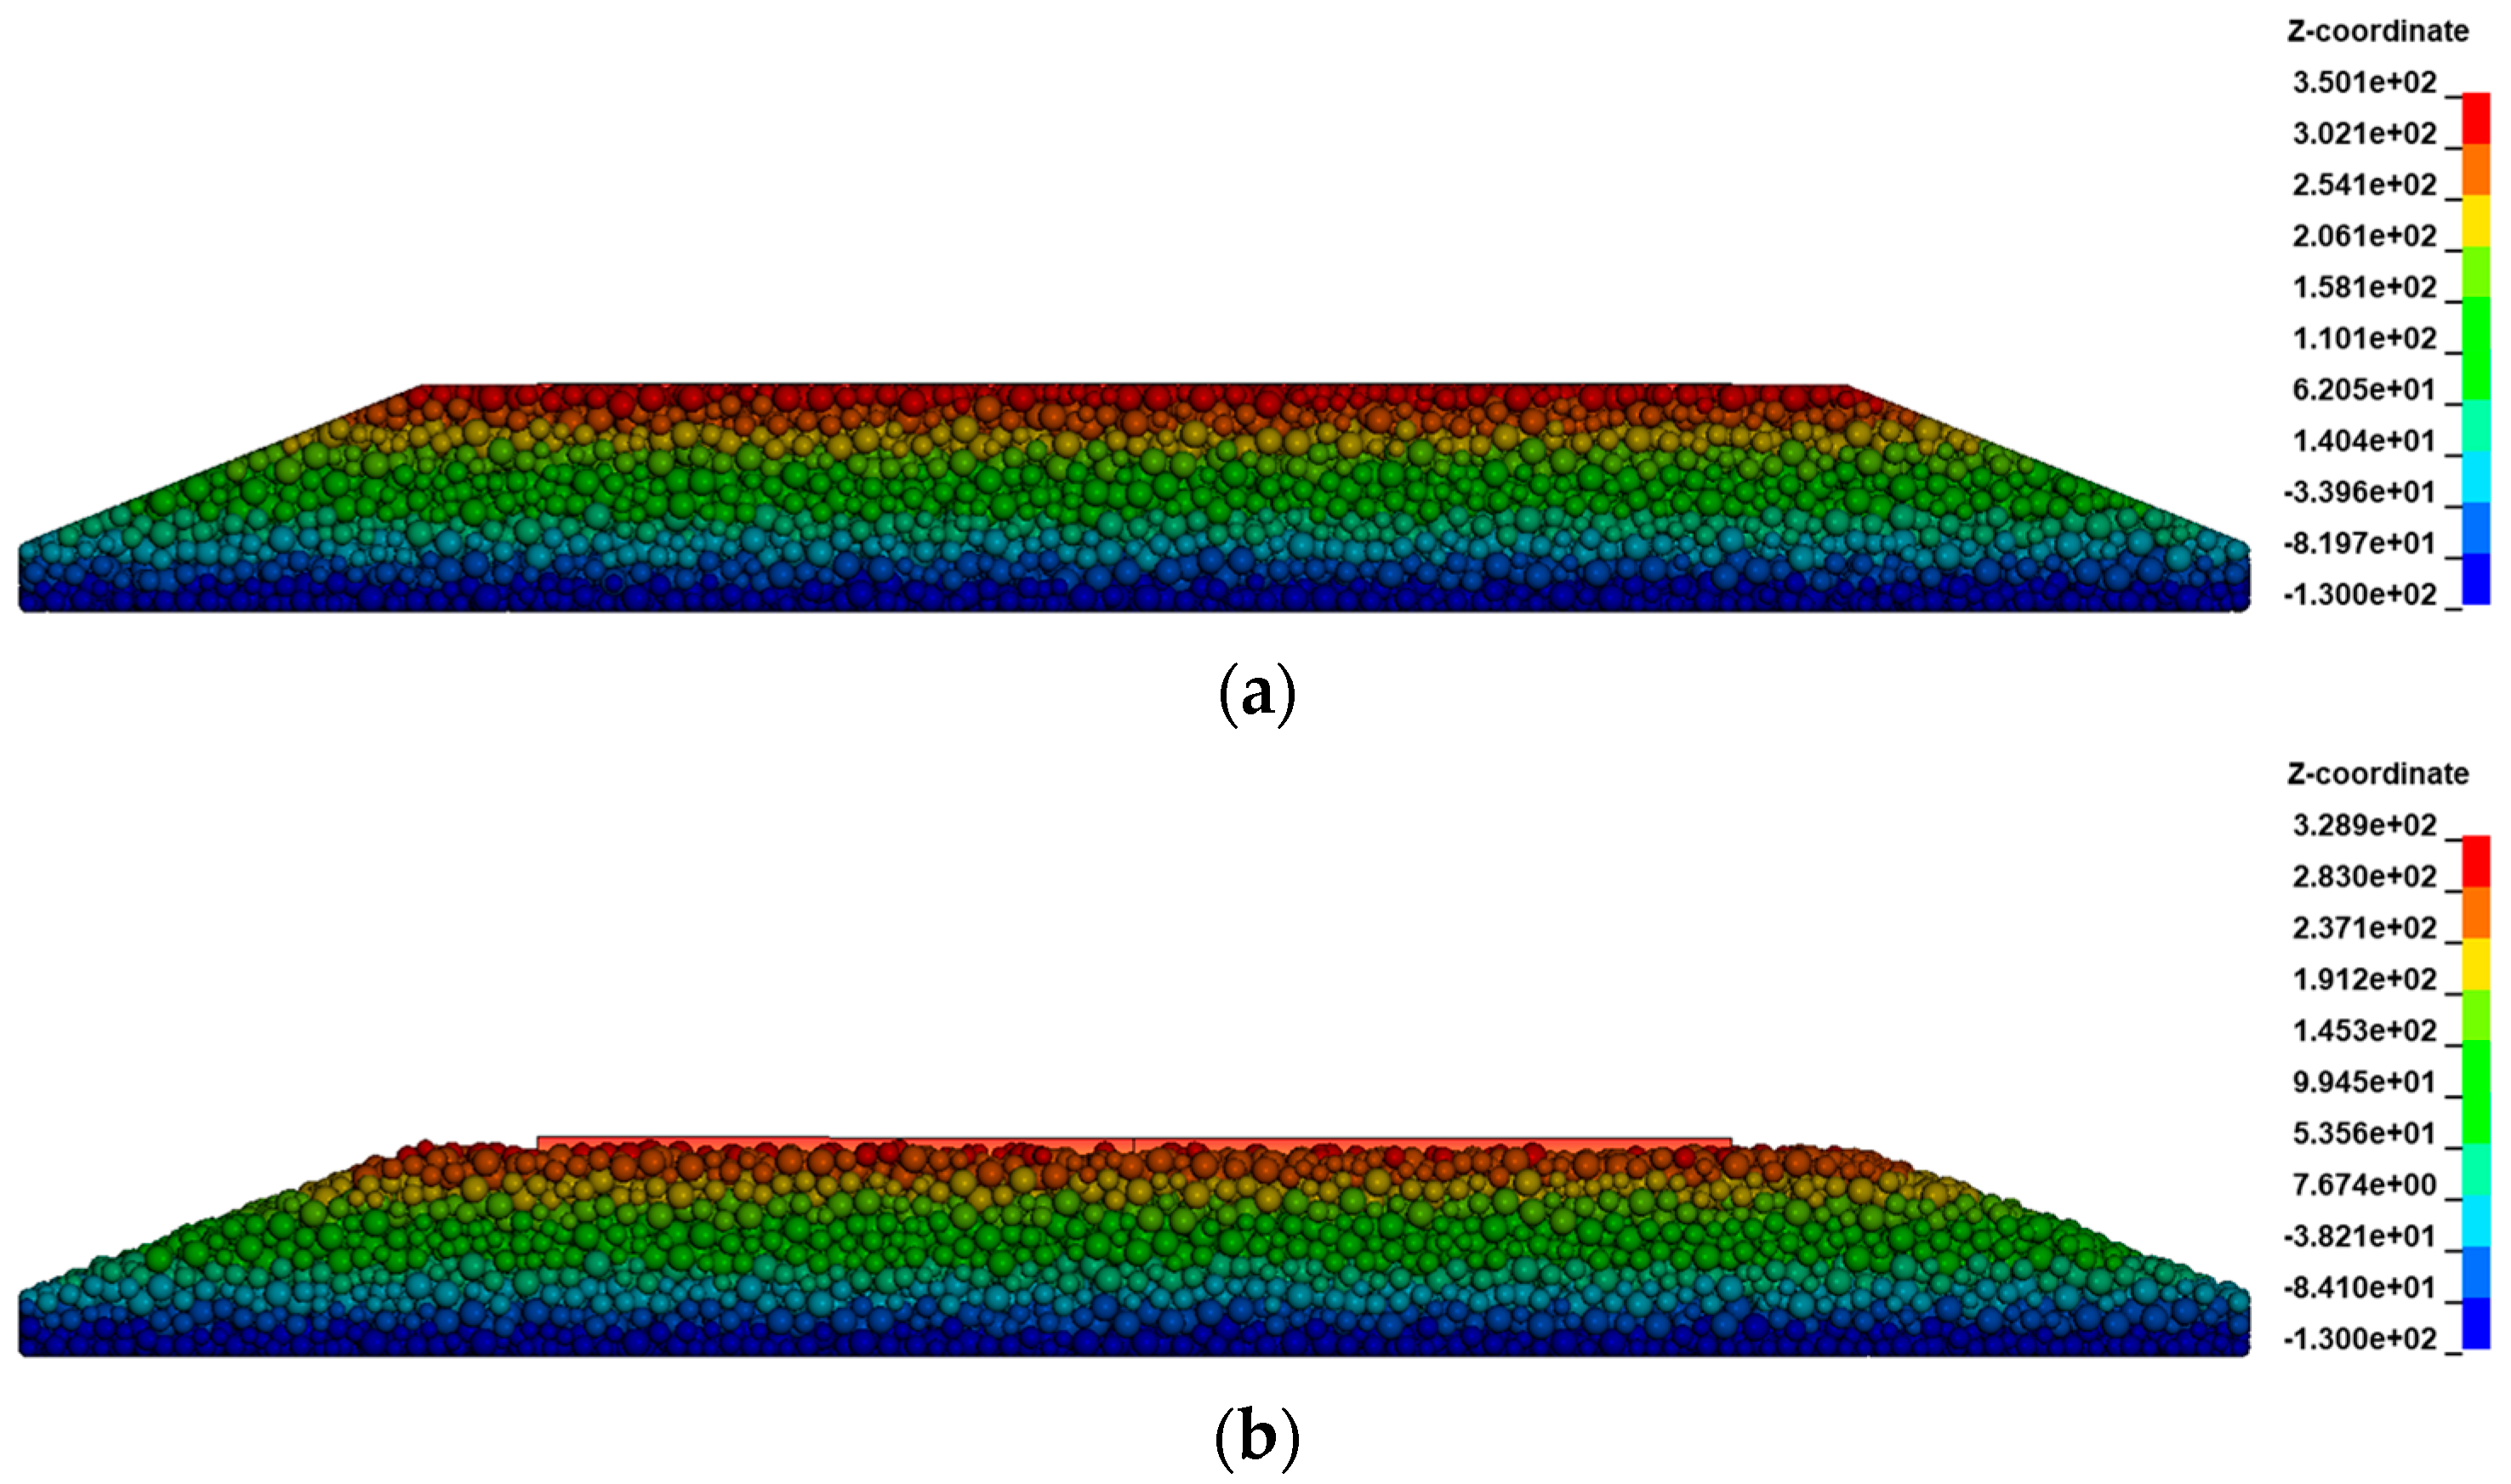
Figure 7a shows the shape of the ballast before gravity load is applied. As shown in
Figure 7b, the shape of the ballast section was not maintained. Additionally, as shown in
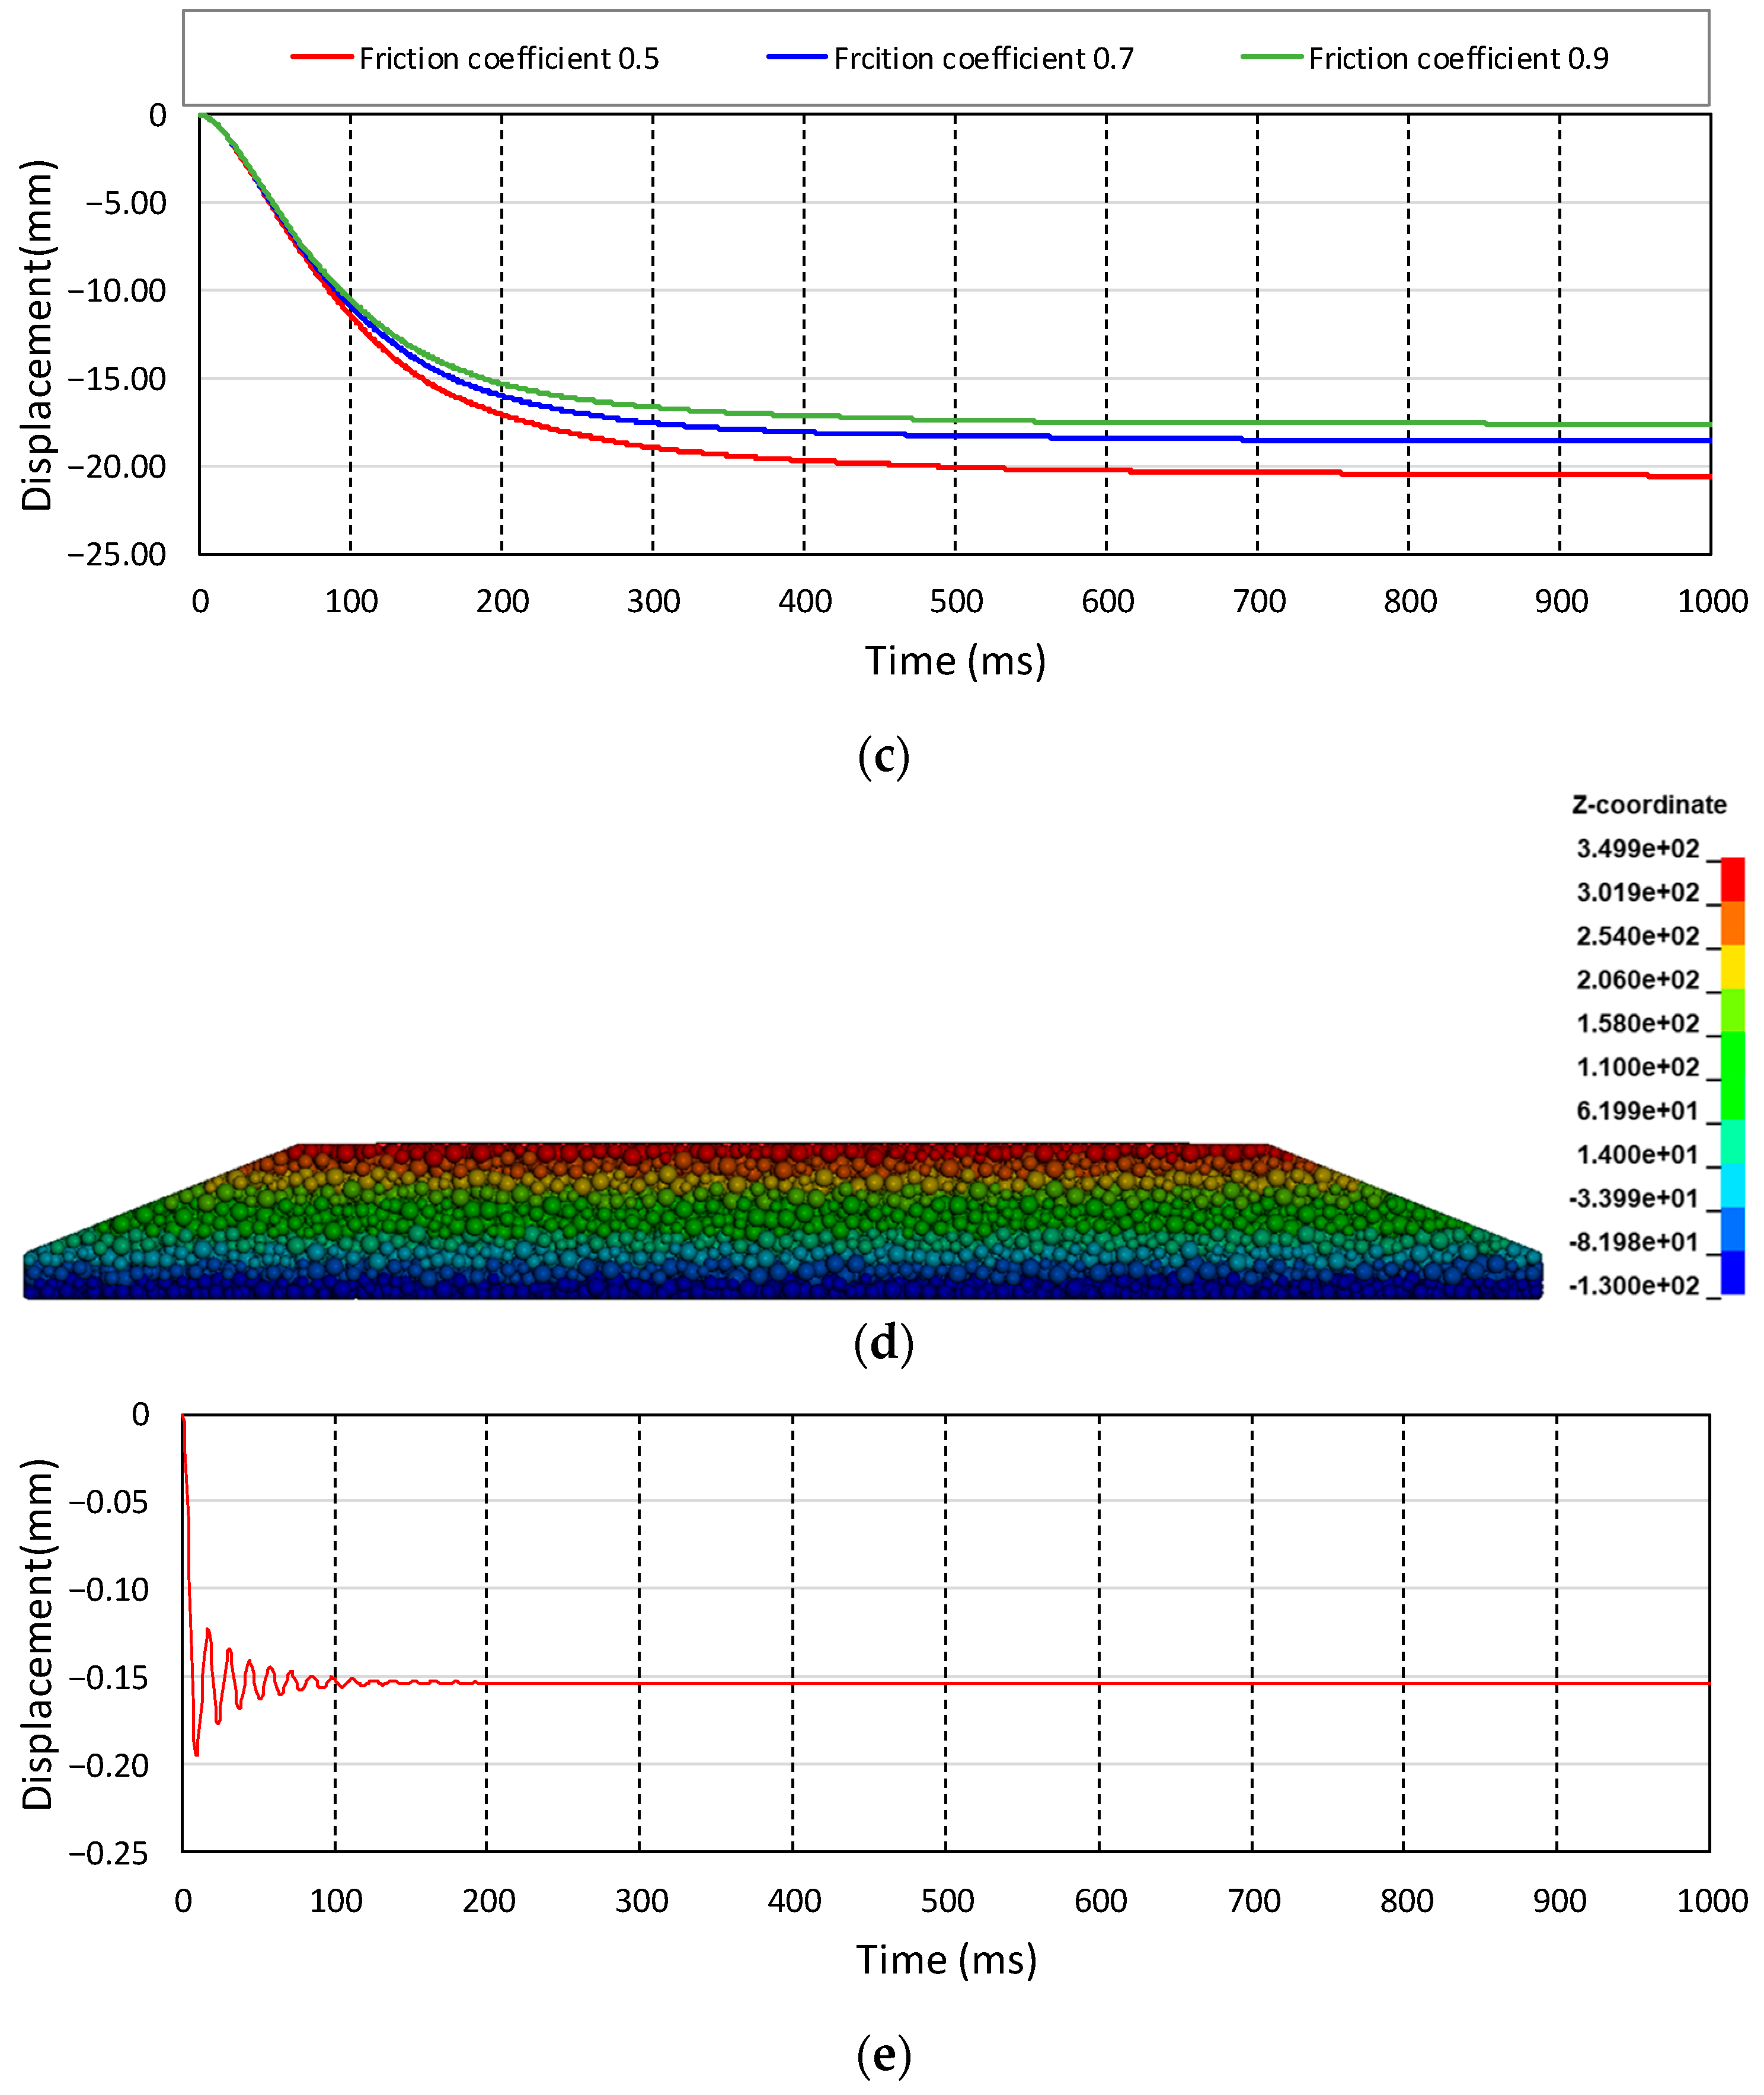
Figure 7c, in the analysis of the friction coefficient as a variable, continuous vertical displacement occurred in the sleeper regardless of the high friction coefficient. In a ballast shape with open sides, such as the analysis model used in this study, the weight of the sleeper cannot be supported by the friction coefficient of single particles in point contact. Without clumps, it was impossible to derive the geometric interlocking of the particles and excessive rolling of the particles was considered to be the cause. Next, the parallel bond analysis model was verified to omit the clump formation process and replace the surface contact between the particles with the bonding force.
and
, parameters that determine the elasticity of the bond through the cylinder formed between adjacent particles, were bonded at 100 MPa and 0.4, respectively. These parameters were determined to demonstrate required stiffness as reported by Kornél Tamás et al. [
22]. In addition, the variable
for the circular cross-sectional area was observed to be 1.5 for necessary stiffness and load transfer for the connection between particles with different radii.
Figure 7d,e show the results when PBM is applied. An initial vertical displacement of 0.1 mm occurred between the sleeper bottom surface and the gravel. After the vibration caused by the contact between the sleeper and gravel, the vertical displacement of the sleeper undergoes a process of stabilization for up to 200 ms. Additional displacement does not occur, and it is possible to implement a ballast using the parallel bond model.
4. Verification of Track Stiffness
It was verified whether the ballast analysis model using the parallel bond method achieved the initial stiffness in the vertical direction as an elastic body. The total simulation time was the same, and the vertical displacement of the sleeper was confirmed using a continuous gravitational load. Subsequently, a concentrated vertical load of 10 kN was applied to the center of the sleeper from 400 ms to 1000 ms, when the vertical displacement was stabilized. The applied load was the frequency-domain load used by Kim et al. [
11] and Kim (2021) [
23]. However, for the purpose of this study, which was to verify the initial stiffness without considering the plastic deformation or separation of particle bonds on the ballast, a static load of 10 kN was applied. The vertical displacement of the sleeper was measured at the same point as the load. In geotechnical engineering, the particle size has a significant influence on ground behavior. It was assumed to exhibit the same behavior in the DEM simulations [
24]. A gravel ballast is formed by the interlocking of countless gravels. When a relatively large number of gravels are placed in the same gravel layer cross-section, the porosity is lowered, and the number of interlocking gravels increases, so high rigidity is expected. Therefore, the effect of the discrete element particle size ratio (change in porosity) on the ballast stiffness was evaluated. Based on the sieve analysis of Korean railroad equipment (KRCS A015 07) [
25], the particle size distribution ratio of gravels between 22.4 and 63 mm is adjusted and implemented into four analysis case models, as shown in
Table 2.
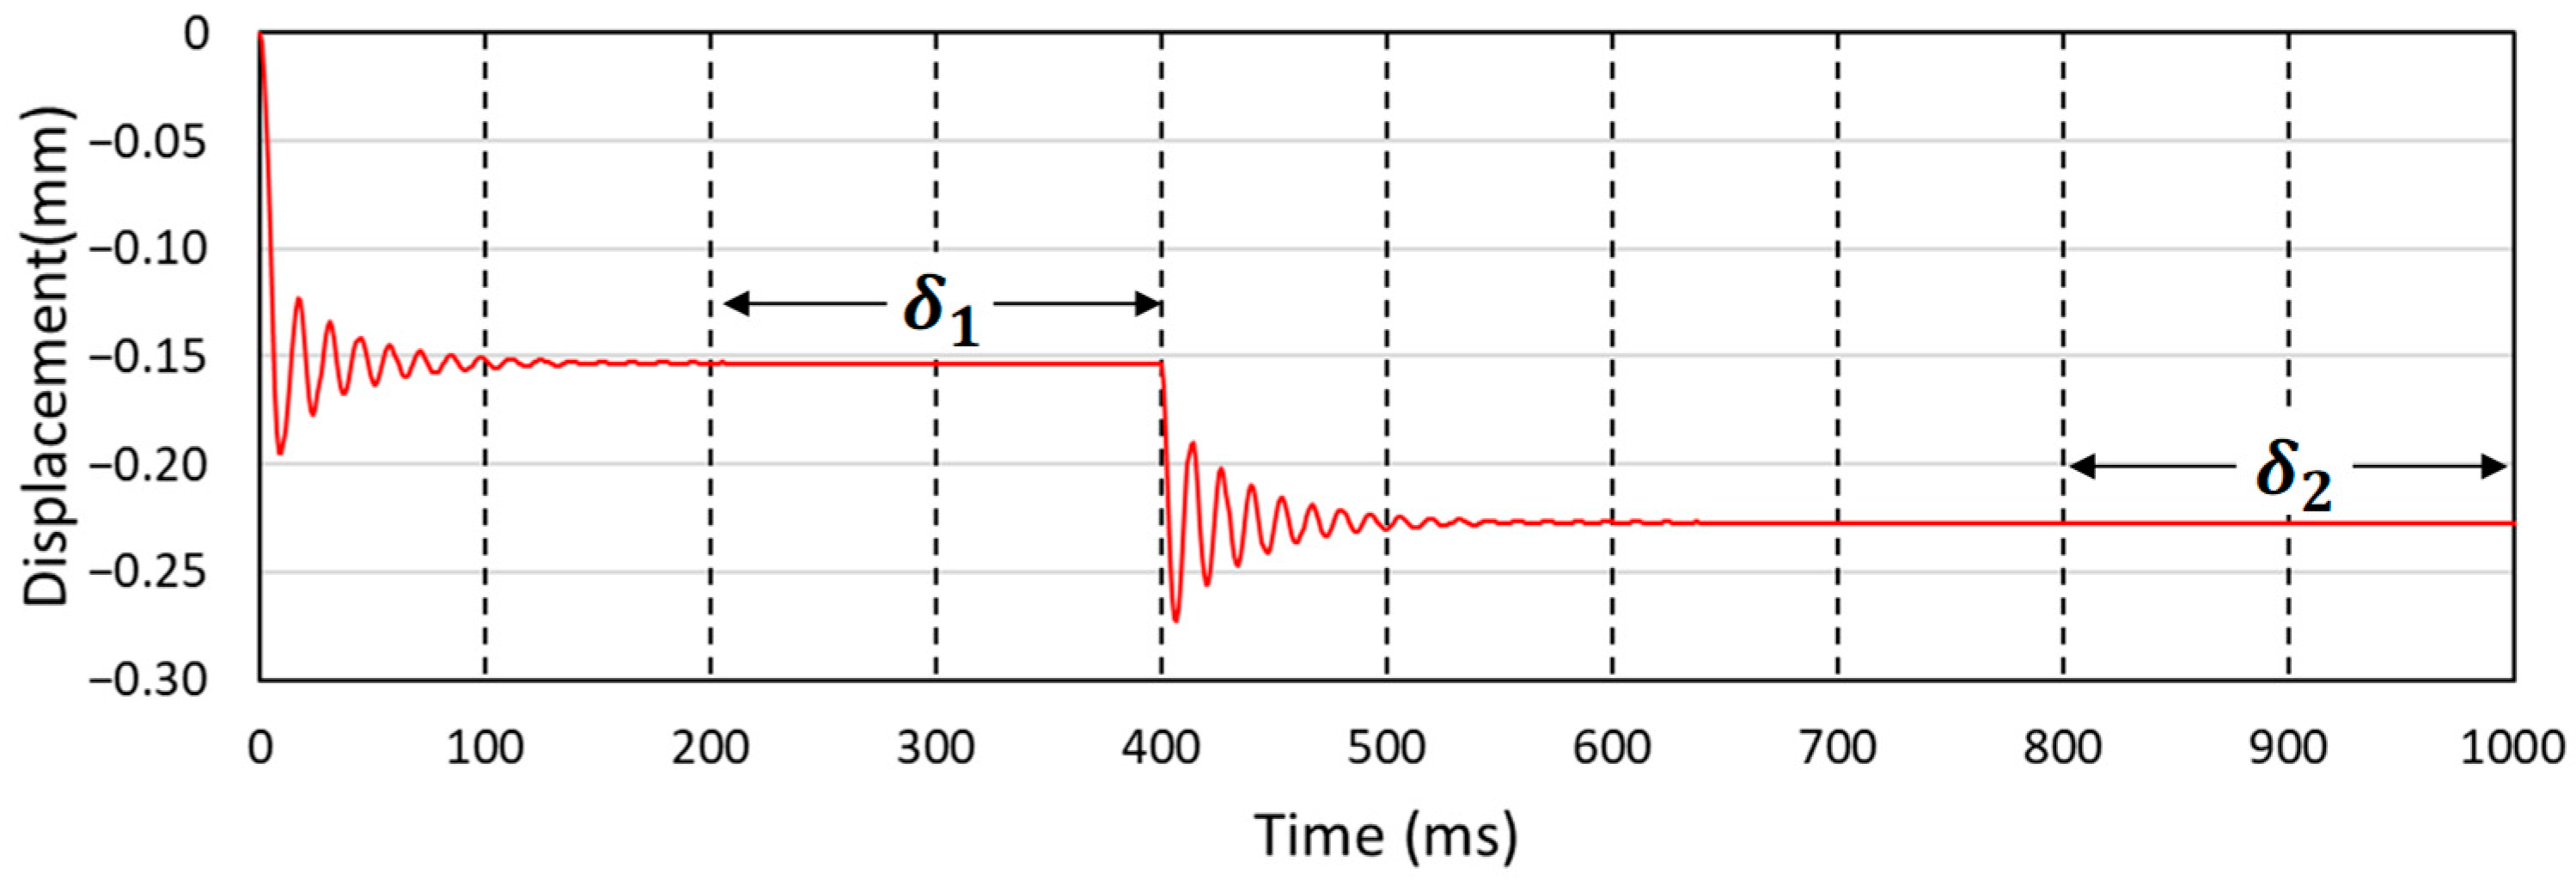
Figure 8 shows an example of the evaluation of the vertical stiffness.
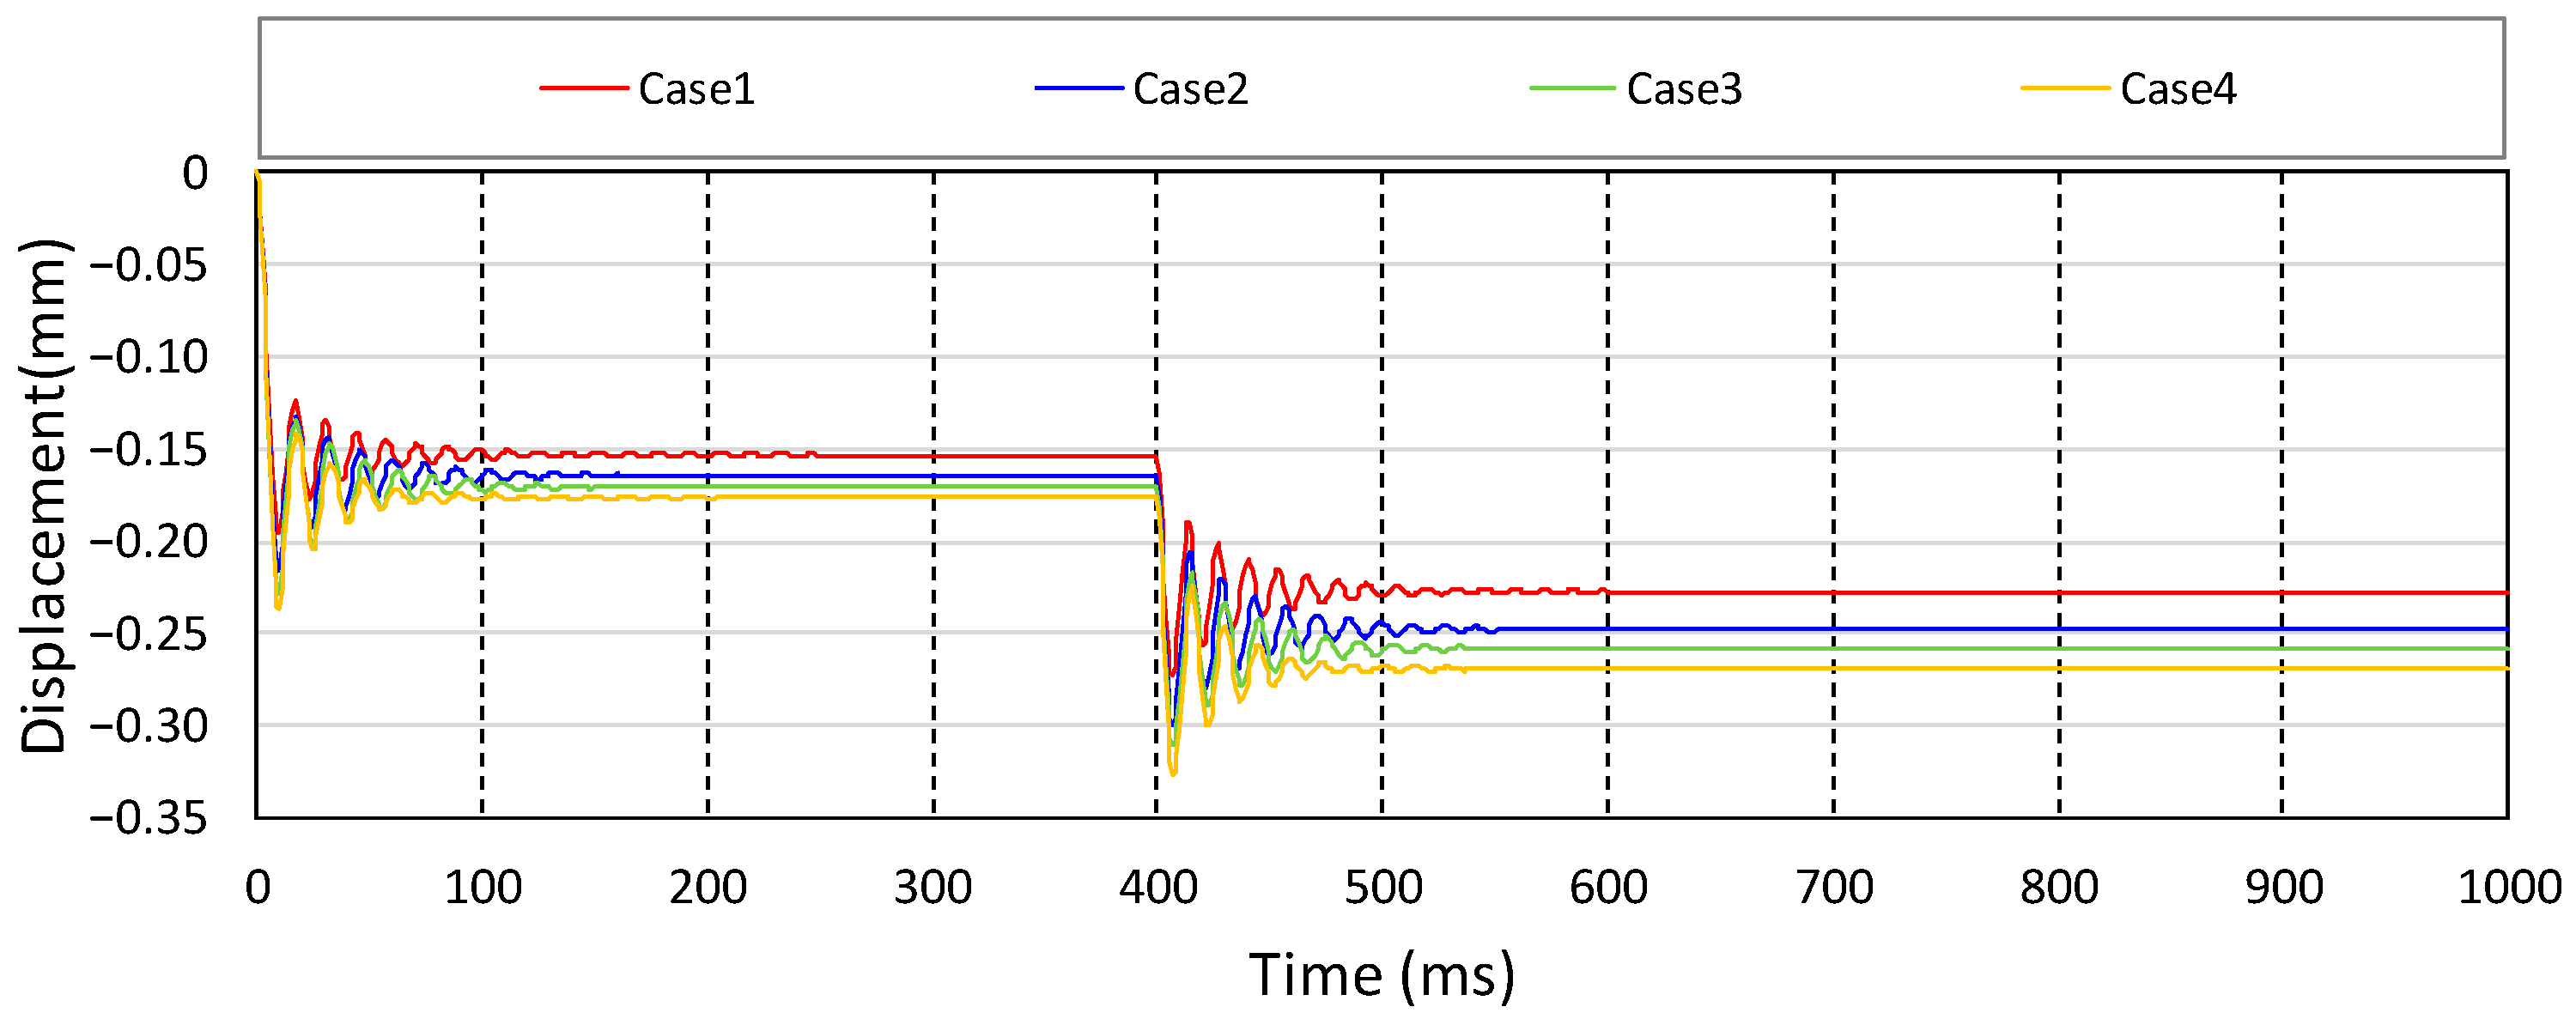
The results of the analysis model according to the particle size distribution are shown in
Figure 9. As the number of large particles increased, the porosity increased, and the number of bonding elements decreased. Large vertical displacements occurred in the analytical models with a high proportion of large particles. Therefore, a relatively large vertical displacement and low stiffness occurred during the stabilization and loading phases. The displacement and calculated vertical stiffness values for each model are listed in
Table 3.
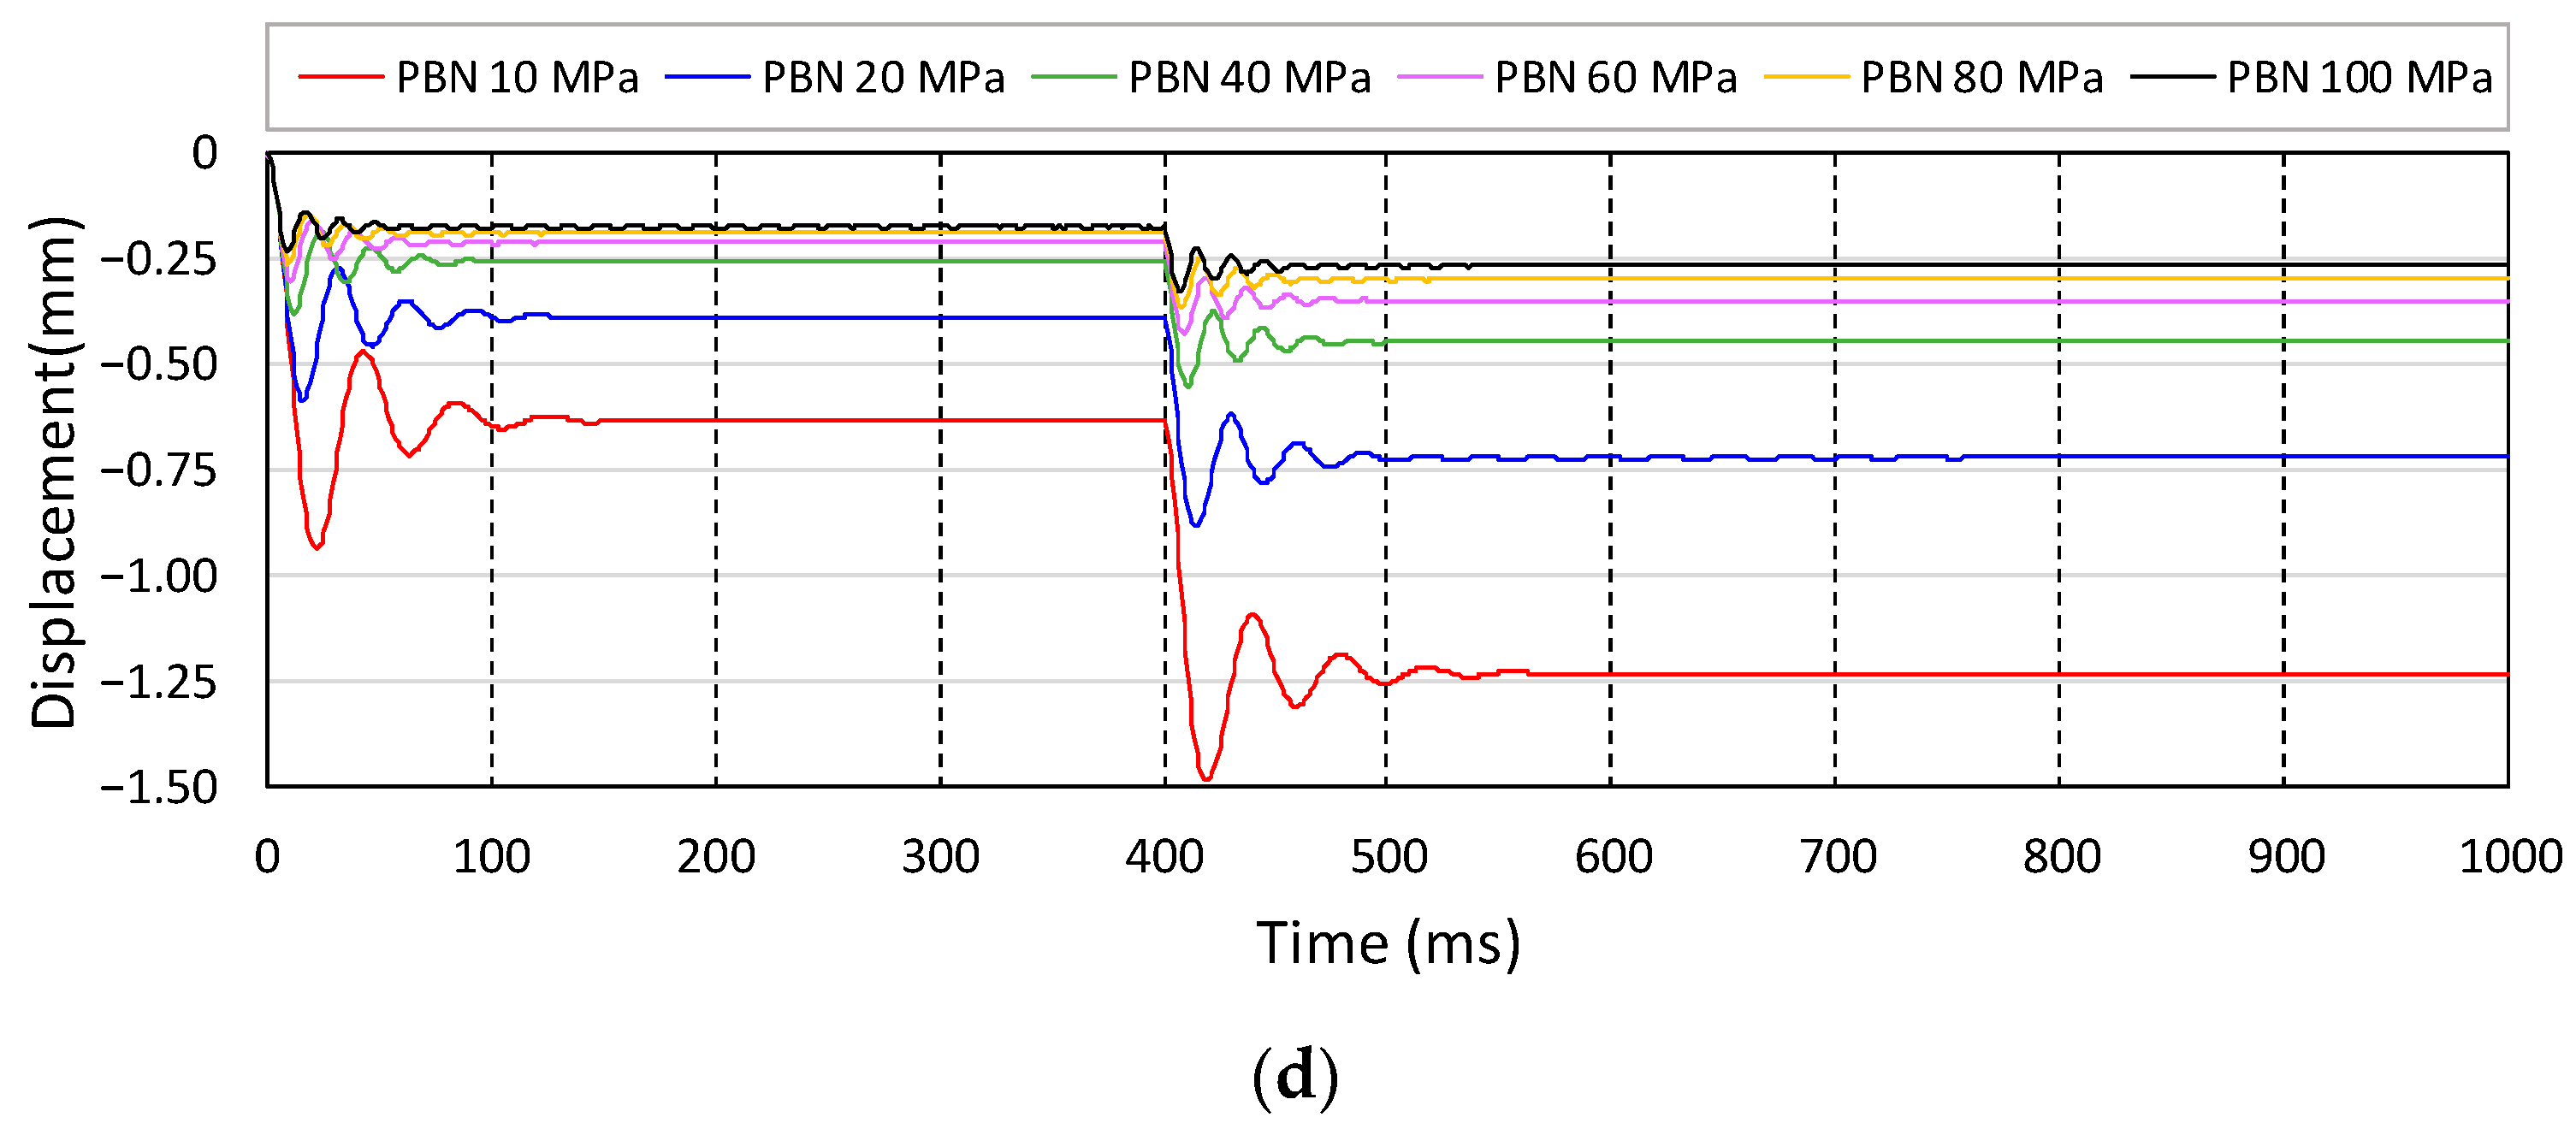
Next, to evaluate the effect of
on the vertical stiffness and to confirm the appropriate vertical stiffness, variable analysis was performed with each case up to 1/10 value of the previous
. In all the cases shown in
Figure 10, as the
decreased, relatively large vertical displacements occurred during the stabilization and loading stages. The vertical displacement and stiffness values of each model are listed in
Table 4. In Case 1, a vertical stiffness of 20.12 kN/mm, which was the design standard, was satisfied with a
of 10 MPa. However, as an analytical model with a high proportion of large particles shows low stiffness, an accurate determination of the
is necessary.
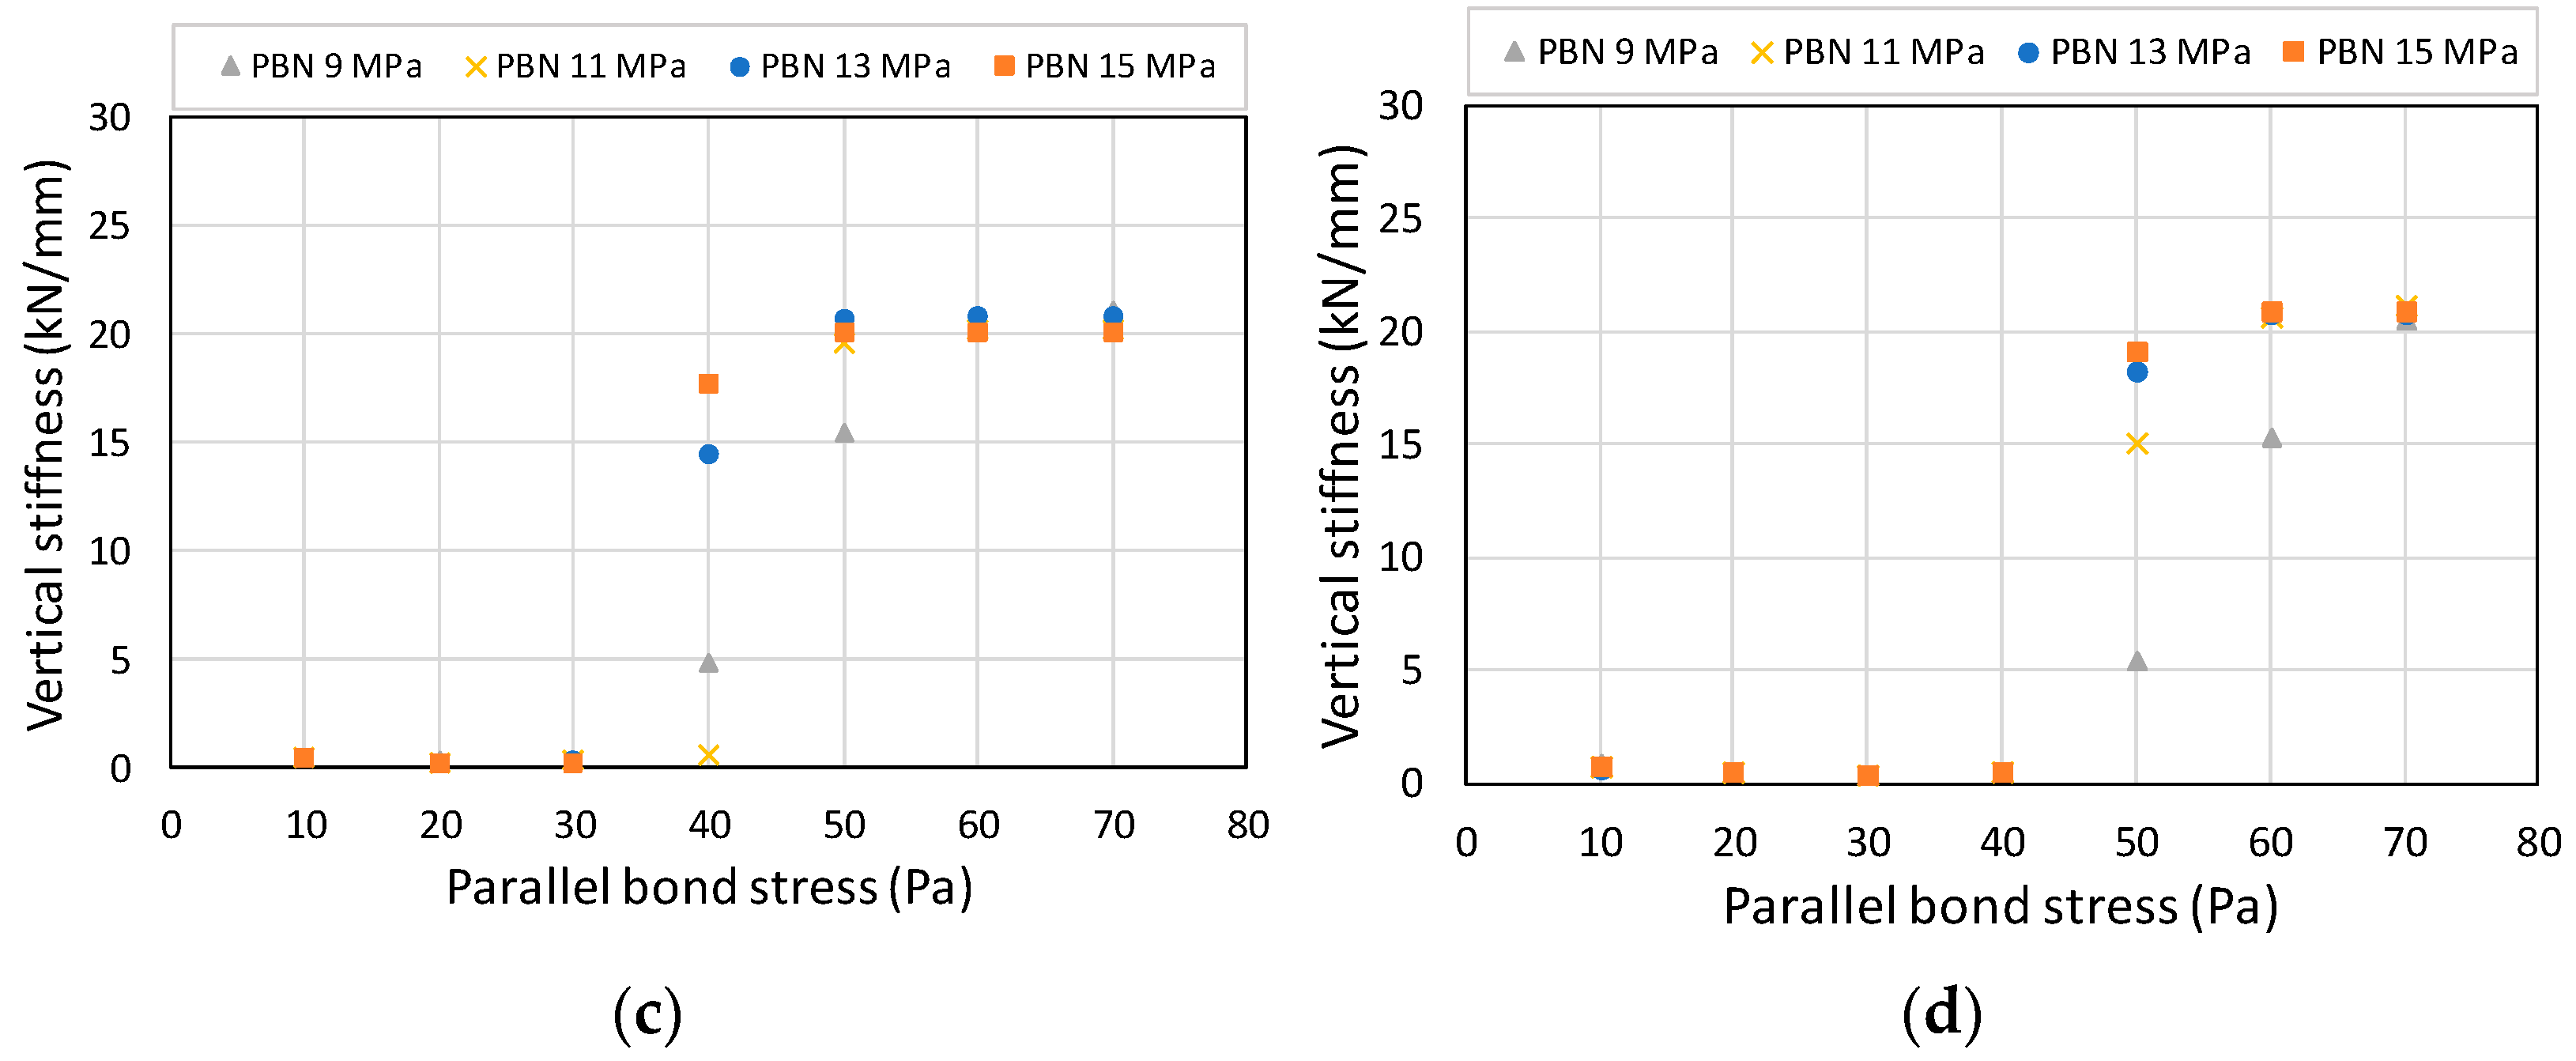
Next, the
required for each analysis model was calculated, and the dependent variable
was set to check the change in vertical stiffness. By setting
as a variable from 9 to 15 Mpa for each case model, and
as a variable from 0.1 to 0.7, the lower limit of bond stiffness for the normal and shear that satisfies the standards was checked. Both
and
are considered as factors that directly affect stiffness, and
Figure 11 shows the vertical stiffness for each case calculated through a combination of the two variables. The vertical stiffness results were reviewed based on the recommended stiffness of 20.12 kN/mm from the design standard.
Table 5 lists the lower limits and vertical stiffnesses of
and
based on the recommended stiffness.
When subjected to long-term loading, such as repeated wheel loading, individual fractures of the gravel occur. Additionally, the settlement of the gravel layer due to failure affects the overall settlement of the track system. However, due to the short-term of the train driving simulation, consideration of gravel breakage is deemed unnecessary. This study focuses on preparing a gravel ballast analysis model needed for train running and derailment simulation rather than considering gravel’s actual shape and breakage. Subsequently, although this study did not consider the bond failure of the particles, the minimum bond strength was checked to maintain the shape of the ballast and ensure vertical rigidity.
and
are the bond strengths in the normal and shear directions, respectively. In this study, the bond strengths in the normal and tangential directions of the ballast gravels were assumed to be the same values for simplicity, although the values are different in reality.
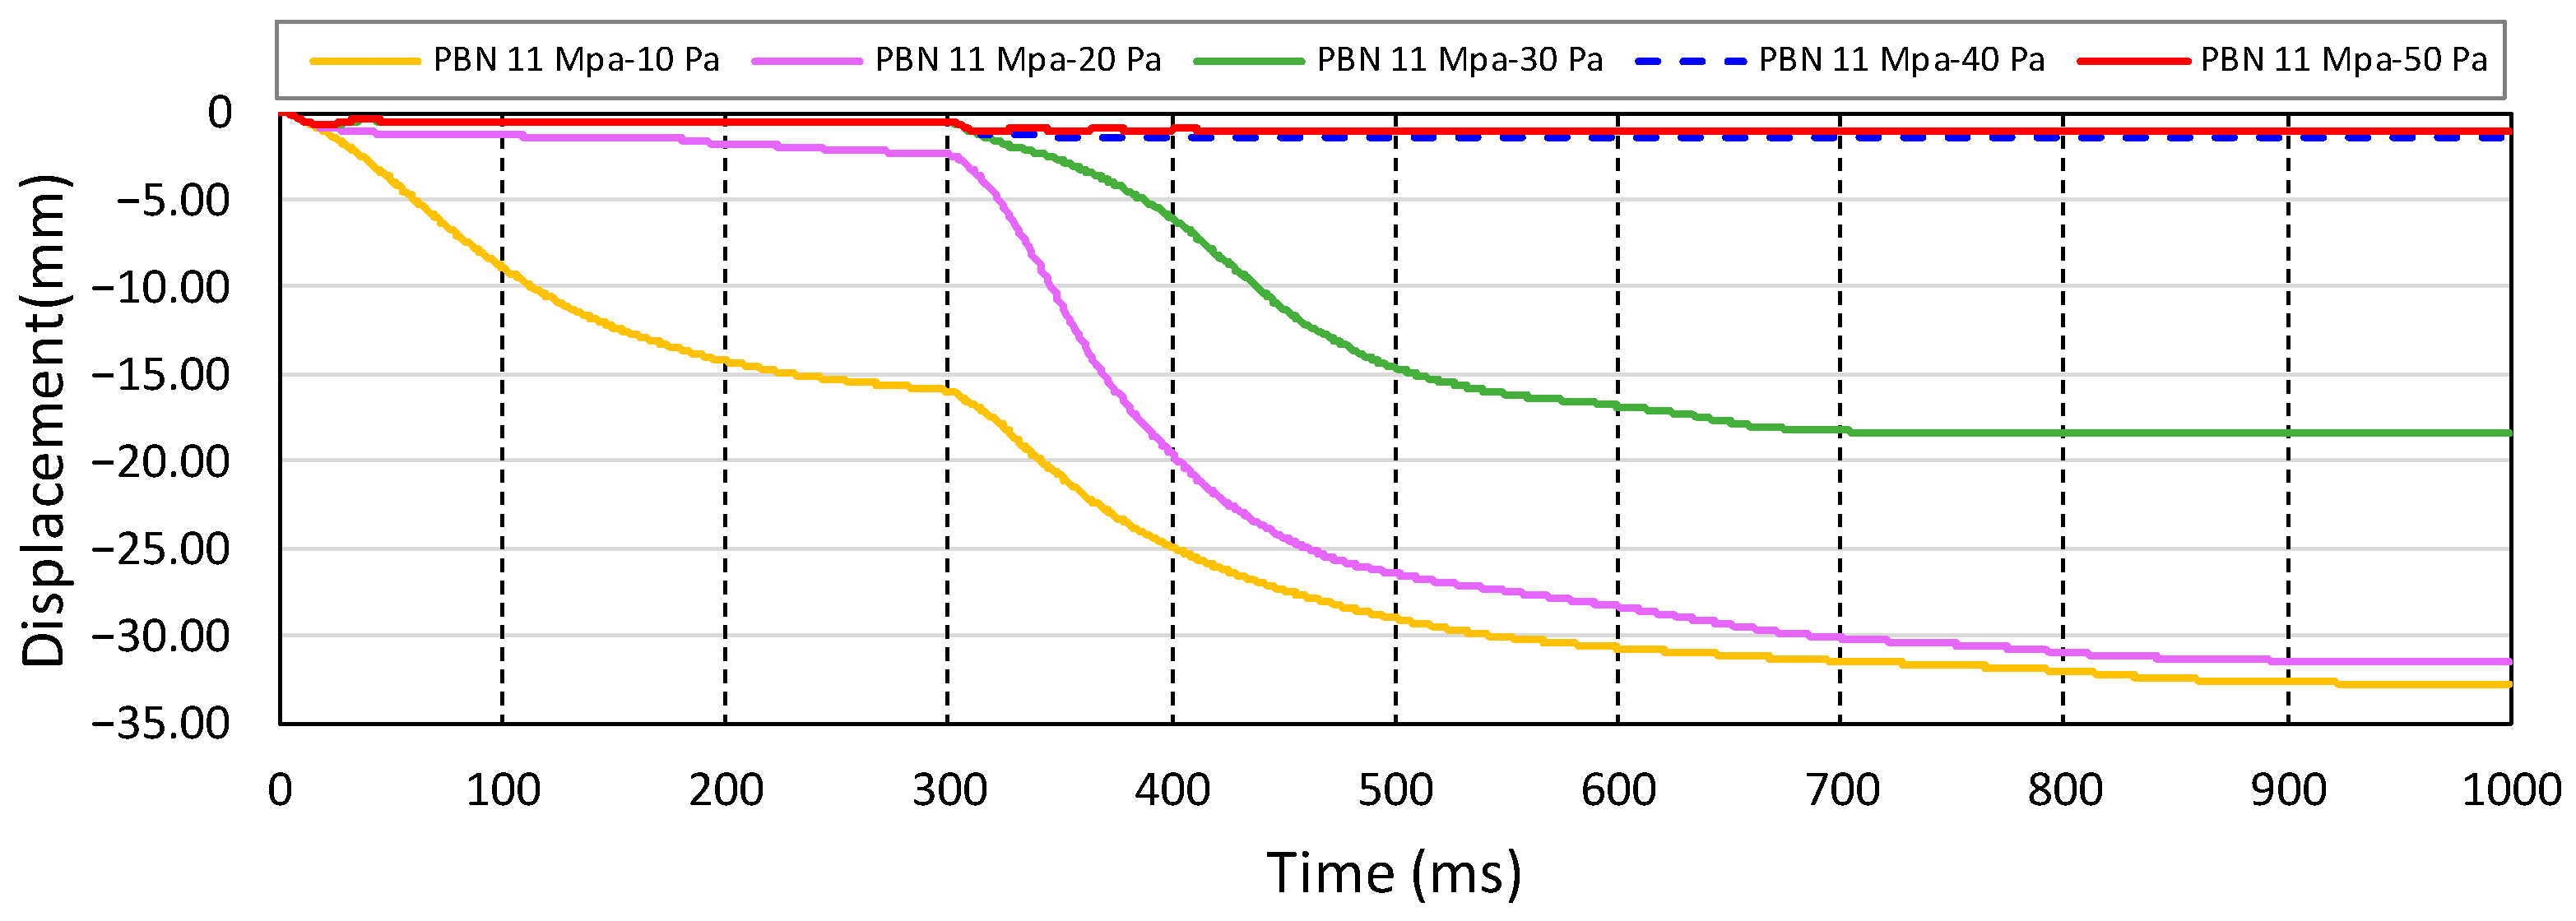
Figure 12 shows the analysis results with bond strength as a variable for the analysis model in Case 1 where
and
were applied at 11 MPa and 0.3, respectively. If the bond strength was sufficient, the initial stiffness could be determined. However, if it is insufficient, there are two cases where the shape of the ballast cannot be maintained under a gravity load, or particle bonding is separated when the load is applied at 400 ms and the sleeper cannot be supported. The vertical stiffness of the ballast calculated for each case is shown in
Figure 13. The lower limits of
and
and the vertical stiffness are listed in
Table 6.
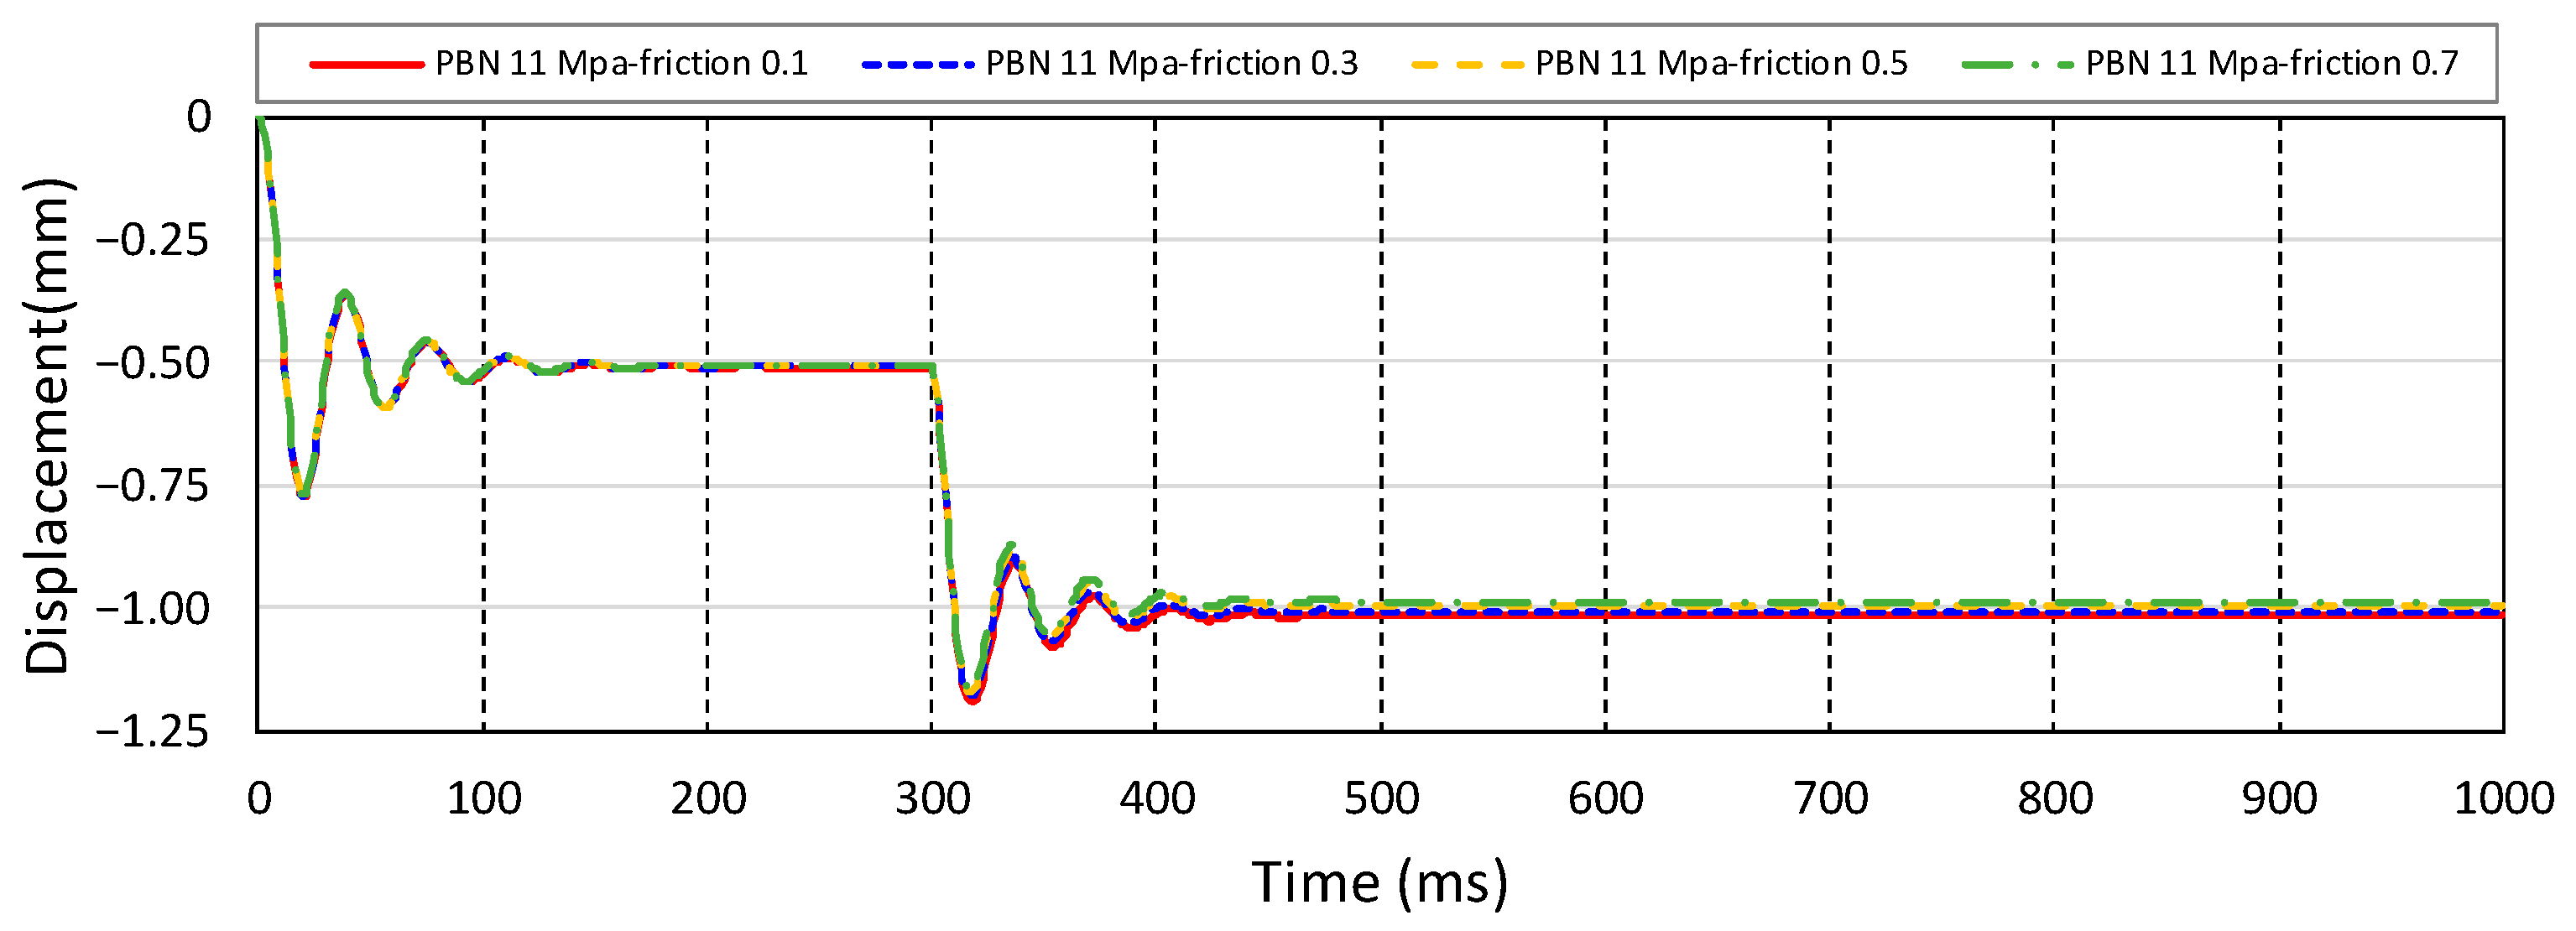
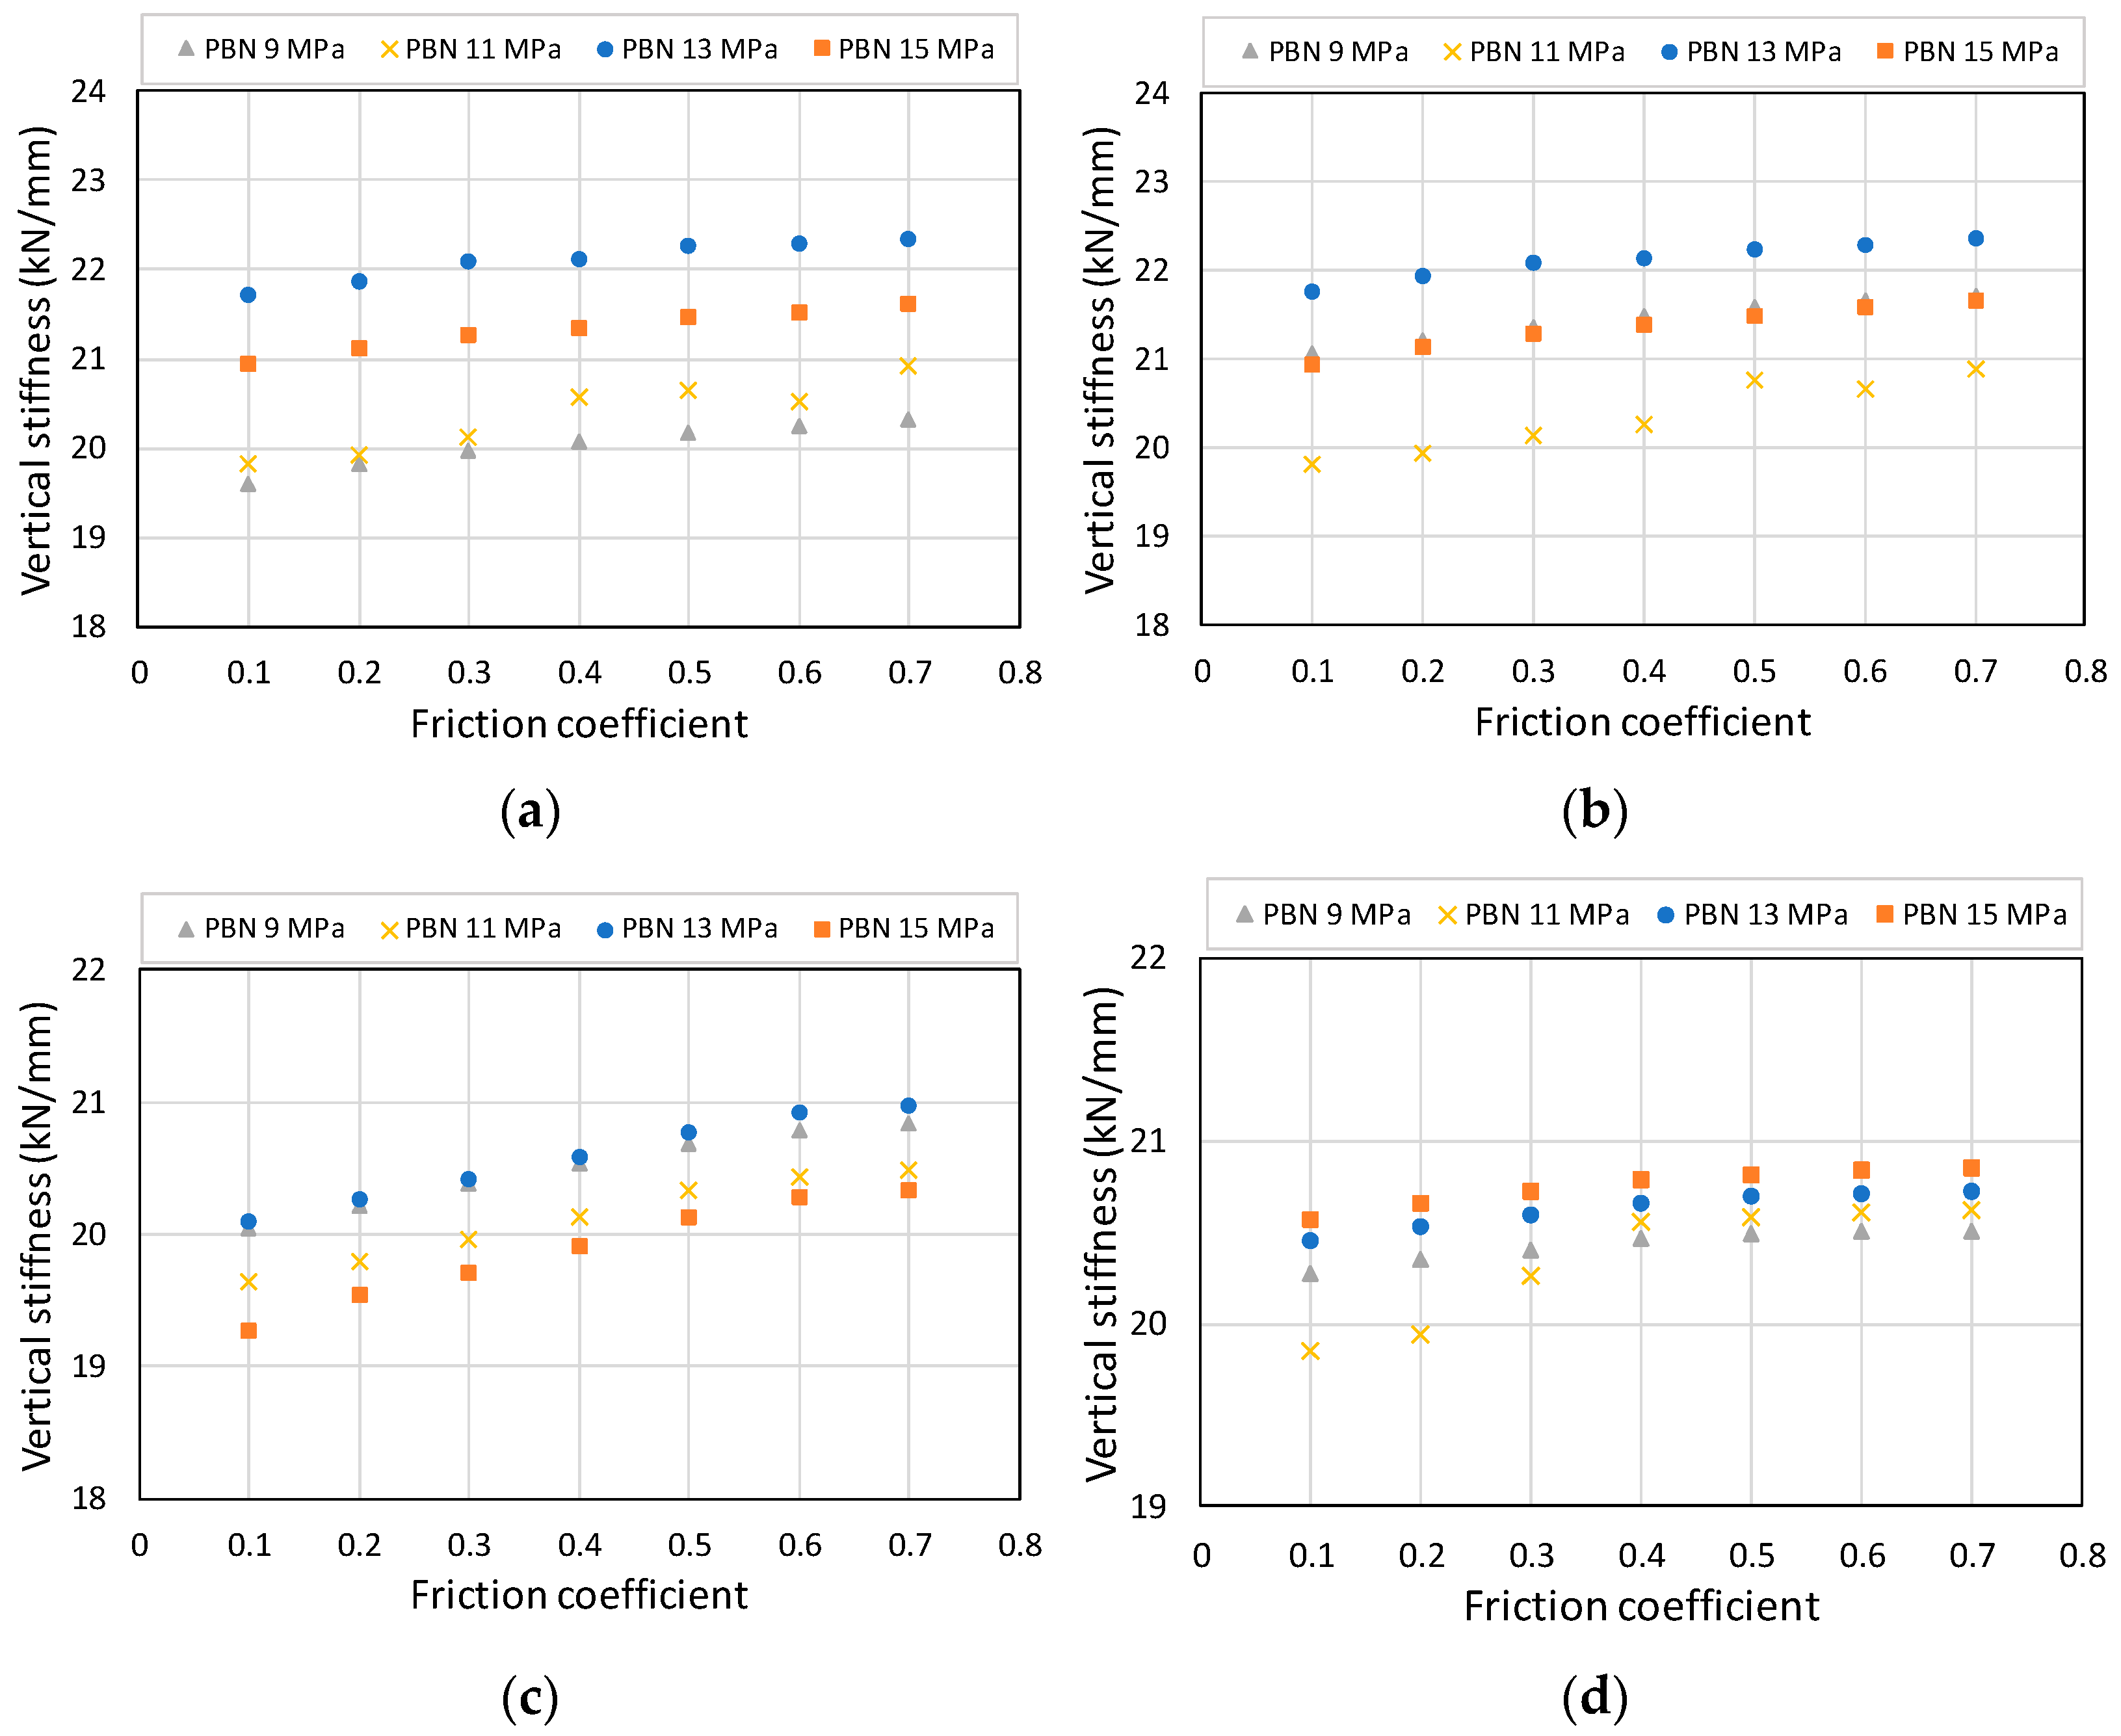
Finally, the effect of the friction coefficient between particles on the stiffness of the ballast was examined.
Figure 14 shows the results of the friction coefficient between the particles as a variable in the analysis model, in which
and
of Case 1 were 11 MPa and 0.4, respectively, and the bond strength was 50 Pa. The sleeper vertical displacement of each analysis model according to the friction coefficient is shown in
Figure 13, which shows the same behavior. The calculated vertical stiffness of the ballast for each case is shown in
Figure 15. In the parallel bond model, the friction coefficient has a minimal effect on the behavior of the ballast because the bonded particles are not separated, and the relative displacement between particles does not occur because of bond stiffness. The lower limits of the friction coefficients are listed in
Table 7.
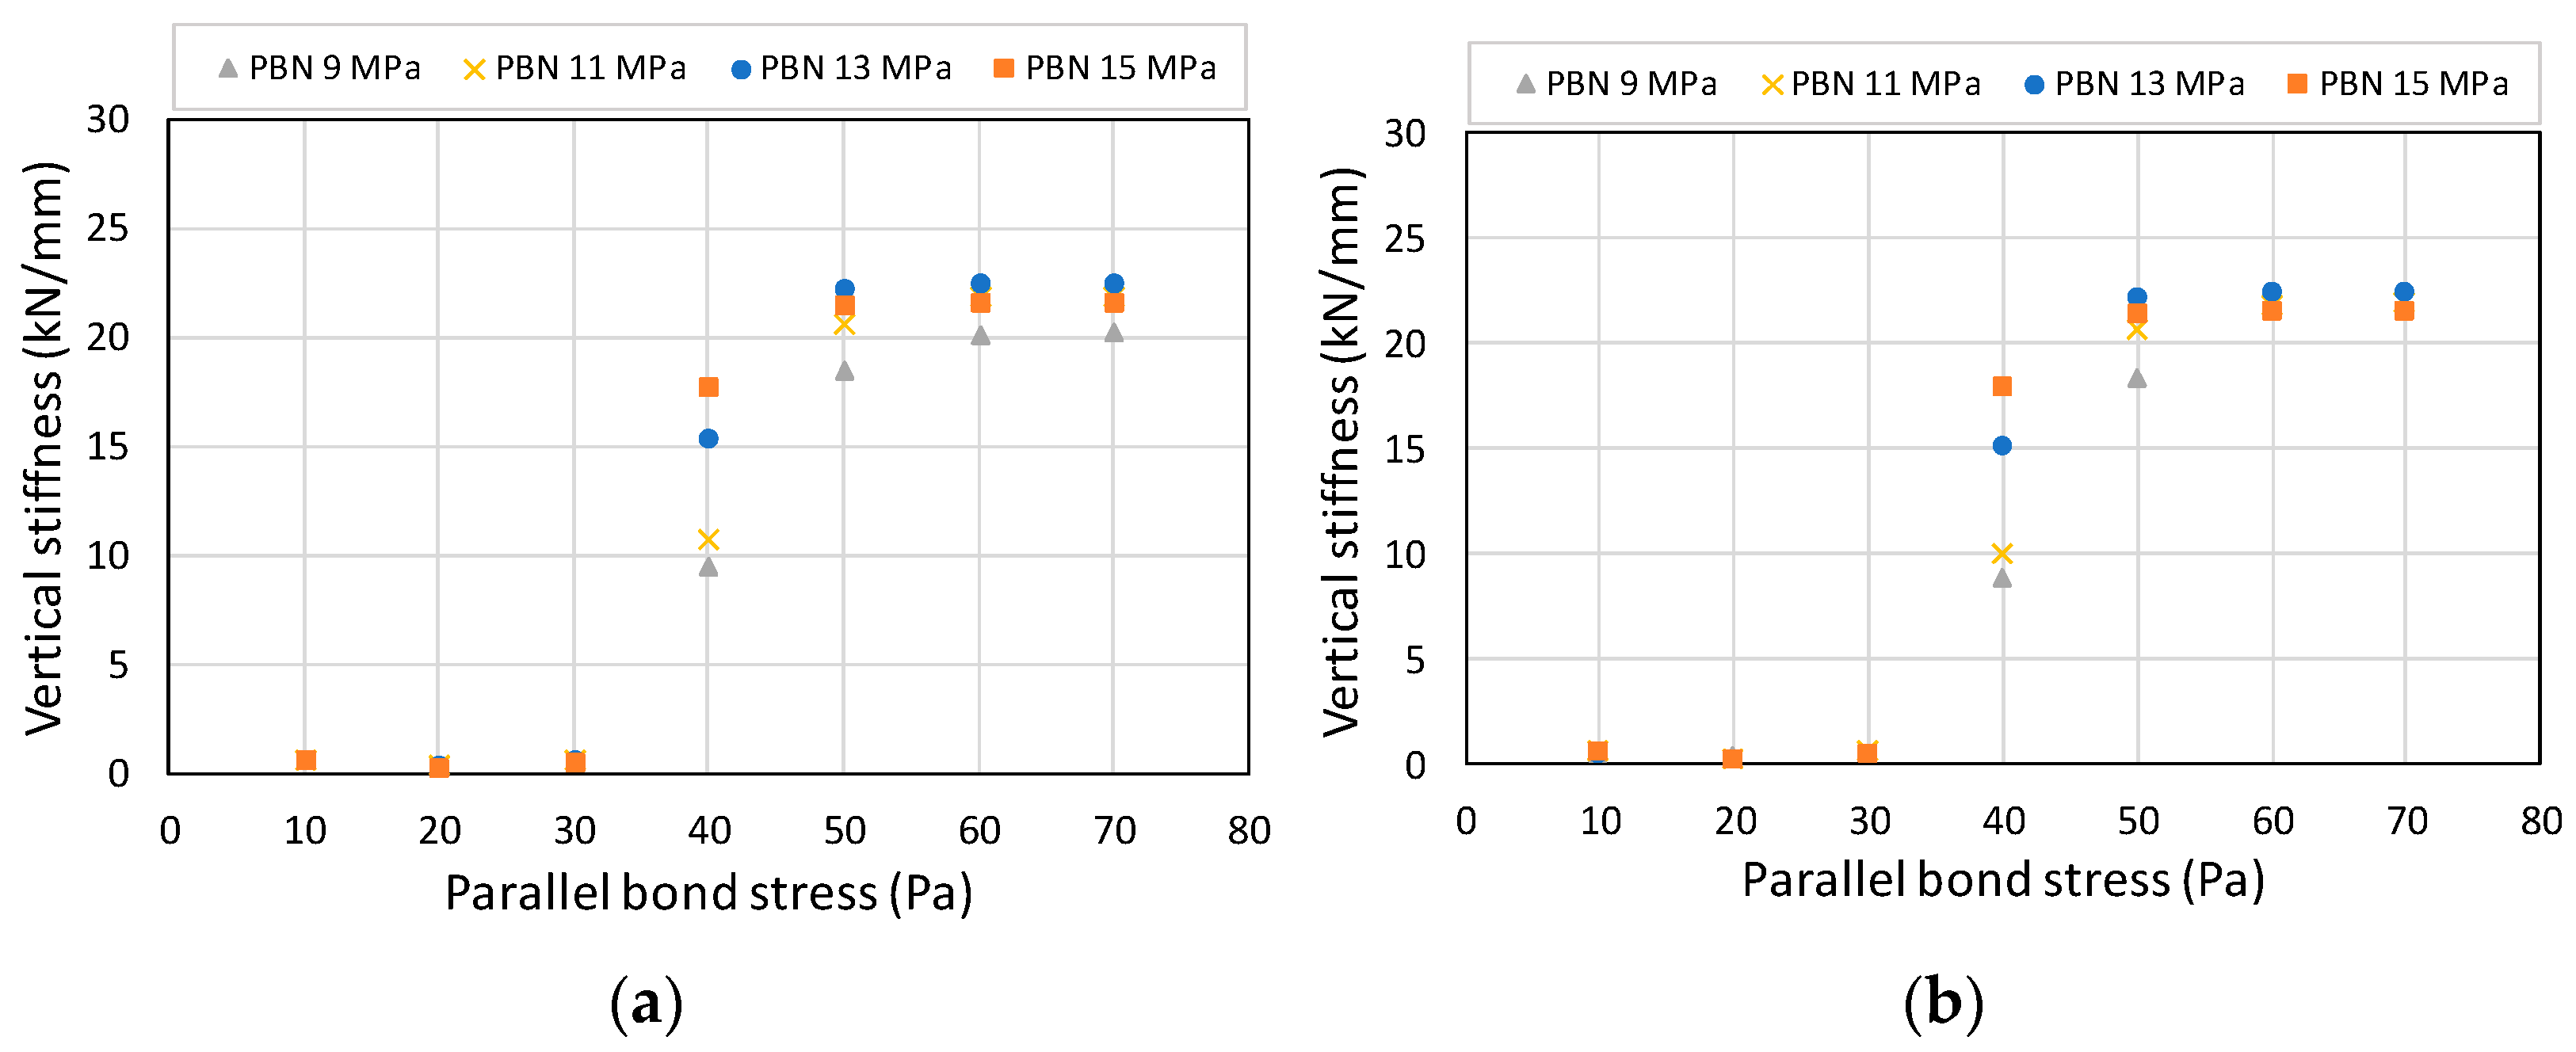
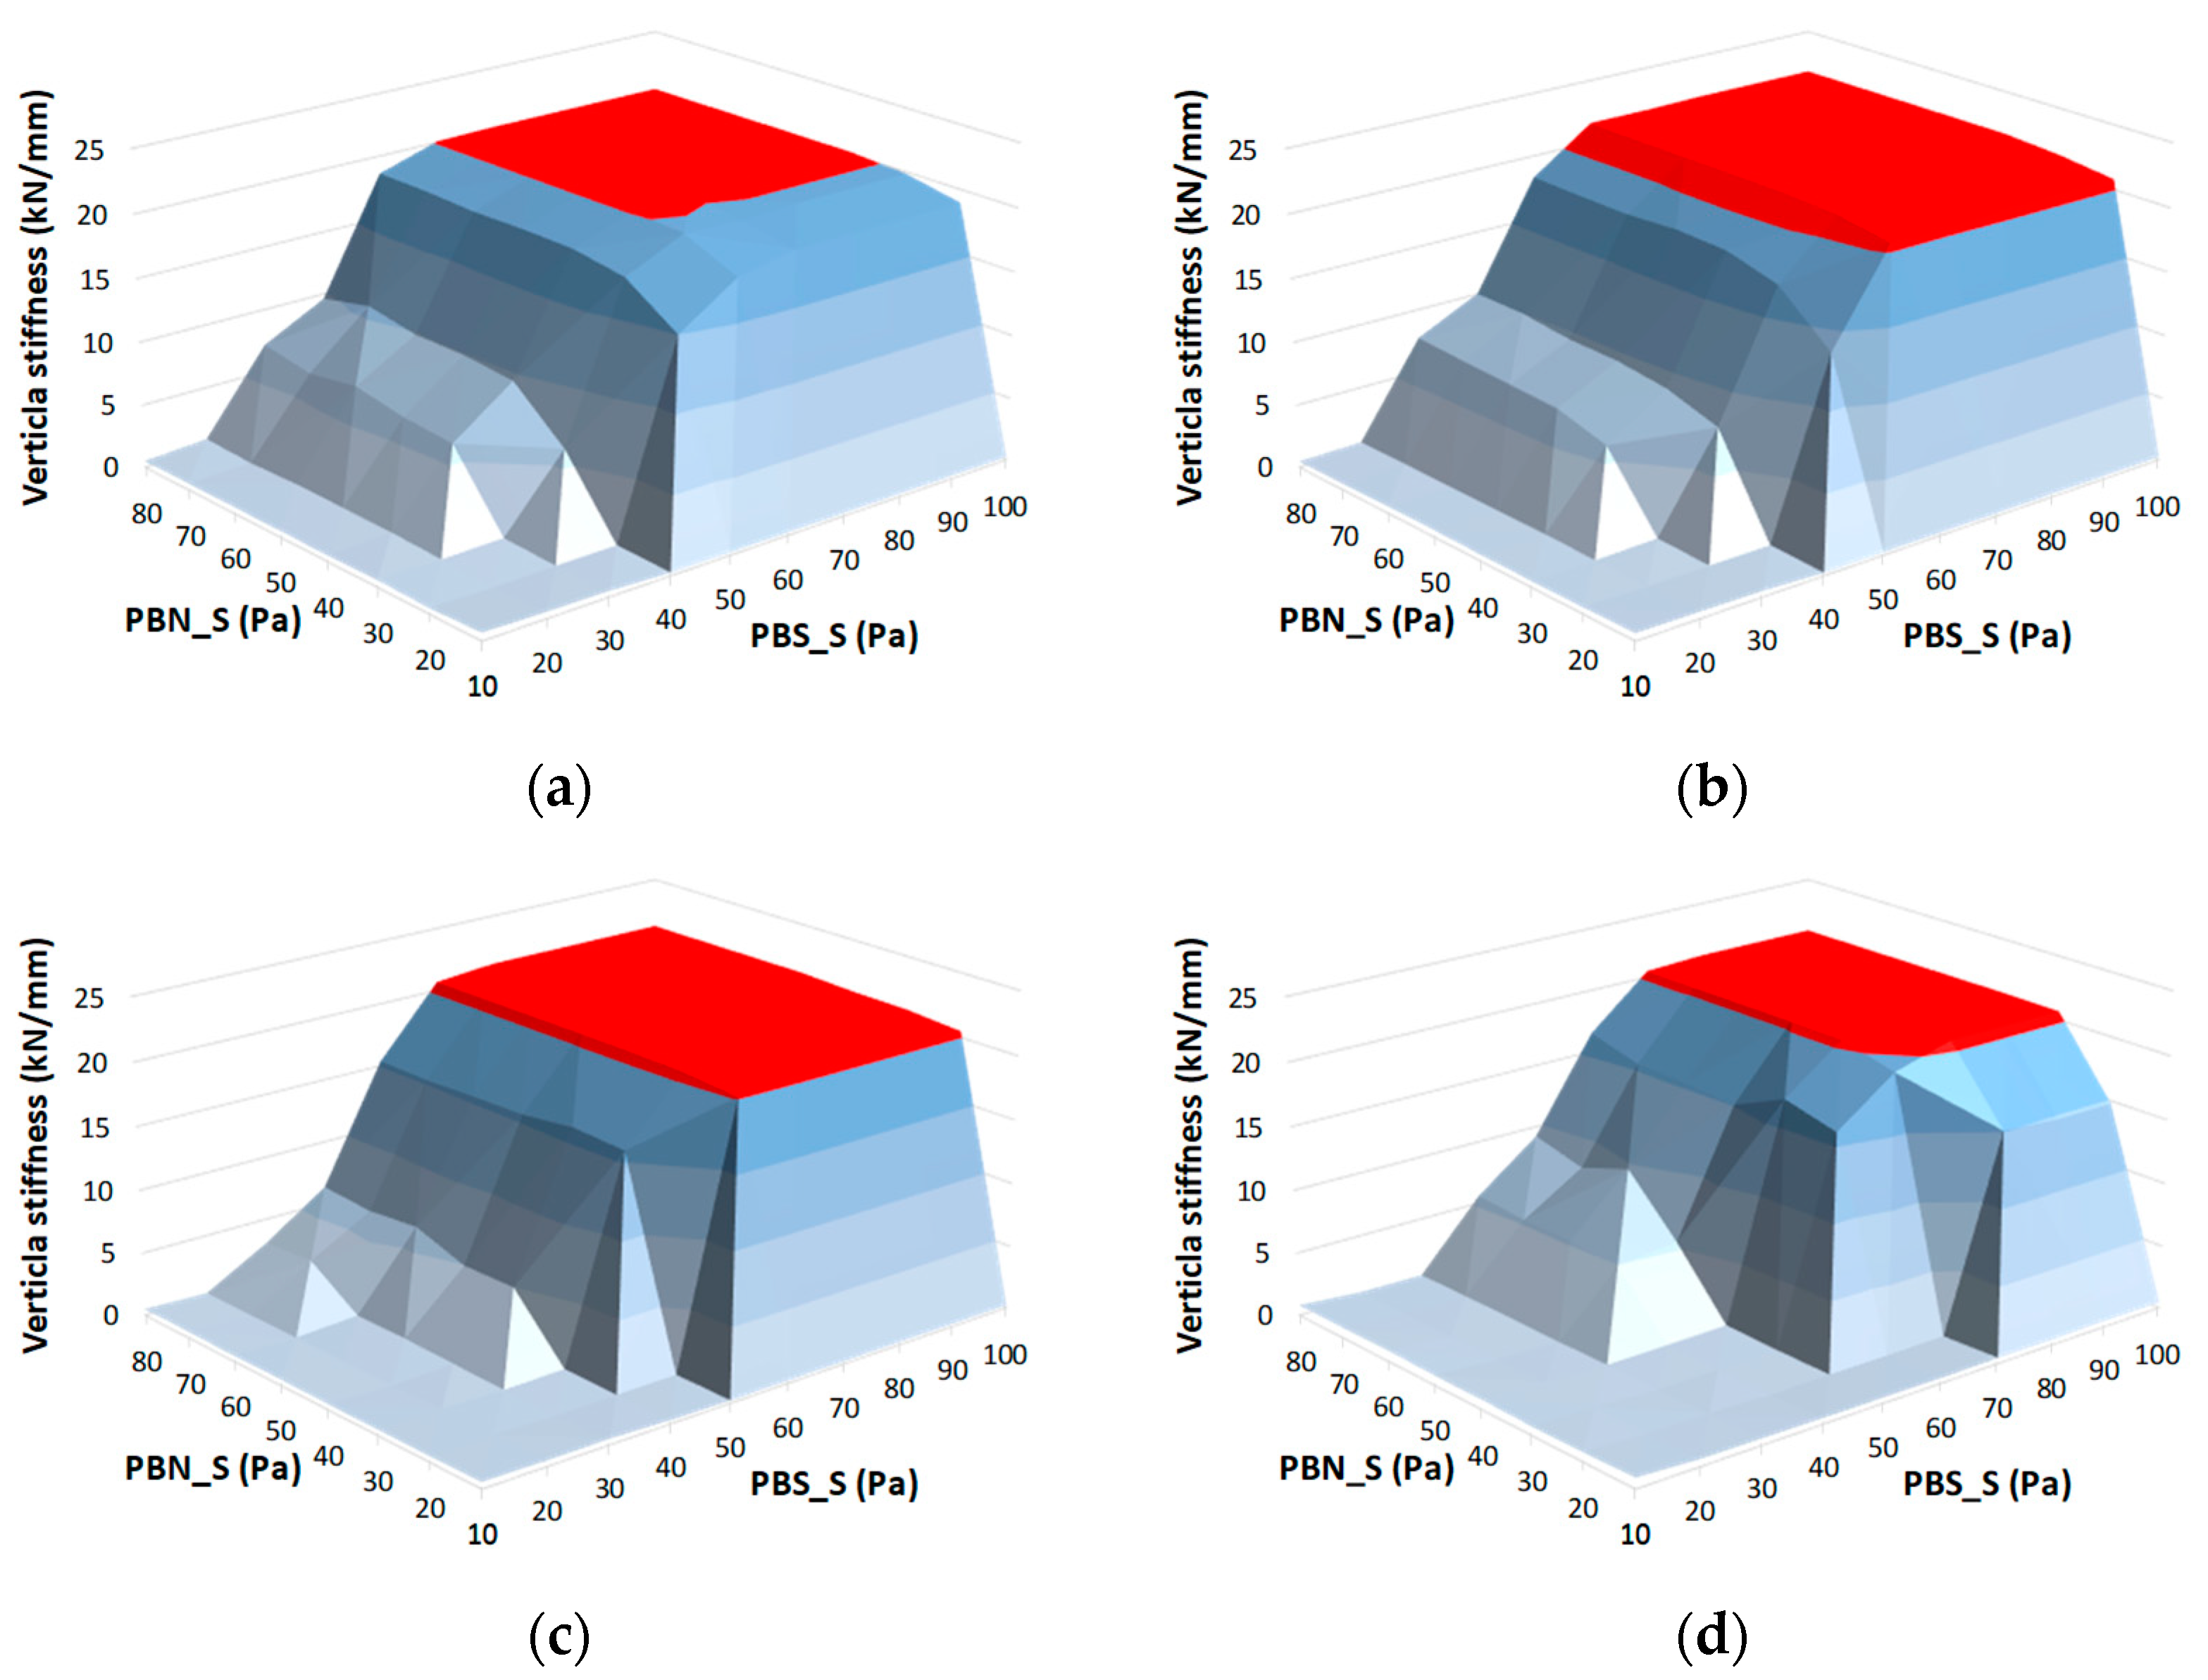
In this study, it was simply assumed that bond strengths in normal and tangential directions are the same for simplicity. The detailed parametric study supports this assumption.
Figure 16 shows the effects of the bond strengths on the ballast stiffness for each case with 9 MPa of parallel bond normal stiffness. Red area indicates that the required stiffness is satisfied by the combination of
and
. As shown in the figure, the target stiffness can be obtained by applying sufficient tangential strength. In other words, the tangential strength is more important than the normal strength when the ballast model is prepared to secure the required stiffness. That is also proven in
Table 8. The required tangential strengths in
Table 8 are the same as the parallel bond strengths in
Table 7. Therefore, the assumption could be adopted practically.


