Abstract
In the Middle East, wall-like reinforced concrete (RC) columns are a common choice in multistory buildings. Sometimes, these columns need axial retrofitting for increased load capacity. In practice, unstrengthened columns bear their load, and if retrofitting is necessary, the load is released before the upgrade—unlike in past research studies that overlooked this real-world scenario. This study aimed to investigate the response of preloaded wall-like RC columns after being retrofitted using different configurations. In the experimental campaign, two half-scale columns were cast and axially loaded to 80% of their capacity, and the load was then totally released. After that, these specimens were strengthened with two different schemes, and hence, they were concentrically loaded until failure. In both schemes, the section shape was not modified. The first scheme comprised wrapping carbon FRP (fiber-reinforced polymer) sheets together with near-surface mounted (NSM) steel rebars. However, the second technique was composed of wrapping glass FRP (GFRP) sheets together with NSM steel rebars and bolted steel plates. The second scheme was found to be superior to the first one due to the extra confinement provided by the bolted steel plates. This scheme improved the peak load, stiffness, and dissipated energy by 115%, 75%, and 524%, respectively. Other than the testing campaign, nonlinear numerical modeling was undertaken to examine the behavior of tested specimens. The models were utilized to conduct a parametric study, exploring the influence of the percentage of preloading and the amount of load release on the response of columns strengthened with the second scheme.
Keywords:
wall-like RC columns; strengthening; FRP; NSM rebars; steel plates; testing; FE modeling; preloading 1. Introduction
In multistory RC buildings in Saudi Arabia, RC wall-like columns are primarily used to maximize space efficiency. These columns are frequently in need of retrofitting for several reasons, such as the addition of more stories or an increase in live load due to changes in building use. Traditional methods for upgrading RC members/columns involved wrapping them with RC jackets [1,2] or steel jackets [3,4,5,6,7,8], but these approaches are labor-intensive and complex to execute. Consequently, due to its favorable properties [9,10,11,12,13], there has been a recent shift towards using FRP composites for upgrading RC wall-like columns, as they offer benefits such as rapid and straightforward installation with minimal alteration to the column’s dimensions.
The majority of research in the field of FRP-strengthened RC rectangular columns subjected to concentric loading has focused on sections with depth-to-width ratios of up to 2. There have been only a limited number of studies [14,15,16,17,18,19,20,21,22,23,24,25] that specifically addressed the retrofitting of wall-like columns with the help of FRP composites. Tan [14] conducted experiments to investigate FRP-enhanced columns with an aspect ratio of 3.65. The study compared the peak axial load of the columns with previously proposed prediction models [26,27]. In another study by Hosny et al. [15], the behavior of FRP-enhanced columns with sections with an aspect ratio of 3 was examined. The experimental FRP strains at peak load were significantly less than the failure strains. Tanwongsval et al. [16] conducted experimental research on wall-like columns subjected to concentric loading, both without strengthening and with strengthening, with sections of the same aspect ratio as mentioned in Ref. [14]. Two methods were employed for column strengthening, one using conventional externally bonded GFRP sheets, and the other using GFRP wrapping after modifying the section. Columns upgraded with the second technique exhibited superior performance due to enhanced confinement of concrete. Maalej et al. [17] conducted experiments to investigate the influence of FRP schemes on enhancing the peak load of wall-like columns with sections featuring an aspect ratio of 3.65. In addition to the laboratory tests, they utilized an analytical model previously proposed in Refs. [28,29] to calculate the columns’ peak load.
Prota et al. [18] undertook an experimental campaign to study the effects of applying GFRP sheets for enhancing the axial resistance of wall-like columns characterized by substantial depth-to-width ratios. Their research findings indicated that the GFRP wrapping resulted in enhancements in both the ductility and strength of these columns. Notably, the failure of GFRP-retrofitted specimens was found to be contingent on the shape of the column section, occurring at considerably lower horizontal GFRP strains. De Luca et al. [19] examined wall-like columns strengthened with GFRP sheets by testing three specimens, including one control and two that were retrofitted. These upgraded specimens utilized two different GFRP confinement ratios. The study’s results demonstrated that, although GFRP confinement did not necessarily enhance the maximum load, it significantly improved the concrete crushing strain.
In their research, Alsayed et al. [20] investigated the retrofitting of RC wall-like columns with FRP composites under concentric compression. The original rectangular section underwent a transformation into an elliptical shape using cementitious mortar, which was subsequently retrofitted with CFRP sheets. Nonlinear finite element analysis was employed to evaluate the load-displacement characteristics of these columns. The use of CFRP wrapping resulted in an enhancement of both the ductility and strength of the columns.
Triantafillou et al. [21] experimentally examined the behavior of FRP-strengthened wall-like columns. They conducted tests on a total of forty-five columns, having section aspect ratios of either 3 or 4, subjecting them to axial compression. The study explored different strengthening methods, encompassing anchored and unanchored CFRP wrapping, both without and with the modification of sections. Their findings led to the conclusion that the efficiency of CFRP confinement was nearly doubled when anchors were appropriately distributed
Elsanadedy et al. [24] conducted a study to come up with an efficient scheme, without section modification, for strengthening existing RC wall-like columns employing a hybrid of NSM and CFRP wrapping systems. Six half-scale specimens were subjected to concentric compression testing. Two of these columns remained unretrofitted, serving as reference, while the remaining four were upgraded using different schemes. Among the four schemes explored, the most efficient approach involved the use of continuous NSM rebars in combination with CFRP wrapping, resulting in an impressive 80% increase in the ultimate load. Additionally, nonlinear FE analysis was employed to assess the response of the tested columns. The test results closely aligned with the FE analysis, confirming the accuracy of the constitutive models employed for different materials. In another companion study, Elsanadedy et al. [25] studied the axial strengthening of wall-like RC columns using another four different configurations. These schemes were also without shape modification, and they incorporated the use of GFRP wrapping alone, GFRP wrapping combined with bolted steel plates, or GFRP wrapping combined with connected (or disconnected) NSM bars. Nonlinear FEA was also performed to predict the response of columns.
Even though past research was conducted concerning the behavior of control and retrofitted RC wall-like columns, the specimens in these studies were not preloaded prior to their strengthening. This did not reflect the real practice in which unstrengthened columns carry their service load and if strengthening is required when the load is partially or totally released. The objective of this investigation was to explore the response of concentrically preloaded wall-like RC columns after being strengthened using different configurations. In the experimental campaign, four half-scale specimens were tested in the event of concentric compressive load. The first two columns were unstrengthened, loaded to 80% of their axial capacity, and the load was then totally released. After that, these specimens were retrofitted using two different schemes, and hence, they were concentrically loaded until failure. Other than the testing campaign, nonlinear FE analysis was performed to examine the response of tested specimens. The validated models were then employed for conducting parametric studies of practical interest.
2. Experimental Campaign
This study comprised a testing campaign carried out on half-scale RC wall-like columns tested concentrically until failure. The studied parameter in the testing campaign was the strengthening configuration. Two strengthening techniques were applied to preloaded RC specimens.
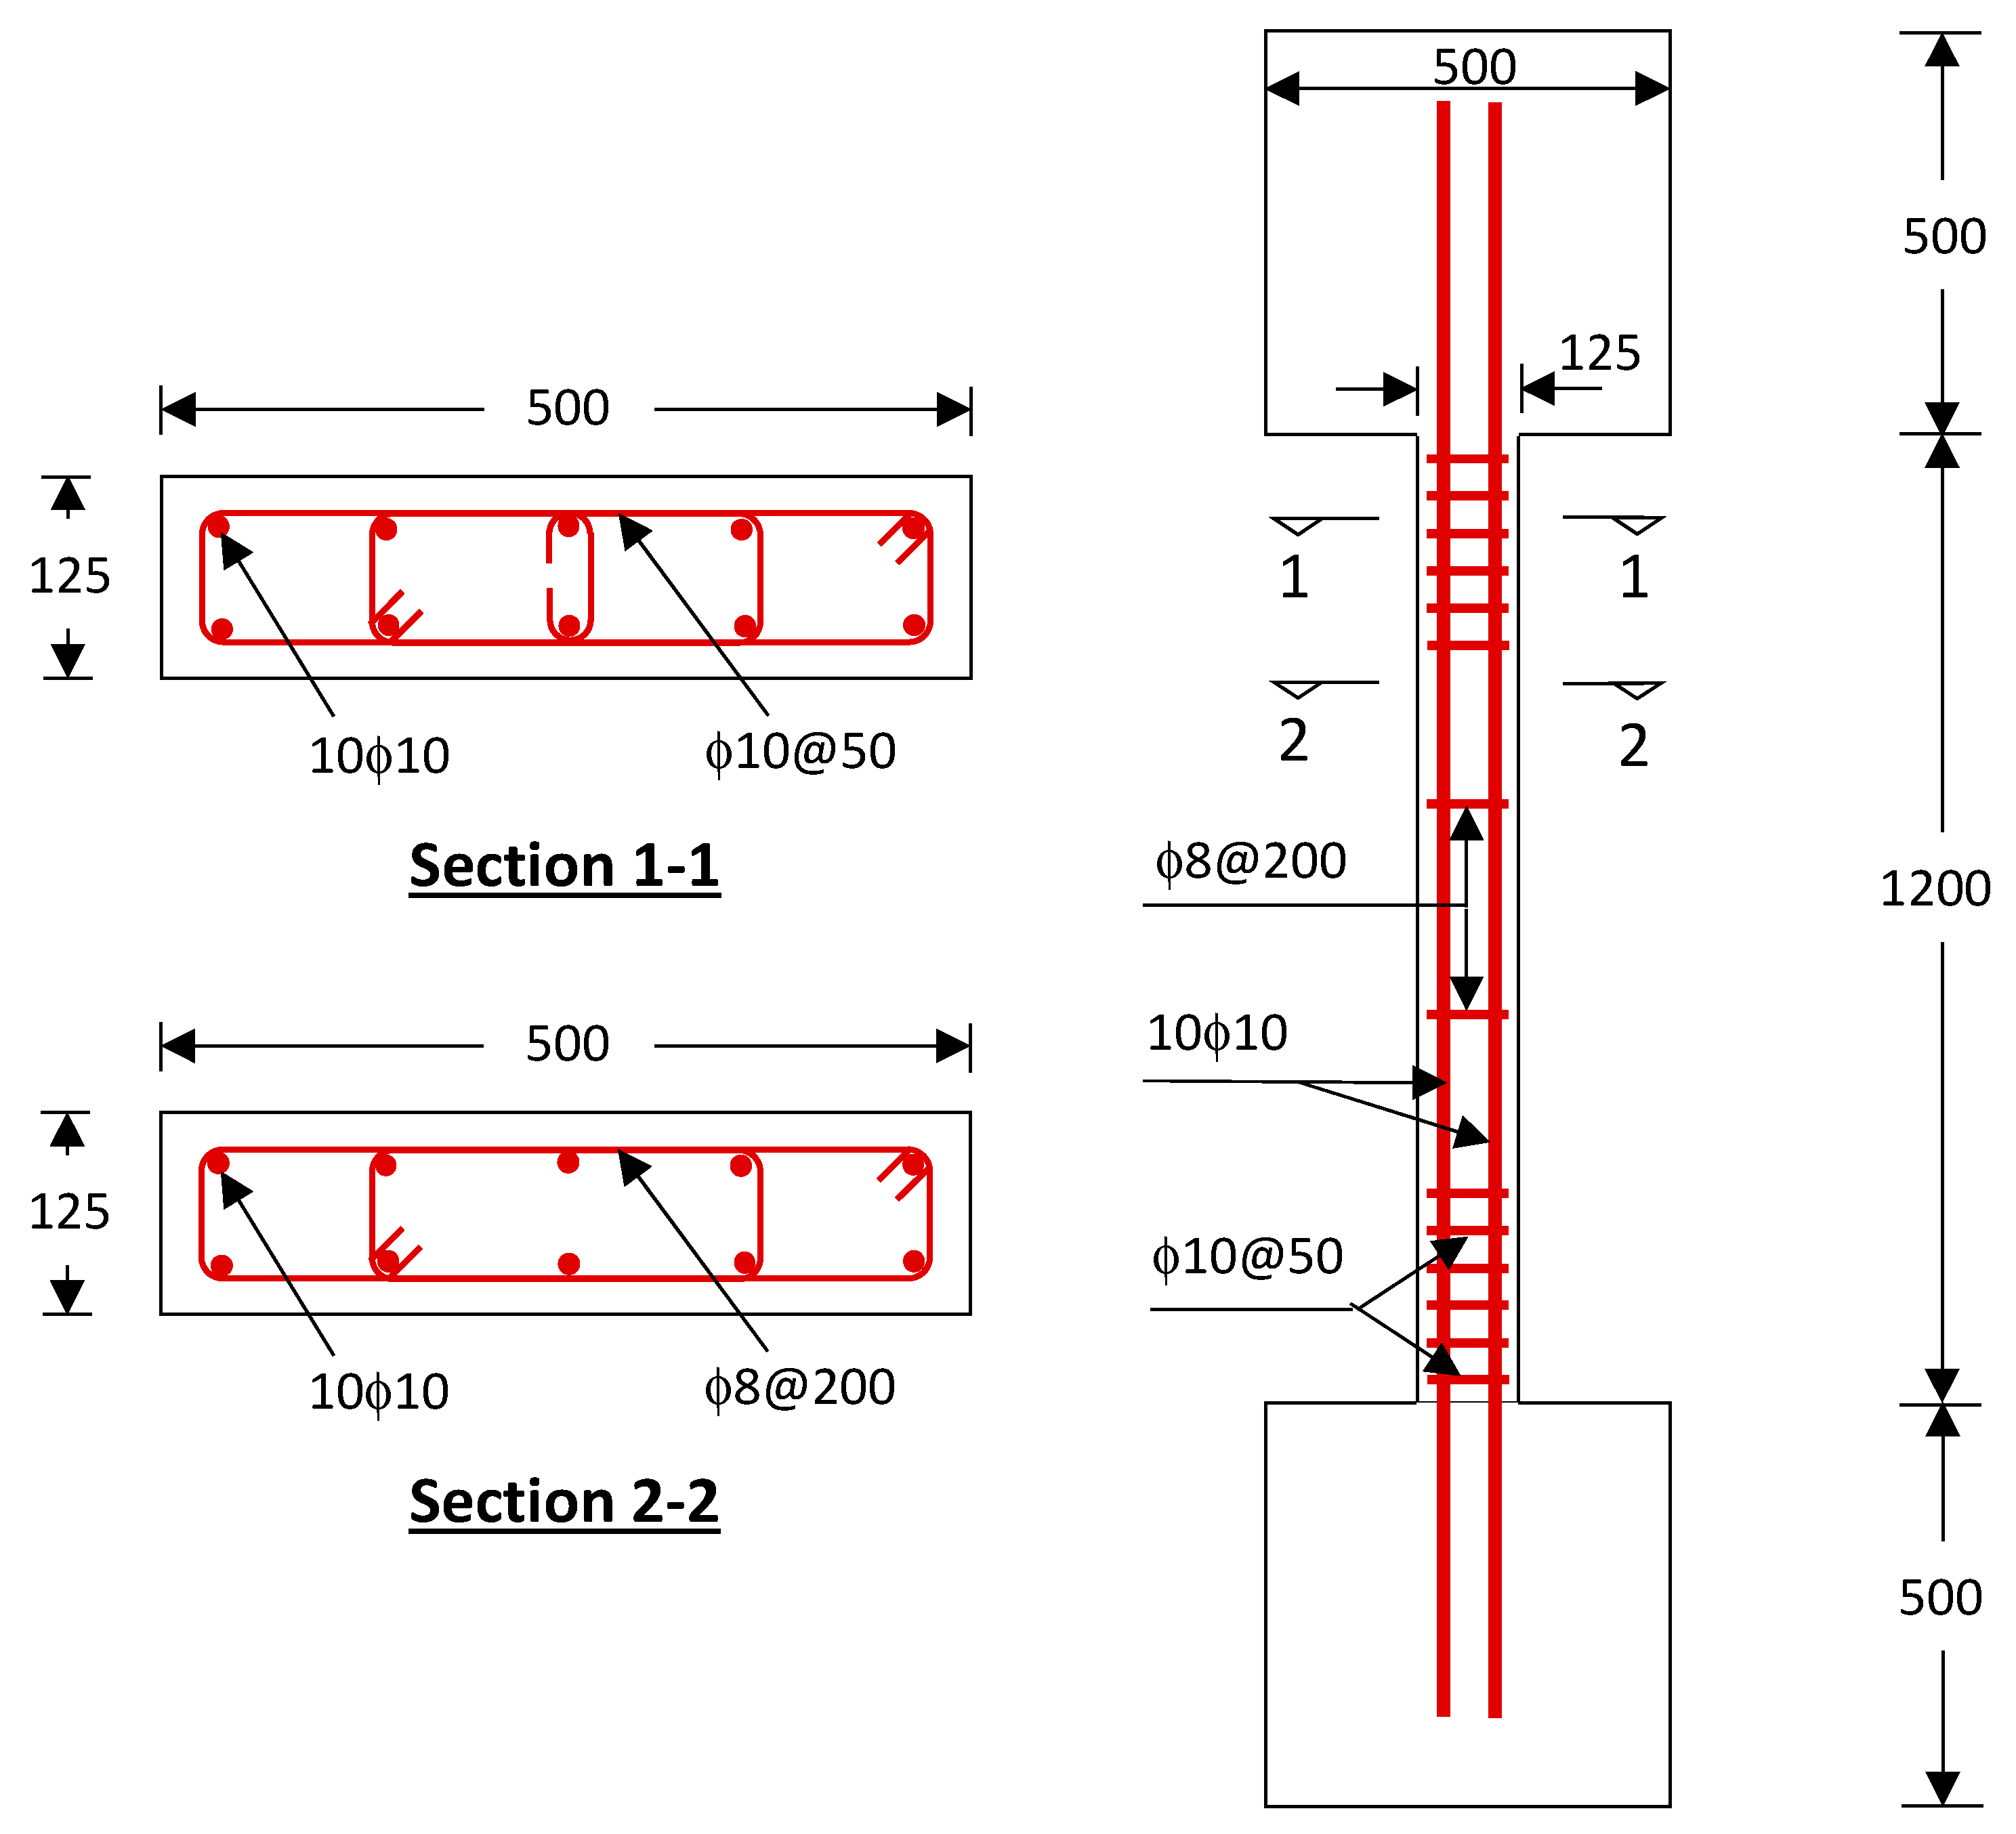
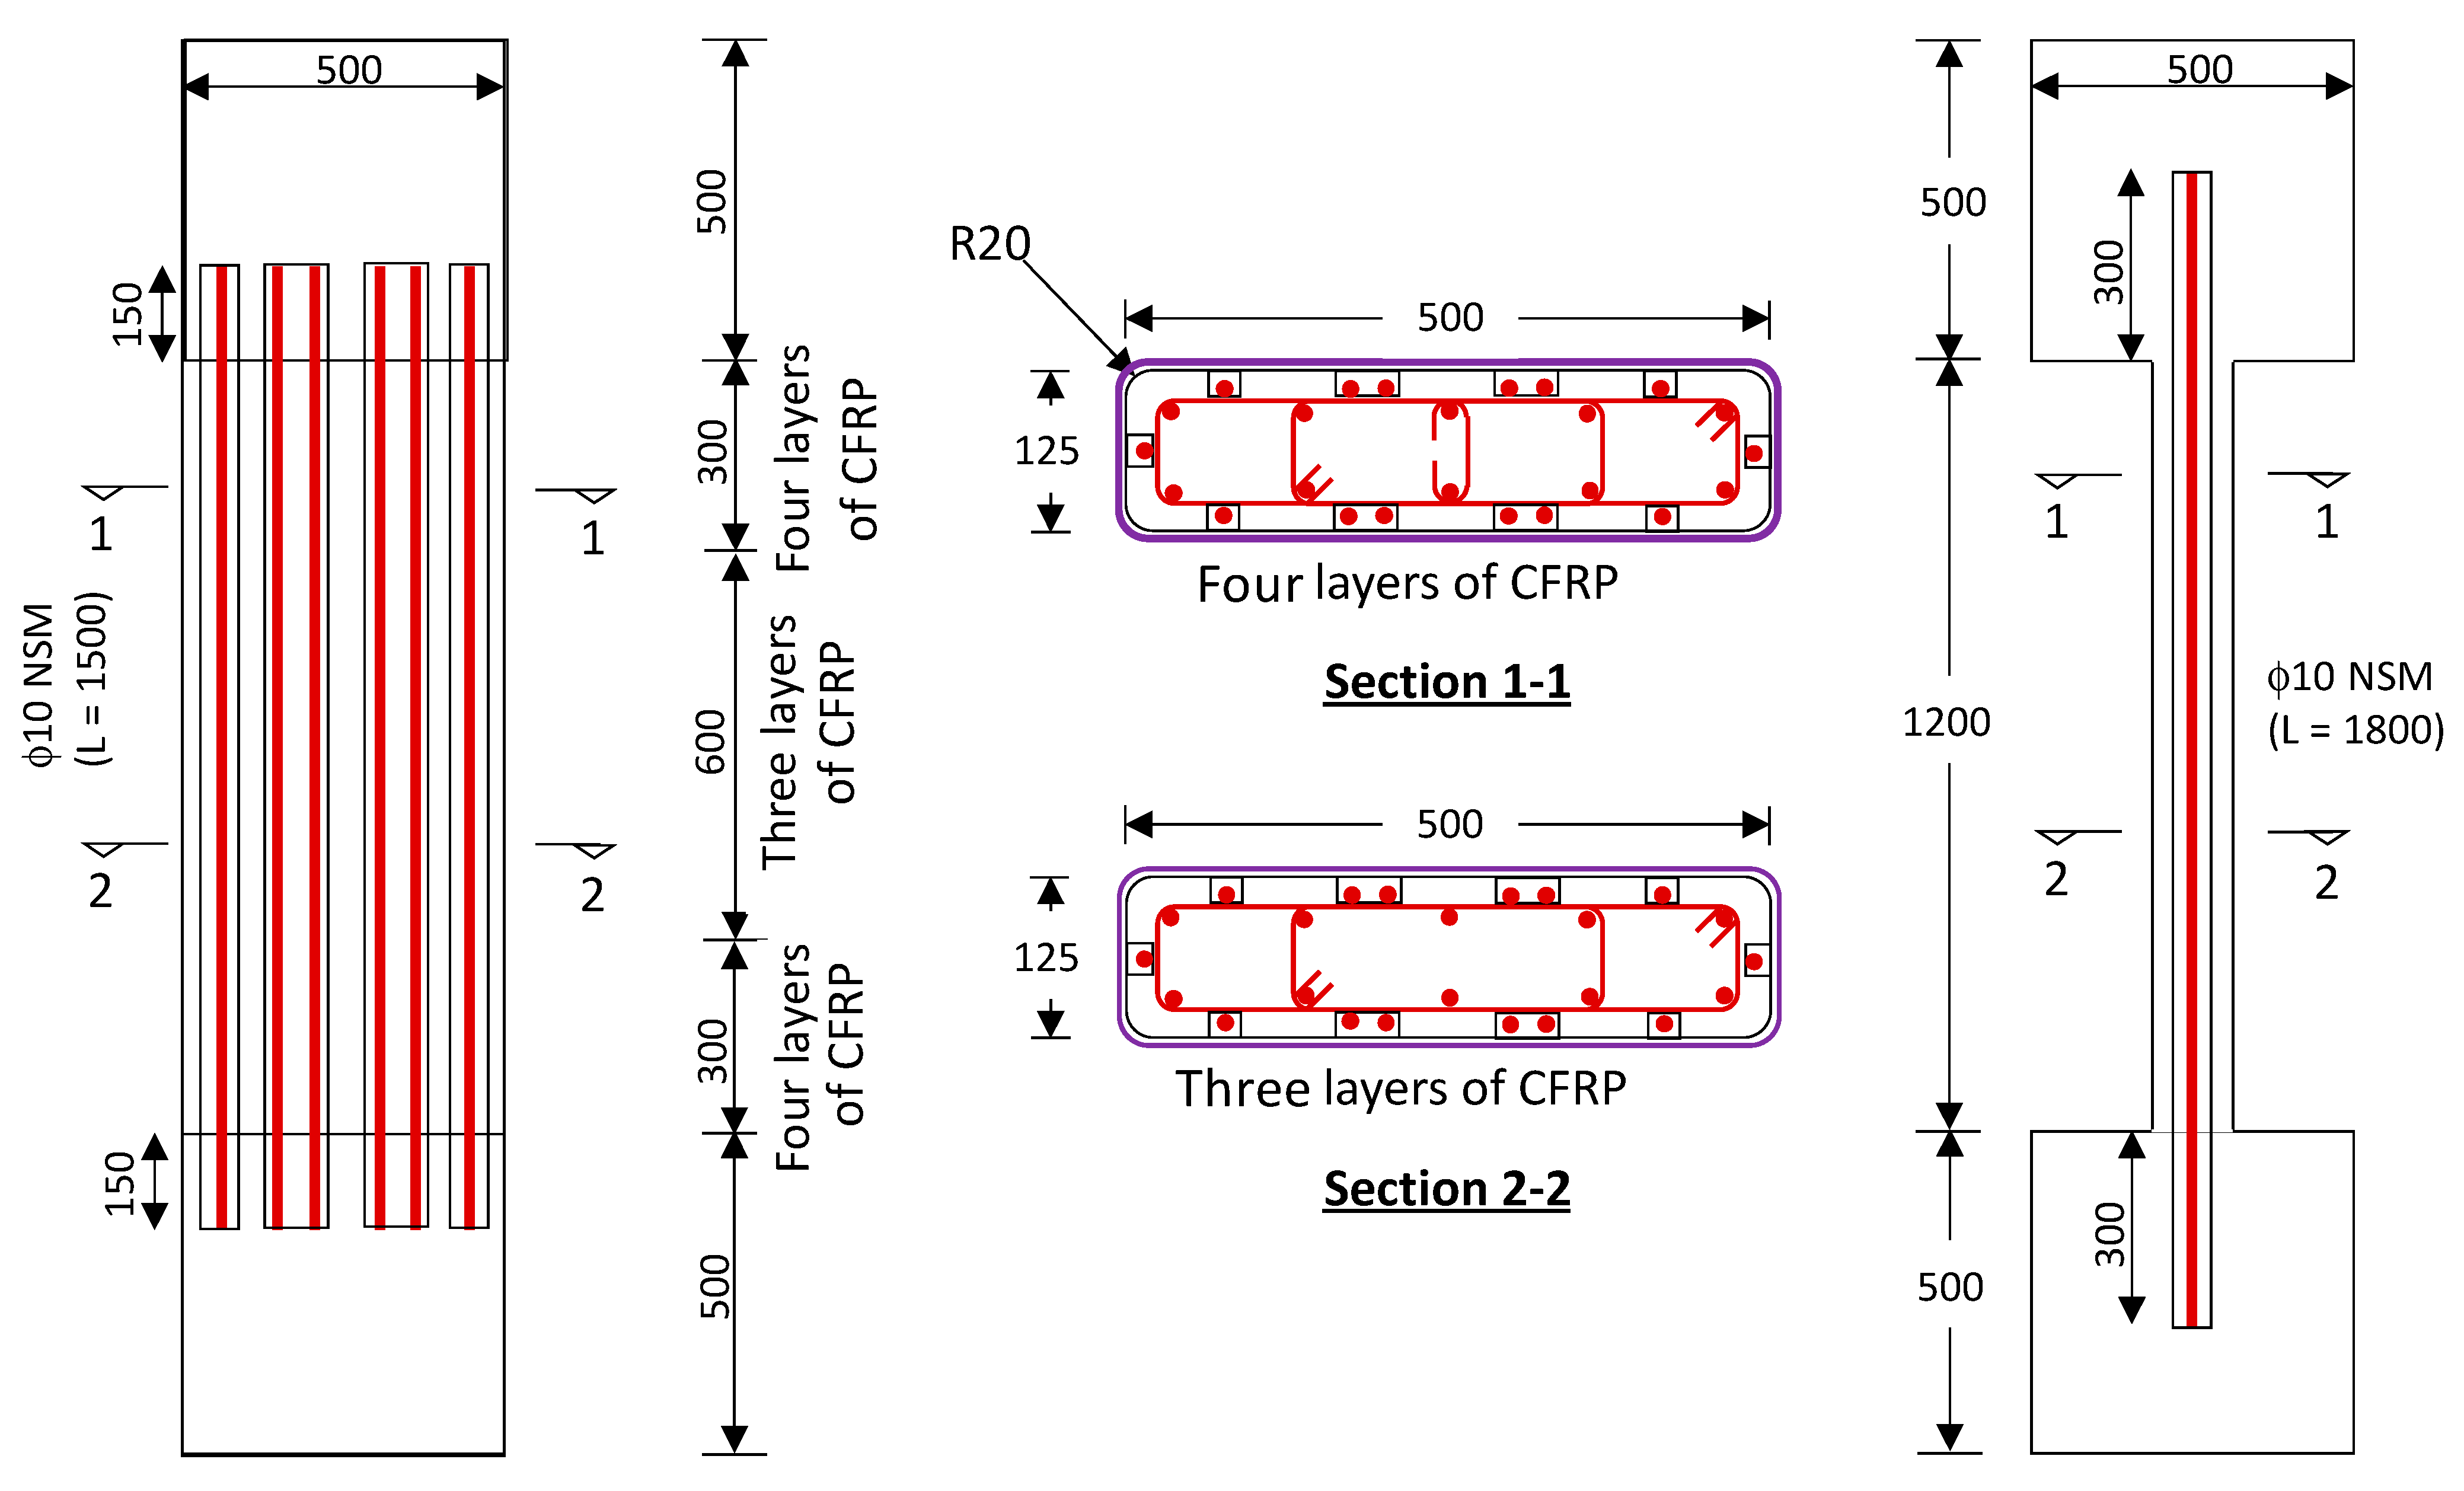
2.1. Experimental Matrix
It should be noted that the experimental campaign in this study is an extension of the previous authors’ research covered in Refs. [24,25]. The test matrix used in this study is shown in Table 1. Figure 1, Figure 2 and Figure 3 show details of the test specimens. The design of the control and strengthened specimens are detailed in Refs. [24,25]. As clarified in Table 1, the test matrix included six casted columns having eight concentric compression tests. Out of the six casted columns, two specimens (having four tests) were cast in this study, whereas the other four specimens were cast and tested by the authors in previous studies [24,25]. In the designation of columns, the symbols “CON” and “ST” refer to control and strengthened specimens, respectively. For the two control specimens “CON1-0.8P-TLR” and “CON2-0.8P-TLR”, the columns were loaded axially to 80% of their ultimate failure load, and the load was then totally released. However, for strengthened specimens, “ST1-0.8P-TLR” and “ST2-0.8P-TLR”, the columns were subjected to the following scenario: (1) the unstrengthened specimen was preloaded to a maximum of 80% of its failure load, (2) the load was totally released, (3) the column was strengthened, and finally, (4) the column was loaded until failure. In this current study, two control specimens CON1-0.8P-TLR and CON2-0.8P-TLR were loaded to 80% of their failure load, and then the load was totally released. Thereafter, the first control specimen CON1-0.8P-TLR was upgraded using the first scheme, which is composed of three layers of CFRP together with continuous NSM steel bars (see Figure 2). This upgraded specimen was then denoted as ST1-0.8P-TLR. However, the second control specimen CON2-0.8P-TLR was strengthened using the second scheme, which consists of five GFRP layers combined with bolted steel plates and continuous NSM steel rebars (see Figure 3). This strengthened column was designated as ST2-0.8P-TLR. The other previously tested four specimens in the test matrix (CON1, CON2, ST1, and ST2) were used as a baseline to compare against the test specimens of this study.
Table 1.
Matrix of testing campaign.
Figure 1.
Details of unstrengthened specimens (measurements are in mm).
Figure 2.
Details of specimen ST1-0.8P-TLR (measurements are in mm).
Figure 3.
Details of specimen ST2-0.8P-TLR (measurements are in mm).
2.2. Material Properties
Listed in Table 2 are the properties of different materials used in the casting of columns. Ready-mix concrete was utilized in the fabrication of specimens, and the concrete strength at different dates was assessed via testing standard cylinders (150 mm × 300 mm) in accordance with Ref. [30]. For steel rebars and rods, standard tension coupons were tested in accordance with Ref. [31], and the average properties are listed in Table 2. Standard test coupons of FRP sheets were tested in tension in accordance with Ref. [32], and the average properties are also summarized in this table. The tensile strength in the fiber direction reported in Table 2 for FRP material was computed as 55% of the mean strength of test coupons in tension [33]. For plates of steel used in specimen ST2-0.8P-TLR, standard tension coupons were tested in accordance with Ref. [34], and the mean values of properties are displayed in the table. For the adhesive mortar used in the NSM grooves, the properties depicted in the table are given as per the datasheet supplied by the manufacturer.
Table 2.
Experimental values of material properties utilized in the FE analysis.
2.3. Preparation and Testing Setup of Columns
Figure 4 presents the preparation steps for the fabrication of columns. More details about the preparation steps can be found in Refs. [24,25]. Figure 4a,b presents the pictures of formwork having reinforcement cages before casting of the concrete and columns after concreting. As identified in Figure 2 and Figure 3, for the upgraded columns, the corners were filleted for a 20 mm radius to minimize the rupture of the FRP sheets at corners.
Figure 4.
Preparation and testing of column specimens: (a) reinforcement cages; (b) columns after casting of concrete; (c) installation of NSM rebars for specimens ST1 and ST1-0.8P-TLR; (d) CFRP wrapping for specimens ST1 and ST1-0.8P-TLR; (e) installation of NSM rebars for specimens ST2 and ST2-0.8P-TLR; (f) specimens ST2 and ST2-0.8P-TLR after strengthening; (g) test setup for control specimens; (h) test setup for strengthened specimens ST1 and ST1-0.8P-TLR.
In the preparation of strengthened column ST1-0.8P-TLR, the surface of the control specimen CON1-0.8P-TLR was prepared after testing via grinding, sandblasting, and cleaning. Then, grooves were cut in the concrete cover at the location of NSM bars, which were fixed in place by bonding into the top and bottom bulbs, as seen in Figure 4c. Epoxy adhesive mortar was then applied to the NSM grooves. After mortar curing, its surface was sandblasted and cleaned. Subsequently, CFRP laminates were wrapped around the column section employing the standard wet layup process (see Figure 4d).
Similarly, in the preparation of upgraded specimen ST2-0.8P-TLR, the surface of the control column CON2-0.8P-TLR was ground, sandblasted, and cleaned after testing. Then, grooves were cut in the cover concrete at the location of NSM bars. Also, holes were drilled in the longer column side at the position of threaded rods, as seen in Figure 4e. Thereafter, the NSM bars were fixed in the grooves by bonding into the top and bottom bulbs, and an epoxy adhesive mortar was added to the grooves for bonding the bars. Once the adhesive mortar became cured, its surface was sandblasted and cleaned. Then, the GFRP layers were wrapped around the column section following the wet layup process.
Following the curing of GFRP laminates, perforations were created in the sheets at corresponding locations of holes on the concrete surface. Subsequently, threaded rods were introduced into these holes and affixed to the concrete using an epoxy-based mortar. After the mortar had completed its curing process, steel plates were then attached to the lengthier side of the column with the help of epoxy-based mortar (see Figure 4f). Figure 4g,h shows the test setup and instrumentation details for the control and retrofitted columns. Concentric compression was applied on the columns via a 10 mega-newton test machine. For recording the axial displacement of columns, four LVDTs were fixed around the column section at a 400 mm gauge length. Also, strain gauges were fixed onto the concrete surface, steel plates, FRP sheets, and steel rebars to measure their strain. A data acquisition system was utilized for recording the test results. The control columns CON1-0.8P-TLR and CON2-0.8P-TLR were monotonically loaded to 80% of the average peak load of specimens CON1 and CON2 (tested previously in Refs. [24,25]), and the load was then totally released. However, the strengthened specimens ST1-0.8P-TLR and ST2-0.8P-TLR were monotonically loaded until failure via a displacement-controlled strategy.
3. Discussion of Experimental Findings
3.1. Key Experimental Parameters
Table 3 and Table 4 list, respectively, the key experimental findings of the eight specimens of the test matrix with regard to load displacement and stress-strain responses.
Table 3.
Experimental and FE outputs for load versus axial deformation behavior of tested specimens.
Table 4.
Experimental and FE outputs for stress versus strain behavior of tested specimens.
It is worth mentioning here that the finite element results are also included in these tables so as to avoid unnecessary repetition and increasing the number of tables.
It should be stated that even though specimens CON1, CON2, ST1, and ST2 were not tested in this study, their results are shown in Table 3 and Table 4 for the sake of comparison with specimens of this study. The test findings in Table 3 include service, yield, and peak loads along with their respective displacements, ultimate displacement, energy dissipated (computed at ultimate state), and stiffness at service load. As depicted in Figure 5a, the service load was assessed as 40% of the peak load [25,26]. The ultimate displacement (Δu) shown in Figure 5a is estimated at the ultimate state, which is defined in Figure 5b as that corresponding with concrete crushing as per the ACI 318-19 code [35]. As displayed in Figure 5c, the energy dissipated was computed as the work performed by the applied load (area under load-displacement plot until ultimate displacement). The parameter ϕ used in Figure 5b,c is the strength reduction factor (=0.65 as per the ACI 318-19 code [35]).
Figure 5.
Characterization of response parameters for column specimens: (a) secant stiffness; (b) ultimate axial concrete strain; (c) energy dissipated at ultimate state.
The stress-strain data provided in Table 4 encompasses several parameters, including actual and maximum average concrete strengths, concrete axial strain at the point of maximum stress, ultimate concrete axial strain, axial strain in both original and NSM bars at peak load, maximum horizontal strain in FRP layers, and maximum horizontal strain in steel plates (for specimens ST2 and ST2-0.8P-TLR). To determine the maximum load, the following equations were employed:
where Pu is the ultimate load; Ag, Ast, and ANSM are, in turn, the areas of column cross-section, main rebars, and NSM rebars. Also, the notations fy-st and fy-NSM stand for the yield strengths of main and NSM rebars, in turn.
3.2. Load-Displacement Plots
Figure 6 depicts the load versus axial compression plots of eight specimens of the test matrix. The experimental failure patterns of tested columns are depicted in Figure 7. Discussed below are the experimental findings of the four specimens of this study. Discussions of test results of other specimens are given in Refs. [24,25].
Figure 6.
Experimental load versus axial displacement plots for columns of the test matrix.
Figure 7.
Failure pattern of columns tested in this study: (a) CON1-0.8P-TLR; (b) ST1-0.8P-TLR; (c) ST2-0.8P-TLR.
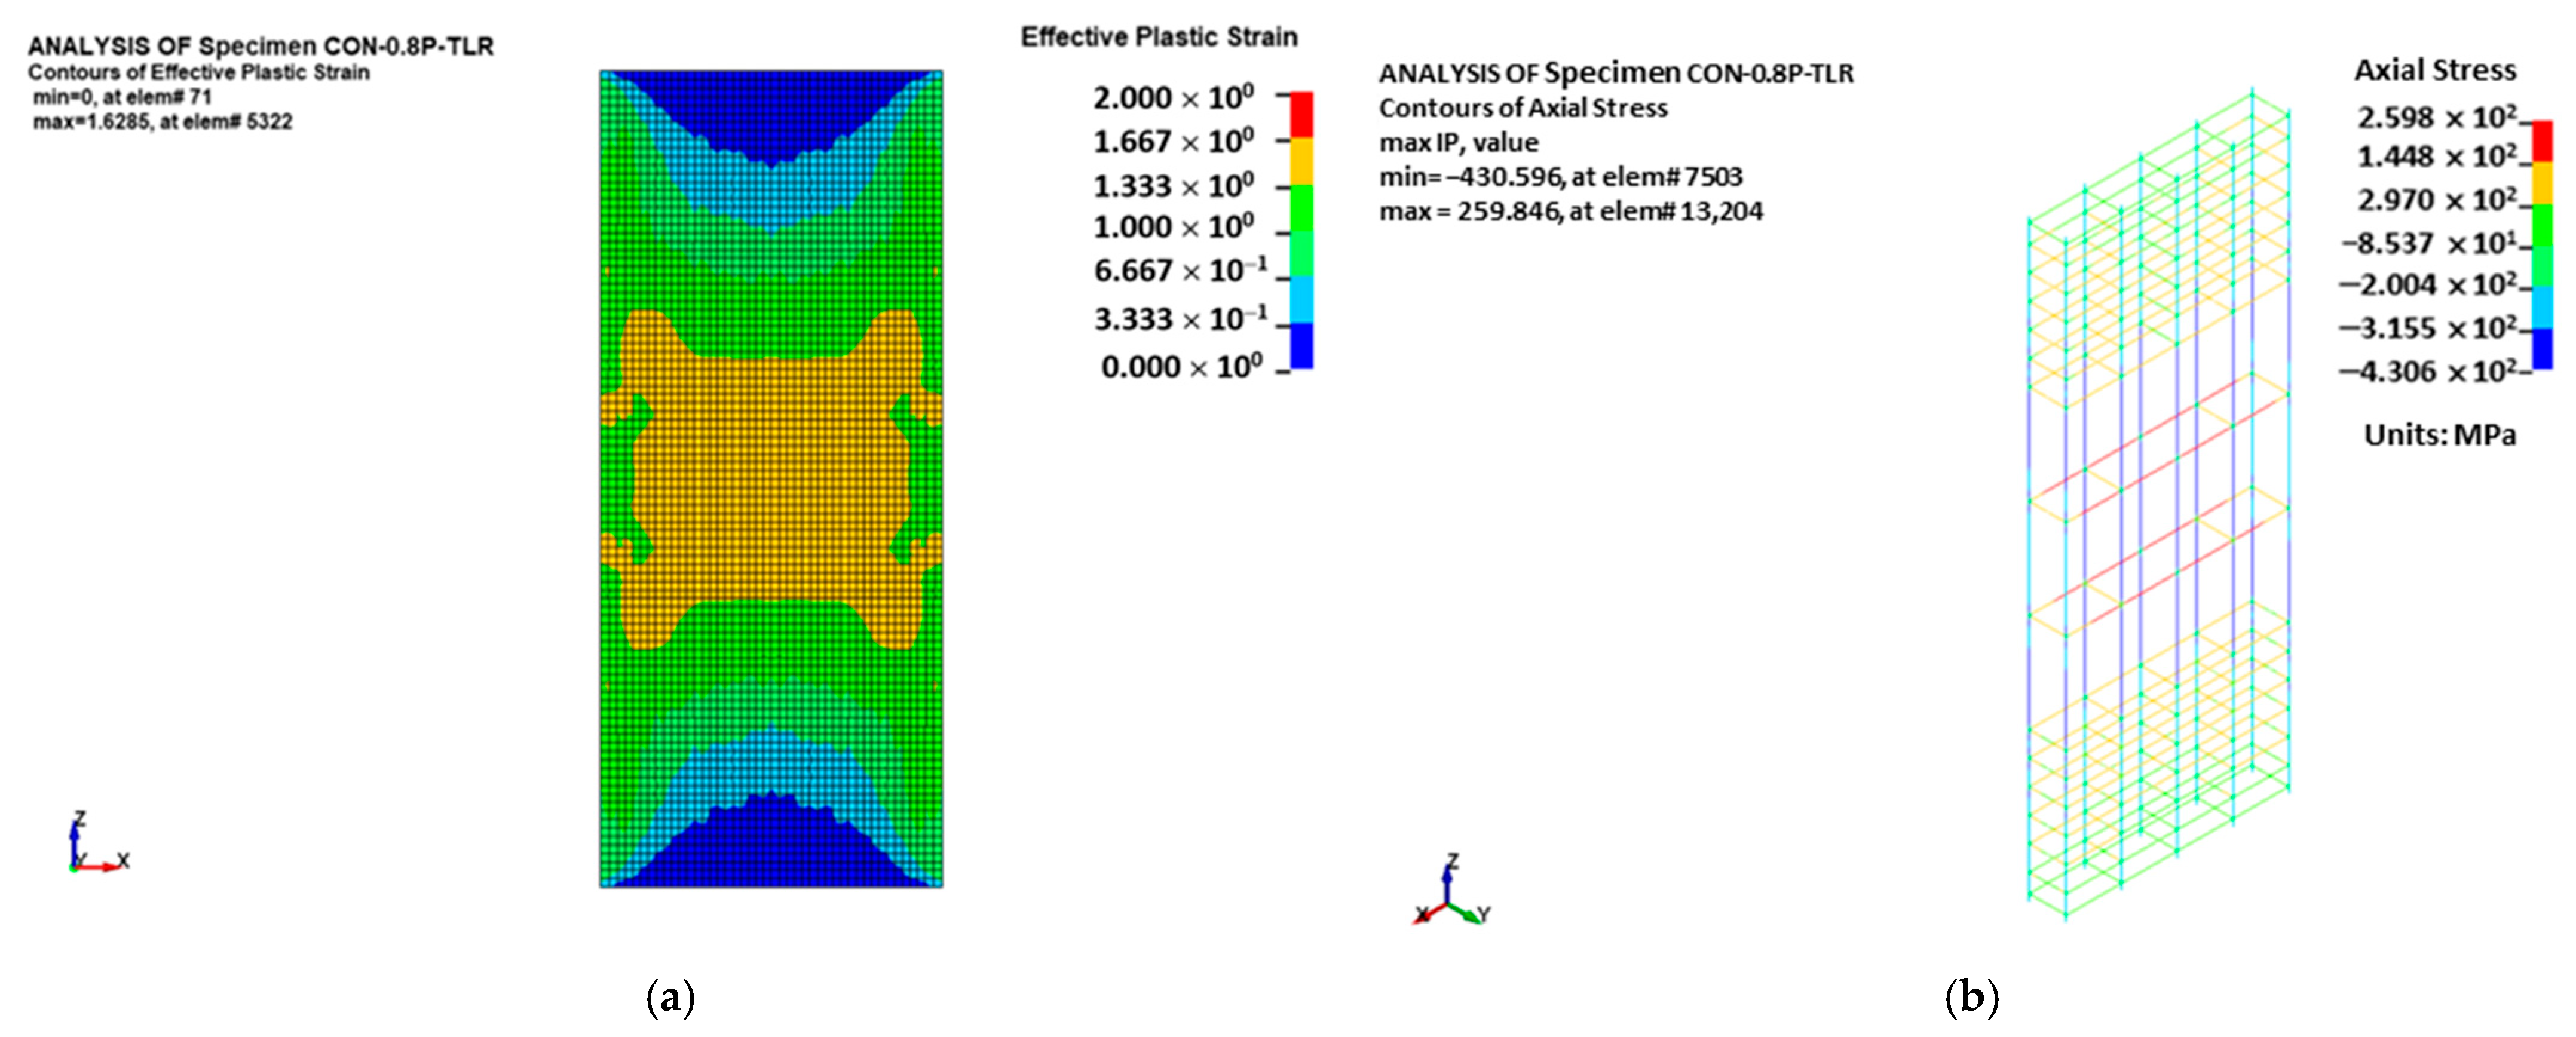
3.3. Control Specimens
As mentioned previously, the control specimens CON1-0.8P-TLR and CON2-0.8P-TLR were concentrically loaded to 80% of the average peak loads of specimens CON1 and CON2, and the load was then totally released. As clarified in Table 3, the average ultimate load of columns CON1 and CON2 is 1934 kN. The maximum recorded loads for specimens CON1-0.8P-TLR and CON2-0.8P-TLR are 1463 kN and 1573 kN, which, respectively, represent about 76% and 81% of the average ultimate load of CON1 and CON2. As the peak loads of the two control columns CON1-0.8P-TLR and CON2-0.8P-TLR were considerably lower than their crushing load (=1934 kN), no signs of failure were observed at the peak load of the two specimens as identified in Figure 7a.
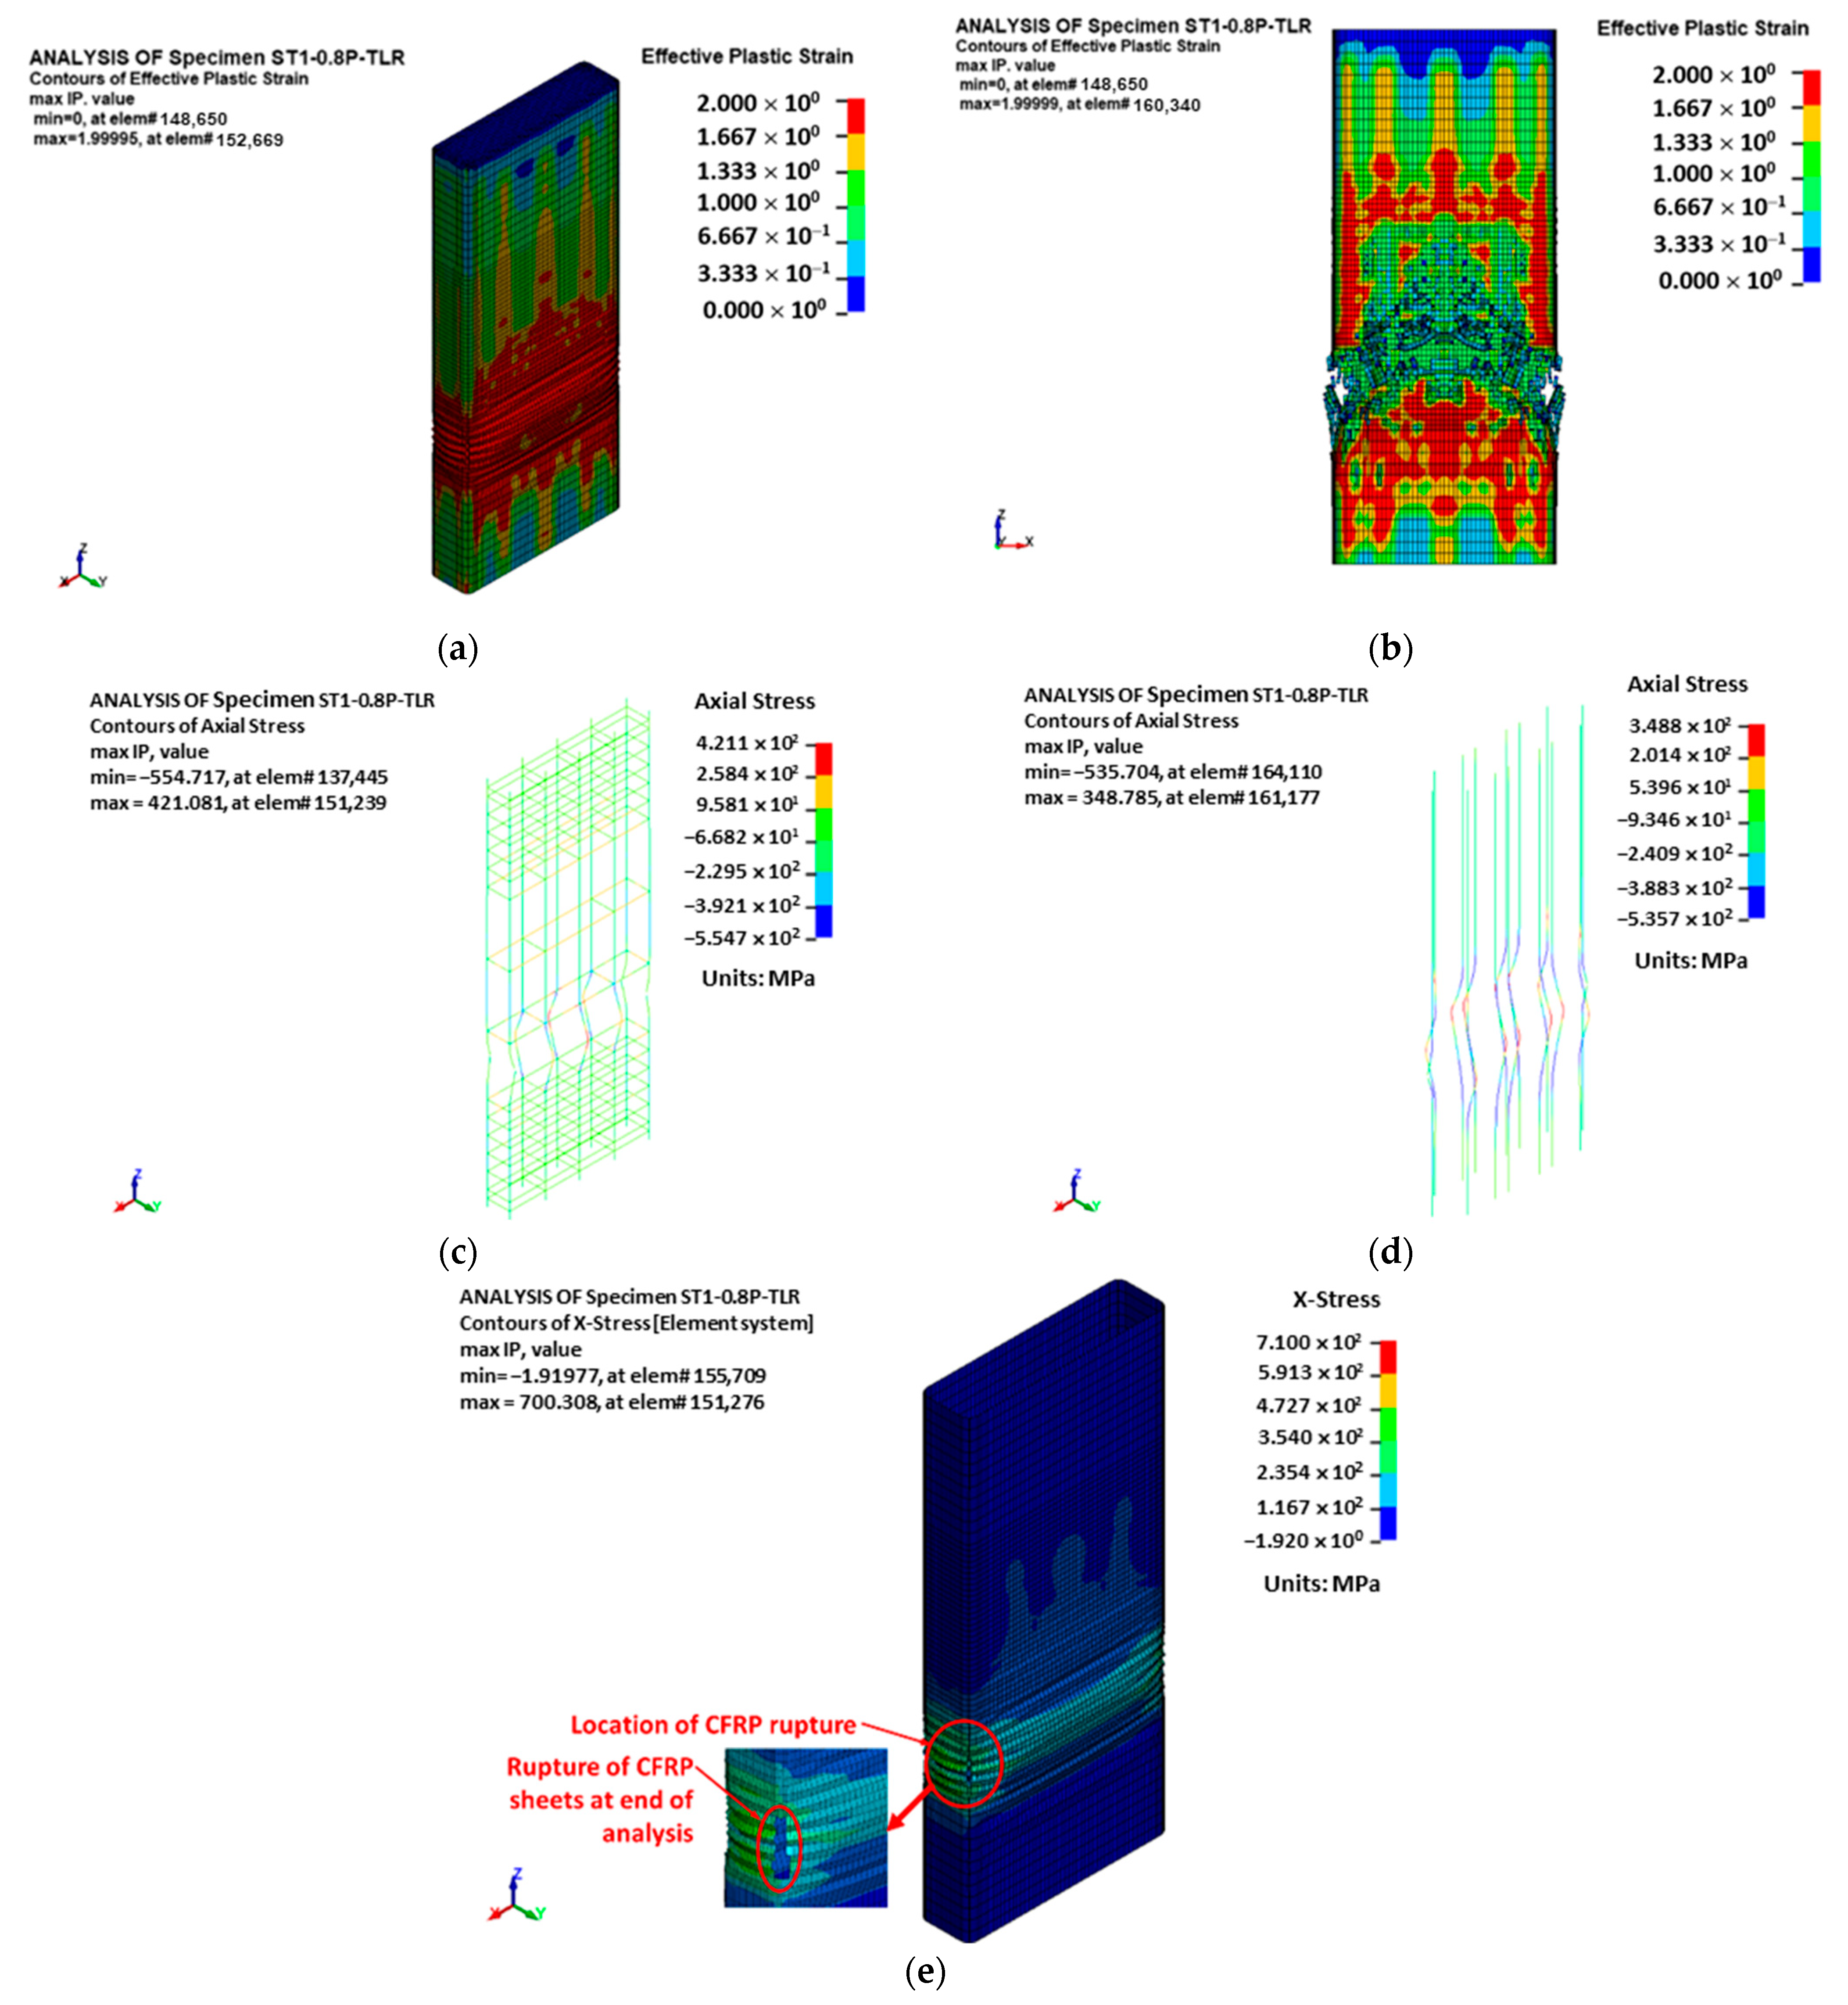
3.4. Upgraded Specimen ST1-0.8P-TLR
As mentioned before, this specimen was upgraded with the first scheme, which comprised CFRP layers combined with continuous NSM rebars. As depicted in Table 3 and Figure 6, the improvement in peak load for this strengthening configuration is 62% with regard to the average ultimate load of reference columns CON1 and CON2. Moreover, the ultimate load for specimen ST1-0.8P-TLR (=3129 kN) is about 90% of its counterpart column ST1 (with the same strengthening scheme without preloading). Therefore, it can be concluded that in practical scenarios where the unstrengthened wall-like RC column is preloaded to 80% of its peak load and then fully unloaded, this retrofitting scheme is effective enough at significantly improving the axial capacity.
The failure pattern of column ST1-0.8P-TLR is displayed in Figure 7b. The concrete expands laterally with the increase of axial compression because of Poisson’s ratio. At the ultimate load of 3129 kN, a large dilation of concrete was noted and the strengthening system was not able to restrain the dilation because of the large depth-to-width ratio of the cross-section of the column. Consequently, NSM bars’ buckling and CFRP layers’ bulging were observed in the lower part of the central 600 mm length of the specimen. Due to NSM rebars’ buckling, there was a sudden drop in the axial load to 2100 kN (a little larger than the mean peak load of reference test specimens CON1 and CON2) but became nearly flat at 1990 kN and continued until displacement of about 4.1 mm, as illustrated in Figure 6. Further increase in the axial displacement resulted in damage to the concrete and buckling of original column bars that caused the fracture of CFRP sheets in the lower part of the central 600 mm length of the column, as shown in Figure 7b.
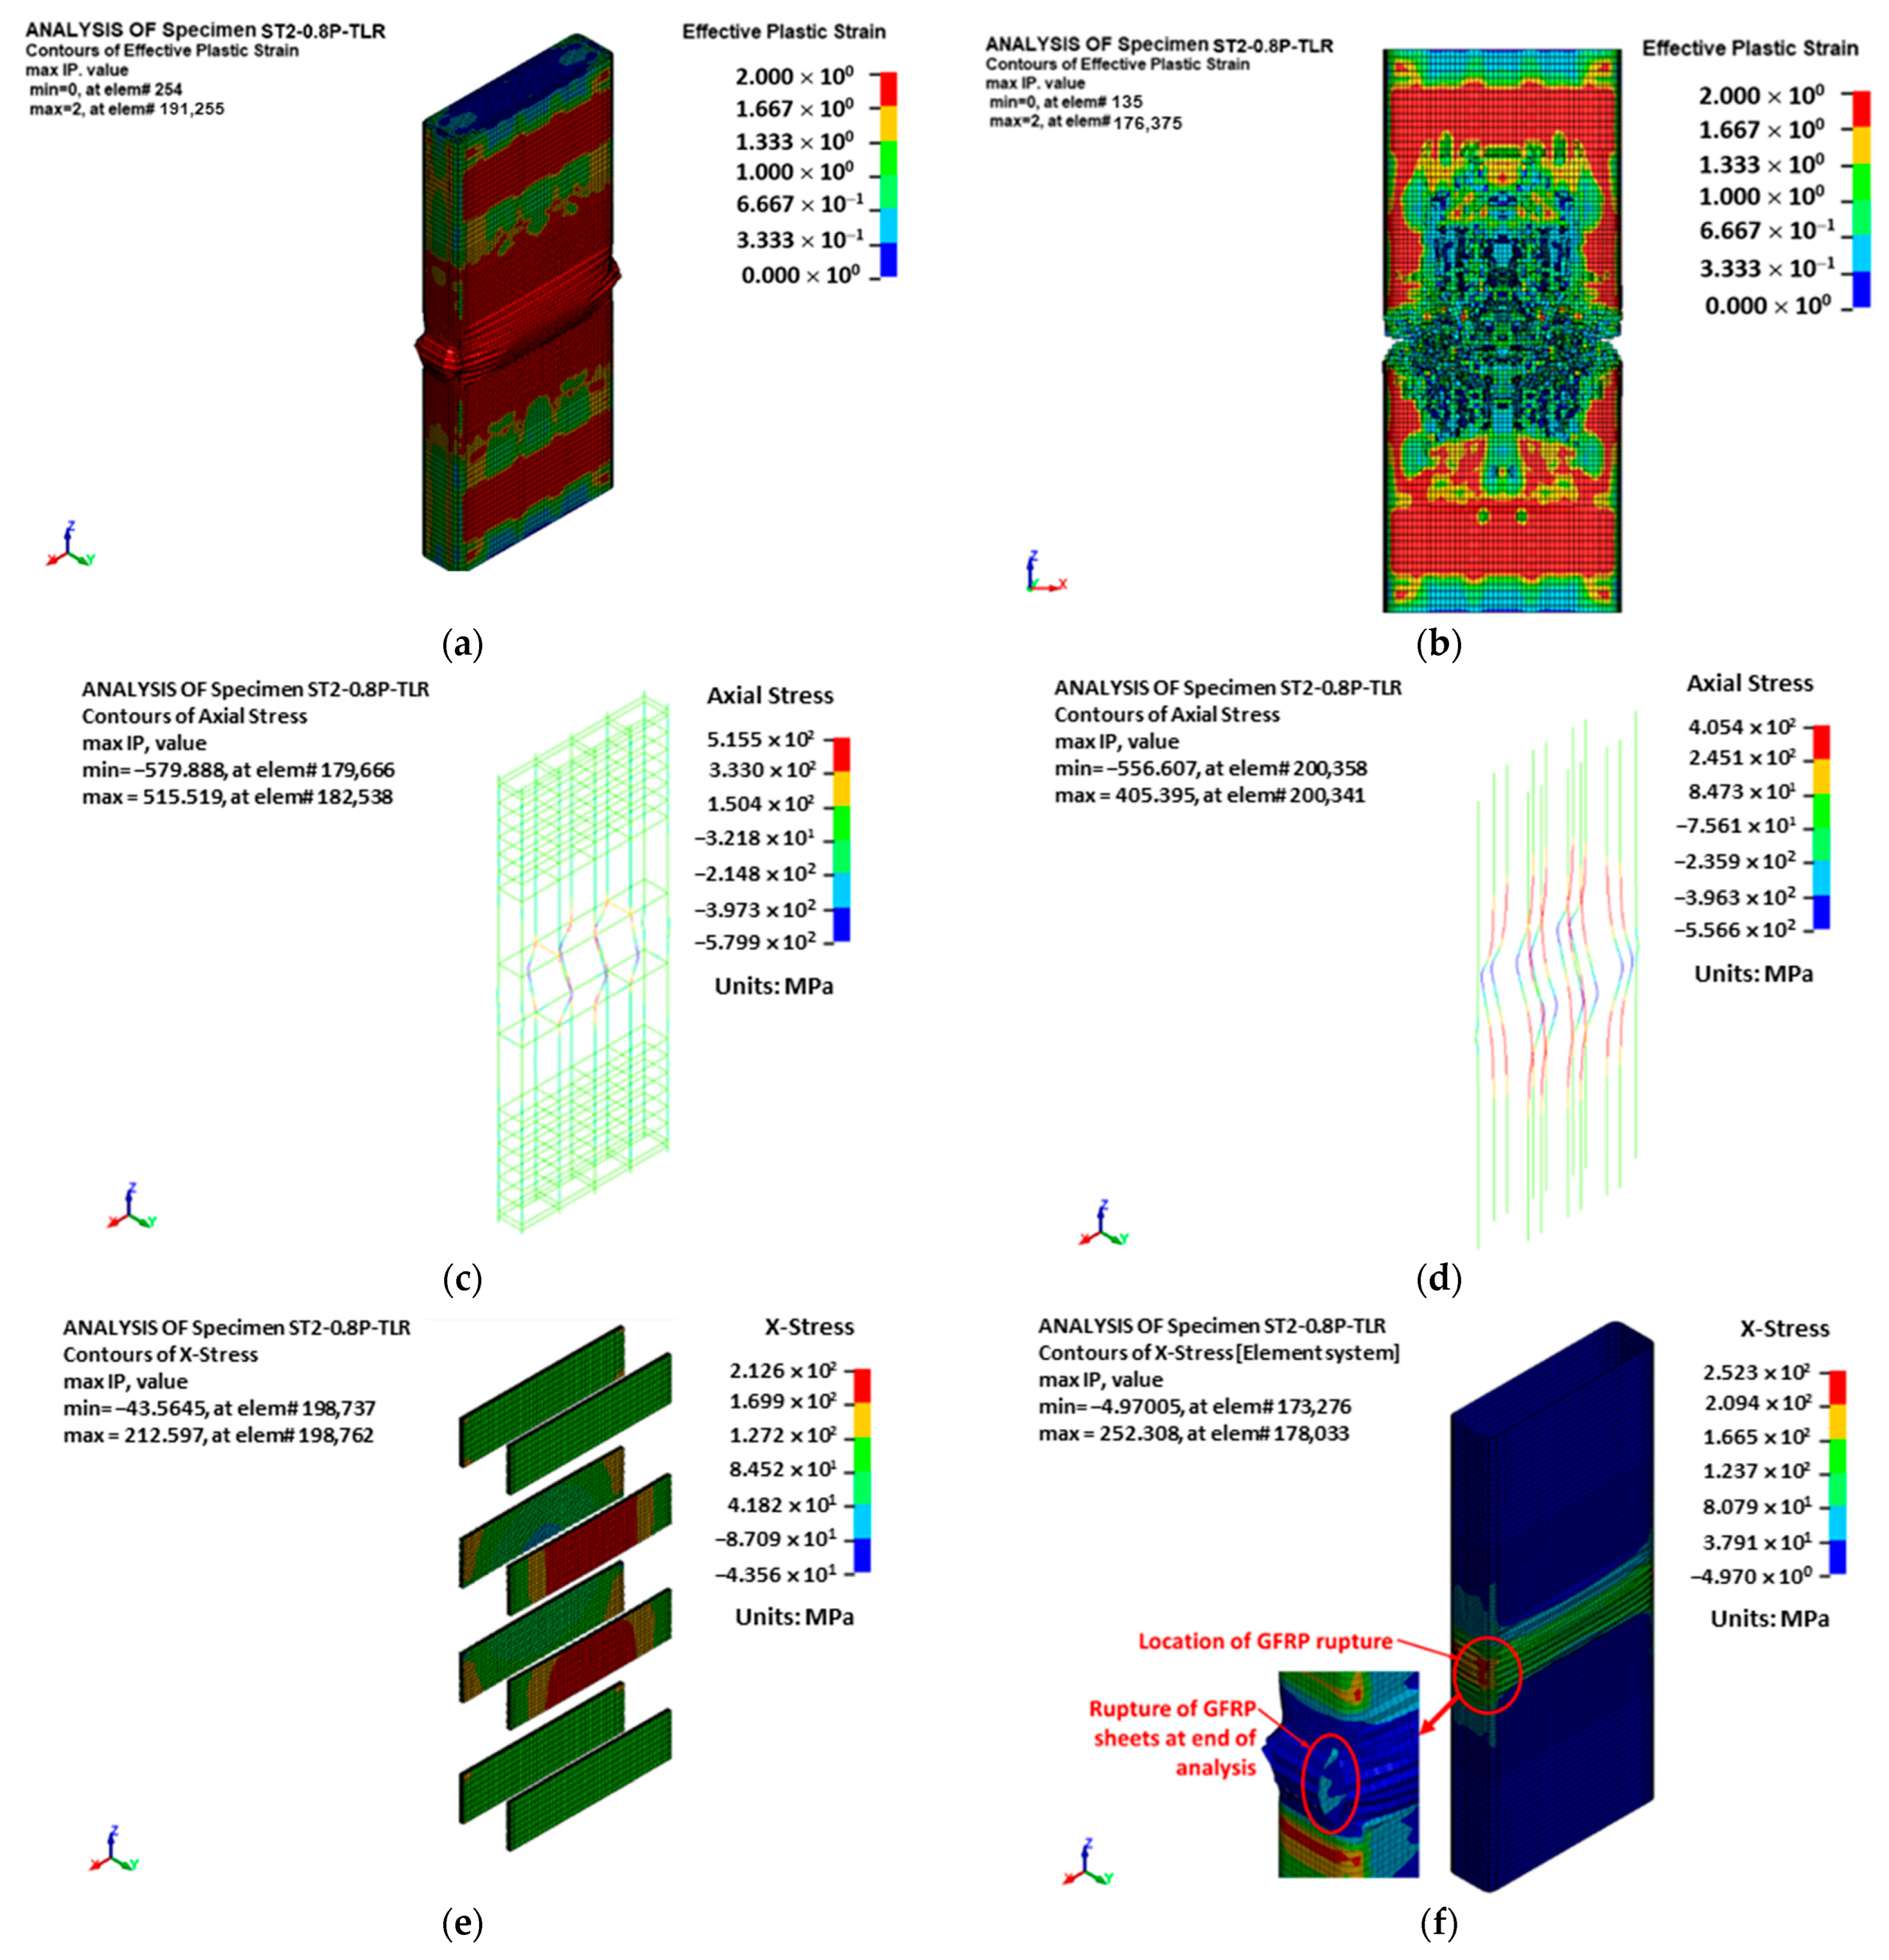
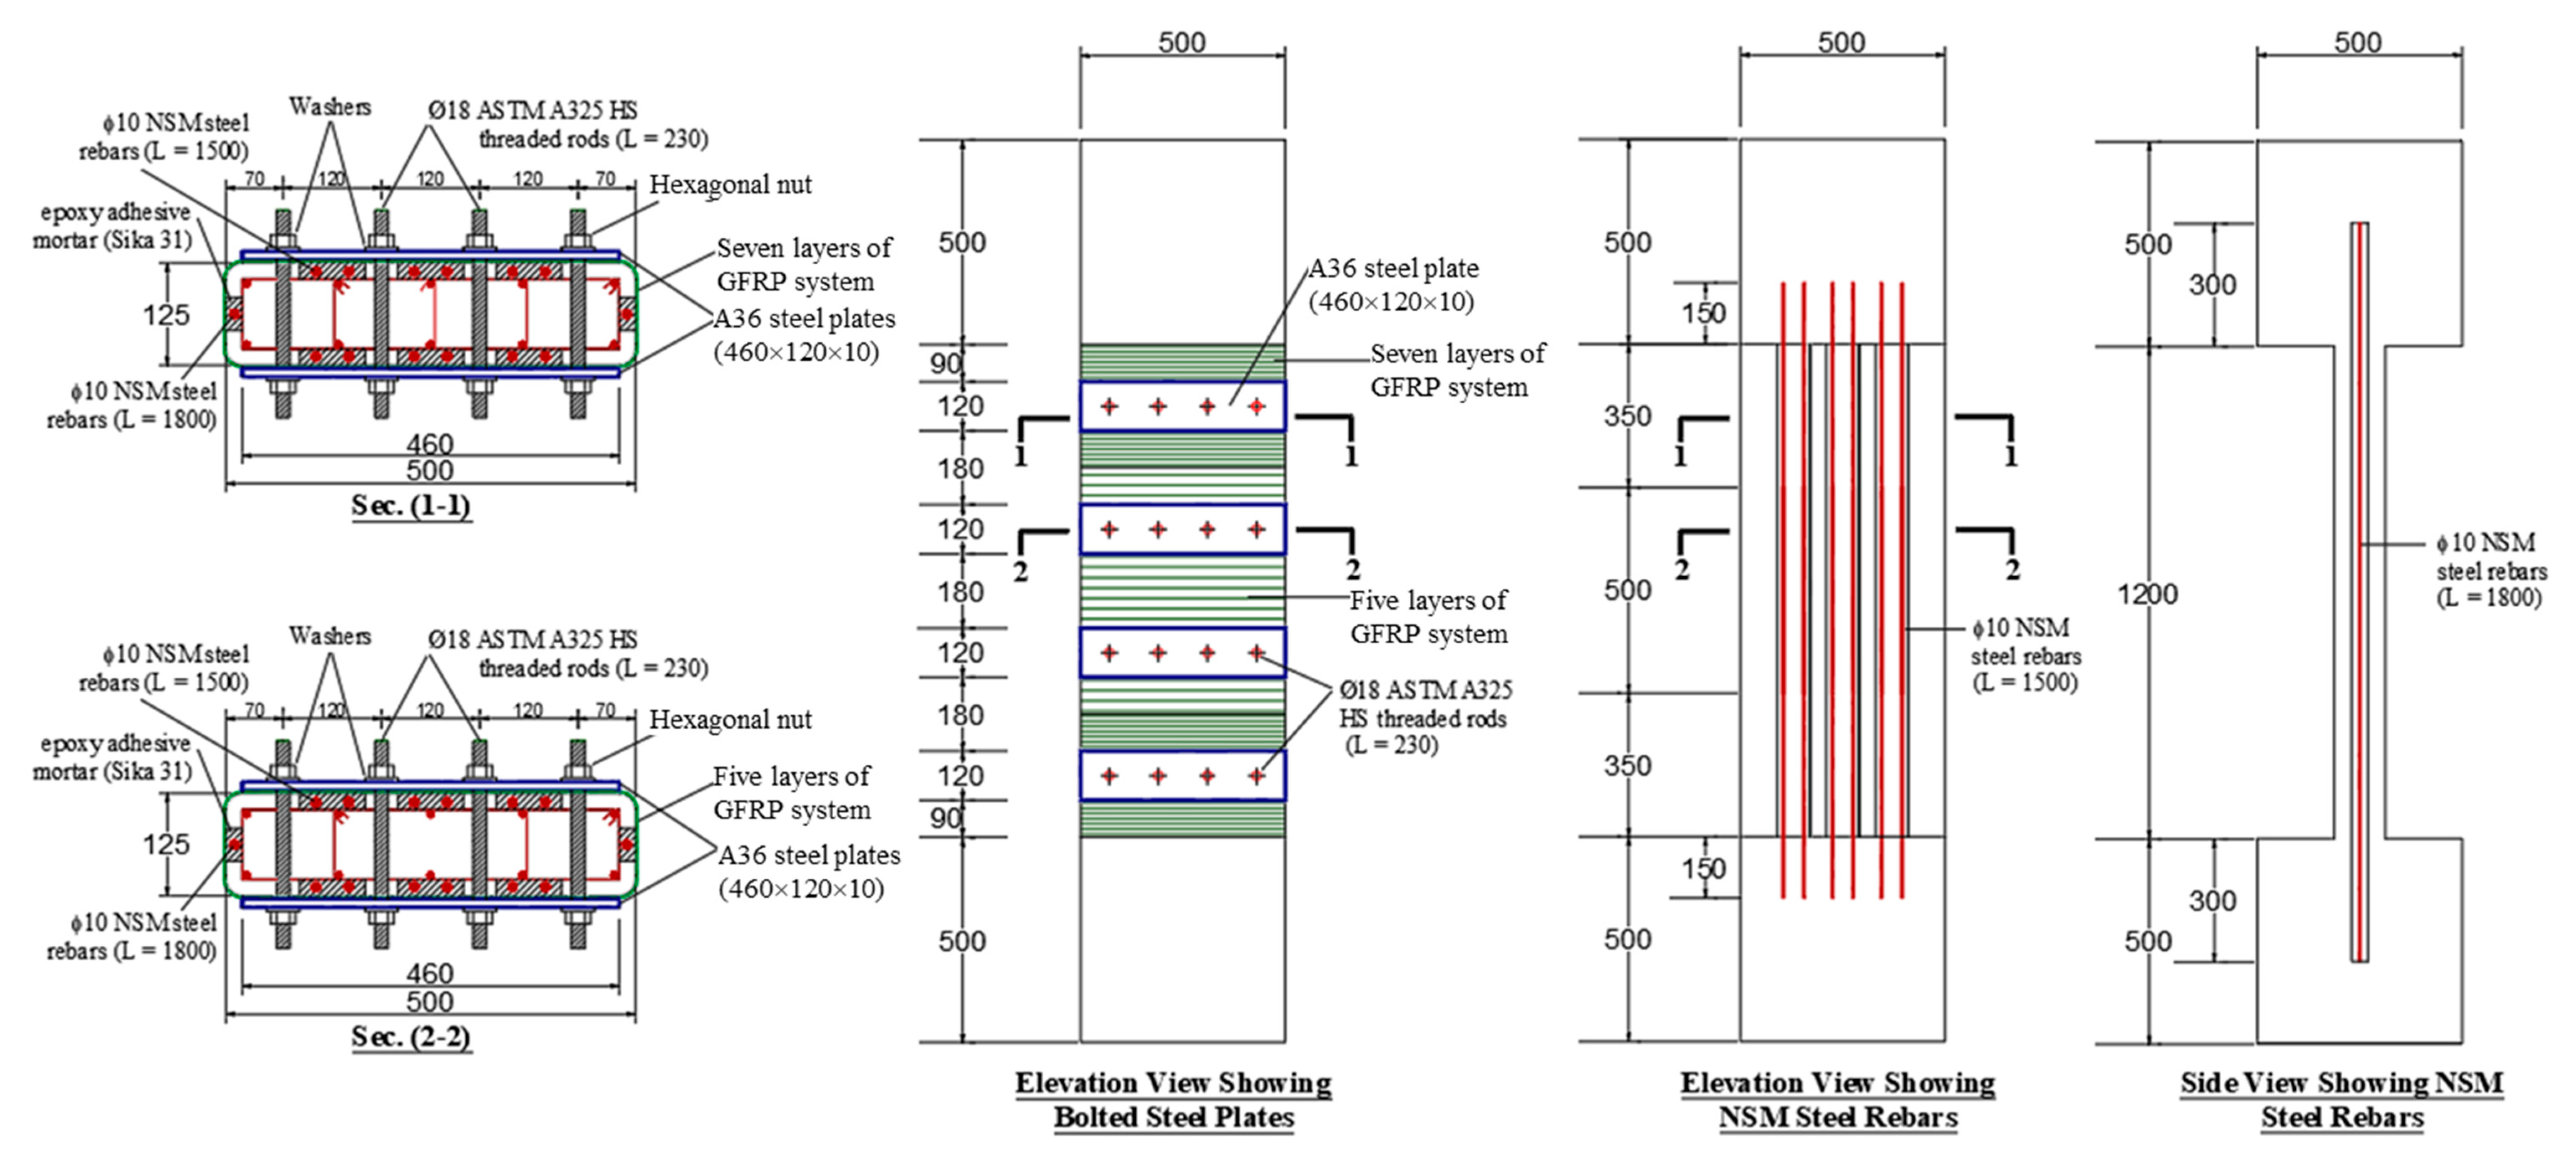
3.5. Upgraded Specimen ST2-0.8P-TLR
This specimen was retrofitted with the second scheme, which was a combination of GFRP sheets, continuous NSM steel rebars, and bolted steel plates. As noted in Table 4 and Figure 6, the peak load of this specimen was 4166 kN, which is greater than the mean ultimate load of control columns CON1 and CON2 by about 115%. It was also found that this strengthening configuration is better than the first scheme, as the response parameters of column ST2-0.8P-TLR with regard to peak load, ultimate displacement, secant stiffness, and dissipated energy were significantly more than specimen ST1-0.8P-TLR by about 33%, 213%, 47%, and 358%, respectively. The enhancement in the load-displacement characteristics over the first scheme was because of the extra confinement due to the bolted steel plates. However, the ultimate load, stiffness, and dissipated energy of column ST2-0.8P-TLR were about 95%, 86%, and 92%, respectively, of its counterpart ST2 (with the same strengthening scheme without preloading). Conclusively, the second strengthening scheme is a lot better than the first one in practical scenarios where the unstrengthened column is preloaded to 80% of its peak load and then fully unloaded. It is considered a super scheme that significantly improves the load-compression response of concentrically loaded columns.
The observed failure pattern of specimen ST2-0.8P-TLR is depicted in Figure 7c. The failure was initiated by the GFRP laminates’ bulging between the steel plates near the middle portion of the column length, which resulted in a decrease in the load. The ultimate failure was because of a fracture of the GFRP sheets close to the corner due to the buckling of both NSM and main rebars on the shorter side of the specimen, as demonstrated in Figure 7c.
3.6. Effect of Preloading
Figure 8 shows the impact of preloading in control specimens CON1-0.8P-TLR and CON2-0.8P-TLR on the percent reduction in the response parameters of strengthened specimens ST1-0.8P-TLR and ST2-0.8P-TLR with regard to upgraded specimens ST1 and ST2. It is identified that preloading the unstrengthened specimens with 80% of their axial load-bearing resistance followed by total load release marginally reduced the peak load in specimens ST1-0.8P-TLR and ST2-0.8P-TLR with respect to their counterparts ST1 and ST2 by 10% and 5%, respectively. Also, compared with columns ST1 and ST2, the dissipated energy of specimens ST1-0.8P-TLR and ST2-0.8P-TLR, in turn, was marginally reduced by 3% and 8% (see Figure 8). However, the 80% preloading with total load release in the control specimens caused a fairly considerable reduction in the secant stiffness of upgraded specimens ST1-0.8P-TLR and ST2-0.8P-TLR by 18% and 14%, respectively, when compared with their counterparts ST1 and ST2. It is worth noting that the preloading of unstrengthened columns, reaching up to 80% of their load-carrying capacity, did not result in any apparent visual damage, as the concrete strain remained below the crushing strain, and there was no yielding of rebars. Nevertheless, after crossing the nearly linear elastic range, the concrete strain led to the development of microcracks and plastic deformation. This, in turn, contributed to a reduction in the response parameters (peak load, axial stiffness, and dissipated energy) of the preloaded wall-like columns compared to columns without preloading.
Figure 8.
Effect of preloading on response parameters of strengthened specimens (based on experimental results).
4. Finite Element Analysis
Other than the experimental campaign, three-dimensional (3D) nonlinear FE modeling was carried out to explore the load-displacement response and failure pattern of test specimens. The analysis was undertaken utilizing LS-DYNA Version R11 [36]. Details of the FE modeling of the wall-like columns are given in the following subsections. However, for the other specimens of the test matrix, the FE analysis is detailed in Refs. [24,25].
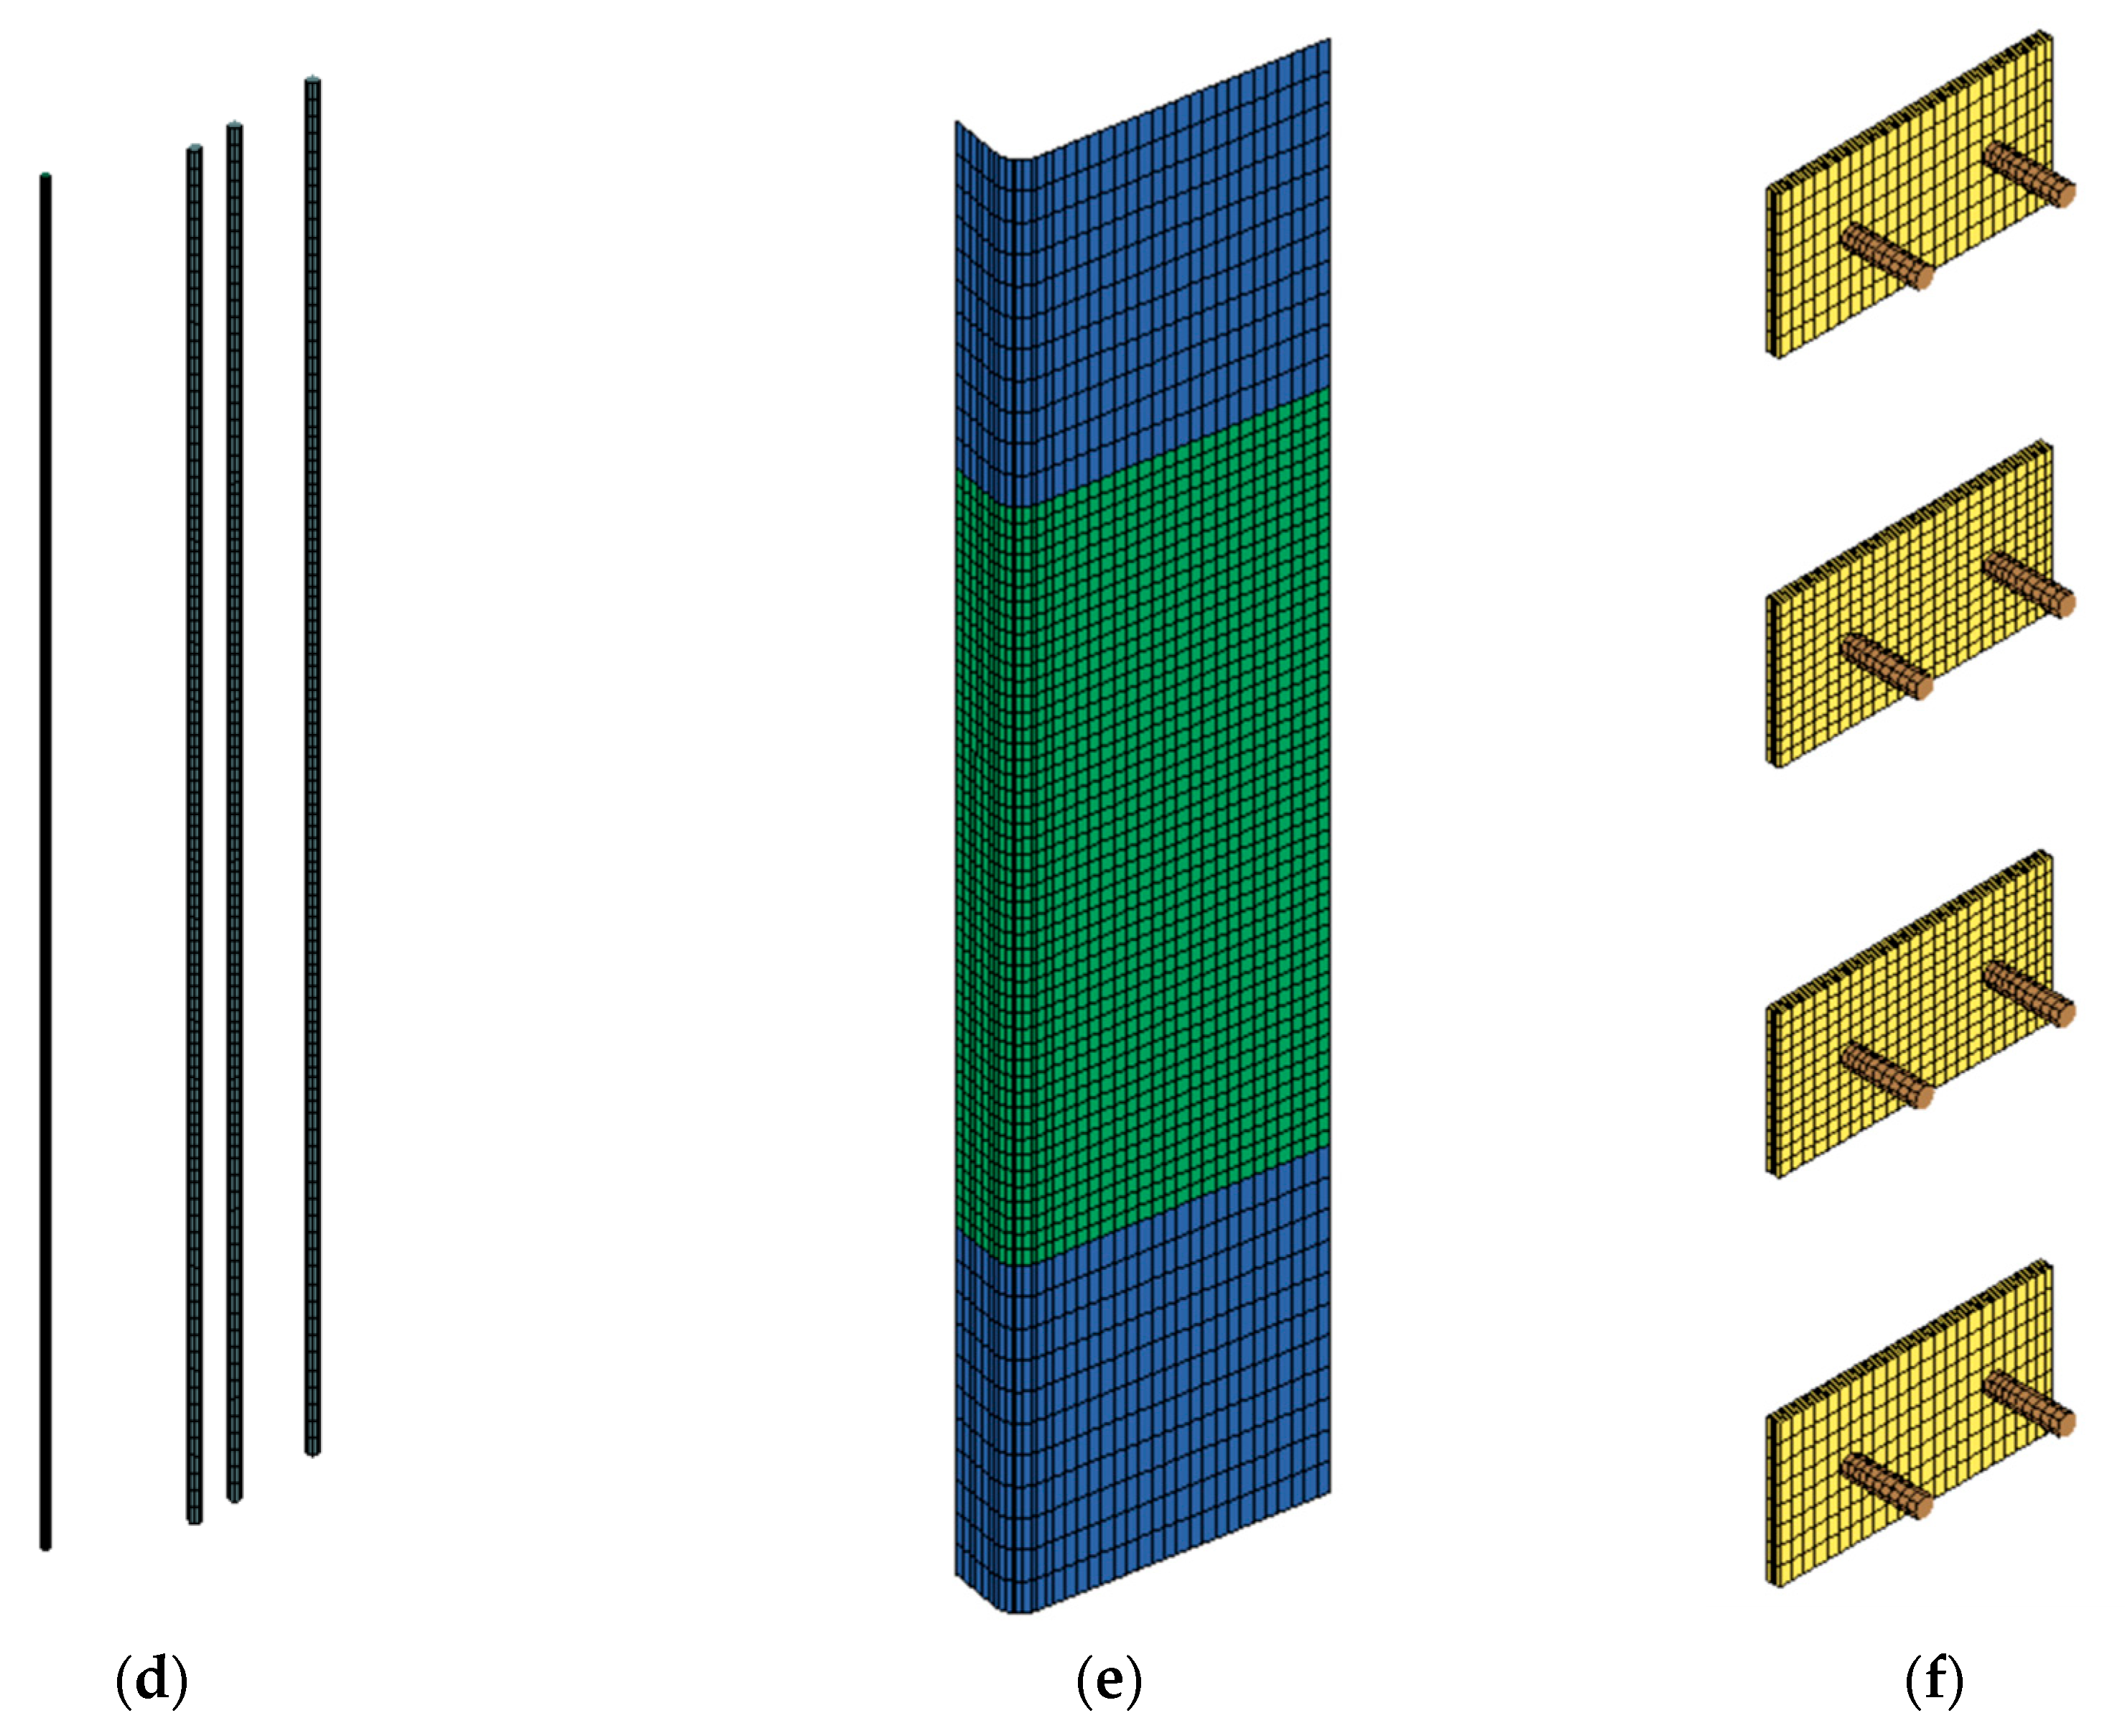
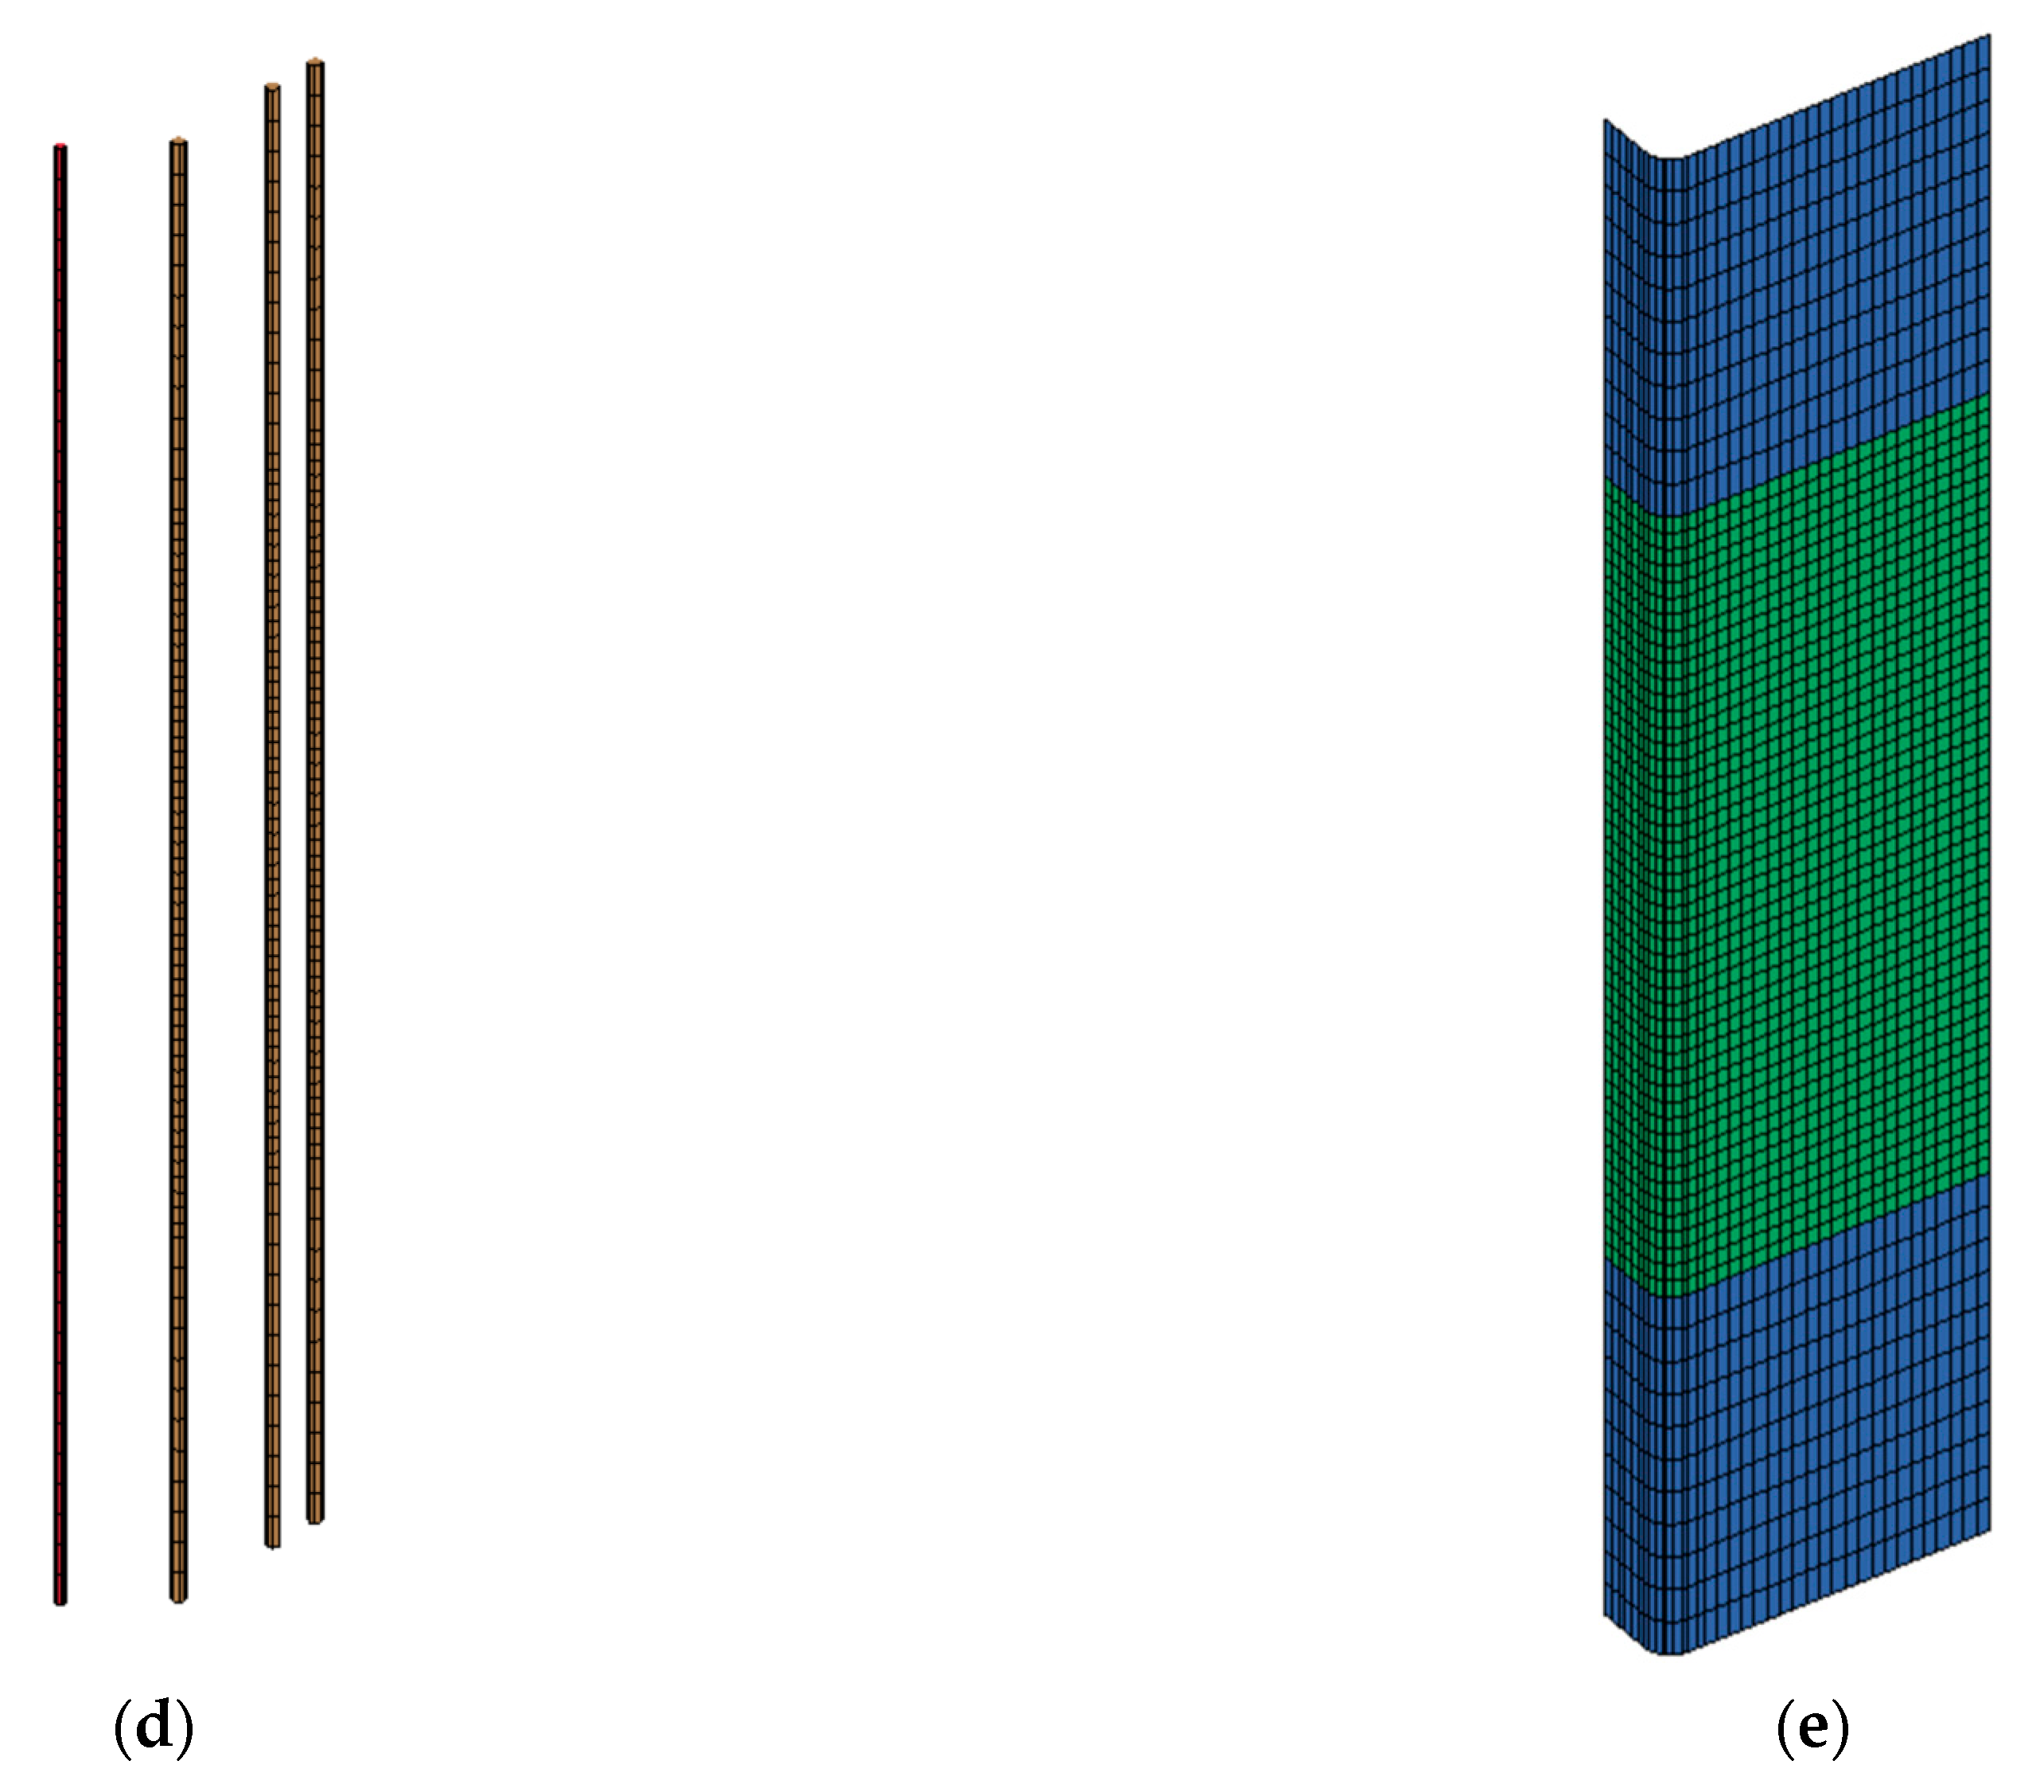
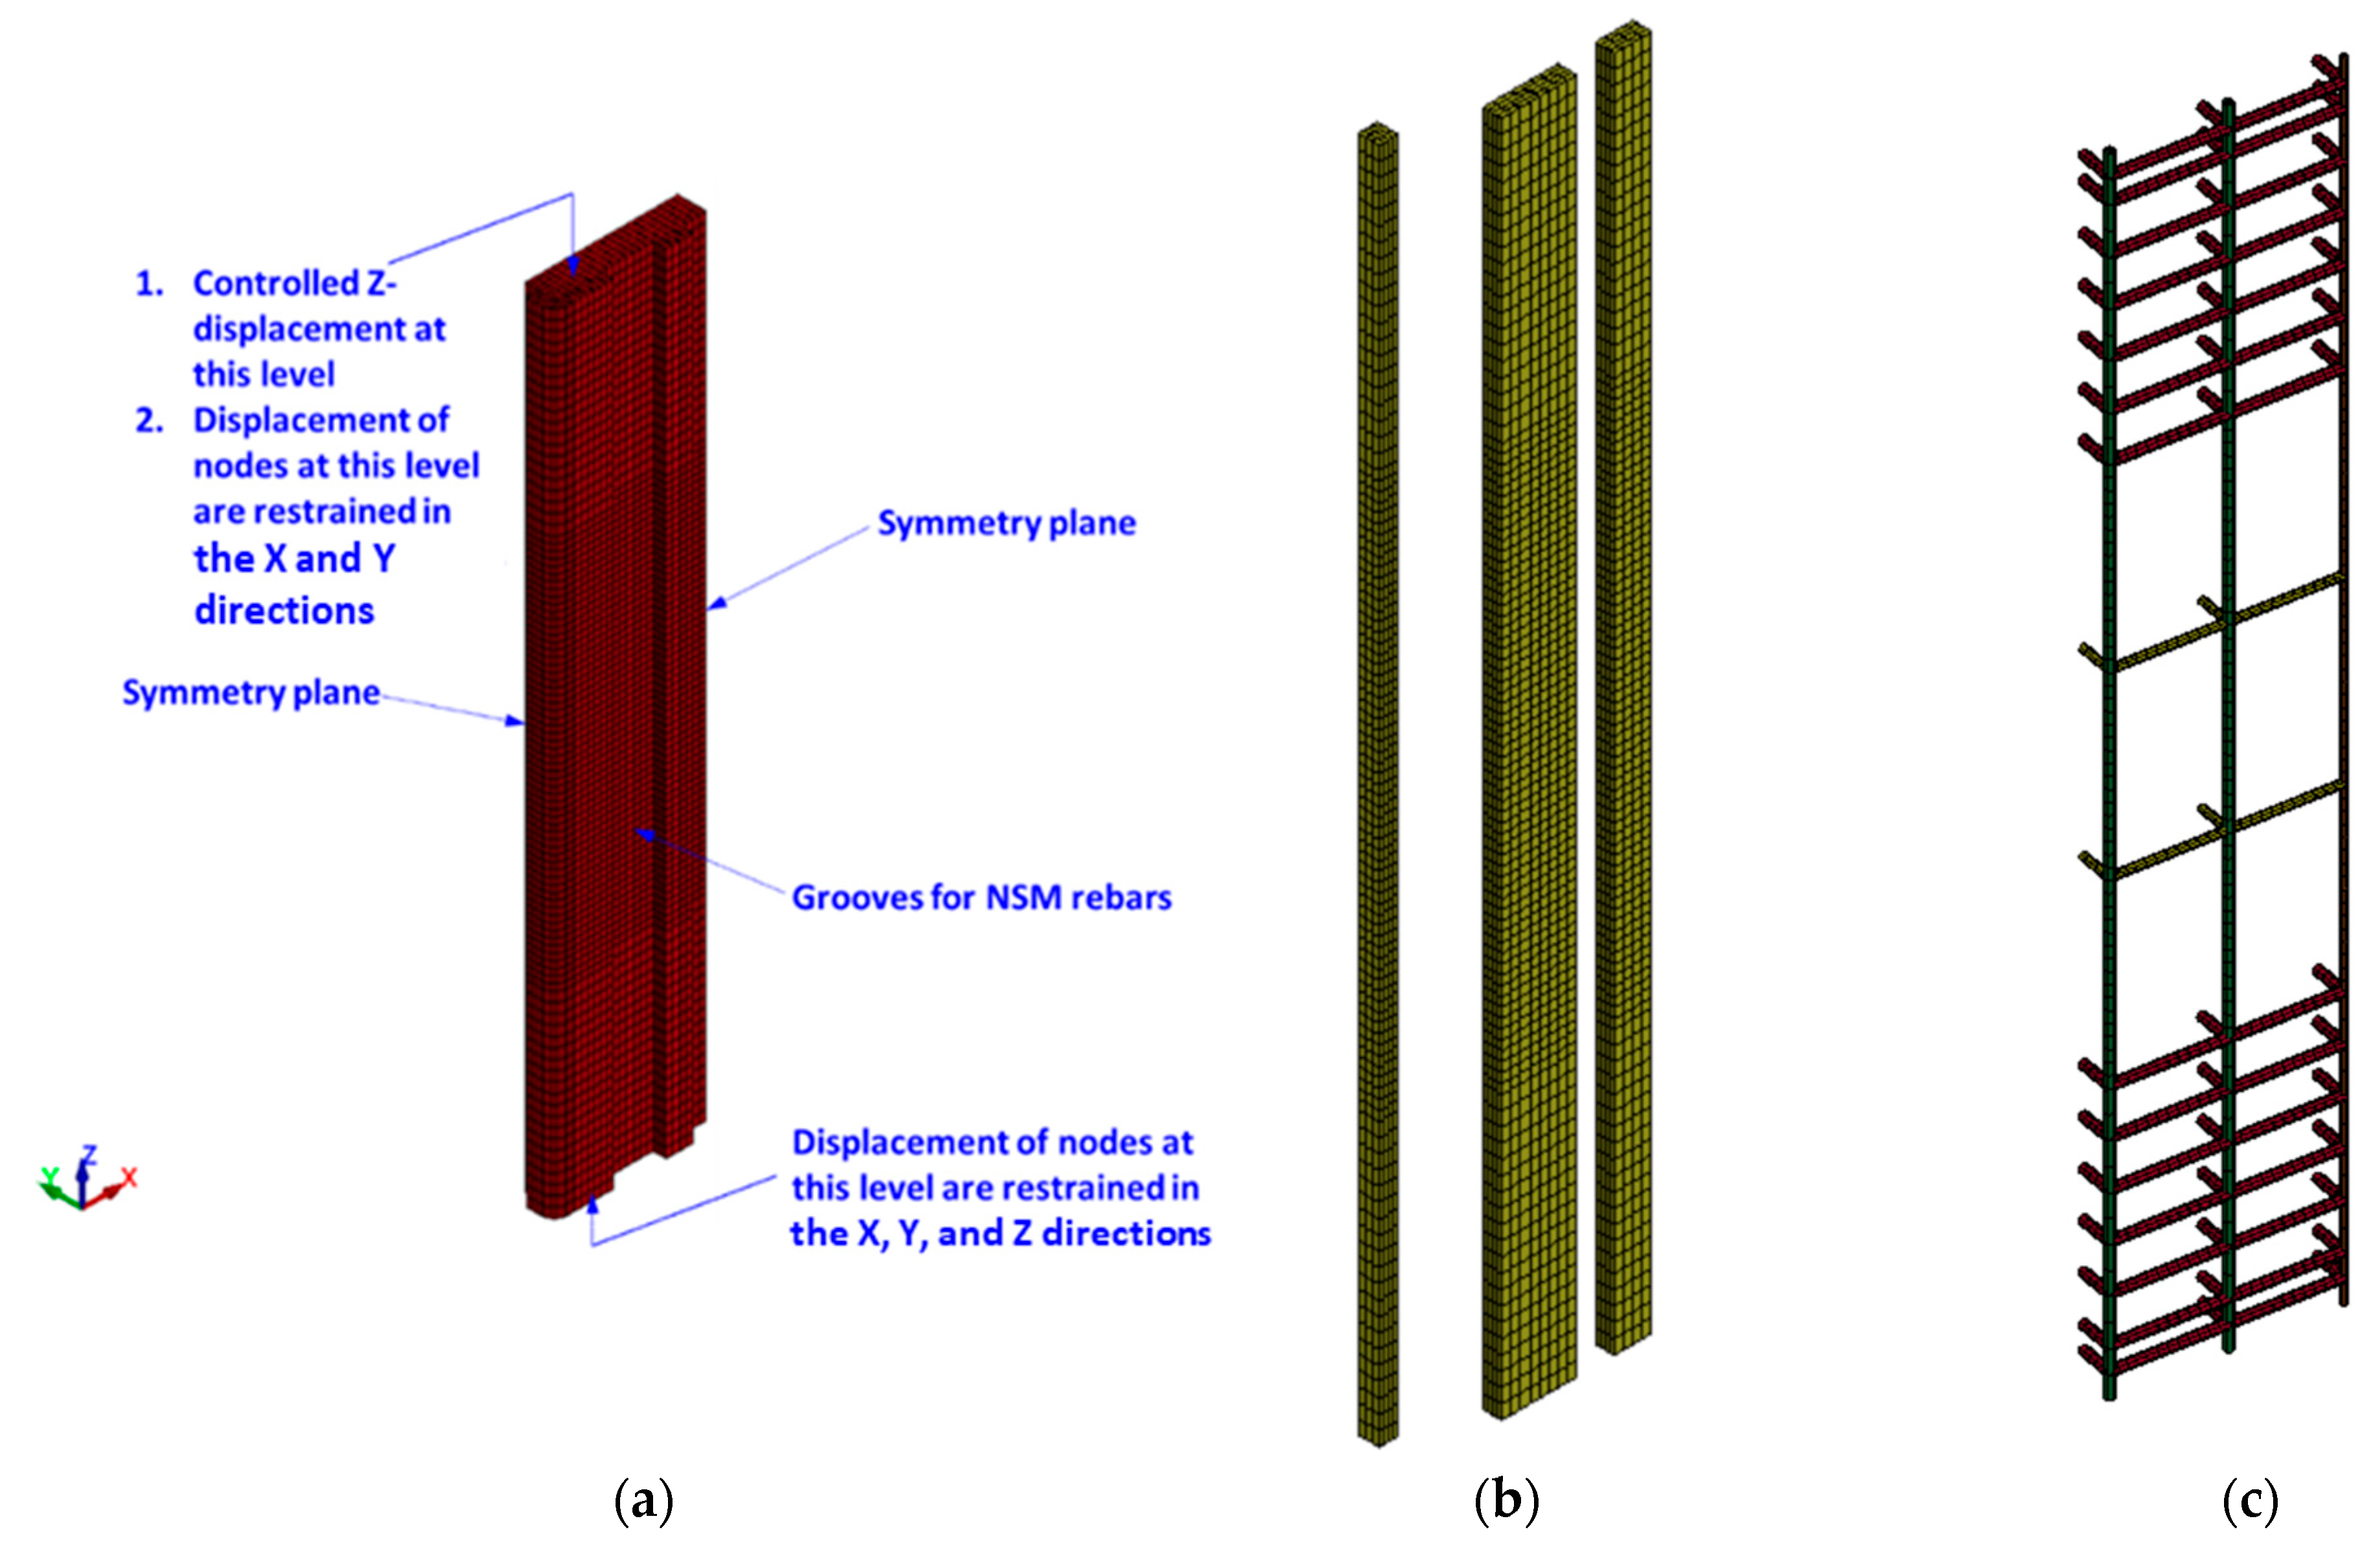
4.1. Mesh and Geometry
Figure 9, Figure 10 and Figure 11 display the FE mesh for the test specimens. Because of the symmetrical nature of the specimens with respect to two planes, only a quarter of the column was simulated in order to conserve computational resources and memory. The end bulbs of the specimens were not included in the model since they were not damaged throughout the experiments. For modeling concrete in all specimens, mortar in strengthened specimens, and steel plates in specimen ST2-0.8P-TLR, eight-node brick elements of reduced integration were employed. However, for modeling vertical and transverse steel rebars (in all specimens) as well as threaded rods in specimen ST2-0.8P-TLR, two-node Hughes Liu beam elements were employed. For FRP sheets in strengthened specimens, four-node Belytschko–Tsay shell elements [37] were used. In the analysis, a perfect bond was assumed for the interface between steel bars and concrete and also between FRP sheets and concrete surface. A mesh sensitivity study was performed and an FE analysis with a maximum mesh size of 25 mm was employed.
Figure 9.
FE model of control columns: (a) solid elements for concrete; (b) beam elements for steel rebars.

Figure 10.
FE model of strengthened column ST1-0.8P-TLR: (a) solid elements for concrete; (b) solid elements for adhesive mortar; (c) beam elements for steel rebars; (d) beam elements for NSM rebars; (e) shell elements for CFRP sheets.

Figure 11.
FE model of strengthened column ST2-0.8P-TLR: (a) solid elements for concrete; (b) solid elements for adhesive mortar; (c) beam elements for steel rebars; (d) beam elements for NSM rebars; (e) shell elements for CFRP sheets; (f) solid and beam elements for steel plates and threaded rods, respectively.
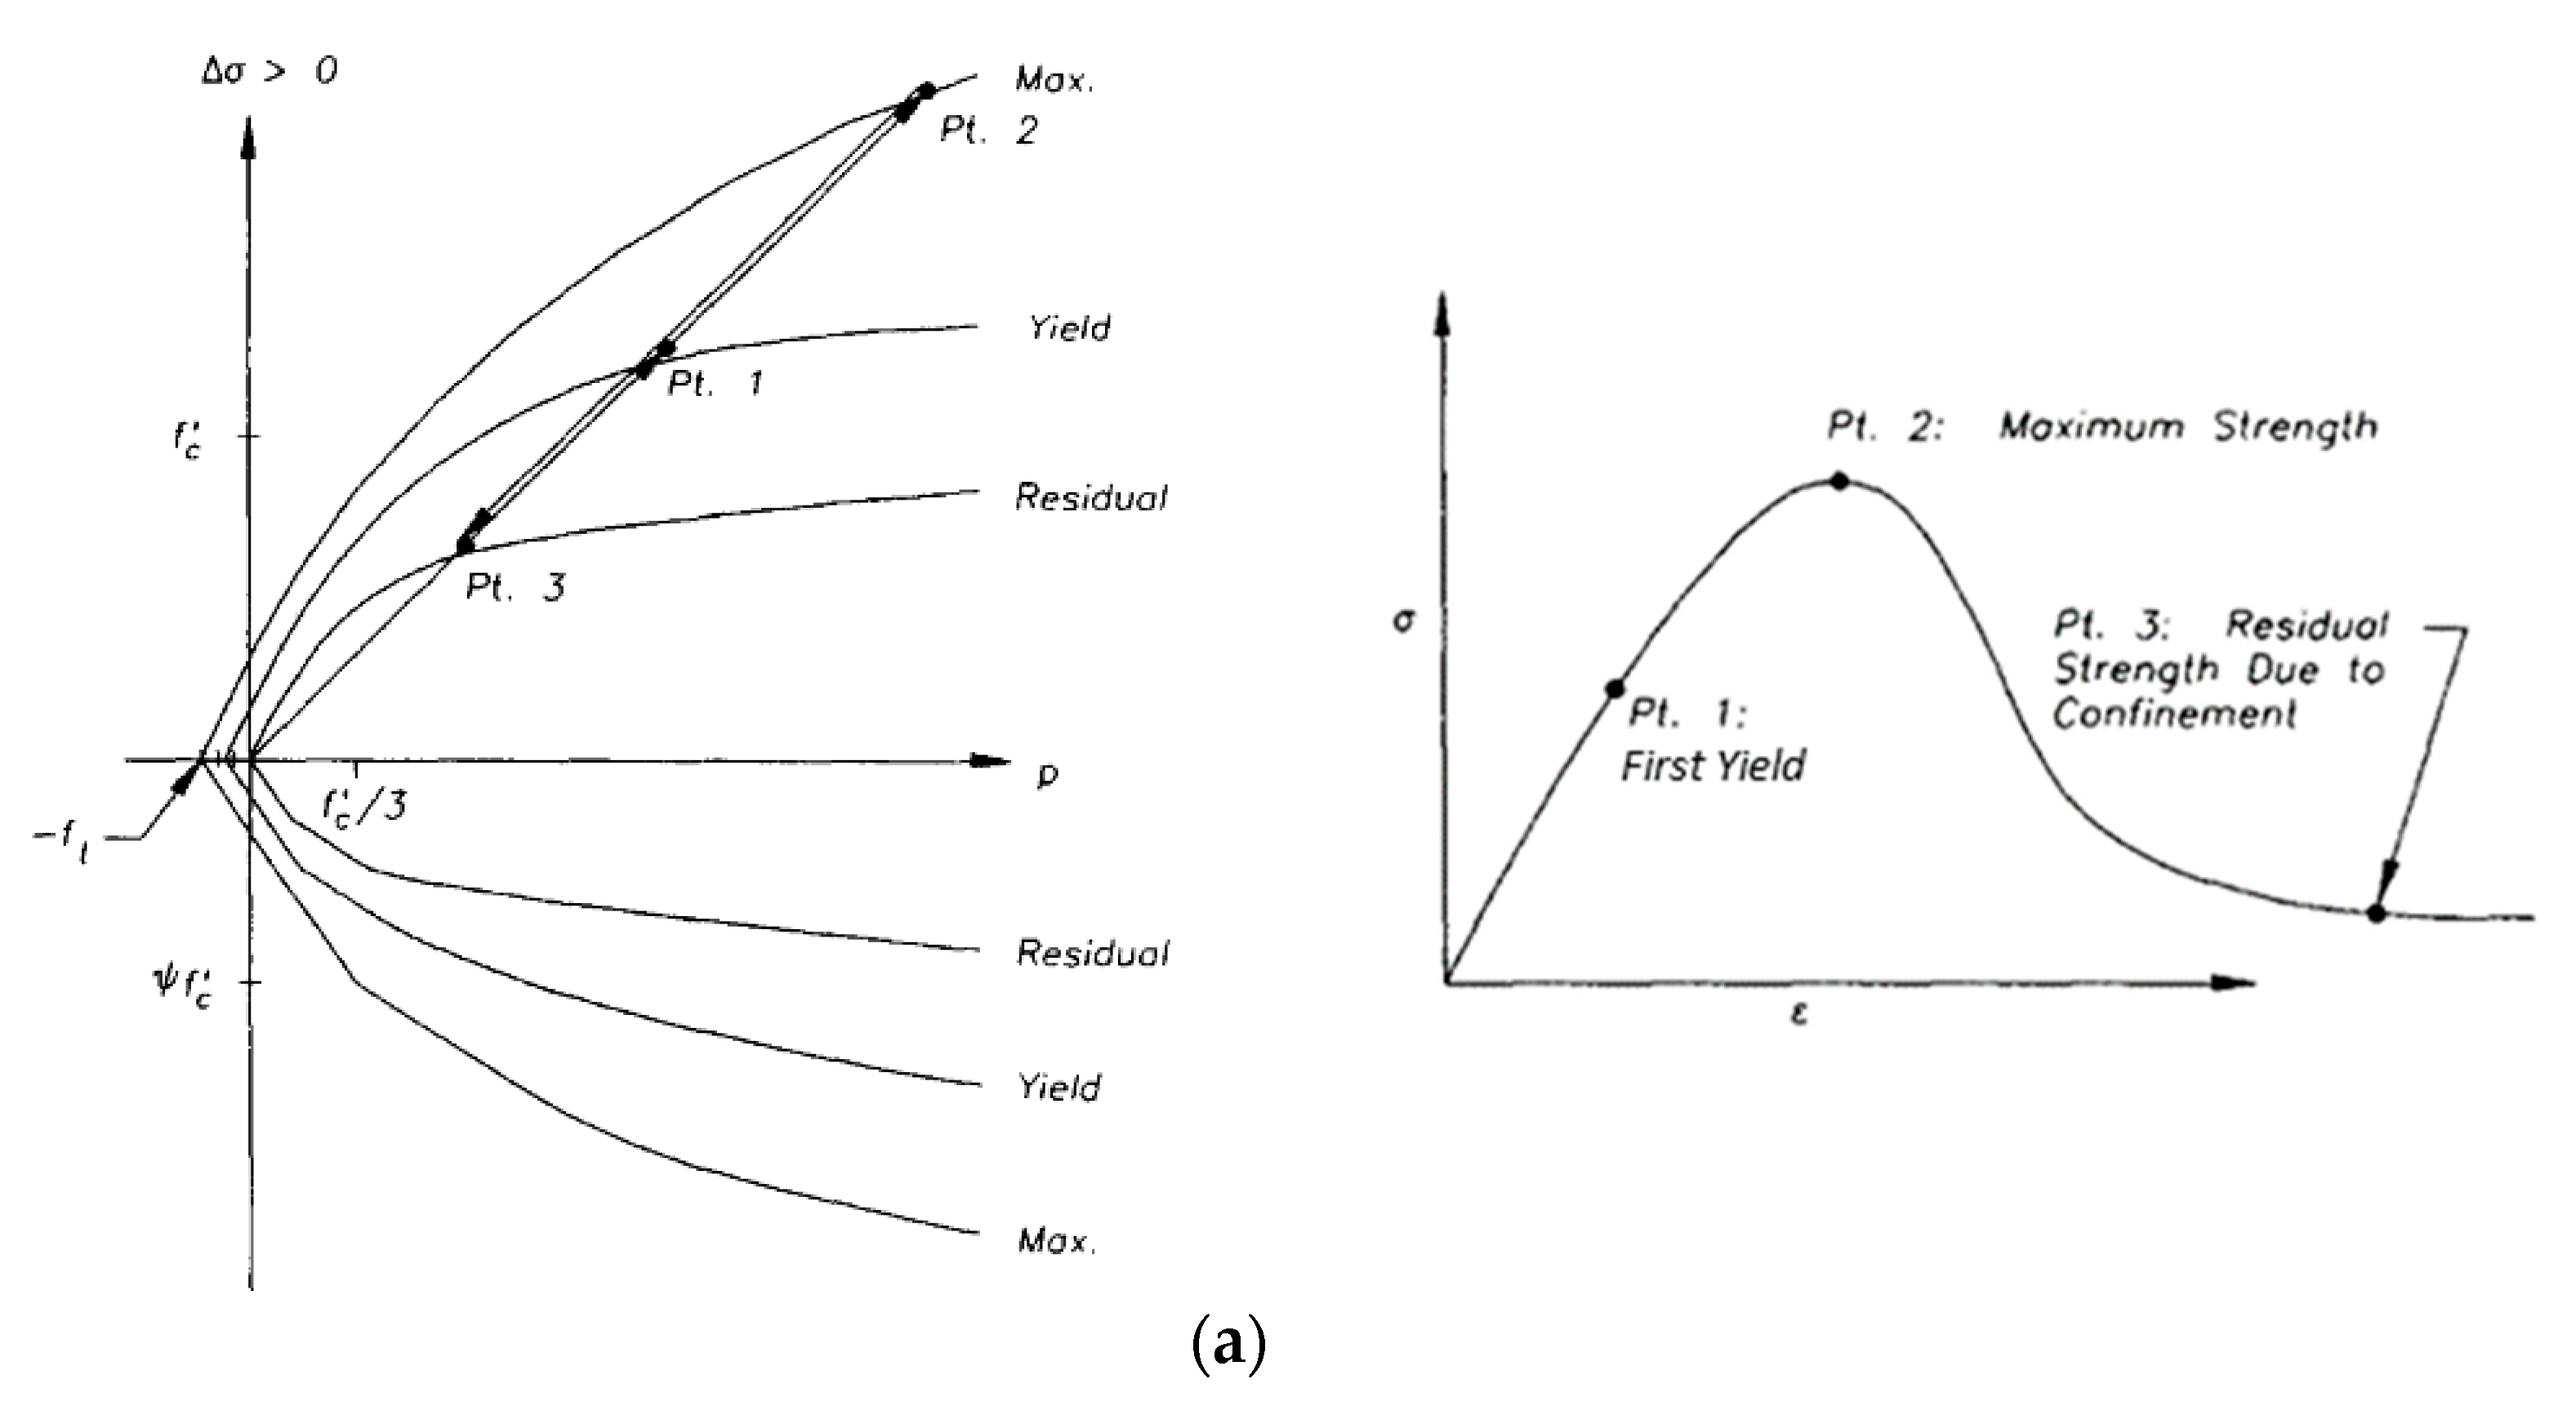
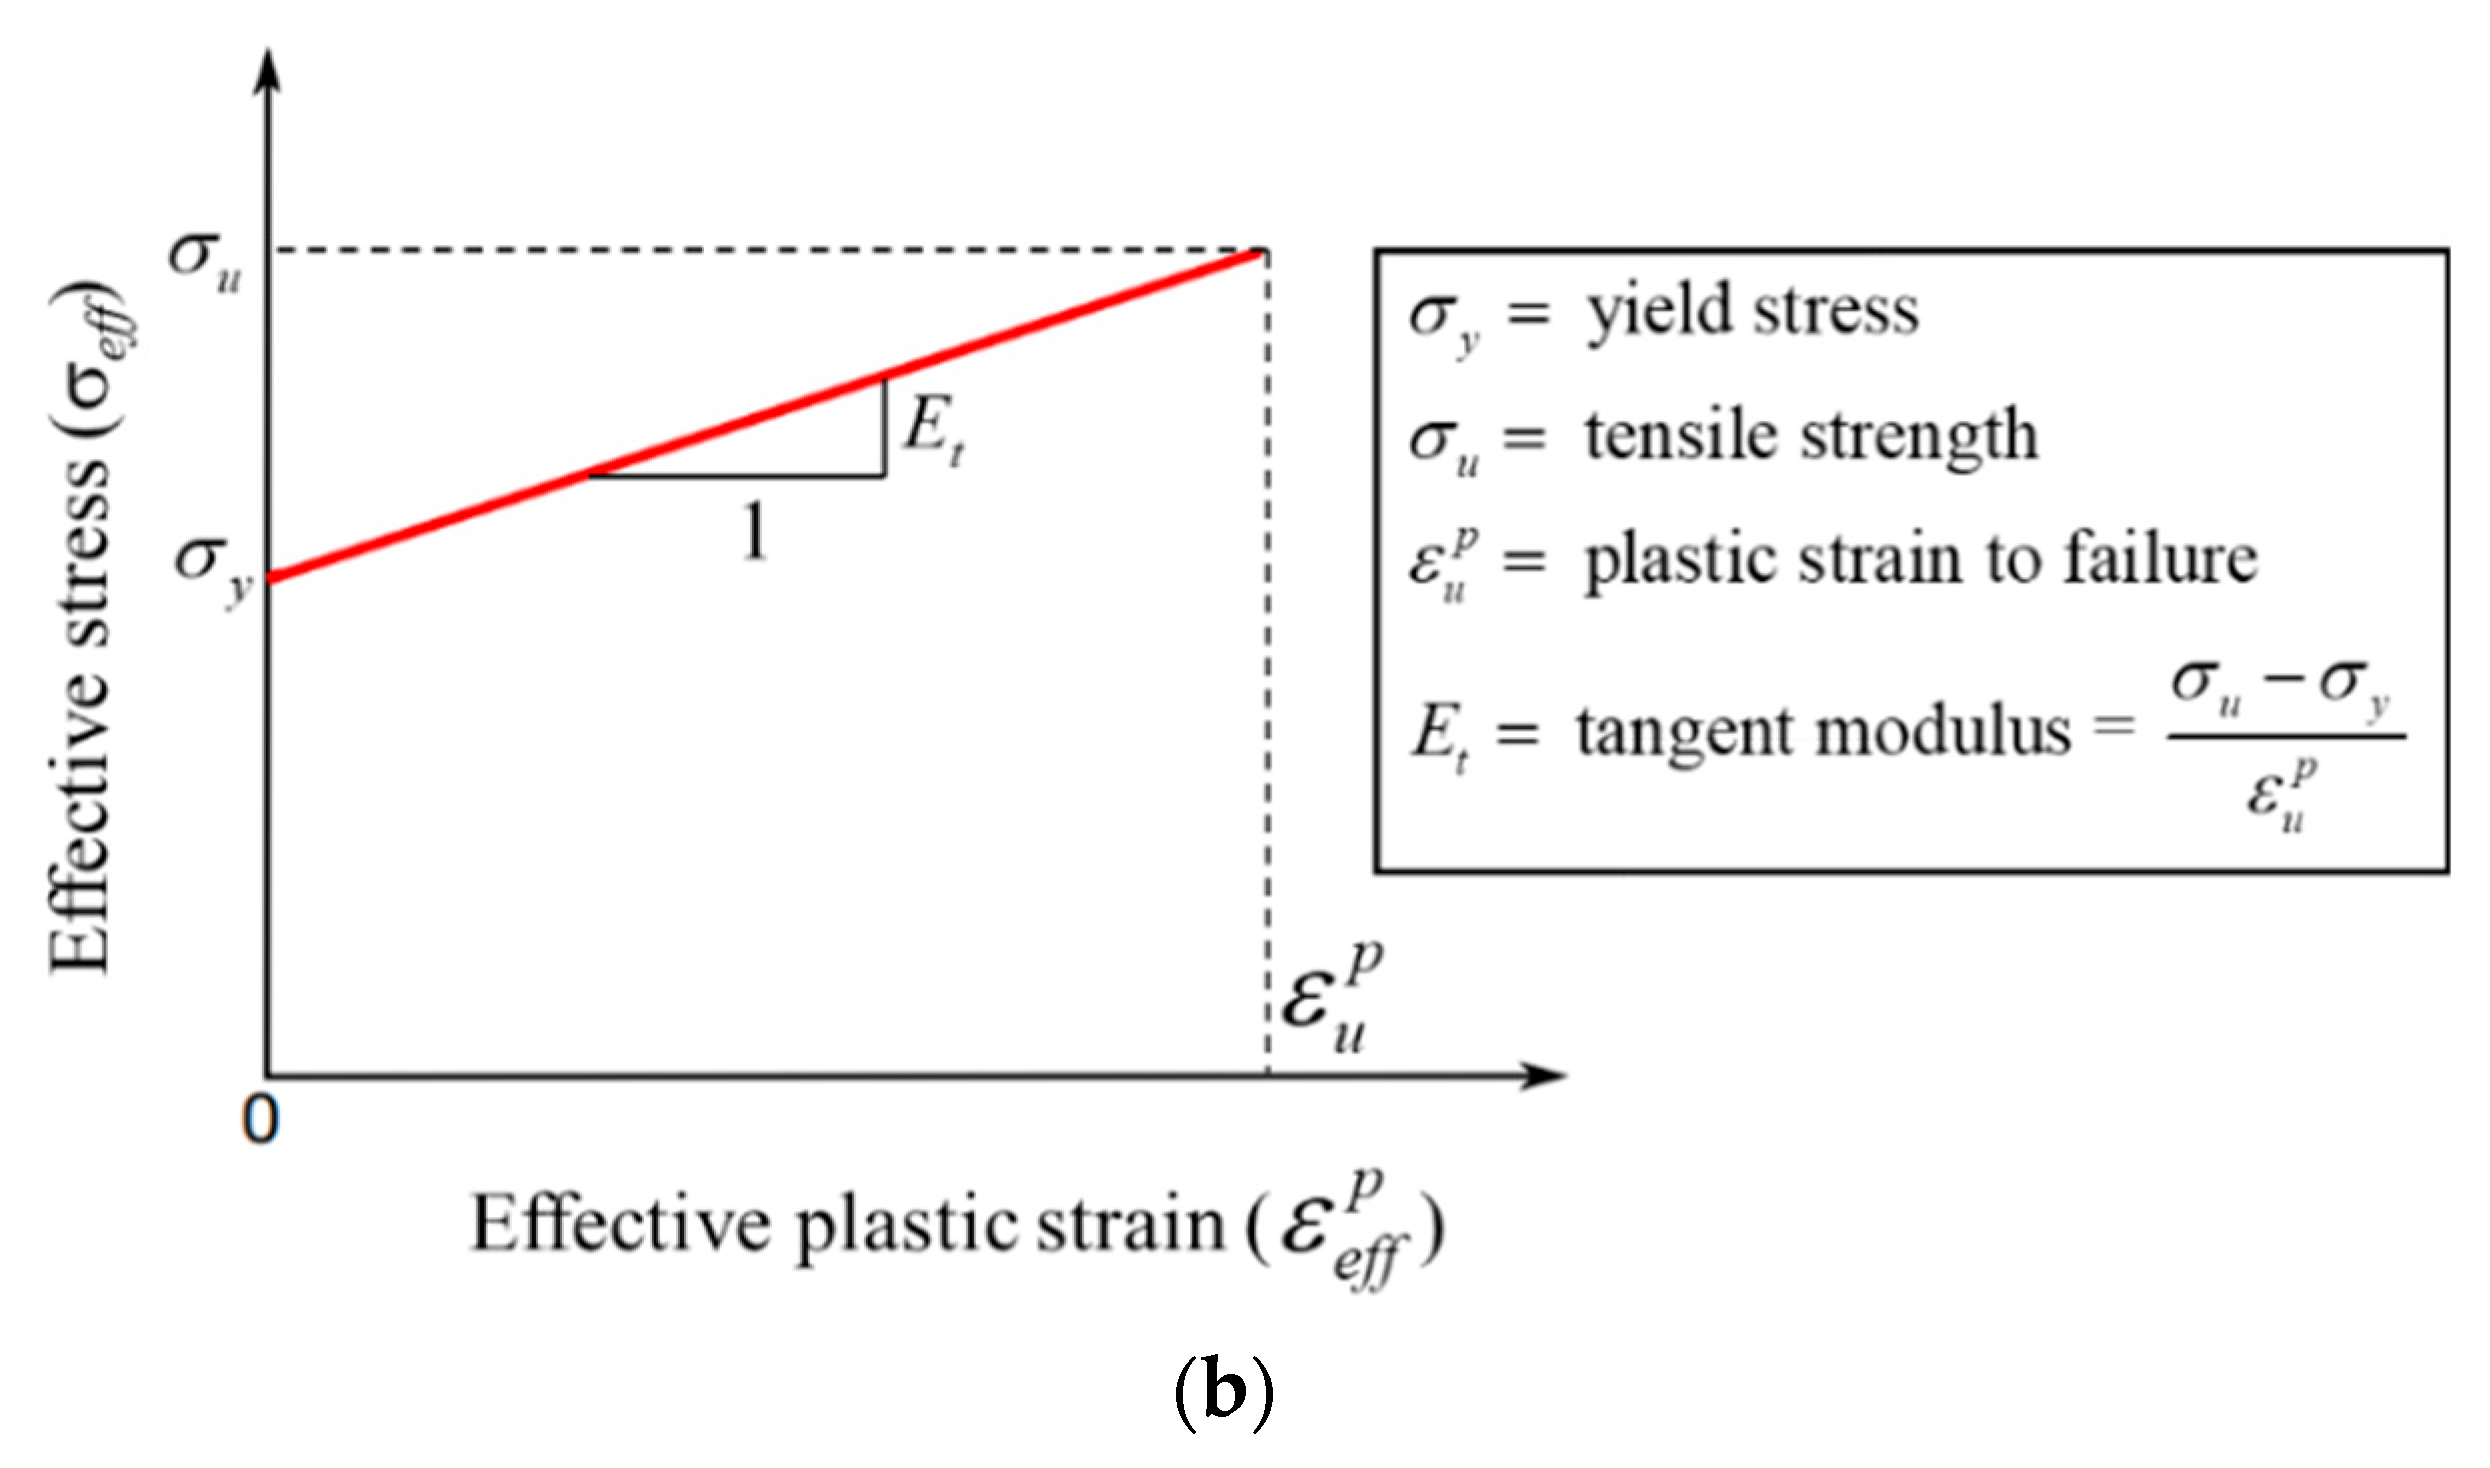
4.2. Material Modeling
Table 2 reports the vital input values of the constitutive models used in the FE analysis. The damaged concrete model type 72R3 [36,38,39,40] was used to model both concrete and mortar. Figure 12a illustrates this model, in which three individual surfaces (yield, maximum, and residual) are used to define the deviatoric strength. The modeling of steel bars, rods, and plates involved the utilization of the piecewise linear plasticity model type 24 [36], which is characterized by a bilinear stress-strain curve illustrated in Figure 12b. For the modeling of FRP sheets, the enhanced composite damage model type 54–55 [36] and the application of Chang and Chang failure criteria [41] were employed.

Figure 12.
Material models employed in the FE analysis: (a) damage model for concrete; (b) piecewise linear plasticity model for steel.
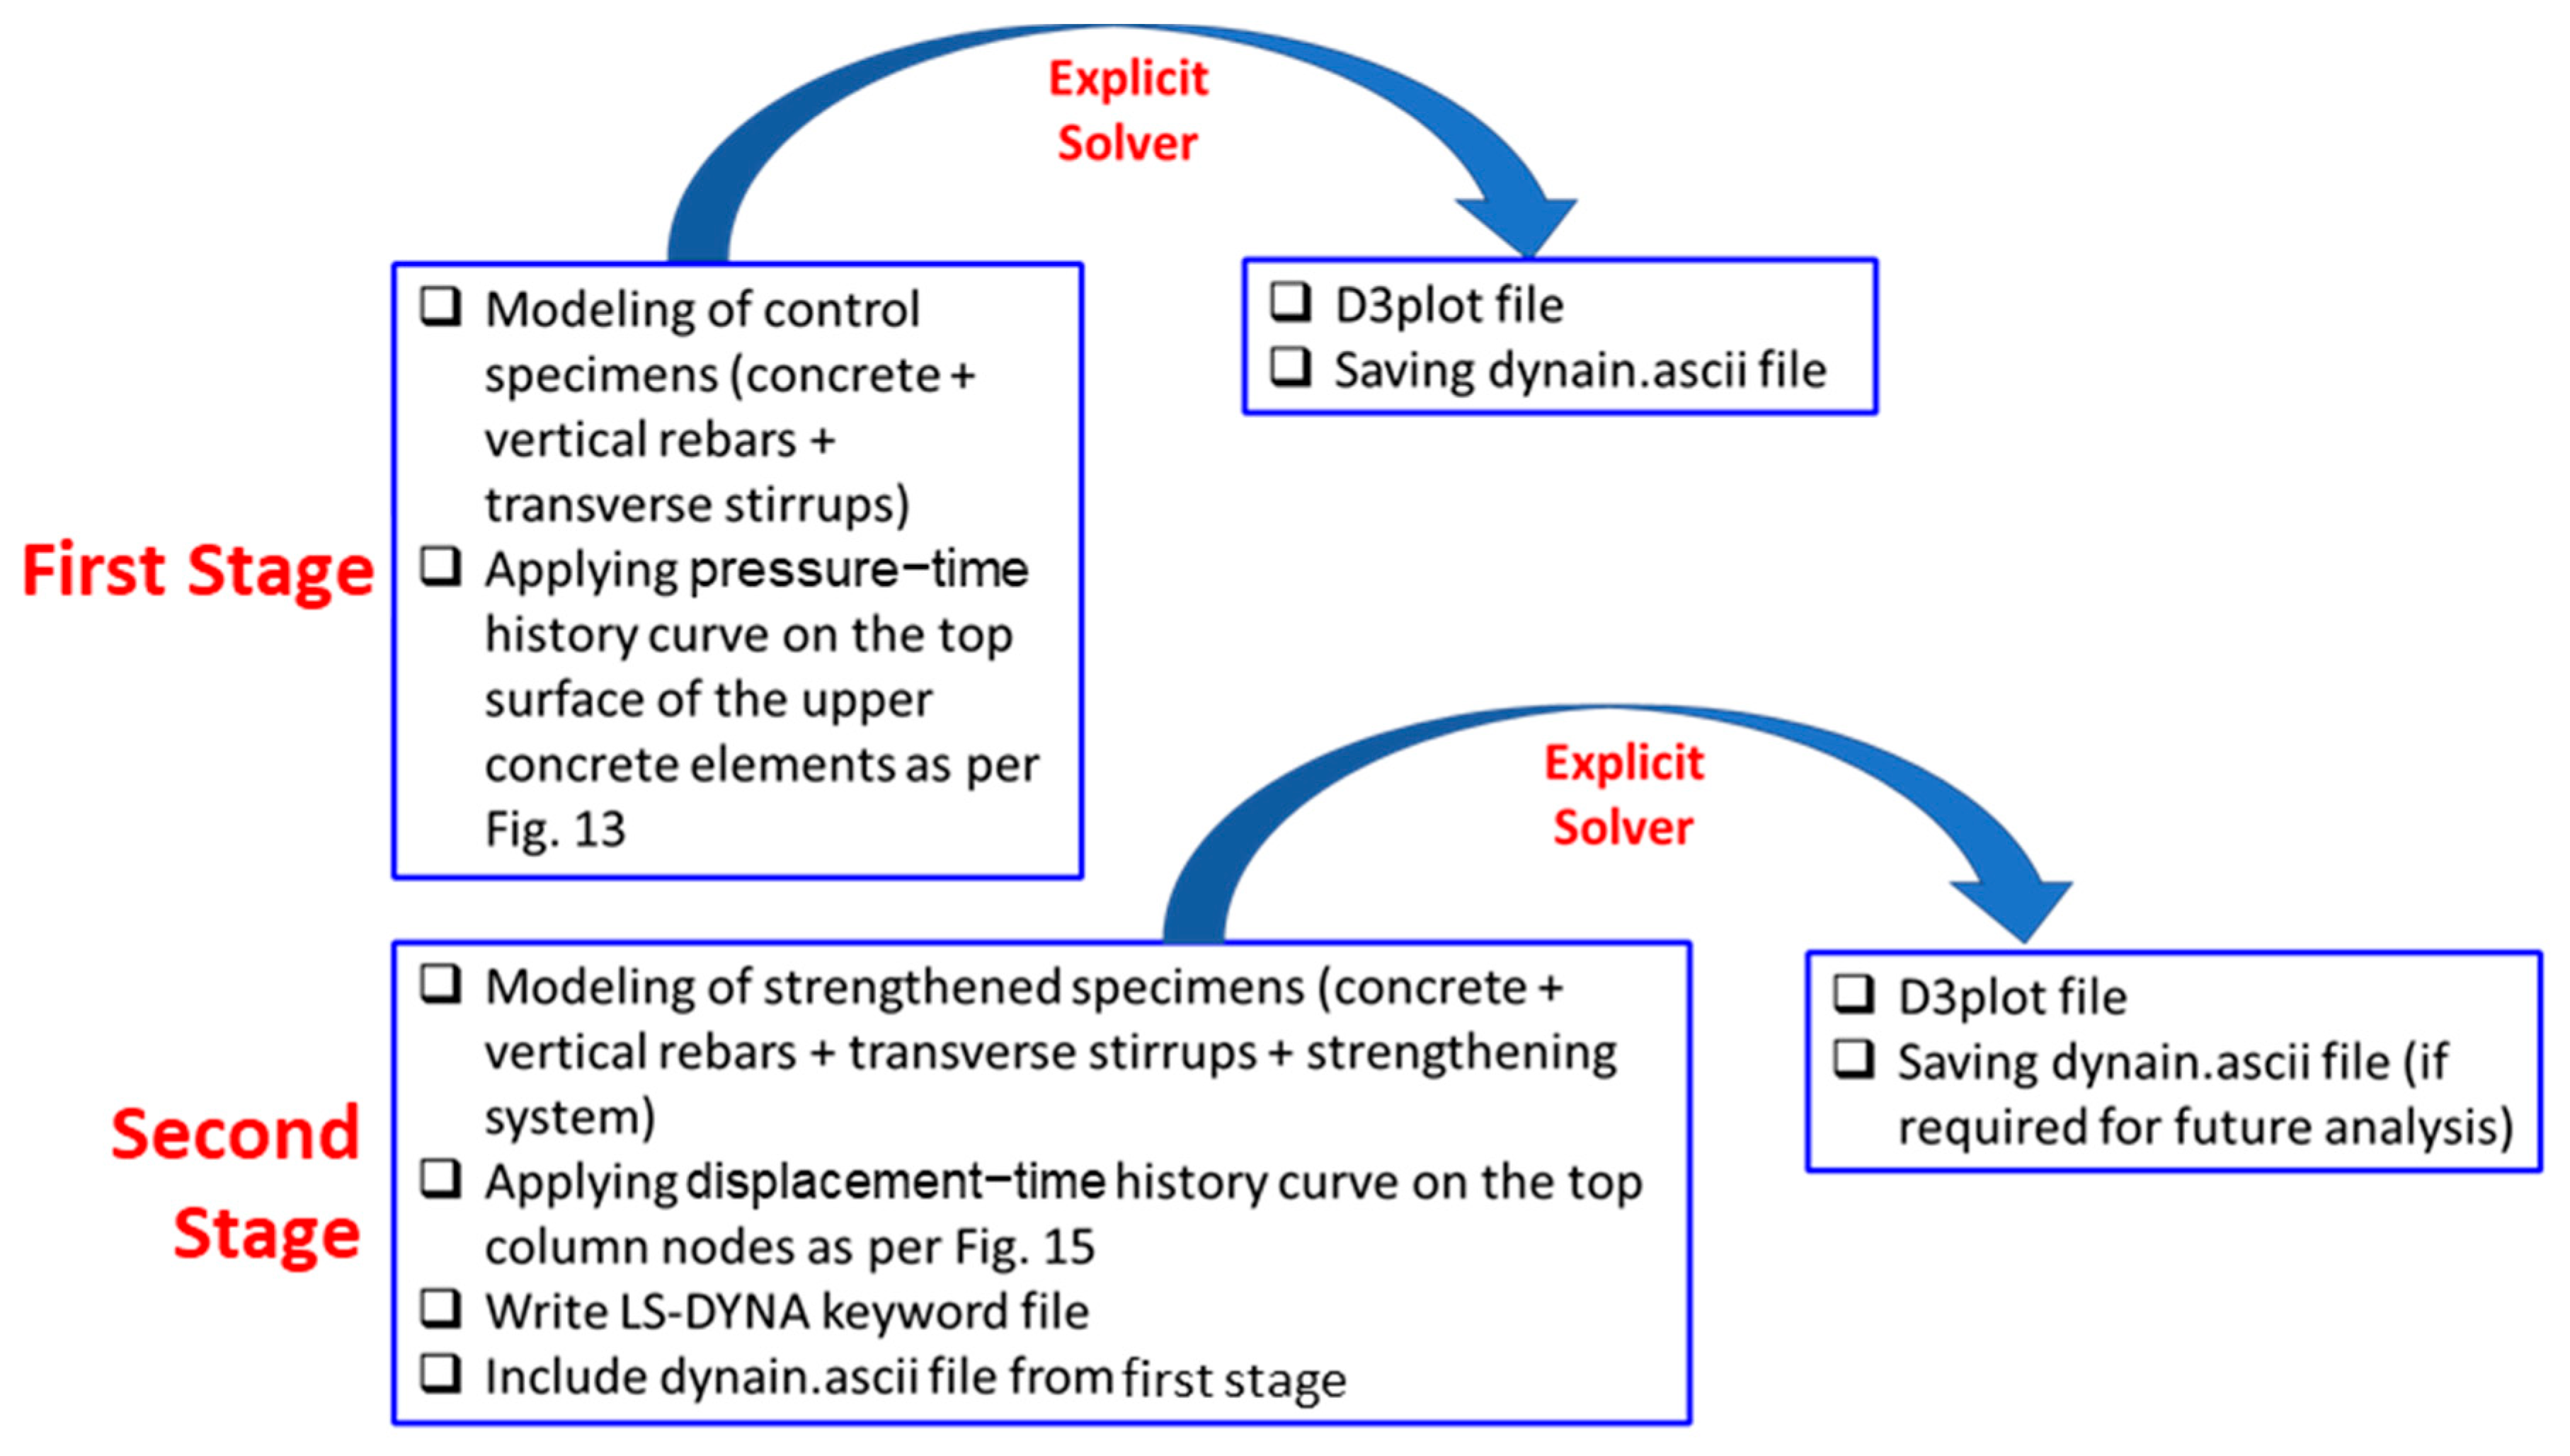
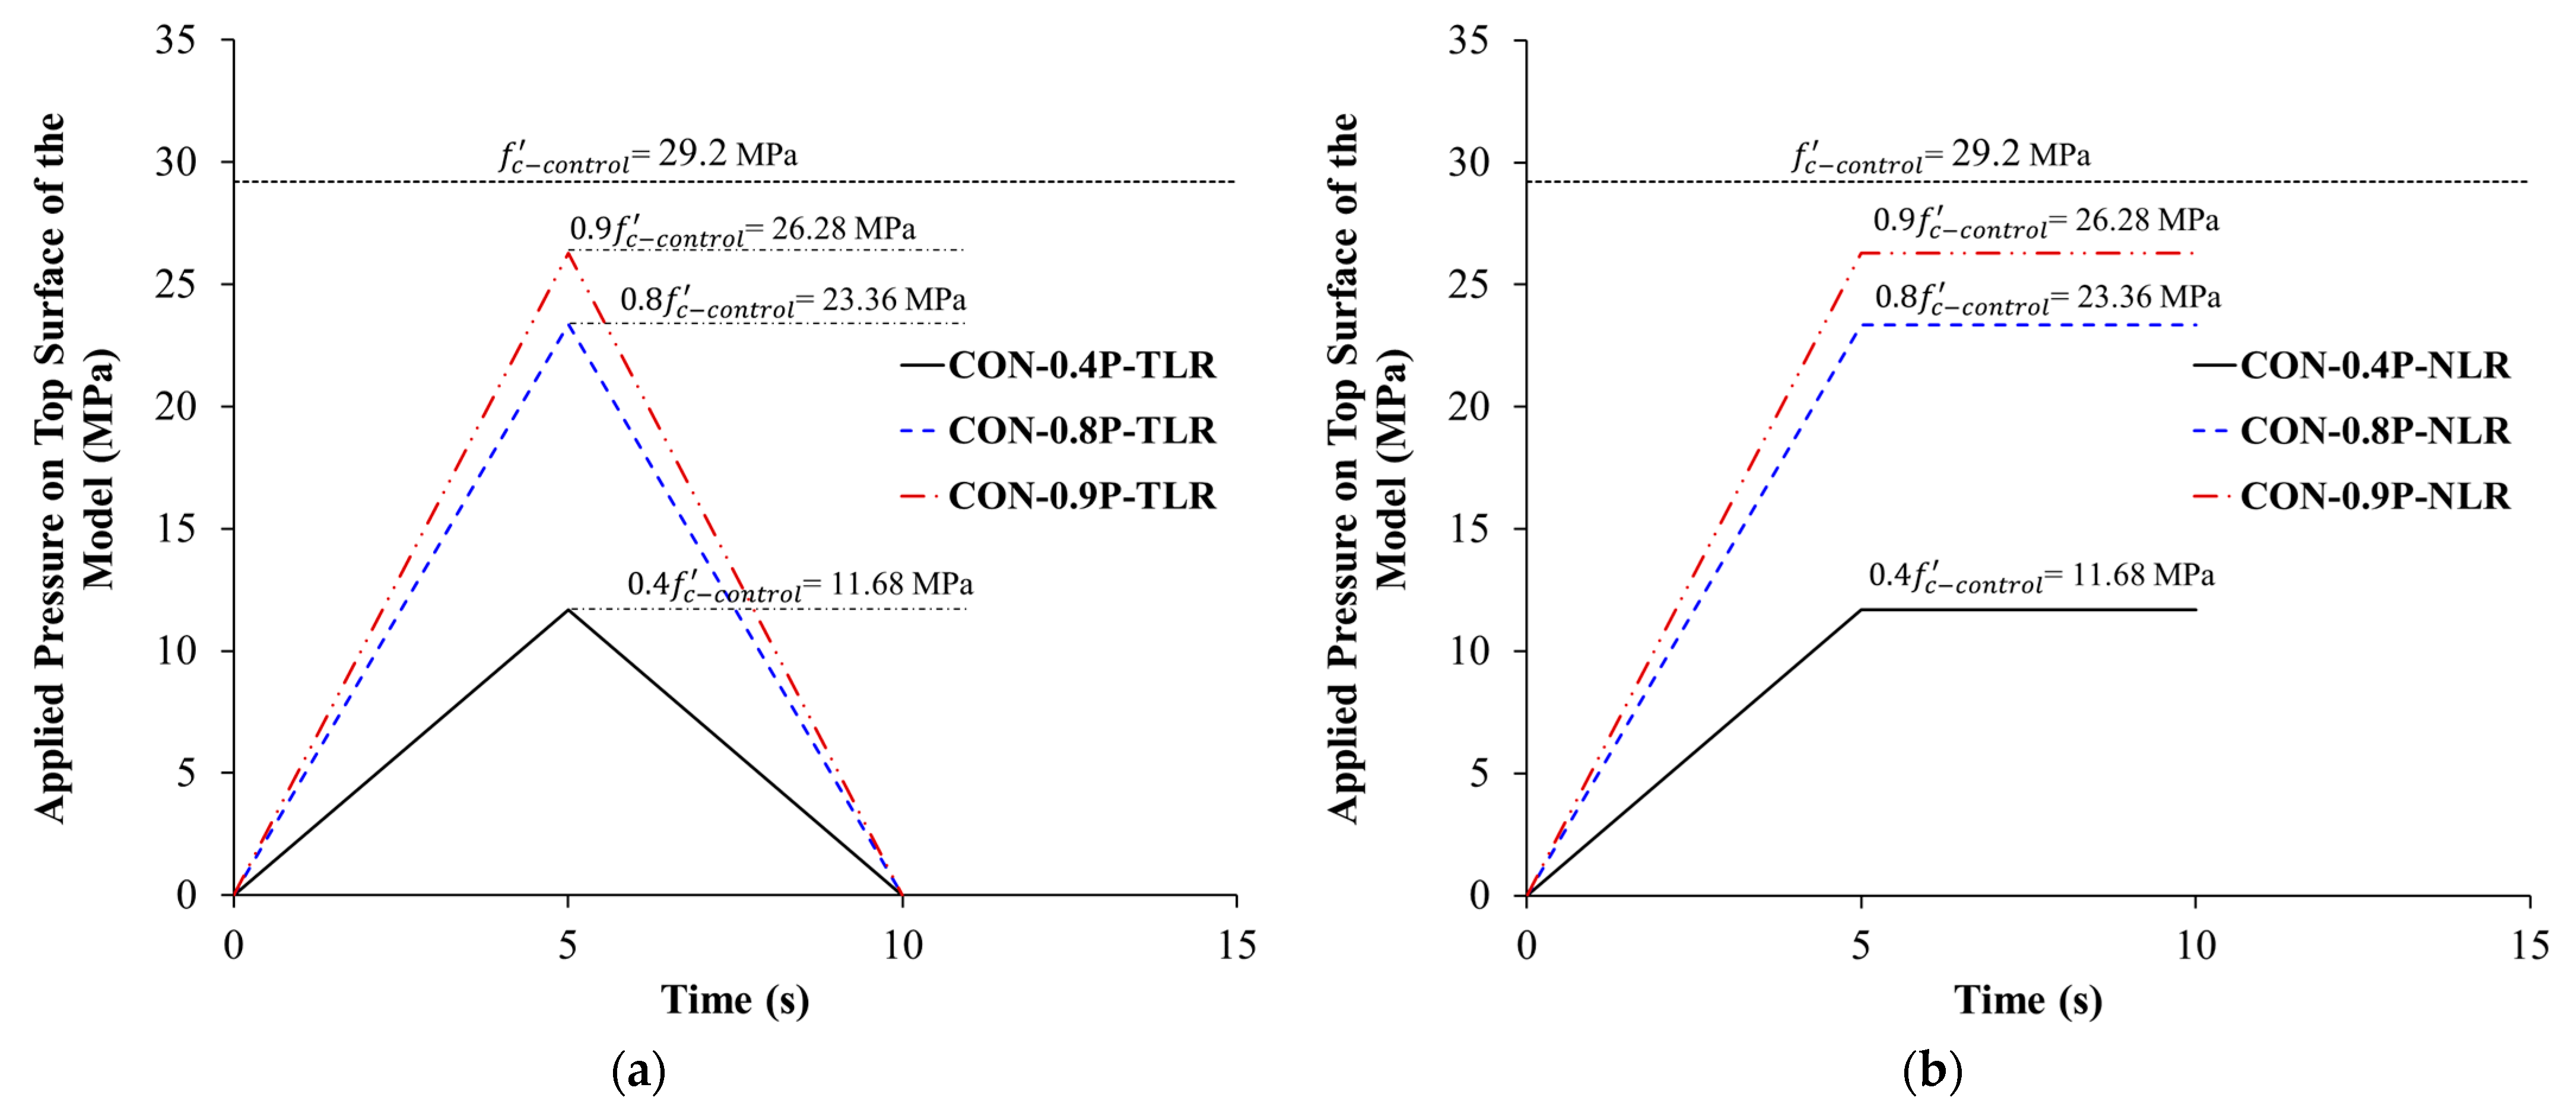
4.3. Boundary Conditions and Analysis Strategy
In setting up the boundary conditions for the column model, the lower nodes were immobilized against displacement in all three global Cartesian directions, as depicted in Figure 9, Figure 10 and Figure 11. However, the top nodes were fixed to prevent translation in the global X and Y directions while retaining freedom of movement along the Z direction, as displayed in Figure 9, Figure 10 and Figure 11. As previously noted, only a quarter of the column was modeled due to its symmetry with two planes, and the corresponding symmetry boundary conditions were applied as depicted in Figure 9, Figure 10 and Figure 11.
For control specimen CON-0.8P-TLR, surface pressure was exerted on the top nodes as per the pressure–time curve (Figure 13a). The pressure was linearly increased with time until its peak value of , where is the specified concrete strength of the control specimen (=29.2 MPa, as in Table 2). Then, the pressure was totally released at the end of the analysis (see Figure 13a). However, for strengthened specimens ST1-0.8P-TLR and ST2-0.8P-TLR, the analysis was conducted in two stages as identified in Figure 14. In the first stage, the last state in the analysis of the control specimen CON-0.8P-TLR was selected for output. The stresses in solid and beam elements were saved as ascii format (dynain.ascii file). In the second stage of analysis, the strengthened column was modeled (concrete, reinforcement cage, and strengthening system), and the displacement–time history curve shown in Figure 15 was applied to the top nodes. After that, the LS-DYNA keyword file was generated and the ascii file from the first analysis stage (dynain.ascii file) was thus included in the keyword file. The explicit solver of the software was then used to run the analysis in the time domain, and the results were then generated (see Figure 14).
Figure 13.
Pressure–time history curve used in the FE analysis of preloaded control specimens: (a) columns with total load release; (b) columns with no load release.
Figure 14.
Steps used in the FE analysis of preloaded strengthened specimens.
Figure 15.
Displacement–time history curve used in the FE analysis of specimens loaded until failure.
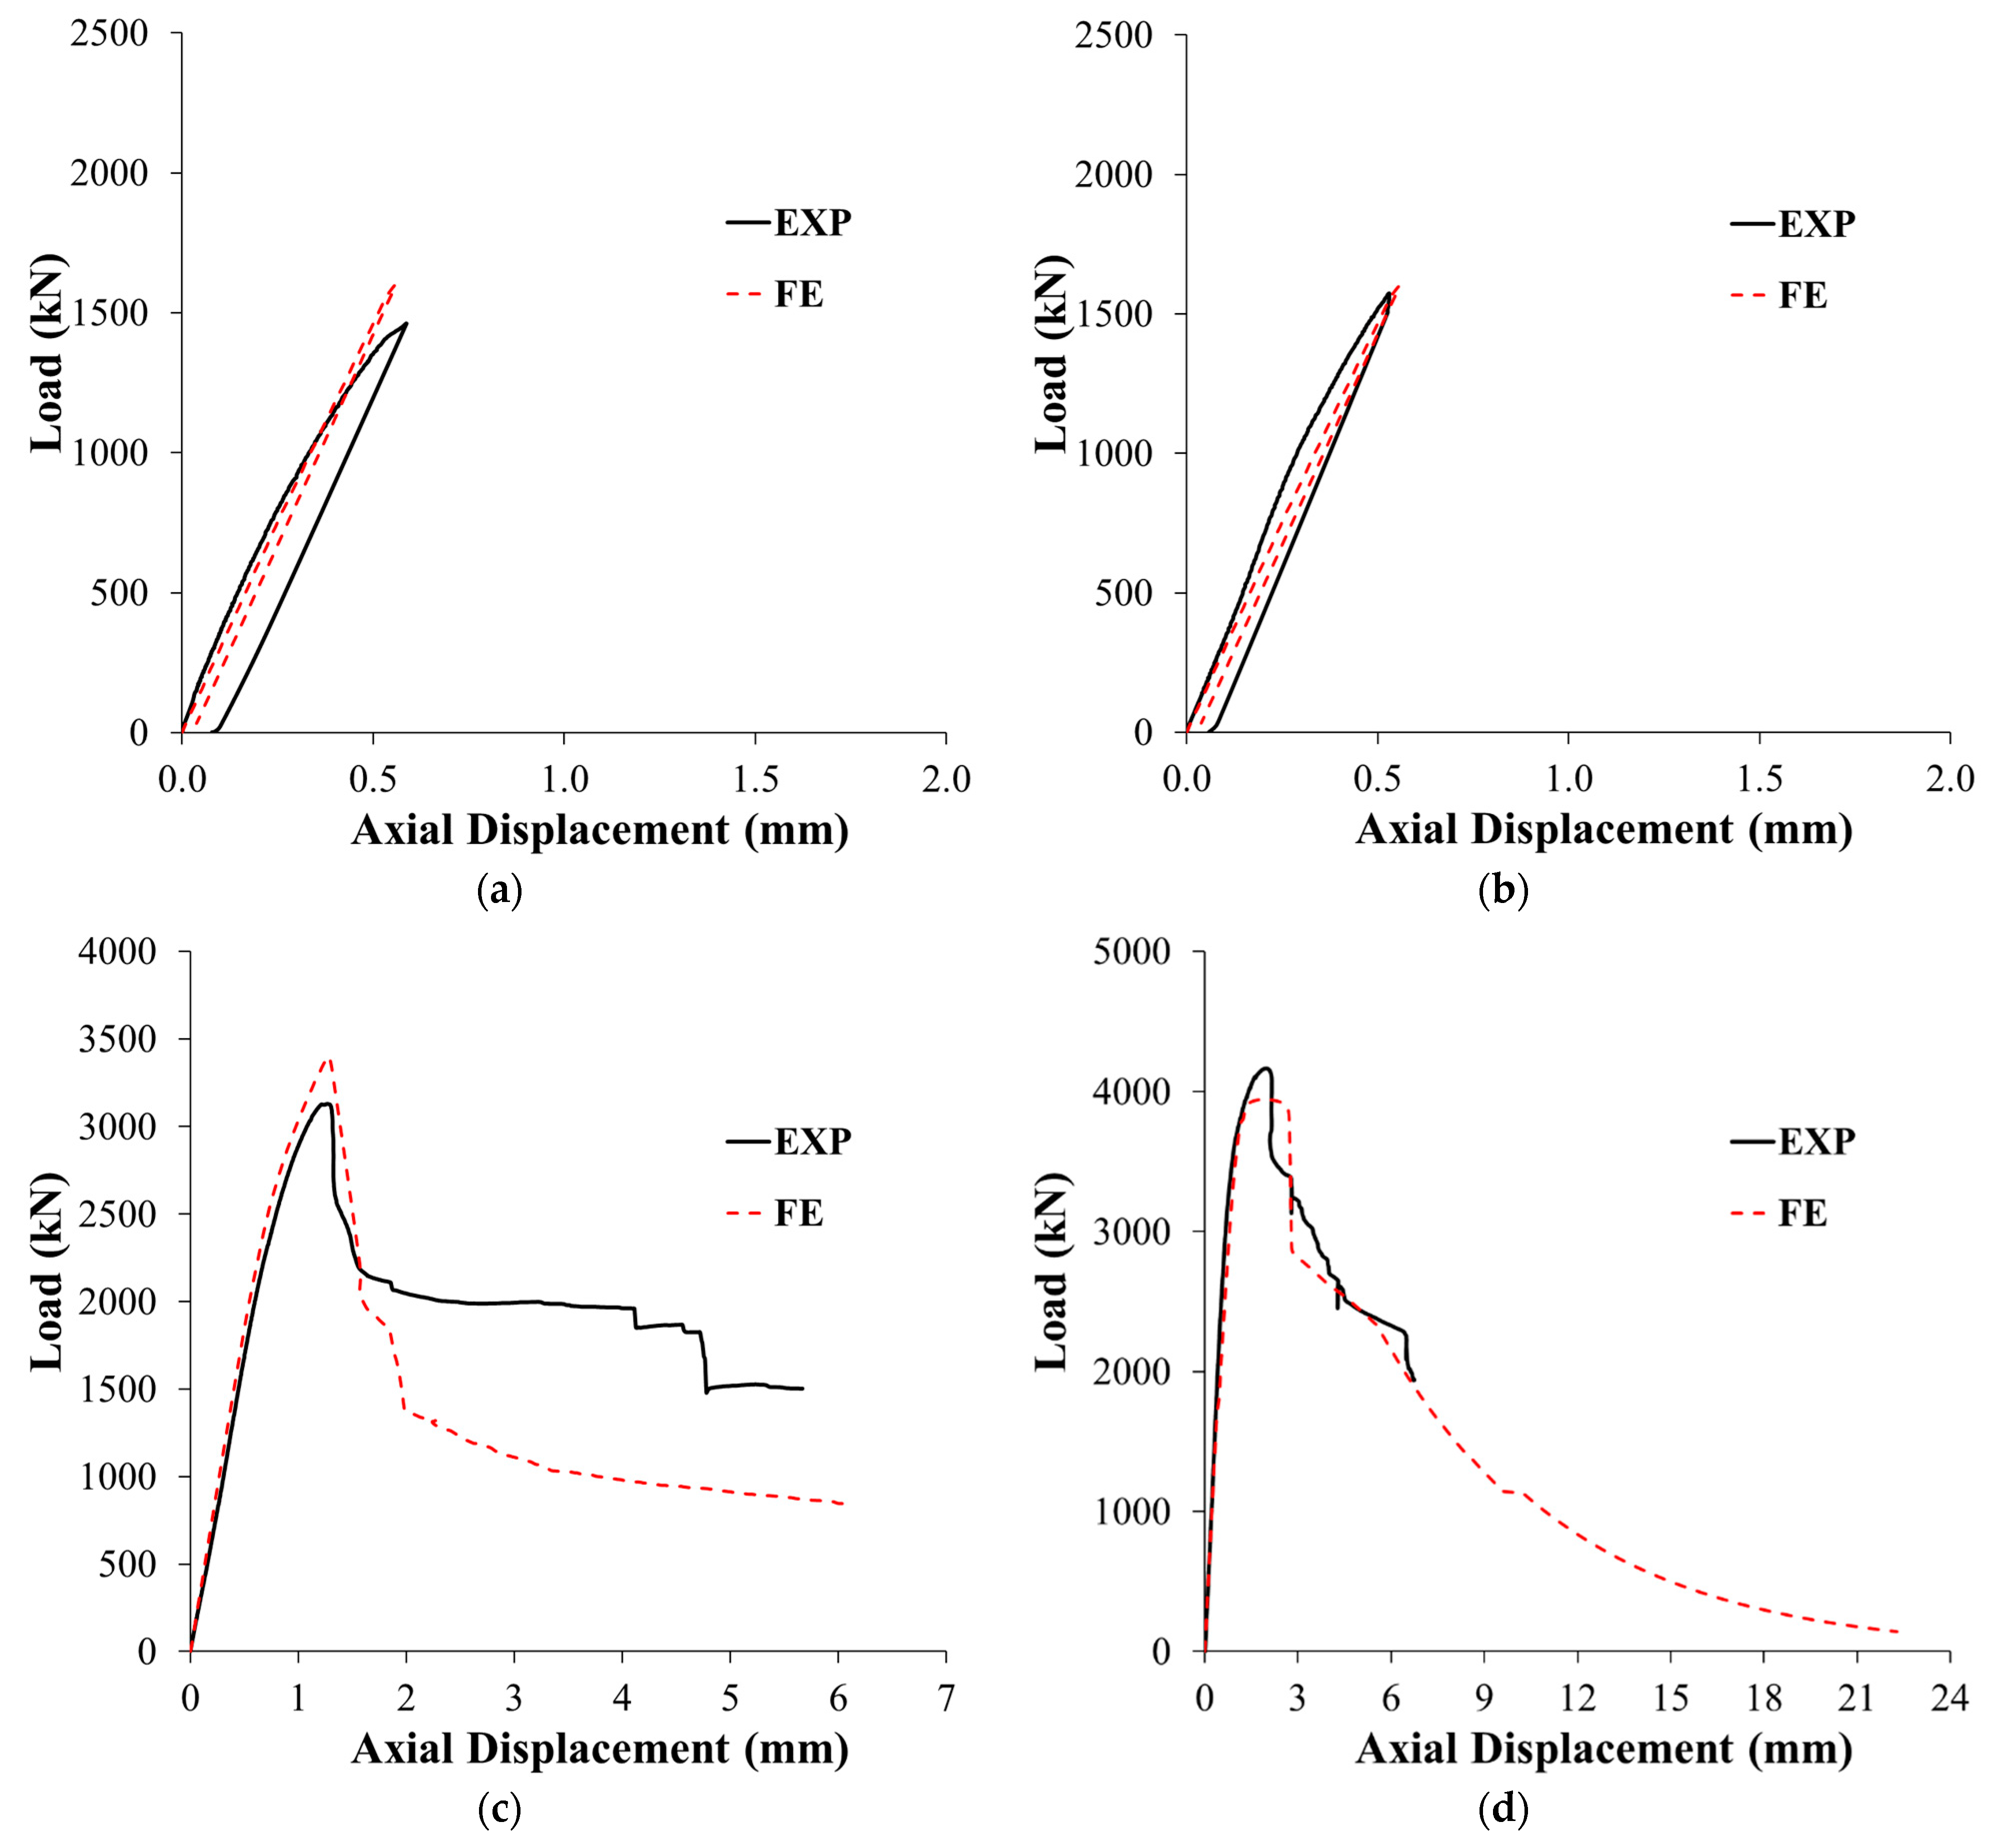
4.4. Finite Element Results
Table 3 and Table 4 list, respectively, the comparison between the FE and experimental findings of the eight specimens of the test matrix with regard to load-displacement and stress-strain responses. It should be stated that even though specimens CON1, CON2, ST1, and ST2 were analyzed in previous studies [24,25], their FE results are shown in Table 3 and Table 4 for the sake of comparison with specimens of this study. In Table 3, the comparative outputs are service, yield, and peak loads along with their respective displacements, ultimate displacement, stiffness at service load, and dissipated energy. Given in Table 3 are also the tested-to-numerical ratios of load-displacement parameters. For the FE estimation of service, yield, and peak loads, the errors in their prediction ranged from 6% to 8%, 3% to 9%, and 6% to 9%, respectively. However, the prediction errors of displacement at service, yield, and peak loads varied from 10% to 14%, 9% to 18%, and 5% to 6%, respectively. For ultimate displacement, the prediction errors were 10% to 18%. The errors in predicting the secant stiffness and dissipated energy were 11% to 16% and 9% to 11%, respectively. The comparative outputs in Table 4 are maximum average concrete strength (prediction errors varied from 6% to 9%), maximum actual concrete strength (errors were 8% to 12%), strain in concrete at maximum stress (errors varied from 2% to 6%), ultimate strain in concrete (errors ranged from 10% to 18%), strain in original bars at maximum load (errors were 10% to 19%), strain in NSM rebars at maximum load (errors were 9% to 10%), maximum horizontal strain in FRP sheets (errors were 14% to 19%), and maximum horizontal strain in steel plates of specimen ST2-0.8P-TLR (error was 11%). The FE results of the specimens analyzed in this study (CON-0.8P-TLR, ST1-0.8P-TLR, and ST2-0.8P-TLR) are discussed below. However, discussions of the FE results of other specimens listed in Table 3 and Table 4 are given elsewhere [24,25].
4.4.1. Failure Pattern
Figure 16a displays the failure pattern at peak load level for control specimen CON-0.8P-TLR with respect to effective plastic strain contours for concrete elements (representing the damage level), and it varied from zero (no damage) to 2 (full damage). As identified from the figure, no damage was predicted in any of the concrete elements at peak load level, which comes in reasonably close agreement with the test results shown previously in Figure 7a. Displayed in Figure 16b are the axial stress contours for the reinforcement cage of control specimen CON-0.8P-TLR at peak load level. The peak predicted compressive stress in the vertical rebars was about 431 MPa, which indicates no yielding occurred. This confirms the predicted compressive strain in vertical steel rebars at maximum load (=0.0022) reported in Table 4. It should be noted that the predicted failure patterns of specimen CON-0.8P-TLR are different from control specimens CON1 and CON2 (previously modeled in Refs. [24,25]), which have been loaded until failure. In these two specimens, the failure occurred due to concrete crushing and buckling of the main steel bars in the central 600 mm length of the column. This clarifies that even though column CON-0.8P-TLR was loaded to 80% of its peak load, this was not enough to initiate concrete crushing and/or yielding of main steel rebars.
Figure 16.
FE failure pattern at peak load of control specimens CON1-0.8P-TLR and CON2-0.8P-TLR: (a) concrete damage contours; (b) axial stress contours for steel rebars.
The FE failure patterns of strengthened column ST1-0.8P-TLR are shown in Figure 17. These patterns are illustrated in terms of contours depicting effective plastic strain (or damage) for concrete elements, axial stress for the reinforcement cage and NSM bars, and circumferential stress for CFRP sheets. The FE failure patterns shown in Figure 17 match well with the test observations shown previously in Figure 7b. This affirms the validity of the FE modeling approach.
Figure 17.
FE failure pattern of preloaded strengthened specimen ST1-0.8P-TLR: (a) damage contours showing bulging of CFRP sheets at peak load; (b) damage contours showing concrete crushing at end of analysis; (c) axial stress contours showing buckling of longitudinal rebars at end of analysis; (d) axial stress contours showing buckling of NSM rebars at end of analysis; (e) X-stress contours showing rupture of CFRP sheets at end of analysis.
The initial failure of the column was characterized by the bulging of the CFRP sheets in the lower section of the central 600 mm length of the specimen, resulting in a sudden drop in the specimen’s load-bearing capacity. The ultimate failure occurred in the lower part of the 600 mm length of the column and was attributed to concrete damage, followed by the buckling of both the original and NSM bars. As the column’s displacement increased, the CFRP layers ruptured at the column corner (see Figure 17e). This rupture was further confirmed by the finite element analysis, which indicated that the maximum horizontal strain in the CFRP layers, as reported in Table 4, closely matched the fracture strain of the CFRP sheets.
The finite element (FE) failure pattern for specimen ST2-0.8P-TLR is depicted in Figure 18. As observed, the failure initiation occurred with the bulging of the GFRP jacket in the mid-height zone of the column, situated between the bolted steel plates. Ultimately, the failure was because of the buckling of both column bars and NSM rebars, and it was succeeded by fracture of the GFRP sheets at the section corner (see Figure 18f). This shows that the FE failure pattern matches closely with the experimental failure mode of the column depicted in Figure 7c. It was also affirmed by the estimated peak strain of the GFRP sheets reported in Table 4 (which was close to the fracture limit).
Figure 18.
FE failure pattern of preloaded strengthened specimen ST2-0.8P-TLR: (a) damage contours showing bulging of GFRP sheets at peak load; (b) damage contours showing concrete crushing at end of analysis; (c) axial stress contours showing buckling of longitudinal rebars at end of analysis; (d) axial stress contours showing buckling of NSM rebars at end of analysis; (e) X-stress contours in steel plates at end of analysis; (f) X-stress contours showing rupture of GFRP sheets at end of analysis.
It is worth mentioning here that the FE failure patterns of specimens ST1-0.8P-TLR and ST2-0.8P-TLR are comparable to the predicted failure modes of their counterparts ST1 and ST2 (previously modeled in Refs. [24,25]), which have not been preloaded. However, the locations of concrete crushing, rebar buckling, and FRP rupture differ in the comparable specimens. Due to preloading, more deformation and concrete plastic strain were noticed in specimens ST1-0.8P-TLR and ST2-0.8P-TLR compared to their counterparts ST1 and ST2.
4.4.2. Load-Displacement Plots
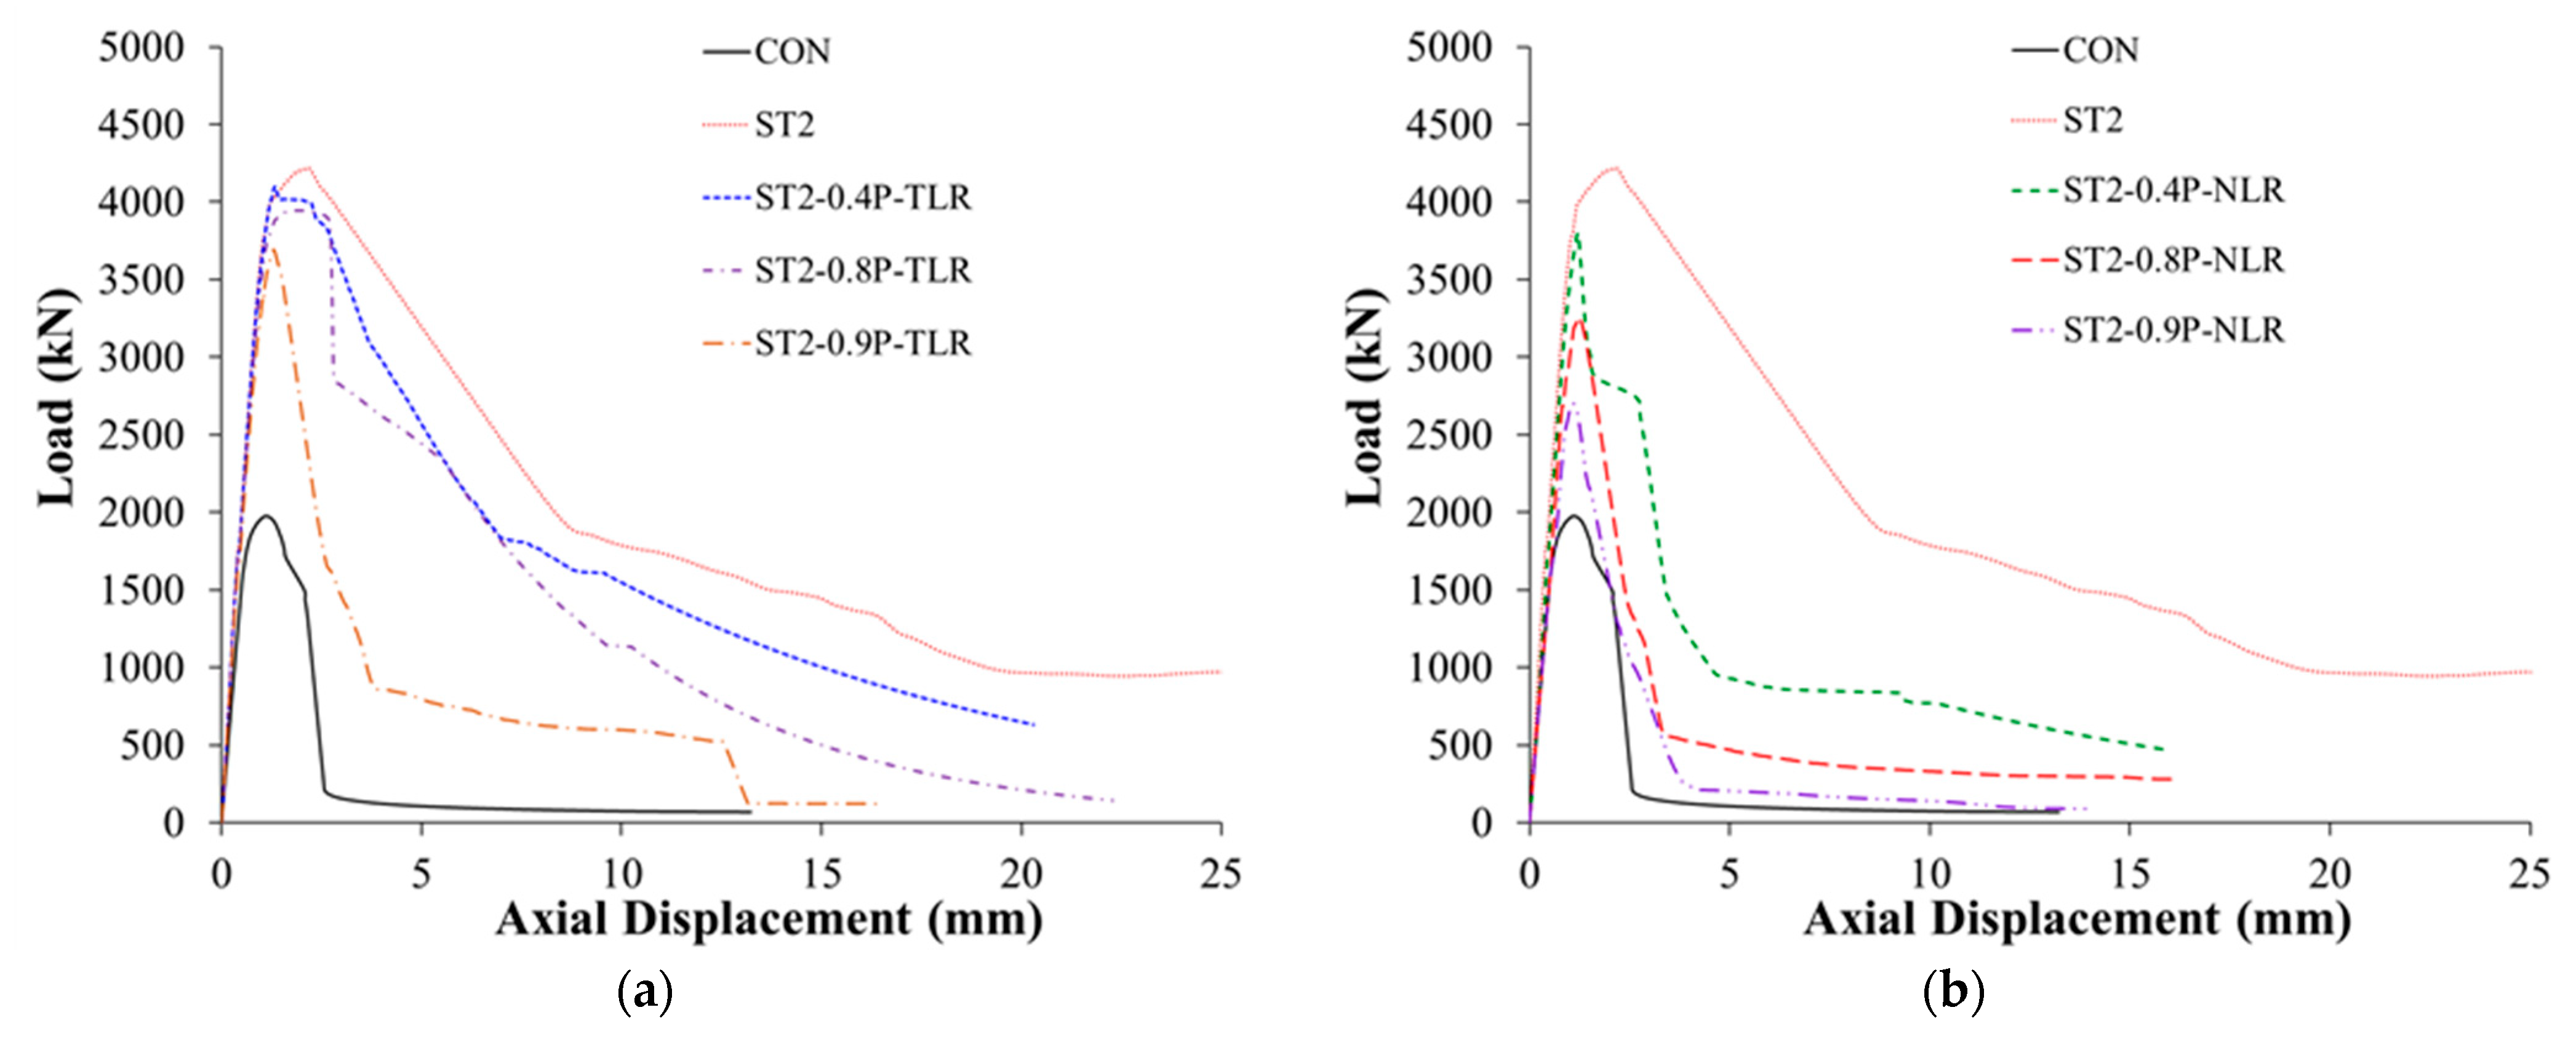
Figure 19 illustrates the difference between the load-displacement plots obtained from the experimental data and the finite element (FE) simulations for the four tested columns. A good match was found between the two curves for both control and strengthened columns. Precisely predicted was also the post-peak portion of the load-displacement plot of the upgraded specimens. This calibrates the models used for different materials.
Figure 19.
Tested versus predicted load-displacement curves for: (a) CON1-0.8P-TLR, (b) CON2-0.8P-TLR; (c) ST1-0.8P-TLR; (d) ST2-0.8P-TLR.
As depicted in Table 3 and Figure 19c, strengthened specimen ST1-0.8P-TLR was assessed as having an enhancement in its peak load of about 72% with regard to the control columns CON1 and CON2. Moreover, the FE ultimate load for specimen ST1-0.8P-TLR (=3400 kN) is about 92% of its counterpart column ST1 (with the same strengthening scheme without preloading).
Figure 19d and Table 3 clarify that the peak predicted load of strengthened specimen ST2-0.8P-TLR was 3943 kN, which is higher than the predicted peak load of reference columns CON1 and CON2 by about 100%. It is also predicted that this strengthening configuration is better than the first scheme, as the FE response parameters of column ST2-0.8P-TLR with regard to peak load, ultimate displacement, secant stiffness, and dissipated energy were significantly more than specimen ST1-0.8P-TLR by about 16%, 231%, 18%, and 332%, respectively. The FE analysis concluded that the second retrofitting scheme is considerably superior to the first scheme in practical scenarios where the unstrengthened wall-like RC column is preloaded to 80% of its peak load and then fully unloaded.
When comparing the key FE load-displacement findings of the two strengthened specimens ST1-0.8P-TLR and ST2-0.8P-TLR with their counterparts ST1 and ST2 (previously modeled in Refs. [24,25]), it is identified that preloading reduced the response parameters. Owing to preloading, the peak load of specimens ST1-0.8P-TLR and ST2-0.8P-TLR was reduced by 8% and 6%, respectively, with respect to their counterparts ST1 and ST2. The secant stiffness of specimens ST1-0.8P-TLR and ST2-0.8P-TLR was also reduced by 8% and 12%, respectively, when compared with their counterparts ST1 and ST2. Additionally, compared with columns ST1 and ST2, the dissipated energy of specimens ST1-0.8P-TLR and ST2-0.8P-TLR, in turn, was reduced by 7% and 16%.
In summary, the conducted FE analysis predicted well the load-displacement behavior of preloaded RC wall-like columns after being retrofitted with different techniques. These numerical models are now validated and can be further used to study more parameters of practical interest, as will be detailed in the following section.
5. Parametric Study
The numerical models were then utilized to explore the impact of key parameters such as percent of preloading and amount of load release on the axial behavior of strengthened columns. The FE analysis matrix used for the parametric study is shown in Table 5. Since the second strengthening scheme had superior performance to the first one, it was employed in this study. As depicted in Table 5, the analysis matrix included three different percentages of preloading (40%, 80%, and 90% of the peak load of the unstrengthened column). The 40% preloading was selected to represent the service load, and the 90% preloading was nominated to simulate preloading close to the axial load capacity of the unstrengthened specimen. In half of the preloaded specimens, the load was totally released; and in the other half, the load was sustained without releasing. The former case was selected to represent the case of full shoring of the column before strengthening; however, the latter case stands for the worst-case scenario of no shoring prior to column strengthening. In the designation of column specimens listed in Table 5, the same symbols used previously in Table 3 were utilized as detailed in Section 2.1. Also, the symbol “NLR” used in Table 5 stands for preloaded columns with no load release. It should be reported that specimens CON and ST2 that were previously modeled in Ref. [25] were included in the analysis matrix (Table 2). Altogether, the FE matrix used in the parametric study incorporated seven control specimens and seven strengthened columns. In the preloaded control specimens CON-0.4P-TLR, CON-0.8P-TLR, and CON-0.9P-TLR, the load was totally released after reaching its peak value, and the pressure–time history curves used in the analysis are shown in Figure 13a. Nevertheless, in the preloaded control columns CON-0.4P-NLR, CON-0.8P-NLR, and CON-0.9P-NLR, the load was sustained without release after reaching its peak value, and the pressure–time history plot used in the models is illustrated in Figure 13b. As identified previously, the FE analysis of the preloaded strengthened specimens was conducted in two stages, as explained earlier in Figure 14, and the specimens were analyzed under the displacement–time history plot shown in Figure 15.
Table 5.
FE analysis matrix used in the parametric study.
A summary of the key FE results for the specimens of the parametric study is reported in Table 6. These results incorporated the main load-displacement parameters such as yield and maximum loads and their corresponding displacement, ultimate displacement, secant stiffness, and dissipated energy. Also included in Table 6 are the ultimate concrete strain and strain in main vertical steel rebars at peak load. Figure 20a,b presents comparisons between the FE load against displacement plots for columns with total load release and columns with no load release, respectively. It is clarified from Figure 20 and Table 6 that for the same amount of load release, the parameters of the load-displacement response of the strengthened specimens without preloading (ST1 and ST2) are higher than all their preloaded counterparts. Also, for the preloaded strengthened specimens, the load-displacement response was improved with the reduction of percent of preloading.
Table 6.
Key FE outputs for specimens of the parametric study.
Figure 20.
FE load-displacement curves for columns employed in parametric study: (a) columns with total load release; (b) columns with no load release.
Figure 21 shows the effect of the percent of preloading on the percent increase in the response parameters due to strengthening (compared with the unstrengthened specimen CON). These response parameters included peak load, secant stiffness, and dissipated energy. It is noted that for all response parameters, as the percent of preloading increased, the percent increase due to strengthening decreased, and the decrease in the case of no load release was more than the case of total load release.
Figure 21.
Effect of preloading on percent increase in response parameters due to strengthening for columns employed in parametric study: (a) peak load; (b) axial stiffness; (c) dissipated energy.
As seen in Figure 21a, as the percent of preloading increased from zero (specimen ST2) to 90%, the percent increase in peak load due to strengthening was significantly reduced from 113% to 87% and 37% for the cases of total load and no load releases, respectively. Also, Figure 21b illustrates that as the percent of preloading increased from zero to 90%, the percent increase in secant stiffness decreased considerably from 57% to 30% and 1% for the cases of total load and no load releases, respectively. Moreover, the increase in the dissipated energy due to strengthening decreased significantly from 551% to 101% and 21% (for total load and no load releases, respectively) as the percent of preloading increased from zero to 90%, as presented in Figure 21c.
Figure 22 illustrates the impact of preloading on the reduction in peak load, stiffness, and dissipated energy for strengthened specimens. Compared with the strengthened specimen without preloading (ST2), as the percent of preloading increased, the reduction in the response parameters of the retrofitted specimens increased. For the case of total load release, as the percent of preloading increased from 40% to 90%, the reduction in peak load, secant stiffness, and dissipated energy was enhanced from 3% to 12%, 7% to 17%, and 13% to 69%, respectively. However, for the case of no load release, the loss in maximum load, stiffness, and energy dissipated increased from 10% to 36%, 23% to 36%, and 62% to 81%, in turn.
Figure 22.
Effect of preloading on percent reduction in response parameters for columns employed in parametric study: (a) peak load; (b) axial stiffness; (c) dissipated energy.
Figure 23 presents the influence of the unrelease of preloading on the percent reduction in response parameters for strengthened specimens. Compared with preloaded strengthened columns with total load release, the unrelease of preloading increased the reduction in peak load from 7% to 17% and 27% as the preloading increased from 40% to 80% and 90%, respectively, as presented in Figure 23a. Similarly, the unrelease of preloading increased the loss in stiffness from 17% to 22% and 23% when the preloading increased from 40% to 80% and 90%, respectively (see Figure 23b). The same trend was not found in the dissipated energy since the unrelease of preloading increased its reduction from 56% to 71% as the preloading increased from 40% to 80%. However, as the preloading increased further to 90%, the loss in dissipated energy due to unrelease of preloading decreased to 40%, as depicted in Figure 23c.
Figure 23.
Effect of unrelease of preloading on percent reduction in response parameters for columns employed in parametric study: (a) peak load; (b) axial stiffness; (c) dissipated energy.
From the parametric study conducted in this research, it is ultimately concluded that even with the worst-case scenario of unstrengthened RC wall-like columns preloaded with 90% of their axial resistance without releasing the load, their strengthening using the second scheme is efficient at enhancing the load-displacement characteristics. Compared with the unstrengthened column, the upgrading scheme in such a case improved the peak load and dissipated energy by 37% and 21%; however, it almost retained the axial secant stiffness of the column.
The novelty of this research is generated from the fact that columns tested and modeled in this study simulated the actual practice in which the unstrengthened columns bear their load, and if retrofitting is necessary, the load is released before the upgrade. However, prior research studies on strengthening RC wall-like columns [20,21,22,23,24,25] overlooked this real-world scenario. For columns tested in Ref. [20], the studied strengthening scheme enhanced the peak load by 24%. In Ref. [21], the peak load enhancement in RC wall-like columns owing to strengthening varied from 29% to 119%. For the wall-like columns investigated by Abbas et al. [22], the peak load enhancement due to strengthening ranged from 30% to 43%. The peak load enhancements for the wall-like columns tested in Refs. [23,24] varied from 27% to 80%. Lastly, strengthening schemes explored by Elsanadedy et al. [25] enhanced the peak load of RC wall-like columns by 34% to 126%. In conclusion, it was proven in previous research on RC wall-like columns without preloading that different strengthening schemes are effective at enhancing the axial capacity by ratios varying from 24% to 126%. The challenge is the success in obtaining similar peak load enhancement in the case of strengthening preloaded RC wall-like columns. This was achieved successfully in this current research. For the worst-case scenario of preloaded columns with no load release, the second scheme investigated in the current research was successful at improving the axial load-bearing capacity of the columns by 93%, 65%, and 37% for 40%, 80%, and 90% of preloading, respectively.
It is worth noting that for practicing structural engineers, the axial capacity of strengthened RC wall-like columns can be reasonably assessed using the simplified analytical approaches discussed in Refs. [23,25]. These approaches can be extended to include the effect of preloading after the inclusion of appropriate reduction factors based on the results of this study.
6. Conclusions
This research was carried out to experimentally and numerically explore the response of concentrically preloaded RC wall-like columns after being strengthened using different configurations. In the testing campaign, four half-scale specimens were tested in the event of concentric compression. The first two specimens were unstrengthened, they were loaded to 80% of their axial capacity, and the load was then totally released. After that, these specimens were strengthened with two different schemes, and hence, they were concentrically loaded until failure. Moreover, FE analysis was undertaken to examine the response of tested specimens. The numerical models were then employed to carry out a parametric study for investigating the impact of percent of preloading and amount of load release on the response of wall-like columns strengthened with the second scheme. The main conclusions of this study are:
- The failure of the upgraded columns in the two studied retrofitting configurations began with the FRP sheets’ bulging, caused by the expansion of the column cross-section, as well as the NSM and main rebars’ buckling. Ultimately, the upgraded columns failed due to the fracture of the FRP sheets.
- In practical scenarios where the unstrengthened column is preloaded to 80% of its peak load and then fully unloaded, the testing campaign proved the efficiency of the two studied schemes in improving the axial load-displacement characteristics of the columns. However, the second scheme was considerably superior to the first one due to the extra confinement provided by the bolted steel plates. This scheme improved the peak load, stiffness, and dissipated energy by 115%, 75%, and 524%, respectively.
- The performed FE analysis accurately assessed the load versus axial displacement behavior of the examined wall-like columns. This affirms the appropriateness of the utilized constitutive models for steel, concrete, and FRP materials. These verified models can be applied in future studies to explore RC wall-like columns with different aspect ratios and under conditions of eccentric loading.
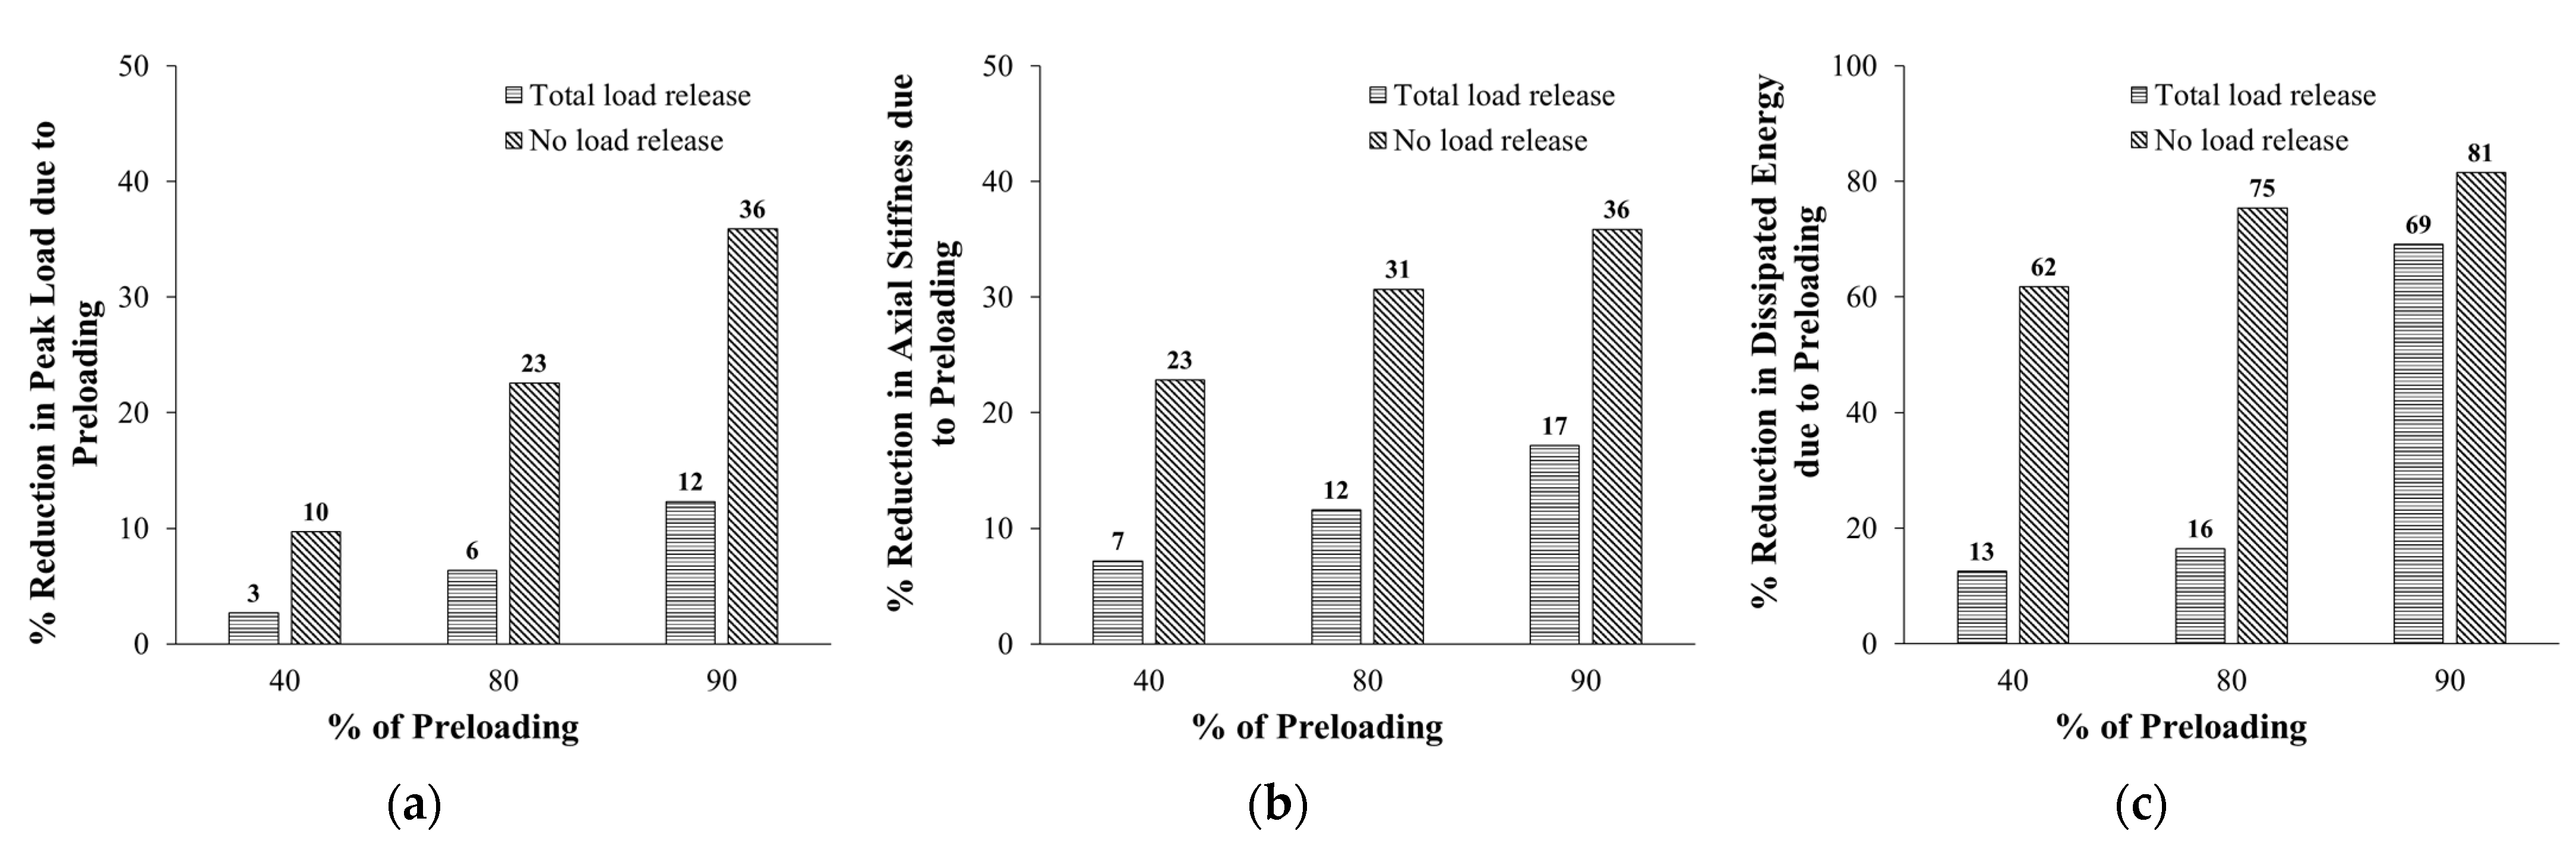
- The conducted parametric study proved that for all response parameters of wall-like columns, as the percent of preloading increased, the percent increase due to strengthening decreased, and the decrease in the case of no load release is significantly more than the case of total load release. For the worst-case scenario of unrelease of the preloading, as the percent of preloading increased from zero to 90%, the percent increase in peak load, stiffness, and dissipated energy due to strengthening was significantly reduced from 113% to 37%, 57% to 1%, and 551% to 21%, respectively.
- From the parametric study carried out in this research, it was found that even with the worst-case scenario of unstrengthened RC wall-like columns preloaded with 90% of their axial resistance without releasing the load, their strengthening using the second scheme was efficient at enhancing the load-displacement response. Compared with the unstrengthened column, the upgrading scheme in such a case improved the peak load and dissipated energy, respectively, by 37% and 21%; however, it almost retained the axial secant stiffness of the column.
- The conclusions derived above are limited to RC wall-like columns with a depth-to-width ratio not exceeding 4. The findings of this study are also limited to wall-like columns fabricated from normal-strength concrete. For wall-like columns with a sectional aspect ratio exceeding 4 or fabricated from high-strength concrete, experimental research is needed.
Author Contributions
Conceptualization, Methodology, Validation, Writing—original draft, H.E.; Investigation, Validation, Writing—review and editing, H.A.; Investigation, Writing—review and editing, Funding acquisition, T.A.; Writing—review and editing, Funding acquisition, Supervision, Y.A.-S. All authors have read and agreed to the published version of the manuscript.
Funding
The authors extend their appreciation to the Deputyship for Research & Innovation, Ministry of Education in Saudi Arabia for funding this research (IFKSURC-1-2207).
Data Availability Statement
Data are contained within the article.
Conflicts of Interest
The authors declare no conflict of interest.
References
- Bett, B.J.; Klingner, R.E.; Jisra, J.O. Lateral load response of strengthened and repaired reinforced concrete columns. ACI Struct. J. 1988, 85, 499–508. [Google Scholar]
- Rodriguey, M.; Park, R. Seismic load tests on reinforced concrete columns strengthened by jacketing. ACI Struct. J. 1994, 91, 150–159. [Google Scholar]
- Campione, G. Load carrying capacity of RC compressed columns strengthened with steel angles and strips. Eng. Struct. 2012, 40, 457–465. [Google Scholar] [CrossRef]
- Khalifa, E.S.; Al-Tersawy, S.H. Experimental and analytical behavior of strengthened reinforced concrete columns with steel angles and strips. Int. J. Adv. Struct. Eng. 2014, 6, 6. [Google Scholar] [CrossRef]
- Tarabia, A.M.; Albakry, H.F. Strengthening of RC columns by steel angles and strips. Alex. Eng. J. 2014, 53, 615–626. [Google Scholar] [CrossRef]
- Abdel-Hay, A.S.; Fawzy, Y.A.G. Behavior of partially defected R.C columns strengthened using steel jackets. HBRC J. 2015, 11, 194–200. [Google Scholar] [CrossRef]
- Shan, Z.; Chen, L.; Liang, K.; Su, R.K.L.; Xu, Z. Strengthening design of RC columns with direct fastening steel jackets. Appl. Sci. 2021, 11, 3649. [Google Scholar] [CrossRef]
- Shan, Z.; Guo, Q.; Liang, K.; Ji, X.; Chen, L.; Li, L.; Xu, Z. Design approach and its optimization for bolted steel plate strengthened RC beams considering the effect of connection bolt slip. In Structures; Elsevier: Amsterdam, The Netherlands, 2023; Volume 57, p. 105045. [Google Scholar]
- Chen, L.; Liang, K.; Shan, Z. Experimental and theoretical studies on bond behavior between concrete and FRP bars with different surface conditions. Compos. Struct. 2023, 309, 116721. [Google Scholar] [CrossRef]
- Stanciu, M.D.; Drăghicescu, H.T.; Roșca, I.C. Mechanical Properties of GFRPs Exposed to Tensile, Compression and Tensile–Tensile Cyclic Tests. Polymers 2021, 13, 898. [Google Scholar] [CrossRef]
- Wu, J.; Zhu, Y.; Li, C. Experimental Investigation of Fatigue Capacity of Bending-Anchored CFRP Cables. Polymers 2023, 15, 2483. [Google Scholar] [CrossRef]
- Xian, G.; Guo, R.; Li, C. Combined effects of sustained bending loading, water immersion and fiber hybrid mode on the mechanical properties of carbon/glass fiber reinforced polymer composite. Compos. Struct. 2022, 281, 115060. [Google Scholar] [CrossRef]
- Elsanadedy, H.; Alaoud, L.; Abbas, H.; Almusallam, T.; Al-Salloum, Y. Externally bonded CFRP composites versus steel stirrups for the confinement of substandard lap spliced GFRP bars in RC beams. Compos. Struct. 2023, 306, 116602. [Google Scholar] [CrossRef]
- Tan, K.H. Strength enhancement of rectangular RC columns using FRP. J. Compos. Constr. ASCE 2002, 6, 175–183. [Google Scholar] [CrossRef]
- Hosny, A.; Shaheen, H.; Abdelrahman, A.; Elafandy, T. Uniaxial tests on rectangular columns strengthened with CFRP. In Proceedings of the Third Middle East Symposium on Structural Composites for Infrastructure Applications, Aswan, Egypt, 14–17 December 2002. [Google Scholar]
- Tanwongsval, S.; Maalej, M.; Paramasivam, P. Strengthening of RC wall-like columns with FRP under sustained loading. Mater. Struct. 2003, 36, 282–290. [Google Scholar] [CrossRef]
- Maalej, M.; Tanwongsval, S.; Paramasivam, P. Modelling of rectangular RC columns strengthened with FRP. Cem. Concr. Compos. 2003, 25, 263–276. [Google Scholar] [CrossRef]
- Prota, A.; Manfredi, G.; Cosenza, E. Ultimate behavior of axially loaded RC wall-like columns confined with GFRP. Compos. Part B 2006, 37, 670–678. [Google Scholar] [CrossRef]
- De Luca, A.; Nardone, F.; Lignola, G.P.; Prota, A.; Nanni, A. Wall-like reinforced concrete columns externally confined by means of glass FRP laminates. Adv. Struct. Eng. 2013, 16, 593–603. [Google Scholar] [CrossRef]
- Alsayed, S.H.; Almusallam, T.H.; Ibrahim, S.M.; Al-Hazmi, N.M.; Al-Salloum, Y.A.; Abbas, H. Experimental and numerical investigation for compression response of CFRP strengthened shape modified wall-like RC column. Constr. Build. Mater. 2014, 63, 72–80. [Google Scholar] [CrossRef]
- Triantafillou, T.C.; Choutopoulou, E.; Fotaki, E.; Skorda, M.; Stathopoulou, M.; Karlos, K. FRP confinement of wall-like reinforced concrete columns. Mater. Struct. Mater. Constr. 2016, 49, 651–664. [Google Scholar] [CrossRef]
- Abbas, H.; Ibrahim, S.M.; Al-Hazmi, N.; Elsanadedy, H.; Almusallam, T.; Al-Salloum, Y. Axial Compression Behavior of Wall-like Reinforced Concrete Columns Retrofitted Using Different FRP Schemes. Buildings 2022, 13, 26. [Google Scholar] [CrossRef]
- Al-Salloum, Y.; Abbas, H.; Elsanadedy, H.; Siddiqui, N.; Almusallam, T. Compression behavior of RC wall-like columns strengthened using NSM/CFRP system without shape modification. In Structures; Elsevier: Amsterdam, The Netherlands, 2023; Volume 57, p. 105158. [Google Scholar]
- Elsanadedy, H.; Abbas, H.; Almusallam, T.; Al-Salloum, Y. Performance of Concentrically Loaded RC Wall-like Columns Upgraded with Innovative Hybrid NSM/CFRP System. Polymers 2023, 15, 378. [Google Scholar] [CrossRef]
- Elsanadedy, H.; Abbas, H.; Siddiqui, N.; Almusallam, T.; Al-Salloum, Y. Hybrid Steel/NSM/GFRP System versus GFRP Wrapping for Upgrading RC Wall-like Columns. Polymers 2023, 15, 1886. [Google Scholar] [CrossRef]
- Mander, J.B.; Priestley, M.J.; Park, R. Theoretical stress-strain model for confined concrete. J. Struct. Eng. 1988, 114, 1804–1826. [Google Scholar] [CrossRef]
- Wang, Y.C.; Resrepo, J.I. Investigations of concentrically loaded reinforced concrete columns confined with glass fiber-reinforced polymer jackets. ACI Struct. J. 2001, 98, 377–385. [Google Scholar]
- Saatcioglu, M.; Razvi, S.R. Strength and ductility of confined concrete. J. Struct. Eng. 1992, 118, 590–607. [Google Scholar] [CrossRef]
- Yalcim, C.; Saatcioglu, M. Inelastic analysis of reinforced concrete columns. Comput. Struct. 2000, 77, 539–555. [Google Scholar] [CrossRef]
- ASTM C39/C39M-21; Standard Test Method for Compressive Strength of Cylindrical Concrete Specimens. ASTM: West Conshohocken, PA, USA, 2021.
- ASTM E8/E8M-22; Standard Test Methods for Tension Testing of Metallic Materials. ASTM: West Conshohocken, PA, USA, 2022.
- ASTM D3039/D3039M; Standard Test Method for Tensile Properties of Polymer Matrix Composite Materials. ASTM: West Conshohocken, PA, USA, 2014.
- ACI 440.2R-17; Guide for the Design and Construction of Externally Bonded FRP Systems for Strengthening Concrete Structures. American Concrete Institute: Detroit, MI, USA, 2017.
- ASTM A370–16; Standard Test Methods and Definitions for Mechanical Testing of Steel Products. American Society for Testing and Materials: West Conshohocken, PA, USA, 2016.
- ACI 318-19; ACI Committee 318; American Concrete Institute. Building Code Requirements for Structural Concrete (ACI 318-19): An ACI Standard: Commentary on Building Code Requirements for Structural Concrete (ACI 318R-19), an ACI Report. American Concrete Institute: Farmington Hills, MI, USA, 2019.
- Livermore Software Technology Corporation (LSTC). LS-DYNA Keyword User’s Manual Vol. 1–3, Version R11; LSTC: Livermore, CA, USA, 2018. [Google Scholar]
- Belytschko, T.B.; Tsay, C.S. Explicit algorithms for non-linear dynamics of shells. J. Appl. Mech. Appl. Mech. Div. ASME 1981, 48, 209–231. [Google Scholar]
- Malvar, L.J.; Crawford, J.E.; Wesevich, J.W.; Simons, D. A plasticity concrete material model for DYNA 3D. Int. J. Impact Eng. 1997, 19, 847–873. [Google Scholar] [CrossRef]
- Malvar, L.J.; Crawford, J.E.; Morrill, K.B. K&C concrete material model Release III—Automated generation of material input. In K&C Technical Report TR-99-24-B1; Report to the Defense Nuclear Agency: Fort Belvoir, VA, USA, 2000. [Google Scholar]
- Magallanes, J.M.; Wu, Y.; Malvar, L.J.; Crawford, J.E. Recent improvements to release III of the K&C concrete model. In Proceedings of the 11th International LS-DYNA Users Conference, Dearborn, MI, USA, 6–8 June 2010. [Google Scholar]
- Chang, F.K.; Chang, K.Y. A progressive damage model for laminated composites containing stress concentration. J. Compos. Mater. 1987, 21, 834–855. [Google Scholar] [CrossRef]
Disclaimer/Publisher’s Note: The statements, opinions and data contained in all publications are solely those of the individual author(s) and contributor(s) and not of MDPI and/or the editor(s). MDPI and/or the editor(s) disclaim responsibility for any injury to people or property resulting from any ideas, methods, instructions or products referred to in the content. |
© 2023 by the authors. Licensee MDPI, Basel, Switzerland. This article is an open access article distributed under the terms and conditions of the Creative Commons Attribution (CC BY) license (https://creativecommons.org/licenses/by/4.0/).