Abstract
The seismic performance of diaphragm walls adjacent to tunnels plays a pivotal role in ensuring the stability of underground infrastructure. This article presents an extensive investigation into the seismic behavior of such diaphragm walls through advanced two-dimensional (2D) numerical modeling. The primary objective is to establish the accuracy and reliability of the numerical model by comparing its results with a reference case history from Tianjin, China. Following successful validation, the study employs rigorous two-dimensional (2D) numerical analyses to examine the response of the diaphragm wall to seismic events while considering crucial factors. These factors encompass the dynamics of pore water pressure, the diverse acceleration histories of earthquakes, varying tunnel positions, and their combined influence on the horizontal displacement of the wall. From our findings, we can conclude that earthquake duration has a more substantial impact on displacement and wall deformation compared to peak ground acceleration (PGA). Longer earthquake durations are associated with greater displacement. In dynamic analyses, the presence of water diminishes soil displacement and concentrates plastic deformation points. The distance between the tunnel and the diaphragm wall significantly affects wall displacement and deformation. The effective distance is approximately 10 m. Our findings can inform better design and construction practices to enhance the stability of underground infrastructure in seismically active regions.
1. Introduction
Diaphragm walls, recognized for their time- and space-saving attributes and consistent performance [1], have become integral components in underground urban construction, capturing the attention of researchers worldwide [2,3,4]. Their noteworthy capacity to significantly diminish seismic tension damage risk and residual lateral deformation in underground structures underscores their importance [5]. Despite their advantages, the seismic design of underground structures often overlooks the impactful role of diaphragm walls, necessitating additional safety considerations in structural design operations [6].
The global rise of underground systems, encompassing metros and road tunnels, is propelled by diverse benefits such as improved spatial utilization, accelerated transportation, reduced air pollution, and a cleaner environment. However, the extensive excavation associated with these projects raises concerns about ground movements, potential damage to adjacent structures, and water leakage issues. In recent years, devastating earthquakes have triggered widespread liquefaction-induced soil deformation, with underground structures bearing the brunt of the damage [7]. The Kobe earthquake, notably, highlighted the vulnerability of underground structures, emphasizing the urgency for research into reinforcement techniques [8,9,10].
Both physical and numerical studies have been pivotal in assessing the seismic response of soil-underground structures [11,12,13]. To mitigate associated challenges, the incorporation of structures like diaphragm walls has become imperative. These structures, designed for deep excavations, swift deployment, and water ingress prevention, represent a crucial element in addressing complex urban construction scenarios [14,15].
Effective and economical design practices aimed at achieving overarching goals necessitate meticulous consideration of methodologies, wall types, retainers, and parameters such as embedded depth, diaphragm wall layers, buried depth, and soil response during earthquakes [16,17,18,19]. Excavation-induced wall deflection poses a significant challenge, often resulting in damage to adjacent urban buildings due to excessive ground movement [20,21,22,23,24]. Therefore, implementing corrective measures to curtail lateral wall movement during excavation is imperative [25,26,27]. Furthermore, engineering practice mandates the strengthening of systems and enhancement of resistance, making it essential to predict diaphragm wall performance under diverse conditions during the design phase [1,14,15,16].
As this paper unfolds, it delves into an extensive investigation of the seismic behavior of diaphragm walls adjacent to tunnels, employing advanced two-dimensional numerical modeling. The primary objective is to validate the accuracy and reliability of the numerical model through a comparison with a reference case history, ultimately contributing to improved design and construction practices for enhancing the stability of underground infrastructure in seismically active regions.
1.1. Related Works
Historical evidence underscores the vulnerability of underground structures to seismic events, with notable examples including the 1989 Loma Prieta, 1994 Northridge, 1995 Kobe, 2008 Wenchuan, and 2011 Tohoku earthquakes [17]. The widespread impact of the Kobe 1995 earthquake, causing concrete cracks, deformations, and collapses, highlights the critical need to address seismic risks in designs [8].
Balkaya et al. [22] investigated the seismic performance of structures dominated by reinforced concrete shear walls constructed using the tunnel form technique. Their study of post-1999 Kocaeli and Duzce earthquakes in Turkey utilized nonlinear pushover analyses to scrutinize 3D scenarios, considering transverse walls, slab-wall interaction, diaphragm flexibility, torsion, and damping effects. The development of a shell element with unique capabilities contributed significantly to predicting actual capacity and understanding failure mechanisms [18].
To assess seismic risks, Madabhushi and Zeng [19] conducted a numerical and experimental study on the seismic behavior of gravity quay walls. Using new quantitative techniques in modeling boundary conditions, their work contributes to understanding seismic responses through centrifuge experiments. Similarly, Haiyang et al. [6] focused on a two-story subway station supported by concrete diaphragm walls. Their numerical study revealed that diaphragm walls mitigate uplift potential and earthquake damage, though severe damage occurs at the structure’s top due to inertial forces.
Yu et al. [24] explored energy geo-structures with heat exchange pipes, including energy tunnels, piles, diaphragm walls, and utility tunnels, examining their seismic performance for both load-bearing and heat exchange functions. Miao et al. [25] investigated a three-stride island-type metro station-tunnel transition structure in Tianjin’s soft soil conditions, emphasizing seismic impact, diaphragm walls, and backfill compactness. Kiryu et al. [26] addressed the reinforcement of side walls in cut and cover tunnels, introducing a seismic countermeasure involving a flexible polymer material. Their study concluded that the polymer isolation method proves effective for seismic countermeasures.
Fabozzi et al. [27] emphasized seismic safety assessments for underground structures in densely populated areas. Using advanced dynamic analyses, the study highlighted the need for accurate geotechnical characterization and input motion selection. Chun-shan et al. [28] utilized dynamic finite element analysis to examine seismic effects on segment opening, finding that bidirectional coupled seismic loading significantly increased both maximal and average segment opening.
Recently, Wen et al. [23] investigated the seismic damage to the Xiangka Bridge following the Ms6.9 earthquake in Menyuan, Qinghai Province. Finite element analysis revealed that the varying stiffness of adjacent spans contributed to the earthquake damage. Specifically exploring the energy aspect of diaphragm walls, this study provides valuable insights into the seismic behavior of such structures.
For analyzing this literature review, a Sankey diagram in Figure 1 shows the significance and importance of the research in the field. The Sankey diagram provides valuable insights into the global research landscape, enabling researchers, policymakers, and practitioners to identify trends, key players, and significant research areas within any realm.
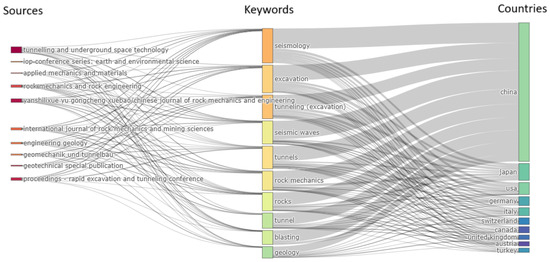
Figure 1.
Global Research Landscape in Seismic, Excavations, and Tunnel Studies.
The figure visually represents the intricate web of research connections among three fundamental keywords: “seismic”, “excavations”, and “tunnel.” Drawing insights from the comprehensive Scopus database, this figure offers a comprehensive glimpse into the state of research in this interdisciplinary field. The diagram prominently highlights China, Japan, the United States, and Germany as the leading countries actively engaged in seismic, excavation, and tunnel studies. These nations exhibit a substantial research presence and contribute significantly to the advancement of knowledge in this domain. Noteworthy keywords in this research landscape include “seismology”, “excavation”, “tunnel”, and “seismic waves.” The frequency of these keywords underscores their central importance in the body of research covered by the Scopus database. The diagram also underscores the significance of key scholarly journals in disseminating research in this field. Notably, “Tunneling and Underground Space Technology Journal”, “Chinese Journal of Rock Mechanics and Engineering”, and “Journal of Rock Mechanics and Rock Engineering” serve as prominent conduits for the exchange of knowledge and findings.
Even though the studies that came before were done in a critical way, one of the hardest and most important parts of design for geotechnical engineers is to understand the significance of horizontal displacement of the retaining structure and ground surface settlement, as well as how they affect the tunnel when there is an earthquake. In light of the fact that groundwater level is one of the most significant factors influencing tunnel behavior, retaining wall behavior, and soil response, this novel study would fill the aforementioned gap. The main goal of this study is to figure out how the soil-diaphragm wall-tunnel reacts to earthquakes by using dynamic loads from the EL-Centro (1940) and Kobe (1995) quakes.
This comprehensive literature review highlights the multifaceted considerations in understanding and mitigating seismic risks in underground structures. Insights from historical earthquakes, innovative modeling techniques, and recent case studies contribute to a deeper understanding of seismic behavior. As the research landscape evolves, ongoing efforts in seismic safety assessments and dynamic analyses continue to inform design practices and enhance the resilience of underground infrastructure in seismically active regions.
1.2. Conceptual and Practical Contributions
To underscore our conceptual contributions, Figure 2 serves as a visual representation of key influential factors that profoundly affect the seismic performance of diaphragm walls situated in close proximity to tunnels. These factors play a pivotal role in comprehending and scrutinizing the behavior of such infrastructure amid seismic events, offering a visual guide to navigate the intricacies of this context.
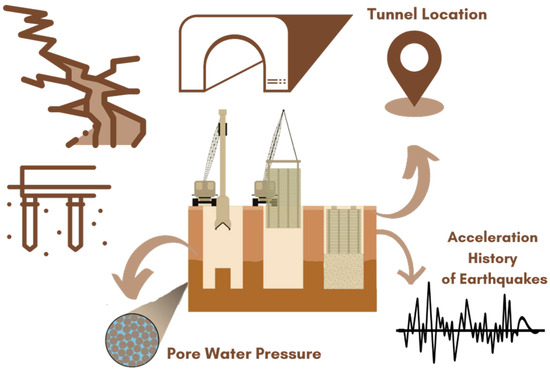
Figure 2.
Conceptual diagram and the influential factors in seismic analysis of diaphragm wall.
One influential factor is clean water pressure, which represents the pressure exerted by water within the surrounding soil. Fluctuations in pore water pressure can significantly impact the stability of diaphragm walls, particularly during seismic events when water pressures may vary. Furthermore, seismic activity, as delineated by historical earthquake records, stands as an essential element. Various earthquakes with diverse magnitudes and frequencies can impart varying levels of stress and strain on diaphragm walls, influencing their dynamic response. Another critical consideration is tunnel location, where the relative positioning of the tunnel concerning the diaphragm wall emerges as a decisive determinant. The proximity or distance between the tunnel and the wall plays a significant role in shaping the diaphragm wall’s response to ground shaking during an earthquake.
This study makes a substantial contribution to the understanding of tunnel behavior in seismic conditions. Utilizing advanced two-dimensional (2D) numerical modeling, we validate our approach against a reference case from Tianjin, China, establishing its accuracy. Unlike previous studies, our research places a distinct emphasis on the impact of earthquake duration on wall displacement and delves into the influence of factors such as tunnel proximity and diameter. These insights offer valuable guidance for enhancing the stability of underground infrastructure in seismic regions.
In the upcoming sections, our exploration unfolds as follows: Section 2 introduces our real-life case study, providing a contextual foundation. Section 3 undertakes verification analyses, meticulously scrutinizing our numerical example. Moving forward, Section 4 encompasses a parametric analysis, expanding the dimensions of our inquiry. To cultivate a comprehensive understanding of our findings, Section 5 unveils results and initiates in-depth discussions. Finally, Section 6 encapsulates our conclusions, offers insights, and outlines promising avenues for future research, thereby concluding our research journey.
2. Case Study
For the purpose of validating the finite element (FE) model in this study, a meticulous examination of a braced excavation in Tianjin City, China, has been selected as the foundational model [16] (Figure A1). The excavation, situated in close proximity to an existing tunnel, comprised three principal and partial depths: 15 m, 16.25 m, and 17.55 m. Notably, the excavation was located on the south side of the tunnel, with the closest point a mere 16.5 m from the tunnel.
To effectively manage the deformation induced by the excavation and ensure the protection of the tunnel, a phased excavation approach was implemented. The southern excavation was initially conducted, followed by the northern excavation. Subsequently, work on the central excavation commenced after the installation of underground structures and the backfilling of the northern and southern excavations. The southern side was secured by a robust 1.2-m-thick diaphragm wall, while contiguous piles were employed to retain the north side. The east and west retaining structures comprised 1-m-thick diaphragm walls, augmented by concrete struts on two levels.
A crucial protective measure between the tunnel and the southern excavation involved the construction of a row of embedded isolation piles to mitigate horizontal displacement risks. These piles, extending to a depth of −13 m, were constructed using the grout technique for insulation. Figure 1 illustrates the sections and key points of the model, offering a visual representation of the excavation setup.
The selected side of the excavation revealed distinct layers, featuring silty-fine sand layers overlaid by subsoils composed of alternating layers of silty clay and silt. Table A1 and Table A2 provide a comprehensive summary of the distribution and characteristics of the soil strata for reference. This case study serves as a robust foundation for validating the FE model and contributes essential insights to the broader investigation into the seismic behavior of diaphragm walls adjacent to tunnels.
3. Numerical Modeling and Verification
In this section, our objective is to validate our numerical modeling. We will commence by providing a comprehensive description of the geometry and intricacies of the numerical model. Subsequently, we will conduct thorough verification analyses.
3.1. Geometry and Details of Numerical Model
Young’s modulus was set at 30 GPa, and Poisson’s ratio was set at 0.2 for modeling the tunnel lining, diaphragm wall, isolation piles, and contiguous piles in PLAXIS 2D v20. When simulating the diaphragm wall and struts, five-node plate elements and three-node bar elements were used, respectively, while 6933 fifteen-node triangle components were used to model the soil. Plate elements were used to model the contiguous piles and isolation. The impact of the vertical interaction can be ignored because the horizontal load is carried by the adjacent piles. To prevent adding more convergence forces, plate elements were employed to simulate the adjacent piles. To account for the influence of the segment joints on the tunnel lining’s rigidity, the transverse effective rigidity ratio was set at 75%. The boundary conditions are constrained for horizontal displacement and set free for vertical displacement at the peripheral project boundary. Both horizontal and vertical shifts have been fixed to the lower bound of the model. Figure 3 shows the arrangement and the mesh used in the mathematical modeling. In the model, a fine mesh is used. In addition, we used the “refine cluster” option in PLAXIS 2D around some elements, such as walls and tunnels, to have more accurate analyses. The groundwater level was −2 m, which was eliminated in one analysis.
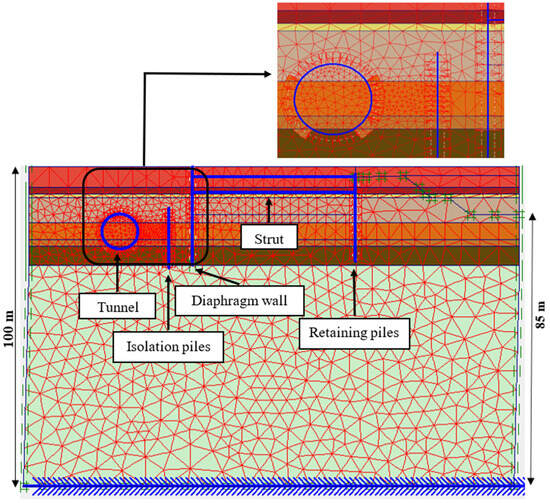
Figure 3.
Configuration and the mesh used in the numerical modeling.
Jardine et al. in [29] and Burland in [30] have emphasized the significance of modeling the small-strain behavior of soils when tending to geotechnical issues. When subjected to modest strains (3–10 percent), soil frequently exhibits a high initial stiffness that decreases with increasing strain. This nonlinearity of the stress-strain curve has exceptionally critical impacts on soil-structure interactions (SSI) and the soil masses’ stress distributions. One of the constitutive models in PLAXIS, the hardening small strain (HSS), explains why soil stiffness increases at small strains. It has been demonstrated that it is possible to create precise predictions about how structures will alter and how the ground will move using FE analysis with a small-strain structural system. Therefore, the HSS model has been used in this research. As shown in Table A1, all relevant parameters, except 0.7, were determined from laboratory tests of soil samples taken with a thin-wall sampler. The analysis is based on effective stress conditions.
The numerical analysis utilized in this study adhered to the steps outlined below:
- Stress is generated at first.
- There is activation of the plate elements of the diaphragm wall, tunnel lining, isolation piles, and contiguous piles.
- It continues until the excavation’s base is dewatered.
- Excavation to a depth of 3.6 m and installation of the first level strut on the excavation’s southern edge.
- The second-level struts are built on the southern excavation side after excavation to a depth of 8.4 m.
- On the northern excavation side, 9.6 m of excavation were completed.
- The northern excavation side is being excavated all the way to the bottom.
- The southern excavation side is being excavated all the way to the bottom.
3.2. Verification
The validation of the numerical model’s horizontal displacement of the diaphragm wall against the reference case history from Tianjin, China, is presented in Figure 4. This comparative analysis illustrates a noteworthy alignment between the numerical model’s predictions and the actual measured data, affirming the accuracy of the simulation.
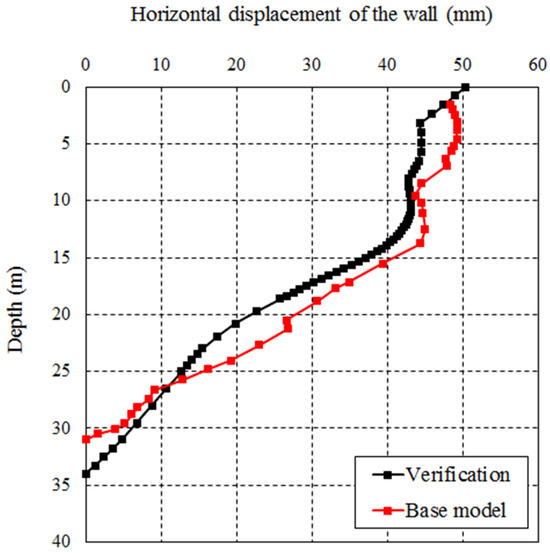
Figure 4.
Comparison between the horizontal displacements of the diaphragm wall obtained from Zheng’s study and the current research.
During the execution of the north excavation, the south excavation side experienced a complete shift towards the north. The displacement curves vividly depict the cantilevered behavior of the diaphragm wall, with a discernible reduction in displacement as depth increases. Particularly significant is the observation that the most substantial horizontal displacement occurred in the proximity of the excavation’s top section. Consequently, the diaphragm wall exhibited a maximum displacement of 50 mm, indicating a considerable lateral shift during the excavation process.
This congruence between the numerical model and the field measurements not only attests to the model’s reliability but also provides valuable insights into the dynamic behavior of the diaphragm wall during staged excavations. The meticulous agreement observed in the horizontal displacement patterns reinforces the credibility of the numerical model, thereby establishing a solid foundation for the ensuing seismic analyses and evaluations of the diaphragm wall’s response to seismic events.
4. Parametric Study
The validated model of the current study has been employed to examine the factors affecting the diaphragm wall reaction. The study investigated the displacement of the diaphragm wall induced by different earthquakes, including El Centro and Kobe, in the presence and absence of water after the examination.
The EL-Centro in 1940 and Kobe in 1995 earthquakes were chosen for this research because they are important to seismic studies. The EL-Centro earthquake was one of the first reported strong-motion events. The historical example can help us understand how our case study behaves in earthquakes. Its data is commonly utilized as a benchmark in seismic research due to its documentation. However, the 1995 Kobe earthquake illustrates how structures are built and react to earthquakes nowadays. Due to the availability of complete data for both earthquakes, a thorough and meaningful analysis provides solid results and makes it easy to compare with other research that has used these well-documented seismic events.
Several influencing factors were considered to investigate the effect of the dynamic loads on diaphragm wall responses, including the earthquake duration and acceleration. Table 1 provides a summary of a number of scenarios that were derived utilizing the dynamic loads. The model was constructed from the steps list of the Tianjin, China, model with the same parameters in PLAXIS 2D. To consider the model in the absence of water before activating step 1, the whole model was dewatered, which is the last step in all models considered for dynamic loads. This study modeled dynamic loads from the bottom of the model. In another step, the effect of tunnel displacement on the diaphragm wall was investigated, which is modeled in the presence of water and the El Centro earthquake. As presented in Figure 5, the tunnel’s vertical displacement (Sy) was constant in this model, and the horizontal displacement (Sx) was variable by 2.5, 5, and 10 m. Figure 6 also depicts the input waves used in the analyses of the current study, considering the El-Centro earthquake and the Kobe earthquake [31].

Table 1.
Dynamic loads and other parameters of earthquake waves.
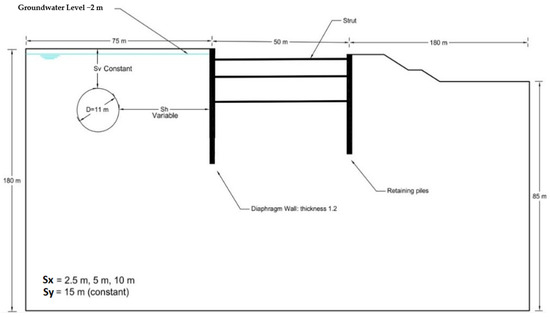
Figure 5.
Geometry of the model used in FE analysis.
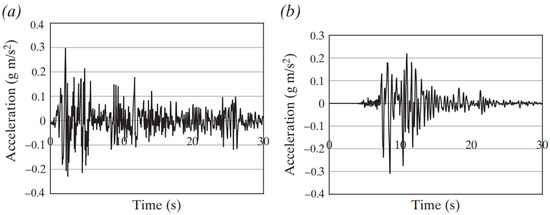
Figure 6.
Input waves used in analyses of the current study: (a) El-Centro earthquake and (b) Kobe earthquake [32].
5. Results and Discussion
In this study, the horizontal displacement versus depth curves and the contour of the plastic point distribution are found through numerical analysis for earthquakes that were caused. The results are analyzed as follows:
5.1. Wall Displacements
Inducing the El Centro earthquake, the diaphragm wall’s horizontal displacements are noticeable. The greatest possible horizontal displacement in the absence of water happened at 20 m from the top of the wall head, which was about 820 mm, and the head of the diaphragm wall moved 180 mm (Figure 7a). The diaphragm’s horizontal displacement was assumed to move in the opposite direction in the presence of water. The highest horizontal displacement happened at 13 m from the wall head, or about 332 mm, and the wall’s head moved 186 mm (Figure 7b). Inducing Kobe’s earthquake load led to a maximum horizontal displacement of 20 m from the wall head, or about 401 mm, in the absence of water. In contrast, the head of the wall has about 125 mm of horizontal displacement. Figure 7b illustrates the diaphragm wall horizontal displacement in the presence of water, leading to 78.25 mm in the wall head and 74.7 mm in 8 depths from the wall head. Figure 7a shows that the maximum horizontal wall head displacement was about 50.8 mm in static conditions. The displacement increased by inducing a dynamic load, which was different in the absence and presence of water. Inducing the El Centro earthquake’s seismic load, the wall head moved about 186 mm in the presence of water, while the corresponding value was about 78 mm for the Kobe earthquake. Respectively, the movements were 236 and 125.8 mm without water. As mentioned, the magnitudes of the Kobe and El Centro earthquakes are approximately the same, while the El Centro earthquake duration is almost twice that of Kobe (Table 1).
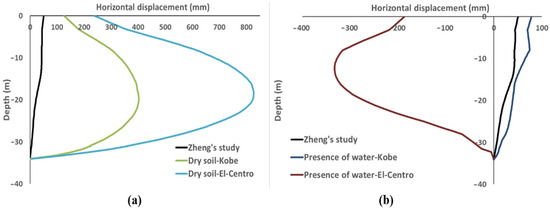
Figure 7.
Horizontal displacement of the wall versus depth curve for all models: (a) dry soil and (b) presence of water.
In the following, due to more discussion about the obtained results, some comparison is done based on different research items, which are summarized in Table 2. The provided discussion (Table 2) offers a glimpse into the complex behavior of diaphragm walls under seismic loads and varying conditions. A comprehensive discussion, informed by the referenced studies, could delve into the mechanics underlying the observed phenomena, offering insights into soil-structure interaction, fluid dynamics, seismic characteristics, and their implications for seismic design and engineering practices.
Table 2.
The discussions on wall displacements in the present research.
5.2. Plastic Zones
The earthquake-induced plastic points for the models considering the absence and presence of water are demonstrated in Figure 8. Depending on the kind of plasticity, miniature symbols of varying sizes, forms, and colors are used to represent the plastic stress points. While the solid white square (tension cut-off point) shows that the tension cut-off criterion was used, the red open square (Mohr-Coulomb point) indicates that the stresses are on the surface of the Coulomb failure envelope. A blue-crossed square (cap point) denotes an expected consolidation condition where the stress during reconsolidation is equal to the stress at the moment. Only when the soft soil (creep) model or the hardening soil model are applied can the later sort of plastic point appear.
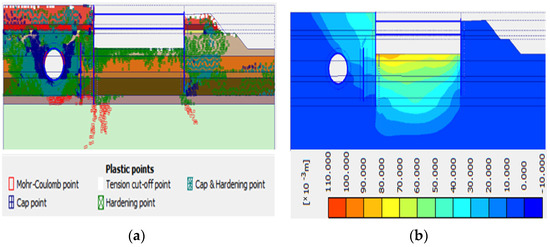
Figure 8.
(a) The distribution of plastic points under static load, and (b) the displacement of soil layers under static load.
A green square with a plus sign (hardening point) denotes sites on the shear hardening envelope for the hardening soil and HSS models as well (mobilized friction envelope). A green crossing square, on the other hand, functions as both a cap point and a hardness point. A comparison between Figure 8a,b illustrates that the plastic points increase when dynamic loads are induced on the model, which increases significantly in the presence of water. It is worth mentioning that the higher duration of the El-Cento earthquake load caused more plastic points in the model compared to the Kobe load. Plastic points are spread evenly in soil layers in the absence of water, which is concentrated and compressed, and are moved to top areas, especially cap points and Mohr-Coulomb points, in the presence of water. The density of points is significantly higher around the elements and excavation areas.
The mathematical underpinnings of the discussed phenomena offer a rich landscape for deeper analysis (Table 3). By linking concepts of stress-strain relationships, failure criteria, consolidation behavior, shear strength evolution, and energy dissipation, one can gain a comprehensive understanding of how various factors interact to shape the distribution and behavior of earthquake-induced plastic points. This analysis not only enhances the theoretical foundation of the study but also provides insights into the real-world behavior of geotechnical structures under seismic conditions.
Table 3.
The mathematical discussions of plasticity assessment of the different points in this research.
5.3. Displacement of Soil Layers
The comprehensive analysis of the presented data, encapsulated within Figure 7, Figure 8 and Figure 9, lays bare intricate insights into the dynamics of soil displacement within the outlined structural context. These visual depictions serve as windows into the underlying mechanical phenomena governing soil behavior under varying conditions, thus paving the way for profound discussions in the realms of geotechnical engineering and mathematical modeling. In Figure 8, a topographical representation of the peak soil displacement encircling the structural elements and the excavation zones is manifestly portrayed. This figure, a testament to the meticulous monitoring of localized soil responses, offers a crucial vantage point for discerning the disparities in deformation magnitudes across distinct regions. Its visual clarity aids in grasping the spatial distribution of soil displacement, thereby facilitating the identification of zones subjected to more pronounced mechanical strain. The logical implications are evident: elements experiencing higher stress loads due to their position or load-bearing function may exhibit greater soil displacement, a consequence of the interplay between mechanical forces and material characteristics.
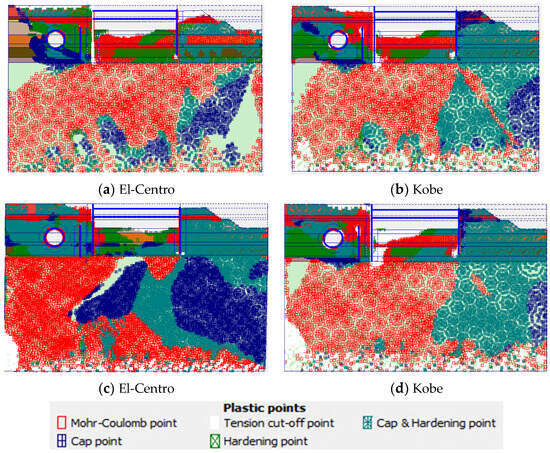
Figure 9.
The distribution of plastic points: (a,b) Dry soil (c,d) presence of water.
Turning attention to Figure 10, a more holistic perspective emerges as it encompasses the aggregate soil displacements witnessed across the entire model. Notably, this illustration is engendered under dynamic loading conditions, a context that introduces an added layer of complexity to the analysis. This figure serves as a testament to the model’s overarching structural response to external forces, encompassing the intricate interconnections between the various elements. It becomes a cornerstone for further discussions, inviting considerations regarding wave propagation, stress wave interactions, and the propagation of soil deformation fronts.
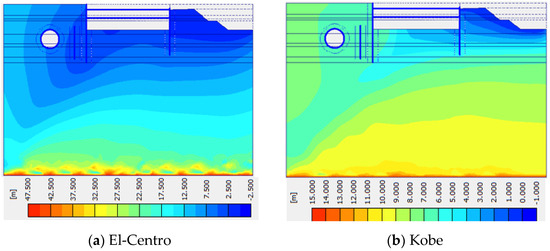
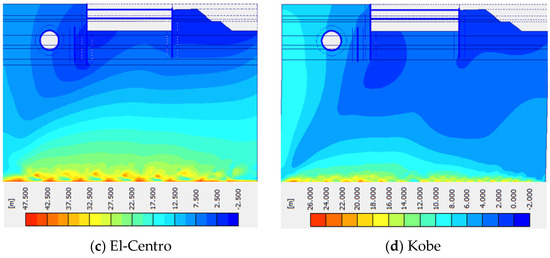
Figure 10.
The displacement of soil layers: (a,b) Dry soil (c,d) presence of water.
A particularly intriguing inference emerges from the comparative analysis between the two figures. A salient observation is that the degree of soil displacement exhibits a profound dependence on the moisture content of the soil. This connection finds its roots in the intricate interplay between soil mechanics, pore water pressure, and material behavior. The significantly greater displacement observed when the soil is dry as opposed to when it is saturated with water underscores the critical influence of water content on soil stiffness and, consequently, its ability to resist deformation. This is where mathematical models can step in, utilizing constitutive relationships and soil performance theories to simulate and predict these variations under different conditions [44].
The stratification of soil displacement, with deeper layers showcasing greater deformation compared to the shallower regions, introduces another layer of inquiry. Here, geological and geotechnical principles come into play, including the concept of lateral stress distribution in soil masses and the role of confining pressures. These factors, intricately interwoven with mathematical models like Terzaghi’s consolidation theory or various finite element methods, provide avenues for understanding the mechanisms underlying the observed disparities [29].
5.4. Displacement of the Tunnel
Based on Figure 6, the tunnel has been displaced at different horizontal distances (2.5, 5, and 10 m) in the presence of water and the El Centro earthquake; the results are shown in Figure 11. Figure 11a clearly shows that when the tunnel comes close to the wall, the wall’s displacement outside the excavation increases. Also, this figure shows that the wall has severe concave behavior, and the maximum displacement happened at 15 m from the top, which was almost equal in all three curves (Sx = 2.5, 5, and 10 m). The tunnel approach to the wall did not affect the maximum deformation of the wall. Furthermore, the influence zones of the tunnel displacement on the diaphragm wall are less than 5 m and more than 2.5 m. As the curves show, when the tunnel is close to the diaphragm wall, the deformation of the wall increases significantly (Sx = 2.5 m).
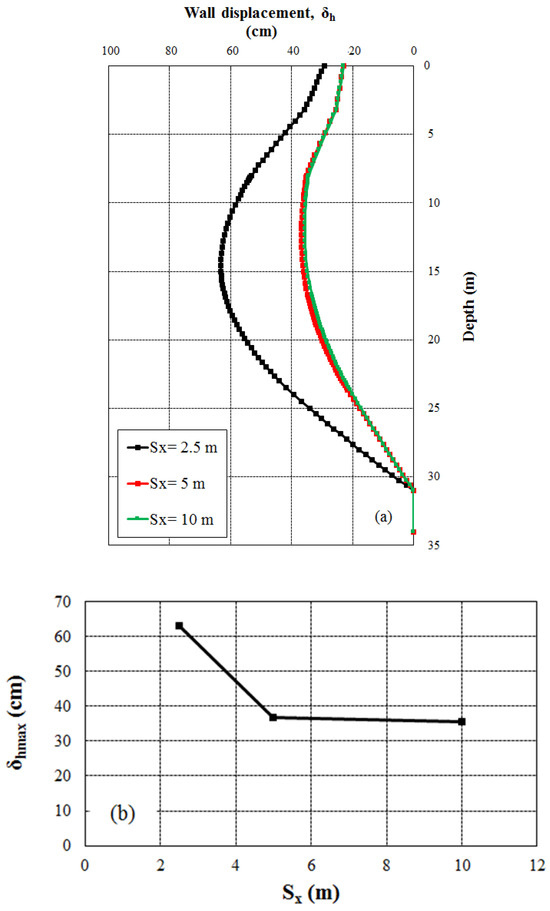
Figure 11.
The diaphragm wall’s displacement for various values of Sx: (a) The profiles of the wall’s horizontal displacement and (b) the maximum horizontal wall displacement relative to Sx values.
6. Conclusions
This research significantly contributes to the field by shedding light on the intricate dynamics of diaphragm walls, providing practitioners and researchers with a nuanced understanding of seismic interactions. The emphasis on earthquake duration as a key factor influencing displacement, the influence of soil conditions on dynamic responses, and the critical importance of tunnel proximity enrich our knowledge of the design and construction of resilient underground structures.
Our comprehensive dynamic study has illuminated critical aspects of diaphragm wall behavior under seismic conditions, providing valuable insights into horizontal wall movement and plastic point distribution. Through an exhaustive analysis, we explored the seismic repercussions of the El Centro and Kobe earthquakes, uncovering nuanced connections between earthquake duration and wall displacement, surpassing the impact of peak ground acceleration.
A pivotal finding emerged from our comparison of diverse earthquake scenarios, revealing the profound influence of earthquake duration in relation to maximum acceleration. The study showcased significant displacement at the wall head under static conditions, with dynamic analysis, particularly in dry soil, concentrating displacement at two-thirds of the wall head. Conversely, saturated soil conditions resulted in substantial displacement around one-third from the top. The plastic point distribution patterns were notably dense, particularly in the presence of water, underscoring the complexity of the soil-structure interaction.
The investigation also highlighted the correlation between increased earthquake acceleration and amplified soil displacement. A critical distance was identified, linking tunnel diameter to wall displacement and deformation, emphasizing the substantial impact of tunnel proximity and excavation activities. Our research contributes to the evolving understanding of diaphragm wall dynamics, underscoring the significance of earthquake duration, soil conditions, tunnel proximity, and dimensions in governing displacement and deformations.
Having managerial insights based on our findings, we recommend a heightened focus on earthquake duration in seismic design considerations, especially in regions prone to seismic activity. Additionally, practitioners should carefully assess soil conditions and the proximity of tunnels during the design phase to optimize the performance and resilience of diaphragm walls.
Future research endeavors should delve into refining seismic design guidelines for diaphragm walls and tunnels, considering the insights gained from this study. Exploring the applicability of our findings in real-world scenarios and conducting field validations will further enhance the robustness of seismic resilience measures [45]. Moreover, extending the investigation to include three-dimensional numerical modeling and exploring innovative construction techniques could contribute to advancing the state-of-the-art in underground infrastructure resilience [46].
Author Contributions
Conceptualization, N.B. and R.Y.K.; methodology, N.B.; software, M.G.; validation, A.M.F.-F., S.W. and R.M.; formal analysis, N.B.; investigation, A.M.F.-F. and S.W.; resources, R.M.; data curation, M.G.; writing—original draft preparation, M.G. and A.M.F.-F.; writing—review and editing, A.M.F.-F. and R.M.; visualization, M.G.; supervision, A.M.F.-F., R.Y.K. and S.W. All authors have read and agreed to the published version of the manuscript.
Funding
The authors would like to thank the Technical University of Liberec for the Student Grant Competition SGS-2023–3401. The research was also supported by Research Infrastructure NanoEnviCz via the Czech Republic’s Ministry of Education, Youth, and Sports under Project No. LM2023066.
Data Availability Statement
The data that support the findings of this study are available on request from the corresponding author. The data are not publicly available due to ongoing collaborations.
Conflicts of Interest
The authors declare no conflicts of interest.
Appendix A

Figure A1.
The geometry of the tunnel and excavation [16].
Table A1.
The soils’ mechanical and physical characteristics [16].
Table A1.
The soils’ mechanical and physical characteristics [16].
| Layer No. | Soil Type | Thickness (m) | γ (kN/m3) | c’ (kPa) | φ (°) |
|---|---|---|---|---|---|
| 1-1 | Miscellaneous fill soil | 6.5 | 18.5 | 12.4 | 16.1 |
| 3-1 | Silty clay | 2 | 18.55 | 5.6 | 2629 |
| 6-3 | Silt | 1.2 | 18.69 | 6 | 27.65 |
| 6-4 | Silty clay | 7.8 | 19.46 | 9.54 | 28.59 |
| 8-1 | Silty clay | 5.5 | 19.78 | 13.95 | 25.66 |
| 8-2 | Silt | 2 | 18.36 | 10 | 32.3 |
| 9-1 | Silty clay | 6 | 19.83 | 21.45 | 21.6 |
| 10-2 | Silty sand | 3 | 20.98 | 10.2 | 36.4 |
| 11 | Silty clay | 66 | 20.28 | 14.62 | 24.66 |
Table A2.
The mechanical properties of structural elements [16].
Table A2.
The mechanical properties of structural elements [16].
| Element | Specific Weight (kN/m3) | Elasticity Modulus (kPa) | Poisson’s Ratio | Height (m) | Damping Ratio | Thickness (m) |
|---|---|---|---|---|---|---|
| Diaphragm wall | 25 | 3 × 10⁶ | 0.2 | 34 | 10% | 1.2 |
| Piles | 25 | 3 × 10⁶ | 0.2 | 19 | 10% | 0.8 |
| 29.8 | 0.9 | |||||
| Struts | 25 | 3 × 10⁶ | 0.2 | 50 | 10% | - |
References
- Bahrami, M.; Khodakarami, M.I.; Haddad, A. 3D numerical investigation of the effect of wall penetration depth on excavations behavior in sand. Comput. Geotech. 2018, 98, 82–92. [Google Scholar] [CrossRef]
- Bahrami, M.; Khodakarami, M.I.; Haddad, A. Seismic behavior and design of strutted diaphragm walls in sand. Comput. Geotech. 2019, 108, 75–87. [Google Scholar] [CrossRef]
- Liu, W.; Shi, P.; Cai, G.; Cao, C. Seepage on local stability of slurry trench in deep excavation of diaphragm wall construction. Comput. Geotech. 2021, 129, 103878. [Google Scholar] [CrossRef]
- Zhang, J.; Li, M.; Ke, L.; Yi, J. Distributions of lateral earth pressure behind rock-socketed circular diaphragm walls considering radial deflection. Comput. Geotech. 2022, 143, 104604. [Google Scholar] [CrossRef]
- Hashash, Y.M.; Hook, J.J.; Schmidt, B.; Yao, J.I.-C. Seismic design and analysis of underground structures. Tunn. Undergr. Space Technol. 2001, 16, 247–293. [Google Scholar] [CrossRef]
- Haiyang, Z.; Jing, Y.; Su, C.; Jisai, F.; Guoxing, C. Seismic performance of underground subway station structure considering connection modes and diaphragm wall. Soil Dyn. Earthq. Eng. 2019, 127, 105842. [Google Scholar] [CrossRef]
- Kang, G.-C.; Tobita, T.; Iai, S. Seismic simulation of liquefaction-induced uplift behavior of a hollow cylinder structure buried in shallow ground. Soil Dyn. Earthq. Eng. 2014, 64, 85–94. [Google Scholar] [CrossRef]
- Sayed, M.A.; Kwon, O.-S.; Park, D.; Van Nguyen, Q. Multi-platform soil-structure interaction simulation of Daikai subway tunnel during the 1995 Kobe earthquake. Soil Dyn. Earthq. Eng. 2019, 125, 105643. [Google Scholar] [CrossRef]
- Mahmoud, A.O.; Hussien, M.N.; Karray, M.; Chekired, M.; Bessette, C.; Jinga, L. Mitigation of liquefaction-induced uplift of underground structures. Comput. Geotech. 2020, 125, 103663. [Google Scholar] [CrossRef]
- Zeng, X.; Wang, Z.; Fan, J.; Zhao, L.; Lin, D.; Zhao, J. Problems of durability and reinforcement measures for underground structures in China. J. Rock Mech. Geotech. Eng. 2011, 3, 250–259. [Google Scholar] [CrossRef]
- Chen, J.; Wang, L.; Pu, X.; Li, F.; Li, T. Experimental study on the dynamic characteristics of low-angle loess slope under the influence of long- and short-term effects of rainfall before earthquake. Eng. Geol. 2020, 273, 105684. [Google Scholar] [CrossRef]
- Gazetas, G.; Psarropoulos, P.; Anastasopoulos, I.; Gerolymos, N. Seismic behaviour of flexible retaining systems subjected to short-duration moderately strong excitation. Soil Dyn. Earthq. Eng. 2004, 24, 537–550. [Google Scholar] [CrossRef]
- Zheng, G.; Yang, X.; Zhou, H.; Du, Y.; Sun, J.; Yu, X. A simplified prediction method for evaluating tunnel displacement induced by laterally adjacent excavations. Comput. Geotech. 2018, 95, 119–128. [Google Scholar] [CrossRef]
- Arai, Y.; Kusakabe, O.; Murata, O.; Konishi, S. A numerical study on ground displacement and stress during and after the installation of deep circular diaphragm walls and soil excavation. Comput. Geotech. 2008, 35, 791–807. [Google Scholar] [CrossRef]
- Segura-Castillo, L.; Aguado, A.; Josa, A. Bi-layer diaphragm walls: Experimental and numerical structural analysis. Eng. Struct. 2013, 56, 154–164. [Google Scholar] [CrossRef]
- Zheng, G.; Du, Y.; Cheng, X.; Diao, Y.; Deng, X.; Wang, F. Characteristics and prediction methods for tunnel deformations induced by excavations. Géoméch. Eng. 2017, 12, 361–397. [Google Scholar] [CrossRef]
- Pomonis, A.; Saito, K.; Siau, F.; Stuart, G.; Katsuichiro, M.; Joshua, M.; Raby, A.; Sammonds, P. The Mw9.0 Tohoku Earthquake and Tsunami of 11th March 2011, A Field Report by EEFIT. 2011. Available online: https://www.semanticscholar.org/paper/The-Mw9.0-Tohoku-Earthquake-and-Tsunami-of-11th-A-Pomonis-Saito/6ee03fa87148c92d3072003895fbf963da1242f3 (accessed on 17 August 2023).
- Yariyan, P.; Zabihi, H.; Wolf, I.D.; Karami, M.; Amiriyan, S. Earthquake risk assessment using an integrated Fuzzy Analytic Hierarchy Process with Artificial Neural Networks based on GIS: A case study of Sanandaj in Iran. Int. J. Disaster Risk Reduct. 2020, 50, 101705. [Google Scholar] [CrossRef]
- Madabhushi, S.P.G.; Zeng, X. Seismic Response of Gravity Quay Walls. II: Numerical Modeling. J. Geotech. Geoenviron. Eng. 1998, 124, 418–427. [Google Scholar] [CrossRef]
- Chowdhury, S.S.; Deb, K.; Sengupta, A. Behavior of underground strutted retaining structure under seismic condition. Earthq. Struct. 2015, 8, 1147–1170. [Google Scholar] [CrossRef]
- Wartman, J.; Rondinel-Oviedo, E.A.; Rodriguez-Marek, A. Performance and Analyses of Mechanically Stabilized Earth Walls in the Tecomán, Mexico Earthquake. J. Perform. Constr. Facil. 2006, 20, 287–299. [Google Scholar] [CrossRef]
- Balkaya, C.; Kalkan, E. Nonlinear seismic response evaluation of tunnel form building structures. Comput. Struct. 2003, 81, 153–165. [Google Scholar] [CrossRef]
- Wen, Y.; Yuan, D.; Xie, H.; Su, R.; Su, Q.; Li, Z.; Sun, H.; Si, G.; Yu, J.; Chen, Y.; et al. Typical Fine Structure and Seismogenic Mechanism Analysis of the Surface Rupture of the 2022 Menyuan Mw 6.7 Earthquake. Remote. Sens. 2023, 15, 4375. [Google Scholar] [CrossRef]
- Yu, J.; Kang, Y.; Zhai, Z. Advances in research for underground buildings: Energy, thermal comfort and indoor air quality. Energy Build. 2020, 215, 109916. [Google Scholar] [CrossRef]
- Miao, Y.; Zhong, Y.; Ruan, B.; Cheng, K.; Wang, G. Seismic response of a subway station in soft soil considering the structure-soil-structure interaction. Tunn. Undergr. Space Technol. 2020, 106, 103629. [Google Scholar] [CrossRef]
- Kiryu, S.; Murono, Y.; Morikawa, H. Comparative Study of Retrofit Technique For Cut and Cover Tunnel. Doboku Gakkai Ronbunshuu A 2008, 64, 825–830. [Google Scholar] [CrossRef][Green Version]
- Fabozzi, S.; Licata, V.; Autuori, S.; Bilotta, E.; Russo, G.; Silvestri, F. Prediction of the seismic behavior of an underground railway station and a tunnel in Napoli (Italy). Undergr. Space 2017, 2, 88–105. [Google Scholar] [CrossRef]
- Yang, C.-S.; Mo, H.-H.; Chen, J.-S.; Wang, Y.-Z. Influence of Seismic Loading on Segment Opening of a Shield Tunnel. Sci. World J. 2014, 2014, 387210. [Google Scholar] [CrossRef]
- Jardine, R.J.; Potts, D.M.; Fourie, A.B.; Burland, J.B. Studies of the influence of non-linear stress–strain characteristics in soil–structure interaction. Géotechnique 1986, 36, 377–396. [Google Scholar] [CrossRef]
- Burland, J.B. Ninth Laurits Bjerrum Memorial Lecture: “Small is beautiful”—The stiffness of soils at small strains. Can. Geotech. J. 1989, 26, 499–516. [Google Scholar] [CrossRef]
- Peiris, T.; Thambiratnam, D.; Gallage, C.; Perera, N. Soil–Pile Interaction of Pile Embedded in Deep-Layered Marine Sediment under Seismic Excitation. Struct. Eng. Int. 2014, 24, 521–531. [Google Scholar] [CrossRef]
- Al-Jeznawi, D.; Jais, I.B.M.; Albusoda, B.S.; Alzabeebee, S.; Al-Janabi, M.A.Q.; Keawsawasvong, S. Response of Pipe Piles Embedded in Sandy Soils Under Seismic Loads. In Transportation Infrastructure Geotechnology; Springer: Berlin/Heidelberg, Germany, 2023; pp. 1–27. [Google Scholar] [CrossRef]
- Wu, M.; Li, S.; Fan, S.; Lu, J. Experimental study on soil-structure interaction of steel frame under seismic excitations. Structures 2023, 55, 2280–2294. [Google Scholar] [CrossRef]
- Han, J.; Guo, Z.; El Naggar, M.H.; Li, L.; Wang, X.; Du, X. Response of Buried Pipeline to Non-Uniform Longitudinal and Transverse Ground Motions. J. Earthq. Eng. 2023, 1–20. [Google Scholar] [CrossRef]
- Yusra, A.; Mustafa, A.; Refiyanni, M.; Zakia, Z. Performance Structural Analysis of U2C Building with the Kobe Earthquake Spectrum. Int. J. Eng. Sci. Inf. Technol. 2023, 3, 36–46. [Google Scholar] [CrossRef]
- Hussien, R.S.; Albusoda, B.S. Experimental modeling of a single pile in liquefiable soil under the effect of coupled static-dynamic loads. Innov. Infrastruct. Solutions 2022, 8, 50. [Google Scholar] [CrossRef]
- Wang, Q.; Zou, L.; Niu, Y.; Ma, F.; Lu, S.; Fu, Z. Study on the Surface Settlement of an Overlying Soft Soil Layer under the Action of an Earthquake at a Subway Tunnel Engineering Site. Sustainability 2023, 15, 9484. [Google Scholar] [CrossRef]
- Khamesi, S.O.; Hosseini, S.M.M.M. Numerical investigation of the main factors influencing rocking responses of shallow foundations. Proc. Inst. Civ. Eng.—Geotech. Eng. 2023, 1–16. [Google Scholar] [CrossRef]
- Yang, J.; Zhuang, H.; Zhang, G.; Tang, B.; Xu, C. Seismic performance and fragility of two-story and three-span underground structures using a random forest model and a new damage description method. Tunn. Undergr. Space Technol. 2023, 135, 104980. [Google Scholar] [CrossRef]
- Tong, L.; Wang, D.; Sun, Z.; Chen, L.; Shi, F. Seismic Uplift Effect at End Spans of Long-Span Rigid-Frame Bridges Subjected to Near-Fault and Far-Fault Ground Motions. J. Bridg. Eng. 2023, 28, 5023001. [Google Scholar] [CrossRef]
- Shutong, C.; Kassem, M.M.; Jalilluddin, A.M.; Nazri, F.M.; Wenjun, A. The effect of bridge girder-bearing separation on shear key pounding under vertical earthquake action—A state-of-the-art review. Structures 2023, 55, 2445–2460. [Google Scholar] [CrossRef]
- Pai, L.F.; Wu, H.G.; Sun, H.; Ma, Z.G. Shaking table test of the dynamic response of a tunnel across a main sliding surface. Int. J. Rock Mech. Min. Sci. 2023, 169, 105440. [Google Scholar] [CrossRef]
- Zhang, J. Dynamic analysis of fixed platforms equipped with mass dampers under earthquake loading using crow search algorithm. In Multiscale and Multidisciplinary Modeling, Experiments and Design; Springer: Berlin/Heidelberg, Germany, 2023; pp. 1–13. [Google Scholar] [CrossRef]
- Zarinfar, M. Investigating the Effect of Soil Layering on Soil-structure Interaction under Seismic Load. Int. J. Eng. 2022, 35, 1989–2006. [Google Scholar] [CrossRef]
- Moosavi, J.; Fathollahi-Fard, A.M.; Dulebenets, M.A. Supply chain disruption during the COVID-19 pandemic: Recognizing potential disruption management strategies. Int. J. Disaster Risk Reduct. 2022, 75, 102983. [Google Scholar] [CrossRef] [PubMed]
- Gheibi, M.; Eftekhari, M.; Akrami, M.; Emrani, N.; Hajiaghaei-Keshteli, M.; Fathollahi-Fard, A.M.; Yazdani, M. A Sustainable Decision Support System for Drinking Water Systems: Resiliency Improvement against Cyanide Contamination. Infrastructures 2022, 7, 88. [Google Scholar] [CrossRef]
Disclaimer/Publisher’s Note: The statements, opinions and data contained in all publications are solely those of the individual author(s) and contributor(s) and not of MDPI and/or the editor(s). MDPI and/or the editor(s) disclaim responsibility for any injury to people or property resulting from any ideas, methods, instructions or products referred to in the content. |
© 2023 by the authors. Licensee MDPI, Basel, Switzerland. This article is an open access article distributed under the terms and conditions of the Creative Commons Attribution (CC BY) license (https://creativecommons.org/licenses/by/4.0/).