Abstract
In the quest for sustainable and energy-efficient building solutions, the incorporation of phase change materials (PCMs) into building envelopes emerges as a groundbreaking strategy. PCMs, renowned for storing and releasing thermal energy during phase transitions, stand as a promising avenue to curtail energy consumption while enhancing thermal performance. This study rigorously explores the potential energy savings and thermal comfort benefits achievable through PCM integration into building envelopes. Multiple energy simulations are conducted on a residential building model in diverse locations, including Irbid, Amman, and Aqaba in Jordan, and the city of Oradea in Romania, utilizing the EnergyPlus simulation tool embedded in DesignBuilder software v7.0.2.006. The results reveal that BioPCM®, derived from renewable biomass, significantly elevates thermal performance owing to its heightened latent heat of fusion. Optimal outcomes materialize with a PCM melting point of 23 °C, a configuration closer to the interior surface, and a thickness of 37.1 mm. The study underscores the superior performance in moderate climates (Irbid and Amman) compared to hot-dry climates (Aqaba) and cold-wet climates (Oradea, Romania). Financially and environmentally, incorporating PCM in Amman demonstrates potential annual energy savings of 5476.14 kWh, translating to a cost reduction of 1150 USD/year, and a decrease in GHG emissions by 2382.31 kgCO2eq. The estimated payback period for PCM incorporation in external walls is four years, robustly emphasizing the feasibility and multifaceted benefits of this energy-efficient solution.
1. Introduction
Sustainable development encompasses a range of goals and strategies, such as environmental conservation, energy efficiency, and the adoption of green building concepts [1,2]. This holistic approach includes efficient energy production [3], improved insulation in thermal energy transport and distribution networks [4], and measures to reduce consumer demand without compromising comfort. As the global emphasis on sustainable construction intensifies, the integration of innovative technologies, like phase change materials (PCMs), becomes crucial.
This paper explores the energy-saving potential and thermal comfort benefits of incorporating PCMs in building envelopes in Jordan and Romania. Additionally, it lays the groundwork for future investigations into the application of PCM technology in the diverse building landscape of Romania. Given Romania’s rich architectural heritage and varying climatic conditions, it presents an intriguing context for integrating innovative building solutions [1,2]. Upcoming research will focus on Romania’s specific building types, including residential, commercial, and institutional structures, adapting PCM technology to local architectural and climatic needs.
1.1. Residential Sector in Jordan
The building sector plays a pivotal role in global energy consumption, accounting for approximately 40% of energy demand in Europe and Australia and around 39% in the United States [5]. In Jordan, the impact of residential buildings is particularly significant, contributing to 21.5% of final energy consumption and 48% of total electricity consumption [6,7]. With projections indicating a sustained increase in energy demand, the need for effective interventions in the residential sector is crucial. These interventions are key to achieving significant economic, social, and environmental benefits. Figure 1 illustrates the electrical energy consumption by sector in Jordan for the year 2021 [7].
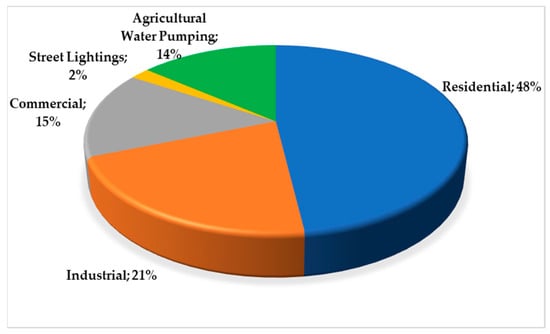
Figure 1.
Electrical energy consumption portions by sector in Jordan, 2021.
Urbanization, population growth, and rising living standards are primary drivers of the increasing energy demands in Jordan’s residential sector [8]. The urban population in Jordan reached 93.2% in 2021, with over 90% of Jordanians residing in urban areas, notably in Amman, which houses more than 43% of the country’s population [9]. This rapid urbanization, largely driven by migration from rural areas seeking better opportunities and services, has a profound impact on energy consumption. In particular, the urban subsector is responsible for 84% of residential energy consumption in Jordan [6].
Furthermore, the high proportion of time spent indoors by individuals, often exceeding 90%, emphasizes the significant role of buildings in overall energy consumption patterns [10]. Space heating and cooling alone account for 61% of household energy use and approximately 14% of global energy demand [11]. The building sector is, thus, a leading contributor to global energy consumption. Predictions suggest that energy consumption for space heating and cooling could account for about 37% of total global energy demand by 2050 [12]. Therefore, optimizing building envelopes and implementing more efficient HVAC systems are vital strategies for ensuring indoor thermal comfort while reducing energy consumption for these purposes. Regarding building envelopes, ref. [13] critically reviewed climate-adaptive building envelopes and biomimetic solutions, analyzing various adaptive and biomimetic envelope examples.
1.2. Building Envelopes in Jordan
The building envelope acts as the interface between indoor and outdoor environments, crucially regulating heat flow from inside to outside in winter and vice versa in summer. Essential for achieving energy-efficient thermal performance, modifications to the building envelope adjust heating and cooling loads to meet internal thermal requirements. Components of the building envelope encompass external walls, roof, floor, external windows, and doors.
The building envelope’s heat transfer often results in substantial heat loss or gain, prompting scholars to focus on energy-saving technologies. These include optimizations in insulation materials [14], low-emittance windows [15], hollow windows [16], Trombe walls [17], thermally activated building systems [18], and enhancements to building codes [19]. While developed countries have adopted concepts like nearly zero-energy buildings, many developing nations, particularly in the MENA region, lack such standards, especially for hot and tropical climates [20]. In Jordan, building insulation codes are defined by the National Building Council under the National Building Law [21], ensuring specified requirements and regulations for construction activities, from permitting to surveillance phases.
Among the common typical externally insulated wall structures in residential buildings in Jordan are those illustrated in Figure 2. Basically, walls consist of five main layers arranged from the outer layer (right side) as follows: hard stone, concrete, thermal insulation (mainly extruded polystyrene), hollow blocks, and cement plaster.
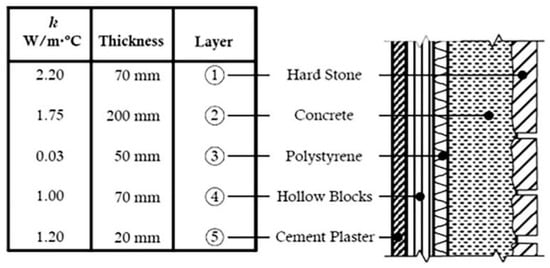
Figure 2.
Typical externally insulated wall construction design in Amman [22].
According to the Jordan National Building Council, the maximum allowable walls’ overall heat transfer coefficient (U-value) according to the codes is 0.57 W/m2∙K [20]. The overall heat transfer coefficient (U-value) is the rate of heat flow through a unit area of building envelope material or assembly, including its boundary films, per unit of temperature difference between the inside and outside air, and it is expressed in (W/m2∙K). Unfortunately, most of the external walls in Jordanian buildings are either uninsulated or poorly insulated, as shown in Figure 3a,b, which illustrates real examples of the most common constructed walls in residential buildings in Jordan [23].
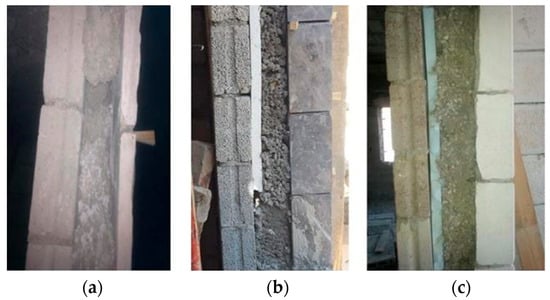
Figure 3.
Real examples of constructed walls in residential buildings in Amman, Jordan. (a) Uninsulated wall; (b) poorly insulated wall; (c) fully insulated wall.
1.3. Building Envelopes in Romania
The contemporary residential infrastructure in Romania primarily originates from the era spanning from 1960 to 1989, marked by the absence of widespread adoption of effective thermal insulation strategies. A substantial proportion of the housing stock falls within the age bracket of 15 to 55 years, characterized by insufficient thermal insulation and notable structural deterioration. The age-dependent composition of the Romanian residential inventory is graphically depicted in Figure 4 [24].
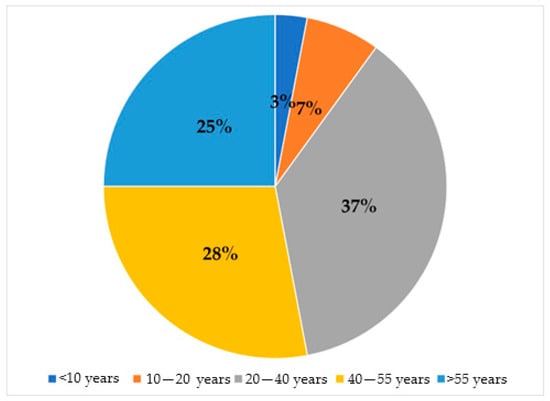
Figure 4.
Distribution of Romanian residential buildings based on construction periods, adapted from [24].
The energy consumption distribution in the annual energy balance of a medium-sized apartment constructed between 1970 and 1985 is shown in Figure 5. When considering the entire housing stock in Romania, the efficiency of heat utilization for heating, hot water, and cooking reaches only 43% of the total supplied heat quantity [24]. It is evident that space heating constitutes the predominant final energy consumer in Romanian buildings.
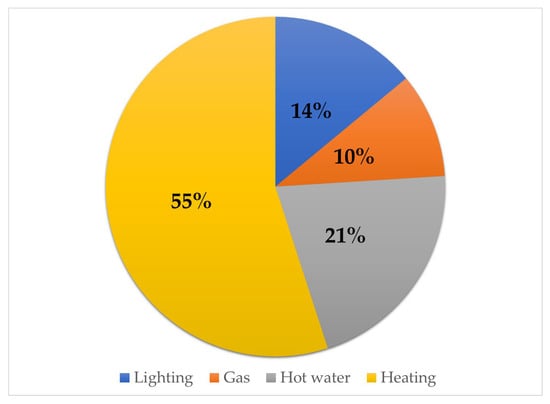
Figure 5.
Breakdown of energy consumption in a residential apartment, adapted from [24].
Until 1984, various types of walls were employed in civil buildings, resulting in distinct thermal performances contingent on wall composition. Figure 6 illustrates the primary design types utilized for the envelope walls of buildings constructed before 1984. A comparative analysis of the minimum heat flow resistances mandated and the actual heat flow resistances of these exterior wall types indicates that the latter fell short of meeting the prescribed thermal insulation standards. The walls exhibited resistances to heat flow within the range of 0.54 to 0.97 m2∙K/W [24].
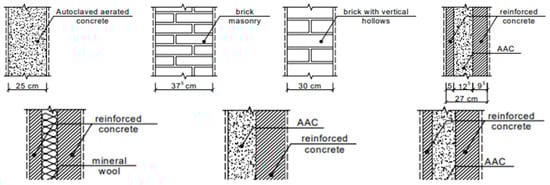
Figure 6.
Architectural construction specifications for walls implemented until 1984, adapted from [24].
Following 1984, the emphasis on energy conservation prompted a shift in design solutions for exterior walls in residential buildings. The newly adopted solutions resulted in surpassing the minimum resistances mandated for envelope elements. Figure 7 provides detailed design specifications for exterior walls utilized in residential buildings since 1985 [23].
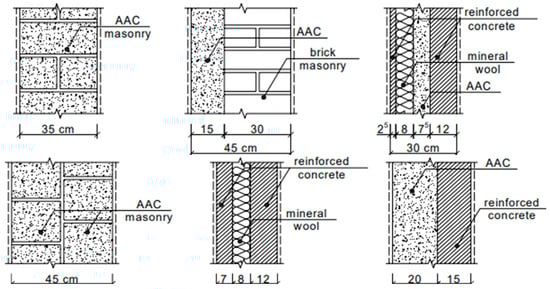
Figure 7.
Architectural construction specifications for walls implemented after 1984, adapted from [24].
For buildings constructed after 1984, notable proposed solutions were given for enhancing heat flow resistance that surpassed the required minimum. However, practical implementation was inconsistent, leading to deficiencies in envelope elements concerning energy efficiency and comfort. Commonly used thermal insulation materials included cellular autoclaved concrete and mineral wool, each with diverse hygro-thermal characteristics. Polystyrene, considered expensive at the time, was less utilized. Consequently, it can be inferred that, for a majority of post-1984 buildings, the envelope elements in contact with the exterior fail to meet thermal and hygro-thermal requirements, necessitating comprehensive rehabilitation with implications for hygro-thermal comfort and energy conservation.
1.4. PCM Contribution to Sustainability
PCMs have been proven to have remarkable potential in different heat transfer and energy storage applications. Studies have investigated the potential of PCMs as thermal storage media in refrigeration and air-conditioning systems [25], heat storage tanks [26], solar distillers [27], and solar cookers [28]. They are often used as heat sink media in electronic devices [29] and photovoltaic modules [30]. Furthermore, PCMs are utilized as insulation materials in shipping containers [31], for heat dissipation in electrical distribution transformers [32], and efficiently incorporated with buildings’ envelope as thermal mass storage.
The integration of PCMs into construction materials enhances thermal regulation, promoting energy efficiency and comfort in buildings, as shown in Figure 8. This sustainable approach aligns with the social, economic, and environmental dimensions of development. In the social realm, PCMs reduce heating and cooling demands, ensuring prolonged indoor comfort. Environmentally, they harness solar energy, reducing reliance on non-renewable sources and decreasing pollutant emissions. Economically, PCMs cut energy expenses, showcasing potential in optimizing energy consumption, enhancing comfort, and supporting sustainable development goals [33].
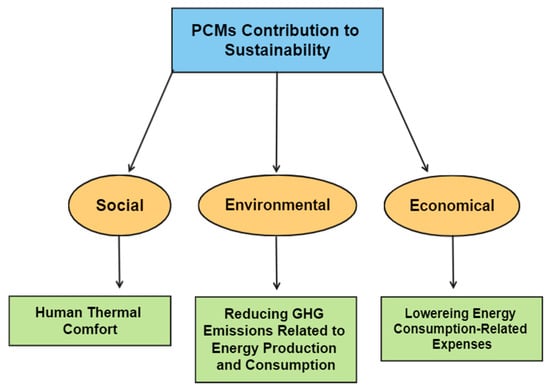
Figure 8.
Incorporation of PCMs in buildings and its contribution to sustainability [33].
Several studies highlight the potential of PCMs to moderate indoor temperature fluctuations by storing and releasing latent heat. In [34], a comprehensive review considered thermo-physical properties and applications of PCMs in buildings. Al-Yasiri and Szabo extensively analyzed PCM benefits in building envelopes, emphasizing reduced energy consumption and enhanced comfort [10]. Combining PCMs with materials like aerogels, as explored in [35], offers a promising retrofitting solution for existing building envelopes. This research underscores the significance of PCM integration in sustainable building design, providing insights into material and configuration optimization for effective thermal management. Rahemipoor et al. [36] explored an innovative approach by integrating macro-encapsulated PCMs into a 3D-printed geopolymer paste (GPP) derived from fly ash, revealing its effectiveness in building envelopes for optimal thermal performance.
Studies demonstrate concentrated applications of PCMs in regions with diverse climate conditions, capitalizing on their energy-saving potential. Lamrani et al. conducted comprehensive evaluations of PCM integration in building wall construction, emphasizing its impact on energy efficiency across various climatic zones [37]. Facundo et al. presented an optimization-based method for designing passive latent energy storage using PCMs with different melting temperatures, emphasizing the importance of aligning PCM melting temperature with indoor thermal comfort [38]. Köse and Manioğlu assessed the performance of a building envelope constructed with PCMs concerning orientation in different climatic regions. They find that increasing PCM thickness gradually decreases energy loads, and PCM performance varies based on facade orientation, with superior performance on western and eastern facades [39].
A review by Dehong et al. advocated biobased PCMs as promising alternatives to paraffin PCMs due to their derivation from renewable sources, like plants and animal fats, coupled with excellent heat storage properties [40]. Qu et al. conducted a multi-factor analysis on thermal comfort and energy-saving potential in PCM-integrated buildings, achieving a notable 34.8% energy reduction using BioPCM23 in external walls [41]. Abdullah et al. demonstrated a 15.6% energy saving with WinCo Enerciel PCM, highlighting the efficiency of PCMs with lower thermal conductivity, higher latent heat of fusion, and phase change temperatures closer to room temperature [42]. Kishore et al. investigated PCM contributions in thermal load modulation through numerical simulations, revealing a potential 70% reduction in wall-related heat gain during peak hours without a significant cumulative increase [43]. Kylili and Fokaides reviewed the life cycle assessment (LCA) of PCMs for building applications, concluding that PCMs are more environmentally friendly compared to conventional thermal insulating materials [44].
Incorporating PCMs into building envelopes proves highly effective in enhancing energy efficiency, notably reducing cooling and heating loads, particularly during peak demand periods. Zhou and Razaqpur conducted a comparison between a traditional building envelope and one with PCM integration, revealing a 20% overall thermal efficiency improvement [45]. The PCM-incorporated envelope demonstrated even thermal load regulation, reducing heat loss during PCM solidification by 29%. Similarly, Fagehi and Hadidi investigated PCM-integrated building envelopes in NEOM, Saudi Arabia, resulting in an impressive 11,681 kWh reduction in annual energy consumption compared to a reference building with conventional insulation [46].
In addition to PCMs, the optimization of energy efficiency in building infrastructure can be effectively accomplished through the implementation of the nearly zero energy buildings (NZEBs) concept [47,48], distinguished by their superior energy performance and substantially reduced overall energy consumption. Concurrently, the integration of the technology transfer paradigm, operationalized within the framework of the triple-helix model involving governmental bodies, the construction sector, and academic institutions, emerges as a pivotal strategy [49,50]. This collaborative approach facilitates the seamless exchange and application of advanced technologies, fostering a synergistic environment for innovation and sustainable energy practices within the construction domain [51,52].
This paper extends beyond existing studies by covering a wide geographical scope, analyzing diverse climatic regions across Jordan rather than limiting the focus to specific areas in Amman. This comprehensive approach facilitates a detailed analysis of PCM applications in various environmental conditions. A critical component of the study is the careful selection of PCM materials and a thorough analysis of their performance, offering new insights into the effectiveness of PCMs in different climates. Additionally, the study encompasses a comparative analysis with regions beyond Jordan, notably including extended simulations for Oradea, Romania. This inclusion provides a global perspective and validates the broader applicability of the findings. The research also places a strong emphasis on sustainability by focusing on eco-friendly PCM materials, contributing significantly to the conversation on sustainable building practices.
2. Materials and Methods
This section provided a comprehensive overview of the methodology, beginning with the selection of the location and detailing the specifications of the baseline building model. The development of PCM-integrated models was then described. A significant focus of this section was on the procedural details of conducting annual energy simulations. These simulations were critical for analyzing the latent heat effects of PCMs on building envelopes, offering insights into their potential impact on energy efficiency.
2.1. Location Selection
According to the literature examined in the literature review section, the performance of PCMs is sensitive to many factors, including their type, latent heat of fusion, melting point, PCM layer configuration with respect to the other components inside the external walls, the PCM layer thickness, and the outside climatic conditions, including the ambient air temperature, the sky clearness, and the solar radiation of any particular location. Therefore, the PCM-incorporated building envelope predominantly depends upon the climate of the site where the building is situated.
To evaluate the site-specific performance of PCM in detail, three locations were selected in Jordan based on the three types of climates prevailing in the country, namely, the capital city of Amman (31°57′47.3688″ N, 35°55′49.2924″ E) for temperate climate, Irbid governorate (32°33′5.2020″ N, 35°51′5.3244″ E) for Mediterranean climate, Aqaba governorate (29°31′36.01″ N, 35°00′28.01″ E) for hot and dry climate, and the city of Oradea in Romania (47°4′0″ N, 21°51′0″ E) for cold and wet climate. Table 1 shows the average daytime and nighttime temperature during summer and winter for the selected locations.

Table 1.
Average daytime and nighttime ambient temperature for the selected locations [53].
2.2. Procedure for the Simulation Process (Workflow)
The workflow diagram in Figure 9 illustrates the entire simulation process, encompassing tasks, such as data collection, building information modeling (BIM), gbXML file exportation, building energy modeling (BEM), model manipulation, PCM incorporation, simulation, and post-processing.
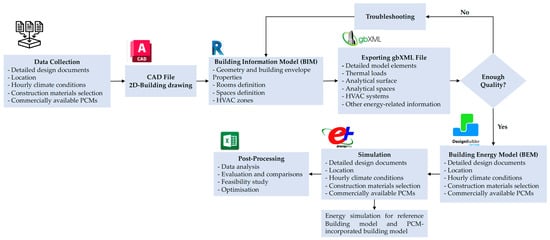
Figure 9.
Flowchart of the adopted methodology for the simulation process.
A two-story residential building model in Jordan was created using Autodesk Revit and DesignBuilder software, transitioning from a 2D Cad file to a 3D building model in Autodesk Revit. DesignBuilder, chosen for its comprehensive material library, particularly for PCMs, supplements Autodesk Revit’s absence of predefined PCM options. DesignBuilder, a Building Energy Performance Simulation (BEPS) tool, offers a user-friendly interface, a diverse range of building components and construction materials, and integrates with EnergyPlus simulation tool for energy simulations, daylighting analysis, and thermal load calculations. DesignBuilder’s compatibility with industry standards and software, such as Autodesk Revit (v23.0.11.19), streamlines the workflow, facilitating automatic data export through Green Building XML (gbXML) files. The gbXML file, an open-source schema, contains crucial building information.
2.3. Building Information Modeling (BIM)
The baseline building model, with conventional insulation, was developed using Autodesk Revit after evolving the 2D CAD drawing file to 3D BIM object, with a total floor area of 205.87 m2 and a net conditioned area of 184.96 m2.
Figure 10 and Figure 11 show the ground and first-floor plans including rooms’ spaces division of the studied building, respectively. All spaces were identified in the software based on American Society of Heating, Refrigerating and Air-Conditioning Engineers ASHRAE standards integrated in [54], considering the occupancy type of each space inside the building, as illustrated in Table 2, which summarizes the sensible and latent heat gains, the lighting and power load densities, the infiltration flow rate, and the occupancy schedule.
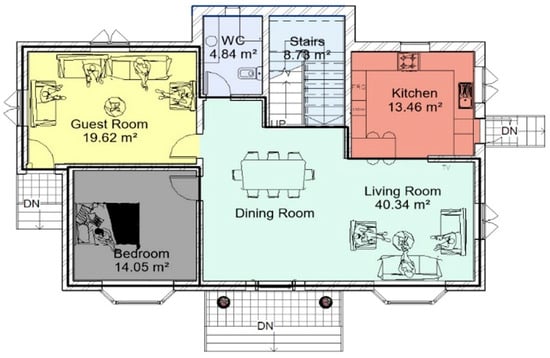
Figure 10.
Ground-floor plan.
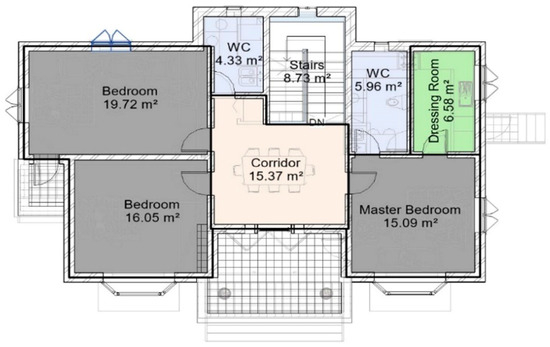
Figure 11.
First-floor plan.
Table 2.
Conditioned spaces characteristics (occupancy schedule − residential/24 h), adapted from [54].
In the context of this study, the building is characterized as a well-sealed construction, featuring an average infiltration flow rate of 0.19 L/s·m2, as detailed in Table 2. Converting this value to 0.23 air changes per hour (ACH), considering a floor height of three meters, is noteworthy. Subsequently, spaces were categorized into thermal zones based on HVAC system characteristics and space boundary conditions. The modeling process for the reference design was facilitated within the Revit BIM environment, utilizing user-friendly tools that allow for the creation of custom object families by modifying default libraries. Analytical surfaces, space types, and solar analysis were the primary objects employed in energy modeling.
Moreover, Autodesk Revit employs the cumulative insolation method to conduct solar analysis on the building, considering solar information from sunrise to sunset throughout the year, based on available weather data for the specified location. In Amman city, for example, the results reveal that solar radiation reaches 1818 kWh/m2 on the roof and certain sections of the southern façade, while the remainder of the building receives approximately 980 kWh/m2, as illustrated in Figure 12.
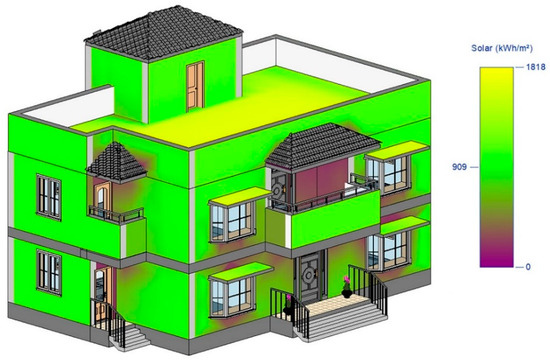
Figure 12.
Solar analysis of the building model in Amman city.
Regarding the thermal properties of the external building elements, such as walls, floors, and roofs, they were assessed by calculating their U-values and thermal capacities, considering the materials used in their construction. Accordingly, the characteristics of the main envelope components for the reference building model are summarized in Table 3.
Table 3.
Characteristics of the reference building envelope components, adapted from [54].
Since this paper focuses on the use of PCMs integrated into the exterior walls for thermal energy storage in terms of energy efficiency, Table 4 summarizes the thermal properties of the external wall layers arranged from the exterior to the interior side, along with Figure 13, which visually reveals the layers of the exterior wall for the reference building model.
Table 4.
Thermal properties of the exterior wall layers, adapted from [54].
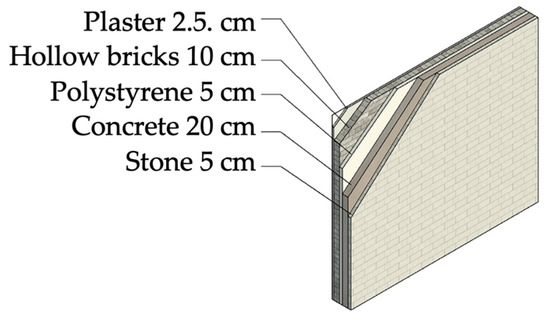
Figure 13.
Visual illustration of the exterior wall layers for the reference building model.
2.4. Building Energy Model (BEM)
BEM was initially constructed using AutoDesk Revit, leveraging features for the automatic generation of analytical spaces and surfaces. These objects encapsulate information inputted during modeling and are subsequently compiled in the gbXML file. The energy model underwent scrutiny to ensure proper boundary conditions for spaces and surfaces. Subsequently, another energy model was established for the building by importing the gbXML file into DesignBuilder software, as illustrated in Figure 14. The BEM model was then primed for modifications to the building envelope, replacing conventional insulation material (extruded polystyrene) with suitable phase change materials in the exterior wall layers. This modification aims to scrutinize and compare the effects on the thermal performance of the studied building.
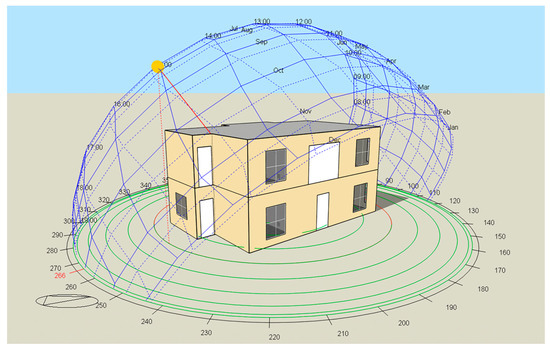
Figure 14.
Building model as illustrated in DesignBuilder software.
Furthermore, the HVAC system was schematically defined as energy object included in the BEM model by means of the HVAC plant templates in DesignBuilder software. The HVAC system used in the building is VRF–air cooled–heat recovery–DOAS system, with all conditioned spaces in the building grouped in one thermal HVAC zone.
Moreover, a dedicated outdoor-air system (DOAS) was employed with a variable refrigerant flow (VRF) system. In this configuration, the DOAS manages air ventilation, while the VRF system handles cooling and heating tasks. This integrated approach enhances ventilation efficiency and temperature control, ultimately optimizing the overall performance of the HVAC system. Figure 15 provides an overview of the HVAC system utilized in the building, with all energy-related data incorporated into the pre-defined template within DesignBuilder software. These data are instrumental in the subsequent energy analysis and simulation, encompassing various energy consumption sources.
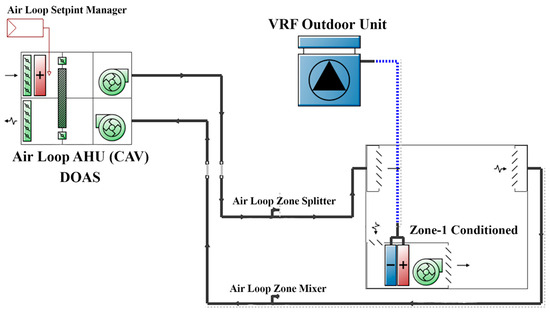
Figure 15.
Schematic representation of the VRF–air cooled–heat recovery–DOAS HVAC system.
2.5. Evaluation Criteria
The reference energy model used for comparison with PCM-integrated building models aimed to assess energy-saving measures. This study explores the latent heat effect of PCMs within the building envelope, particularly in external walls, through annual energy simulations with and without PCM incorporation. The investigation aims to determine optimal PCM specifications under varying Jordanian climatic conditions as well as in Oradea. The parameters examined include finding the ideal melting point, PCM type, configuration within external wall layers, layer thickness, and performance across different climates. Multiple quantitative simulations were conducted for each category to identify optimal values for significant energy savings.
2.5.1. PCM Melting Point
This paper delves into assessing the thermal and energy performance based on PCM integration with different melting points (21 °C, 23 °C, 25 °C, 27 °C, and 29 °C). The evaluation focuses on BioPCM®, with fixed parameters, such as layer configuration, thickness, and weather data, for Amman city.
2.5.2. PCM Type
This paper considers the careful selection of PCM types based on factors, like application, operating temperature range, thermal stability, and cost. The evaluation focuses on three commercially available PCM products pre-defined in DesignBuilder’s software database: BioPCM®, InfiniteR PCM, and WinCo EnerCiel PCM.
BioPCM, derived from renewable biomass sources, is an environmentally friendly alternative to traditional PCMs, being non-toxic and biodegradable. InfiniteR PCM, composed of inorganic compounds like salt hydrates, exhibits a high heat of fusion, enabling significant thermal energy storage during phase transition. WinCo Enerciel PCM, a non-toxic and environmentally friendly option, utilizes eutectic mixtures, specifically polyethylene glycol, offering suitable latent heat capacity and melting temperatures for various thermal energy storage applications. Table 5 summarizes the specifications and thermal properties of the studied PCM products.
Table 5.
Specifications and thermal properties of the studied PCM types, adapted from [54].
2.5.3. PCM Layer Configuration
The PCM layer configuration effect depends on the external weather conditions along with the internal set point for the HVAC system inside the building. While the literature suggests this effect depends on external weather conditions and internal HVAC set points, the focus here is on evaluating the best PCM configuration among external wall layers. Specifically, this study explores a single PCM layer in three positions: closer to the interior side, in the middle, and closer to the exterior side of the external wall. All the other parameters will remain fixed during the evaluation process, with the only variable being the position of the PCM layer among other external wall layers. Figure 16 illustrates the PCM-incorporated external wall layers with the tested PCM configurations.
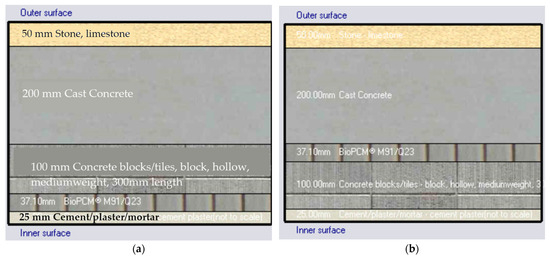
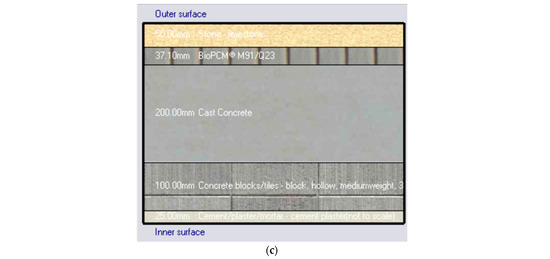
Figure 16.
BioPCM® M91/Q23-incorporated external wall layers with the tested PCM configuration, (a) closer to the interior side, (b) in the middle, and (c) closer to the exterior side of the external wall.
2.5.4. PCM Layer Thickness
PCM layer thickness is considered a particularly important factor for adjusting diurnal temperature variation inside the buildings. Therefore, finding the optimal thickness for the PCM layer inside the external wall is crucial. In this regard, the evaluation process includes investigating the external wall with different PCM layer thicknesses while fixing all other measures to focus on finding the optimal PCM sheet thickness that will achieve the best results for the specific application. However, the PCM products, which were previously specified in Section 2.5.2 come in macro-encapsulated panels that have specific thicknesses. For instance, BioPCM® comes in different sizes of macro-encapsulated PCM panels with three available thicknesses of 11.2 mm, 20.8 mm, and 37.1 mm. These panels can even be installed within the wall assembly during the construction phase or can be directly attached to the wall during the retrofitting phase using adhesive or fasteners, depending on the manufacturer’s recommendations.
3. Results and Discussion
3.1. Baseline Building Model
Energy simulations were conducted on this model in different locations, particularly, Amman, Irbid, Aqaba, and Oradea, to use them as a comparison reference with energy results obtained from the PCM-incorporated building models. Figure 17 shows the percentage distribution of the electrical energy consumption in the baseline building model in Amman, Irbid, Aqaba, and Oradea.
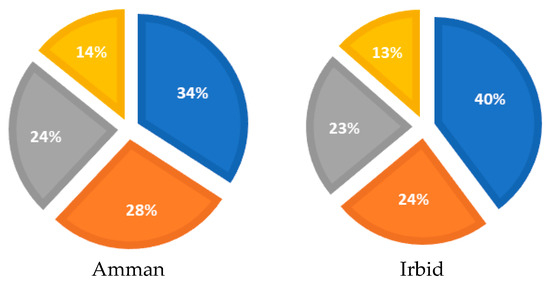
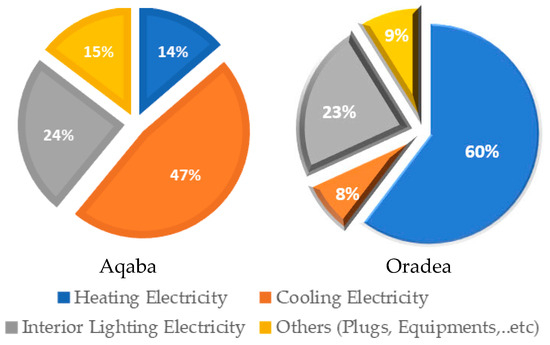
Figure 17.
Percentage distribution of the electrical energy consumption in the baseline building model in Amman city, Irbid city, Aqaba city, and Oradea city.
For the city of Amman, the baseline building model with extruded polystyrene insulation exhibits annual electricity consumption of 9283.38 kWh for heating, 7574.54 kWh for cooling, 6465.58 kWh for interior lighting, and 3871.55 kWh for other electrical loads such as plugs and equipment. For Irbid city, the baseline building model incorporating extruded polystyrene insulation demonstrates annual electricity consumption of 11,420.19 kWh for heating and 6926.15 kWh for cooling. For Aqaba, the baseline building model with extruded polystyrene insulation exhibits annual electricity consumption of 3626.72 kWh for heating and 12,501.29 kWh for cooling. For Oradea city, the baseline building model, with mineral wool fibers as insulation medium, demonstrates annual electricity consumption of 20,251.03 kWh for heating and 2620.26 kWh for cooling.
Additionally, the electrical energy intensity or the energy use intensity (EUI) for the baseline building model was calculated by dividing the total electricity consumption by the conditioned and total floor areas of the building. Energy use intensity (EUI) refers to the amount of electrical energy consumed per unit of area or a specific activity. This measure is used to assess the efficiency of electrical energy use in various contexts including the buildings sector.
Accordingly, monitoring the energy use intensity (EUI) is crucial to track progress in buildings’ energy efficiency and sustainability goals. Therefore, lower EUI is desirable as it signifies a more efficient use of energy resources, which can contribute to energy cost savings and reduced greenhouse gas emissions. In this regard, the following tables demonstrate the electrical energy intensity and the HVAC electricity intensity per conditioned and total floor areas for the baseline building model in the specified location; the results are listed in Table 6.
Table 6.
Energy use intensity (EUI) for the baseline building model in Amman, Irbid, Aqaba, and Oradea.
The ideal value for EUI in a residential building depends on a few factors, including the climate, the type of building, and the occupants’ lifestyle. According to the Building Energy Efficiency Standard (BEES), the average value of the EUI for residential buildings is 115.14 kWh/m2/year [55].
Accordingly, the EUI values per total floor area of the baseline building model, as illustrated in the above tables, are 132.10, 139.33, 128.55, and 162.97 (kWh/m2/year) for Amman, Irbid, Aqaba, and Oradea, respectively. Although the resulted EUI values are slightly higher than the average value, these values are to be modified by means of phase change materials.
3.2. PCM-Incorporated Building Model
The annual energy simulation results for the PCM-incorporated building models are presented in this section Finding the optimal melting point for PCM typically involves investigating the thermal and energy performance of the building after integrating phase change materials with different phase transition temperatures.
3.2.1. Optimal Melting Point
The simulation results for the comparison of heating and cooling loads between the baseline building model, featuring extruded polystyrene insulation, and PCM-incorporated building models with varied phase transition temperatures reveal substantial energy-saving potential. For the PCM with a melting point of 21 °C, heating and cooling loads experienced reductions of 31.30% and 18.22%, respectively. At a melting point of 23 °C, the reductions were 34.38% for heating and 23.33% for cooling. Similarly, for the PCM with a melting point of 25 °C, reductions were 31.56% for heating and 17.06% for cooling. The PCM with a melting point of 27 °C demonstrated reductions of 24.90% for heating and 11.44% for cooling. Lastly, the PCM with a melting point of 29 ºC resulted in an 11.75% reduction for heating and a 4.91% reduction for cooling. Overall, incorporating PCMs into building envelopes exhibits a consistent trend of significant reductions in both heating and cooling loads across different melting points, highlighting the potential for substantial energy savings.
As directly observed from the simulation results, the PCM with a phase transition temperature of 23 °C reached the highest energy-saving rate compared with the baseline simulation results and the other melting points. As illustrated in Figure 18, the total energy-saving rate achieved by incorporating PCM with a melting point 23 °C is 18.23%, compared with the energy-saving rates of 15.76%, 15.53%, 11.69%, and 5.38% for melting points of 21 °C, 25 °C, 27 °C, and 29 °C, respectively.

Figure 18.
Annual electrical energy consumption chart for PCM-incorporated building with melting point 23 °C compared with the baseline building model.
Figure 19 shows an HVAC energy comparison chart for the different melting points of PCM. It is worth mentioning that since the indoor set point temperature for the HVAC system used in the energy simulation of the building was 23 °C, these results comply with the literature [38,45], as they proved that the optimal PCM melting point should be close to the indoor set point of the HVAC system.
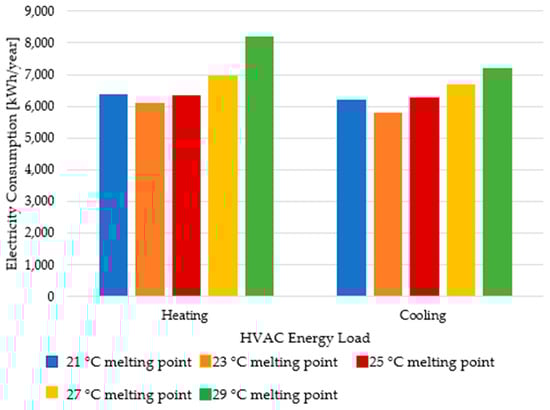
Figure 19.
HVAC energy comparison chart for the tested PCMs with different melting points.
Another observation was noticed from the energy simulation results; PCMs can perform better in reducing the heating load more than the cooling load. For the PCM with a melting point of 23 °C as an example, the energy-saving rate for heating is −34.38%, while for cooling, the energy-saving rate is −23.33%. This might be caused by the fact that in Jordan, the daily temperature fluctuation during the winter season is higher than that in summer, resulting in a higher effect of the latent heat of fusion for these materials.
3.2.2. PCM Type Evaluation
Investigating the most suitable PCM type for building application includes evaluating three commercially available PCM products that are pre-defined in the DesignBuilder software database, namely, BioPCM®, InfiniteR PCM, and WinCo EnerCiel PCM. The annual energy simulation results for the building after incorporating the specified PCM products underscore the energy-saving potential of incorporating these PCM products into building envelopes. In comparing the baseline building model with extruded polystyrene insulation to the building after incorporating three commercially available PCM products, significant reductions in electrical energy consumption were observed. For BioPCM® M91/Q23, the PCM-incorporated building demonstrated a 34.38% reduction in heating and a 23.33% reduction in cooling, resulting in an overall 18.23% reduction in total end-use energy. InfiniteR PCM23 showed even more substantial reductions, with a 37.21% decrease in heating and a 14.74% decrease in cooling, contributing to a total end-use energy reduction of 16.81%. WinCo Enerciel PCM 23 exhibited an 11.58% reduction in heating and an 8.89% reduction in cooling, leading to a 6.43% decrease in total end-use energy.
As directly observed from the simulation results, the building incorporated with BioPCM® M91/Q23 reached the highest energy-saving rate compared with the baseline simulation results and the other PCM types. The total energy-saving rate achieved by incorporating a single layer of BioPCM® M91/Q23 to the external wall of the proposed building model is 18.23%, compared with energy-saving rates of 16.81% and 6.43% for InfiniteR PCM23 and WinCo Enerciel PCM 23, respectively. Figure 20 shows the HVAC energy comparison chart for the tested types of PCM.
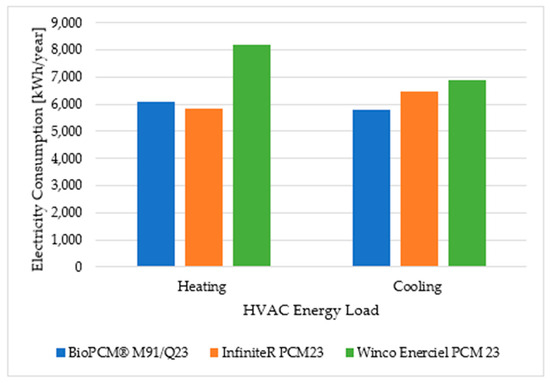
Figure 20.
HVAC energy comparison chart for the tested PCM products.
3.2.3. Optimal PCM Configuration
Evaluating the best PCM configuration among the external wall layers is carried out by investigating a single PCM layer in the middle, closer to the interior side, and closer to the exterior side of the external wall. In the comparison between the baseline building model with extruded polystyrene and the building after incorporating a single sheet of BioPCM® at different positions within the external wall, notable reductions in electrical energy consumption were observed. Placing the PCM in the middle of the external wall resulted in a 34.38% reduction in heating and a 23.33% reduction in cooling, contributing to an 18.23% total end-use energy reduction. Positioning the PCM closer to the interior side led to even greater reductions, with a 38.79% decrease in heating and a 24.76% decrease in cooling, resulting in a substantial 20.14% total end-use energy reduction. Similarly, placing the PCM closer to the exterior side resulted in a 32.53% reduction in heating and a 16.18% reduction in cooling, contributing to a 15.61% total end-use energy reduction.
As clearly observed from the simulation results, the building incorporated with BioPCM® closer to the interior surface of the external wall reached the highest energy-saving rate compared with the baseline simulation results and the other PCM configurations, as illustrated in Figure 21. These results comply with the literature [37,39], as they proved that the optimal PCM layer configuration should be closer to the interior surface of the external wall. Figure 22 illustrates an HVAC energy comparison chart for the tested PCM configurations.
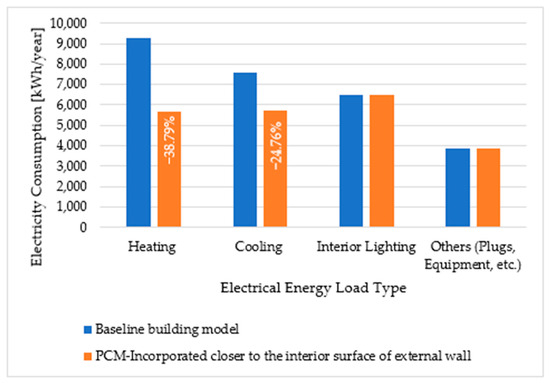
Figure 21.
Annual electrical energy consumption chart for the building incorporated with BioPCM® layer closer to the interior surface of the external wall compared with the baseline model.
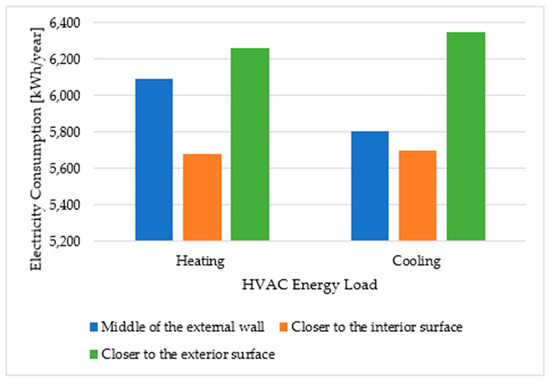
Figure 22.
HVAC energy comparison chart for the tested PCM configurations.
3.2.4. Optimal PCM Panel Thickness
Finding the optimal thickness for the PCM layer inside the external wall includes investigating the external wall with different PCM panel thicknesses, particularly 11.2 mm, 20.8 mm, and 37.1 mm, while fixing all other measures to focus on finding the optimal thickness of the incorporated PCM panel that will achieve the best results for the specific application. In evaluating the impact of different thicknesses of a single sheet of BioPCM® on the baseline building model with extruded polystyrene, the findings highlight the significance of PCM thickness in achieving optimal energy-saving results.
The results indicate that increasing the thickness of the incorporated BioPCM® panel contributes to greater reductions in electrical energy consumption. For a thickness of 11.2 mm, the PCM-incorporated building model demonstrated a 28.50% reduction in heating and a 14.28% reduction in cooling, resulting in a total end-use energy reduction of 13.71%. A thickness of 20.8 mm led to more substantial reductions, with a 31.93% decrease in heating and a 19.19% decrease in cooling, contributing to a 16.25% total end-use energy reduction. Further increasing the thickness to 37.1 mm resulted in even greater reductions, with a notable 38.79% decrease in heating and a 24.76% decrease in cooling, achieving a significant 20.14% total end-use energy reduction, as shown in Figure 23. Figure 24 shows an HVAC energy comparison chart for the tested PCM layer thicknesses.
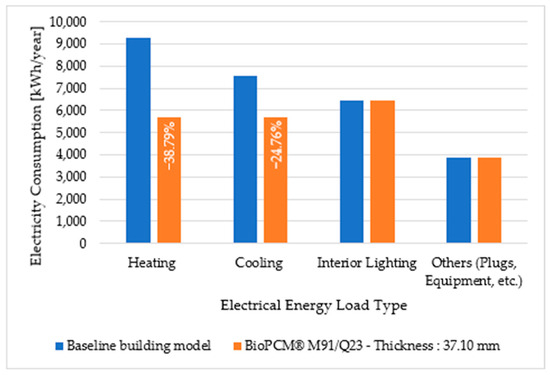
Figure 23.
Annual electrical energy consumption chart for the building incorporated with 37.10 mm layer thickness of BioPCM® M91/Q23 compared with the baseline model.
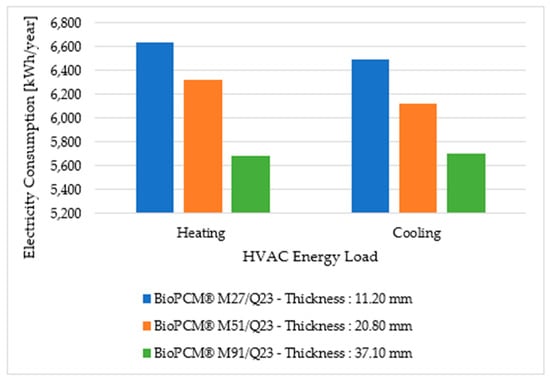
Figure 24.
HVAC energy comparison chart for the tested PCM layer thicknesses.
Simulation results revealed that the highest energy-saving rate was achieved in Amman (20.14%), followed by Irbid (19.78%), Aqaba (7.50%), and Oradea (5.64).
These results comply with the fact that PCMs can perform better in moderate climate conditions, like in Amman and Irbid, significantly more than their performance in very hot-dry climate conditions like in Aqaba city and cold-wet climate conditions like in Oradea city. This is due to the fact that average daily temperatures are closer to the PCM phase transition temperature of 23 °C. This proximity facilitates a greater latent heat of the fusion effect, stabilizing building temperatures and reducing HVAC system energy usage for indoor climate control. Furthermore, the energy use intensity (EUI) of PCM-incorporated buildings was notably lower than that of baseline models with conventional insulation in all locations, demonstrating a substantial reduction in total end-use energy. Table 7 compares the EUI and HVAC electricity intensity for PCM-incorporated and baseline building models in Amman, Irbid, Aqaba, and Oradea.
Table 7.
Energy use intensity (EUI) of the PCM-incorporated building compared with the baseline building in Amman, Irbid, Aqaba, and Oradea.
As illustrated in Table 7, a considerable reduction in the EUI could be achieved by incorporating PCM in the building envelope. Moreover, in Amman, as demonstrated in Table 7, the EUI value for the building after incorporating PCM with optimal specifications and properties could reach 117.42 kWh/m2/year, which is close enough to the average ideal value for green buildings of 115.14 kWh/m2/year stated by the Building Energy Efficiency Standard (BEES).
3.3. Validation of the Results
The study’s findings were further validated and enriched through a comparison with the conclusions of a reference paper [56] that focused on the use of environmentally friendly phase change materials (BioPCMs). This reference study conducted an in-depth analysis of the energy reduction capabilities of various BioPCMs, each with distinct enthalpy–temperature curves, and examined their effectiveness across a spectrum of metabolic rates. Key aspects of the reference study [55] include the following:
Selection of BioPCMs: The study utilized BioPCM M182/Q21, BioPCM M182/Q23, BioPCM M182/Q25, and BioPCM M182/Q27. Each of these BioPCMs has a unique enthalpy–temperature curve, which was crucial in determining their effectiveness in reducing energy consumption.
Heating and Cooling Needs: The first two BioPCMs (M182/Q21 and M182/Q23) were particularly effective, fully meeting the building’s heating requirements. They also contributed to cooling, with impact rates of 23.4% and 22.1% energy reduction, respectively.
The findings from the reference paper corroborate and expand upon the results of the study, offering a broader context and a deeper understanding of the efficacy of BioPCMs in energy conservation. The comprehensive analysis in the reference study reinforces the conclusion that integrating BioPCMs into building envelopes can significantly boost energy efficiency. This comparison validates the methodology and results of the study and highlights the potential of BioPCMs in real-world applications. It emphasizes their adaptability to different human occupancy conditions and their capability to effectively balance heating and cooling demands.
4. Financial and Environmental Analysis
4.1. Financial Feasibility
To assess the financial viability of incorporating the PCM in the studied building model described so far, we first need to determine the initial cost of incorporating these materials including the installation cost in the external walls. Afterwards, we need to subtract it from the cost of incorporating the conventional insulation material in the baseline building model, which is a 2.5 cm panel of XPS extruded polystyrene. The annual energy cost saving is then calculated by multiplying the yearly energy savings by the electricity tariff in Jordan. Finally, the expenses and the energy cost savings are utilized to estimate the payback period, to determine whether the application of PCMs in buildings is financially viable.
Accordingly, the price of a 3.7 cm panel thickness of BioPCM® M91/Q23 including the installation cost in the external walls of the building is 36.65 $/m2. The total gross area of the external walls is 179.60 m2. Therefore, the total cost of incorporating the external walls of the building with BioPCM® M91/Q23 is USD 6582.54. Additionally, the cost of installing a 2.5 cm panel of extruded polystyrene in the external walls of the building is 11.28 USD/m2. Therefore, the total cost of incorporating the extruded polystyrene insulation in the external walls of the building is USD 2025.40. Subtracting USD 6582.54 from USD 2025.40 will result in USD 4557.15 as a net expense.
The energy use intensity difference per total floor area for Amman city, as illustrated in Table 7, is 26.6 kWh/m2/year. Therefore, the annual energy savings for the PCM-incorporated building after multiplying 26.6 kWh/m2/year by the total floor area of the building will result in 5476.14 kwh energy saved per year. This is translated to approximately USD 1150 saved annually at an electricity tariff of 0.21 USD/kWh [57]. The payback period is then estimated by dividing the initial cost of incorporating BioPCM® M91/Q23 in the external walls of the building by the annual energy-saving amount, resulting in a payback period of 4 years, affirming the financial feasibility of PCM application and its economic benefits.
In Oradea, the price of electrical energy is approximately USD 0.3 per kWh. For heating, the city utilizes a district heating system that supplies thermal energy at USD 86 per Gcal (equivalent to USD 0.074 per kWh) [58], posing a question about the cost-effectiveness of PCM use considering the 5.64% energy savings observed in simulations. Notably, the heating energy price is subsidized by the City Council of Oradea, which influences the economic feasibility of PCM integration.
4.2. Environmental Viability
Incorporating PCMs into building envelopes, particularly BioPCMs, has the potential to mitigate temperature fluctuations, enhancing thermal comfort and contributing to sustainability goals by reducing energy consumption and carbon emissions. BioPCMs are environmentally friendly materials derived from renewable biomass sources, exhibiting non-toxic and recyclable properties. Unlike conventional insulation materials, BioPCMs do not generate emissions during manufacturing. To assess the energy-related environmental impact, the greenhouse gas (GHG) emissions equivalent to a kilowatt-hour (kWh) of electricity in Jordan (435 g of CO2e) are considered [59]. The emissions factor is based on the current electricity generation mix, primarily comprising natural gas and oil, with growing prospects for renewable sources like solar and wind power. The reduction in GHG emissions resulting from energy savings can be estimated using the formula: GHG reduced emissions (kg CO2e) = kWh of electricity saved × 0.435 kg CO2e per kWh. For Amman, with an annual energy saving of 5476.58 kWh/year, this corresponds to an estimated reduction of 2382.31 kg of equivalent carbon dioxide emissions per year (kgCO2e/year).
5. Conclusions
This paper presents a comprehensive study on the integration of bio-based phase change materials (BioPCMs) into building envelopes, aimed at enhancing energy efficiency in residential buildings in Jordan and the city of Oradea in Romania. The key findings, arranged according to their importance, are as follows:
- Incorporating BioPCMs led to a significant reduction in energy consumption, with a 34.38% decrease in heating and a 23.33% decrease in cooling energy compared to the baseline model at a melting point of 23 °C.
- The modeling and simulations revealed that BioPCMs significantly improved thermal performance, leading to more efficient heating and cooling in buildings.
- BioPCMs offer considerable environmental benefits, including non-toxicity, recyclability, reduced manufacturing emissions, and a notable reduction in greenhouse gas emissions, estimated at an annual decrease of 2382.31 kg of equivalent carbon dioxide.
- The BioPCM® M91/Q23 configuration demonstrated economic viability, with an estimated payback period of just four years.
- The simulation results showed the highest energy-saving rate in Amman (20.14%), followed by Irbid (19.78%), Aqaba (7.50%), and Oradea (5.64%).
- In moderate climates, like Amman and Irbid, where average temperatures align closely with the PCM’s phase transition temperature of 23 °C, PCMs showed enhanced performance, resulting in greater thermal stability compared to very hot-dry climates like Aqaba and cold-wet climates like Oradea.
- The close alignment of average daily temperatures with the PCM’s phase transition temperature in moderate climates led to decreased energy consumption by HVAC systems for maintaining indoor thermal comfort.
- Through all studied locations, the PCM-incorporated building models demonstrated a lower EUI compared to baseline models with conventional insulation, reflecting a substantial reduction in total end-use energy.
This paper conclusively demonstrates that integrating phase change materials (PCMs) into building envelopes significantly reduces energy consumption. This key outcome underlines the potential of PCM technology as an effective solution for enhancing building energy efficiency, particularly in the context of climate change and the growing need for sustainable energy practices in the building sector.
Author Contributions
Conceptualization, M.J. and H.A.M.; data curation, M.J. and C.C.B.; formal analysis, H.A.M. and C.B.; funding acquisition, C.B.; investigation, M.J., H.A.M., C.C.B. and T.B.; methodology, M.J. and H.A.M.; project administration, C.B.; supervision, C.B.; validation, T.B.; visualization, C.C.B.; writing—original draft, M.J., H.A.M. and C.B.; writing—review and editing, C.C.B. and T.B. All authors have read and agreed to the published version of the manuscript.
Funding
This research and APC were funded by the Romanian Ministry of National Education and Scientific Research, through National Council for Higher Education Funding, Contract No. CNFIS-FDI-2023-F-0426 with University of Oradea.
Data Availability Statement
Data provided in this article are supported by experimental results and by the mentioned references.
Acknowledgments
The authors would like to thank to the University of Oradea, Oradea, Romania, and the German Jordanian University, Amman, Jordan for the facilities and support provided.
Conflicts of Interest
The authors declare no conflict of interest. The funders had no role in the design of the study; in the collection, analyses, or interpretation of data; in the writing of the manuscript; or in the decision to publish the results.
References
- Bungau, C.C.; Bungau, T.; Prada, M.F.; Prada, I.F.; Moleriu, R.D. Sustainable Development through Green Buildings: Updated Bibliometric Analysis of the Literature in the Field. Rom. J. Mater. 2023, 53, 82–93. [Google Scholar]
- Bungau, C.C.; Bungau, T.; Prada, I.F.; Prada, M.F. Green Buildings as a Necessity for Sustainable Environment Development: Dilemmas and Challenges. Sustainability 2022, 14, 13121. [Google Scholar] [CrossRef]
- Bendea, G.; Bendea, C.; Secui, C.; Hora, C.; Necula, S.; Ciobanca, A. Energy Efficient and Environmentally Safe New Thermal Power Plant in Oradea. In Proceedings of the 2019 International Conference on Energy and Environment (CIEM), Timisoara, Romania, 17–18 October 2019; pp. 534–538. [Google Scholar]
- Bendea, G.; Felea, I.; Hora, C.; Bendea, C.; Felea, A.; Blaga, A. Energy Performance Analysis of a Heat Supply System of a University Campus. Energies 2023, 16, 174. [Google Scholar] [CrossRef]
- Ayadi, O.; Abdalla, O.; Hallaq, Y.; Aldalabih, A. Developing an Energy Benchmark for Residential Buildings in Jordan. In Proceedings of the International Renewable Engineering Conference (IREC), Amman, Jordan, 14 April 2021; pp. 1–5. [Google Scholar]
- Ministry of Energy and Mineral Resources, Amman, Jordan. Energy 2019—Facts and Figures. Available online: https://memr.gov.jo/En/List/Studies_and_Statistics (accessed on 22 November 2023).
- Ministry of Energy and Mineral Resources, Amman, Jordan. Annual Report 2021. Available online: https://memr.gov.jo/En/List/Annual_Reports (accessed on 21 November 2023).
- Zarei, M.; Zare, H. Energy Consumption Modeling in Residential Buildings. Archit. Urban Dev. 2013, 3, 35–38. [Google Scholar]
- The Department of Statistics of Jordan. Jordan in Figure 2021. Available online: https://dosweb.dos.gov.jo/products/jordan-in-figure2021/ (accessed on 22 November 2023).
- Al-Yasiri, Q.; Szabó, M. Incorporation of Phase Change Materials into Building Envelope for Thermal Comfort and Energy Saving: A Comprehensive Analysis. J. Build. Eng. 2021, 36, 102122. [Google Scholar] [CrossRef]
- Al-Hinti, I.; Al-Sallami, H. Potentials and Barriers of Energy Saving in Jordan’s Residential Sector through Thermal Insulation. Jordan J. Mech. Ind. Eng. 2017, 11, 141–145. [Google Scholar]
- International Energy Agency. The Future of Cooling. Opportunities for Energy-Efficient Air Conditioning. Available online: https://www.iea.org/reports/the-future-of-cooling (accessed on 22 November 2023).
- Sommese, F.; Badarnah, L.; Ausiello, G. A critical review of biomimetic building envelopes: Towards a bio-adaptive model from nature to architecture. Renew. Sustain. Energy Rev. 2022, 169, 112850. [Google Scholar] [CrossRef]
- Huang, H.; Zhou, Y.; Huang, R.; Wu, H.; Sun, Y.; Huang, G.; Xu, T. Optimum Insulation Thicknesses and Energy Conservation of Building Thermal Insulation Materials in Chinese Zone of Humid Subtropical Climate. Sustain. Cities Soc. 2020, 52, 101840. [Google Scholar] [CrossRef]
- Urbikain, M.K. Energy Efficient Solutions for Retrofitting a Residential Multi-Storey Building with Vacuum Insulation Panels and Low-E Windows in Two European Climates. J. Clean. Prod. 2020, 269, 121459. [Google Scholar] [CrossRef]
- Lyu, Y.-L.; Liu, W.-J.; Su, H.; Wu, X. Numerical Analysis on the Advantages of Evacuated Gap Insulation of Vacuum-Water Flow Window in Building Energy Saving under Various Climates. Energy 2019, 175, 353–364. [Google Scholar] [CrossRef]
- Liu, Y.; Hou, L.; Yang, Y.; Feng, Y.; Yang, L.; Gao, Q. Effects of External Insulation Component on Thermal Performance of a Trombe Wall with Phase Change Materials. Sol. Energy 2020, 204, 115–133. [Google Scholar] [CrossRef]
- Chung, W.J.; Park, S.H.; Yeo, M.S.; Kim, K.W. Control of Thermally Activated Building System Considering Zone Load Characteristics. Sustainability 2017, 9, 586. [Google Scholar] [CrossRef]
- Juaidi, A.; Anayah, F.; Assaf, R.; Hasan, A.A.; Monna, S.; Herzallah, L.; Abdallah, R.; Dutournié, P.; Jeguirim, M. An Overview of Renewable Energy Strategies and Policies in Palestine: Strengths and Challenges. Energy Sustain. Dev. 2022, 68, 258–272. [Google Scholar] [CrossRef]
- Al-Saeed, Y.W.; Ahmed, A. Evaluating Design Strategies for Nearly Zero Energy Buildings in the Middle East and North Africa Regions. Designs 2018, 2, 35. [Google Scholar] [CrossRef]
- Jordan National Building Codes. Energy Codes and Manuals. Available online: https://www.buildings-mena.com/files/JordanNationalBuildingCodes.pdf (accessed on 22 November 2023).
- Alsaad, M.; Hammad, M. Heating, and Air Conditioning for Residential Buildings, 1st ed.; National Library Department, The Hashemite Kingdom of Jordan: Amman, Jordan, 2011; ISBN 199/2/1995. [Google Scholar]
- Shamout, S.; Al-khuraissat, M. Your Guide to Building Envelope Retrofits for Optimising Energy Efficiency & Thermal Comfort in Jordan; National Library Department, The Hashemite Kingdom of Jordan: Amman, Jordan, 2018; ISBN 9789957878917. [Google Scholar]
- Dan, D.; Stoian, V.; Nagy-Gyorgy, T.; Daescu, C. Thermal Insulation of Old and New Buildings in Romania. Politehnica University of Timisoara. Available online: https://www.irbnet.de/daten/iconda/CIB11594.pdf (accessed on 10 December 2023).
- Nada, S.A.; Alshaer, W.G.; Saleh, R.M. Experimental Investigation of PCM Transient Performance in Free Cooling of the Fresh Air of Air Conditioning Systems. J. Build. Eng. 2020, 29, 101153. [Google Scholar] [CrossRef]
- Hirmiz, R.; Teamah, H.M.; Lightstone, M.F.; Cotton, J.S. Analytical and Numerical Sizing of Phase Change Material Thickness for Rectangular Encapsulations in Hybrid Thermal Storage Tanks for Residential Heat Pump Systems. Appl. Therm. Eng. 2020, 170, 114978. [Google Scholar] [CrossRef]
- Mevada, D.; Panchal, H.; kumar Sadasivuni, K.; Israr, M.; Suresh, M.; Dharaskar, S.; Thakkar, H. Effect of Fin Configuration Parameters on Performance of Solar Still: A Review. Groundw. Sustain. Dev. 2020, 10, 100289. [Google Scholar] [CrossRef]
- Bhave, A.G.; Kale, C.K. Development of a Thermal Storage Type Solar Cooker for High Temperature Cooking Using Solar Salt. Sol. Energy Mater. Sol. Cells 2020, 208, 110394. [Google Scholar] [CrossRef]
- Ren, Q.; Guo, P.; Zhu, J. Thermal Management of Electronic Devices Using Pin-Fin Based Cascade Microencapsulated PCM/Expanded Graphite Composite. Int. J. Heat Mass Transf. 2020, 149, 119199. [Google Scholar] [CrossRef]
- Elsheniti, M.B.; Hemedah, M.A.; Sorour, M.M.; El-Maghlany, W.M. Novel Enhanced Conduction Model for Predicting Performance of a PV Panel Cooled by PCM. Energy Convers. Manag. 2020, 205, 112456. [Google Scholar] [CrossRef]
- Owens, C.G.; Cox, J.N.; Horwath, P.F.; Sawafta, R.I. Thermal Energy Storage Systems Including a Shipping Container, a Heat Exchange Apparatus, and a Phase Change Material. U.S. Patent 10,012,451 B2, 3 July 2018. [Google Scholar]
- Hasan, M.I.; Abduladheem, A.A. Modifying the Thermal Performance of Electrical Distribution Transformers Using Phase Change Materials (Paraffin Wax). Heat Transf. Res. 2019, 48, 2440–2455. [Google Scholar] [CrossRef]
- Frigione, M.; Lettieri, M.; Sarcinella, A. Phase Change Materials for Energy Efficiency in Buildings and Their Use in Mortars. Materials 2019, 12, 1260. [Google Scholar] [CrossRef] [PubMed]
- Cui, Y.; Xie, J.; Liu, J.; Wang, J.; Chen, S. A Review on Phase Change Material Application in Building. Adv. Mech. Eng. 2017, 9, 1687814017700828. [Google Scholar] [CrossRef]
- Kumar, D.; Alam, M.; Sanjayan, J.G. Retrofitting Building Envelope Using Phase Change Materials and Aerogel Render for Adaptation to Extreme Heatwave: A Multi-Objective Analysis Considering Heat Stress, Energy, Environment, and Cost. Sustainability 2021, 13, 10716. [Google Scholar] [CrossRef]
- Rahemipoor, S.; Hasany, M.; Mehrali, M.; Almdal, K.; Ranjbar, N.; Mehrali, M. Phase Change Materials Incorporation into 3D Printed Geopolymer Cement: A Sustainable Approach to Enhance the Comfort and Energy Efficiency of Buildings. J. Clean. Prod. 2023, 417, 138005. [Google Scholar] [CrossRef]
- Lamrani, B.; Johannes, K.; Kuznik, F. Phase Change Materials Integrated into Building Walls: An Updated Review. Renew. Sustain. Energy Rev. 2021, 140, 110751. [Google Scholar] [CrossRef]
- Bre, F.; Lamberts, R.; Flores-Larsen, S.; Koenders, E.A.B. Multi-Objective Optimization of Latent Energy Storage in Buildings by Using Phase Change Materials with Different Melting Temperatures. Appl. Energy 2023, 336, 120806. [Google Scholar] [CrossRef]
- Köse, E.; Manioğlu, G. Evaluation of the Performance of a Building Envelope Constructed with Phase-Change Materials in Relation to Orientation in Different Climatic Regions. E3S Web Conf. 2019, 111, 4003. [Google Scholar] [CrossRef]
- Li, D.; Zhuang, B.; Chen, Y.; Li, B.; Landry, V.; Kaboorani, A.; Wu, Z.; Wang, X.A. Incorporation Technology of Bio-Based Phase Change Materials for Building Envelope: A Review. Energy Build. 2022, 260, 111920. [Google Scholar] [CrossRef]
- Qu, Y.; Zhou, D.; Xue, F.; Cui, L. Multi-Factor Analysis on Thermal Comfort and Energy Saving Potential for PCM-Integrated Buildings in Summer. Energy Build. 2021, 241, 110966. [Google Scholar] [CrossRef]
- Li, Z.X.; Al-Rashed, A.A.A.A.; Rostamzadeh, M.; Kalbasi, R.; Shahsavar, A.; Afrand, M. Heat Transfer Reduction in Buildings by Embedding Phase Change Material in Multi-Layer Walls: Effects of Repositioning, Thermophysical Properties and Thickness of PCM. Energy Convers. Manag. 2019, 195, 43–56. [Google Scholar] [CrossRef]
- Kishore, R.A.; Bianchi, M.V.A.; Booten, C.; Vidal, J.; Jackson, R. Parametric and Sensitivity Analysis of a PCM-Integrated Wall for Optimal Thermal Load Modulation in Lightweight Buildings. Appl. Therm. Eng. 2021, 187, 116568. [Google Scholar] [CrossRef]
- Kylili, A.; Fokaides, P.A. Life Cycle Assessment (LCA) of Phase Change Materials (PCMs) for Building Applications: A Review. J. Build. Eng. 2016, 6, 133–143. [Google Scholar] [CrossRef]
- Zhou, S.; Razaqpur, A.G. Efficient Heating of Buildings by Passive Solar Energy Utilizing an Innovative Dynamic Building Envelope Incorporating Phase Change Material. Renew. Energy 2022, 197, 305–319. [Google Scholar] [CrossRef]
- Fagehi, H.; Hadidi, H.M. Toward Buildings with Lower Power Demand in the Smart City of NEOM-Incorporating Phase Change Material into Building Envelopes. Sustain. Energy Technol. Assess. 2022, 53, 102494. [Google Scholar] [CrossRef]
- Bungau, C.C.; Hanga Prada, F.I.; Bungau, T.; Bungau, C.; Bendea, G.; Prada, M.F. Web of Science Scientometrics on the Energy Efficiency of Buildings to Support Sustainable Construction Policies. Sustainability 2023, 15, 8772. [Google Scholar] [CrossRef]
- Jaysawal, R.K.; Chakraborty, S.; Elangovan, D.; Padmanaban, S. Concept of Net Zero Energy Buildings (NZEB)—A Literature Review. Clean. Eng. Technol. 2022, 11, 100582. [Google Scholar] [CrossRef]
- Craiut, L.; Bungau, C.; Negru, P.A.; Bungau, T.; Radu, A.-F. Technology Transfer in the Context of Sustainable Development-A Bibliometric Analysis of Publications in the Field. Sustainability 2022, 14, 11973. [Google Scholar] [CrossRef]
- Uusitalo, P.; Lavikka, R. Technology Transfer in the Construction Industry. J. Technol. Transf. 2021, 46, 1291–1320. [Google Scholar] [CrossRef]
- Bungău, C.C.; Prada, I.F.; Prada, M.; Bungău, C. Design and Operation of Constructions: A Healthy Living Environment-Parametric Studies and New Solutions. Sustainability 2019, 11, 6824. [Google Scholar] [CrossRef]
- Iqbal, M.; Ma, J.; Ahmad, N.; Hussain, K.; Waqas, M.; Liang, Y. Sustainable Construction through Energy Management Practices: An Integrated Hierarchal Framework of Drivers in the Construction Sector. Environ. Sci. Pollut. Res. Int. 2022, 29, 90108–90127. [Google Scholar] [CrossRef] [PubMed]
- Meteoblue Weather in Amman, Irbid, and Aqaba. Available online: https://www.meteoblue.com/en/weather/ (accessed on 5 September 2023).
- Autodesk. (n.d.). Revit System Analysis for Mechanical Design Professional. Available online: https://www.autodesk.com/certification/learn/course/revit-system-analysis-mechanical-design-professional/module/HvSSdYIkMAXaKzTXiHqtW (accessed on 20 August 2023).
- Wang, X.; Yuan, J.; You, K.; Ma, X.; Li, Z. Using Real Building Energy Use Data to Explain the Energy Performance Gap of Energy-Efficient Residential Buildings: A Case Study from the Hot Summer and Cold Winter Zone in China. Sustainability 2023, 15, 1575. [Google Scholar] [CrossRef]
- Alharbey, R.A.; Daqrouq, K.O.; Alkhateeb, A. Energy exchange of inserting eco-friendly bio phase change material into the vertical walls to make the buildings energy-efficient. J. Build. Eng. 2022, 56, 104777. [Google Scholar] [CrossRef]
- Jaradat, M.; Alsotary, O.; Juaidi, A.; Albatayneh, A.; Alzoubi, A.; Gorjian, S. Potential of Producing Green Hydrogen in Jordan. Energies 2022, 15, 9039. [Google Scholar] [CrossRef]
- Local Official Monitor: Decision of the Deliberative Authority of Oradea City Council Regarding the Approval of the Local Prices of Thermal Energy Practiced by the Company Termoficare Oradea SA in the Municipality of Oradea, Valid for the Period 01.11.2023–31.03.2024. Available online: https://mol.oradea.ro/storage/39852/pct.-1081.pdf (accessed on 9 December 2023).
- Jaradat, M.; Albatayneh, A.; Alsotary, O.; Hammad, R.; Juaidi, A.; Manzano-Agugliaro, F. Water Harvesting System in Greenhouses with Liquid Desiccant Technology. J. Clean. Prod. 2023, 414, 137587. [Google Scholar] [CrossRef]
Disclaimer/Publisher’s Note: The statements, opinions and data contained in all publications are solely those of the individual author(s) and contributor(s) and not of MDPI and/or the editor(s). MDPI and/or the editor(s) disclaim responsibility for any injury to people or property resulting from any ideas, methods, instructions or products referred to in the content. |
© 2023 by the authors. Licensee MDPI, Basel, Switzerland. This article is an open access article distributed under the terms and conditions of the Creative Commons Attribution (CC BY) license (https://creativecommons.org/licenses/by/4.0/).