1. Introduction
The escalating global energy crisis has prompted a shift towards renewable energy sources, particularly solar energy, in addressing concerns associated with fossil fuels [
1]. Harnessed through building-integrated photovoltaics (BIPV), solar energy has gained prominence in the building sector. In high-rise buildings, where roof area is limited, the integration of PV systems on building façades has emerged as a favorable option [
2]. Merely implementing energy-saving methods will not suffice in curbing excessive energy consumption [
3]. BIPV optimizes building envelopes, seamlessly replacing traditional materials with PV modules [
4].
BIPV serves a dual purpose in new constructions by contributing to the functionality of the building envelope and enhancing aesthetic appeal. BIPV transforms buildings into local power plants, generating electricity for operations while replacing traditional components. BIPV minimizes transmission and distribution line losses.
Architects play a crucial role in achieving energy efficiency, influencing approximately 80% of design decisions in the initial phase. The integration of photovoltaic systems into building structures aligns with global renewable energy policies, offering benefits like electricity generation, reduced reliance on external energy sources, and improved daylight utilization. Recent market advancements have increased the availability of sophisticated BIPV products, meeting quality standards and exhibiting enhanced technical and economic performance.
TPVs can be classified into wavelength-selective and non-wavelength-selective TPVs; TPVs offer unique advantages in maintaining transparency. Non-wavelength-selective TPVs find applications in tinted windows, enhancing building exteriors, and achieving average visual transmission values ranging from 0% to 50%. Wavelength-selective TPVs harness ultraviolet and near-infrared radiation, maintaining transparency but potentially compromising overall efficiency compared to their opaque counterparts. The choice between these technologies depends on specific application requirements and the desired balance between transparency and energy generation.
The increasing demand for sustainable energy solutions has driven innovation in the field of solar technologies. TPVs and STPVs have emerged as promising candidates for seamlessly integrating solar energy harvesting into architectural designs [
5]. This literature review explores recent research on the energy-saving potential, challenges, and advancements in these technologies.
TPVs offer a unique advantage in architectural integration due to their ability to maintain visual transparency. Hassan et al. [
6] highlights the potential of TPVs in windows and façades, allowing buildings to generate electricity without sacrificing natural light penetration. This integration not only contributes to energy savings but also aligns with the aesthetic and functional requirements of modern architectural designs. Despite these advancements, challenges persist. Cuce [
7] underscores concerns related to material durability, cost-effectiveness, and scalability. The trade-off between transparency and efficiency remains a key challenge, prompting ongoing research to strike a balance that maximizes energy savings while addressing these practical constraints [
8].
Comparative Analysis: TPVs vs. STPVs
Comparing TPVs and STPVs reveals a nuanced landscape of advantages and challenges. TPVs excel in maintaining balanced transparency while contributing to energy generation, making them suitable for applications where visual aesthetics are paramount. On the other hand, STPVs strike a balance between energy efficiency and light transmittance, offering adaptability in diverse architectural environments.
Table 1 presents a concise overview of the most relevant research in the literature, summarizing the methodologies, context, and outcomes of each study.
Notably, certain previous investigations have delved into advancing vacuum glass to enhance TPVs’ energy production, implementing a dual scheme for optimizing TPVs’ optical signals, and conducting a comparative analysis of the performance of transparent photovoltaics in the market. Kyrou et al. [
9] discovered that transparent photovoltaic (TPV) solutions become more competitive for broader façade applications. This could be achieved by attaining a power conversion efficiency (PCE) of at least three times the current value without compromising visible transmittance. Qiu and Yang [
10] found that combining reversible vacuum photovoltaic (PV) glazing with both PV glazing and vacuum glazing presents a promising avenue for harnessing substantial energy-saving potential. Research conducted by Kapsis et al. [
13] revealed that optimal performance can be attained by incorporating a STPV module, featuring a visible effective transmittance of 30%, as the outer glass layer of a double-glazed window. Toutou et al. [
16] indicated that the most effective daylighting solution achieved a substantial spatial daylighting index, registering at 87. Additionally, the best energy solution exhibited a relatively low energy use intensity (EUI), consuming 162 kWh/m
2.
Other studies explored the optical properties of PV modules and the transparency of photovoltaic windows to enhance energy savings, temperature regulation, building performance, and resident comfort. Alrashidi et al. [
2] investigated the energy performance of cadmium telluride-based semi-transparent glazing (CdTe). Their findings revealed that, in comparison to a single-glazing case used as a reference, the utilization of CdTe resulted in a significant net energy saving, reaching as high as 20% based on on-site-measured data. Martellotta et al. [
12] suggests that the integration of STPV technologies into building structures has the potential to yield noteworthy energy savings, offering a promising solution for enhancing overall energy efficiency and sustainability in architectural design. Uddin et al. [
15] reveals a strategic aspect of BIPVs application in relation to the orientation of the solar glazing used. Specifically, their study suggests that south-facing BIPV windows exhibit higher efficiency in power generation, maximizing the exposure to direct sunlight and optimizing electricity production in the northern hemisphere.
Several research endeavors have employed energy software simulation to assess the optimal placement angles of photovoltaic panels on façades and roofs, subsequently comparing the energy output with the building’s annual consumption. Vahdatikhaki et al. [
11] reached the conclusion that achieving optimum solutions for the energy efficiency of TPVs, STPVs, and opaque PVs entails maintaining a more consistent orientation of the panels, coupled with uniform pan and tilt angles. de Sousa Freitas et al. [
14] concluded that, in terms of energy performance, south-facing building-integrated photovoltaics (BIPVs) windows prove to be more efficient for power generation. On the other hand, east-facing windows demonstrate greater efficiency in reducing net electricity consumption. This insight underscores the importance of considering the specific goals and priorities, such as maximizing electricity generation or minimizing overall electricity usage, when strategically placing BIPVs installations within architectural designs. The research findings from Zhang et al. [
17] indicate that an optimized free-form shaped building experiences a substantial increase in total solar radiation gain, ranging from 30% to 53%, in comparison to a cube-shaped structure.
Fan et al. [
18] delve into the performance of BIPV systems in various climates, revealing nuanced variations in energy generation and building thermal dynamics. The study underscores the importance of location-specific considerations, advocating for tailored design strategies to maximize the benefits of STPVs in different environmental contexts.
Overcoming technical hurdles related to electrical integration and thermal management remains a focal point for future research in this domain. Comparing TPVs and STPVs reveals a nuanced landscape of advantages and challenges. TPVs excel in maintaining transparency while contributing to energy generation, making them suitable for applications where visual aesthetics are paramount.
However, challenges such as material durability, cost-effectiveness, and integration complexities must be addressed to unlock their full potential. Ongoing research efforts focusing on these challenges, along with tailored design strategies, will be crucial in realizing the vision of seamlessly integrating solar energy harvesting into our architectural landscapes. Drawing from the literature review and preceding discussions, it is evident that the predominant focus of research on PV windows or façades has revolved around their thermal behavior, daylighting characteristics, and capacity to generate electricity. More specifically, there has been a notable emphasis on cost-effectiveness.
Drawing on an extensive review of the existing literature, this study presents a thorough evaluation of the energy-saving and cost–benefit aspects of TPV and STPV technologies within the unique context of hot and semi-arid climates, particularly in the scenario of a high-rise residential building. The research quantifies the energy efficiency metrics and cost-effectiveness of the two BIPV systems, aiming to offer actionable insights for the strategic deployment of the systems in developing countries. By showcasing the performance of STPV and TPV technologies in a real-world setting, the research fosters technological innovation and provides practical data for further advancements in solar energy applications. The findings of the study can inform policy discussions regarding the adoption and promotion of sustainable practices in building design, especially in regions with specific climatic considerations like semi-arid climates. The research provides practical implications for designers, architects, and decision-makers, emphasizing the energy-saving potential of TPV and STPV systems in high-rise structures and highlighting the current challenges related to the financial viability of such technologies in specific geographical contexts.
2. Methodology
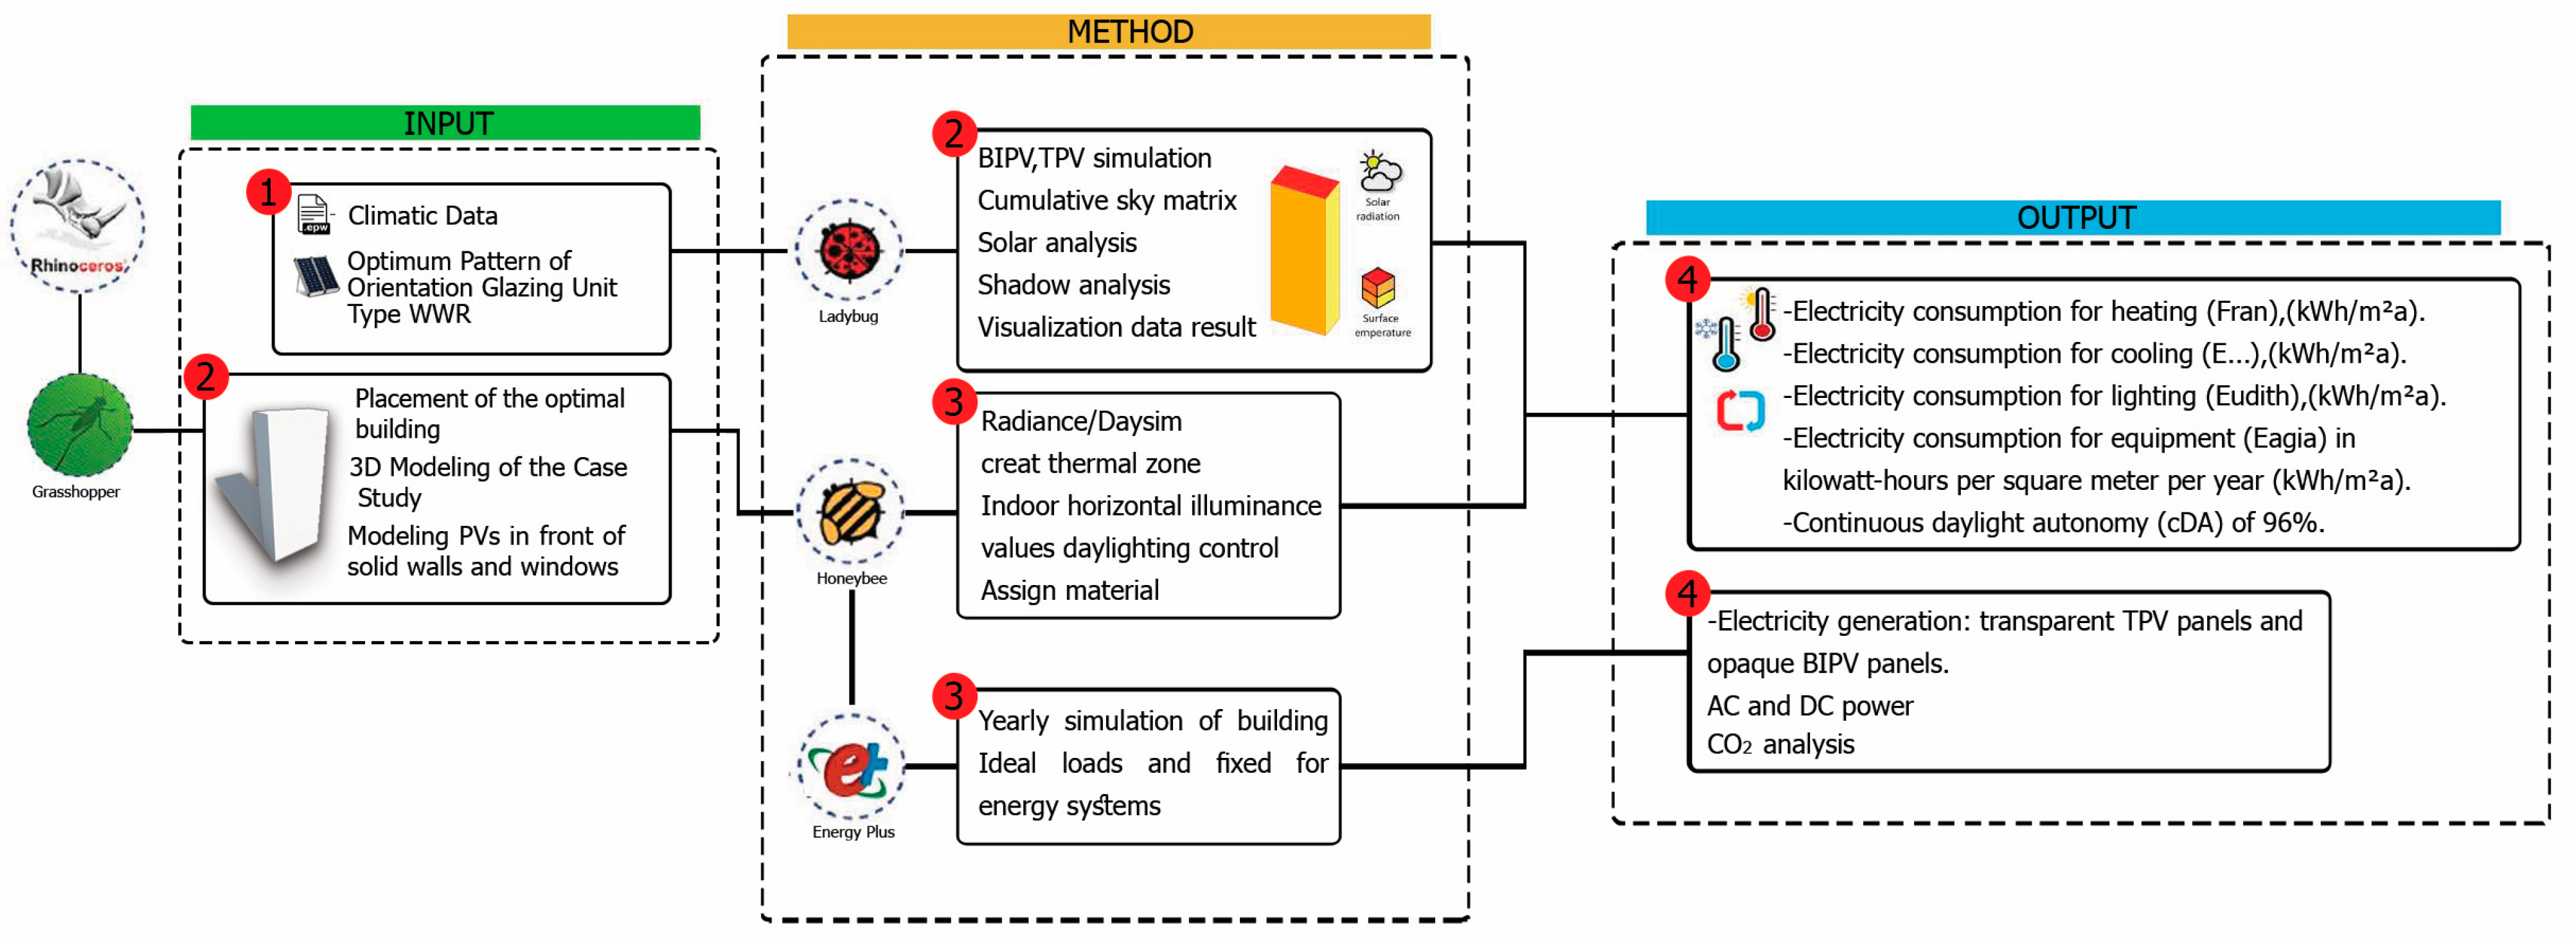
This research has been executed in four sequential phases, as depicted in
Figure 1. Initially, building data, encompassing geometry, annual energy consumption, and weather data, were gathered in the urban environment. Following this, an integrated simulation workflow was employed to evaluate energy use areas, solar radiation, BIPV design alternatives, and associated energy production for diverse façade design options (TPVs) for Tehran’s climate. Ultimately, the design alternatives were assessed based on the energy balance of the building.
Tehran’s climate has a substantial impact on the effectiveness and efficiency of TPV and STPV systems. The systems perform optimally under closed temperature conditions, and Tehran’s temperature range, with maximum and minimum values reaching +40 degrees Celsius on the hottest day and −2 degrees Celsius on the coldest, aligns with the specified temperature range for module surfaces. The findings indicate that these systems are well-suited for Tehran’s climate within their designated temperature range.
2.1. The Configuration and Geometry of the Selected Building
The high-rise residential building, located in Tehran, Iran, with a semi-arid climate, has been selected to undergo the retrofitting of façade coverings with TPV and STPV systems. Tehran serves as an excellent case study for solar panel installation research for several reasons climate variation, solar irradiance, urban environment, energy demand, policy implications, and geographical location. Tehran experiences diverse climatic conditions, including hot summers and cold winters. Studying solar panel installations in such a varied climate provides insights into the technology’s performance under different weather scenarios. Tehran receives a substantial amount of sunlight throughout the year, making it an ideal location to study the effectiveness of solar panel installations in harnessing solar energy. Being a metropolitan area, Tehran presents challenges and opportunities related to urban planning, building design, and energy demands. Investigating solar panel installations in an urban setting contributes valuable knowledge for sustainable urban development. As the capital and largest city of Iran, Tehran has a significant energy demand. Researching solar panel installations in this context helps in understanding how renewable energy technologies can contribute to meeting urban energy requirements. Tehran’s urban policies and regulations can impact the feasibility and integration of solar panel installations. Studying these aspects can provide insights into the role of government policies in fostering renewable energy adoption. Tehran’s geographical location, situated on the southern slope of the Alborz highlands, influences its solar exposure and energy potential. Researching solar panel installations here can offer insights into the impact of geographical factors on energy generation. Choosing Tehran as a case study allows for investigating the retrofitting of existing buildings with solar technologies, which is crucial for sustainable urban development and reducing environmental impact. The findings from solar panel installation research in Tehran can have practical applications not only for the city itself but also for regions with similar climatic conditions and urban characteristics. In summary, Tehran provides a multifaceted environment for studying solar panel installations, offering insights into technology performance, urban challenges, policy implications, and practical applications in a diverse and dynamic setting.
TPV and STPV systems demonstrate enhanced efficiency in converting heat into electricity when compared to traditional PV systems. This characteristic makes them particularly well-suited for applications in hotter climates like Tehran. Moreover, TPV systems have the potential for achieving high efficiency in the conversion of heat to electricity.
Notably, Tehran’s positioning on the southern slope of the Alborz highlands affords it favorable climatic conditions in contrast to the central regions of the Iranian plateau.
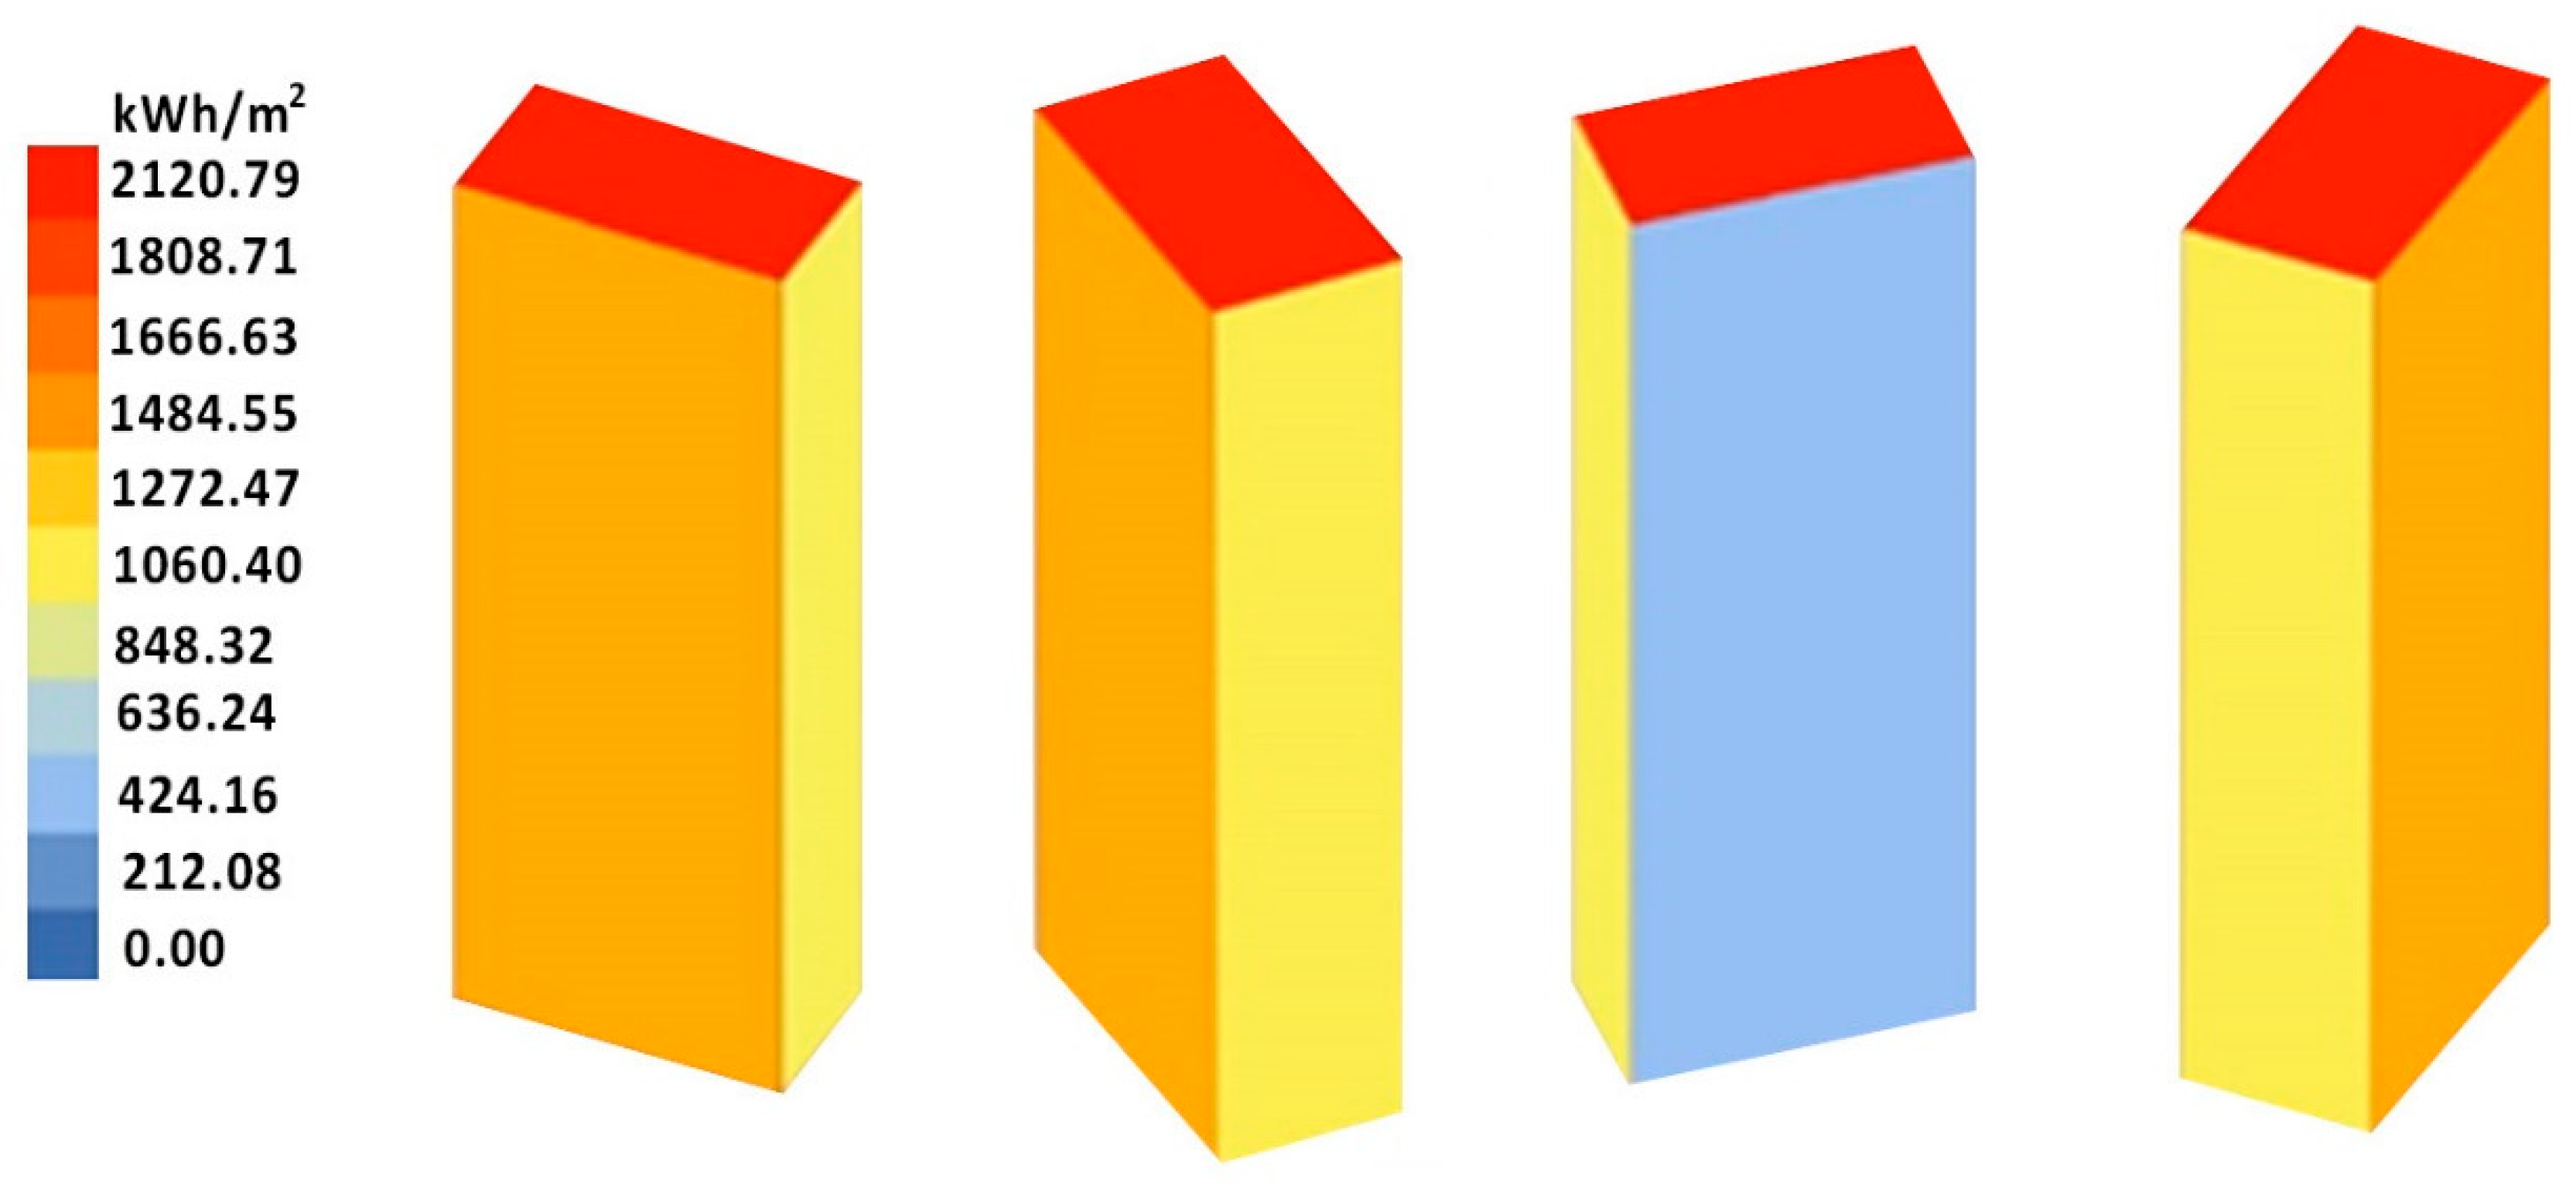
Figure 2 illustrates the Radiation Analysis for Tehran Mehrabad International Airport, Tehran, Iran. It provides information on the annual irradiation levels at this location.
The region exhibits semi-desert conditions, marked by significant fluctuations in air temperature [
19]. As per
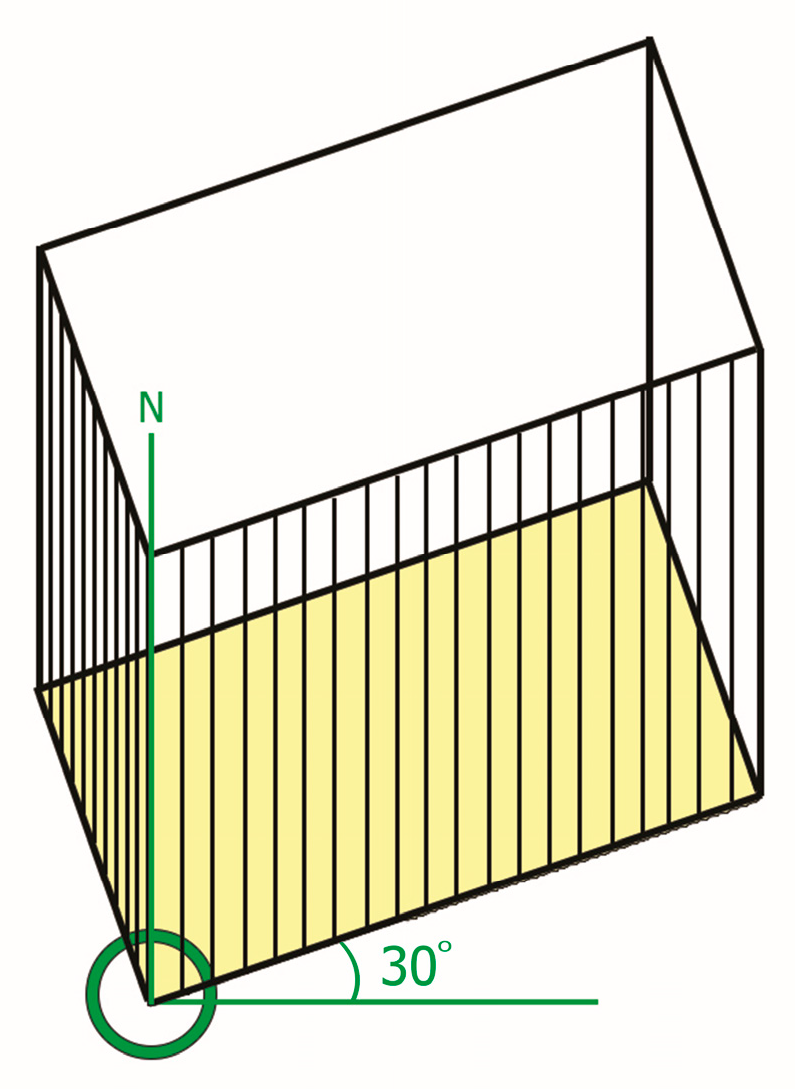
Figure 3, the optimal building angle in the solar radiation sector is determined to be 30 degrees, offering the highest efficiency in the absorption of solar radiation energy. Furthermore, buildings featuring larger semi-transparent layers, such as windows on the south and east sides, stand to gain increased daylight penetration during the day, as evidenced by the findings in this research [
20].
The suitability of TPV systems for high-rise buildings is rooted in their ability to harness waste heat, their adaptability to vertical façades, the increased sun exposure at heights, the reduced shadowing effects, the energy efficiency in urban environments, and their compatibility with architectural integration and aesthetics.
The building’s energy consumption from the city grid can be determined by comparing the energy generated by TPV and STPV panels on the façade with the total energy consumption of the building on a monthly basis. Based on the radiation output from the Ladybug plugin, it is observed that the north side of the building receives minimal radiation. Installing STPVs on the north face may not be economically feasible as they cannot generate as much electricity from solar radiation. However, TPV panels with selective wavelength capabilities not only utilize visible radiation for electricity generation but also convert ultraviolet radiation (<435 nm) and near-infrared radiation (>670 nm) into electricity. These panels have the potential to generate electricity in shaded areas and even during the nighttime [
21].
The TPV cells used in the study are thermophotovoltaics cells, which operate in the infrared part of the electromagnetic spectrum (see
Figure 4). Thermophotovoltaic (TPV) cells convert heat energy directly into electricity through a process that involves the emission of thermal radiation and the subsequent absorption of photons by semiconductor materials [
22]. The process begins with a heat source that produces high temperatures. This heat source can be generated through various means, such as combustion, concentrated sunlight, or any process that produces significant thermal energy.
The high-temperature heat source emits thermal radiation. Thermal radiation consists of photons, which are particles of light, but in the infrared spectrum (heat radiation) due to the high temperatures involved. A selective emitter is a crucial component in TPV cells. It is designed to efficiently emit thermal radiation in the form of photons at specific wavelengths that match the bandgap of the semiconductor material in the photovoltaic cell. This selectivity is essential for optimizing energy conversion. The thermophotovoltaic cell contains semiconductor materials with a bandgap that corresponds to the wavelengths of the emitted photons. When the emitted photons strike the semiconductor material, they transfer their energy to electrons in the material. This process generates electron–hole pairs (excitons) due to the absorption of photons with energy greater than that of the bandgap of the semiconductor. The creation of electron–hole pairs leads to the generation of an electric current within the semiconductor material. The electrons move toward the n-type (negative) side, and the holes move toward the p-type (positive) side of the TPV cell, creating a voltage potential. An external circuit is connected to the TPV cell to allow the flow of electric current. This circuit can be connected to an electrical load or used to charge batteries, allowing them to power electronic devices or supply electricity to the grid.
The key advantage of thermophotovoltaic systems is that they can convert heat energy into electricity at high temperatures, making them suitable for applications with concentrated solar power, industrial waste heat, and other high-temperature heat sources. However, challenges such as materials optimization, system efficiency, and cost-effectiveness continue to be areas of research and development in the field of thermophotovoltaics.
STPV cells are devices that convert sunlight into electricity using a combination of thermal and photovoltaic processes. Unlike traditional solar cells, which directly convert sunlight into electricity, STPV cells utilize a thermal absorber to generate heat, and this heat is then converted into electricity through a photovoltaic process. STPV cells typically consist of a solar absorber layer that absorbs sunlight. This layer is designed to efficiently absorb a broad spectrum of sunlight, including visible and infrared wavelengths. The absorbed sunlight heats the solar absorber layer, causing it to emit thermal radiation in the infrared range. This emission is a result of the high temperature attained by the absorber layer. Similar to TPVs, STPV cells often incorporate a selective emitter, which is designed to emit thermal radiation at specific wavelengths that match the bandgap of the photovoltaic material. The emitted thermal radiation is absorbed by the photovoltaic material in the STPV cell. This absorption creates electron–hole pairs, generating an electric current within the material. The flow of electrons and holes results in the generation of electricity. The electrical current can be extracted and used to power electronic devices or be fed into the electrical grid.
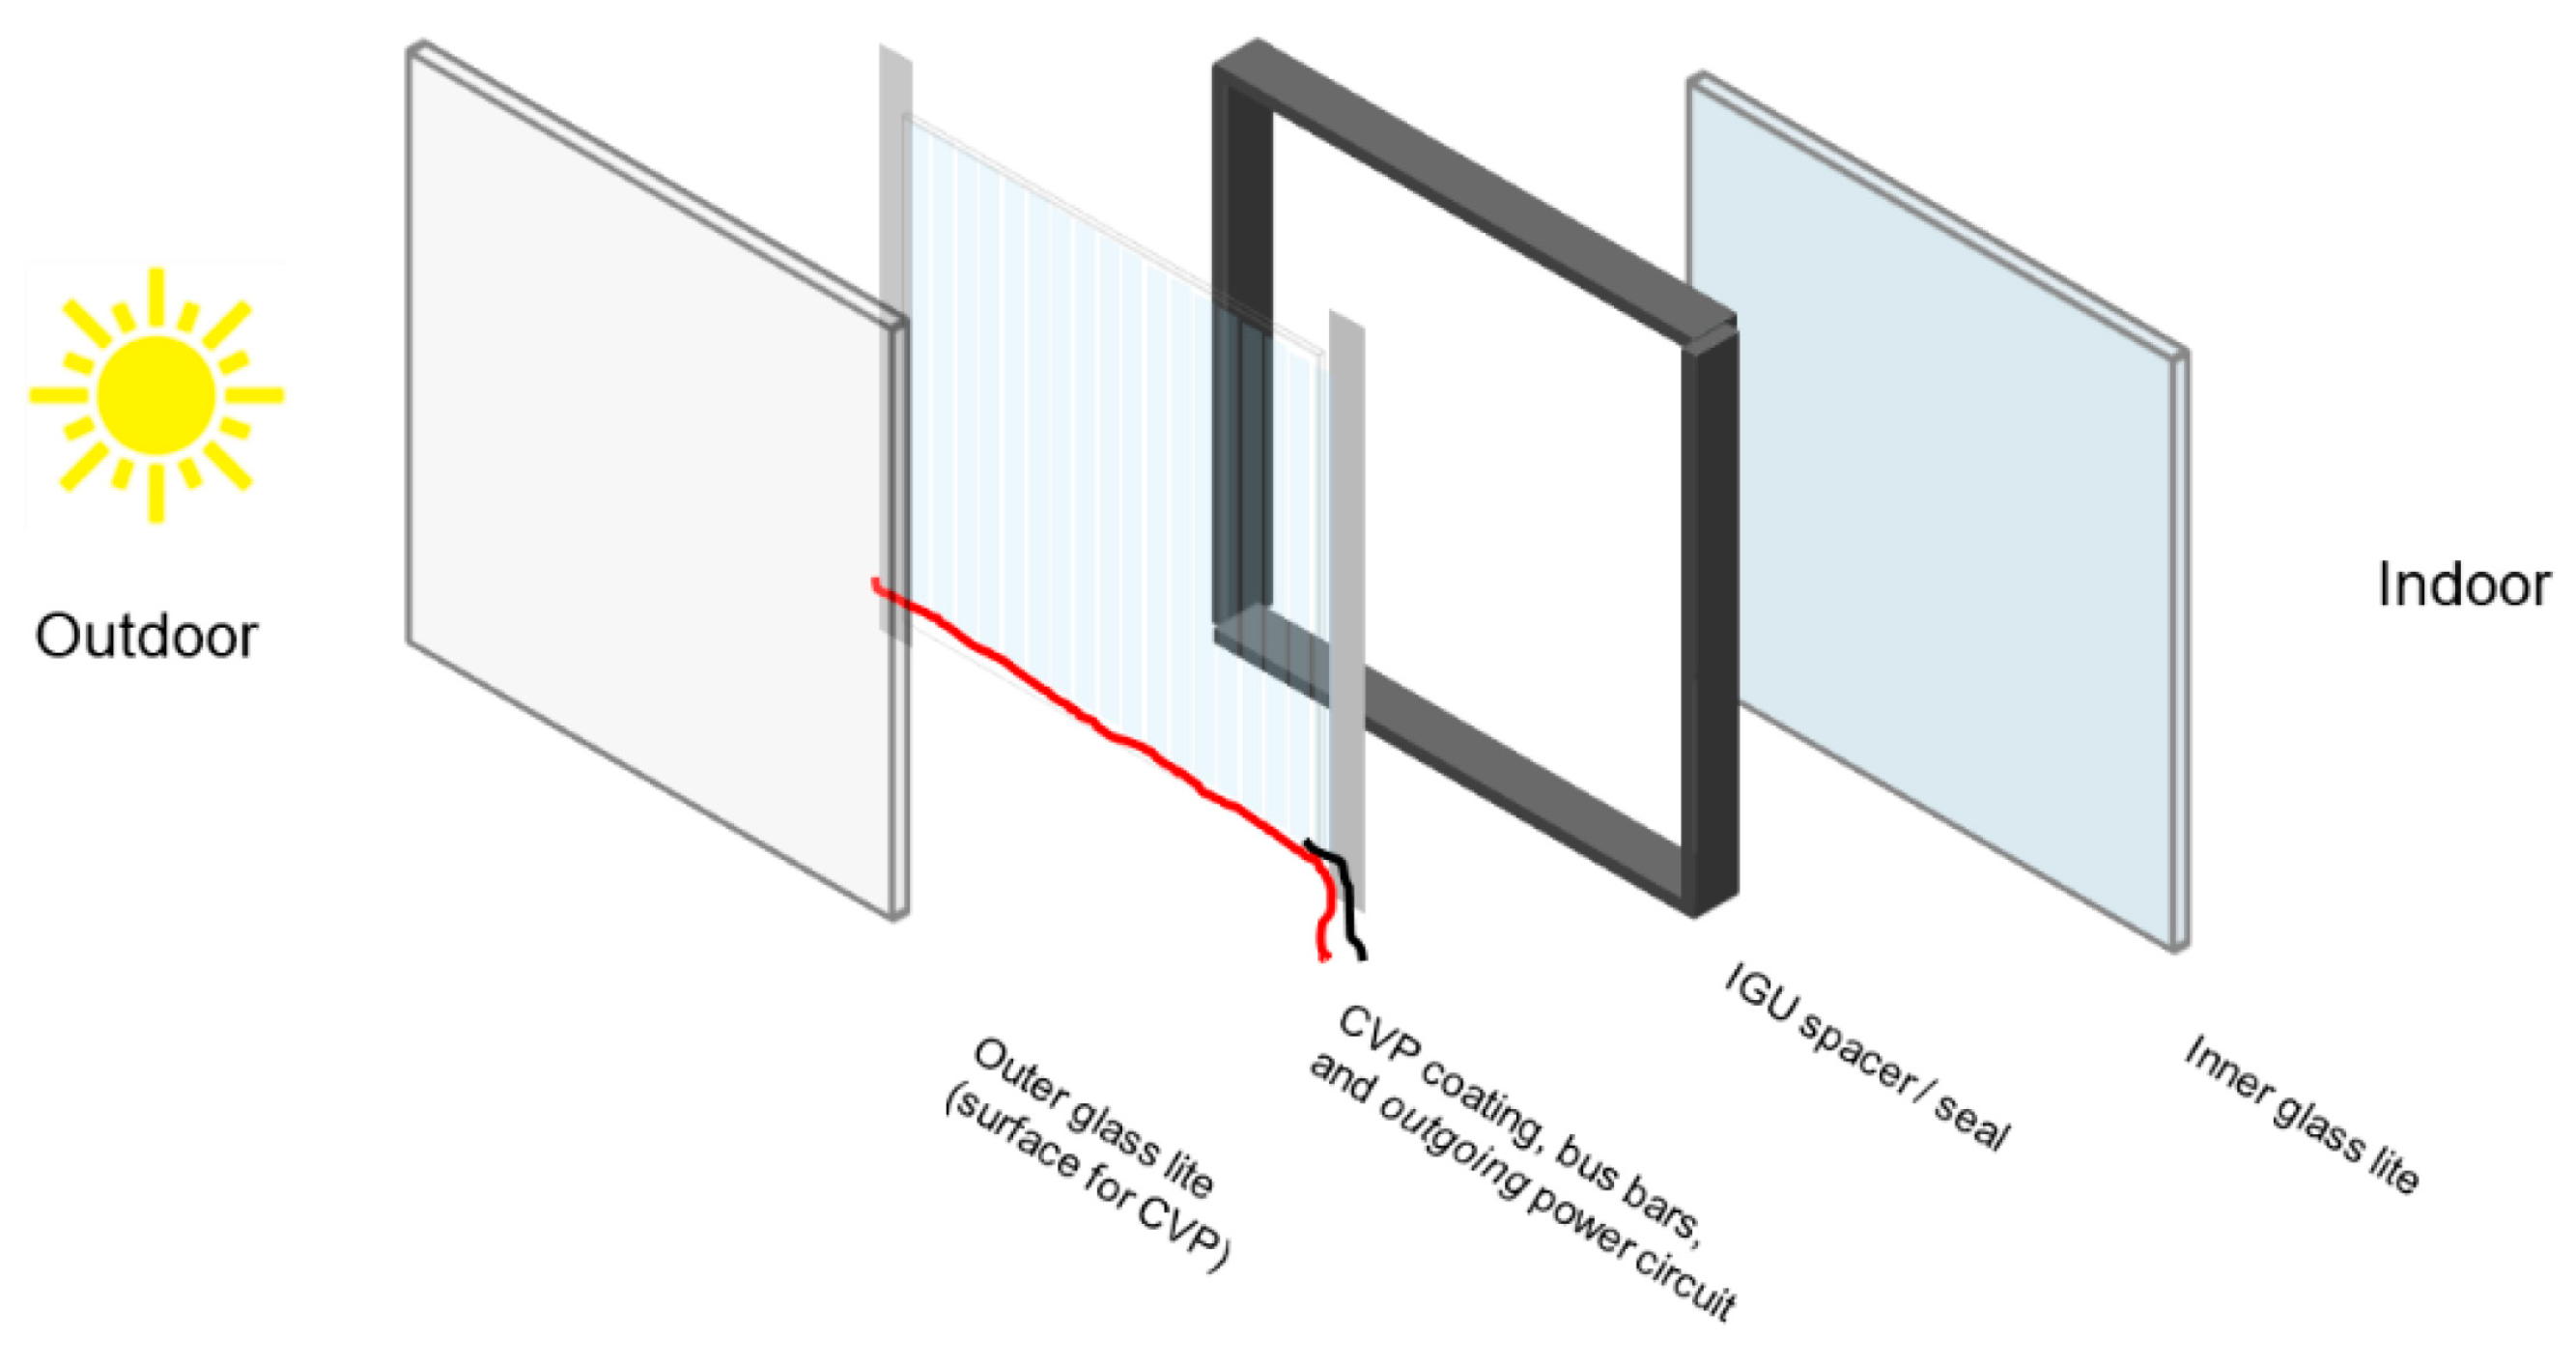
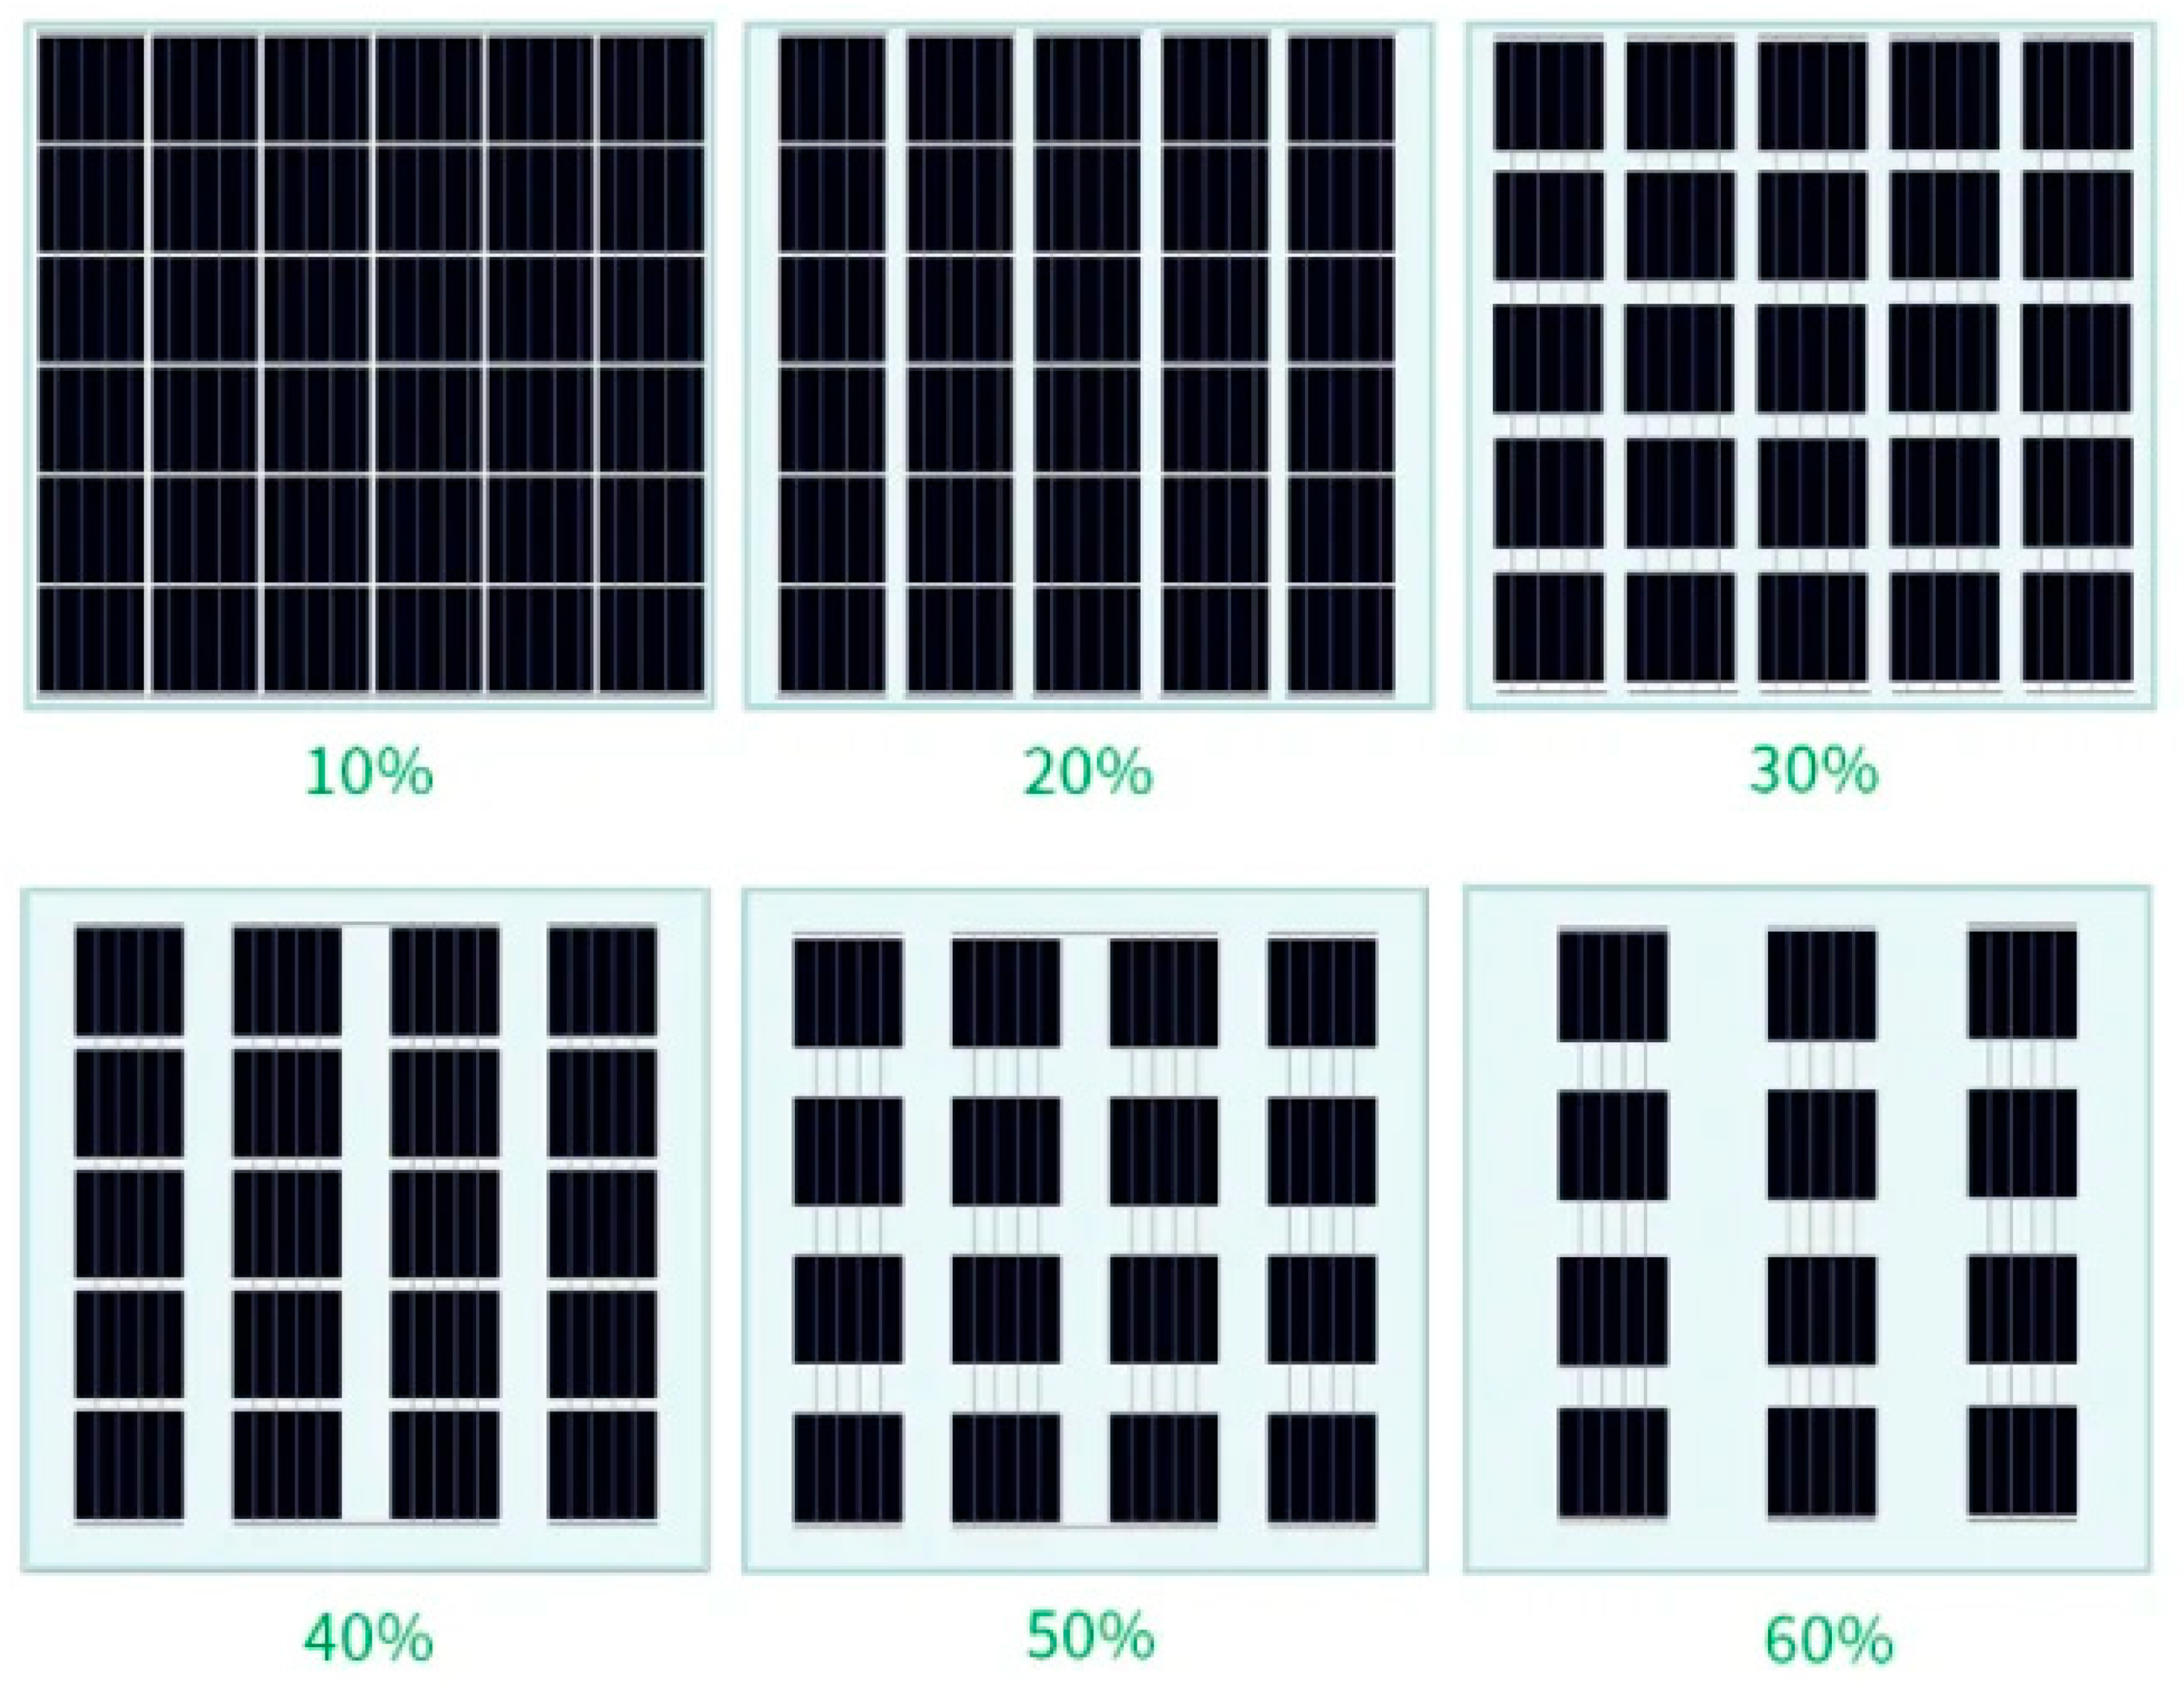
Various types of TPVs based on transparency percentage are desirable for certain applications like windows and building-integrated photovoltaics. In our study, we implemented TPV cells with a transparency level of 50% (see
Figure 5) to be comparable with STPVs with 50% transparency.
The chosen 50% transparency represents a compromise between maximizing energy generation and maintaining a sufficient level of transparency. This balance is crucial, especially in applications where both electricity generation and visible light transmission are important, such as building-integrated photovoltaics. Additionally, the choice of 50% transparency was intended to facilitate a fair and meaningful comparison with TPV technology. This allows for a clear assessment of the trade-offs between energy generation efficiency and transparency, providing insights into the advantages and disadvantages of each technology. Additionally, the practical considerations including manufacturing capabilities, material properties, and cost-effectiveness, played a great role in determining the chosen transparency level with available technologies in the country.
2.2. The Role of TPV in Research Design
The primary objectives of this study are to conduct a comparative analysis of the overall performance between TPVs and STPVs. Specifically, the investigation delves into the utilization of opaque BIPV as a window in building façades. Furthermore, the study aims to assess the energy production capabilities of TPV and explore potential advancements in this technology. Recognizing the evolving landscape of TPV technologies is pivotal in enhancing their efficacy in the future. It is imperative to underscore the role and potential of TPVs, involving the conversion of solar energy into electrical energy through glass PV units. This research endeavors to contribute insights across diverse domains, encompassing energy consumption, energy conversion efficiency, and the availability of daylight.
To fulfill the objectives of this study, the comprehensive design process includes three-dimensional modeling and the analysis of various weather parameters, including wind, precipitation, radiation, temperature, relative humidity, psychrometric chart, thermal comfort, and shadow analysis. The Rhino software version 6 within the Grasshopper environment is employed for PV energy estimation processes, and EnergyPlus version 23.1.0, through the Honeybee and Ladybug Tools plugin version 1.6.0, is utilized for energy simulations. The outcomes of the energy simulation are subsequently scrutinized to quantify the energy consumption for heating, cooling, and artificial lighting in both TPV and STPV modes. The different scenarios are meticulously designed and calculated separately, considering the annual consumption measurement data for the final consumption. This approach aims to establish an energy balance for each level offered. While tools with capabilities akin to EnergyPlus and Radiance/Daysim engines have been employed in transparent and STPV modeling and simulation [
23], façade-mounted TPVs have not been previously utilized. Lastly, the Ladybug radiation analysis tool is leveraged to compute the solar radiation on the exterior surfaces of the building, a crucial factor in determining the energy converted by the PV system.
2.3. Zone Geometry
To assess the energy consumption in each specific zone, the building components must be initially categorized into distinct areas. These zones encompass various sections such as the entrance and lobby, the communication and service areas, the recreational and administrative spaces, and the residential sections. The building components modeled in Rhino are then transferred to the Grasshopper environment. The “Intersect Mass” component is employed to delineate these zones and compute the corresponding surfaces between each pair of adjacent surfaces. This step is crucial for accurately identifying internal barriers and calculating conductive heat flow during the energy simulation. Detailed information regarding the building materials is meticulously recorded within the zones before acquiring data on the cooling and heating of the units. Notably, the middle units in the tower, as per data from the “Set Energy Plus Zone Thresholds” component, lack heating and cooling systems. Subsequently, data on air conditioning are obtained.
2.4. Simulation of BIPV Systems
Specialized software is employed to simulate energy consumption during the construction or design phase when evaluating the solar energy potential of photovoltaic panels. The study incorporates the influence of surrounding buildings to simulate shadows in the plan, considering all façades of the building for the application of photovoltaics (see
Figure 1). For energy usage intensity (EUI) analysis, the Honeybee plugin version 0.0.06 with the EnergyPlus version 23.1.0 is utilized. Furthermore, the Ladybug plugin version 1.6.0 within the Grasshopper environment ensures the precision and efficiency of solar radiation simulation.
Following the building design in the software, the initial phase of the window design process entails identifying the optimal locations and sizes of windows with respect to different orientations of the building. The utilization of Grasshopper plugins in Rhinoceros 3D facilitates the implementation of 3D modeling. Furthermore, the Honeybee plugin within Grasshopper enables the simulation of energy consumption analysis (EUI) through the Energy Plus engine. This method has been used in many studies in the past [
24].
Moreover, the Ladybug plugin is instrumental in simulating PVs and conducting climate analysis. This includes considering building envelopes on both roofs and vertical walls, as well as accounting for shading effects caused by adjacent buildings. The Ladybug plugin facilitates the import of weather data for analyzing specific locations and times, providing insights into weather patterns. It displays radiation and peak temperatures in views, evaluates shading from surrounding buildings, and enables the simulation of photovoltaic systems. Moreover, this plugin plays a crucial role in optimizing the design of the building envelope for energy efficiency and simulating heat transfer through it. Utilizing these data allows for the identification of optimal PV locations and an assessment of the potential for photovoltaic power generation in specific areas, such as tower façades.
To model and simulate façade configurations, a comprehensive review of information on commercial TPV products in the market has been undertaken. Various manufacturers were contacted to gather data on specific performance aspects that are not publicly available.
Table 2 provides an overview of the STPV and TPV specifications used in the study.
Accurate 3D representations of nearby structures and GIS maps of the area are utilized to estimate the percentage of shading on the project. The Ladybug plugin, integrated into the software environment, conducts annual simulations of shade by incorporating weather data and modeling the site. Following this process, the study examines the impact of shadows on the site concerning the energy received and solar radiation on nearby buildings.
2.5. Modules on the Façade
For a comprehensive analysis of the optimal placement of PV modules on a façade, it is crucial to take into account various factors. These factors encompass the type of glazing technology employed, as indicated in
Table 3 (whether PV glazing or conventional glazing), the equilibrium between the glazing, the window-to-glazing ratio, the window-to-wall ratio (WWR), and the extent of the opaque façade area covered by the PV modules [
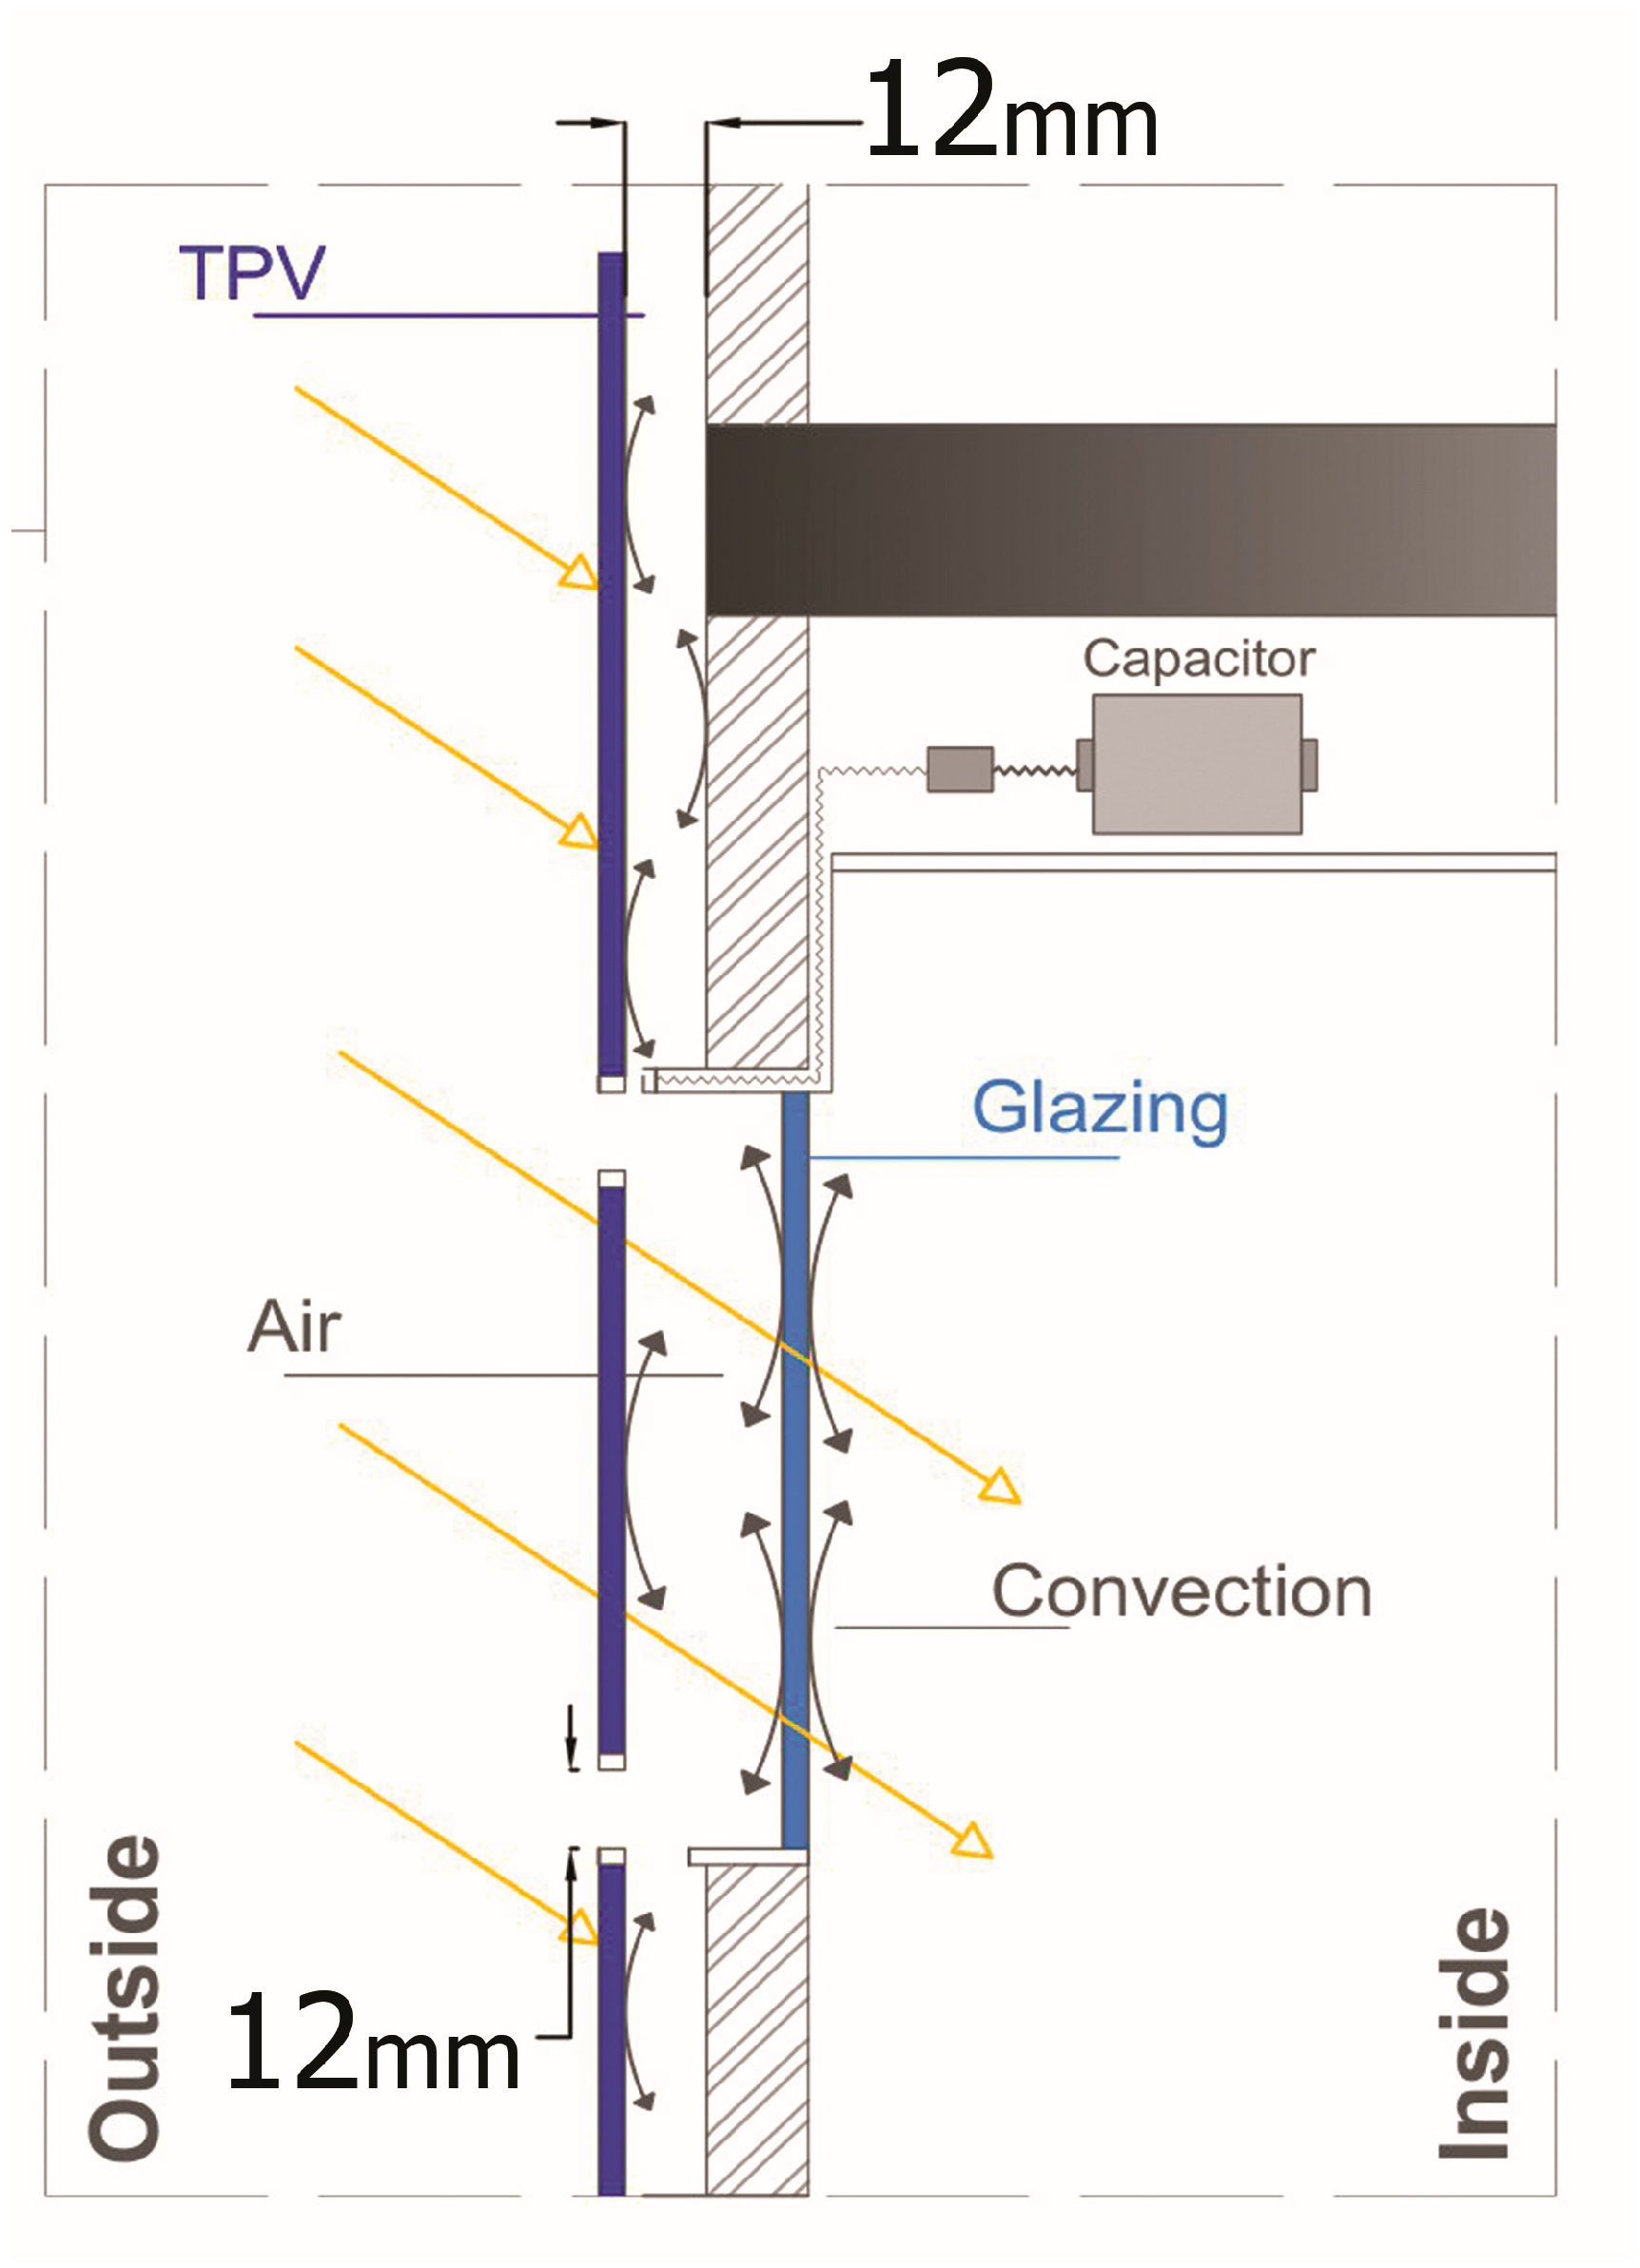
25]. To facilitate precise analysis, a significant portion of the façade configuration should be systematically sampled parametrically in all directions. In this design, a double-paned unit comprising two layers of glass is employed, with the outer layer tailored to accommodate various types of PV. The optimal air gap between the two layers, established through computational fluid dynamics (CFD) analysis (see
Figure 6), is at least 120 mm to mitigate PV temperature. This optimization results in a nearly 50% increase in the efficiency of the PV modules by curbing the cooling load and reducing CO
2 emissions [
26].
Additionally, the process of climate-based daylight modeling (CBDM) involves the use of meteorological data extracted from the EnergyPlus weather file (epw) for a particular location. Ladybug software version 1.6.0 is then used to simulate the daylight radiation on panels. To keep the two technologies comparable, both STPVs and TPVs used in the simulation study have 50% transparency.
The calculation of the energy balance in Iran relies on Mabhase 19 [
27]. The Honeybee plugin within Rhino provides ratings for cooling and heating loads. To assess the energy generated by the modules, the Honeybee plugin is utilized, and the simulation process involves importing all relevant data into Honeybee, which employs a series of instructions for OpenStudio version 3.3.0. These data comprise the standard values derived from the parametrically constructed geometry or volume in Rhino or Grasshopper.
The EnergyPlus simulation engine version 23.1.0 is utilized at each time step within the chosen period, and Honeybee receives the raw result computations. System and thermostat setpoints are provided to the Honeybee plugin for reapplication. Honeybee has the following capabilities: gathering specific metrics, displaying the energy balance for each location, comparing regions, and integrating the outcomes of multiple areas. The “Run Energy Simulation” component is employed to evaluate thermal energy, while the “EP Construction” and “EP Material” components define the structure and materials. Since the calculated outputs in EnergyPlus are not read by default, the “Read Result Dictionary” component is used to read them. Subsequently, the output energy level is assessed, and its reasonableness is determined.
Following the simulation and analysis, a default file is generated, allowing for the implementation of design changes and the assessment of their impact on the overall design. TPV cells are chosen for this structure due to their superior effectiveness compared to the other PVs available on the market. The primary criterion for selecting these modules was their efficiency.
3. Results
Three distinct modes have been investigated for each output of the EnergyPlus plugin, categorized by zones:
3.1. Energy Use
The software output initially calculates the annual energy usage for each zone by determining the area of each zone. This output provides monthly and kWh estimations.
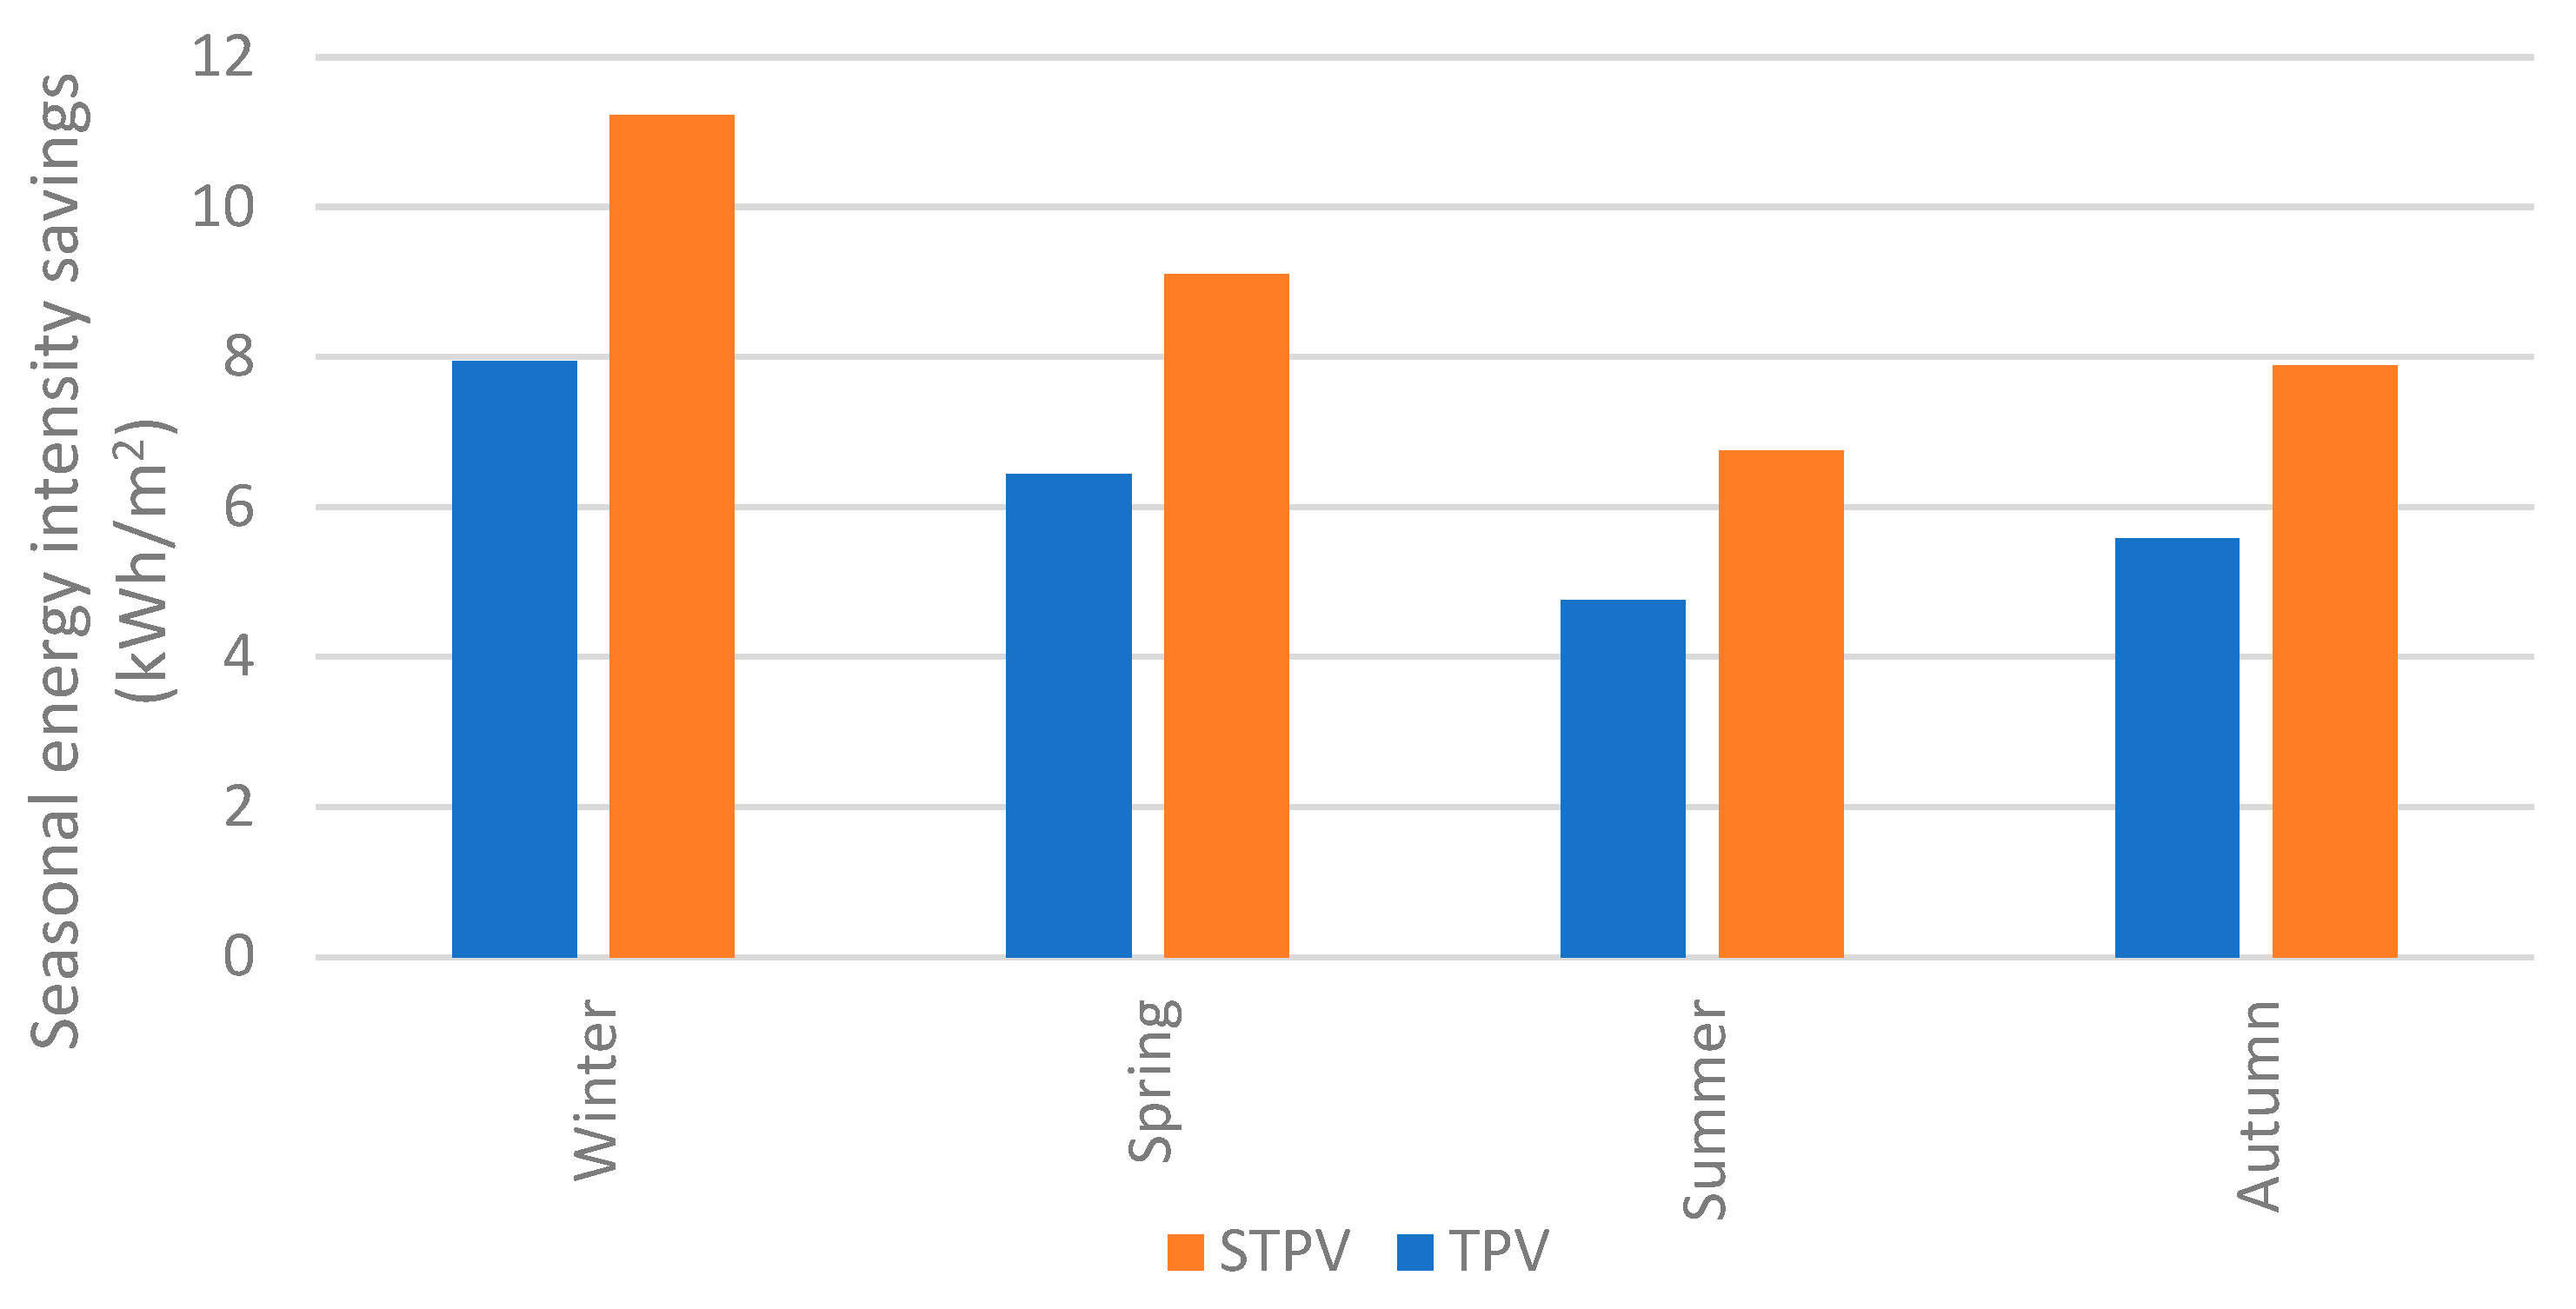
Figure 7 illustrates the projected energy use intensity savings under both scenarios in comparison to conventional glass. TPV and STPV systems excel in efficiently converting heat into electricity, particularly in cold weather, making them highly valuable for energy savings during winter. TPV systems are well-suited for winter conditions as they utilize thermal radiation from the thermal emitter to generate electricity [
28]. Notably, TPV panels demonstrate superior performance in colder climates, and the winter season is considered an optimal temperature range for their operation. Lower temperatures contribute to enhancing the overall efficiency and electrical performance of photovoltaic systems [
29]. Moreover, considering Iran’s location in the northern hemisphere, the orientation of PV panels installed on a vertical façade is strategically designed to maximize solar absorption during the winter months [
30].
It is crucial to highlight that the tower façades are not shaded by adjacent buildings in the east and west directions. The percentage of energy savings across different seasons is established by contrasting the energy collected in two modes (utilizing BIPV and TPV) with the energy computed in the normal mode. The optimal placement of modules is expected to be vertical on the façade. Although angled modules demonstrate a higher absorption of annual solar radiation, vertically arranged PVs can cover more surface area, thereby enabling a higher nominal power output [
23]. When BIPV is implemented, the achieved savings amount to 25 kWh/m
2 (see
Table 3). However, employing TPVs on the façade elevates the total energy savings to 35 kWh/m
2, as detailed in
Table 3, considering the duration of the four seasons. These results indicate that the installation of TPV on the tower façades leads to more substantial energy savings. Insights from various studies indicate that PV systems are notably effective in generating electricity in hot and semi-arid climates, especially in regions that are heavily reliant on electricity-consuming air conditioning devices to achieve thermal comfort [
31].
Consideration must be given to the potential adverse impacts of opaque modules on both physical and mental well-being [
32]. For optimal thermal comfort and the promotion of inhabitants’ health, it is recommended to choose clear TPVs. When deciding on the most appropriate option for the system, it is crucial to give priority to health-related factors. However, TPV glass with the selected wavelength can be applied as a glass façade in all directions of the towers. The use of PV in the tower’s façade often does not enhance the appearance of the structure. In contrast, this technology, when employed in all directions of the building, resembles spider glass and is more appealing from an aesthetic standpoint.
Figure 2 illustrates that the north face of this project receives the least amount of sunshine, rendering it economically unfeasible to install modules relying solely on solar energy for electricity generation. Nevertheless, even in shaded areas, TPVs with a selected wavelength can capture ultraviolet and infrared light from the surroundings and convert it into electrical energy [
25]. Moreover, during operation, each module generates its own heat. As per previous predictions in the literature, this design necessitates an initial thermal simulation for evaluation. The purpose of this is to ensure that this generated heat does not impact the efficiency of the modules and to prevent excessive heating in the interior areas, particularly during hot seasons [
33].
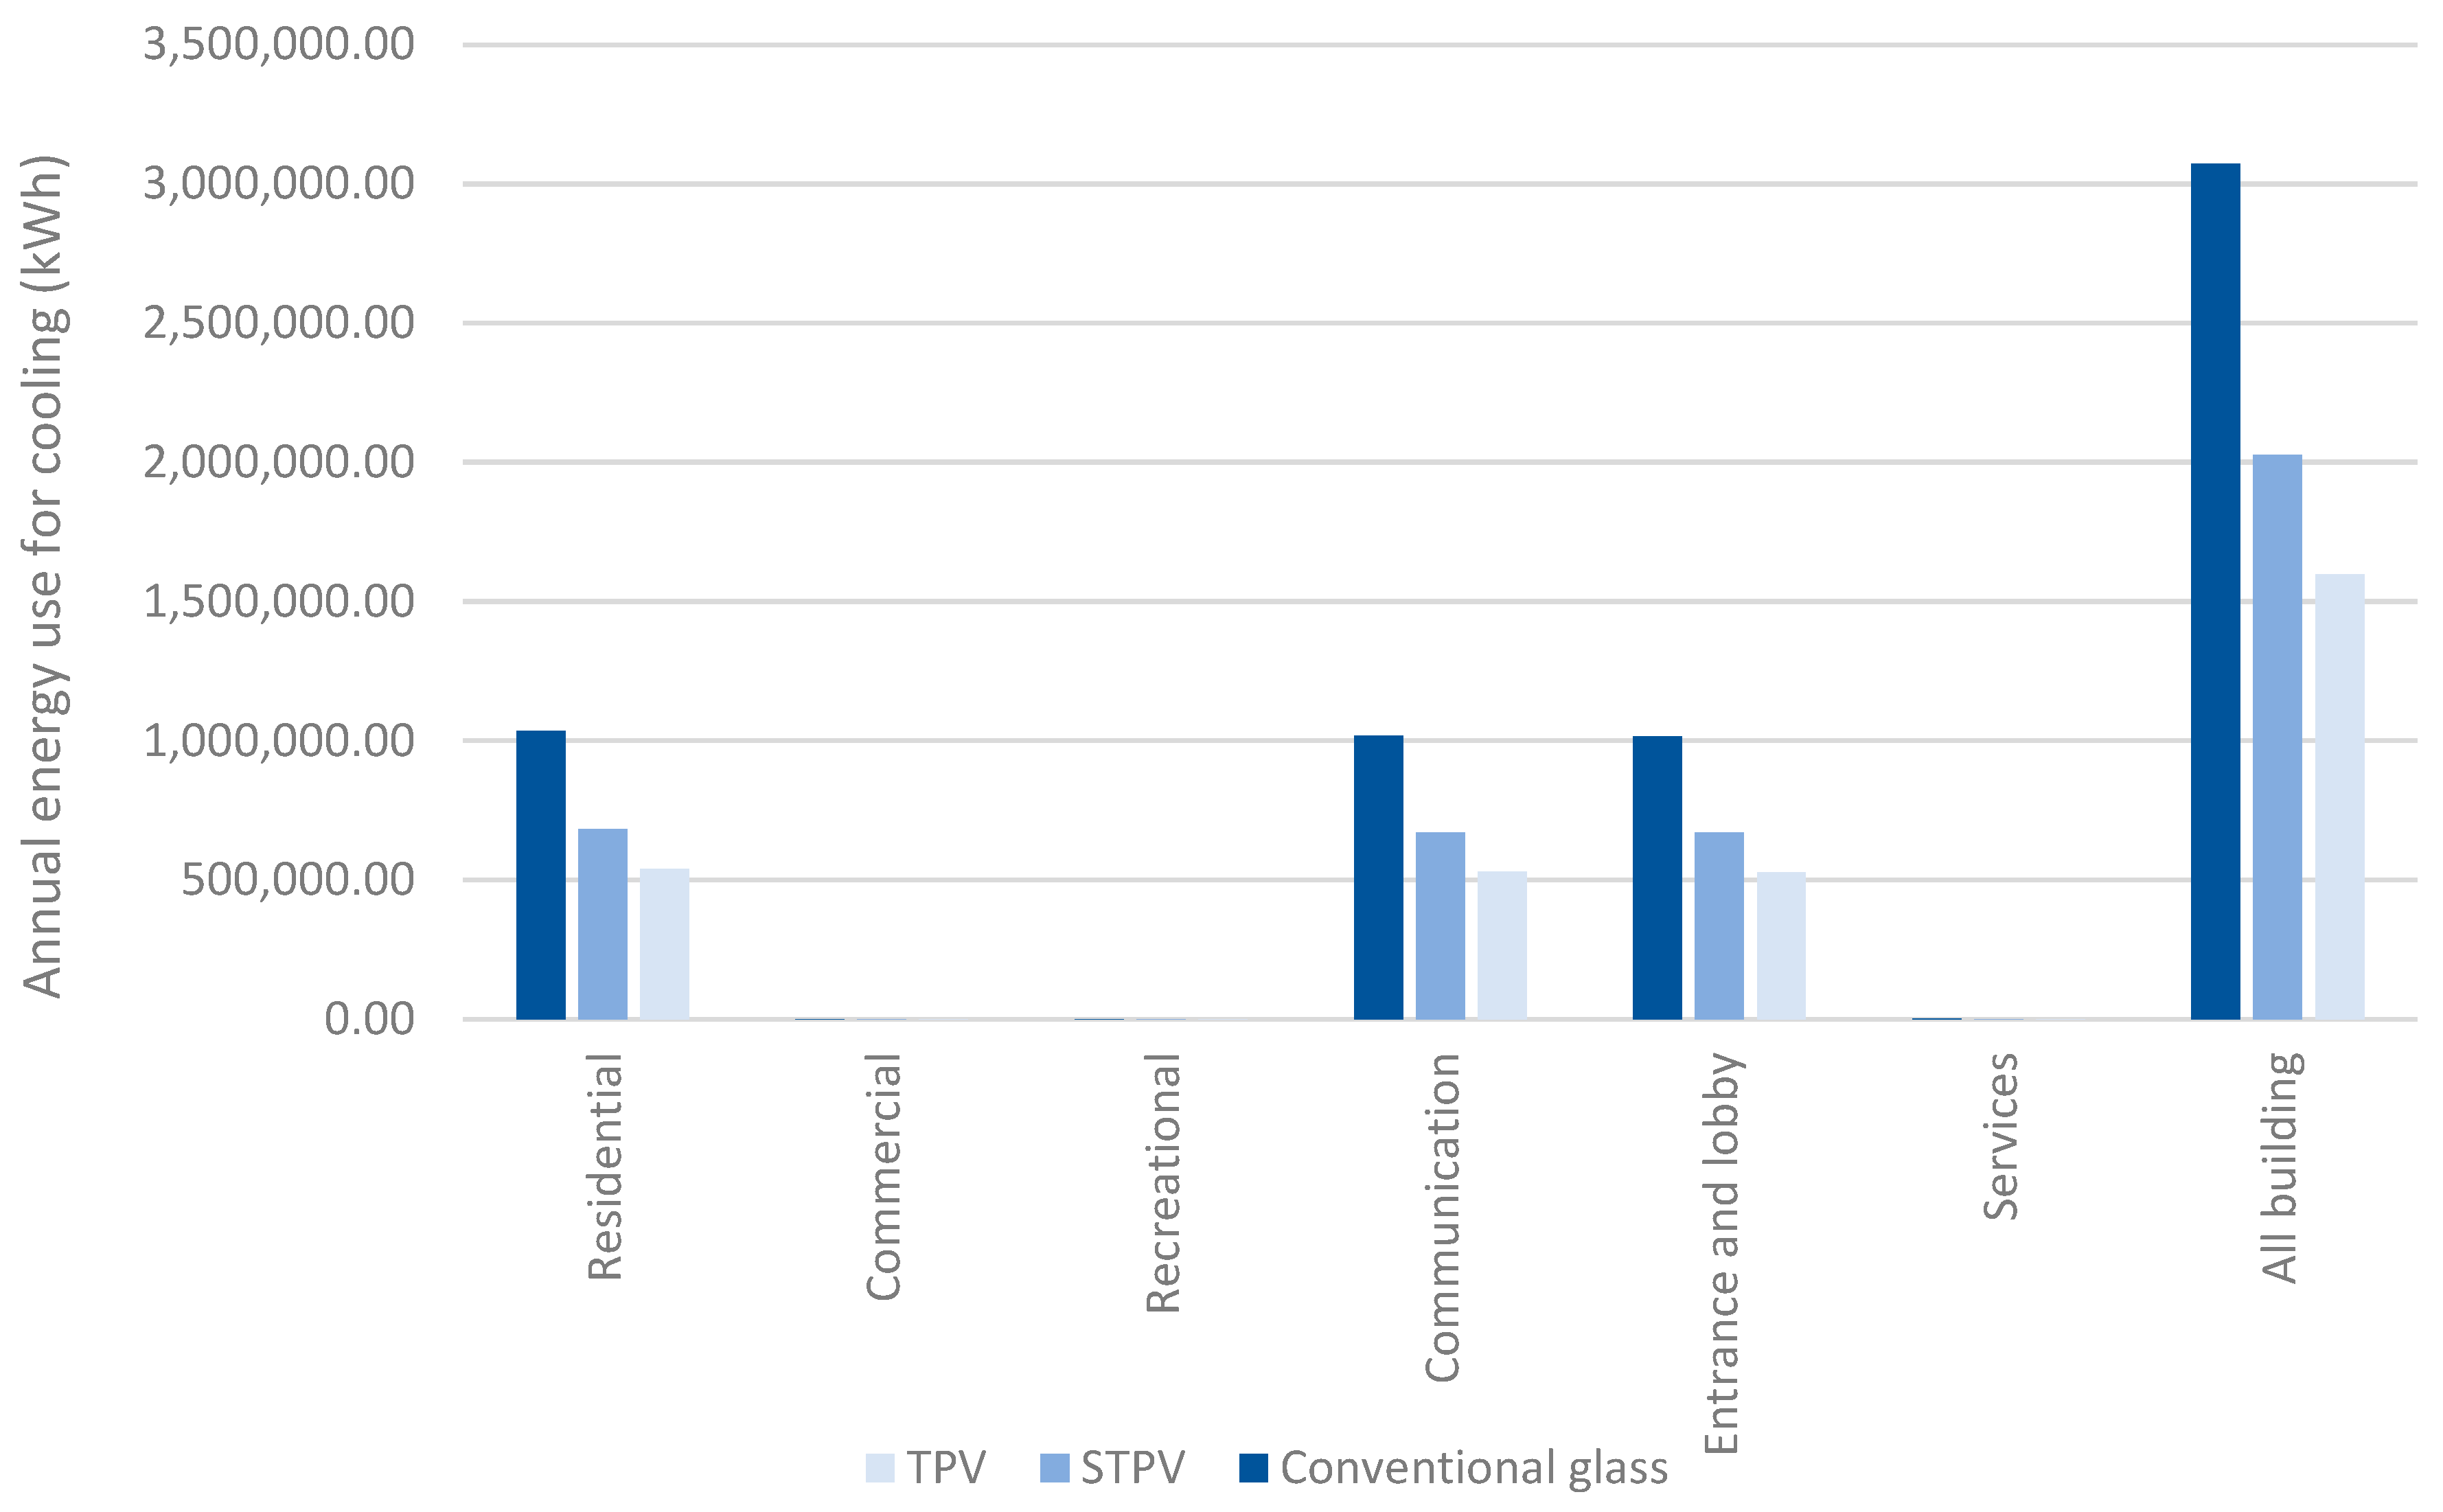
To facilitate efficient ventilation at the rear of the modules, particularly in Tehran’s high temperatures, it is essential to create an air gap between the building’s façade and the modules installed in front of it. For this purpose, the annual cooling energy has been compared under three different scenarios using the previously mentioned methodology (utilizing regular glass, TPV glass, and STPV glass) and the results are presented in
Figure 8. The findings indicate that the use of TPV glass reduces municipal electricity consumption by 2 million kWh compared to regular windows and one million kWh compared to the use of BIPV modules.
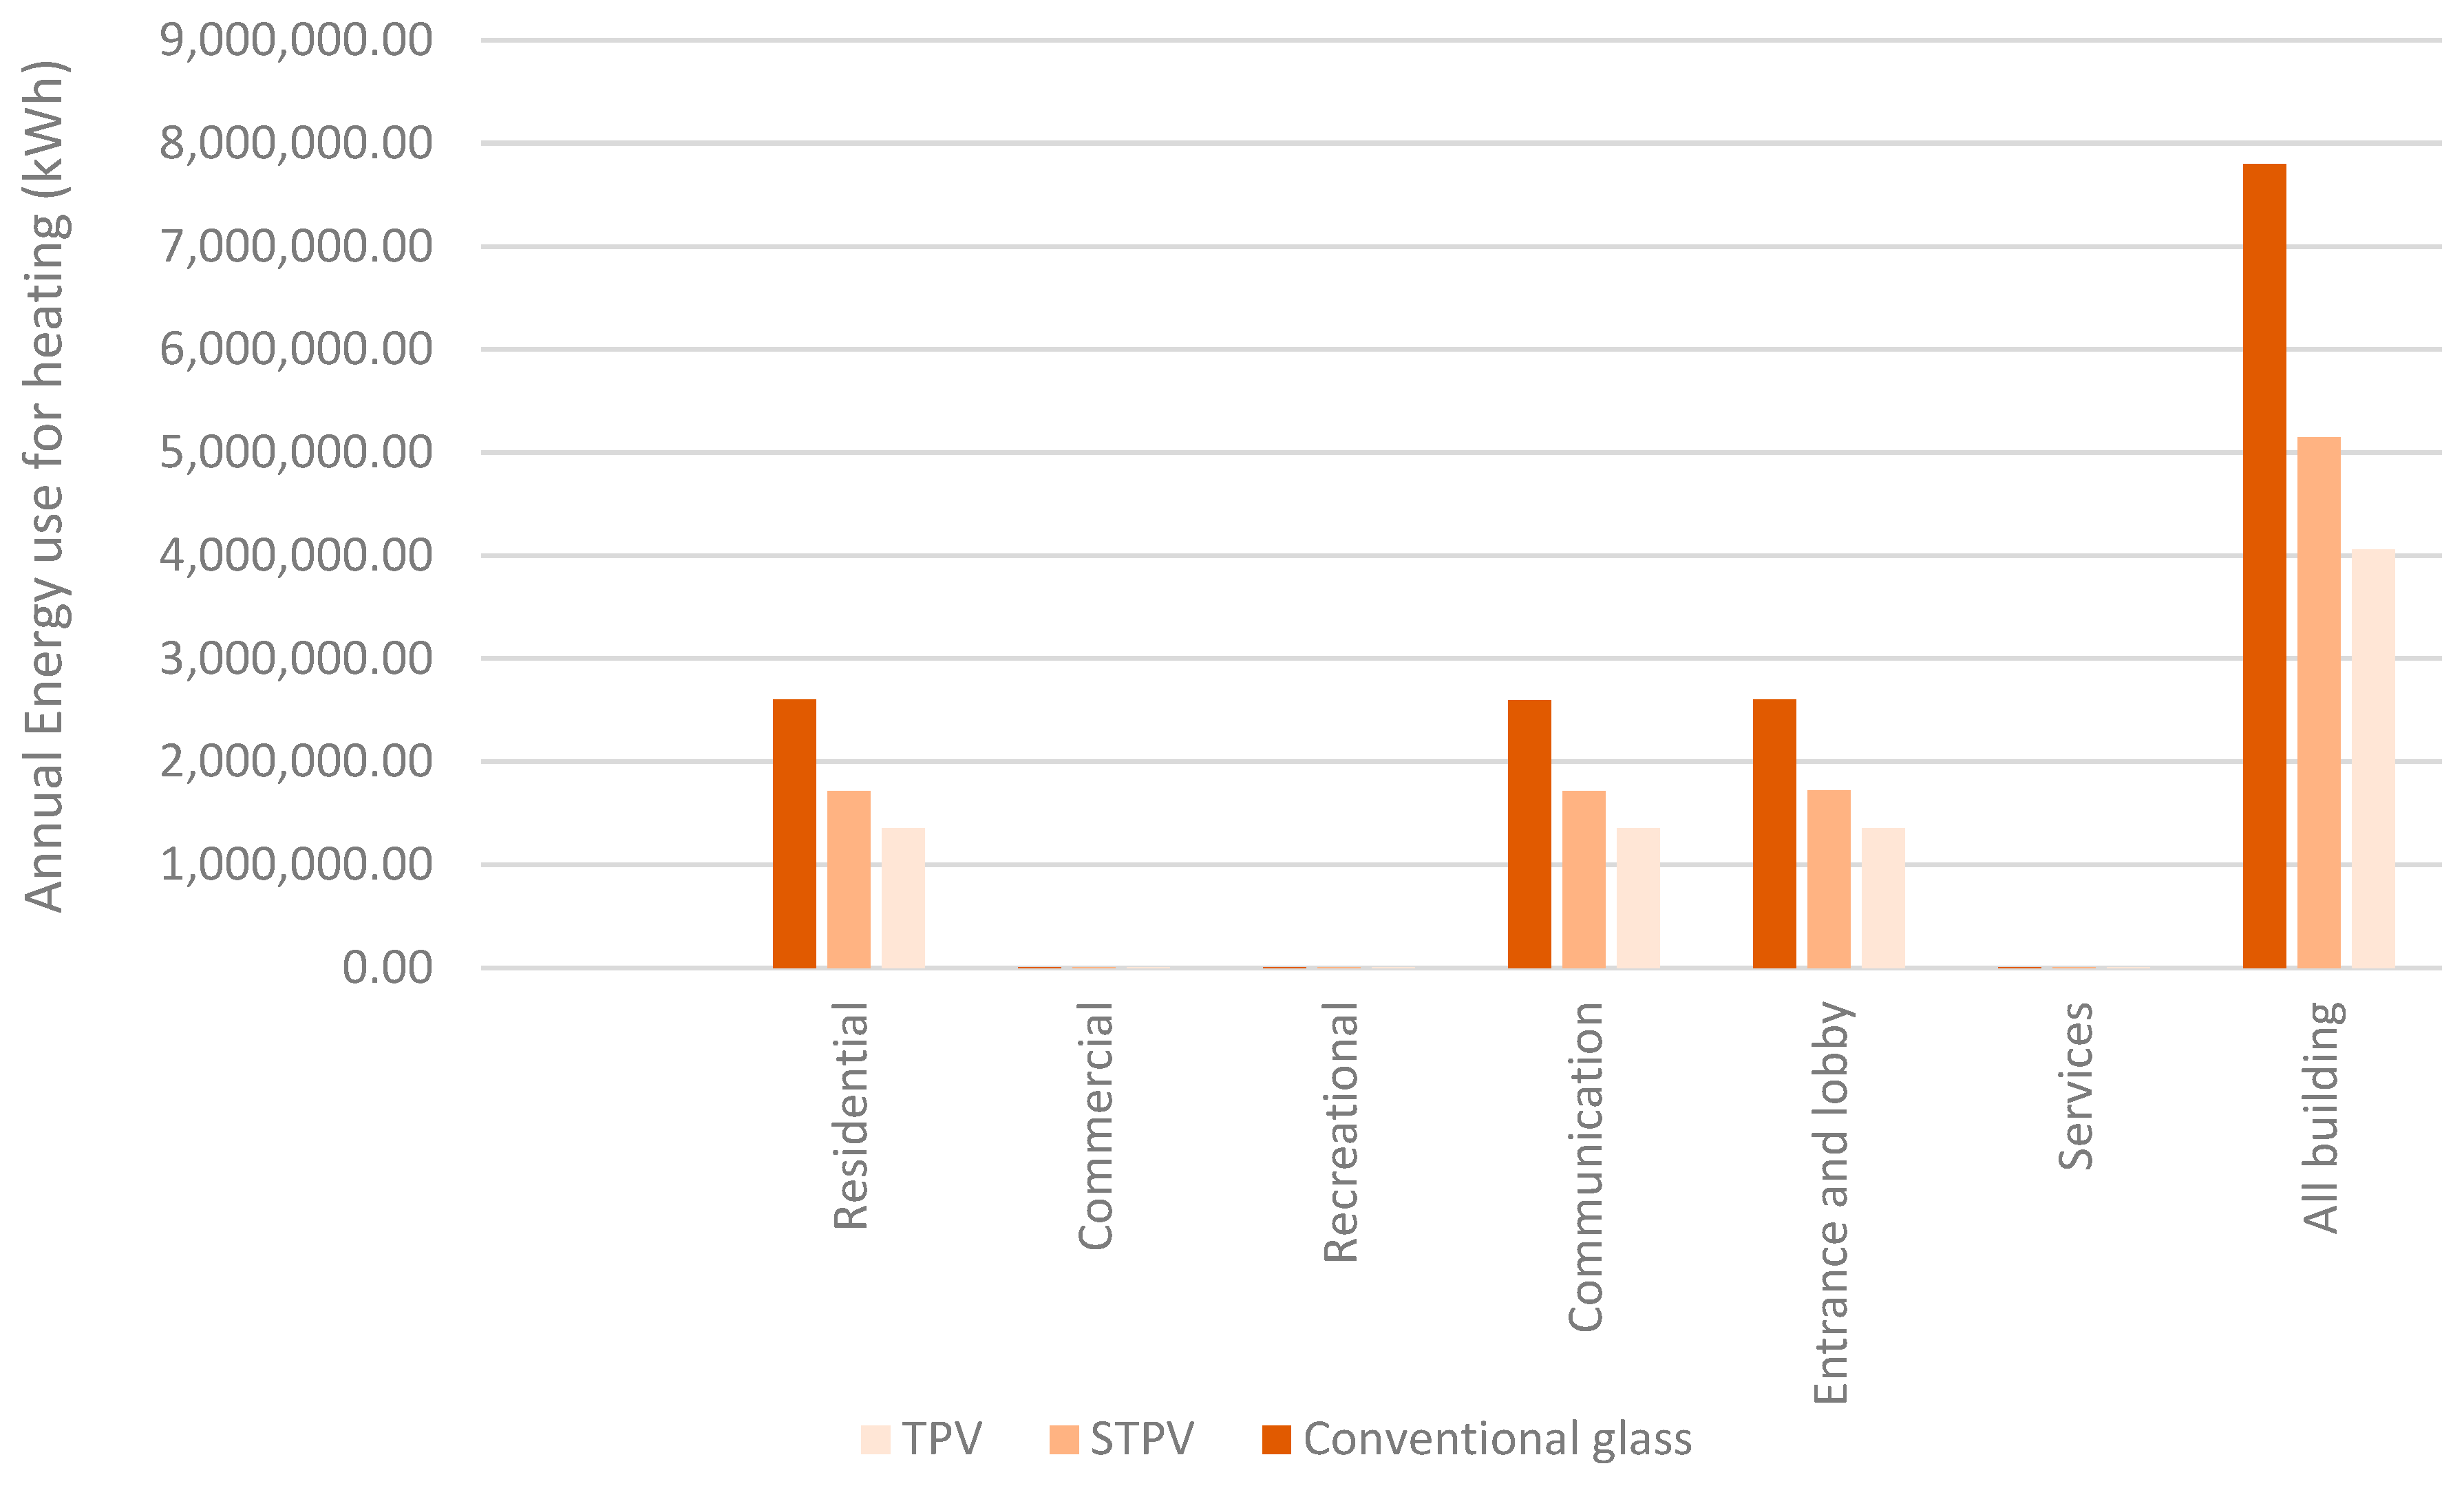
Furthermore, the energy demand for annual heating has been compared using the same process. In this tower, the energy requirement is equivalent to seven million kWh when using regular windows, five million kWh with STPV, and four million kWh per year when using TPV glasses. The energy needed for annual heating is illustrated in
Figure 9. The practice of establishing a minimum space between a module and a window or a building façade has enhanced module efficiency, reduced the environmental cooling load, and had an impact on the annual heating process.
As per
Table 4, the energy consumption in the initial state is 73 kWh/m
2. If STPV is implemented in the façade, then the energy consumption will decrease to 48 kWh/m
2, leading to savings of 25 kWh/m
2. Moreover, if TPVs are employed, the energy consumption will be 38 kWh/m
2, resulting in 35 kWh/m
2 of energy savings.
Based on the analysis of energy consumption using the different technologies employed in this study, it was determined that implementing BIPV in all four directions of the tower can only result in a 34% reduction in energy consumption. However, it was found that the energy obtained from TPVs used in the building’s façade saves approximately 48% of the energy consumed across the entire structure. Given the functionality and clarity of these glasses, this amount is substantial. The cost of power used by the tower is saved by a similar amount, approximately USD 2 million per year, and greenhouse gas emissions, including CO2, are reduced. These designs not only generate renewable energy but also possess valuable architectural features in terms of aesthetics.
The research can aid in optimizing resource allocation by identifying which technology, TPV or STPV, provides a better balance between cost and energy efficiency. This knowledge can be crucial in allocating funds effectively, especially in projects where budget constraints are a significant consideration. Understanding the cost-effectiveness and energy efficiency of TPV and STPV allows for a comprehensive assessment of their environmental impacts. This information is crucial for promoting technologies that not only make economic sense but also align with broader sustainability goals and improve overall building performance. Policymakers can use the research findings to inform and refine policies related to renewable energy adoption and building standards. This, in turn, can create a supportive regulatory environment that encourages the integration of TPVs and STPVs in construction projects.
3.2. Cost-Effectiveness
The payback period is a financial metric used to determine the amount of time it takes for an investment to generate cash inflows sufficient to recover the initial cost of the investment. The formula for calculating the payback period is:
Nonetheless, the payback period is a simple metric and has some limitations. It does not account for the time value of money (the fact that USD 1 today is worth more than USD 1 in the future) and does not consider cash inflows beyond the payback period. Additionally, it does not provide information about the overall profitability of the investment. For a more comprehensive financial analysis, other metrics such as the net present value (NPV) or internal rate of return (IRR) may be considered. These metrics take into account the time value of money and provide a more complete picture of the financial viability of an investment.
NPV and IRR allow for the incorporation of risk and uncertainty in the form of discount rates. The discount rate applied in NPV calculations reflects the risk associated with the investment. IRR, on the other hand, implicitly considers risk by indicating the rate at which the project breaks even. Higher discount rates or lower IRRs account for greater perceived risk.
The net present value represents the present value of the expected cash inflows and outflows associated with an investment, discounted at a specified rate of return (discount rate). The formula for NPV is as follows:
where
CFt is the net cash inflow during the period
t,
r is the discount rate, and
T is the total number of periods.
The internal rate of return is the discount rate that makes the NPV of an investment zero. In other words, it’s the rate of return at which the present value of cash inflows equals the present value of cash outflows. The IRR is found by setting the NPV equation equal to zero and solving for the discount rate. The formula for IRR is typically solved using financial calculators, software, or iterative methods:
where NPV is the net present value, which is the sum of the discounted cash flows,
CFt represents the cash flow at time period
t, and
t is the time period.
The IRR is expressed as a percentage and represents the effective annual rate of return on the investment. If the IRR is greater than the required rate of return or the cost of capital, the investment is generally considered acceptable.
Based on the results for annual energy savings with both TPVs and STPVs in comparison with conventional glass alternative and the discount rate of −9.31%, NPV and IRR were calculated using Equations (1) and (2), and spreadsheets. The NPV of USD 953 for TPVs and USD 2643 for STPV are achievable with IRR value of −6% and −50% for TPV and STPV, respectively.
3.2.1. Cost-Effectiveness of TPV
The positive NPV indicates that, based on Iran’s discount rate, the present value of future cash inflows exceeds the initial investment of USD 953. In other words, the investment is projected to result in a net gain and the investment in STPV panels is expected to meet or exceed the required rate of return, making it financially attractive. The value of USD 953 represents the estimated net gain in present value terms.
The IRR of −6% is a negative value and it indicates that the internal rate of return is −6%. The IRR is the discount rate at which the NPV of the investment becomes zero. In this case, it means that, for the provided cash flows, a discount rate of −6% results in an NPV of zero. The negative IRR indicates that the investment is not generating a sufficient return to cover the cost of capital.
In combination, a positive NPV and a negative IRR suggest that, based on the provided cash flows and the chosen discount rate, the investment in STPV panels is expected to generate a net gain, but the internal rate of return is negative. This could indicate that the project’s cash flows are not sufficient to generate a positive return relative to the cost of capital.
3.2.2. Cost-Effectiveness of STPV
The figure suggests that the present value of the net cash flows (benefits minus costs) associated with STPV is USD 2643. A positive NPV generally indicates a positive return on investment. IRR is the discount rate that makes the net present value of all cash flows from a particular project equal to zero. It represents the annualized effective compounded return rate or yield of the investment.
An IRR of −50% suggests that, under the given cash flow assumptions, the project is not generating a positive return. Typically, a positive IRR is desired for a project to be considered financially viable.
In summary, a positive NPV of USD 2643 for STPV indicates potential profitability. A negative IRR of −50% suggests that, based on the given cash flow assumptions, the project may not be financially viable.
Higher NPV is generally considered more favorable. In this case, the STPV system has a significantly higher NPV (USD 2643) compared to the TPV system (USD 953). Therefore, based on NPV alone, the STPV system appears more profitable. IRR represents the discount rate at which the NPV of the project becomes zero. A higher IRR is generally preferred, but it is also essential to consider the cost of capital. Both systems have negative IRR values, which might indicate that they are not meeting the required rate of return. Although both systems have negative IRR, the STPV system seems more financially viable due to its substantially higher NPV.
4. Discussions
Reliance on the data obtained from different manufacturers poses several limitations and challenges, especially when discussing specific performance features of commercial TPV products that are not publicly disclosed. As TPV modules are still in the development stage, the available data regarding their performance in various environments are solely derived from manufacturers. The lack of standardization in this emerging field can result in minor variations in the measurement of their performance aspects. However, relying on outdated or insufficient information may not accurately depict the current state of technology, and some manufacturers might opt to keep certain performance details confidential for competitive reasons. Another challenge arises from the absence of long-term performance data for TPV products, which may not be readily accessible. Forecasting the lifespan and reliability of these systems becomes challenging without historical performance data.
In countries like Iran, where electricity prices are relatively low, the economic viability of investments in renewable energy technologies may be impacted [
34]. Traditional fossil-fuel-based energy sources, which may have lower upfront costs, can sometimes be more financially attractive in the short term in comparison with solar energy systems. Green technologies, including TPV, and STPV, often require significant upfront investments. The financial feasibility of these projects depends on factors such as the initial capital costs, operational and maintenance expenses, and the expected energy production over time. Given the long-term environmental benefits and the global push for sustainable practices, governments may recognize the importance of transitioning to cleaner energy sources. In countries where electricity prices are low, the government may need to provide subsidies or financial incentives to make investments in green technologies financially feasible for businesses and individuals [
22].
One significant factor affecting the financial viability of TPV and STPV systems in Iran is the absence of a mechanism for selling excess energy back to the national grid, often referred to as “net metering” or “feed-in tariffs”. In many countries, net metering allows building owners with solar panels to feed surplus electricity they generate back into the grid. The electricity meter runs backward when the home generates more power than it consumes, effectively allowing investors to receive credit for the excess electricity. This credit can then be used during periods of low solar production, such as at night. In some regions, there are feed-in tariffs (FITs), where individuals or businesses are paid a fixed rate for the electricity they generate and feed into the grid. This provides a guaranteed income stream for renewable energy producers and incentivizes investment in solar installations. Without the ability to sell excess energy, investors in Iran miss out on potential revenue opportunities. The surplus energy generated during peak sunlight hours could otherwise be utilized to offset electricity costs during times when the solar panels are not producing electricity, such as during the night. The absence of mechanisms like net metering can extend the payback period for the initial investment in PV systems. Investors might take longer to recoup their upfront costs, which could impact the attractiveness of investing in solar energy systems, including TPVs and STPVs.
Increasing public awareness about the benefits of solar energy and advocating for policy changes can help build public support for the adoption of solar technologies. Introducing financial incentives, such as tax credits or subsidies, can make solar investments more attractive for homeowners, even in the absence of direct compensation for excess energy.
A comprehensive long-term energy strategy that includes support for distributed generation and renewable energy sources can contribute to a sustainable and resilient energy infrastructure. Addressing these issues could help overcome the hurdle posed by the absence of mechanisms for selling excess energy, fostering a more conducive environment for the financial viability of home PV systems in Iran.
Supporting the adoption of green building technologies aligns with global efforts to mitigate climate change. Green building technologies such as TPVs or STPVs contribute to reducing greenhouse gas emissions by generating electricity from renewable sources, thereby decreasing reliance on fossil fuels. Investing in green technologies not only contributes to reducing carbon emissions but also addresses environmental concerns related to air and water pollution. Additionally, it can stimulate job creation and promote a sustainable and resilient energy infrastructure.
Establishing long-term laws and supportive policies in Iran is crucial in facilitating the widespread installation of photovoltaic (PV) systems. The sixth law of agricultural development mandates that the government enhances the nation’s electricity production capacity, aiming for a maximum of 5% to be generated from renewable energy power plants by 2030 [
35]. Approved parliamentary laws allocate tax revenue for improving both urban and rural electricity supplies, emphasizing renewable system purchases. Notably, the “Perspective and Policy Making” section underscores the importance of guaranteed purchase of renewable electricity, highlighted in various documents [
36].
To promote the adoption of green technologies, particularly thermophotovoltaics (TPVs) and solar thermophotovoltaics (STPVs), the following suggestions can be considered:
- -
Subsidies for solar panel installation and operation to reduce initial costs.
- -
Establishing infrastructure for the assured purchase and sale of such systems.
- -
Encouraging the development and strengthening of the technological framework for advancing renewable energy use.
- -
Assessing domestic companies’ technological capabilities in the renewable energy sector.
- -
Promoting the growth and innovation of the market for renewable equipment.
- -
Conducting extensive programs to enhance knowledge in design.
- -
Providing financial support for the advancement of renewable technologies.
- -
Government agencies acquiring renewable energy equipment directly from manufacturers.
- -
Implementing policies that encourage the construction of small-scale private power plants.
- -
Reviewing import tariffs and customs charges for renewable energy equipment.
- -
Establishing investment funds for financing in the TPV and STPV fields.
- -
Granting low-interest, long-term loans to solar industrialists.
- -
Ensuring long-term funding to increase the adoption of TPV and STPV systems.
- -
Involving the Ministry of Energy as a stakeholder in renewable energy policies [
37].
While developers may face risks entering the potential energy market due to reduced government tariffs, higher tariff rates over the next 20 years are expected to yield greater benefits [
36]. Additionally, aligning national policies with global sustainability goals, such as those outlined in the Paris Agreement, can strengthen a nation’s standing and foster international cooperation.
Governments play a crucial role in shaping the energy landscape through policies, regulations, and initiatives. They can implement feed-in tariffs, tax incentives, or direct subsidies to encourage the adoption of renewable energy technologies. While the initial costs of green technologies may be higher, they often offer long-term benefits, including lower operational costs over time and increased energy independence. Governments may consider the long-term environmental and economic advantages when formulating subsidy programs. Governments may also invest in public awareness and education campaigns to inform businesses and individuals about the benefits of green technologies. Increasing awareness can drive demand and create a more favorable environment for sustainable investments.
5. Conclusions
The efficiency of two distinct types of photovoltaic modules (STPVs and TPVs with wavelength-selective functions) is examined in this study, employing the standard appearance of spider glass on the façade of a residential tower in Tehran. The choice was made to vertically position the PV modules on the exterior of the tower for aesthetic reasons. The potential for energy savings has been assessed throughout the year by installing these modules in the four façade directions of the building. The following provides a summary of the main conclusions drawn from the study.
The energy consumption in terms of kilowatt-hours (kWh) for each zone has been independently determined by calculating the square footage of various portions of the plan and dividing it into different zones. This energy amount is calculated in three scenarios: a translucent TPV installation, a STPV installation, or a façade made entirely of regular glass. The Honeybee plugin, one of the Grasshopper plugins in the Rhino software, is utilized to generate this energy quantity.
The research illustrated the design process for evaluating the energy-saving potential of using TPVs and STPVs as alternatives to regular glass. The high-rise residential building showcased energy savings of 11 kWh/m2 in winter, 9 kWh/m2 in spring, 7 kWh/m2 in summer, and 8 kWh/m2 in autumn with TPVs. For STPVs, the corresponding energy savings were 8 kWh/m2, 6 kWh/m2, 5 kWh/m2, and 6 kWh/m2 in the winter, spring, summer, and autumn, respectively. These findings indicate that TPVs can achieve approximately 30% more energy savings than STPVs.
The modules were positioned 12 mm away from the façade and windows of the units to optimize performance and mitigate the impact of generated heat on the building’s annual cooling. This distance selection was made based on the characteristics of the chosen modules and their heat generation. To ensure the accuracy of these estimates, the energy required for annual heating and cooling was determined. The total energy required in the building for conditioning spaces with STPVs is approximately 2,028,032 kWh/year, while TPVs requires 1,597,833 kWh/year. These figures show that TPV can reduce annual cooling energy consumption by 21% more than STPV. Furthermore, compared to regular glass, STPVs and TPVs can decrease the building’s annual cooling energy usage by 34% and 48%, respectively.
The annual heating energy requirements for the examined building follow a similar pattern. The use of TPVs and BIPVs necessitates 4,056,579 kWh/year and 5,148,734 kWh/year of energy, respectively. By this amount, the annual energy consumption in the heating sector is cut by 48% and 34%, respectively, compared to the standard case of façade glass. These findings demonstrate that, by establishing a space of 12 mm between the panels and the building’s façade, it is not only able to regulate the heat radiated from the modules but also serves as ventilation behind the modules, increasing the modules’ efficiency.
The simulation results revealed that the energy usage without PV is 73 kWh/m2. This energy consumption is reduced to 48 kWh/m2 when employing STPV systems. The integrated TPV systems with a selected wavelength achieve even greater energy efficiency, bringing the energy consumption down to 38 kWh/m2. To put it differently, STPVs save 25 kWh, equivalent to a 34% reduction in energy usage compared to the design’s baseline. In contrast, TPVs save 35 kWh, marking a more substantial reduction of 48% in energy consumption.
Nevertheless, TPV systems have not only preserved more energy but have also exhibited the capacity to generate more electricity in hot and semi-arid climatic conditions.
In countries like Iran, where low electricity prices and the lack of government policies and incentives impact the economic viability of renewable energy investments, governments play a crucial role in encouraging the adoption of green technologies, such as TPVs and STPVs, through subsidies and policies, aligning with global sustainability efforts and addressing environmental concerns, while also stimulating job creation and promoting a resilient energy infrastructure.
