Article

Assessment of Households’ Perceptions of Health Co-Benefits in Relation to the Willingness to Undertake Energy Retrofits in Barcelona

by
Carlos Benites-Aguilar
1 and
Carlos Marmolejo-Duarte
2,*
1
Barcelona School of Architecture (ETSAB), Technical University of Catalonia, 08034 Barcelona, Spain
2
Centre for Land Policy and Valuations, Department of Technology in Architecture, Barcelona School of Architecture (ETSAB), Technical University of Catalonia, 08034 Barcelona, Spain
*
Author to whom correspondence should be addressed.
Buildings 2024, 14(1), 236; https://doi.org/10.3390/buildings14010236
Submission received: 31 October 2023 / Revised: 15 December 2023 / Accepted: 11 January 2024 / Published: 15 January 2024

Abstract

:
Energy retrofits have, so far, been studied from the perspective of economic benefits that undertaking energy retrofit brings. They have also been of interest in the pursuit of reducing carbon emissions. However, few have studied the perception of health co-benefits of energy retrofits. Therefore, this paper seeks to shed light on how the residents’ perception of their health affects their decision to undertake an energetic retrofit. The focus of this article is to determine how residents perceive their health and their willingness to undertake energy retrofits to improve their health in the municipality of Barcelona. The methods used were in-depth interviews with experts and face-to-face and surveys conducted online. The results were analysed using descriptive, segmental, and unconditional logistic regression. We also analysed if awareness of the health co-benefits of retrofits corresponded with the respondent’s housing conditions, socio-demographics, and willingness to energy retrofit their homes. A total of 127 participants were included, of which 6.3% listed health co-benefit improvements as an influencing factor in undertaking an energy retrofit. The survey findings show that the less educated households are less aware of the health co-benefits of energy retrofits. These findings reveal the need to re-evaluate the current energy and housing policies.

1. Introduction

According to the United Nations Environmental Programme, the construction industry consumes 40% of the world’s raw materials and 36% of CO2 emissions in Europe [1]. The increase in carbon in the atmosphere contributes to rising temperatures, which requires higher energy consumption to preserve comfort in buildings placed in hot climates. This generates a repetitive cycle that contributes to global warming. Regarding local energy consumption, the residential sector accounts for 30% of the total in Barcelona municipality [2]. In a residential building, the building envelope plays a determining role in the impact of indoor conditions, such as thermal comfort, which may have an underestimated impact on the health conditions of its residents. Barcelona, however, is aggravated by poor housing conditions due to the age of the housing stock (80% of the housing stock predates 1979, when the first regulation requiring thermal insulation was passed) [3] and the inadequate implementation of insulation.
Directive (EU) 2010 (Energy Performance of Building Directive-EPBD) [4] introduced the imposition of Energy Performance Certificates (EPCs) to certify existing buildings and has been updated in 2018 and 2023. This recent recast introduced terms, such as energy poverty [5]. In Spain, however, the general transposition of this directive has not yet been fully implemented, as there is no clear persuasion of the benefits that efficient housing or the retrofitting of existing housing can bring.
Several studies have tried to quantify the co-benefits related to energy efficiency in retrofitted dwellings, the costs related to health services and medicines, and the temporary labour costs related to work losses. For example, Ortiz, J. and Salom, J. [6] investigated the economic impact of energy retrofit in residential buildings in Spain, through a cost–benefit analysis. The most significant contribution of such research consisted of estimating the return on investment, considering, on the one hand, the investment cost, and on the other, energy savings, avoided labour costs, and public health expenditures. By including such positive externalities, it is possible to reduce energy retrofit payback periods by almost half. An important limitation of this research is that the gradient between the cost of medicines and labour costs is taken from a public sector perspective; however, people also spend from their own resources, making it impossible to give a real economic value to this aspect. Furthermore, in order to characterise dwellings that cannot guarantee comfortable conditions in winter, the definition of energy poverty is based on the definition that total energy costs should not exceed 10%.
Martin Jakob [7] has proposed a methodology that quantifies the marginal costs of energy efficiency investment in the residential sector in Switzerland (e.g., benefit from avoided costs of generation and distribution of space heating when improving wall insulation and window systems). The cost–benefit analysis addresses key issues such as improved living comfort, indoor air quality, and protection against external noise. However, such research is unable to explain the economic effects of other environmental conditions (i.e., cold temperatures in winter, high temperatures in summer, damp and fungal problems) because it lacks epidemiological analyses for the respective diseases. The present research takes into account the factors contributing to the increased perception of co-benefits. The study carried out by Dell’ Anna et al. [8] investigates, through contingent valuation and Bidding Game (BG), the health benefits related to retrofitting interventions in residential buildings in Turin. Its findings suggest that people are willing to pay (WTP) an amount of EUR 7541 on average, coming from improved comfort conditions and reduced negative health impacts. These investment amounts allow for the installation of various energy efficiency measures, such as the replacement of the boiler and windows/façade insulation. In short, we refer to the people WTP based on improving the architectural conditions of the dwelling. The present study tries to go a step further by considering, in addition, environmental factors, explicitness in health conditions, and the level of sensitivity in the perception of the recipients of these benefits. Baron A. [9] studied the change in perceived thermal comfort after implementing a neighbourhood-scale energy retrofit in Santa Coloma (Barcelona). However, it was limited to the winter period, relegating the fact that summer produces thermal stress aggravated by heatwaves in the Mediterranean area. Biere Arenas, R. et al. [10] used a survey and identified that perceived financial benefits (e.g., energy savings) and co-benefits (e.g., comfort and health) of efficient homes are contingent on the socio-demographic characteristics of the population. Older and higher-income people appreciate more co-benefits, such as health, comfort, and environmental conservation, but younger and lower-income people value economic aspects more. Certainly, in the same direction as the contributions, it is necessary to cite Marmolejo et al. [11]. Based on the hypothesis that “current living conditions influence perceived co-benefits”, it was possible to explain, to some extent, whether these conditions affect the perception of co-benefits; however, the issue of health was made explicit in a general way, without breaking it down into the different vectors associated with the environmental conditions of housing, such as high temperatures in summer, cold temperatures in winter, dampness problems, low levels of air quality, and high levels of noise.
As can be seen in Table 1, a number of methodologies have been employed to study the impacts on benefits and co-benefits, focusing, however, on economic theories [6,7,8,12,13,14,15] (e.g., replacement costs, avoided costs, hedonic pricing, contingent valuation). However, these valuations have been criticised by arguments referring to the “commodification of services” [16] or aspects involving the value of life in countries with different income levels. Few have employed a methodology in which co-benefits are studied at the level of people’s perceptions [9,10,11], but none have studied them merely at the level of health co-benefits by focusing on perceptions of health and their impact on undertaking energy retrofits.
Given that the importance of the issue of the effectiveness of EPCs is limited [17,18] in encouraging residents to commit to retrofitting their homes, there is a great need to understand the perception of the residents while facing the challenge of prioritising the financial savings of retrofitting their homes. The argument for energy savings, mainly in winter, is overshadowed in Mediterranean areas, such as Barcelona. For this reason, the objectives of this article were (a) to assess whether residents are aware of the influence that energy-efficient housing conditions have on their health; (b) assess the extent to which the population is willing to undertake energy retrofits once they are confirmed that there is a link between housing conditions and health; and (c) identify the perceptions that residents have on their health. All of the specific objectives listed can be compressed into a general one: determine whether health co-benefits influence residents’ decision-making to undertake energy retrofitting. The novelty in this research lies in the fact that to date, although these health co-benefits have been increased in the number of studies published in the scientific literature in relation to greenhouse gas emission reductions and urban environmental health [19,20,21,22], no investigation has assessed residents’ perceptions about health co-benefits and their impact on undertaking energy retrofits.
This paper also explores whether occupants’ perceptions can contribute to undertaking energy retrofitting through passive design strategies, such as integral insulation in external walls and windows, when they are informed about health improvement.
Table 1. Selected indicators and methodology of different co-benefits.
Supporting LiteratureImpact SubcategoryCauses Physical IndicatorMethod Used
Vandentorren et al. (2003) [9] FranceHigh interior temperaturesHeat waves
Living in a penthouse
Lack of thermal insulation
Additional deaths
Respiratory diseases
Cardiovascular diseases
A case study in four different areas in France (where the heat wave was strongest)
Kampa and Castanas (2008) [10]Indoor air qualityParticulate matter (PM10 and PM2.5).
Nitrogen dioxide (NO2).
Sulfur dioxide (SO2) emissions of Sox and NOx
CO2 and ozone (O3)
Mortality
Respiratory problems (asthma and chronic bronchitis)
Cardiovascular problems
Lung cancer
Avoided costs approach
Contingent valuation method
Willingness to pay (WTP)
Ortiz, J. and Salom, J. (2016) [6] SpainCold temperatures in winterAge of the dwelling
Existence and characteristics of the heating system
Price of energy (heating)
Self-perceived health
Respiratory diseases (asthma and chronic bronchitis)
Cardiovascular diseases
Mortality and morbidity
Characterise the housing stock in Spain
Characterise dwellings that do not guarantee comfort conditions in winter
Describe people’s health
Chapman et al. (2003) [11]
United States
Condensations (dampness and fungus)Warm climatesIrritation, allergies, infections, and asthmaMeta-analysis
Bjørner, T. (2004) [12]
Denmark Copenhague
Noise exposureRoad and air traffic
Ambient noise above 55 dB
Cardiovascular diseases
Cognitive impairment in children
Sleep disturbance
Tinnitus
Increased mortality
Irritation or anger
Contingent valuation and questionnaire
Willingness to pay (WTP)
Martin Jakob (2004) [7]
Swiss. Residential sector
Thermal comfortn.a.n.a.* Avoided cost approach
* Cost–benefit analysis
Barón Rodríguez, A. (2017) [13] SpainCo-benefits Thermal comfortn.a.n.a.* Survey
* Descriptive statistical analysis
Biere Arenas, R. et al. (2023). [14] BarcelonésPecuniary benefits
Co-benefits
n.a.n.a.* Survey
* Multivariate analysis of results
* Principal components
Marmolejo et al. (2020) [15] SpainCo-benefits Thermal comfortn.a.n.a.* Survey
* Descriptive statistical analysis
* Regression model
Larger scale; exterior housing
Arellano, B. Et al. (2022) [23]
Spain. Barcelona
Heat island* Torrid temperatures* Respiratory diseases
* Cardiovascular diseases
* Morbidity and mortality
* Individualised analysis for the four weather stations
* Linear ordinary least squares regression (OLS)
Note: n.a. is “not applicable” Source: Prepared by the authors using the review by Ürge–Vorsatz et al. [24] and several authors.

2. Research Methodology

The methodology for conducting an assessment of residents’ health perception consists of (1) methods and materials, where data collection is further elaborated; (2) a brief statistical analysis is performed to identify residents’ health perception and awareness of the impact of housing conditions on health; and (3) finally, in the conclusions, guidelines for policy implementation are provided and limitations are highlighted, and the research methodology flowchart is shown in Figure 1. Lastly, the potential influencing factors of occupants’ perception status are identified.

3. Method and Materials

The methods used in this study can be divided into two sections: data collection methods and analysis methods.

3.1. Survey Design

A semi-structured questionnaire was developed following an extensive review of the scientific literature on health co-benefits. During the preliminary elaboration, some experts were interviewed (Table 2). The opinions and comments were incorporated into the revised questionnaire. The survey is based on the standardised questionnaire ASHRAE Standard 55:2017 [25] and ISO 10551:2019 [26] consisting of 15 questions on perception of health, thermal comfort, and willingness to undertake energy retrofits and 13 questions on housing conditions and characteristics. The socio-demographic information of the respondents was inquired at the end of the interview with 10 questions. In total, the questionnaire contained 38 questions.
The main indoor comfort parameters considered were thermal, acoustics, dampness, and indoor air quality (IAQ), but no direct subjective assessment methods for lighting were considered. The questionnaire also included basic diagrams where respondents indicated the location of the building, the main orientation of the façade, whether the windows or walls had external insulation, and the type of window and carpentry. Also, if any questions were not obvious, they were explained when taking the survey. The questions were mostly divided into qualitative questions with closed questions, Likert scale (7-point) multiple choice, single choice, matrix questions, and open questions. The sample questionnaire and technical details in Table 3 are structured as follows.
Housing Conditions: This section analyses the condition of the dwelling, starting from the year of construction according to the first and subsequent thermal insulation building regulations, and whether or not they have external insulation (walls and windows). Residents are also required to indicate their estimated electricity and gas bills, as well as whether they have heating and air conditioning in their homes.
Indoor comfort conditions in the dwelling. In this section, residents should express how satisfied they are with the indoor comfort, determined by the five environmental factors previously described: outdoor noise, indoor air quality, dampness and leaks, thermal comfort in summer, and thermal comfort in winter. In addition, residents have an open option to indicate any other problems with their dwelling.
Self-perception of health. In this section, an attempt is made to study residents’ self-perception of their health, respiratory diseases, cardiovascular diseases, and mental illnesses, and there is a sub-section on the level of knowledge and understanding of perceptions of health co-benefits concerning housing conditions in general.
Willingness to undertake energy retrofits. The penultimate section explores the level of willingness to undertake energy retrofits to improve their health, and what factors are the main influences in making such a decision. It includes an open-ended multiple-choice question to express the difficulties in undertaking an energy retrofit.
Socio-demographic conditions. The last section looks at income levels, professions, age ranges, the dwelling tenure type, and a question where residents indicate whether, in the last twelve months, they have had any arrears on their mortgage, rent, or utility bills, to establish whether energy poverty exists.

3.2. Validity and Reliability of the Survey

The validity of the survey is concerned with the accuracy of the questions. This depends on formulating questions that actually measure what they are supposed to measure. Thus, the survey was discussed with various experts in the fields of architecture, energy efficiency, and health. A draft survey was tested on a restricted sample of experts, which had observations up to thirteen times, and was then tested by people with no prior knowledge of architecture (six relevant people chosen) to identify and resolve any complications with technical terms. Reliability refers to the internal consistency of the survey; that is, for questions using the Likert scale, Cronbach’s alpha was used. Questions with multiple choices or closed single choices were discarded. The average test was conducted according to its structural groups where the perception of thermal comfort was 0.741, indicating an acceptable level of reliability, and awareness was 0.928, indicating that the questions are consistent.
On the other hand, points 3.1 and 4.1 are clearly not indicators of a common underlying factor. Alpha and any other consistency approaches are, therefore, inappropriate.

3.3. Population and Sample

The study was carried out in the municipality of Barcelona, Catalonia, in the north-east of Spain, where, according to the National Institute of Statistics (INE in Spanish), there are 671,177 households (population size) [27]. Within this group, there are two types of buildings: single-family housing and multi-family housing. The required sample size, n, was generated as n = z2Npq/e2 (N − 1) z2pq, where n is the sample size sought, N is the size of the research scope = 671,177, z is 1.645 (with a confidence level of 90%) with a margin of error of 7%, and p-q is 50%. The result of the sample size is 138. In this paper, 127 residents agreed to participate in valid surveys. Therefore, given the limitations, the sample is not representative of each district but of the municipality of Barcelona as a whole. The sample was stratified by sex, which was representative of the distributions determined according to the latest statistical census of the city. Eligible respondents were residents for at least one year living in the city who were over the age of 18. Only one eligible member of each household was selected to complete the survey. The sample was compared with the characteristics of the total population, which showed similar distributions across genders (Table 4).
The distribution of the sample to make it as representative as possible was carried out following the socio-professional distribution in Barcelona [28]. On this basis, and based on the hypothesis that the level of health literacy is related to education and income level, neighbourhoods were selected according to the following criteria: (1) neighbourhoods with divergent socio-professional levels; (2) neighbourhoods with the highest number of tourists and rentals (Barrio Gótico, Raval, El Born, La Barceloneta, and Sant Pere) were discarded, as they are in the end of the agglomeration close to the historic centre where the percentage of temporary rentals is very high at 65.10% (Barcelona City Council. Oficina Municipal de Dades. Barcelona 2020 Socio-demographic Survey). Therefore, the distribution of the survey was mainly performed in the following neighbourhoods:
High income: Sarrià and Sant Gervasi;
Medium income: La Sagrera, Sants, and Sant Antoni;
Low income: Trinitat Vella, C. Meridiana, Roquetes, La Verneda and La Pau, and Bèsos.
These neighbourhoods are taken as the starting point; however, because the sample was partly online, the participation of residents in neighbourhoods other than those mentioned above was taken into account to a lesser extent.

3.4. Data Collection

Data were collected with a four-month survey conducted from March to July 2023. Participants were recruited through neighbourhood associations in each neighbourhood and community institution (e.g., civic centres, “Casals”). They responded to the paper through face-to-face interactions. Then, to increase the number of participants, a “snowball sampling” procedure was used. A QR code with the link to the questionnaire was used for people who could not be interviewed face-to-face. Participants were included as long as they were adults and residents of Barcelona municipality for at least one year. They were given 10–15 min to complete the survey anonymously. The questionnaire script was based on the Health Survey of Catalonia (ESCA 2022) (source: Plan estadístico de Cataluña, Departamento de Salud (ESCA)) and the ASHRAE 55 standard that measures the level of comfort in a building. A total of 18 institutions were visited, and a total of 127 residents agreed to participate (valid responses), of which 69% were paper responses through face-to-face interactions and 31% were online responses through the Qualtrics platform (QR codes with their own URLs were distributed through mailboxes or delivered personally to potential participants or through the associations’ websites) (L’associació de veïns i veïnes del barri de Sants. Página web: https://www.centresocialdesants.org/ (accessed on 24 August 2023)).

3.5. Survey Improvement and Respondents Recruiting

Six people were selected for an in-depth questionnaire to determine if there were any specific fields/topics that were not yet covered that were relevant to include in the survey (Table 5). Therefore, these interviews were pilot-tested on the draft survey, where the inputs of the six random individuals without previous expertise were introduced to obtain the final design of the survey. The six people were chosen based on having no prior knowledge of the topic, relationships, or role in their neighbourhood. Thus, three Spanish women (n = 3), two Spanish men (n = 2), and one British nationalised Spaniard (n = 1) were accepted (Table 4). The first part of the interviews was carried out in parks, on the street, and, on a few occasions, in workplaces open to the public (e.g., flower shops), in three neighbourhoods depending on the socio-professional level: high, medium, and low (Ciutat Meridiana, Sant Antoni, and Sant Gervasi). Once we had identified the people and introduced ourselves as researchers, the following open questions were used: Are you a resident of Barcelona municipality for at least one year? Once the interviewee answered positively, we proceeded to carry out the questionnaire. The second part was carried out through the neighbourhood associations (AAVVs in Spanish). Multiple calls were made and e-mails were sent to all associations registered in the Federation of Neighbourhood Associations of Barcelona (favB) (source: FAVB Federación de Asociaciones Vecinales de Barcelona. Available online: https://www.favb.cat/entitats (accessed on 28 September 2023)), and seven AAVVs received a positive response. As expected, the associations with the greatest housing problems and low/middle income were the ones willing to participate. The third part was carried out by means of visits to the “Casals” and “Civic Centres” of certain neighbourhoods, where it was explained that a research project was being carried out, and we asked if we could go to an event or neighbourhood meeting to carry out the questionnaire together with the neighbours who were there.

4. Statistical Analysis

Responses from both paper and online surveys were archived as a dataset in spreadsheet format. Only relevant variables were included for statistical analysis using the statistical package IBM SPSS Statistics version 29. First, all datasets were analysed with descriptive statistics to examine the distribution and identify outliers. Segmented analysis was also employed. Next, inferential statistical analysis was performed to compare variables using logistic regressions and reach a robust conclusion.
In addition, unconditional logistic regression analysis was conducted to assess associations of demographic variables, perceptions (from 1 = strongly disagree to 7 = strongly agree), and practice factors (independent variables) with respondents’ perceptions of health co-benefits related to housing conditions (dependent variable, coded as missing = 0, and presence = 1).

5. Results and Discussion

5.1. Descriptive Analysis

5.1.1. Socio-Demographic Characteristics

Of the total number of participants surveyed, women accounted for 57.5% and men accounted for 42.5%, respectively. In terms of age distribution, the most prevalent group of residents surveyed was the 45–65 age group, specifically 52%, and 26.8% of residents were aged 25–34 and 9.4% were aged 65 and over. The sample covered various educational and occupational levels, with more than half of the respondents (52.0%) claiming to have completed university studies. A total of 26% had a bachelor’s degree or technical studies, 10.2% claimed to have completed primary studies, and 11.8% claimed to have completed secondary studies. In terms of occupation, the most prevalent group (74.0%) is working. This is followed by 14.2% who are retired people (it should be noted that this percentage is higher than the percentage of people over 65 (9.4%) in the survey because Spain has an early retirement system, so it is possible to retire before this age); 7.1% who are unemployed (a figure very similar to the unemployment rate as of July 2023 of 6.92% according to the National Statistics Institute, INE); and 4.7% who do housework, are students, and others.
The average net monthly family income is almost even (29.1%) for the two groups and is between EUR 1001 to 2000 and EUR 2001 to 3500. Likewise, 27.6% made EUR 3500 per month. Only 12.6% do not exceed EUR 1000 per household.
In relation to housing tenure, 66.9% are owners and 30.7% are tenants. Only (2.4%) live in another type of housing tenure, such as, for instance, cession of use. Also, within the “other” group, it should be noted that there were participants who lived in the home of a relative or were young adults who had not yet become independent.
With respect to energy poverty, i.e., households in arrears due to financial difficulties, the question was divided into five groups (Figure 2), where the most prevalent group (7.9%) was utility expenses, specifically gas and electricity (not including property tax nor rubbish collection fee) followed by water (6.3%) (it is worth mentioning that a specific group is taken for water with respect to the others, such as electricity and gas, due to the fact that since 2014, a measure of not cutting off the water supply to any user was approved). Interestingly, the groups of mortgage loans and deferred purchases or other loans are evenly matched, with 3.9% being overdue one or more times. Although rent arrears only account for 3.1%, this relatively low percentage can be explained by the fact that arrears can lead to an eviction claim or interest generated by late payment.

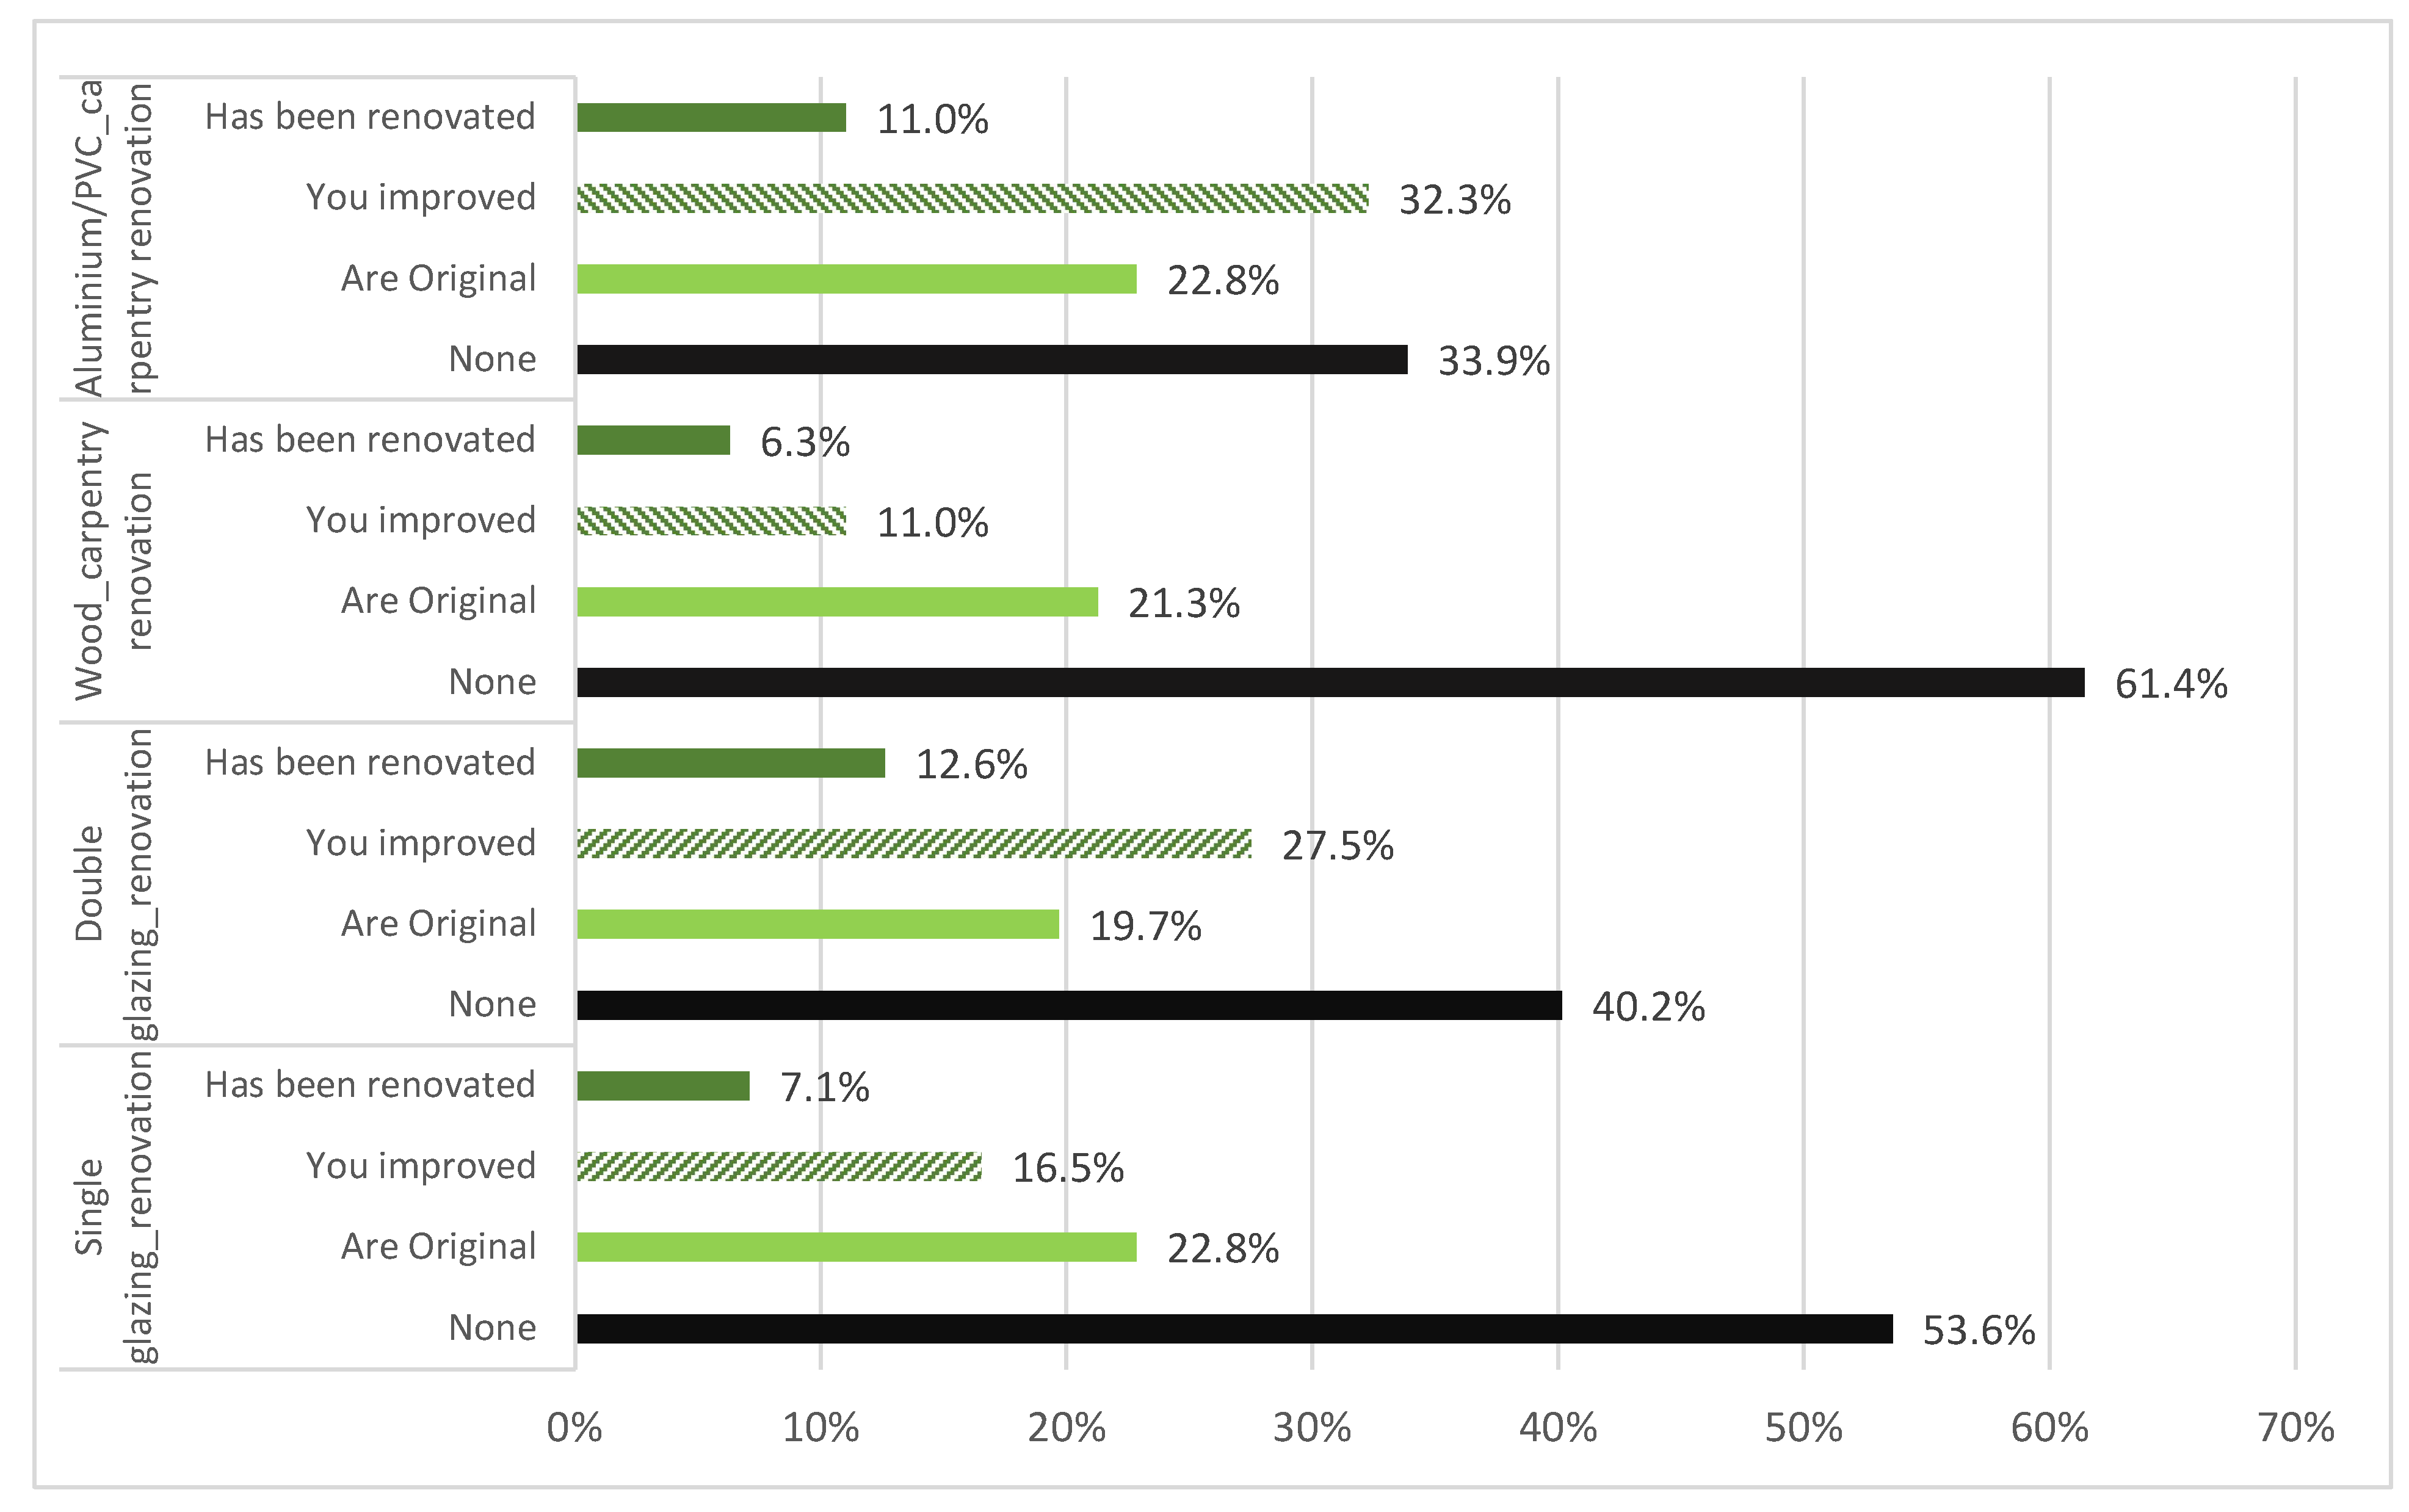
5.1.2. Housing Conditions and Attributes

By analysing the profile of housing conditions and attributes, it is observed that the predominant typology in Barcelona is the multi-family dwelling (83.5%), as opposed to the single-family dwelling with only 16.5%. In addition, in multi-family dwellings, which encompasses different types of floors, almost a third of respondents live on intermediate floors of the building (73.11%), with 14.29% in attics, 7.56% on the ground floor, and 5.04% in mezzanines. It is important to typify these types of floors because the scope of the study will focus exclusively on the exterior facades, which will be seen in the impact of the energy efficiency of the exterior walls and windows and whether or not they have good thermal insulation.
Regarding the orientation of the main façade of the dwelling, 54.3% of apartments face south and west, which is a convenient configuration for sun exposure during winter, although it may represent overheating during summer.
Regarding the period of construction, most of the dwellings (68.5%) were built before 1979, when the first Spanish construction code included minimum insulation requirements for buildings so that if they have not been retrofitted; they are in a state of “energy ruin”. On the one hand, it can be seen that 18.1% of apartments were built in the period from 1980 to 2007 when the technical code was (including more restrictive thermal insulation) put into effect. On the other hand, only 9.4% of apartments were built after 2007, which took into account the energy-saving criteria of the newest construction code.
The group of the renovation of external windows in Figure 3 encompasses different types of materials: joinery (aluminium or PVC, wood), types of glazing (single and double glazing), and the type of renovation used (original, renovated by the owner himself or renovated by the previous owner).
Sorting by material, it can be seen that the two largest groups are “aluminium joinery” (66.1%) and “double glazing” (59.8%), followed by “wooden joinery” (38.6%) and “single glazing” (46.5%), respectively.
As can be seen, the sum of the glazing typology and the joinery make up more than one hundred percent. This is because some residents claimed to have more than one type of glazing or joinery on the main external façade.

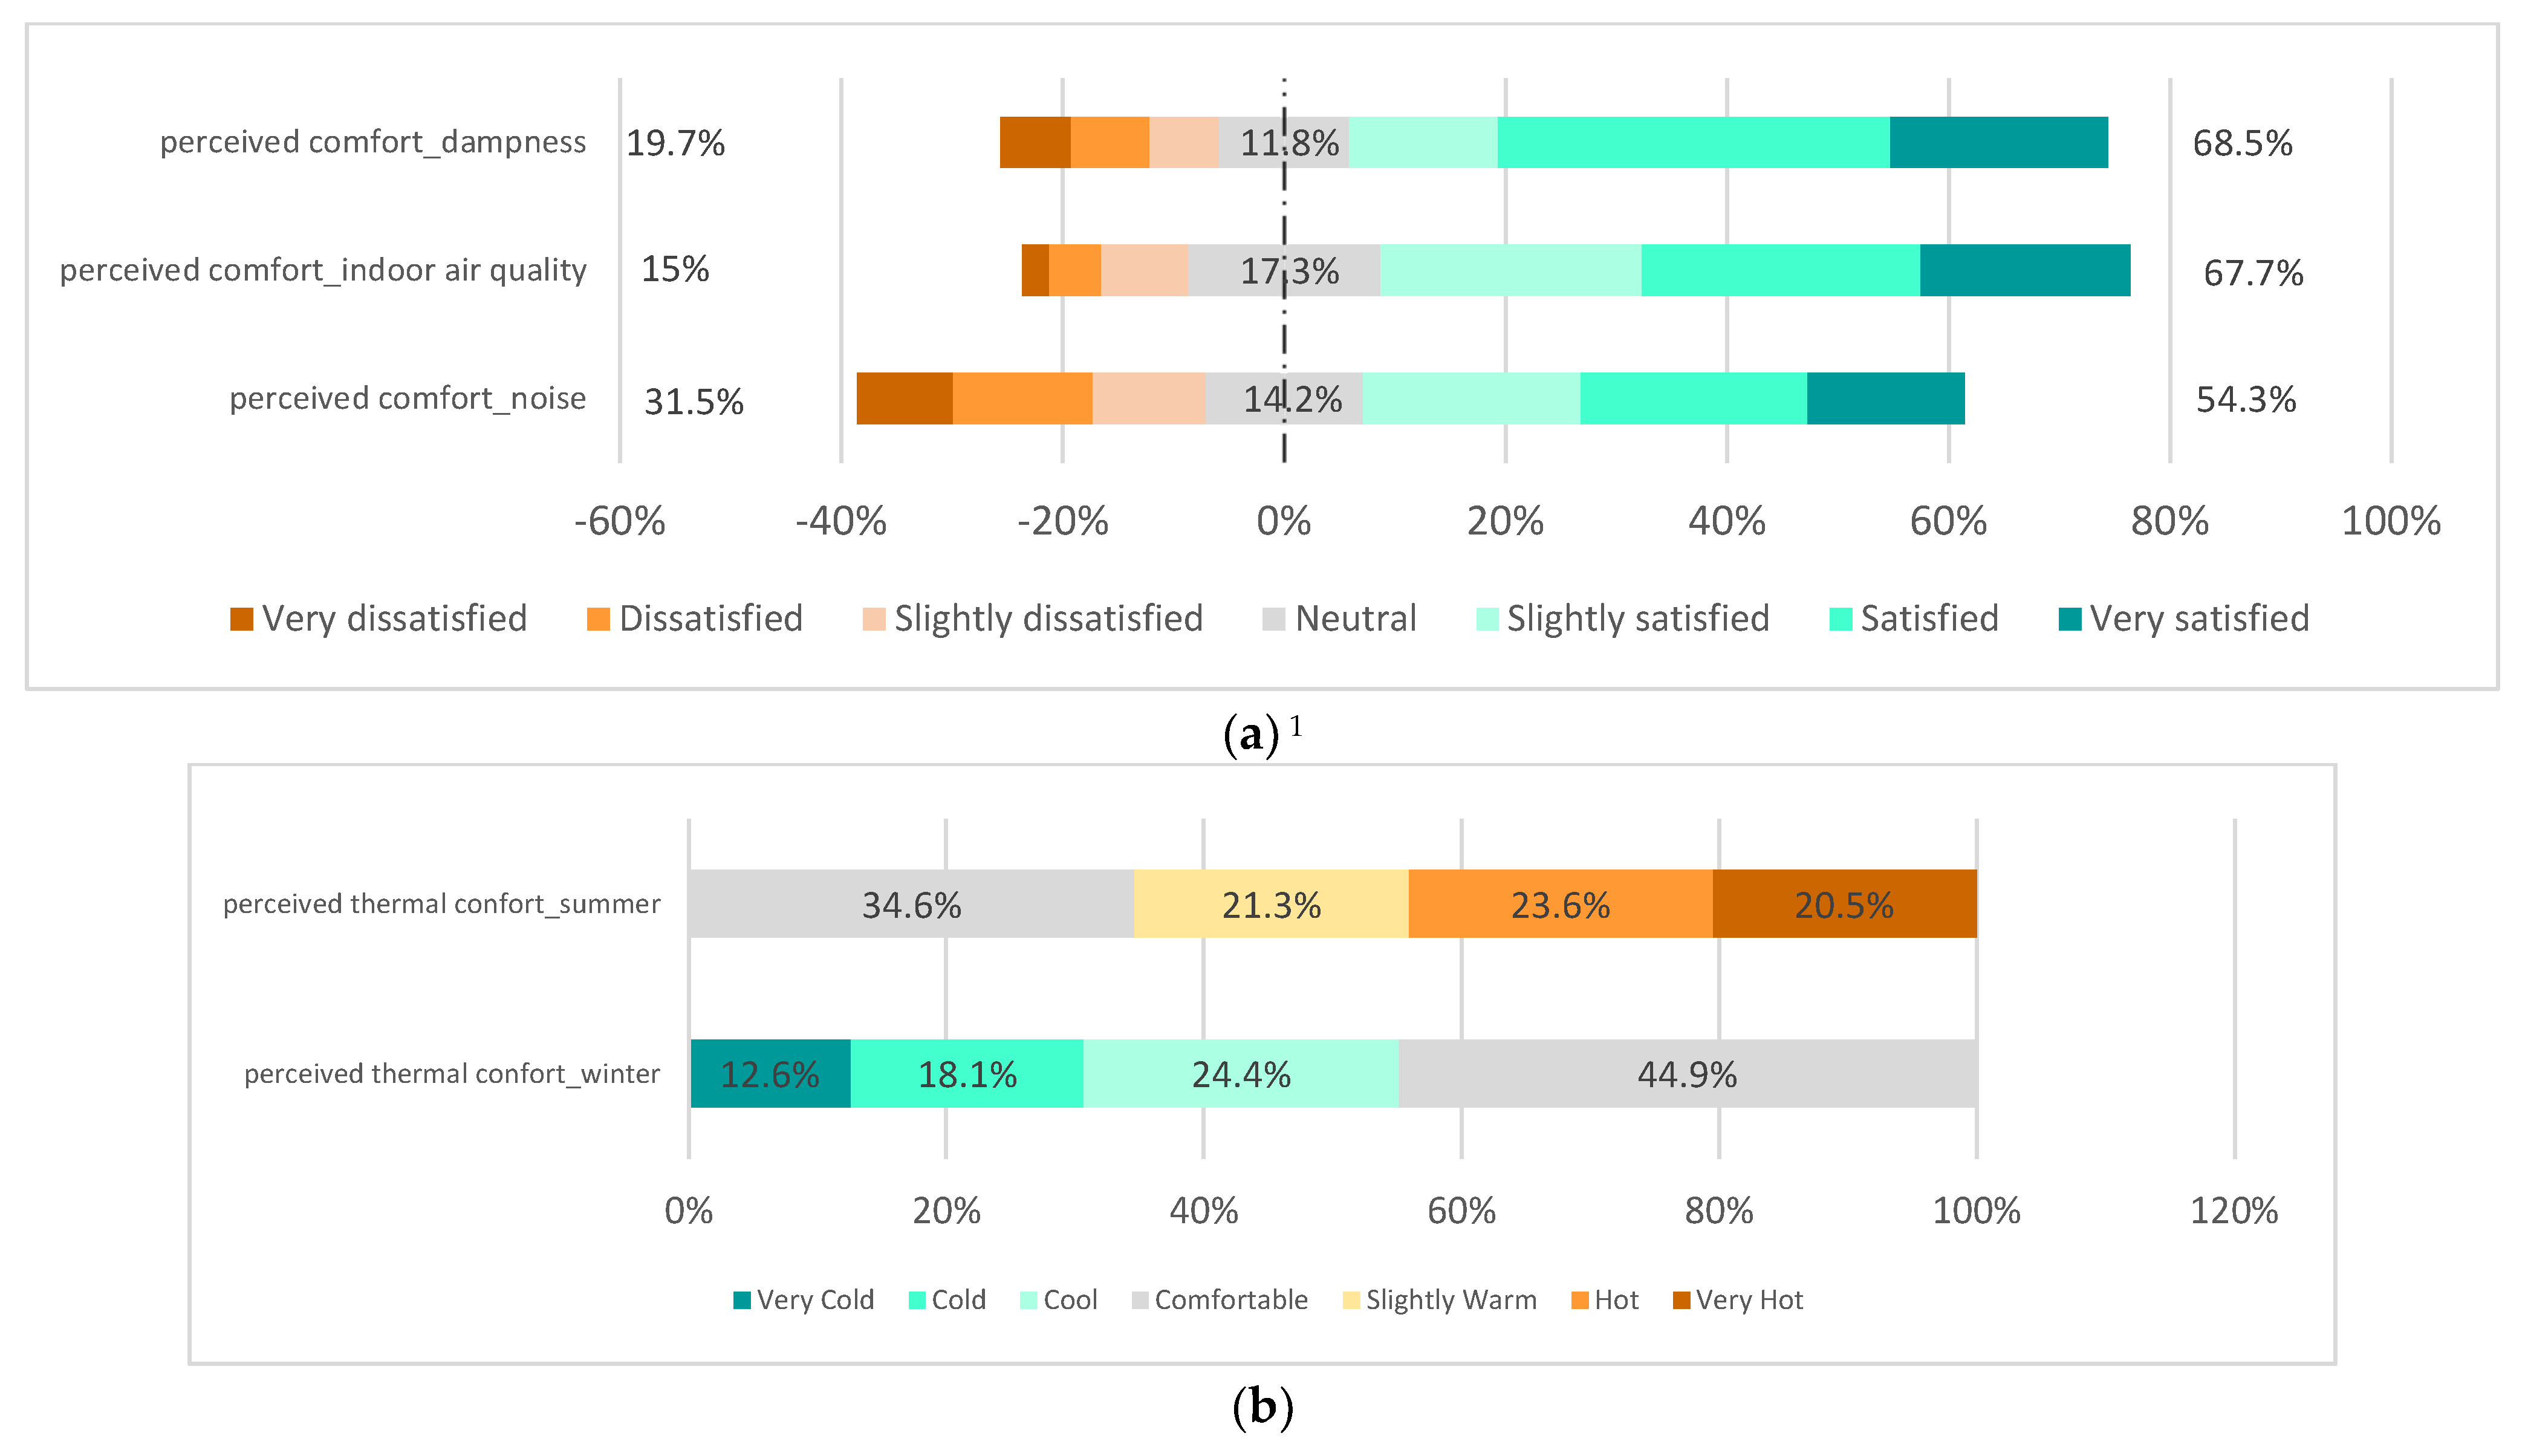
5.1.3. Perception of Indoor Comfort Conditions

Residents’ perception of their homes is based on the context of the climatic conditions of Barcelona municipality, which has a “warm subtropical Mediterranean/dry summer” climate in the Köppen–Geiger climate classification.
Figure 4a shows the perception of indoor comfort conditions in the dwelling. In the first quadrant, the clear climatic factor of environmental quality focuses on satisfaction with the indoor air level, outdoor noise from the street, dampness, and leaks.
The responses were summarised by counting the number of responses to each question at each of the defined scale levels to provide a graphical summary of the results (Figure 4a). Approximately one-third (31.5%) reported that they are not satisfied with the external street noise, and this paper only focuses on the comprehensive renovation of the external walls and windows (see limitations).
Regarding dampness and leaks, 19.7% indicated that they are dissatisfied and that there is some kind of leakage. For example, the lack of adequate water tightness causes the water that infiltrates the interior through filtration to peel off the walls and produce saltpetre stains and mould.
Similarly, 15% said they are dissatisfied with the indoor air quality in their home, but this should be taken with caution, as many elements are undetectable to smell and micro-organisms present in indoor air (see limitations).
Figure 4b shows the perceived thermal comfort. In one corner, the perceived thermal comfort in summer is shown, and in the other corner, the perceived thermal comfort in winter is shown. Knowing that heating and cooling systems are used to counteract construction deficiencies and acclimatise the dwelling, in the questions related to thermal comfort, it was explained that they should indicate their level of perception in summer/winter without considering the heating or cooling systems to be on.
It is worth noting that approximately two-thirds (65.4%) stated that they perceive thermal discomfort in summer, as opposed to winter (55.1%). This finding is interesting since due to climate change, summers have increased their length and have several heat waves. In addition, the period of the questionnaire (from the end of winter to mid-summer) could significantly influence the answers.

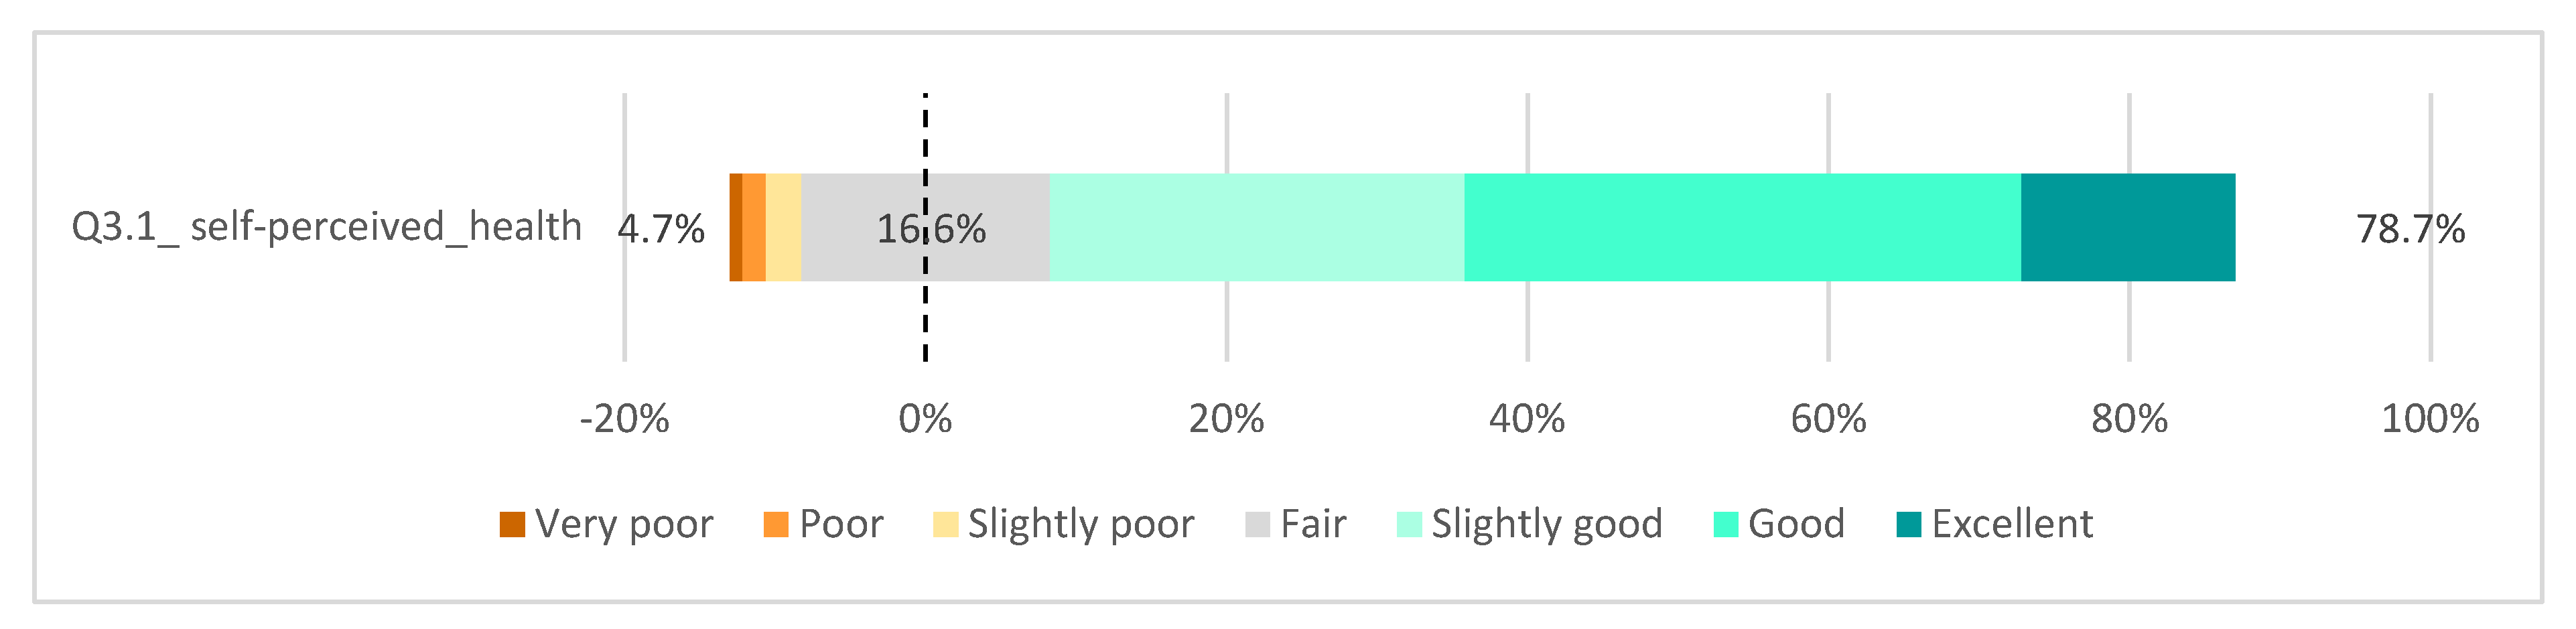
5.1.4. Self-Perception of Health

According to Figure 5, participants were asked about their self-perceived health. The majority (78.7%) reported that they are in good health, as opposed to 4.7% who said that their overall health is poor.
It should be noted that the format used may have biased some sensitive questions, such as the self-perception of health (see limitations). Therefore, one of the advantages of using both methods (face-to-face and online surveys) is that one neutralises the other, i.e., when respondents answered online, due to the anonymity, they felt freer to answer, as some diseases are still considered taboo and they prefer not to disclose them face-to-face.
However, when asked if they had had any cardiovascular disease, 78.7% said they had no disease, in contrast to 15.7% who had high blood pressure, 2.4% who had myocardial infarction, and 3.1% who had other ailments. It is worth noting that other cardiovascular diseases include arrhythmia, etc.
Regarding respiratory diseases 80.3% of respondents reported that they do not have any disease. On the other hand, within the 19.7% who have a respiratory disease, there is a tie with (8.7%) those who stated that they have chronic allergy and asthma or chronic bronchitis. On the other hand, and to a lesser extent, 0.8% have Chronic Obstructive Pulmonary Disease (COPD), and 1.6% have other diseases, including, for example, cancer.

5.1.5. Awareness of the Health Co-Benefits of Housing Conditions

Figure 6 summarises respondents’ perceptions of health co-benefits about building quality in different health sectors: general health, cardio-respiratory diseases, and mental illness. In general, residents showed levels of agreement, but with some degree of confusion. For example, with the statement “Housing conditions (meaning the architectural-constructive quality of housing) have an impact on your health”, two-thirds (66.9%) of the participants agreed, but 26% disagreed, which is a significant percentage.
In reference to the level of agreement with the statement “Housing conditions, in general, have an impact on the fact that I may suffer from some mental illnesses (depression, anxiety, nervousness, etc.)”, about one-third (32.3%) disagreed, which was the highest percentage among the three aspects studied.
In the group of cardio-respiratory diseases with the statement “Housing conditions in general impact on the fact that I may suffer from some cardio-respiratory diseases, premature death, etc..”, 28.3% indicated that they disagreed with this statement, while 11% said they were neutral.

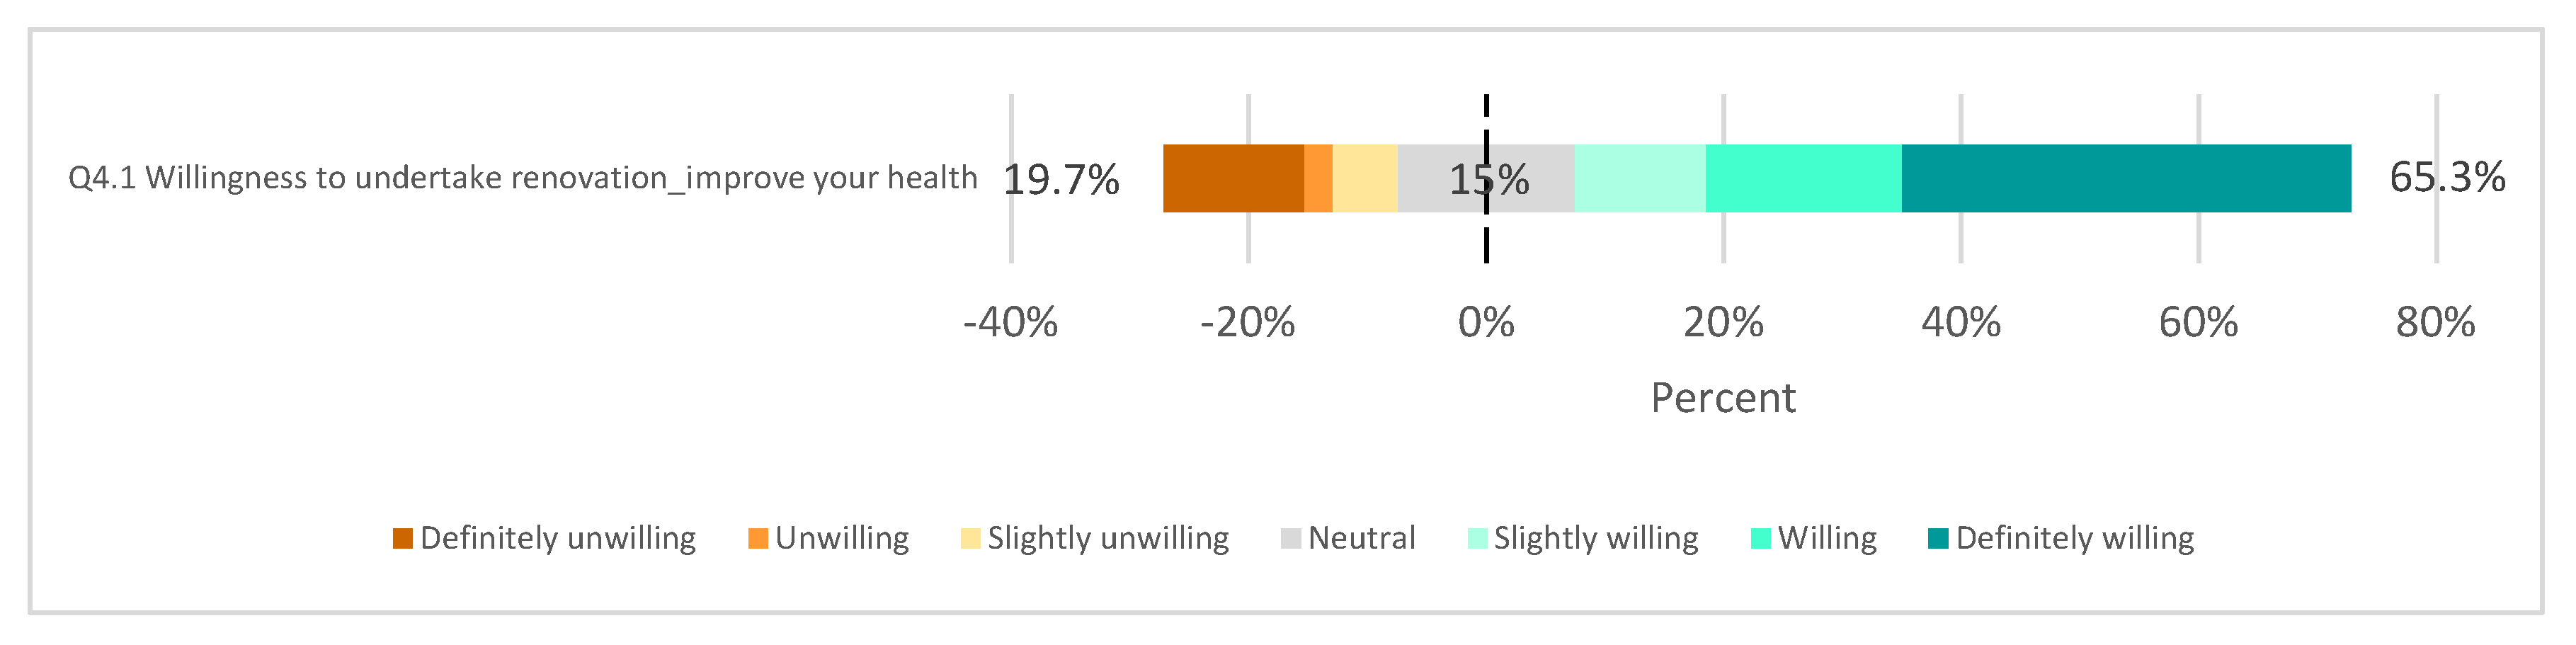
5.1.6. Willingness to Undertake an Energy Retrofit

With regard to the question, “How willing are you to undertake energy retrofits of your home in order to improve your health?” Residents showed interest, and 65.4% agreed to undertake energy retrofits, leaving the economic issue aside; however, 19.7% indicated that they were unwilling to undertake energy retrofits because their house is new or was recently retrofitted, and 15% were neutral (Figure 7).
Regarding, the question “In the case that you were willing to carry out an energy retrofit, which of the following factors are the main ones that influence your decision?” six statements were given: “Increasing the value of the dwelling, environmental protection, reducing the energy bill, improving my health, improving in thermal comfort and all the above”. Almost one-third of respondents (32.3%) selected all of the above options. If we disaggregate further, in second place, as expected, is the economic factor (25.2%). Respondents indicated that they would retrofit their homes if it reduced energy costs, while relatively few (18.9%) admitted that they would like improvements in thermal comfort and environmental protection (8.7%), and improving their health was in last place (6.3%). Therefore, although most people are aware of the co-benefits (such as thermal comfort and health), it seems that the economy still takes prominence when undertaking retrofitting. The health co-benefits are not an influencing factor that impacts residents’ decision-making to undertake an energy retrofit.
Regarding the barriers to carrying out an energy retrofit, the largest problem is the “lack of financial aid or subsidies” (45.7% of the total), followed by 13.4% who “live in rented accommodation” and would not be interested in retrofitting because they feel they are in a temporary space. Finally, 11.8% stated “recovering the investment in the long term” and “lack of information on subsidies”.

5.2. Segmented Analysis

-
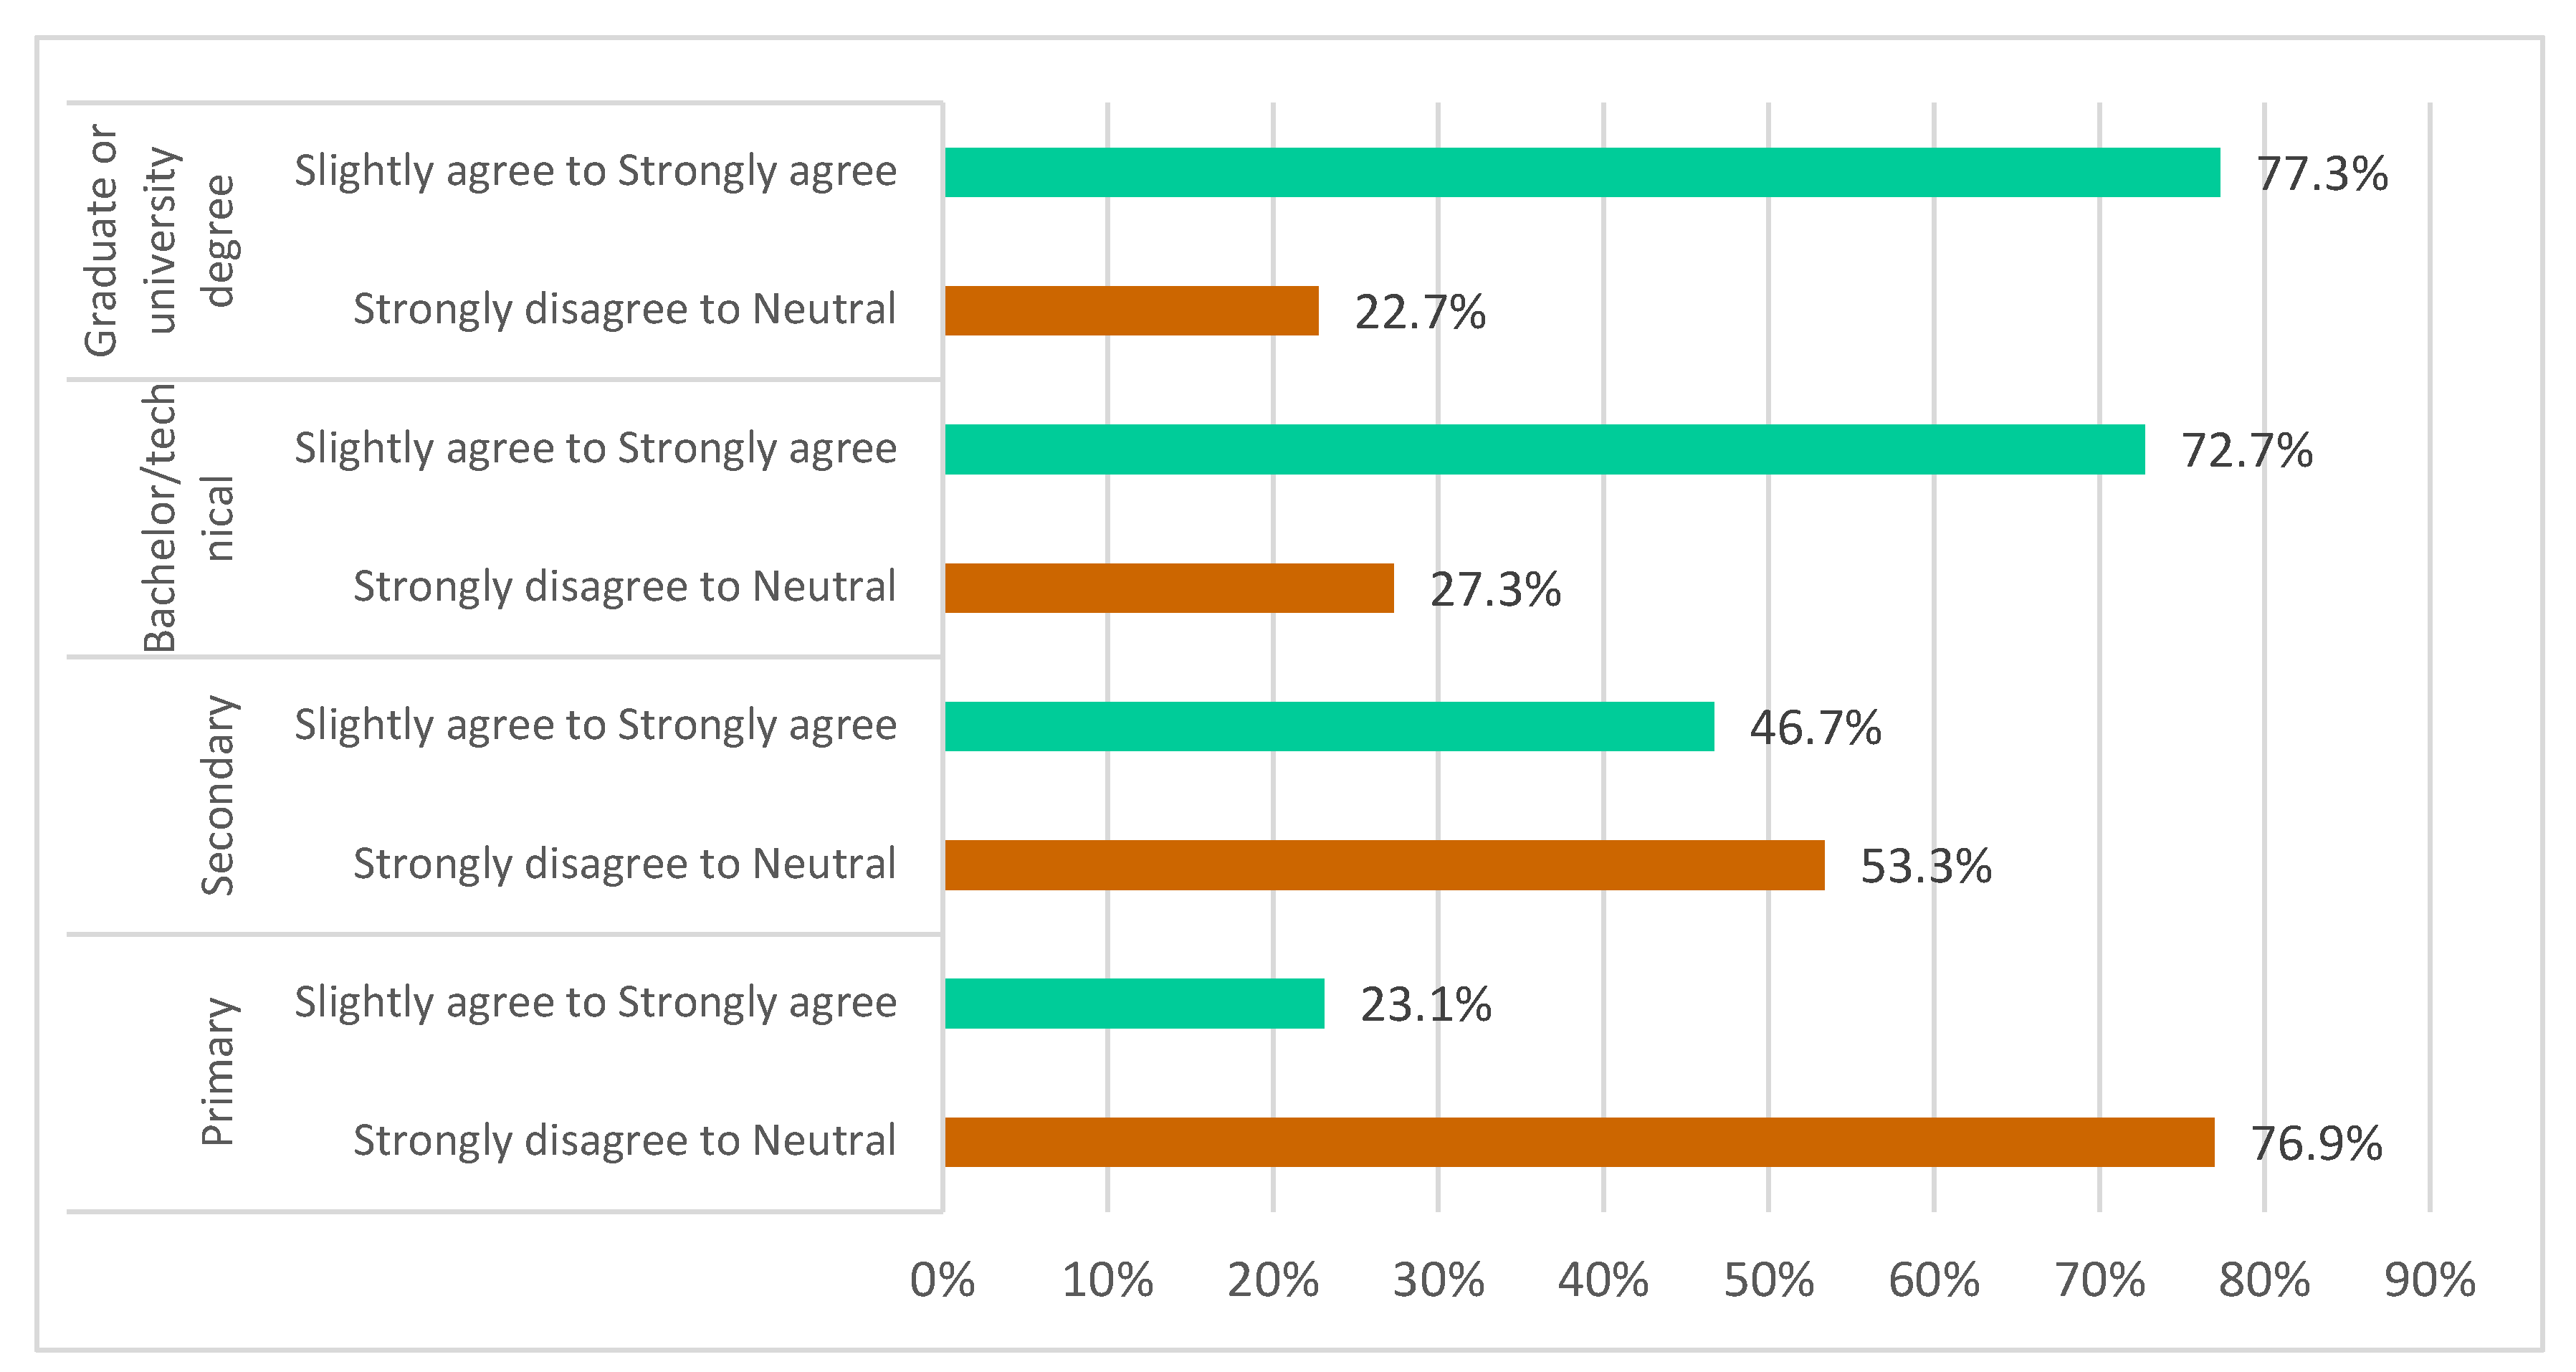
Relationship between awareness of health co-benefits and educational attainment
Segmented analyses were conducted first to examine the associations between each independent variable (socio-demographic) and the dependent variable (participants’ perceptions of health co-benefits). Due to the number of samples and for the sake of a quick understanding, the Likert scales of the variables are re-escalated into two groups: the first group (strongly disagree to neutral) and the second (slightly agree to strongly agree).
Looking at the results, there is a clear trend towards a lack of knowledge that “housing conditions impact on health”, with more than three-quarters (76.9%) of residents with primary education and more than half (53.3%) with secondary education. Such a lack of awareness decreases significantly among respondents holding technical studies and postgraduate or university degrees (22.7%) (Figure 8).
-
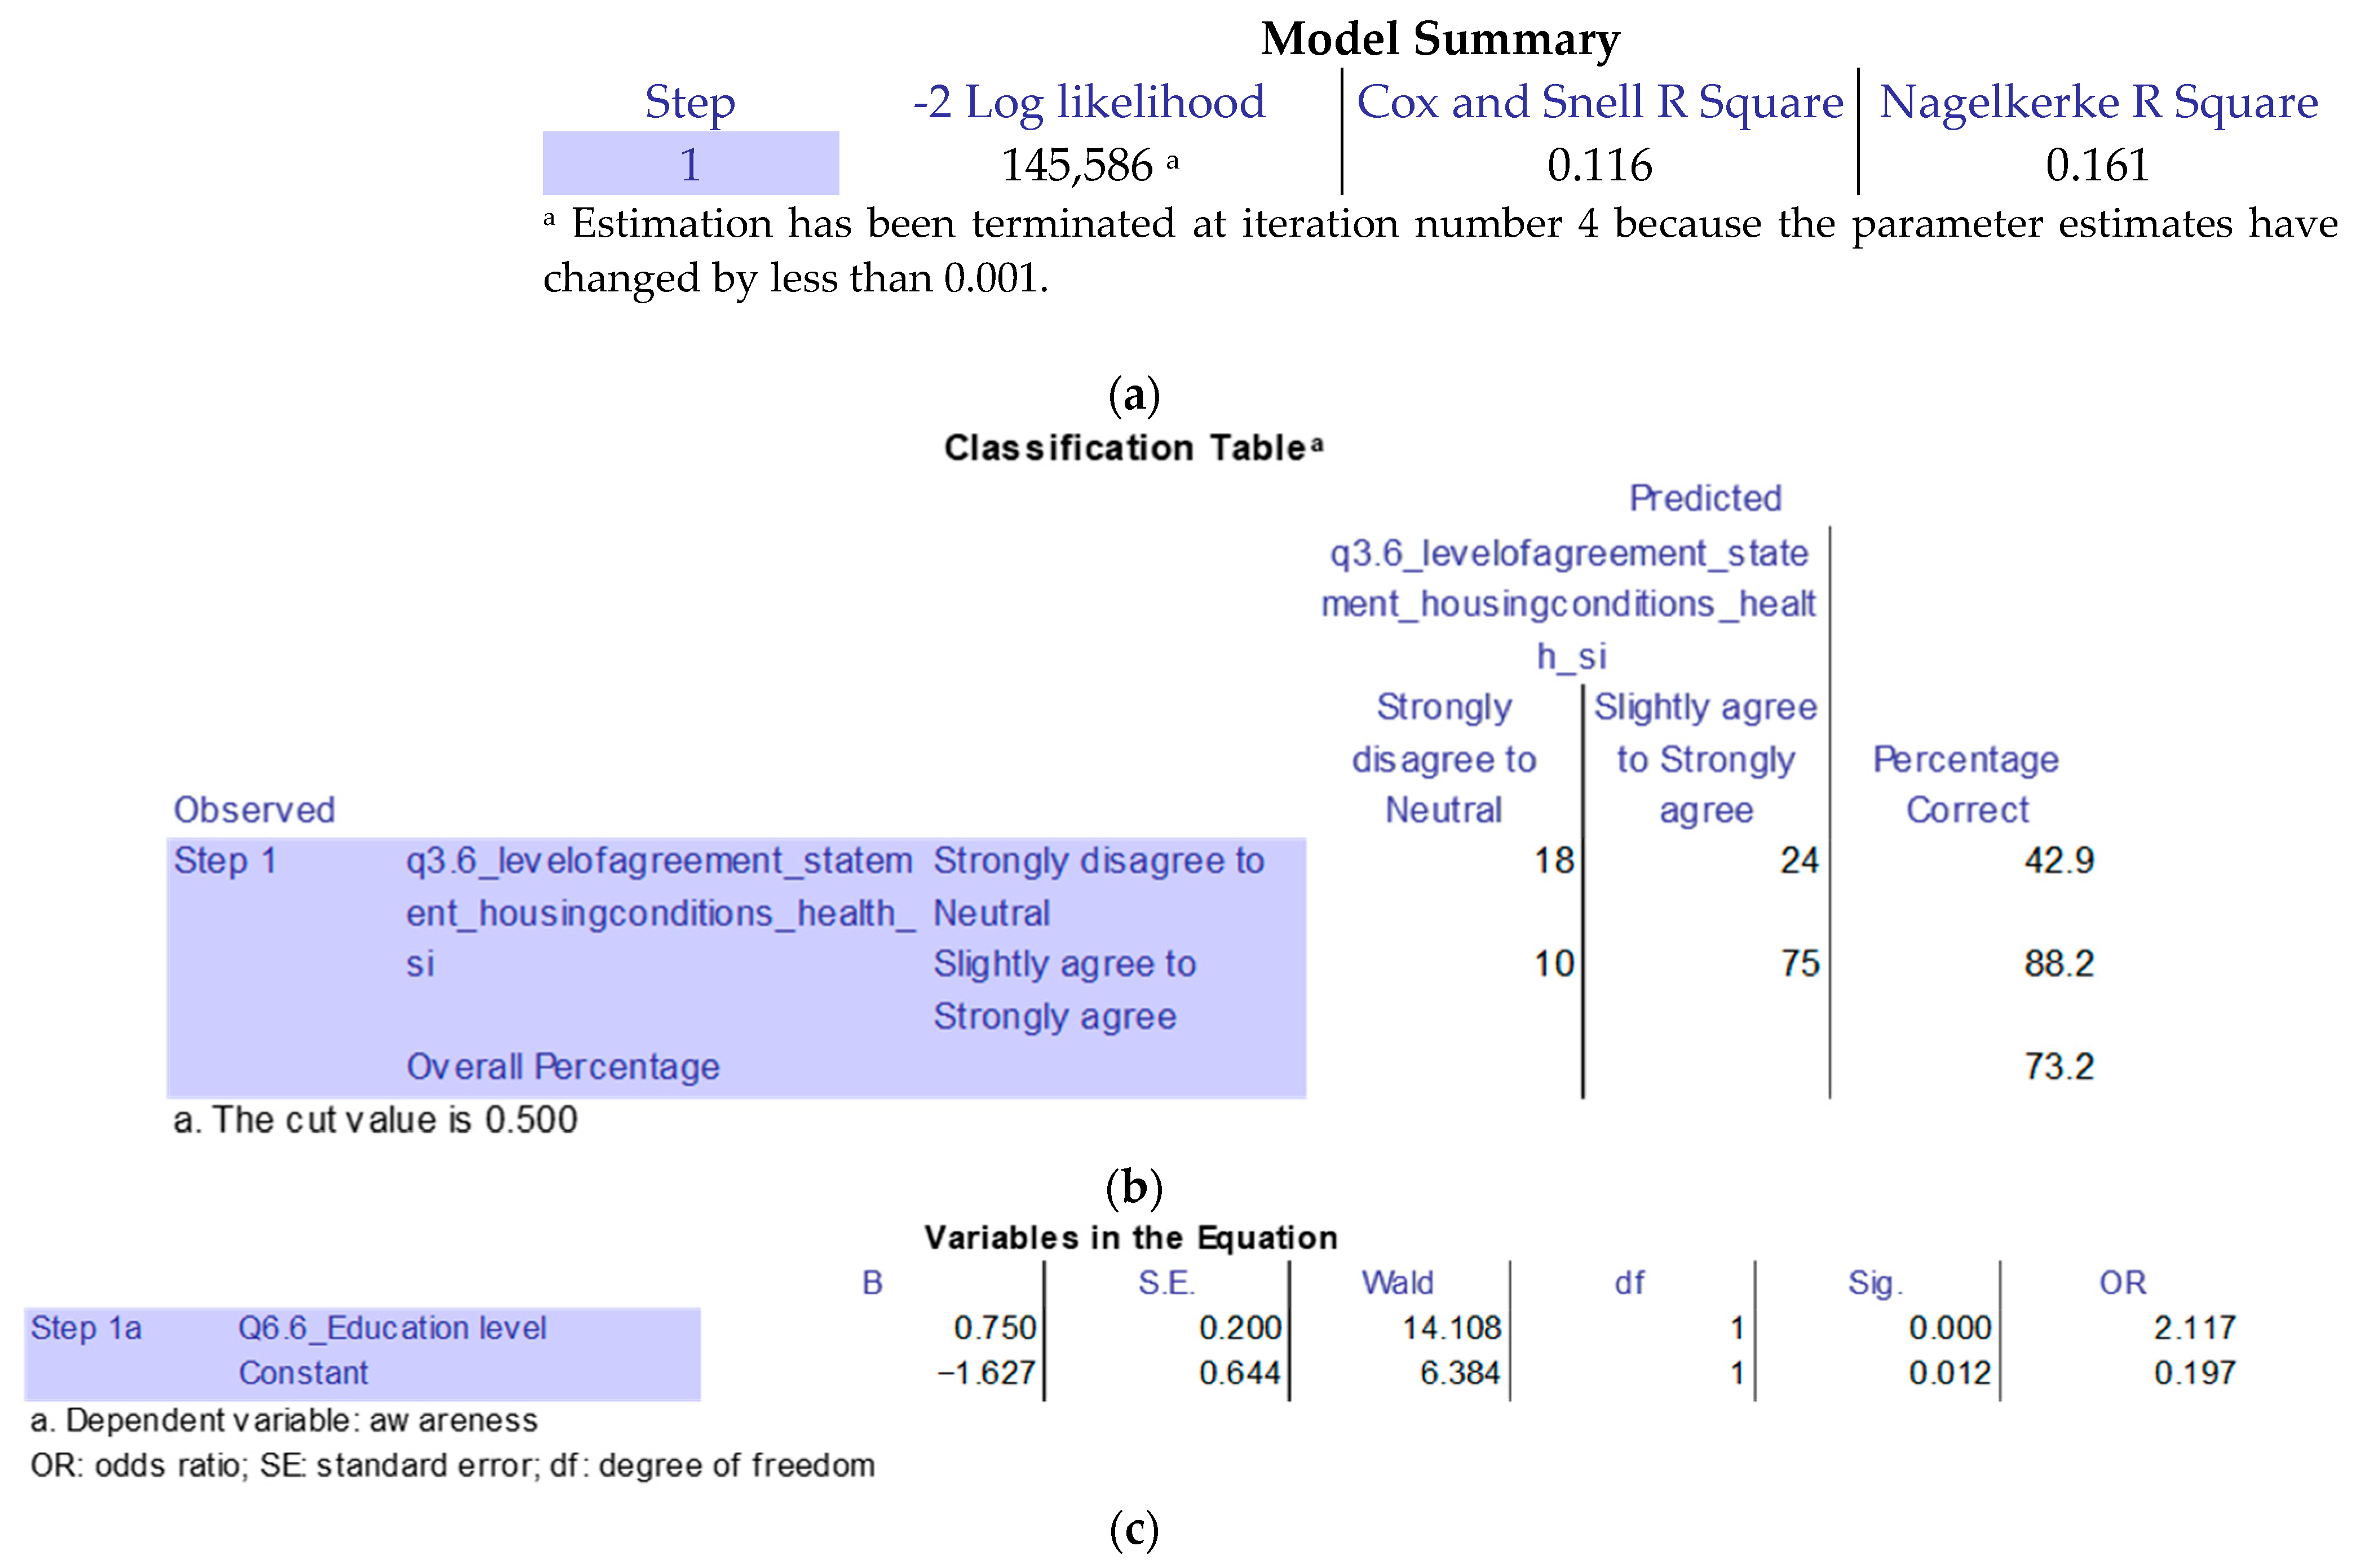
Explanatory model for awareness
The correlation between awareness of the effect of housing conditions on health and educational attainment is studied using a set of bivariate regressions. For this purpose, other control variables of socio-demographic factors, such as “Age”, “Gender”, “Family monthly average income”, and “Neighbourhoods”, have been controlled, but none of them turned out to be statistically significant, possibly because of the modest sample size. As seen in Figure 9, according to the results, the model is able to explain the awareness of the participants by 12%.
The model educational attainment is significant at almost 99% (OR = 2.11; 95% CI: 0.99). +Education = +Awareness.
-
Relationship between respiratory diseases and dampness
In this analysis, respiratory diseases are the dependent variable and dampness is the independent variable. For this purpose, dummy variables have been established, i.e., whether people perceive that they have respiratory diseases (asthma, bronchitis, chronic allergy, etc., and a value of 1 is adopted) or do not have respiratory diseases (a value of 0 is adopted). Furthermore, perceived dampness used a Likert scale where 1 is very dissatisfied with dampness and 7 is very satisfied.
According to Figure 10, the results show that perceived dampness is significant and correlates negatively with respiratory diseases, i.e., the more dissatisfied with perceived dampness the participants are, the higher the significance of having respiratory diseases. However, it is rather weak (R2 0.05). By contrast, other control variables such as education, family income, and age have been used; however, they have not entered the model, as they appeared statistically non-significant.
For this model, indoor air quality has been discarded, as there was multicollinearity between the former and the dampness variable. The Pearson correlation method (0.575), therefore, confirms the correlation between these two variables.
+Dissatisfaction Dampness = +Respiratory Illnesses.
-
Relationship between willingness to undertake energy retrofits and housing conditions
For this purpose, we used the control of the factors or attributes of the dwelling, including “heating”, “A/C”, “external walls insulation”, “external windows insulation”, “façade main orientation”, “year of construction”, and “type of dwelling”, and socio-economic variables, including “Age”, “Regimen”, “Education level”, “gender”, and “family average income”, and dummy variables by neighbourhood (high, medium, and low income) were also controlled.
The dummy variable for the neighbourhood was recategorised into three categories (a high-income neighbourhood with a value of 1 and other neighbourhoods with a value of 0); (a medium-income neighbourhood with a value of 1 and other neighbourhoods with a value of 0); (a low-income neighbourhood with a value of 1 and other neighbourhoods with a value of 0). Then, dummy variables were established to examine the dependent variable, i.e., the answers obtained by the Likert scale were grouped with values from 1 to 7, where if you are more willing to undertake a reform to improve your health, a value of 1 is adopted, or if you are less willing to undertake a reform to improve your health, a value of 0 is adopted. According to the results (R2 0.047), (Figure 11) the model shows that it is able to explain the willingness to undertake energy retrofits of the participants by only 5%.
According to the housing conditions, the insulation of exterior windows is significant in 99% of cases, i.e., residents who have no or little insulation in exterior windows are more willing to renovate. Furthermore, in the second step, it is noted that the insulation of external walls influences the model with the expected negative sign. Consequently, the more exterior wall insulation, the lower the probability of undertaking energy retrofits.
−External Windows Insulation = +Willingness to Undertake a Retrofit.
−External Walls Insulation= +Willingness to Undertake a Retrofit.
-
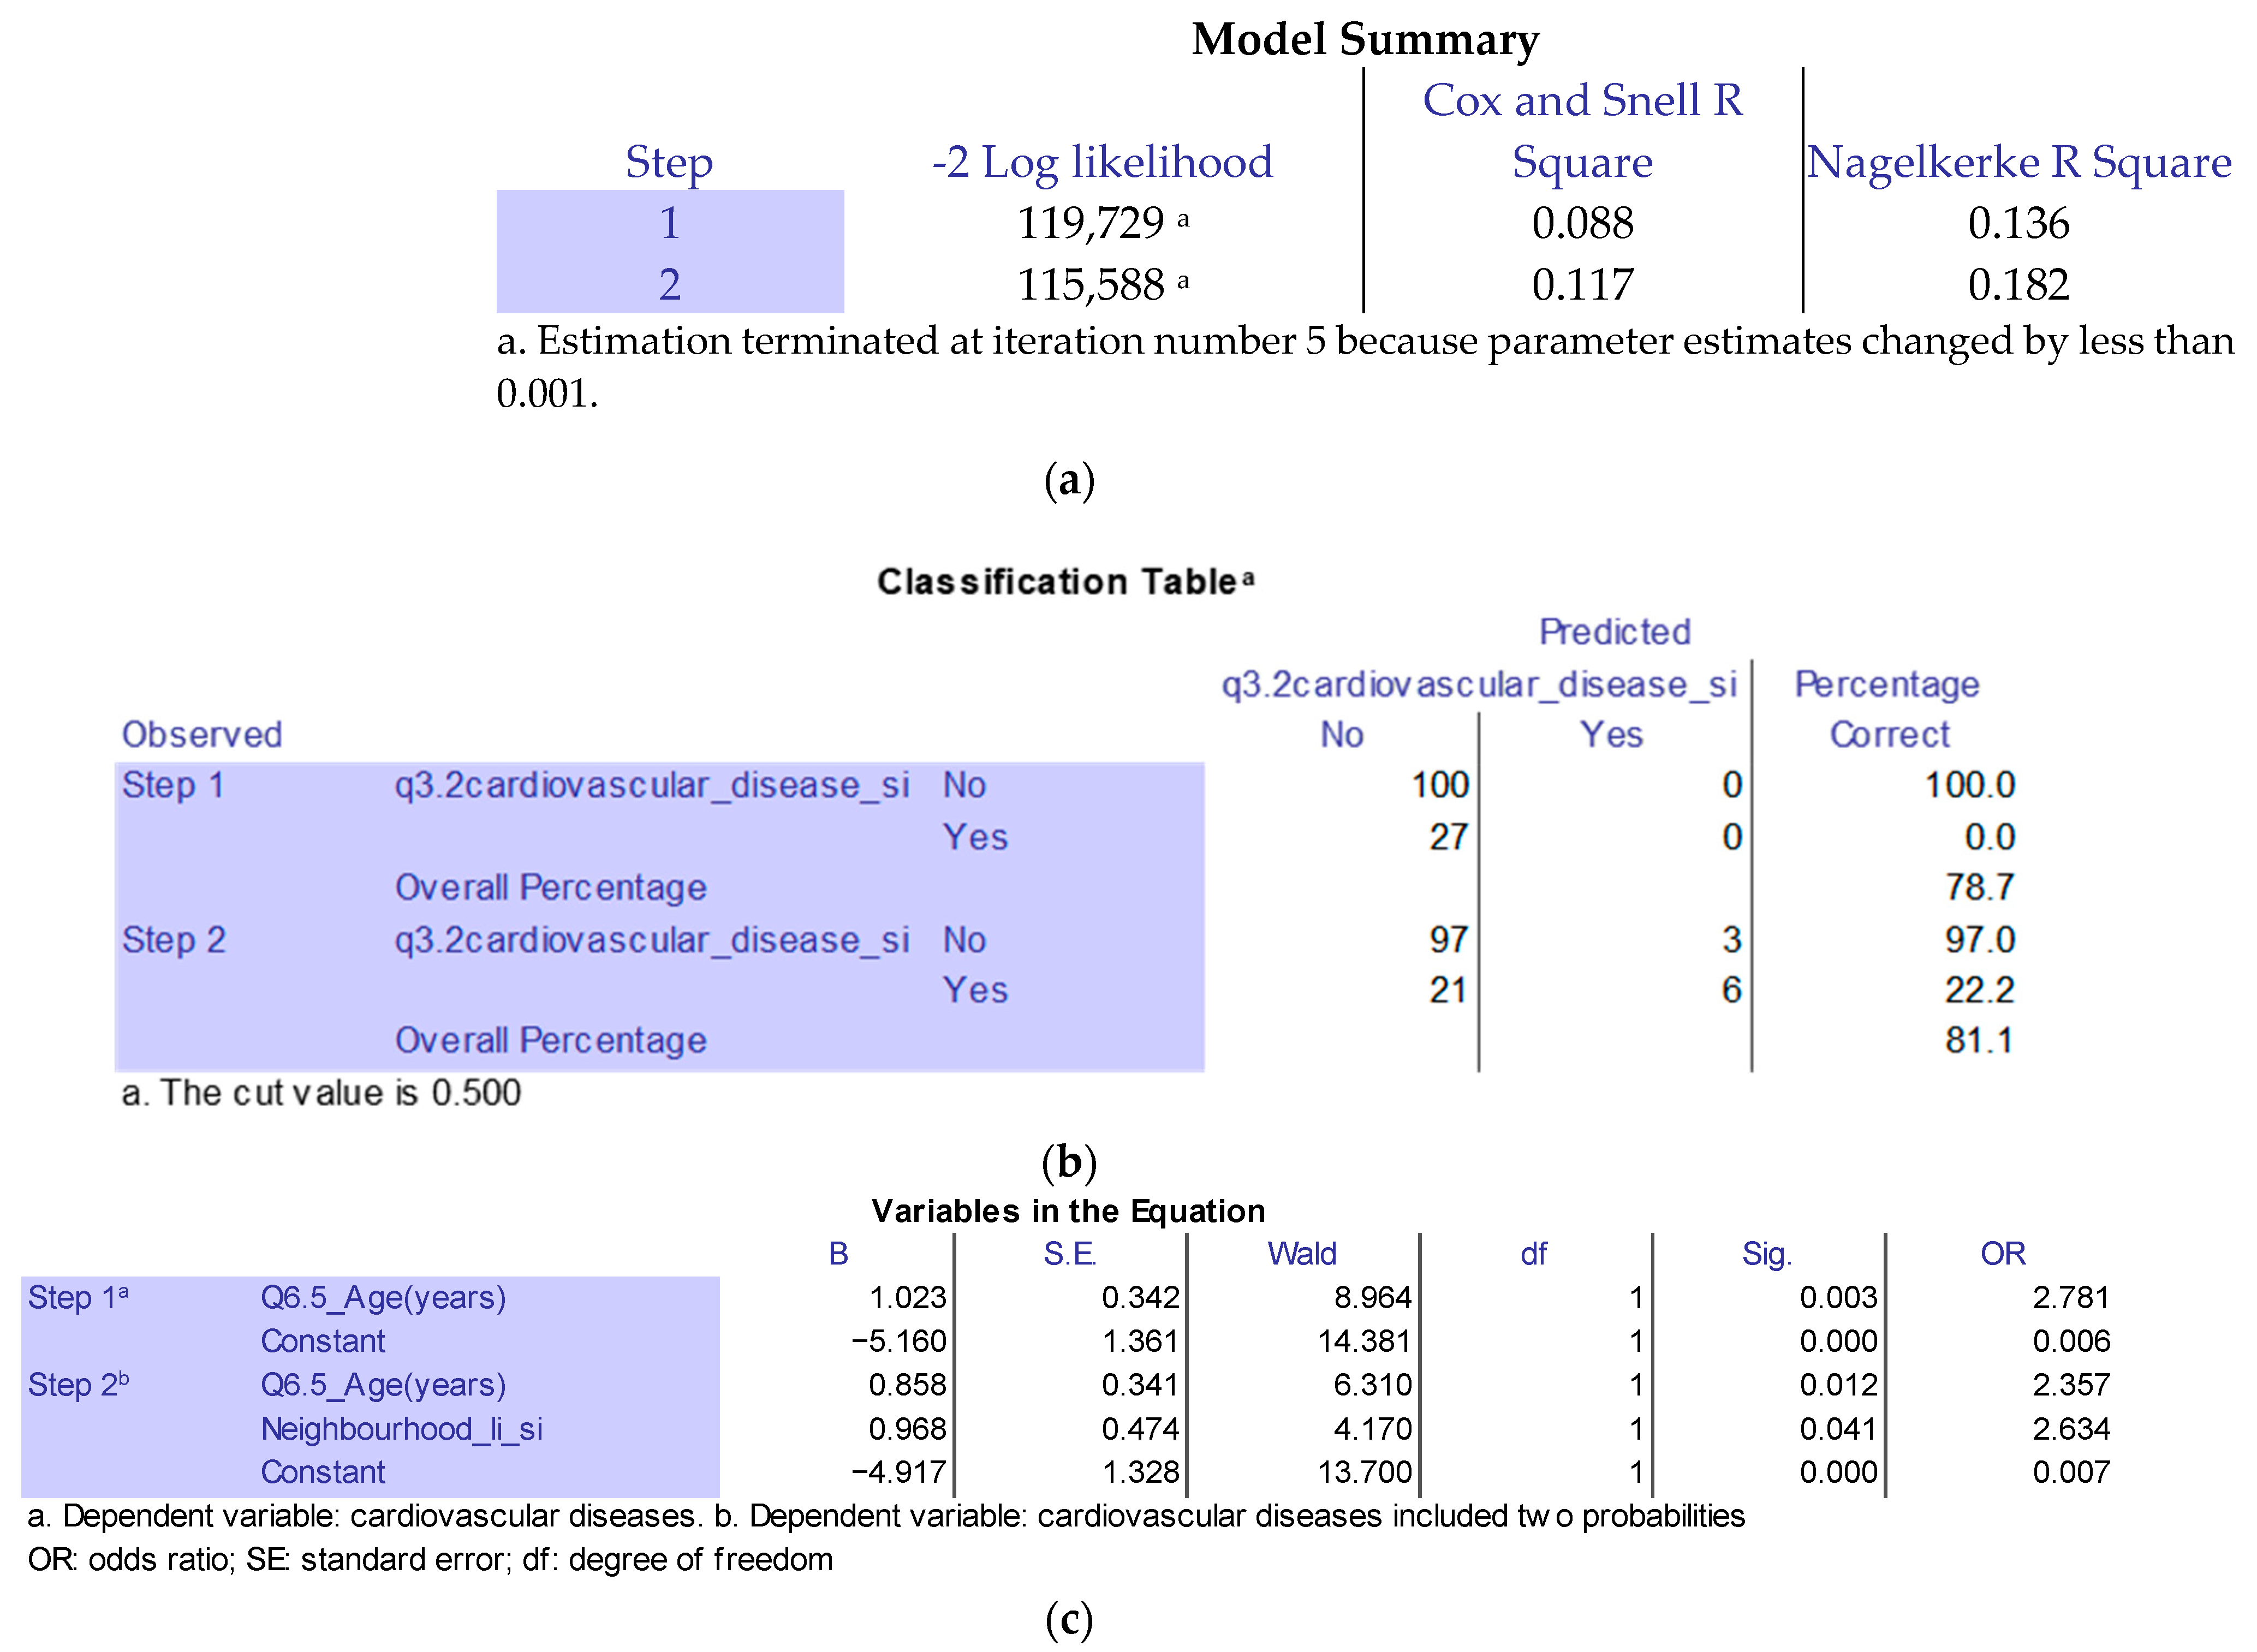
Relationship between cardiovascular diseases and neighbourhood (income)
Cardiovascular disease was also studied as a predictor variable, where it was coded as 0 = does not have cardiovascular disease or 1 = does have cardiovascular disease.
Figure 12 shows the results are interesting because they highlight two aspects. First, age is significant at 99%, i.e., the higher the age, the higher the probability of cardiovascular disease. Second, the low-income neighbourhood is significant at 96%, meaning that neighbourhoods with lower economic capacity have a higher probability of cardiovascular disease. The model has an R2 of 0.117.
+Age = +Cardiovascular Disease.
Low-income Neighbourhood = +Cardiovascular Disease.

6. Conclusions

The assessment of the perception of health co-benefits in energy retrofitting yields several conclusions that shed light on the insufficiency of the existing knowledge. The awareness of the health co-benefits of housing conditions does not significantly influence residents’ decision-making to undertake retrofitting. Only 6.3% of the participants listed health improvements as an influencing factor when asked about their willingness to do an energy retrofitting. It seems that economic factors influence the decision-making process much more than health co-benefits, with 25.2% of the participants listing the economic aspect as an influencing factor, as presented in Section 5.1.6. However, when viewed as a whole, including other factors, health co-benefits associated with efficient homes would have a positive impact on willingness to undertake energy retrofits. Secondly, it is noted that people feel more uncomfortable in summer (65.4% of surveyed households) (Figure 4b) than in winter, which corroborates with what is currently happening primarily because of climate change, which has driven longer and hotter summers [29]. Thirdly, the level of education attainment of the participants played a statistically significant role in their awareness of the relationship between housing conditions and the residents’ health. Higher levels of education were associated with greater awareness (OR = 2.11, 95% CI, Sig. 99%).
Based on the findings of this study, it is clear that neighbourhoods with lower income levels are those with greater comfort deficits, which could have a greater impact on cardio-respiratory diseases. Public health awareness campaigns are extremely important to raise awareness of health co-benefits related to housing conditions and should be targeted primarily at these lower-income neighbourhoods.

Discussion, Limitations of the Study, and Future Research

The findings of this research have brought to light valuable information on the impact that the resident’s awareness of the relationship between health and housing conditions has on the resident’s willingness to undertake energy retrofits. Firstly, the perception of satisfaction with indoor environmental quality (IEQ) can be further developed by covering other environmental aspects, such as visual comfort, with factors such as the amount of daylight reaching the dwelling and the impact that this has on the perception of health. Secondly, with regard to future studies in housing retrofits, it would be important to explore the difficulties of reaching an integrated management or consensus for a retrofit among the owners of the same residential building. This kind of detailed knowledge would allow better public policies to be directed to enable more efficient energy retrofits. Additionally, it is important to mention that the focus of this study was on the possible renovation of the insulation of windows and external walls, covering only part of the housing attributes. There are still various aspects that affect occupant comfort, such as solar radiation and adequate shading in the apartment. Future research can contribute to developing various strategies to assess the perception of indoor comfort.
The present article has some limitations that should be acknowledged. First, the 127 surveys conducted in this study are not enough to draw clear conclusions on each district separately but rather to offer an understanding of the residents’ willingness to undertake retrofits based on their perception of their health in the general scope of the whole municipality of Barcelona. Further, limitations of the present study are the absence of lighting issues and the absence of objective measurements because of the assessment of thermal comfort satisfaction using subjective judgment scales based on their perceptions. Another limitation of the research on indoor comfort regarding the perception of noise is that the noise coming from neighbouring apartments, the interior courtyards, or the apartment itself was excluded, while only external noise coming from the street was included in the survey. This is because in this study, the focus was set on researching the retrofit of the external walls and windows. Additionally, in indoor air quality with regard to the perception of odours, many elements are undetectable to the sense of smell, and micro-organisms are present in indoor air (e.g., PM 10 and PM 2.5, formaldehyde); therefore, it is likely that in many cases the air quality is worse but was not perceived as such. Also, the health perceptions of the residents researched in this study might be disproportionally affected by the season during which the surveys were conducted. The season was the summer of 2023 when many people living in Barcelona were going through one of the worst heat waves in Europe [23,29]. For further studies, a year-round balance in the surveys should be further developed. Finally, the results of the research may have been affected due to possible unwillingness to answer honestly to the self-perception of health-related questions in the format used, face-to-face interviews, despite ASHRAE standard 55 and ISO 10551, due to the stigma on health issues and social desirability biases [30]. Nonetheless, to counteract these potential biases, the survey was partially conducted using anonymous online surveys, and a greater willingness to answer sensitive questions online was observed.

Supplementary Materials

The following supporting information can be downloaded at: https://www.mdpi.com/article/10.3390/buildings14010236/s1. The questionnaire S1: Survey to assess the Households’ Perceptions of Health Co-Benefits.

Author Contributions

Conceptualisation, C.B.-A.; methodology, C.B.-A. and C.M.-D.; C.B.-A. designed the survey, gathered the sample, and gathered respondents; C.M.-D. aided in shaping the survey and analysed the information and produced this paper. All authors have read and agreed to the published version of the manuscript.

Funding

This article is part of the master thesis of the first author, directed by the second author, in the framework of the EnerValor 2 project Ref. PID2019-104561RB-I00 (MINCIU).

Data Availability Statement

Publicly available datasets were analyzed in this study. This data can be found here: https://www.ine.es/.

Conflicts of Interest

The authors declare no conflicts of interest.

References

  1. WWF. Potencial de Ahorro Energético y de Reducción de Emisiones de CO2 del Parque Residencial Existente en España en 2020; WWF: Madrid, Spain, 2010; Available online: https://wwfes.awsassets.panda.org/downloads/resumen_wwf.pdf?40760/Potencial-de-Ahorro-Energtico-y-de-Reduccin-de-Emisiones-de-CO2-del-Parque-Residencial-existente-en-Espaa-en-2020 (accessed on 10 January 2024).
  2. Ajuntament de Barcelona. Energia Barcelona. Available online: https://www.energia.barcelona/es/ahorrar-energia-en-el-hogar-y-en-el-trabajo (accessed on 2 June 2023).
  3. Agencias. Destinados 17,8 Millones de Fondos Europeos a Rehabilitar 1.933 Viviendas en Barcelona, 20–22. Available online: https://www.lavanguardia.com/vida/20230602/9015609/destinados-17-8-millones-fondos-europeos-rehabilitar-1-933-viviendas-barcelona.html (accessed on 2 June 2023).
  4. European Commission. Directive 2010/31/EU of the European Parliament and of the Council of 19 May 2010 on the Energy Performance of Buildings (Recast). 2018. Available online: https://eur-lex.europa.eu/legal-content/EN/TXT/?uri=CELEX%3A02010L0031-20210101 (accessed on 10 January 2024).
  5. Directive (EU) 2023/1791 of the European Parliament and of the Council of 13 September 2023 on Energy Efficiency and Amending Regulation (EU) 2023/955 (Recast) (Text with EEA Relevance). Available online: https://eur-lex.europa.eu/legal-content/EN/TXT/?uri=OJ%3AJOL_2023_231_R_0001 (accessed on 10 January 2024).
  6. Ortiz, J.; Salom, J. Estimación del Efecto de la Rehabilitación Energética en la Salud de las Personas. In Eficiencia Energética: Sistemas, Edificios y Comunidades; Institut de Recerca en Energia de Catalunya, Barcelona, Spain. 2016. Available online: http://www.lacasaqueahorra.org/documentos/estimacionEfectoRehabilitacionSalud.pdf (accessed on 30 September 2023).
  7. Jakob, M. Marginal costs and co-benefits of energy efficiency investments: The case of the Swiss residential sector. Energy Policy 2006, 34, 172–187. [Google Scholar] [CrossRef]
  8. Dell’Anna, F.; Becchio, C.; Bottero, M.; Corgnati Stefano, P. Evaluating Health Benefits of Urban Energy Retrofitting: An Application for the City of Turin. In Smart and Sustainable Planning for Cities and Regions; Springer International Publishing: Cham, Switzerland, 2019; pp. 281–304. [Google Scholar] [CrossRef]
  9. Barón Rodríguez, A.; Ortíz Roncallo, M.; Larrea Eguiguren, A.; Ampudia Farías, A.; Marmolejo Duarte, C.R.; Garcia-Almirall, M.P. Study of the perception of thermal comfort, Residetial Satisfaction and management model, of the residents of the conservation and energy Rehabilitation Area in the Poroneos Street, Santa Coloma de Gramenet, Spain. In Proceedings of the International Congress Virtual City and Territory (XII CTV)—Intelligent Cities and Territories (CTV 2018), Mendoza, Argentina, 5–7 September 2018; CPSV: Barcelona, Spain, 2018; pp. 303–318. [Google Scholar]
  10. Biere Arenas, R.; Marmolejo Duarte, C.; Crespo Sánchez, E.; Onecha Pérez, B. Percepción de beneficios y co-beneficios de las viviendas energéticamente eficientes. Un análisis para Barcelona. Rev. INVI 2023, 38, 260–290. [Google Scholar] [CrossRef]
  11. Sánchez, E.C.; Berrio, S.S.; Perez, B.O.; Marmolejo-Duarte, C. Perceived Benefits of Energy Efficiency in the Spanish Residential Market and Their Relation to Sociodemographic and Living Conditions. Appl. Sci. 2021, 11, 875. [Google Scholar] [CrossRef]
  12. Vandentorren, S.; Bretin, P.; Zeghnoun, A.; Mandereau-Bruno, L.; Croisier, A.; Cochet, C.; Ribéron, J.; Siberan, I.; Declercq, B.; Ledrans, M. August 2003 Heat Wave in France: Risk Factors for Death of Elderly People Living at Home. Eur. J. Public Health 2006, 16, 583–591. [Google Scholar] [CrossRef] [PubMed]
  13. Kampa, M.; Castanas, E. Human health effects of air pollution. Environ. Pollut. 2008, 151, 362–367. [Google Scholar] [CrossRef] [PubMed]
  14. Chapman, J.A.; Terr, A.I.; Jacobs, R.L.; Charlesworth, E.N.; Bardana, E.J., Jr. Toxic mold: Phantom risk vs science. Ann. Allergy Asthma Immunol. 2003, 91, 222–232. [Google Scholar] [CrossRef] [PubMed]
  15. Bjørner, T. Combining socio-acoustic and contingent valuation surveys to value noise reduction. Transp. Res. Part D Transp. Environ. 2004, 9, 341–356. [Google Scholar] [CrossRef]
  16. Toman, M. Special Section: Forum on Valuation of Ecosystem Services: Why not to calculate the value of the world’s ecosystem services and natural capital. Ecol. Econ. 1998, 25, 57–60. [Google Scholar] [CrossRef]
  17. Amecke, H. The Impact of Energy Performance Certificates: A Survey of German Home Owners. Energy Policy 2012, 46, 4–14. [Google Scholar] [CrossRef]
  18. Marmolejo-Duarte, C.; Spairani Berrio, S.; Moral-Ávila, D.; Méndez, L.D. The Relevance of EPC Labels in the Spanish Residential Market: The Perspective of Real Estate Agents. Building 2020, 10, 27. [Google Scholar] [CrossRef]
  19. Pachauri, R.K.; Allen, M.; Barros, V.; Broome, J.; Cramer, W.; Christ, R.; Church, J.; Clarke, L.; Dahe, Q.; Dasgupta, P. IPCC, 2014: Climate Change 2014: Synthesis Report. In Contribution of Working Groups I, II and III to the Fifth Assessment Report of the Intergovernmental Panel on Climate Change; IPCC: Geneva, Switzerland, 2014; p. 151. [Google Scholar]
  20. Gao, J.; Xu, G.; Ma, W.; Zhang, Y.; Woodward, A.; Vardoulakis, S.; Kovats, S.; Wilkinson, P.; He, T.; Lin, H.; et al. Perceptions of Health Co-Benefits in Relation to Greenhouse Gas Emission Reductions: A Survey among Urban Residents in Three Chinese Cities. Int. J. Environ. Res. Public Health 2017, 14, 298. [Google Scholar] [CrossRef] [PubMed]
  21. Haines, A. Health benefits of a low carbon economy. Public Health 2012, 126 (Suppl. S1), S33–S39. [Google Scholar] [CrossRef] [PubMed]
  22. Vardoulakis, S.; Dear, K.; Wilkinson, P. Challenges and opportunities for urban environmental health and sustainability: The healthy-polis initiative. Environ. Health Glob. Access Sci. Source 2016, 15 (Suppl. S1), 30. [Google Scholar] [CrossRef] [PubMed]
  23. Ramos, B.A.; Cladera, J.R.; Cladera, J.R.; de Larrocha, C.S.; de Larrocha, C.S.; Santafé, M.D.M.; Santafé, M.D.M.; Arenas, R.M.B.; Arenas, R.M.B. Olas de Calor en la ciudad de Barcelona: 1971–2020. ACE Archit. City Environ. 2022, 17, 11684. [Google Scholar] [CrossRef]
  24. Ürge-Vorsatz, D.; Herrero, S.T.; Dubash, N.K.; Lecocq, F. Measuring the Co-Benefits of Climate Change Mitigation. Annu. Rev. Environ. Resour. 2014, 39, 549–582. [Google Scholar] [CrossRef]
  25. ANSI/ASHRAE Standard 55:2017; Thermal Environmental Conditions for Human Occupancy. ASHRAE: Atlanta, GA, USA, 2017.
  26. UNE-EN ISO 10551:2019; Ergonomics of the Physical Environment—Subjective Judgement Scales for Assessing Physical Environments. European Committee for Standardization: Brussels, Belgium, 2019.
  27. INE. National Institute of Statistics. Number of Households (Main Dwellings) in the 2021 Census. Available online: https://www.ine.es (accessed on 29 September 2023).
  28. Escofet i Figueras, J. Obtenció d’un Indicador Microterritoal de Renda Familiar Disponible a Partir de Dades Macroterritorials Contrastació Empírica a Nivel de Sección Censal: El cas de Terrasa. Ph.D. Thesis, Universitat Politècnica de Catalunya, Barcelona, Spain, 2016. Available online: https://upcommons.upc.edu/handle/2117/105137 (accessed on 2 June 2023).
  29. Wang, J.; Guan, Y.; Wu, L.; Guan, X.; Cai, W.; Huang, J.; Dong, W.; Zhang, B. Changing Lengths of the Four Seasons by Global Warming. Geophys. Res. Lett. 2021, 48, e2020GL091753. [Google Scholar] [CrossRef]
  30. Larson, R.B. Co Controlling Social Desirability Bias. Int. J. Mark. Res. 2018, 61, 534–547. [Google Scholar] [CrossRef]
Figure 1. Flowchart of the research methodology.
Buildings 14 00236 g001
Figure 2. Arrears of a bill due to financial difficulties.
Buildings 14 00236 g002
Figure 3. Percentage of exterior windows according to type of renovation.
Buildings 14 00236 g003
Figure 4. (a) Percentage of perceived indoor comfort. Own elaboration. (b) Percentage of perceived thermal environment. Note: without relying on mechanical systems, such as heating or air-conditioning being turned on. (a) 1: Due to limitations in the text editing software, in mathematical contexts, the intended representation of hyphens (-) is a minus sign (−).
Buildings 14 00236 g004
Figure 5. Percentage of residents’ self-perceived health. Own elaboration. Note: Due to limitations in the text editing software, in mathematical contexts, the intended representation of hyphens (-) is a minus sign (−).
Buildings 14 00236 g005
Figure 6. Percentage of awareness of the fact that housing conditions have an impact on health.
Buildings 14 00236 g006
Figure 7. Percentage of residents willing to undertake energy retrofits. Own elaboration.
Buildings 14 00236 g007
Figure 8. Percentage of the level of agreement with the statement “housing conditions have an impact on health”.
Buildings 14 00236 g008
Figure 9. (a) Summary of the regression model to explain residents’ awareness about “housing conditions have an impact on health”. (b) League table to explain residents’ awareness about “housing conditions have an impact on health”. (c) Coefficients in the regression model to explain residents’ awareness about “housing conditions have an impact on health”.
Buildings 14 00236 g009
Figure 10. (a). Summary of the regression model to explain people’s perception of whether they have respiratory diseases. (b). League table to explain people’s perception of whether they have respiratory diseases. (c). Coefficients in the regression model to explain people’s perception of whether they have respiratory diseases.
Buildings 14 00236 g010
Figure 11. (a) Summary of the regression model to explain willingness to undertake energy retrofits. (b) League table to explain readiness to undertake energy retrofits. (c) Coefficients in the regression model for willingness to undertake energy retrofits.
Buildings 14 00236 g011
Figure 12. (a) Summary of the regression model for people’s perception of whether they have cardiovascular disease. (b) Classification table to explain people’s perception of whether they have cardiovascular disease. (c) Coefficients in the regression model to explain people’s perception of whether they have cardiovascular disease.
Buildings 14 00236 g012
Table 2. In-depth interviews with experts.
NoIn-Depth Interview TopicIntervieweeDate, Roll, and Affiliation
1Introduction to co-benefits and cost-effectiveness assessmentFederico Dell’Anna31 April 2022
Research Professor—Polytechnic University of Turin
Summary: To understand different methods to quantify the co-benefits of improved building efficiency.
2Review of previous surveysTian Weijia21 December 2022
Research Professor—Tongji University
Summary: Review the advance and critique of the method and analysis of the prior epidemiological survey, Health Survey of Catalonia—ESCA in Spanish—2022.
3Review of survey draftDeng Linshuang23 February 2023
Post-Doctor Researcher–Tongji University
Summary: Categorise the five topics in the survey based on the hypothesis and research question.
4Review of survey draftJoana Aina Ortiz Ferra23 February 2023
Deputy Head of Thermal Energy and Building Performance—Fundació Institut de Recerca en l’Energia de Catalunya (IREC)
Summary: Apply the survey based on the ASHRAE 55 standard that measures comfort.
5Review of survey draftBelen Onecha Perez24 February 2023
Research Professor—Polytechnic University of Catalonia
Summary: feedback related to the characteristics of the dwelling conditions, such as the orientation of the main façade and heat-producing systems. Source: own elaboration.
Table 3. Technical details and structure of the survey.
Qualitative Study Technical SheetStructure of the Survey RequestAnswer FormatStatistical Reliability
(Cronbach’s
Alpha)
Research scopeBarcelona municipality 1.1 Which floor do you live on?Closed, multiple
choice
n.a.
Type of studyPrimary qualitative descriptive and segmented study1.2 Typology of your apartmentClosed,
single option
n.a.
Research techniqueFace-to-face and online surveys1.3 Main orientation of your apartmentClosed,
multiple choice
n.a.
Data collection instrumentA survey using ten closed-response Likert-scale questions, five closed-response single-choice questions, eight closed-response multiple-choice questions, three open-response free-text questions, and two matrix questions1.4 Period of construction of your apartmentClosed, multiple
choice
n.a.
Type of sample surveyConsecutive and stratified by sex and socio-professional in order to be accessible and representative of the study group1.5 How much, on average, is your monthly electricity bill?Open, free optionn.a.
Survey sample
size
A total of 127 valid cases have been collected in the 10 districts of Barcelona, Spain, with a response rate of 9% from the neighbourhood associations1.6 How much, on average, is your monthly gas bill?Open, free optionn.a.
Survey error levelA total of 7% for global data in the assumed simple random sampling at a 90% confidence level, and p-q-0.51.7. Does your dwelling have external wall insulation?Closed, single optionn.a.
Data
collection
period
25 March 2023 to 31 July 20231.8 Specify whether your exterior window glasses are original or whether you have upgraded them.Matrix optionn.a.
ResearchEnerValor 2 research project1.9 Specify whether your window frames are original or whether you have upgraded them.Matrix optionn.a.
1.10 Do you have a heating system in your apartment?Closed, single optionn.a.
1.11 What type of heating system is installed in your apartment?Closed, multiple-choicen.a.
1.12 Do you have air conditioning installed in your apartment?Closed, single optionn.a.
2.1 How satisfied are you with the level of external street noise?Closed, Likert scale0.489
2.2 How satisfied are you with the indoor air quality in your apartment?Closed, Likert scale0.721
2.3 How satisfied are you with dampness problems, such as leaks or condensation?Closed, Likert scale0.524
2.4 How do you perceive thermal comfort in summer?Closed, Likert scale0.401
2.5 How do you perceive thermal comfort in winter?Closed, Likert scale0.462
2.6 Please indicate any other problems in your apartment.Free textn.a.
3.1 What would you say your general health is like?Closed,
Likert scale
n.a.
3.2 Have you had any cardiovascular disease?Closed
multiple choice
n.a.
3.3 Have you ever had a respiratory illness?Closed
multiple choice
n.a.
3.4 Housing conditions have an impact on cardio/respiratory diseases?Closed, Likert scale0.821
3.5 Housing conditions have an impact on mental health? (depression, etc.)Closed, Likert scale0.876
3.6 Do housing conditions have an impact on your health?Closed, Likert scale0.861
4.1 Are you willing to undertake energy retrofit in your apartment?Closed, Likert scalen.a.
4.2 Which of these aspects of your dwelling would you be willing to...Closed, single optionn.a.
4.3 If you were to carry out an energy retrofit, which would you…Closed, multiple
choice
n.a.
4.4 What makes it difficult for you to carry out an energy retrofit?Closed, multiple
choice
n.a.
Note: n.a. is “not applicable” Source: own elaboration.
Table 4. Demographic information of the sample versus the total target population.
ItemsStudy Participants (N, %) Target Population (%)
Barcelona municipality1271.63 million (in 2022)
Gender
Male54 (42.5%)47.59%
Female73 (57.5%)52.41%
Source: own elaboration based on information from the National Institute of Statistics (INE in Spanish) data.
Table 5. Profile of the five residents and their main contributions.
IdemFeaturesInputs
KE-1Woman; 44 years old; Spanish; architect and professor. A resident of the Sant Gervasi neighbourhood; an expert in insulation and thermal materials.Point 1.3. The east and west façade is added. Point 1.9. The iron carpentry is changed to steel. Point 6.8. It is specified that it is net per month.
KE-2Female; 37 years old; Spanish. Deputy Director of Thermal Energy and Building Performance. Design comfort questions are based on the ASHRAE 55 standard.
KE-3Female; 21 years old; Spanish; law student.Point 6.2. Ownership regime. A section is added with others to specify children who are living in the parents’ house and do not own or rent. In addition, persons living in a concession of the use of the building.
KE-4Male; 35 years old; Spanish. Neighbour and president of the AAVV Verneda. He has lived in the neighbourhood all his life.Understanding technical terms to simplify them and other problems with housing such as asbestos, aluminosis, or leaks.
KE-5Male; 38 years old; British. Comedian; 29 years in Spain. Resident of Sant Antoni.Points 3.4, 3.5, and 3.6. Replace “The conditions of your dwelling …” with “the conditions of the dwelling in general...”.
KE-6Male; 45 years old; Spanish. Engineer. Resident of Parc Vall d’Hebron.Point 1.10. The term “aerothermal” heat pump is changed to just “heat pump”.
Source: own elaboration.
Disclaimer/Publisher’s Note: The statements, opinions and data contained in all publications are solely those of the individual author(s) and contributor(s) and not of MDPI and/or the editor(s). MDPI and/or the editor(s) disclaim responsibility for any injury to people or property resulting from any ideas, methods, instructions or products referred to in the content.

