
A Predictive Model for the Growth Diameter of Mold under Different Temperatures and Relative Humidities in Indoor Environments


Abstract
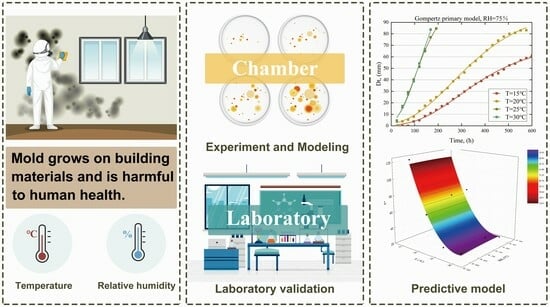
1. Introduction
- (1)
- Investigate the impact of temperature and relative humidity on the growth parameters of mold, identify the key environmental factors and the control ranges, and provide recommendations for environmental control to prevent indoor mold growth;
- (2)
- Establish a predictive model for mold growth based on indoor temperature and relative humidity, develop appropriate modeling methods to fit the mold growth curve and predict growth parameters, and determine whether relative humidity could be used for mold growth prediction;
- (3)
- Validate the applicability of the mold growth predictive model in real environments (unventilated and natural ventilation conditions) and analyze the factors influencing the accuracy of the predictive model.
2. Materials and Methods
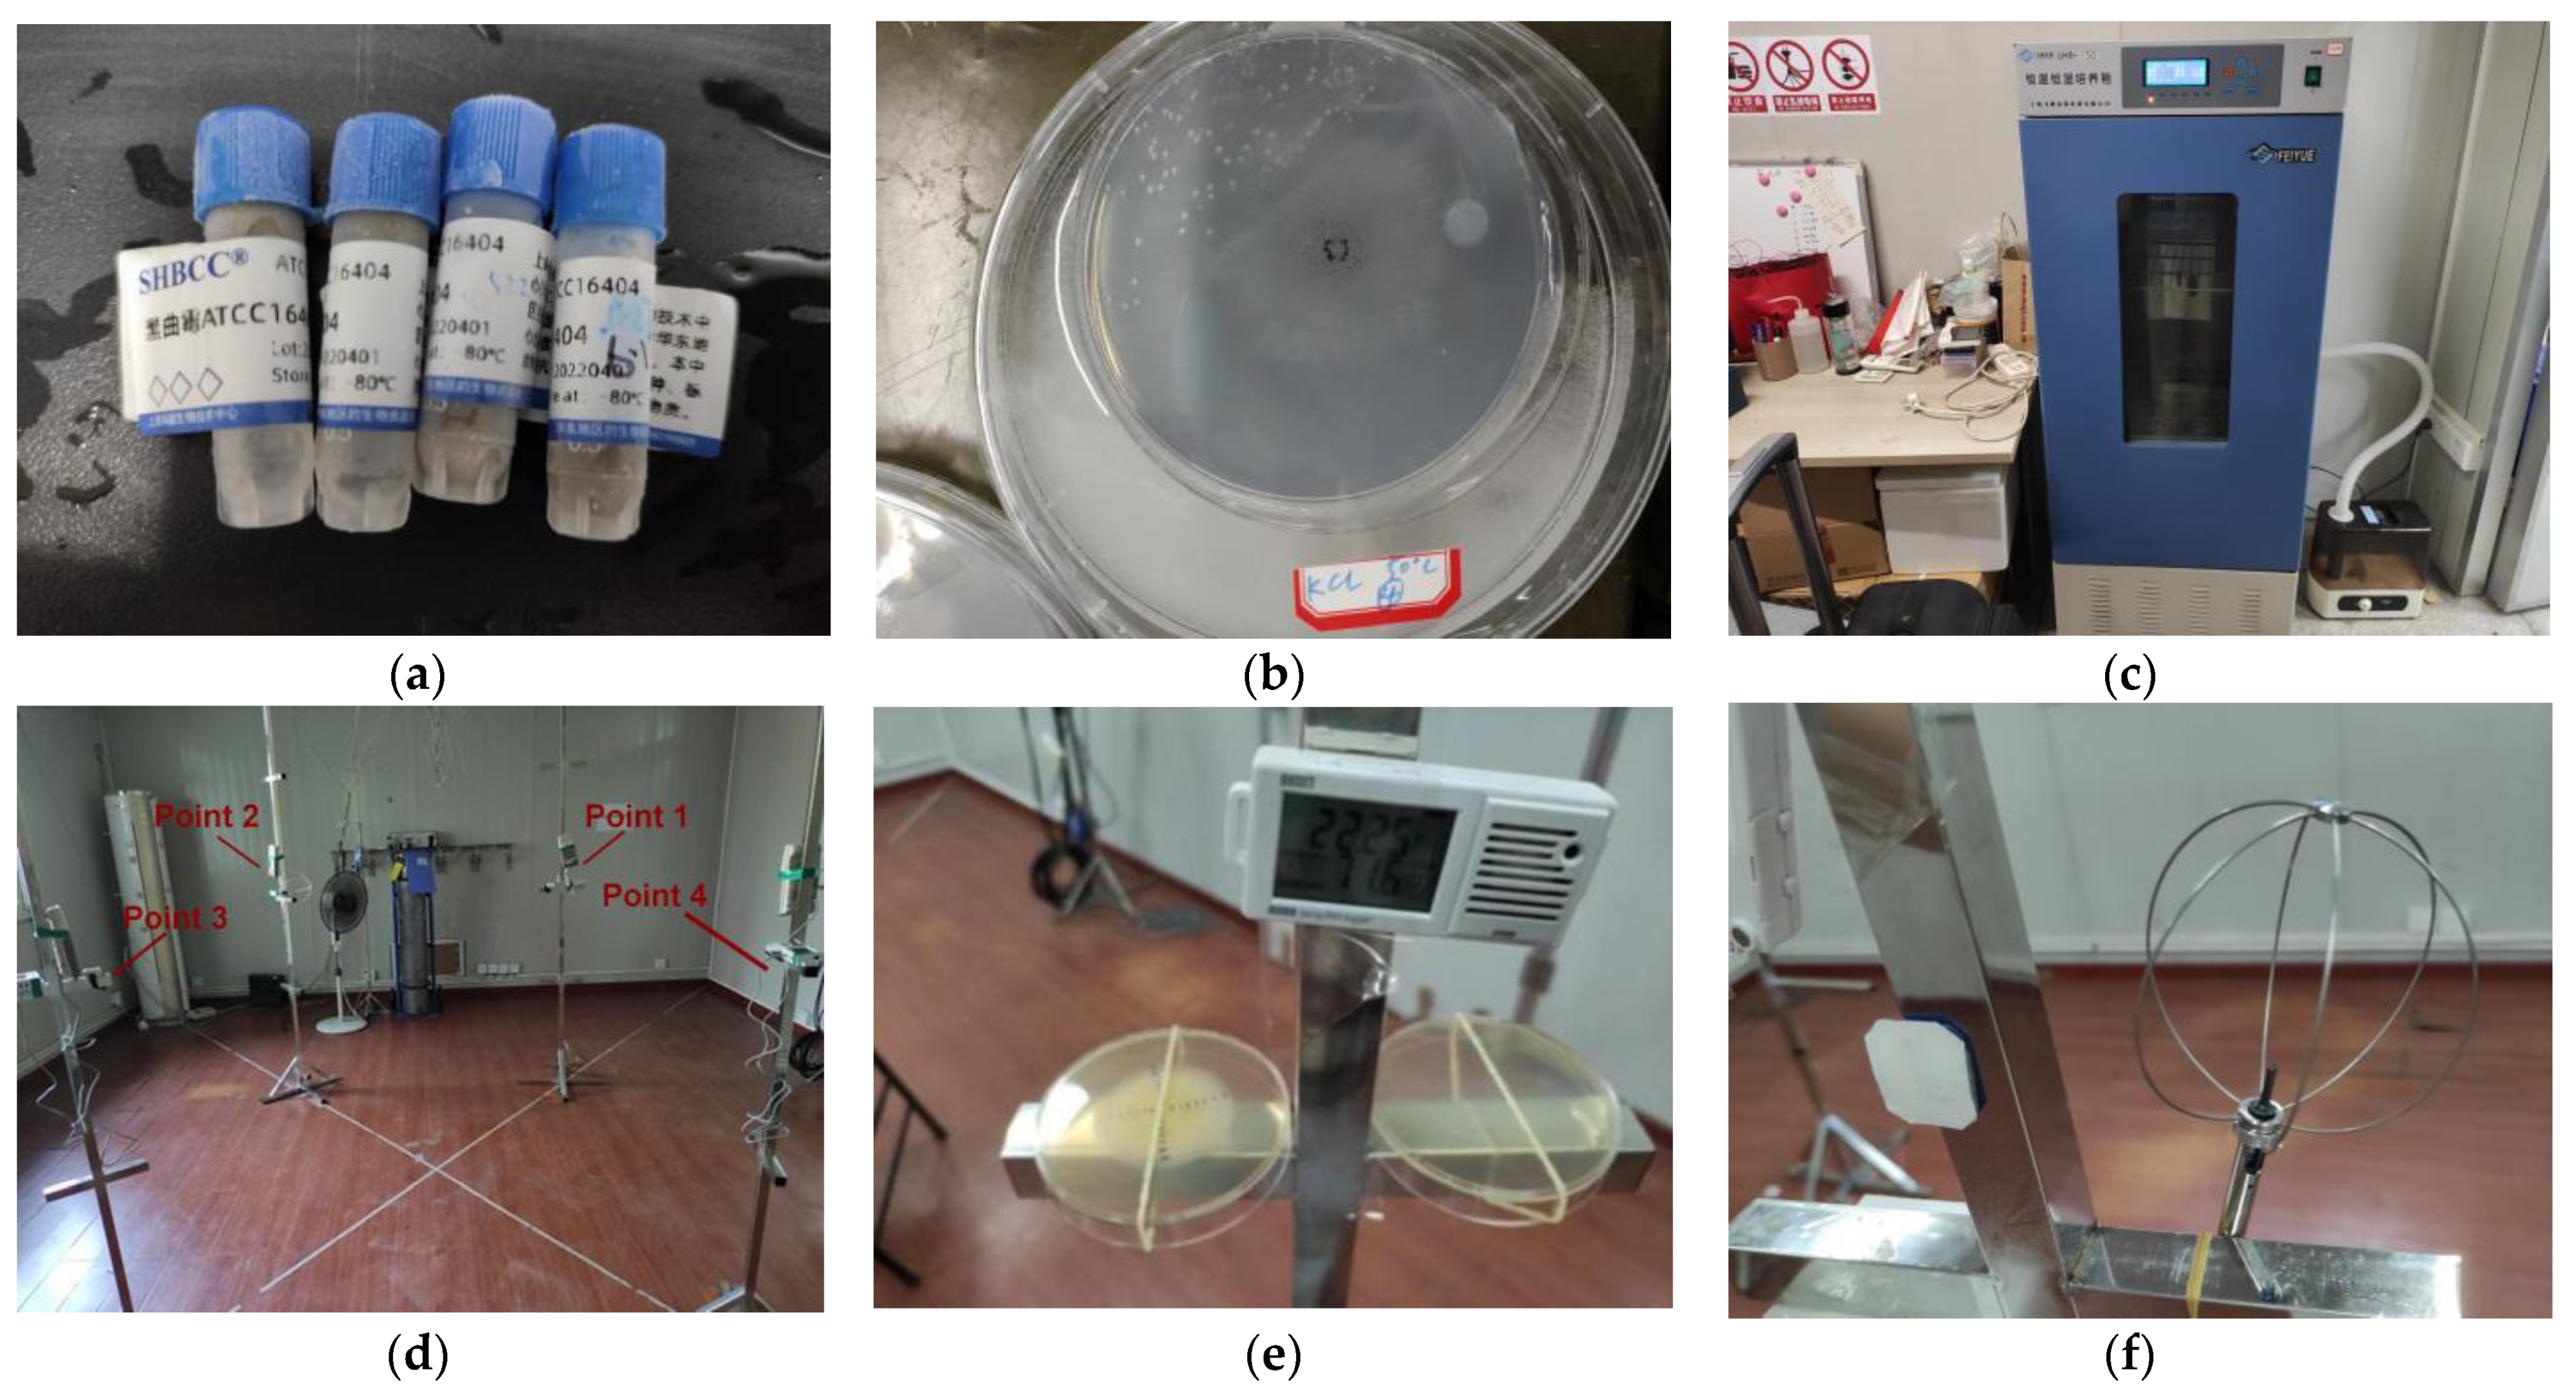
2.1. Mold Growth Experiments
2.1.1. Mold Strains and Inoculations
2.1.2. Experimental Conditions
2.1.3. Experimental Process
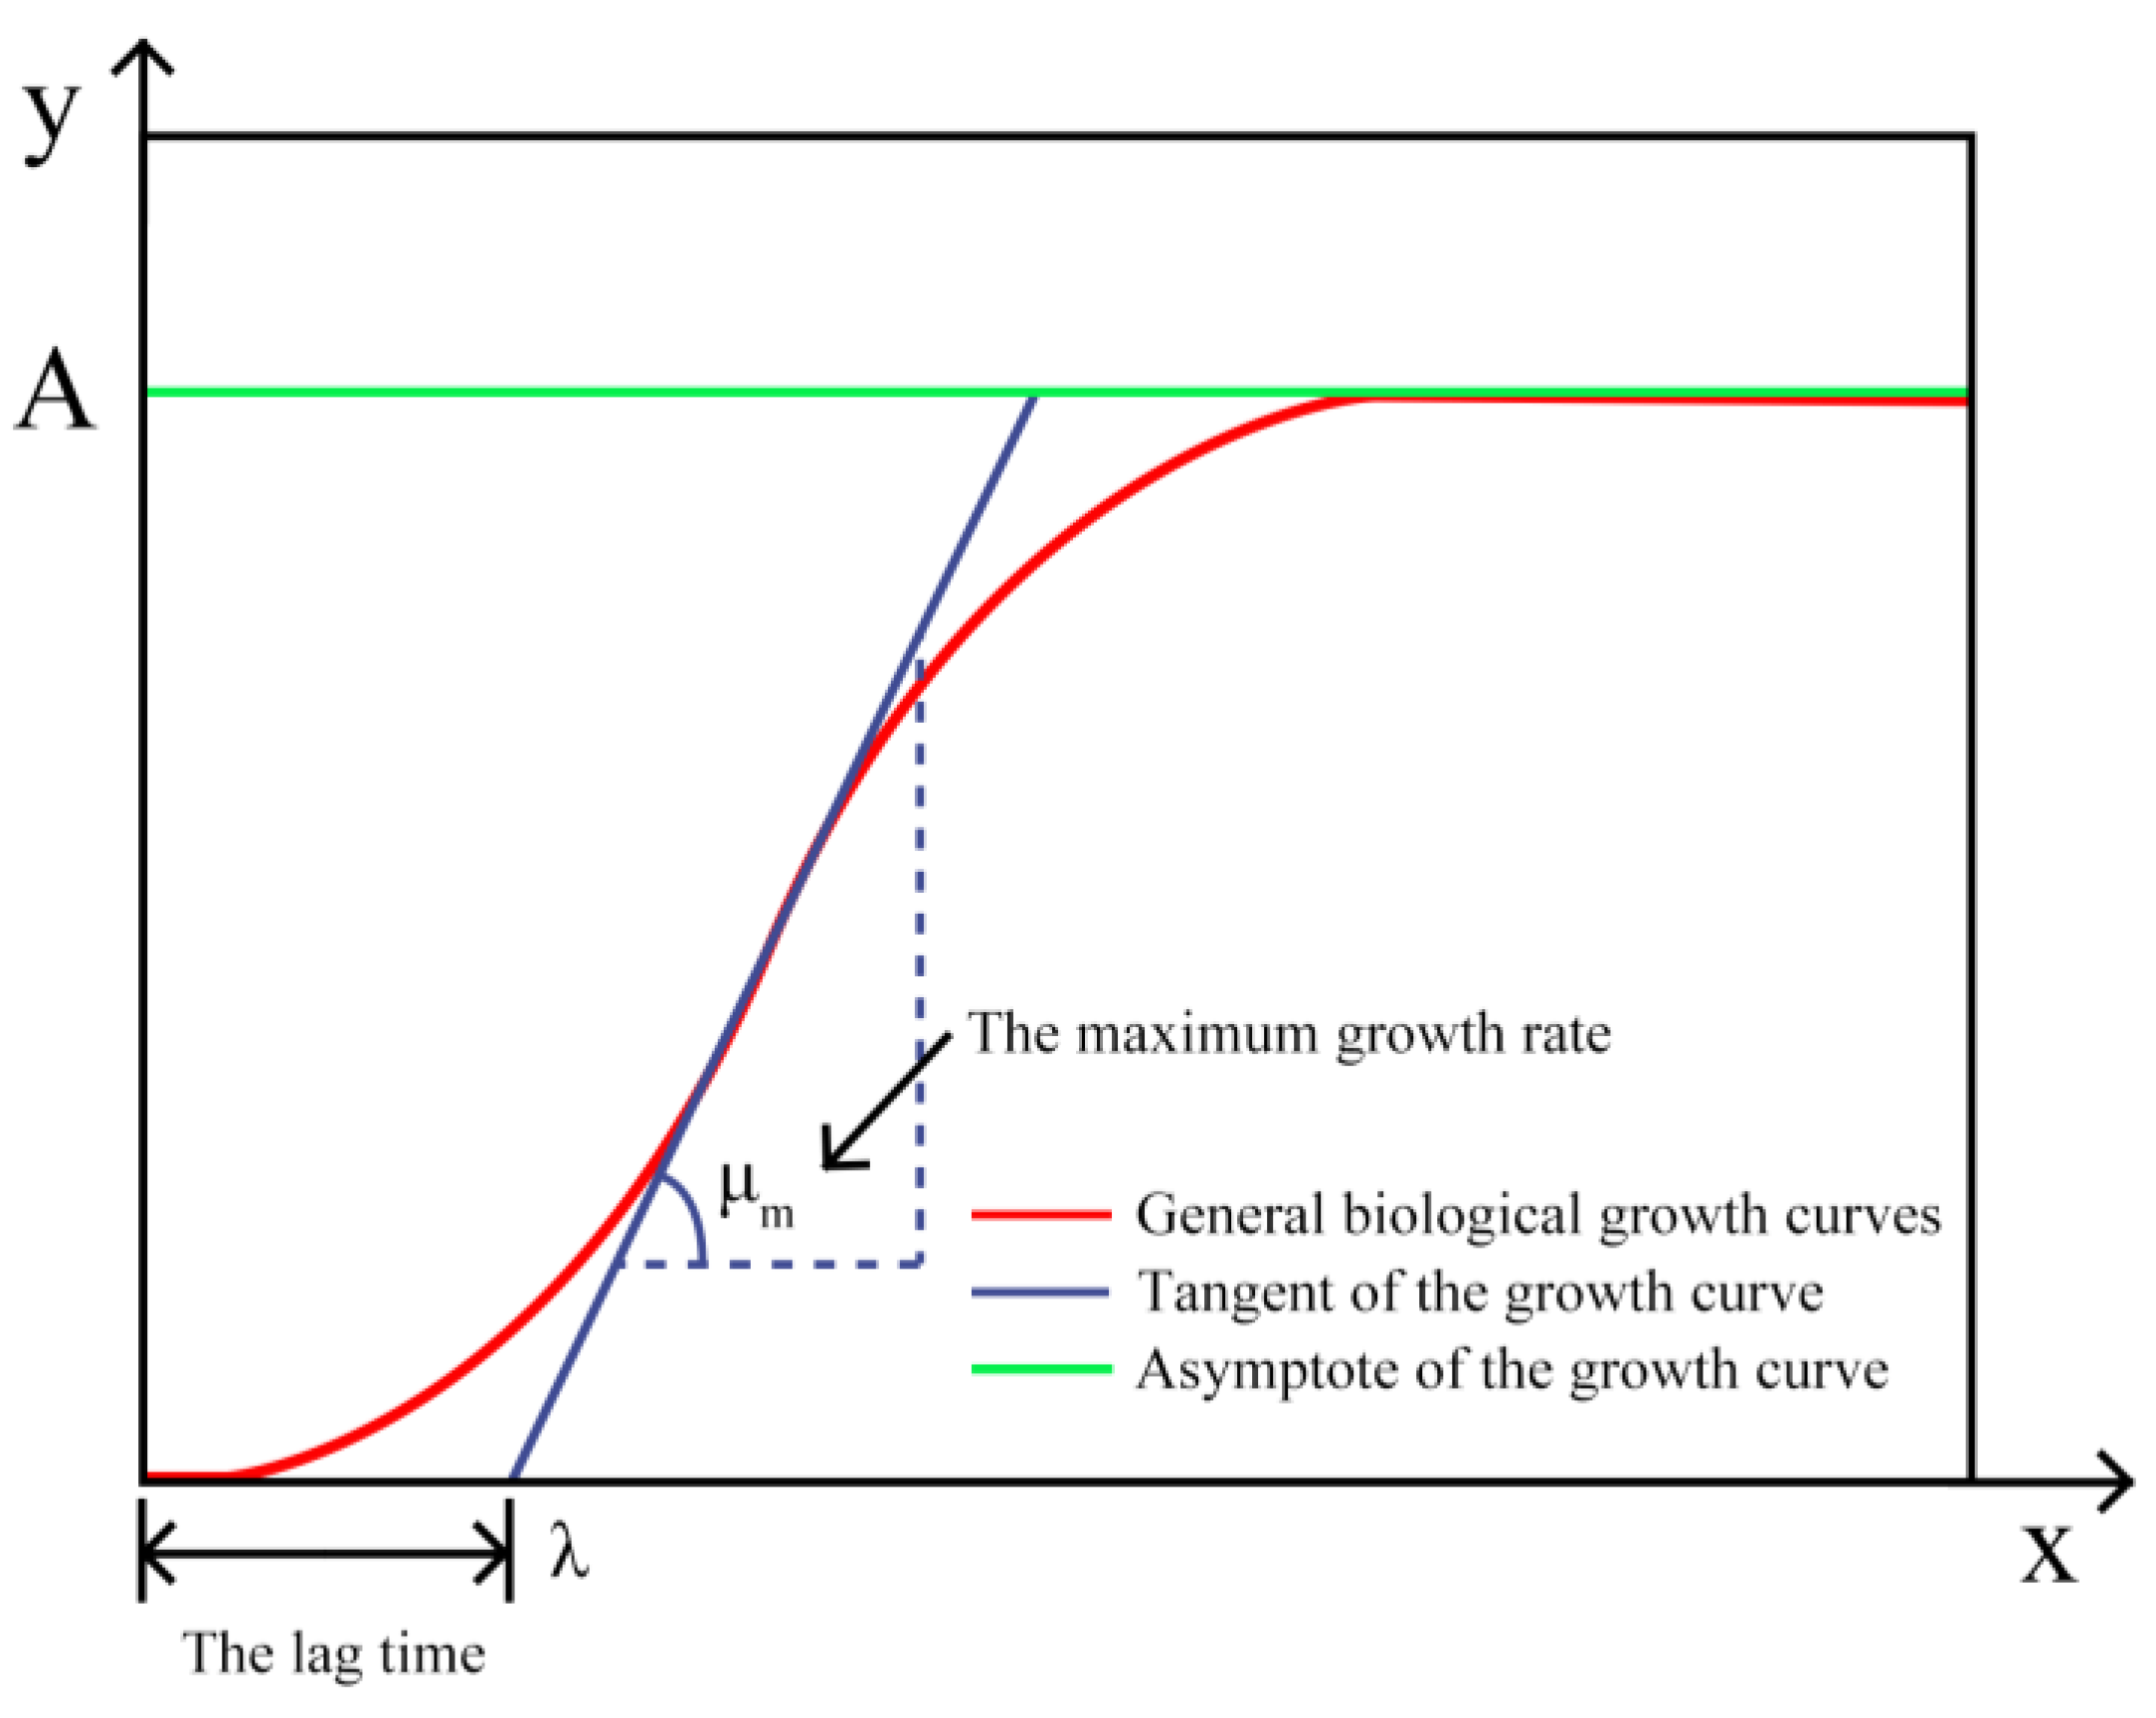
2.2. Modeling
2.2.1. Primary Modeling
2.2.2. Secondary Modeling
2.2.3. Model Accuracy Evaluation
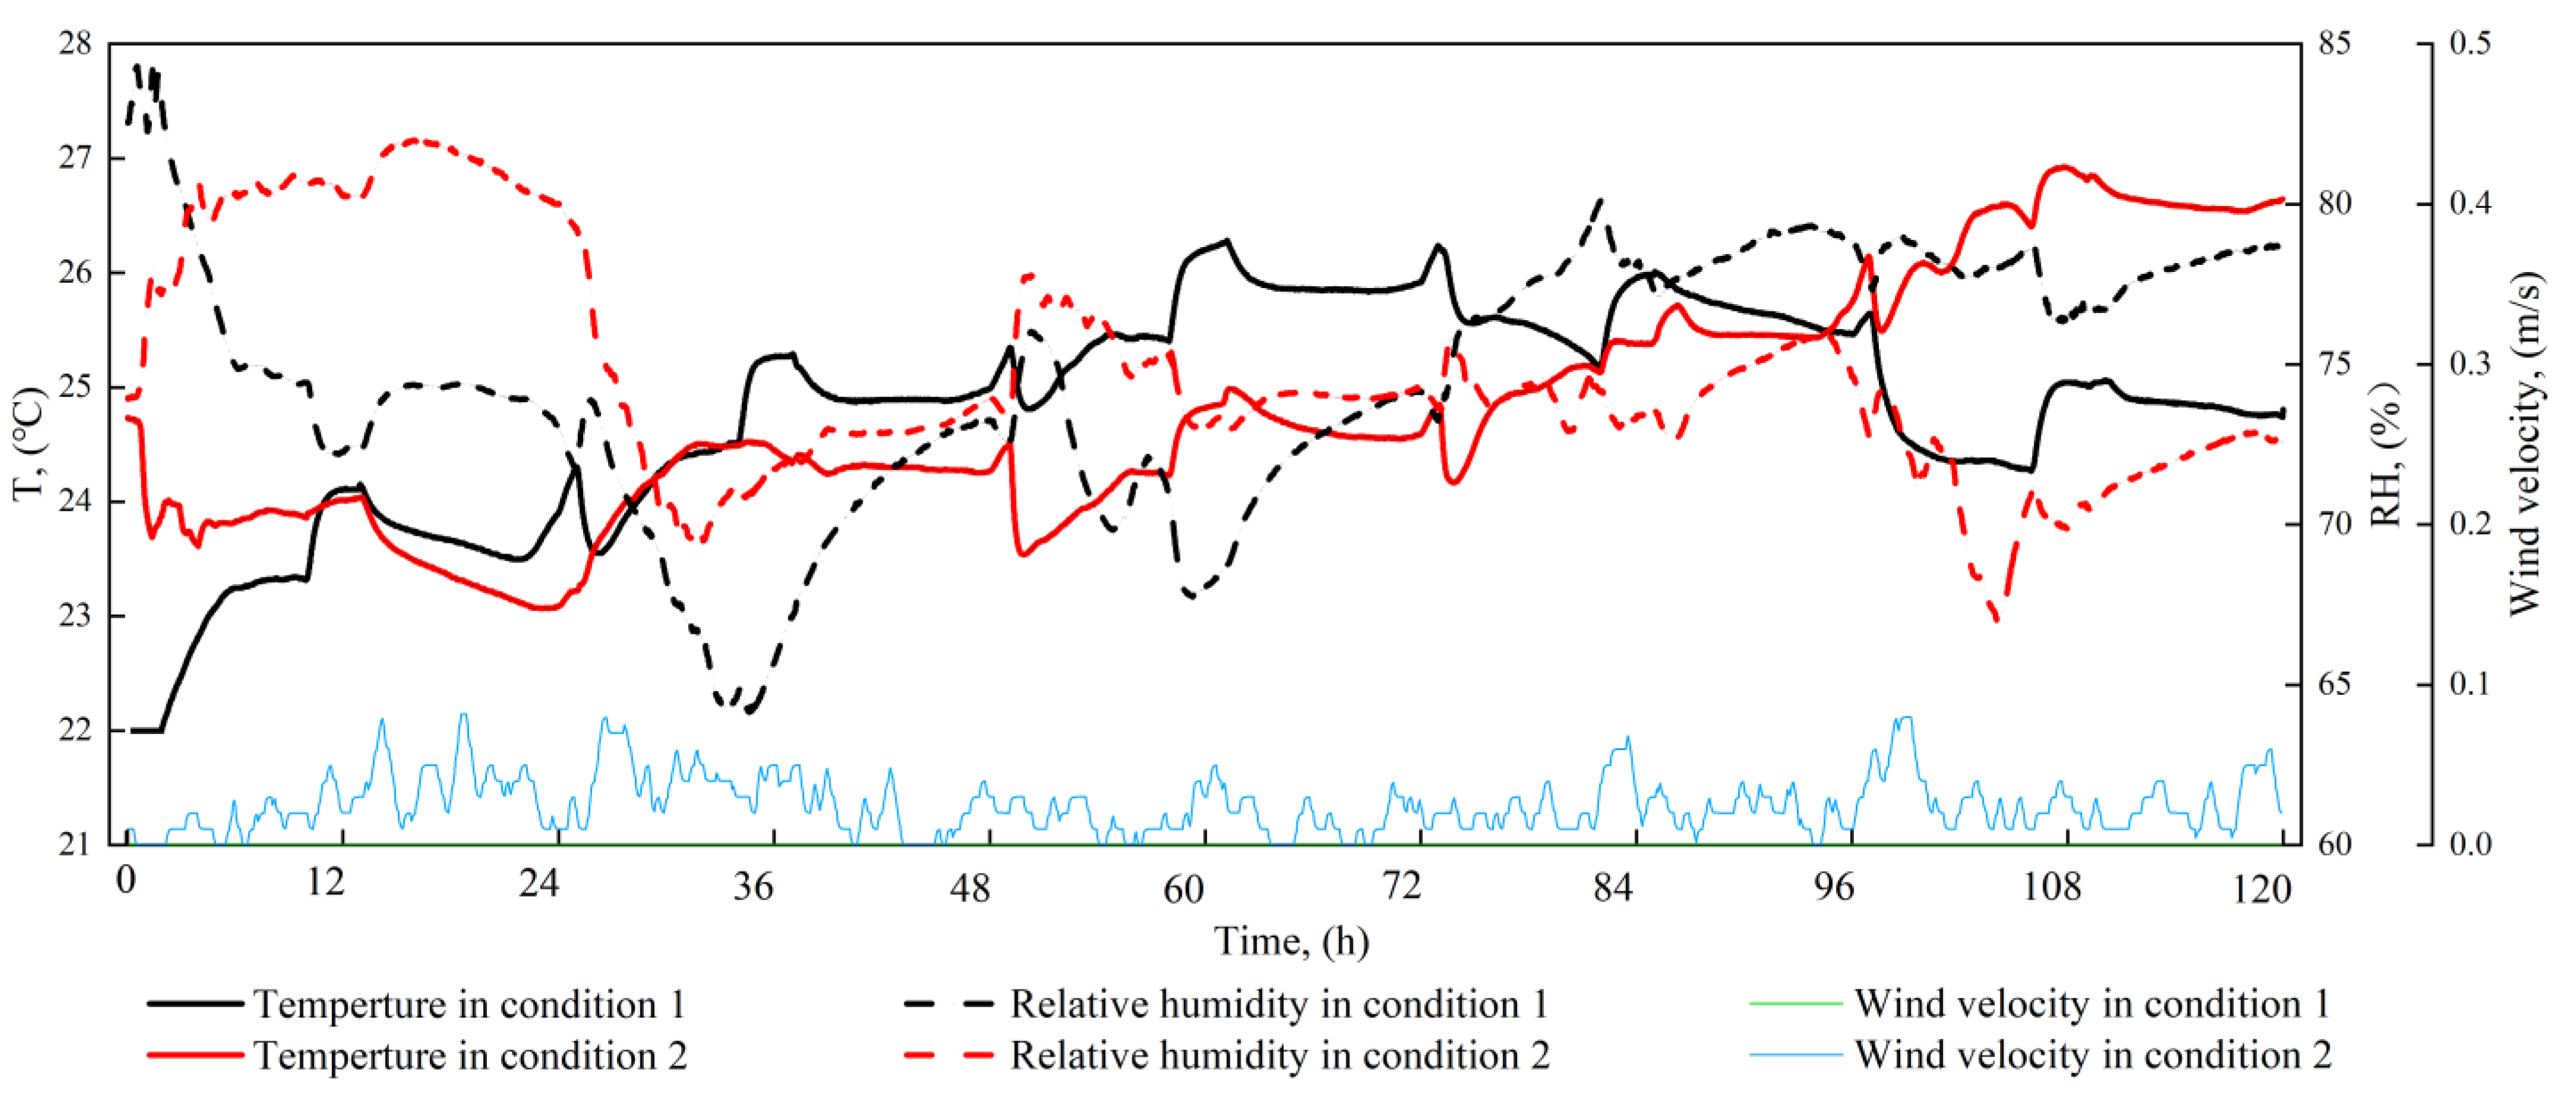
2.3. Laboratory Validation
2.4. Statistics
3. Results
3.1. Results of the Primary Modeling
3.2. Results of the Secondary Modeling
3.3. Results of the Laboratory Verification
4. Discussion
4.1. Effect of Temperature and Relative Humidity on Mold Growth
4.2. Accuracy of the Predictive Model and Parameter Determination
4.3. Analysis of Laboratory Validation Results
4.4. Limitations
5. Conclusions
- (1)
- Our research cultivated mold on a medium under constant temperature and relative humidity conditions. We found that reducing the temperature and relative humidity could significantly inhibit mold growth, but the inhibitory effects varied. Temperature might play a more important role; the maximum growth () rate and diameter () of the mold increased as the temperature increased, while the lag time () decreased. At higher temperatures (25 °C and 30 °C), the rate of change in mold growth and lag time might become consistent, and we speculate that the main difference might appear in the maximum diameter ().
- (2)
- We utilized the diameter of mold growth under varying temperatures and relative humidity levels to derive growth parameters (, , ) through nonlinear fitting methods. Our findings indicate that these growth parameters could effectively depict the growth process of the mold. The primary model was able to accurately calculate these growth parameters, although it is important to note that temperature and relative humidity might influence the precision of these parameters. Compared to the Logistic model ( = 0.990), the Gompertz primary model demonstrated superior predictive performance for the growth parameters ( = 0.997). Therefore, the Gompertz primary model is more suitable for calculating growth parameters in indoor environments.
- (3)
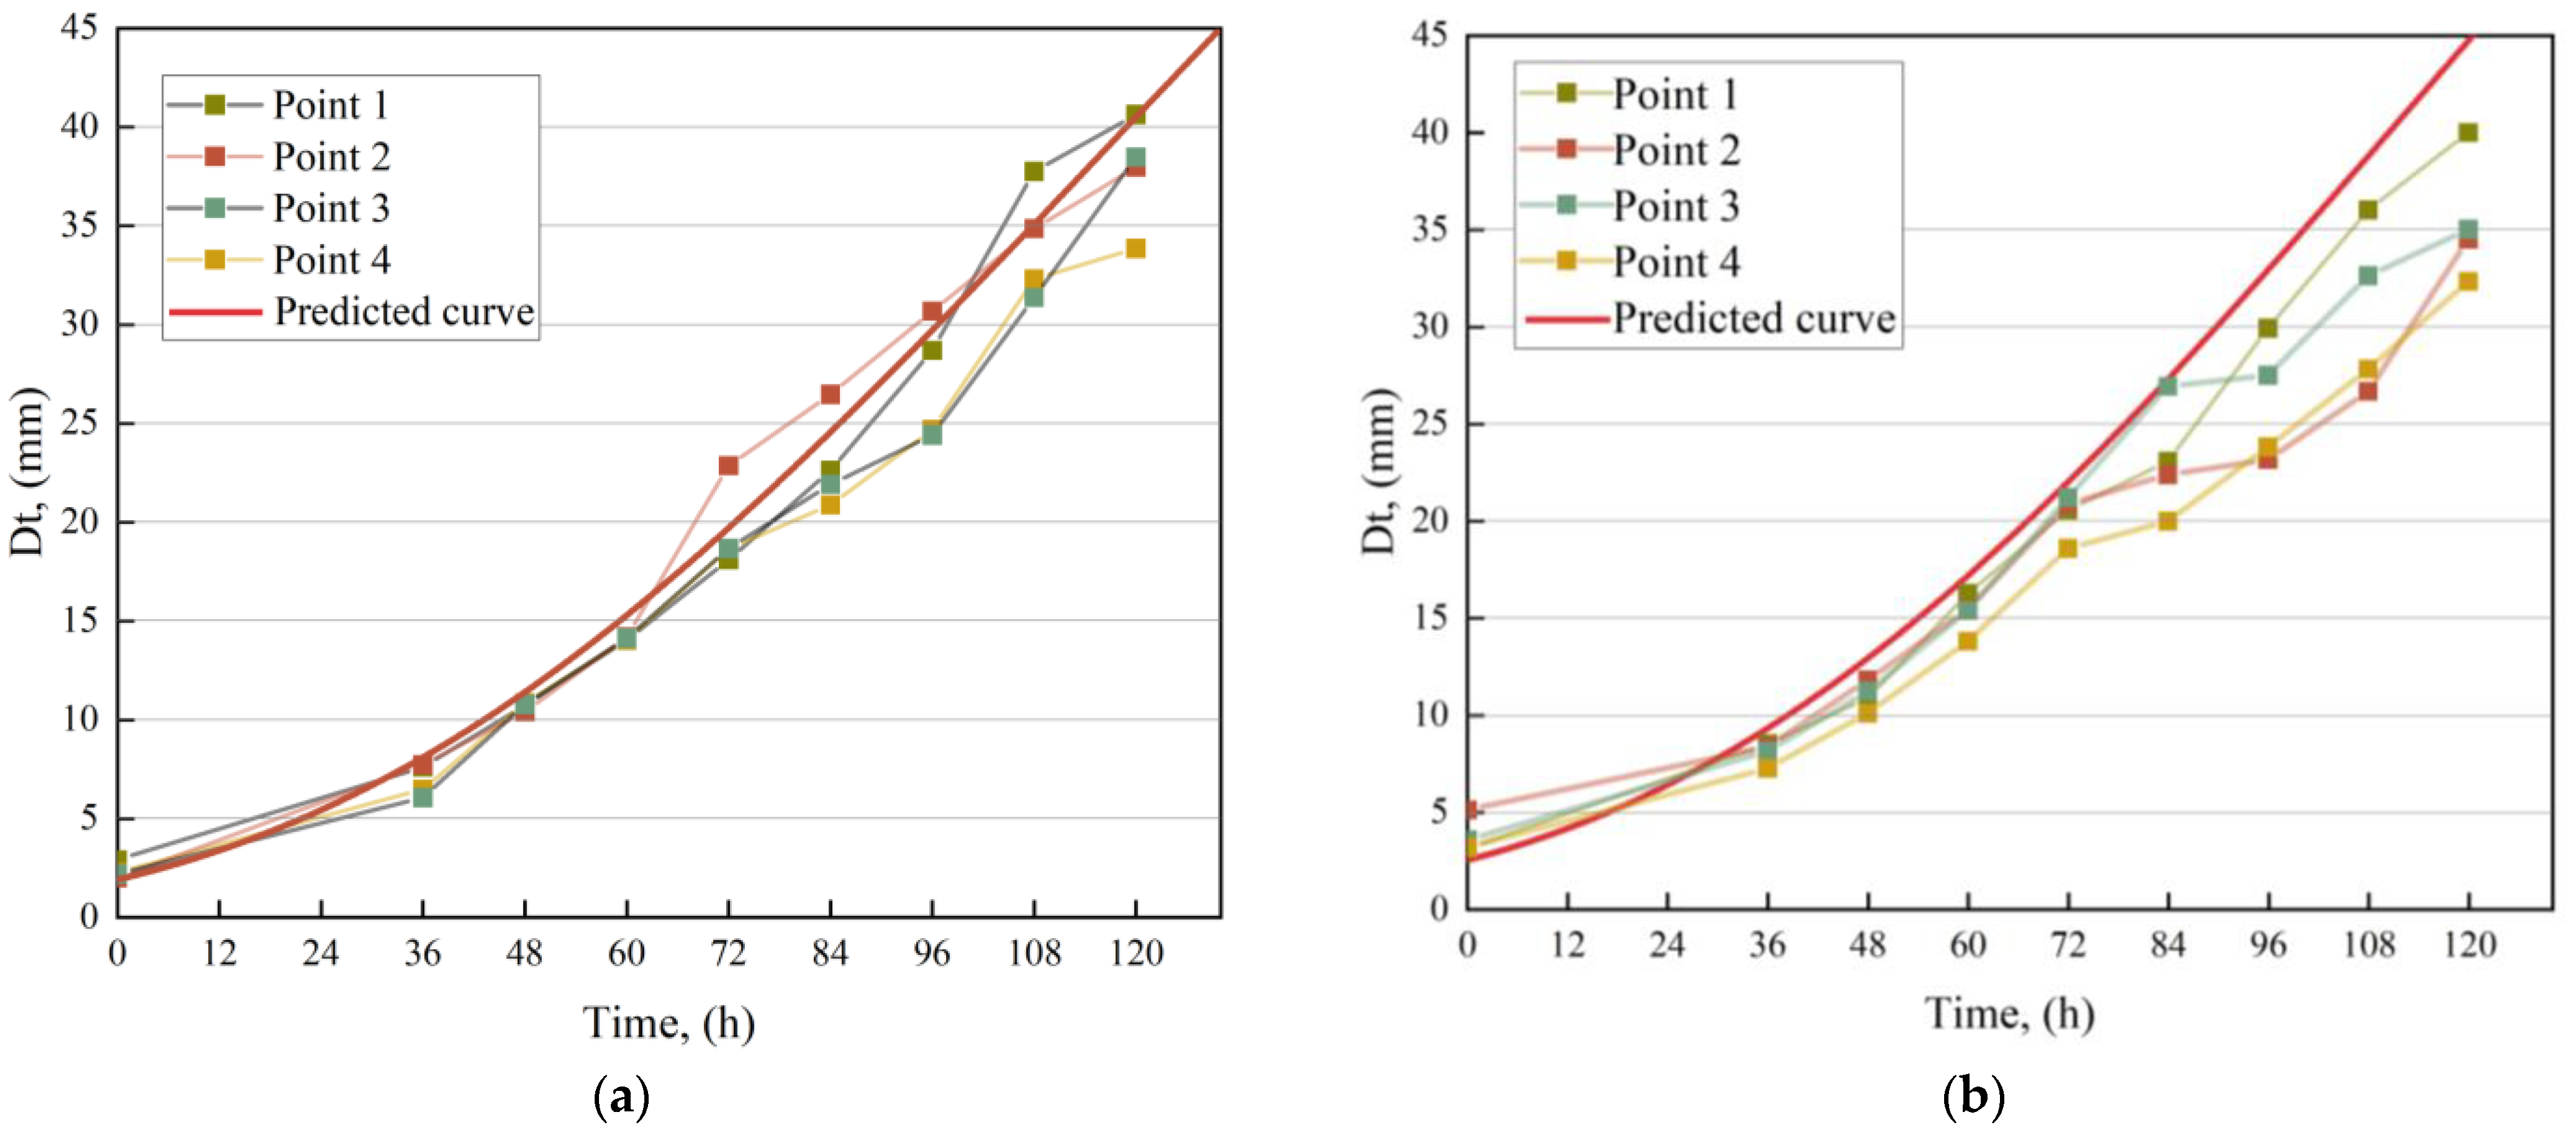
- We developed a secondary model based on environmental parameter changes to predict growth parameters (, , ), established a mold growth prediction model and validated the model under windless and windy conditions. We concluded that the polynomial secondary model for the maximum growth rate () and lag time (), and the Arrhenius–Davey secondary model for the maximum growth diameter () demonstrated good predictive performances ( > 0.850). Relative humidity was found to be a useful factor in constructing the mold growth prediction model. This mold growth prediction model was able to predict mold growth under windless conditions in real-world environments fairly well ( > 0.700). However, the model’s accuracy decreased ( < 0.400) under windy conditions (wind velocity < 1 m/s).
Supplementary Materials
Author Contributions
Funding
Institutional Review Board Statement
Informed Consent Statement
Data Availability Statement
Acknowledgments
Conflicts of Interest
References
- World Health Organization WHO. Guidelines for Indoor Air Quality: Dampness and Mould; WHO Regional Office Europe: Geneva, Switzerland, 2009; ISBN 978-92-890-4168-3. [Google Scholar]
- Seguel, J.M.; Merrill, R.; Seguel, D.; Campagna, A.C. Campagna Indoor Air Quality. Am. J. Lifestyle Med. 2017, 11, 284–295. [Google Scholar] [CrossRef] [PubMed]
- Haleem Khan, A.A.; Mohan Karuppayil, S. Fungal Pollution of Indoor Environments and Its Management. Saudi J. Biol. Sci. 2012, 19, 405–426. [Google Scholar] [CrossRef] [PubMed]
- Madureira, J.; Paciência, I.; Cavaleiro-Rufo, J.; Fernandes, E.D.O. Eduardo de Oliveira Fernandes Indoor Air Risk Factors for Schoolchildren’s Health in Portuguese Homes: Results from a Case-Control Survey. J. Toxicol. Environ. Health Part A 2016, 79, 938–953. [Google Scholar] [CrossRef] [PubMed]
- Antova, T.; Pattenden, S.; Brunekreef, B.; Heinrich, J.; Rudnai, P.; Forastiere, F.; Luttmann-Gibson, H.; Grize, L.; Katsnelson, B.; Moshammer, H.; et al. Exposure to Indoor Mould and Children’s Respiratory Health in the PATY Study. J. Epidemiol. Community Health 2008, 62, 708–714. [Google Scholar] [CrossRef] [PubMed]
- Sun, Y.; Sundell, J. Life Style and Home Environment Are Associated with Racial Disparities of Asthma and Allergy in Northeast Texas Children. Sci. Total Environ. 2011, 409, 4229–4234. [Google Scholar] [CrossRef] [PubMed]
- Takigawa, T.; Wang, B.-L.; Sakano, N.; Wang, D.-H.; Ogino, K.; Kishi, R. A Longitudinal Study of Environmental Risk Factors for Subjective Symptoms Associated with Sick Building Syndrome in New Dwellings. Sci. Total Environ. 2009, 407, 5223–5228. [Google Scholar] [CrossRef] [PubMed]
- Kanchongkittiphon, W.; Mendell, M.J.; Gaffin, J.M.; Wang, G.; Phipatanakul, W. Indoor Environmental Exposures and Exacerbation of Asthma: An Update to the 2000 Review by the Institute of Medicine. Environ. Health Perspect. 2015, 123, 6–20. [Google Scholar] [CrossRef] [PubMed]
- Gunnbjornsdottir, M.I.; A Franklin, K.; Norbäck, D.; Björnsson, E.; Gislason, D.; Lindberg, E.; Svanes, C.; Omenaas, E.; Norrman, E.; Jõgi, R.; et al. Prevalence and Incidence of Respiratory Symptoms in Relation to Indoor Dampness: The RHINE Study. Thorax 2006, 61, 221–225. [Google Scholar] [CrossRef]
- Simoni, M.; Lombardi, E.; Berti, G.; Rusconi, F.; La Grutta, S.; Piffer, S.; Petronio, M.G.; Galassi, C.; Forastiere, F.; Viegi, G. Mould/Dampness Exposure at Home Is Associated with Respiratory Disorders in Italian Children and Adolescents: The SIDRIA-2 Study. Occup. Environ. Med. 2005, 62, 616–622. [Google Scholar] [CrossRef]
- Bornehag, C.G.; Sundell, J.; Hagerhed-Engman, L.; Sigsggard, T.; Janson, S.; Aberg, N.; DBH Study Group. “Dampness” at Home and Its Association with Airway, Nose, and Skin Symptoms among 10,851 Preschool Children in Sweden: A Cross-Sectional Study. Indoor Air 2005, 15 (Suppl. 10), 48–55. [Google Scholar] [CrossRef]
- Bornehag, C.G.; Sundell, J.; Hagerhed-Engman, L.; Sigsgaard, T. Association between Ventilation Rates in 390 Swedish Homes and Allergic Symptoms in Children. Indoor Air 2005, 15, 275–280. [Google Scholar] [CrossRef] [PubMed]
- Fisk, W.J.; Lei-Gomez, Q.; Mendell, M.J. Meta-Analyses of the Associations of Respiratory Health Effects with Dampness and Mold in Homes. Indoor Air 2007, 17, 284–296. [Google Scholar] [CrossRef] [PubMed]
- Zhang, Y.; Li, B.; Huang, C.; Yang, X.; Qian, H.; Deng, Q.; Zhao, Z.; Li, A.; Zhao, J.; Zhang, X.; et al. Ten Cities Cross-Sectional Questionnaire Survey of Children Asthma and Other Allergies in China. Chin. Sci. Bull. 2013, 58, 4182–4189. [Google Scholar] [CrossRef]
- Wang, J.; Li, B.; Yang, Q.; Wang, H.; Norback, D.; Sundell, J. Sick Building Syndrome among Parents of Preschool Children in Relation to Home Environment in Chongqing, China. Chin. Sci. Bull. 2013, 58, 4267–4276. [Google Scholar] [CrossRef]
- Cai, J.; Li, B.; Yu, W.; Yao, Y.; Wang, L.; Li, B.; Wang, Y.; Du, C.; Xiong, J. Associations of Household Dampness with Asthma, Allergies, and Airway Diseases among Preschoolers in Two Cross-Sectional Studies in Chongqing, China: Repeated Surveys in 2010 and 2019. Environ. Int. 2020, 140, 105752. [Google Scholar] [CrossRef]
- Prussin, A.J.; Marr, L.C. Sources of Airborne Microorganisms in the Built Environment. Microbiome 2015, 3, 78. [Google Scholar] [CrossRef]
- Almeida, R.M.S.F.; Barreira, E. Monte Carlo Simulation to Evaluate Mould Growth in Walls: The Effect of Insulation, Orientation, and Finishing Coating. Adv. Civ. Eng. 2018, 2018, e8532167. [Google Scholar] [CrossRef]
- Nielsen, K.; Holm, G.; Uttrup, L.; Nielsen, P. Nielsen Mould Growth on Building Materials under Low Water Activities. Influence of Humidity and Temperature on Fungal Growth and Secondary Metabolism. Int. Biodeterior. Biodegrad. 2004, 54, 325–336. [Google Scholar] [CrossRef]
- Johansson, P.; Ekstrand-Tobin, A.; Svensson, T.; Bok, G. Laboratory Study to Determine the Critical Moisture Level for Mould Growth on Building Materials. Int. Biodeterior. Biodegrad. 2012, 73, 23–32. [Google Scholar] [CrossRef]
- Viitanen, H.A. Modelling the Time Factor in the Development of Mould Fungi—The Effect of Critical Humidity and Temperature Conditions on Pine and Spruce Sapwood. Holzforschung 1997, 51, 6–14. [Google Scholar] [CrossRef]
- Sahlberg, B.; Gunnbjörnsdottir, M.; Soon, A.; Jogi, R.; Gislason, T.; Wieslander, G.; Janson, C.; Norback, D. Airborne Molds and Bacteria, Microbial Volatile Organic Compounds (MVOC), Plasticizers and Formaldehyde in Dwellings in Three North European Cities in Relation to Sick Building Syndrome (SBS). Sci. Total Environ. 2013, 444, 433–440. [Google Scholar] [CrossRef] [PubMed]
- Mendell, M.J. Indoor Residential Chemical Emissions as Risk Factors for Respiratory and Allergic Effects in Children: A Review. Indoor Air 2007, 17, 259–277. [Google Scholar] [CrossRef] [PubMed]
- Aldars-García, L.; Sanchis, V.; Ramos, A.J.; Marín, S. Time-Course of Germination, Initiation of Mycelium Proliferation and Probability of Visible Growth and Detectable AFB1 Production of an Isolate of Aspergillus Flavus on Pistachio Extract Agar. Food Microbiol. 2017, 64, 104–111. [Google Scholar] [CrossRef] [PubMed]
- Hukka, A.; Viitanen, H.A. A Mathematical Model of Mould Growth on Wooden Material. Wood Sci. Technol. 1999, 33, 475–485. [Google Scholar] [CrossRef]
- Clarke, J.; Johnstone, C.; Kelly, N.; McLean, R.; Anderson, J.; Rowan, N.; Smith, J. A Technique for the Prediction of the Conditions Leading to Mould Growth in Buildings. Build. Environ. 1999, 34, 515–521. [Google Scholar] [CrossRef]
- Gradeci, K.; Labonnote, N.; Time, B.; Köhler, J. Mould Growth Criteria and Design Avoidance Approaches in Wood-Based Materials—A Systematic Review. Constr. Build. Mater. 2017, 150, 77–88. [Google Scholar] [CrossRef]
- Wilkins, K.; Larsen, K.; Simkus, M. Volatile Metabolites from Indoor Molds Grown on Media Containing Wood Constituents. Environ. Sci. Pollut. Res. 2003, 10, 206–208. [Google Scholar] [CrossRef] [PubMed]
- Chen, N.-T.; Shih, C.-H.; Jung, C.-C.; Hsu, N.-Y.; Chen, C.-Y.; Lee, C.-C.; Su, H.-J. Impact of Mold Growth on Di(2-Ethylhexyl) Phthalate Emission from Moist Wallpaper. Heliyon 2022, 8, e10404. [Google Scholar] [CrossRef]
- Du, C.; Wang, Y.; Li, B.; Xu, M.; Sadrizadeh, S. Grey Image Recognition-Based Mold Growth Assessment on the Surface of Typical Building Materials Responding to Dynamic Thermal Conditions. Build. Environ. 2023, 243, 110682. [Google Scholar] [CrossRef]
- Wawrzyniak, J. A Predictive Model for Assessment of the Risk of Mold Growth in Rapeseeds Stored in a Bulk as a Decision Support Tool for Postharvest Management Systems. J. Am. Oil Chem. Soc. 2020, 97, 915–927. [Google Scholar] [CrossRef]
- Wawrzyniak, J. Model of Fungal Development in Stored Barley Ecosystems as a Prognostic Auxiliary Tool for Postharvest Preservation Systems. Food Bioprocess Technol. 2021, 14, 298–309. [Google Scholar] [CrossRef]
- Kosegarten, C.; Mani-López, E.; Palou, E.; López-Malo, A.; Ramírez-Corona, N. Estimation of Aspergillus Flavus Growth under the Influence of Different Formulation Factors by Means of Kinetic, Probabilistic, and Survival Models. Procedia Food Sci. 2016, 7, 85–88. [Google Scholar] [CrossRef][Green Version]
- Pei, P.; Xiong, K.; Wang, X.; Sun, B.; Zhao, Z.; Xu, J.; Jin, X.; Ye, H.; Xiao, J.; Kong, J. Modelling the Effect of Environmental Factors on the Growth of Aspergillus Parasiticus and Mycotoxin Production in Paddy during Storage*. J. Stored Prod. Res. 2021, 93, 101846. [Google Scholar] [CrossRef]
- Abellana, M.; Benedi, J.; Sanchis, V.; Ramos, A.J. Water Activity and Temperature Effects on Germination and Growth of Eurotium Amstelodami, E. Chevalieri and E. Herbariorum Isolates from Bakery Products. J. Appl. Microbiol. 1999, 87, 371–380. [Google Scholar] [CrossRef] [PubMed]
- Yogendrarajah, P.; Vermeulen, A.; Jacxsens, L.; Mavromichali, E.; De Saeger, S.; De Meulenaer, B.; Devlieghere, F. Mycotoxin Production and Predictive Modelling Kinetics on the Growth of Aspergillus Flavus and Aspergillus Parasiticus Isolates in Whole Black Peppercorns (Piper nigrum L.). Int. J. Food Microbiol. 2016, 228, 44–57. [Google Scholar] [CrossRef]
- Menneer, T.; Mueller, M.; Sharpe, R.A.; Townley, S. Modelling Mould Growth in Domestic Environments Using Relative Humidity and Temperature. Build. Environ. 2022, 208, 108583. [Google Scholar] [CrossRef]
- Koňuchová, M.; Valík, L. Modelling the Radial Growth of Geotrichum Candidum: Effects of Temperature and Water Activity. Microorganisms 2021, 9, 532. [Google Scholar] [CrossRef]
- Du, C.; Liu, S.; Yu, W.; Li, B.; Li, B.; Lu, B.; Meng, C.; Zhou, M. Characterizing Seasonal Dynamics of Indoor Fungal Exposure and Its Relations with Allergic Diseases/Symptoms of Children—A Case-Control Based Investigation in Residences. J. Build. Eng. 2023, 69, 106296. [Google Scholar] [CrossRef]
- Du, C.; Li, B.; Yu, W.; Yao, R.; Cai, J.; Li, B.; Yao, Y.; Wang, Y.; Chen, M.; Essah, E. Characteristics of Annual Mold Variations and Association with Childhood Allergic Symptoms/Diseases via Combining Surveys and Home Visit Measurements. Indoor Air 2022, 32, e13113. [Google Scholar] [CrossRef]
- Costa, C.P.; Silva, D.G.; Rudnitskaya, A.; Almeida, A.; Rocha, S.M. Shedding Light on Aspergillus Niger Volatile Exometabolome. Sci. Rep. 2016, 6, 27441. [Google Scholar] [CrossRef][Green Version]
- Shabankarehfard, E.; Ostovar, A.; Farrokhi, S.; Naeimi, B.; Zaeri, S.; Nazmara, S.; Keshtkar, M.; Sadeghzadeh, F.; Dobaradaran, S. Air- and Dust-Borne Fungi in Indoor and Outdoor Home of Allergic Patients in a Dust-Storm-Affected Area. Immunol. Investig. 2017, 46, 577–589. [Google Scholar] [CrossRef] [PubMed]
- Guo, M.; Yu, W.; Zhang, Y.; Li, B.; Zhou, H.; Du, C. Associations of Household Dampness and Cold Exposure with Cardiovascular Disease and Symptoms among Elderly People in Chongqing and Beijing. Build. Environ. 2023, 233, 110079. [Google Scholar] [CrossRef]
- Dao, T.; Bensoussan, M.; Gervais, P.; Dantigny, P. Inactivation of Conidia of Penicillium Chrysogenum, P. Digitatum and P. Italicum by Ethanol Solutions and Vapours. Int. J. Food Microbiol. 2008, 122, 68–73. [Google Scholar] [CrossRef] [PubMed]
- Nanguy, S.P.-M.; Perrier-Cornet, J.-M.; Bensoussan, M.; Dantigny, P. Impact of Water Activity of Diverse Media on Spore Germination of Aspergillus and Penicillium Species. Int. J. Food Microbiol. 2010, 142, 273–276. [Google Scholar] [CrossRef]
- Greenspan, L. Humidity Fixed Points of Binary Saturated Aqueous Solutions. J. Res. Natl. Bureau Stand. 1977, 81, 89–96. [Google Scholar] [CrossRef]
- Zwietering, M.H.; Jongenburger, I.; Rombouts, F.M.; Van’t Riet, K. Modeling of the Bacterial Growth Curve. Appl. Environ. Microbiol. 1990, 56, 1875–1881. [Google Scholar] [CrossRef] [PubMed]
- Zwietering, M.H.; Jongenburger, I.; Rombouts, F.M.; Van’t Riet, K. Modeling the Soluble Solids and Storage Temperature Effects on Byssochlamys Fulva Growth in Apple Juices. Food Bioprocess Technol. 2017, 10, 720–729. [Google Scholar] [CrossRef]
- Marín, S.; Cuevas, D.; Ramos, A.J.; Sanchis, V. Fitting of Colony Diameter and Ergosterol as Indicators of Food Borne Mould Growth to Known Growth Models in Solid Medium. Int. J. Food Microbiol. 2008, 121, 139–149. [Google Scholar] [CrossRef]
- Samapundo, S.; Devlieghere, F.; Geeraerd, A.; Demeulenaer, B.; Vanimpe, J.; Debevere, J. Modelling of the Individual and Combined Effects of Water Activity and Temperature on the Radial Growth of Aspergillus Flavus and A. Parasiticus on Corn. Food Microbiol. 2007, 24, 517–529. [Google Scholar] [CrossRef]
- Panagou, E.; Skandamis, P.; Nychas, G.-J. Modelling the Combined Effect of Temperature, pH and Aw on the Growth Rate of Monascus Ruber, a Heat-Resistant Fungus Isolated from Green Table Olives. J. Appl. Microbiol. 2003, 94, 146–156. [Google Scholar] [CrossRef]
- Pei, P.; Xiong, K.; Wang, X.; Sun, B.; Zhao, Z.; Zhang, X.; Yu, J. Predictive Growth Kinetic Parameters and Modelled Probabilities of Deoxynivalenol Production by Fusarium Graminearum on Wheat during Simulated Storing Conditions. J. Appl. Microbiol. 2022, 133, 349–361. [Google Scholar] [CrossRef] [PubMed]
- Juneja, V.K.; Mishra, A.; Pradhan, A.K. Dynamic Predictive Model for Growth of Bacillus Cereus from Spores in Cooked Beans. J. Food Prot. 2018, 81, 308–315. [Google Scholar] [CrossRef] [PubMed]
- Zimmermann, M.; Miorelli, S.; Massaguer, P.; Aragão, G.M.F. Growth of Byssochlamys Nivea in Pineapple Juice Under the Effect of Water Activity and Ascospore Age. Braz. J. Microbiol. 2011, 42, 203–210. [Google Scholar] [CrossRef]
- Debonne, E.; Vermeulen, A.; Van Bockstaele, F.; Soljic, I.; Eeckhout, M.; Devlieghere, F. Growth/No-Growth Models of in-Vitro Growth of Penicillium Paneum as a Function of Thyme Essential Oil, pH, Aw, Temperature. Food Microbiol. 2019, 83, 9–17. [Google Scholar] [CrossRef] [PubMed]
- Dagnas, S.; Onno, B.; Membré, J.-M. Modeling Growth of Three Bakery Product Spoilage Molds as a Function of Water Activity, Temperature and pH. Int. J. Food Microbiol. 2014, 186, 95–104. [Google Scholar] [CrossRef] [PubMed]
- Juneja, V.K.; Melendres, M.V.; Huang, L.; Gumudavelli, V.; Subbiah, J.; Thippareddi, H. Modeling the Effect of Temperature on Growth of Salmonella in Chicken. Food Microbiol. 2007, 24, 328–335. [Google Scholar] [CrossRef] [PubMed]
- Baranyi, J.; Roberts, T.A. A Dynamic Approach to Predicting Bacterial Growth in Food. Int. J. Food Microbiol. 1994, 23, 277–294. [Google Scholar] [CrossRef]
- Polizzi, V.; Adams, A.; De Saeger, S.; Van Peteghem, C.; Moretti, A.; De Kimpe, N. Influence of Various Growth Parameters on Fungal Growth and Volatile Metabolite Production by Indoor Molds. Sci. Total Environ. 2012, 414, 277–286. [Google Scholar] [CrossRef]
- Foarde, K.K.; VanOsdell, D.W.; Chang, J.C.S. Evaluation of Fungal Growth on Fiberglass Duct Materials for Various Moisture, Soil, Use, and Temperature Conditions. Indoor Air 1996, 6, 83–92. [Google Scholar] [CrossRef]
- Ryu, S.H.; Moon, H.J.; Kim, J.T. Evaluation of the Influence of Hygric Properties of Wallpapers on Mould Growth Rates Using Hygrothermal Simulation. Energy Build. 2015, 98, 113–118. [Google Scholar] [CrossRef]
- Wu, H.; Wong, J.W.C. Temperature versus Relative Humidity: Which Is More Important for Indoor Mold Prevention? J. Fungi 2022, 8, 696. [Google Scholar] [CrossRef] [PubMed]
- Müller, W.A.; Pasin, M.V.A.; Sarkis, J.R.; Marczak, L.D.F. Effect of Pasteurization on Aspergillus Fumigatus in Apple Juice: Analysis of the Thermal and Electric Effects. Int. J. Food Microbiol. 2021, 338, 108993. [Google Scholar] [CrossRef] [PubMed]
- Kopecký, P.; Staněk, K.; Ryparová, P.; Richter, J.; Tywoniak, J. Toward a Logistic Model of Dynamic Mold Growth on Wood. Wood Sci. Technol. 2023, 57, 759–780. [Google Scholar] [CrossRef]
- Ito, K. Numerical Prediction Model for Fungal Growth Coupled with Hygrothermal Transfer in Building Materials. Indoor Built Environ. 2012, 21, 845–856. [Google Scholar] [CrossRef]
- GB 50736-2012; Design Code for Heating Ventilation and Air Conditioning of Civil Buildings. Chinese Standard: Beijing, China, 2012.
- Park, S.Y.; Choi, S.-Y.; Ha, S.-D. Predictive Modeling for the Growth of Aeromonas Hydrophila on Lettuce as a Function of Combined Storage Temperature and Relative Humidity. Foodborne Pathog. Dis. 2019, 16, 376–383. [Google Scholar] [CrossRef] [PubMed]
- Ross, T. Indices for Performance Evaluation of Predictive Models in Food Microbiology. J. Appl. Bacteriol. 1996, 81, 501–508. [Google Scholar] [CrossRef] [PubMed]
- Mudarri, D.; Fisk, W.J. Public Health and Economic Impact of Dampness and Mold. Indoor Air 2007, 17, 226–235. [Google Scholar] [CrossRef]
- Pardo, E.; Malet, M.; Marín, S.; Sanchis, V.; Ramos, A. Effects of Water Activity and Temperature on Germination and Growth Profiles of Ochratoxigenic Penicillium Verrucosum Isolates on Barley Meal Extract Agar. Int. J. Food Microbiol. 2006, 106, 25–31. [Google Scholar] [CrossRef]
- Alaidroos, A.; Mosly, I. Preventing Mold Growth and Maintaining Acceptable Indoor Air Quality for Educational Buildings Operating with High Mechanical Ventilation Rates in Hot and Humid Climates. Air Qual. Atmos. Health 2023, 16, 341–361. [Google Scholar] [CrossRef]
- Bhattacharya, A.; Pantelic, J.; Ghahramani, A.; Mousavi, E.S. Three-Dimensional Analysis of the Effect of Human Movement on Indoor Airflow Patterns. Indoor Air 2021, 31, 587–601. [Google Scholar] [CrossRef]
- Long, X.J.; Zhang, C.M.; Yang, T.H.; Huang, Y.L. Analysis of Meteorological Elements Variations of Chongqing over the Past 60 Years. Appl. Mech. Mater. 2014, 501–504, 2016–2019. [Google Scholar] [CrossRef]
- Nagayasu, M.; Nakamura, M.; Masuda, M. Nakamura Effect of Wood Ratio and Area in Interior Space on Psychological Images: In the Case of an Experiment Using a Loft in a Log-House. For. Res. 1998, 70, 19–27. [Google Scholar]


| Environmental Factors | Model Parameters | Accuracy Indicators | ||||||
|---|---|---|---|---|---|---|---|---|
| T (°C) | RH (%) | A (mm) | μm × 100 (h−1) | λ (h) | Adj.R2 | RMSE | Af | Bf |
| 15 °C | 61% | 75.99 | 14.78 | 122.74 | 1.00 | 0.83 | 1.03 | 0.99 |
| 76% | 71.26 | 14.52 | 108.27 | 1.00 | 0.92 | 1.03 | 1.00 | |
| 86% | 71.98 | 14.13 | 114.25 | 1.00 | 0.63 | 1.03 | 1.00 | |
| 20 °C | 59% | 89.40 | 21.43 | 61.03 | 1.00 | 1.04 | 1.04 | 1.01 |
| 76% | 102.20 | 20.47 | 75.86 | 1.00 | 1.36 | 1.04 | 1.01 | |
| 85% | 94.89 | 21.63 | 76.89 | 1.00 | 1.40 | 1.05 | 1.03 | |
| 25 °C | 58% | 131.32 | 52.33 | 27.07 | 0.99 | 2.65 | 1.10 | 1.03 |
| 75% | 111.37 | 56.04 | 24.50 | 1.00 | 1.91 | 1.09 | 1.05 | |
| 84% | 123.10 | 54.18 | 24.23 | 1.00 | 1.58 | 1.05 | 1.00 | |
| 30 °C | 56% | 134.67 | 60.28 | 27.03 | 0.99 | 3.24 | 1.18 | 1.09 |
| 75% | 147.82 | 61.87 | 32.73 | 0.99 | 2.49 | 1.14 | 1.07 | |
| 84% | 122.75 | 62.96 | 24.67 | 0.99 | 3.09 | 1.17 | 1.09 | |
| Environmental Factors | Model Parameters | Accuracy Indicators | ||||||
|---|---|---|---|---|---|---|---|---|
| T (°C) | RH (%) | A (mm) | μm × 100 (h−1) | λ (h) | Adj.R2 | RMSE | Af | Bf |
| 15 °C | 61% | 70.82 | 15.62 | 145.85 | 0.99 | 1.34 | 1.05 | 1.00 |
| 76% | 67.16 | 15.15 | 128.71 | 0.99 | 1.41 | 1.06 | 1.02 | |
| 86% | 67.27 | 14.88 | 136.44 | 1.00 | 1.31 | 1.06 | 1.02 | |
| 20 °C | 59% | 81.90 | 22.59 | 77.48 | 0.99 | 1.94 | 1.09 | 1.04 |
| 76% | 88.83 | 22.23 | 98.01 | 1.00 | 1.75 | 1.09 | 1.04 | |
| 85% | 85.42 | 23.03 | 94.89 | 0.99 | 2.45 | 1.12 | 1.07 | |
| 25 °C | 58% | 100.26 | 56.56 | 34.65 | 0.98 | 3.18 | 1.12 | 1.06 |
| 75% | 94.00 | 60.20 | 31.65 | 0.99 | 2.94 | 1.13 | 1.08 | |
| 84% | 97.35 | 59.21 | 32.39 | 1.00 | 1.56 | 1.06 | 1.02 | |
| 30 °C | 56% | 102.02 | 65.07 | 33.67 | 0.98 | 3.94 | 1.21 | 1.12 |
| 75% | 105.32 | 66.45 | 38.62 | 0.99 | 3.34 | 1.17 | 1.10 | |
| 84% | 99.12 | 67.97 | 31.33 | 0.98 | 3.99 | 1.22 | 1.12 | |
| Equation | Model | Model Parameter | Adj.R2 | Af | Bf |
|---|---|---|---|---|---|
| (11) | The polynomial model | 0.850 | 1.193 | 1.001 | |
| (12) | 0.923 | 1.154 | 1.023 | ||
| (13) | The Arrhenius–Davey model | 0.894 | 1.042 | 1.003 |
| Condition | Adj.R2 | RMSE | ||||||
|---|---|---|---|---|---|---|---|---|
| Point 1 | Point 2 | Point 3 | Point 4 | Point 1 | Point 2 | Point 3 | Point 4 | |
| 1 | 0.935 | 0.717 | 0.934 | 0.806 | 3.208 | 5.835 | 3.115 | 5.106 |
| 2 | 0.357 | −0.540 | 0.022 | −0.422 | 7.969 | 10.832 | 9.124 | 11.391 |
| / | ||||||||
| 1 | 1.166 | 1.256 | 1.151 | 1.252 | 1.132 | 1.256 | 1.141 | 1.252 |
| 2 | 1.380 | 1.561 | 1.418 | 1.600 | 1.380 | 1.413 | 1.390 | 1.600 |
Disclaimer/Publisher’s Note: The statements, opinions and data contained in all publications are solely those of the individual author(s) and contributor(s) and not of MDPI and/or the editor(s). MDPI and/or the editor(s) disclaim responsibility for any injury to people or property resulting from any ideas, methods, instructions or products referred to in the content. |
© 2024 by the authors. Licensee MDPI, Basel, Switzerland. This article is an open access article distributed under the terms and conditions of the Creative Commons Attribution (CC BY) license (https://creativecommons.org/licenses/by/4.0/).
Share and Cite
Wang, C.; Mei, Y.; Wang, H.; Guo, X.; Yang, T.; Du, C.; Yu, W. A Predictive Model for the Growth Diameter of Mold under Different Temperatures and Relative Humidities in Indoor Environments. Buildings 2024, 14, 215. https://doi.org/10.3390/buildings14010215
Wang C, Mei Y, Wang H, Guo X, Yang T, Du C, Yu W. A Predictive Model for the Growth Diameter of Mold under Different Temperatures and Relative Humidities in Indoor Environments. Buildings. 2024; 14(1):215. https://doi.org/10.3390/buildings14010215
Chicago/Turabian StyleWang, Chenyang, Yong Mei, Heqi Wang, Xinzhu Guo, Ting Yang, Chenqiu Du, and Wei Yu. 2024. "A Predictive Model for the Growth Diameter of Mold under Different Temperatures and Relative Humidities in Indoor Environments" Buildings 14, no. 1: 215. https://doi.org/10.3390/buildings14010215
APA StyleWang, C., Mei, Y., Wang, H., Guo, X., Yang, T., Du, C., & Yu, W. (2024). A Predictive Model for the Growth Diameter of Mold under Different Temperatures and Relative Humidities in Indoor Environments. Buildings, 14(1), 215. https://doi.org/10.3390/buildings14010215