Article

The Association between Perceived Housing Environment and Health and Satisfaction among the Older Adults during the COVID-19 Pandemic: A Cross-Sectional Survey in Northern China

1
School of Environment and Energy Engineering, Beijing University of Civil Engineering and Architecture, Beijing 100044, China
2
Liverpool School of Architecture, University of Liverpool, Liverpool L69 7ZN, UK
*
Authors to whom correspondence should be addressed.
Buildings 2023, 13(11), 2875; https://doi.org/10.3390/buildings13112875
Submission received: 25 September 2023 / Revised: 1 November 2023 / Accepted: 15 November 2023 / Published: 16 November 2023
(This article belongs to the Special Issue Indoor Environmental Quality and Human Wellbeing)

Abstract

:
China lacks design strategies to improve home-based care environments for its older adults. This study investigated the perception of indoor environmental quality in housing environments and analyzed its impact on health and satisfaction among home-living older adults. A cross-sectional survey in Northern China was conducted during the COVID-19 pandemic (October 2021–March 2022) to test the effects of five housing environmental factors on home-living older adults’ health and satisfaction, including noise, lighting and view, temperature and humidity, air quality, and maintenance and cleanliness. A total of 356 home-living adults aged 60 years and older participated in the survey. The 12-item Short Form Health Survey was used to measure health-related quality of life among respondents. Using multiple regression analyses, we found that overall satisfaction can be positively predicted by four housing environmental qualities: lighting and view, temperature and humidity, air quality, and maintenance and cleanliness. Air quality was found to be a predictor of respondents’ physical health. Only noise had a significant predictive effect on respondents’ mental health. Age, marital status, and health status (cardiovascular and chronic diseases) were significantly correlated with the physical health of the respondents, whereas educational status, monthly income, and alcohol consumption could predict their mental health.

1. Introduction

1.1. Background

The World Health Organization (WHO) predicts that the proportion of the global population aged 60 years and older, namely older adults, will reach nearly 12% in 2030 and 16% in 2050, and that by 2030, 1.4 billion people will be 60 years and older worldwide, with the large majority living in low- and middle-income countries [1]. There are significant variations in the pace of population aging in present-day developing countries compared to countries that developed earlier [2,3]. WHO [3] predicts that developing countries such as Brazil, China, and India will have slightly more than 20 years to adapt to rapid population aging—whereby the population of adults 60 years and older rises from 10% to 20%—whereas in some countries that developed earlier, it took approximately 150 years to experience the same change in the share of older adults. In the People’s Republic of China (China), the Seventh National Population Census 2021 [4] predicted that the country will become a moderately aging society by 2025, with 20% of the population aged 60 years and older, and will become a severely aging society by 2035, with 400 million people, or 30% of its population, 60 years and older. To accommodate the growing need for long-term care and support for older adults, the Ministry of Housing and Urban–Rural Development of China developed two building regulations for long-term care facilities, the “Code for Design of Residential Building for the Aged (GB 50340-2016)” in 2016 [5] and the “Standard for Design of Care Facilities for the Aged (JGJ 450-2018)” in 2018 [6]. However, home-based care remains the dominant type of care for most older adults in China, and design standards for care facilities for older adults are not applicable to the care environments for home-living older adults. Several guidelines [7,8,9] have summarized typical environmental qualities affecting residents’ health and well-being at home, including noise, lighting and view, temperature and humidity, and air quality, suggesting that improvements in the quality of life of home-living older adults can be achieved by controlling these four environmental factors at their homes. It could be necessary to conduct further exploration of the care environment needs for home-living older adults.

1.2. Literature Review

1.2.1. Housing Environmental Qualities and Health: General Knowledge

As proved by various investigations [7,8,10], people who have lived in urban houses with poor environmental conditions for a long period may suffer from both mental and physical health problems. Thus, the World Health Organization (WHO) has clearly pointed out that improved housing conditions can save lives, prevent disease, increase quality of life, and help mitigate climate change [9].
First, noise was identified as a critical environmental stressor in housing [9]. For a Swedish study in multi-story residential buildings, the noise exposure brought by neighbors was strongly associated with eight different physical and mental health symptoms of occupants, such as pain in various body parts, headache, fatigue, depression, and anxiety [11]. A cross-sectional survey has found that the noise from outdoor urban environment can clearly increase the risk of adverse effects on wellbeing [12]. Second, the positive effect of daylighting on occupants’ health has been well recognized [13]. Daylighting can generally improve vision and relieve depressive symptoms in the built environment [14]. Improving daylighting availability in the home can take significant impact on emotional wellbeing, especially for women and young people [15]. A cross-over study demonstrated the impact of daytime lighting on the physiological, behavioral, and subjective measures of circadian health in a residential building and stressed the importance to optimize daylight availability for human health and wellbeing in homes [16]. Third, the association between indoor temperature and humidity and occupants’ physiological and psychological performances was generally found in a living space [17,18,19]. In Japan, the intensive room heating in winter decreased morning blood pressure when compared with weak room heating (room temperature: 10 °C lower) [17], whilst the housing coldness/warmth evaluation was significantly related to psychological distress [18]. Long-term exposure to high humidity can not only increase the risk of respiratory diseases such as asthma and rhinitis [19,20], but also create a psychological burden [21]. Fourth, due to the adverse effects of air pollution on public health, residents had a preference for living in housing with better air quality [22,23]. Last, some research has shown that cleanliness is the most important individual variable influencing occupant satisfaction with the overall environment [24].

1.2.2. Housing Environmental Qualities and the Health and Well-Being of Older Adults in Foreign Countries

Indoor environmental quality for older adults’ homes must be maintained at a high level [25]. Indoor environmental factors such as temperature and humidity, lighting and view, noise, and air quality can have a significant impact on the physical health of older individuals [26].
First, as older adults’ physiological functions gradually decline with age, indoor temperature can directly affect their health [27]. An Australian study showed that older adults living in homes with poor thermal insulation in winter were more likely to develop bronchitis and pneumonia [28]. A study among older men suggested that maintaining a relative humidity higher than 30% could help avoid dryness of the eyes and skin, whereas a relative humidity of ≥10% was required to avoid dryness of the nasal mucous membrane [29]. The study also found that older men feel cooler than younger adults at lower humidity levels [29]. A Scottish study found that low indoor temperatures (<21 °C) combined with low humidity (<40%) can cause very dry skin conditions among home living older adults and although older people could perceive a change in room temperature, they could not always perceive humidity changes [30].
Second, studies have suggested that the quality of light has a clear impact on the quality of life of older adults; thus, enhanced lighting may be a significant environmental factor in promoting healthy aging at home [31]. Owing to vision deterioration with age, adults 60 and older may need more light to improve their visual function and physical and mental health [31]. For older individuals, increasing lighting levels can reduce the risk of fall and resultant fractures and other injuries [32]. There is also an association between visual impairment in older people and mental health problems such as loneliness, depression, and anxiety [33], and light exposure can be used to improve older adults’ quality of life and social and emotional state [34]. Furthermore, good nighttime sleep quality in older adults can be achieved by adjusting the illuminance level and light spectra of living spaces [35].
Third, environmental noise experienced by home-living older adults includes traffic noise, internal noise from indoor equipment, and neighbor noise [36]. Long-term exposure to noise may increase the risk of cardiovascular diseases among older adults [36]. Additionally, they may experience significant psychological distress after perceiving noise [37].
Fourth, a study concluded that both outdoor and indoor household air pollution are significantly correlated with mental disorders in older individuals, including anxiety, stress, depression, mood disorders, suicidal behavior, cognitive impairment, and dementia [38].
Last, the cleanliness of older adults’ living environment is associated with their health [39].

1.2.3. Housing Environmental Qualities and the Health and Well-Being of Older Adults in China

China’s rapidly increasing older adult population has challenged local governments to improve living conditions and arrangements for older adults and their families [40]. Since 2016, the government has established building regulations to promote efficient solutions for the planning and construction of long-term care facilities for older adults such as residential care homes and nursing homes [5,6]. These regulations [5,6] mostly focus on spatial design and ergonomic aspects, with scant attention to indoor environmental qualities (noise, lighting and view, temperature and humidity, and air quality). However, recent Chinese investigations have explored the effects of these environmental qualities on the health and well-being of older adults in care facilities. A study conducted at the aged-care center in Chongqing (latitude: 29°33′49″ N; longitude: 106°33′01″ E) showed that humidity variations in residential buildings may affect cardiorespiratory function in older adults [41], and good indoor air quality can substantially improve the cardiopulmonary health of older adults [42]. A survey of residential care homes in Southern China revealed that indoor temperature and artificial lighting in winter and summer were positively correlated with overall satisfaction among residents, whereas street noise was negatively related to residents’ satisfaction [43]. Considering China’s northern location with a cold climate, another study concluded that Chinese residents’ overall satisfaction was associated with indoor environmental qualities (noise, lighting and view, temperature and humidity, and air quality) in care facilities for older adults [44]. A mixed-model investigation in Chinese nursing homes found that the quality of life and cognitive function of older adults with dementia were significantly affected by both indoor environmental factors and supporting facilities [45]. Most elderly care facilities provided accommodation, meals, and medical care for the older adults, and the personnel had different requirements for the indoor physical environment of different functional rooms [44]. According to a study on the residential environment of older adults in Xiangxi [46], the indoor environmental factors (e.g., air quality, lighting environment, hygiene environment and noise) can affect overall satisfaction among older residents and these effects differed in location (ancient town). In addition, nursing facilities had more stringent indoor environment requirements than general buildings [47].
In China, compared with professional care facilities, the home-based care environment cannot meet the growing needs of older adults, and there were still some environmental problems found in such homes [48]. A longitudinal study demonstrated that the physical and mental health of both middle-aged and older adults can be impaired by a long-term exposure to air pollutants at their homes [49]. Another study conducted in public and subsidized (P&S) houses showed that the cleanliness of older adults’ living environments was associated with their physical health [50]. It has been further found, in a longitudinal population-based study, that home tidiness can positively affect depressive symptoms among older adults [51]. In addition, a cross-sectional study concluded that home lighting, noise, air quality, and cleanness may have a clear impact on the mental health of older adults [52]. However, the home-based care environment for older adults has not been fully investigated according to the impact of indoor environmental factors on health and wellbeing of old occupants in China [48].

1.3. Research Problems

First, most Chinese studies on the association between indoor environment and older adults’ satisfaction and physical and mental health were conducted in professional care facilities (residential care homes or nursing homes) [41,42,43,44]. Thus, there remains a lack of knowledge regarding the effects of indoor housing environmental factors on the satisfaction and physical and mental health of home-living older adults.
Second, scant available studies have explored the improvement of overall satisfaction and physical and mental well-being of older adults using multiple environmental interventions in existing Chinese residential buildings. Considering that home-based care remains the main model for the care of older adults in China [53], this study posited that further exploration of the interaction between home-living older adults and their living environment is required.
Third, in terms of research investigation methods, most previous studies adopted physical environmental measurement (e.g., temperature, lighting, humidity) as the main approach to assess environmental qualities [41,43,44]. However, the perception mechanism of indoor environments by older adults and its association with satisfaction and health status (physical and mental) have not been fully understood. It could be hard to deny that the perception of home environment was directly associated with satisfaction and health of old adults [52]. Therefore, this study would also highlight the necessity to evaluate perceived environmental factors using a subjective measure among old adults at their homes.

1.4. Research Questions

In this study, we conducted a cross-sectional survey (a sample survey of a specific population within a certain range at a given point in time [54]) during the COVID-19 pandemic in Northern China (Beijing and its adjacent regions) to investigate the relationship between perceived housing environmental qualities and home-living older adults, to identify the key environmental causes of their health problems, and to propose effective strategies to improve their health and well-being through environmental and architectural design solutions. Specifically, we considered three research questions:
RQ1: 
How can perceived indoor environmental factors in houses predict older adults’ overall satisfaction?
RQ2: 
How can perceived indoor environmental factors in houses predict older adults’ physical health?
RQ3: 
How can perceived indoor environmental factors in houses predict older adults’ mental health?

2. Materials and Methods

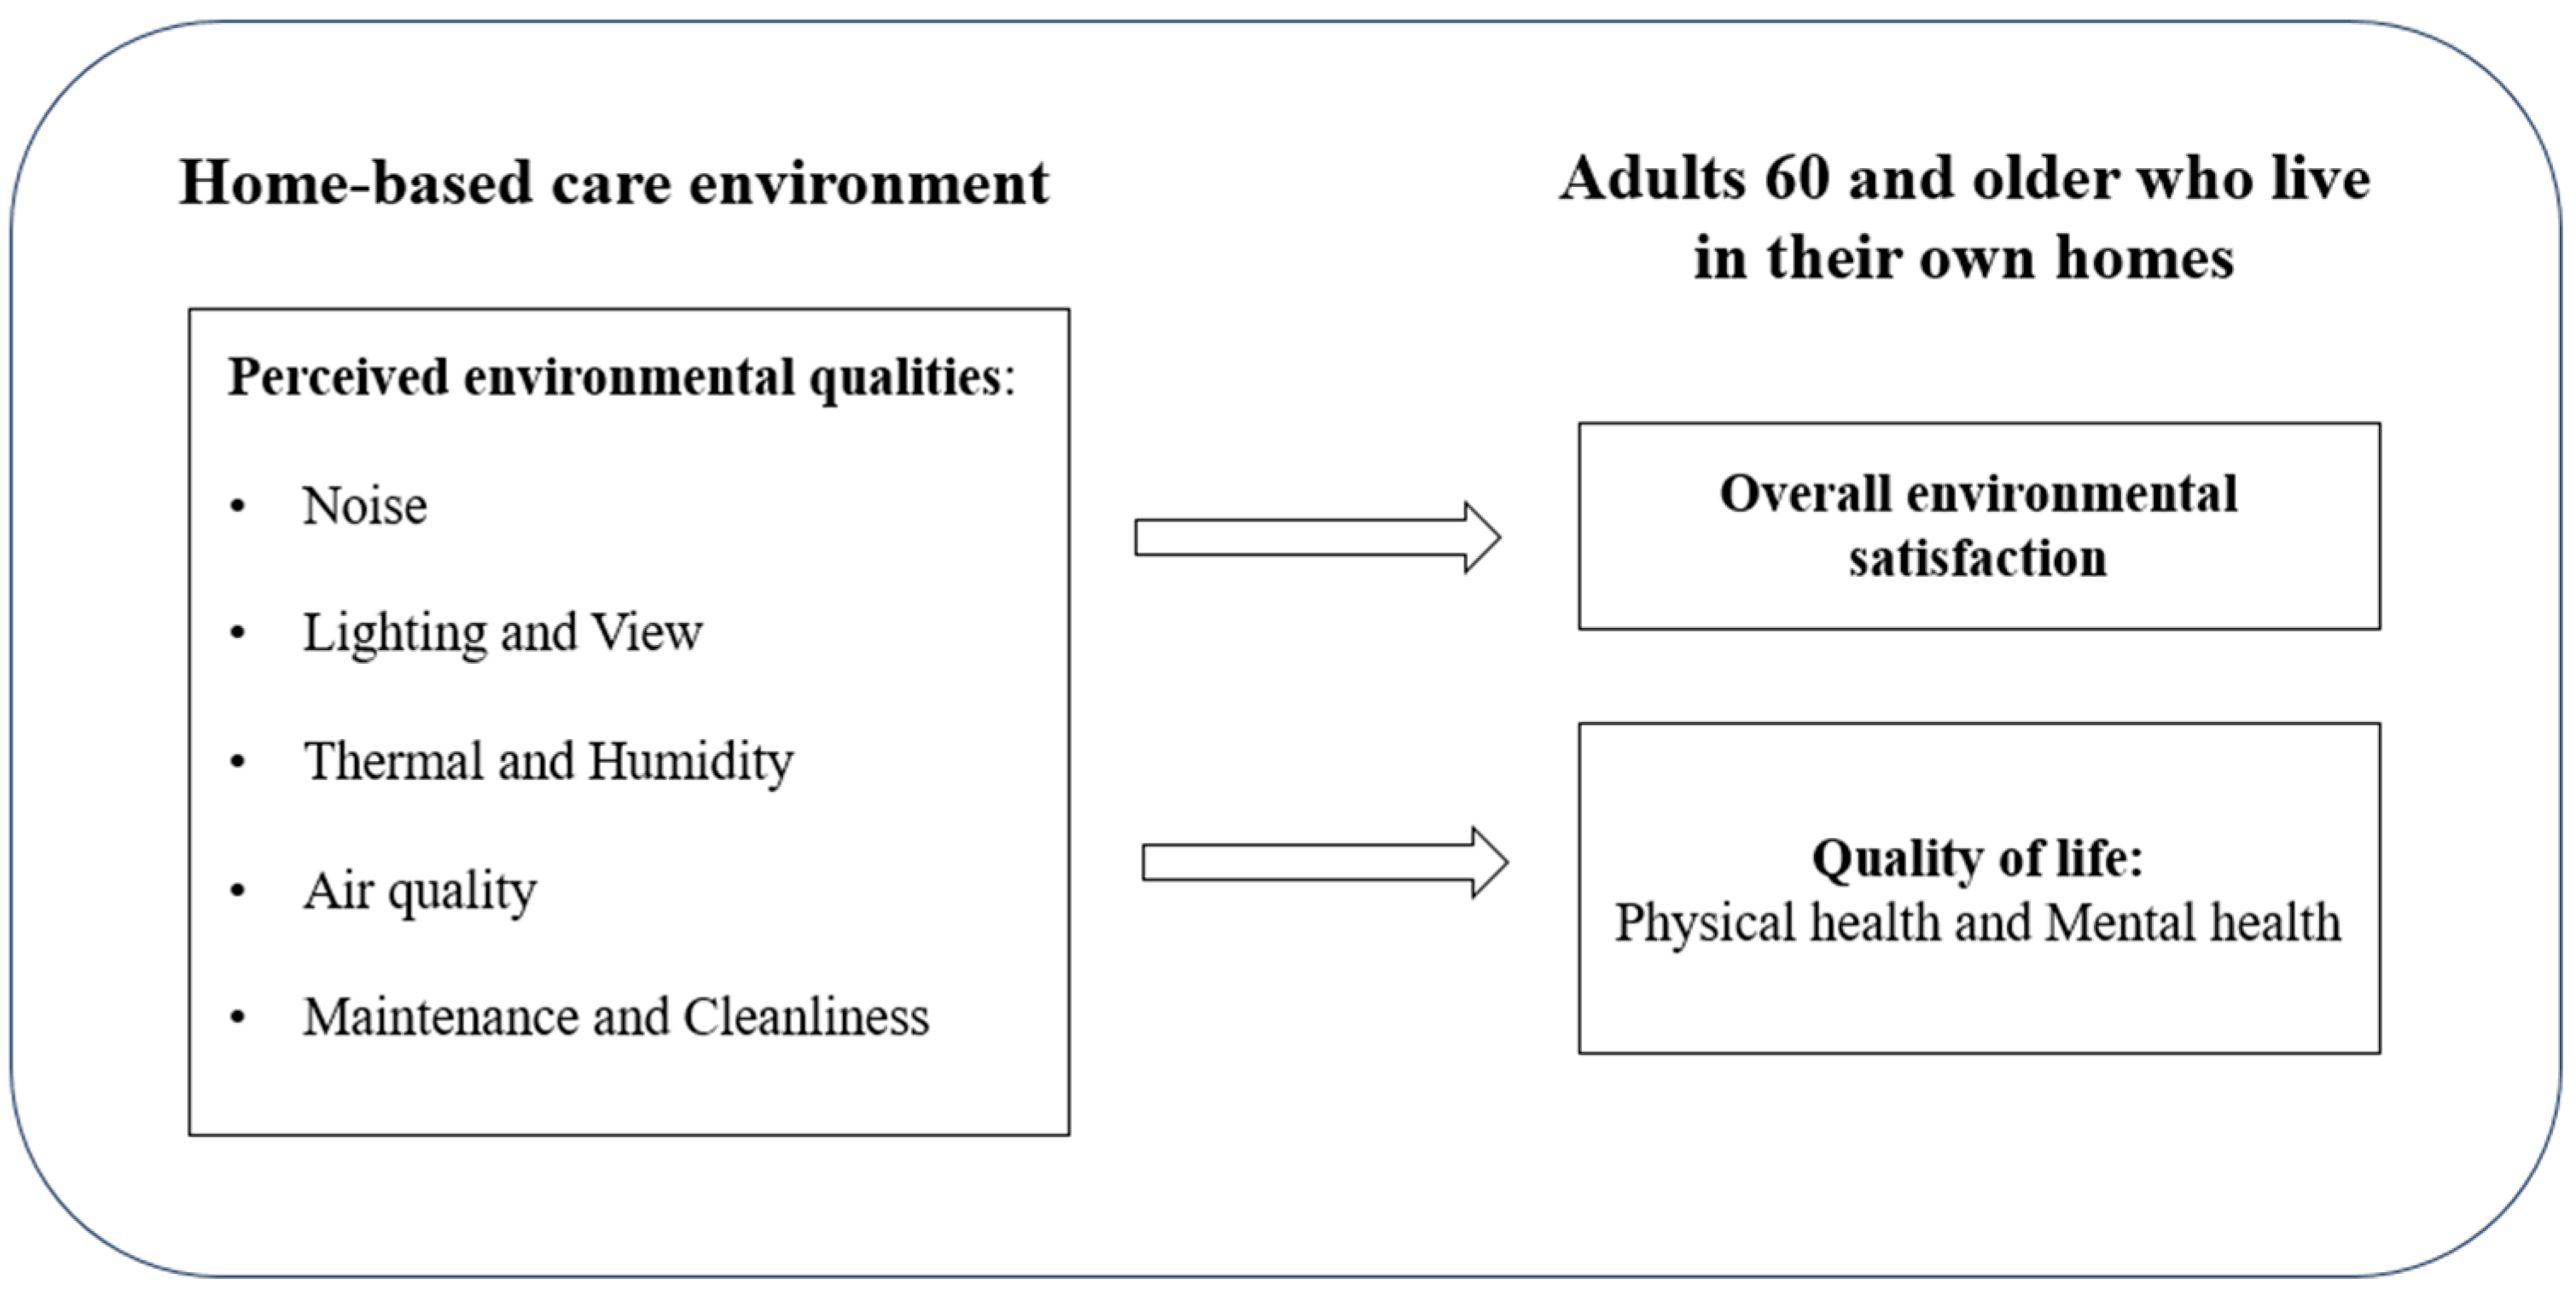
2.1. Conceptual Framework

As shown in Figure 1, we proposed a conceptual framework to explain the interaction between perceived housing environmental factors and overall satisfaction and quality of life among the older adult Chinese population receiving home-based care.

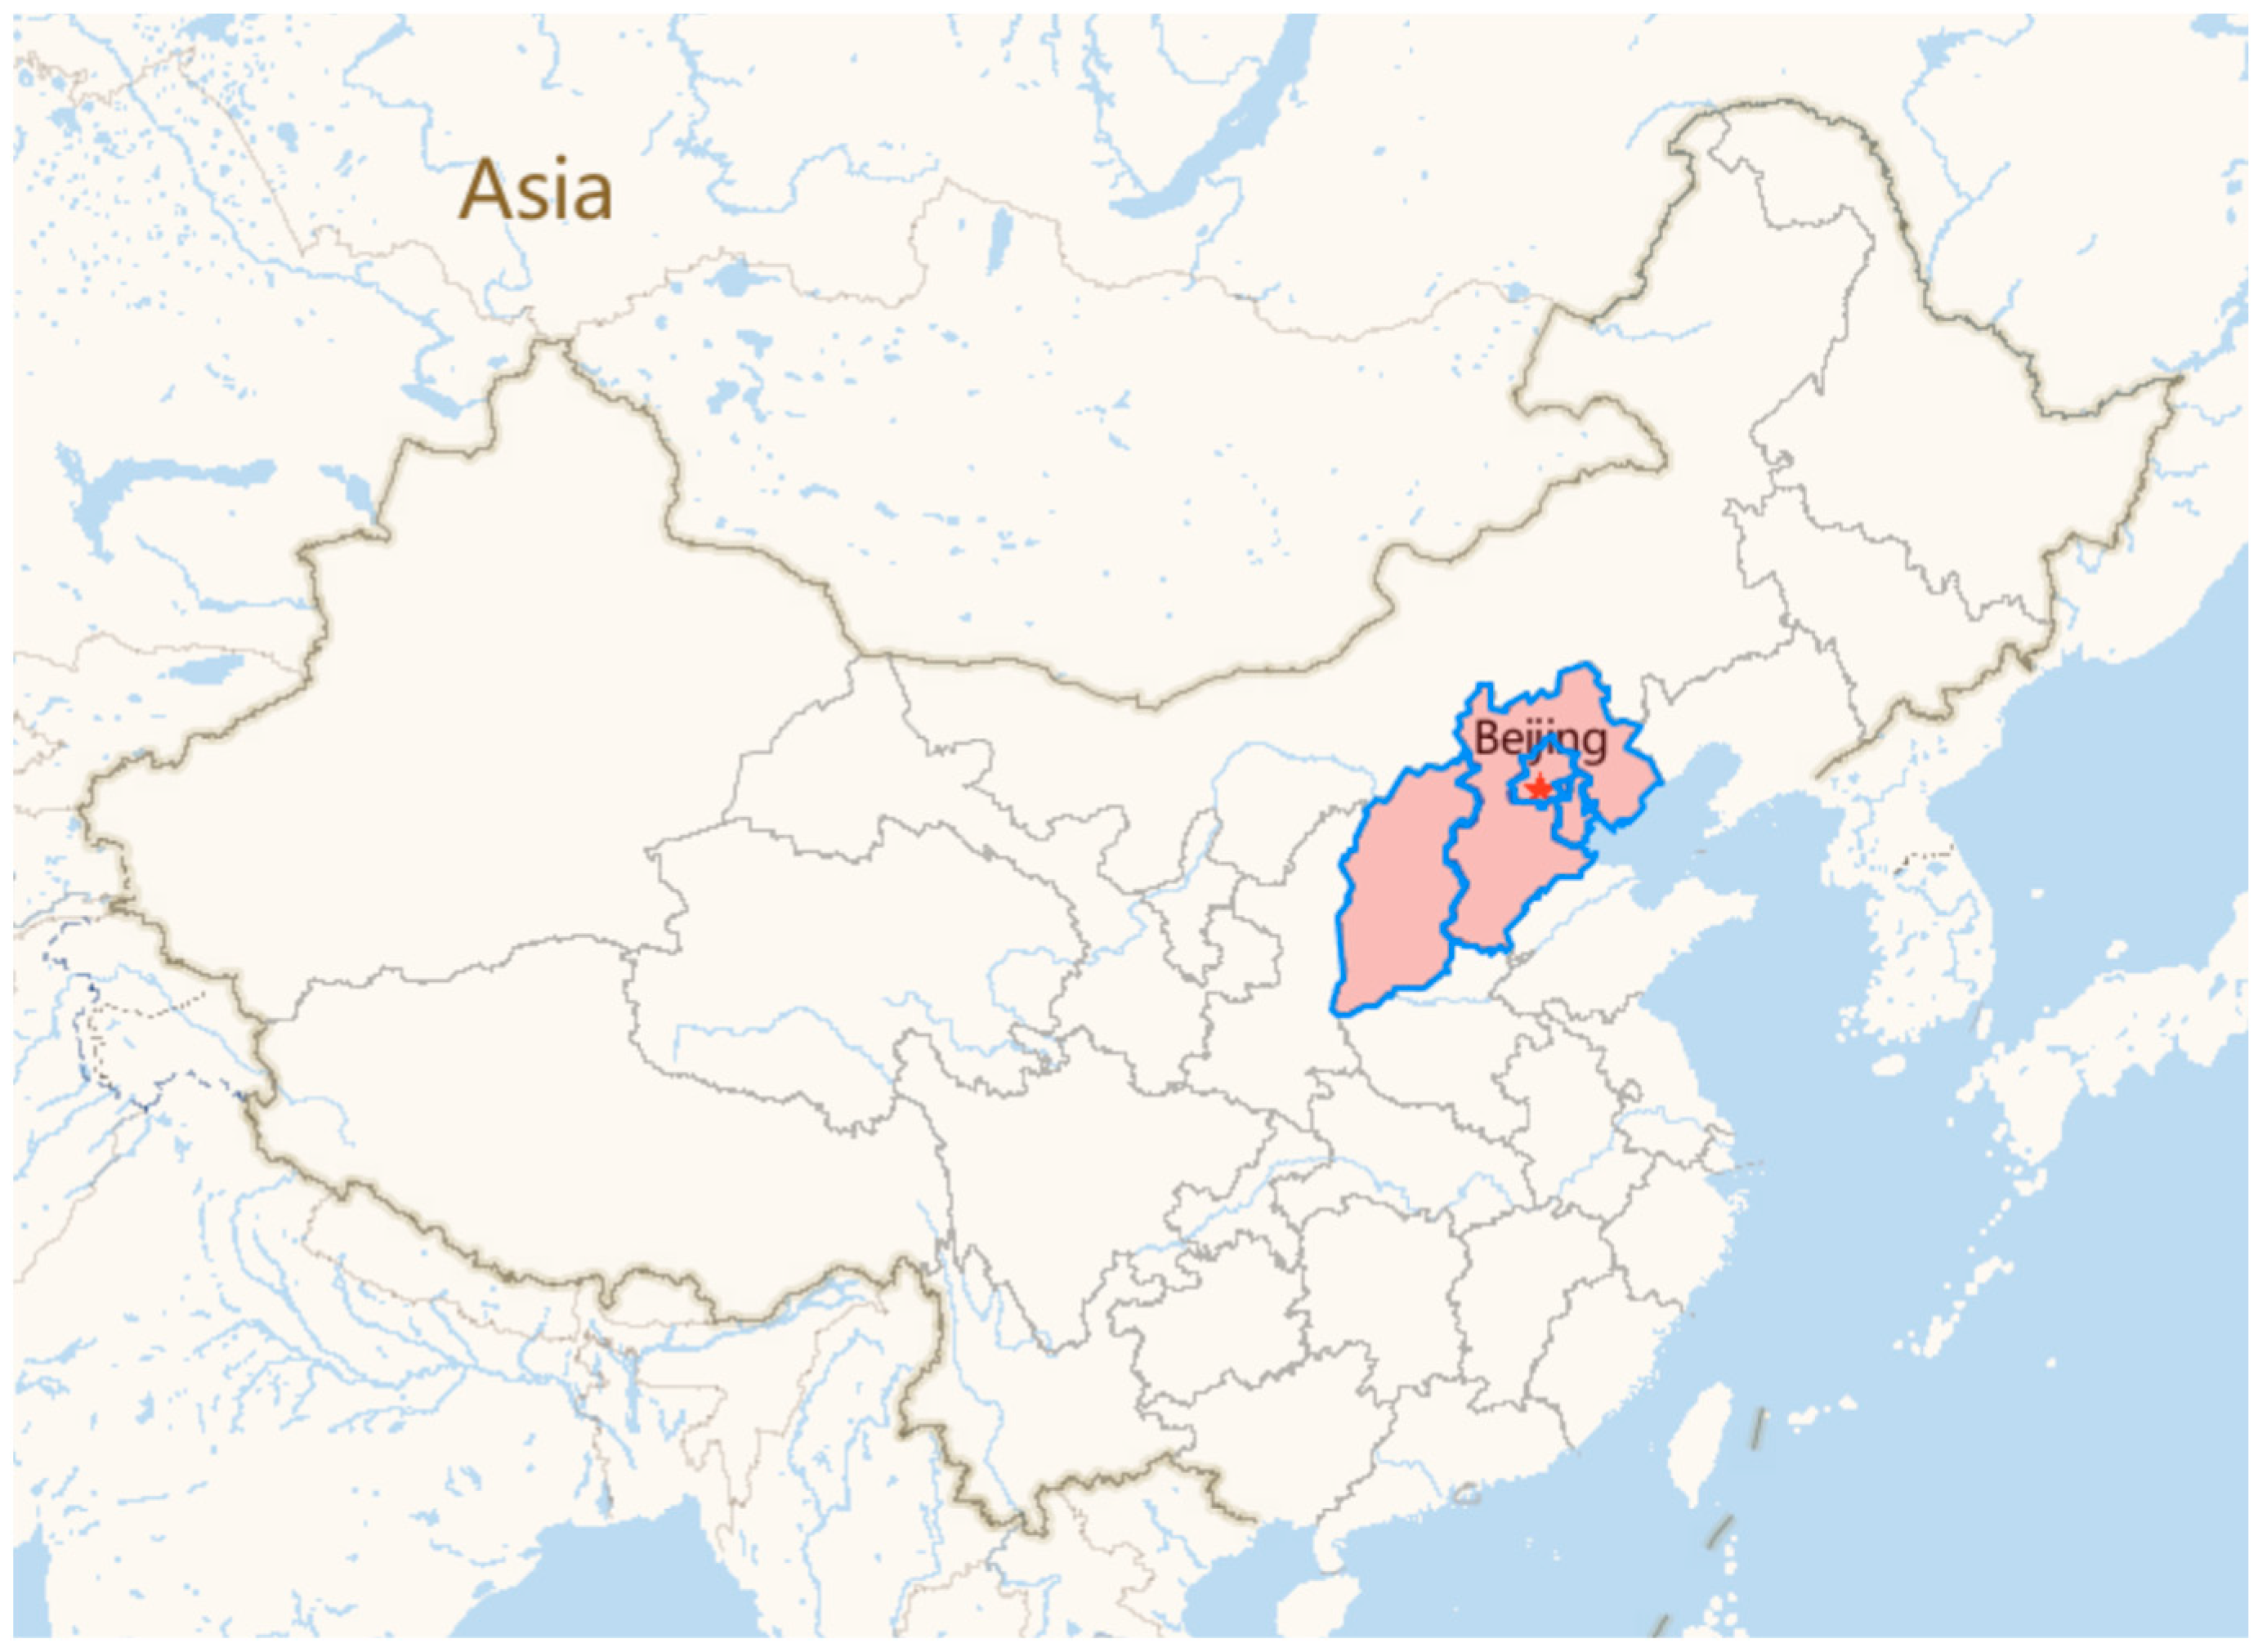
2.2. Survey and Respondents

Owing to the limitations imposed by the COVID-19 pandemic, we conducted an online structured survey in Northern China (Beijing and its adjacent regions, shown in Figure 2) (October 2021 to March 2022). The survey’s self-report questionnaire was completed using Sojump (www.sojump.com, accessed on 10 October 2021), and the relevant link was randomly distributed via the social media website WeChat (www.wechat.com, accessed on 12 October 2021). To ensure the validity of the survey data, inclusion criteria included:
  • Chinese adults 60 years and older
  • normal cognitive functions (no Alzheimer’s disease, normal memory, and logical thinking)
  • no serious hearing (hearing aid needed) or visual impairments (suffer from glaucoma or age-related macular degeneration [55])
  • receiving care at home
  • ability to respond to survey questions
  • provided voluntary consent to participate in the study
Figure 2. The map of Beijing and its adjacent regions.
Buildings 13 02875 g002
A total of 356 valid questionnaires were collected. Table 1 summarizes respondents’ demographic and socioeconomic characteristics. Approximately 59% of respondents were female. Among respondents, 55.6% were 60–69 years old, and 44% were older than 70. In this study, the percentage of respondents with educational levels of a certificate of secondary school and below, high school, and college and above were 47.5%, 25.5%, and 26.9%, respectively. Most respondents (82.3%) lived with their partners. The number of respondents with a monthly income of RMB 2000–3000 (USD 300–450) was slightly higher than that of other groups. Over half of the respondents (59.5%) had a monthly income of RMB 2000–5000 (USD 300–750).
Regarding lifestyle, 88.5% of respondents were not current smokers [56], and 52% considered themselves current drinkers [57]. According to a study on alcohol consumption among the Chinese population [57], current drinkers were divided into three groups: light, moderate, and heavy drinkers. Respondents who identified as light drinkers (38.8%) were the largest population in this survey. Regarding intensity of physical activity, over half of our study’s respondents (68.5%) were light exercisers (e.g., walking), which was higher than the number of moderate exercisers (e.g., yoga, tai chi; 17.4%) and the number of vigorous exercisers (e.g., running, table tennis; 3.7%) [58].
The data on health status revealed that 43.3% and 45.2% of respondents suffered from cardiovascular diseases (e.g., stroke, coronary heart disease, myocardial infarction) [59] and chronic diseases (e.g., diabetes, hypertension, hypercholesterolemia) [60], respectively.
Table 1. Demographic and socioeconomic characteristics of respondents.
VariableItemnPercentage
SexFemale21059
Male14641
Age60–69 years19855.6
70–79 years12234.3
≥80 years3610.1
Educational statusPrimary school and below8022.5
Secondary school8925
High school5515.4
High school (professional education)3610.1
College4612.9
University and above5014
Marital statusMarried29382.3
Single30.8
Widowed5014
Divorced102.8
Other00
Monthly incomeBelow RMB 2000 (USD 300)6217.4
RMB 2000–3000 (USD 300–450)8223
RMB 3000–4000 (USD 450–600)7721.6
RMB 4000–5000 (USD 600–750)5314.9
RMB 5000 (USD 750) and above6618.5
Do not want to say164.5
Smoking statusNever smoked23064.6
Current smoker4111.5
Former smoker8523.9
Alcohol consumptionNon-drinker17148
Light drinker13838.8
Moderate drinker3610.1
Heavy drinker113.1
Physical activity intensityNever3710.4
Light24468.5
Moderate6217.4
Vigorous133.7
Health: cardiovascular diseasesYes15443.3
No19554.8
Health: chronic diseases (noncardiovascular)Yes16145.2
No19554.8

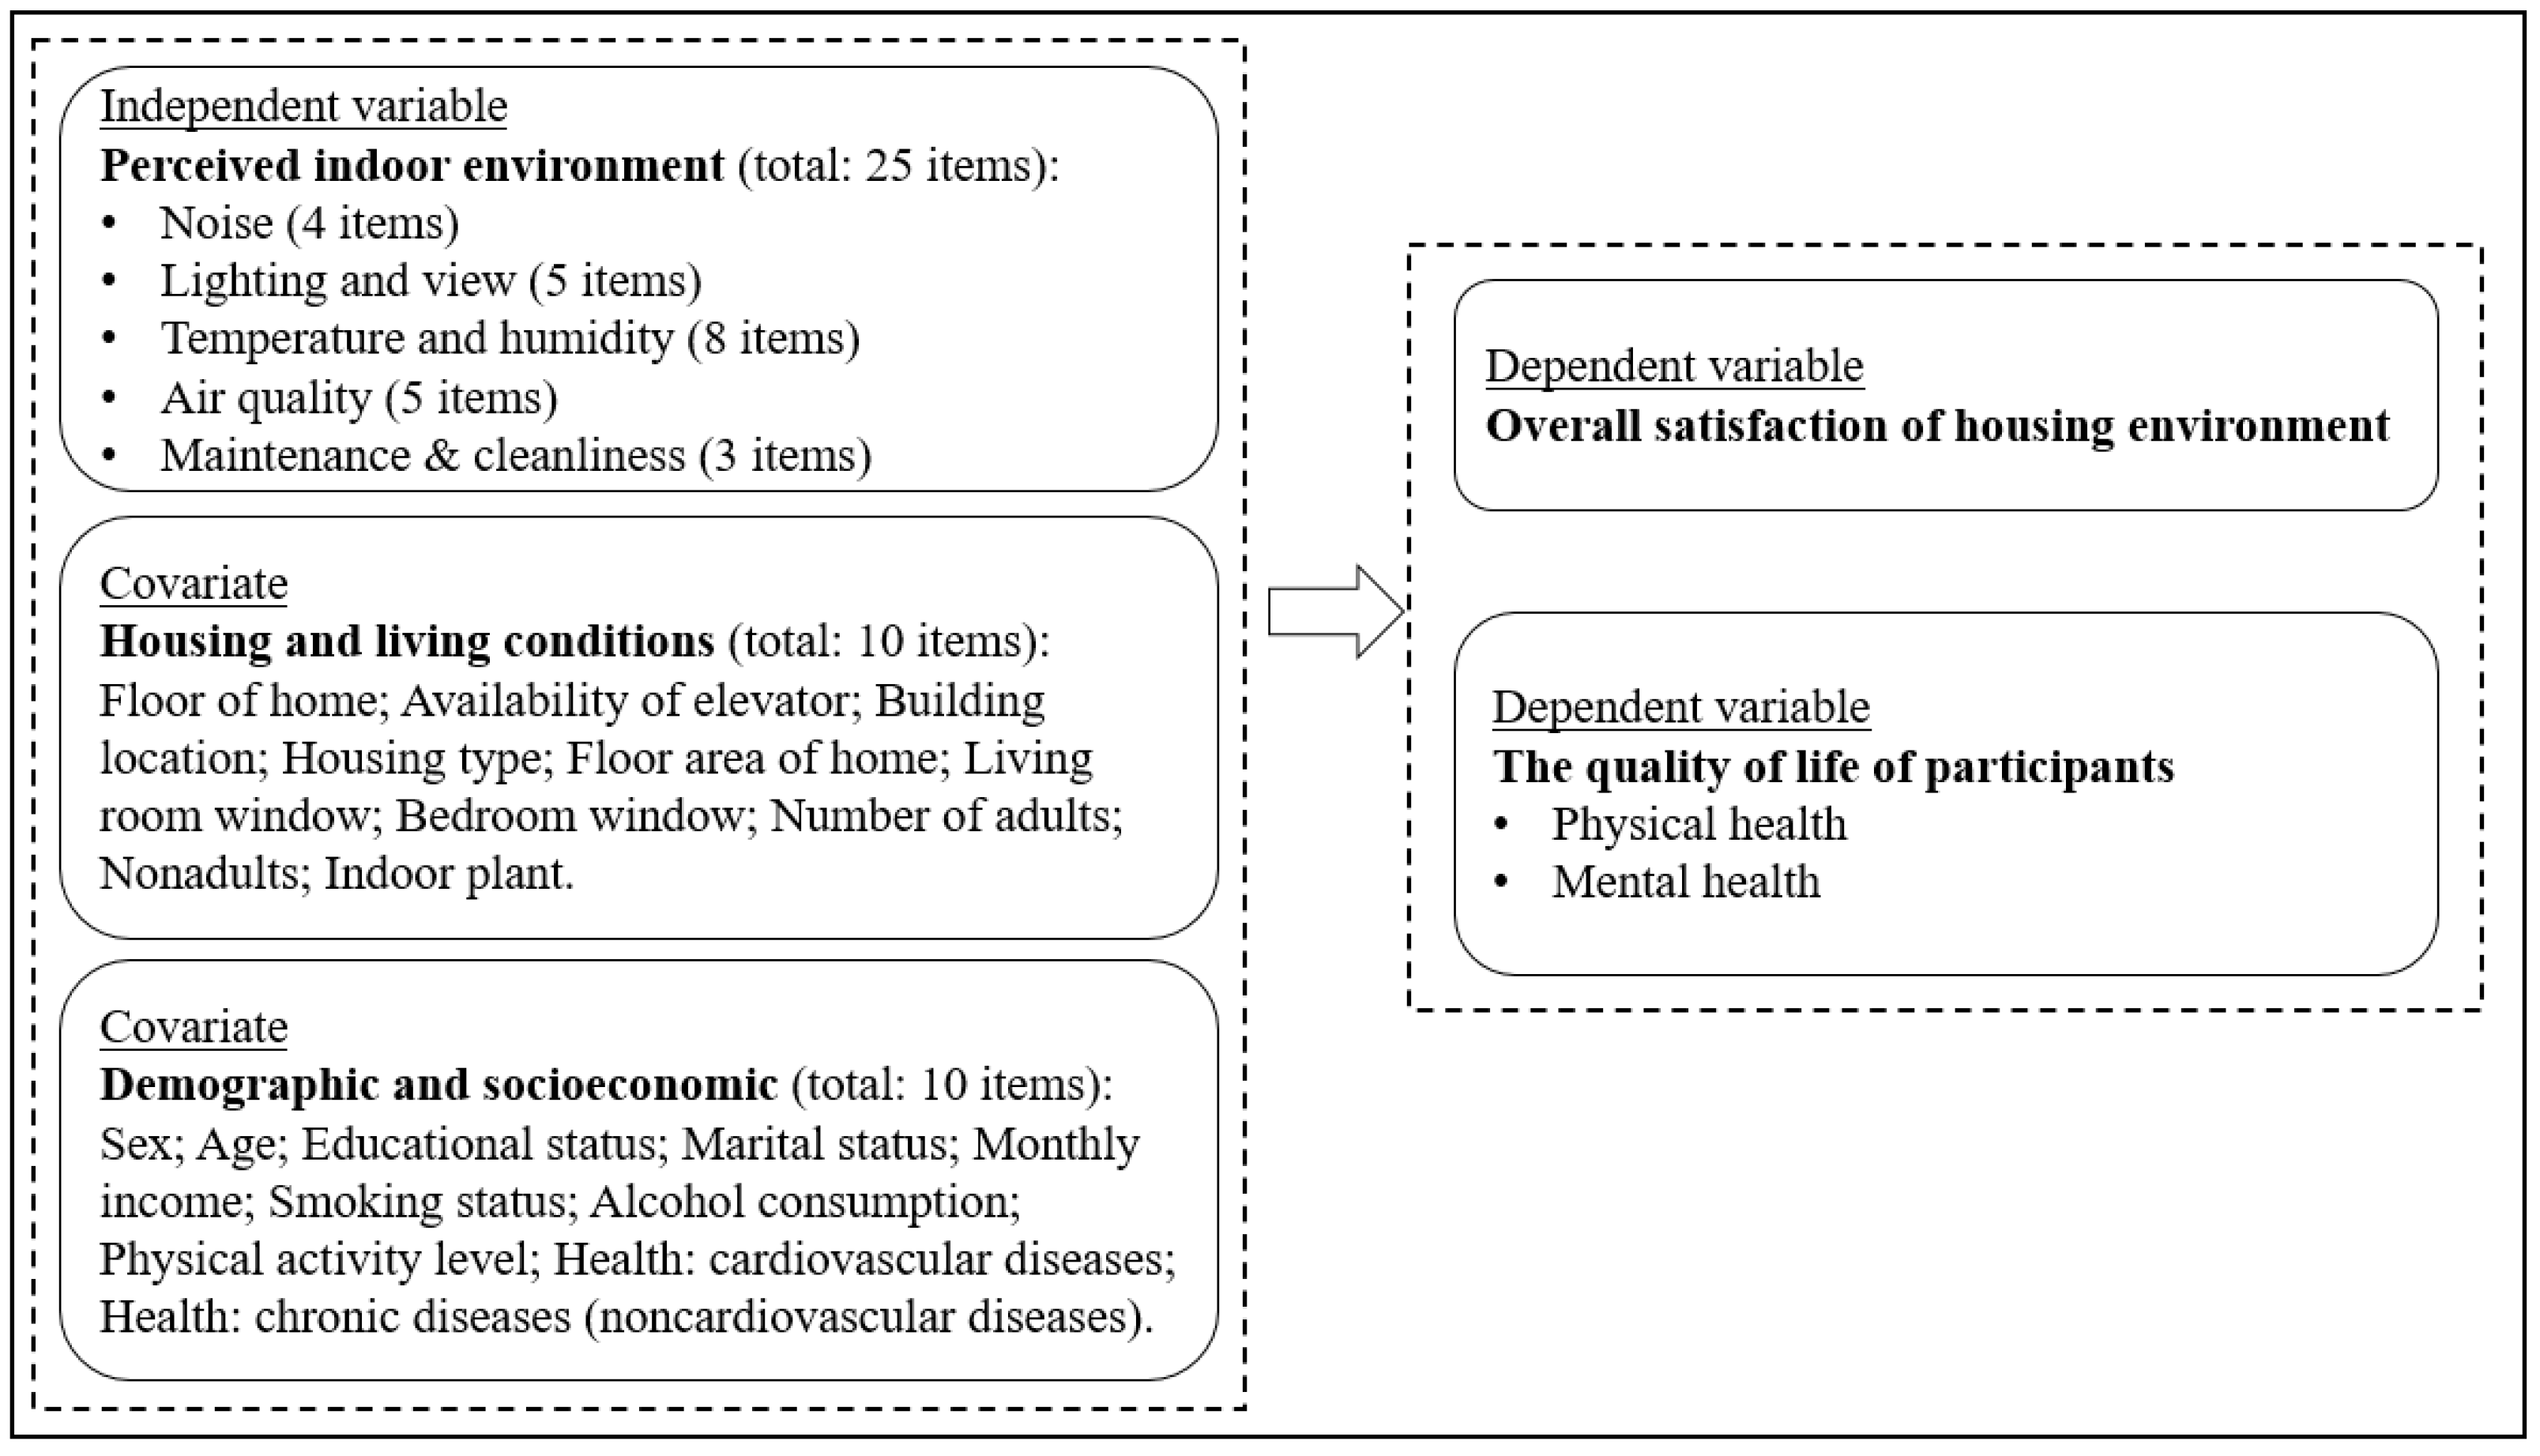
2.3. Research Design and Measures

The structure of the survey questionnaire is shown in Figure 3. Perceived housing environment was set as the key independent variable, and dependent variables included respondents’ overall satisfaction with the housing environment and quality of life. Covariates were applied in terms of two dimensions: housing and living conditions and demographic and socioeconomic information.
The measure of perceived housing environment in respondents’ homes comprised five domains (25 items): noise (four items) [61,62], lighting and view (five items) [63,64], temperature and humidity (eight items) [65,66], air quality (five items) [67], and maintenance and cleanliness (three items) [68]. Developed by the authors, this instrument tested the psychological perception of the indoor physical environment among this study’s respondents. The scale consisted of 25 items on a 5-point Likert scale ranging from 5 (strongly agree) to 1 (strongly disagree).
Respondents’ quality of life was measured using the 12-item Short Form Health Survey instrument (SF-12) [69], which was developed and validated for evaluating the physical and mental health-related quality of life of various population groups, including older adults. The instrument contains eight health subscales, including general health (GH), physical functioning (PF), role limitations due to physical problems (RP), bodily pain (BP), vitality (VT), role limitations due to emotional problems (RE), social functioning (SF), and mental health (MH). These eight subscales are categorized into two distinct domains: the physical component summary (PCS) and the mental component summary (MCS) [70]. The MCS includes VT, SF, RE, and MH, and the PCS includes PF, RP, BP, and GH. Scores are obtained for each item and are standardized using the following algorithm [71]: final score = 100 × (original score of the item − lowest score of the item)/(difference between highest and lowest scores of the item). The scores for each subscale range from 0 to 100, with 50 as the median. Higher scores indicate better health. The instrument’s effectiveness for assessing the health status of older adults has been proven [72]. Furthermore, overall satisfaction of housing environment was measured based on single item: “Overall, you are currently satisfied with the indoor environment at your home”. This measure was adapted from an instrument used in a European Union research project on housing and health [73].
For the covariate, ten items were used to measure respondents’ housing and living conditions [68,74,75], including the floor of the home, availability of elevators, building location, housing type, and floor area of the home. Additionally, respondents’ demographic, socioeconomic, and general health statuses [76,77] were collected, including sex, age, educational status, marital status, monthly income, lifestyle (physical activity level, smoking, and alcohol consumption), and health status (cardiovascular diseases and chronic diseases).

2.4. Data Analysis

This study used IBM® SPSS® Statistics 26.0 to analyze the collected data. Several statistical models were used. Reliability and principal component analyses (PCAs) [78] were conducted to validate the scale of perceived housing environment. Descriptive statistics were applied to show the frequency distributions and quantities of demographic and socioeconomic characteristics of respondents and their housing and living conditions. Pearson correlation analysis was conducted to test correlations between independent and dependent variables. In addition, following the method of a survey study [79], a series of multiple linear regressions were implemented to explore the predictors of overall satisfaction and physical and mental health among the respondents. Three regression models were used: Model 1, Model 2, and Model 3. Model 1 only tested the predictive effects of five perceived environment factors, while Model 2 indicated how the effects of these five factors can be adjusted by respondents’ housing and living conditions (10 items). Moreover, the adjustment of demographic and socioeconomic characteristics of respondents (10 items) on the effects of environmental and housing conditions (Model 2) was tested in Model 3.

3. Results

3.1. Description of Housing Conditions

Table 2 presents the descriptive statistics of respondents’ housing and living conditions. Most respondents (73%) lived in a multistory building. Around 29.8% of respondents lived in buildings with between 4 and 6 floors, while 23.8% of respondents lived in a building with over seven floors. Among respondents, 59.8% indicated that the building in which they lived did not have elevators. Regarding building location, 52.6% and 23% of respondents lived in urban areas and rural areas, respectively, while 34.3% of respondents lived in non-city center urban areas. Two-bedroom and three-bedroom homes (45.8% and 35.7%, respectively) were the most common home types. The floorage of over half of respondents’ homes (60.4%) were between 50 and 100 m2, while 32.3% of respondents had a home floorage of over 100 m2. Most respondents had windows in their living rooms (92.4%) or bedrooms (98.3%). Among respondents, 65.4% lived with adults only. The mean number of adults living in respondents’ households was 2.79 (±1.19), and the mean value of the number of indoor houseplants was 2.41 (±0.86).

3.2. Scale of Perceived Housing Environment: Principal Component Analysis (PCA) and Reliability

Because the instrument for perceived housing environment was self-developed, its validation and reliability were conducted based on the surveyed data. Table 3 gives Principal Component Analysis (PCA) and reliability analysis [78] of the scales, including noise, lighting and view, temperature and humidity, air quality, and maintenance and cleanliness. First, the KMO (Kaiser–Meyer–Olkin) test (0.929) and Bartlett’s test (χ2 = 4714.735, df = 300, p < 0.001) indicated that the scale was accepted for the factor analysis. Next, to identify the factor structure of the scale and integrate the complex variables into a few core factors, PCA was used to extract the 25 items from the scale into five factors with eigenvalues greater than one. These factors revealed different dimensions of older people’s perception of the indoor physical environment and explained 62.798% of the total variance. The results indicated that the five extracted factors effectively reflected most of the information in the original data and delivered good representativeness. Factor loadings are coefficients that explain the association between the items and the factors [80]. The range of factor loadings for each item was between 0.63 and 0.91, indicating that all items were clearly classified [80]. Additionally, the reliability analysis concluded that the internal consistency values (Cronbach’s alpha) of the five factors ranged from 0.787 to 0.884, which were all higher than the minimum critical value of 0.7 [78]. Therefore, a high level of reliability was achieved with this scale.

3.3. Descriptive Statistics and Correlation Analysis

Table 4 presents the descriptive statistics and correlation analysis between the five environmental variables, overall satisfaction, and the two health measures.
The mean values of five environmental variables and overall satisfaction were within the range of 3–4. The mean score of mental health was 47.78 ± 9.44, and the mean score of physical health was 41.52 ± 7.07. Pearson correlation analysis revealed significant positive correlations between overall satisfaction and each factor of the perceived housing environment (p < 0.01), among which the highest correlation was air quality (r = 0.642), and the lowest correlation was noise (r = 0.411). All five environmental factors positively correlated with respondents’ physical health, with air quality (r = 0.228, p < 0.01) as the most correlated factor and the lighting and view (r = 0.120, p < 0.05) as the least correlated factor. Furthermore, significant positive correlations were found between mental health and all five environmental factors (p < 0.01), with the most and the least correlated factors as noise (r = 0.255) and the lighting and view (r = 0.198), respectively.

3.4. Effect of Perceived Housing Environment on Overall Satisfaction

Table 5 presents the results of the three regression models that predict the effect of the independent variables on overall satisfaction (outcome variable). In the linear regression models, B (regression coefficient) indicates the level of influence on the dependent variable by the independent variables, and SE means standard error.
  • Model 1: Model 1 indicated that there was a significant predicting role of the four environmental variables for overall satisfaction (adjusted R2 = 0.520): lighting and view (B = 0.239, p < 0.01), temperature and humidity (B = 0.350, p < 0.01), air quality (B = 0.231, p < 0.01), and maintenance and cleanliness (B = 0.135, p < 0.01).
  • Model 2: When housing and living conditions were entered into the regression model (Model 2), the four environmental variables still significantly predict overall satisfaction (adjusted R2 = 0.528), including lighting and view (B = 0.218, p < 0.01), temperature and humidity (B = 0.342, p < 0.01), air quality (B = 0.220, p < 0.01), and maintenance and cleanliness (B = 0.159, p < 0.01).
  • Model 3: After controlling for demographic and socioeconomic status and housing factors, Model 3 (adjusted R2 = 0.518) showed the same results as Models 1 and 2: a significant predicting role of lighting and view (B = 0.223, p < 0.01), temperature and humidity (B = 0.344, p < 0.01), air quality (B = 0.208, p < 0.01), and maintenance and cleanliness (B = 0.152, p < 0.01). However, the effects of noise, housing conditions, and demographic and socioeconomic statuses on overall satisfaction were not significant (p > 0.05). Additionally, there were no significant differences among the R2 values of the three models (p > 0.05).
Table 5. Multiple regression analysis with the overall satisfaction as outcome variable.
VariableModel 1Model 2Model 3
BSEBSEBSE
Constant0.0970.198−0.6100.494−0.6230.563
Noise0.0400.0450.0510.0450.0620.047
Lighting and view0.239 **0.0610.218 **0.0620.223 **0.064
Temperature and humidity0.350 **0.0670.342 **0.0690.344 **0.071
Air quality0.231 **0.0730.220 **0.0750.208 **0.077
Maintenance and cleanliness0.135 **0.0490.159 **0.0510.152 **0.053
Floor of home 0.0520.0330.0650.035
Elevator 0.1460.0860.1630.089
Building location 0.0030.025−0.0110.028
Housing type 0.0710.0470.0740.048
Home area 0.0830.0620.0880.063
Number of adults −0.0490.027−0.0480.028
Nonadults −0.1050.068−0.0910.070
Living room window 0.1510.1200.1600.124
Bedroom window 0.0330.2360.0070.248
Indoor plants 0.0380.0370.0320.040
Sex 0.0430.069
Age −0.0050.051
Educational status −0.0170.023
Marital status 0.0070.032
Monthly income −0.0220.027
Smoking status −0.0010.044
Alcohol consumption 0.0110.047
Physical activity level 0.0080.055
Health: cardiovascular diseases −0.0090.068
Health: chronic diseases 0.0110.070
Adjusted R20.5200.5280.518
R2 0.0080.010
Significant: B = regression coefficient, SE = standard error, **. p < 0.01.

3.5. Effect of Perceived Housing Environment on Respondents’ Physical Health (PCM)

Table 6 presents the results of the three regression models predicting the impact of independent variables on physical health (outcome variables).
  • Model 1: Model 1 found significant predicting roles for air quality (B = 2.322, p < 0.01) with an adjusted R2 of 0.237.
  • Model 2: With the inclusion of housing conditions in Model 2, air quality (B = 2.409, p < 0.01) and home floor (B = 0.847, p < 0.05) significantly predict physical health. However, the increase in R2 in Model 2 was not significant (p > 0.05).
  • Model 3: After adding demographic and socioeconomic factors to Model 3, the adjusted R2 value increased significantly from 0.297 (Model 2) to 0.500 (Model 3) (p < 0.01). Compared with Model 2, the effect of noise on physical health was lower in Model 3 (B = 2.214, p < 0.01), and the effects of the home floor (B = 0.792) were maintained at a similar level (p < 0.05). In Model 3, four demographic and socioeconomic variables can significantly predict the physical health, including age (B = −1.404, p < 0.05), marital status (B = −0.732, p < 0.05), cardiovascular diseases (B = 1.726, p < 0.05) and chronic diseases (B = 3.175, p < 0.01). However, factors such as noise, lighting and view, temperature and humidity, and maintenance and cleanliness had no significant effect on physical health (p > 0.05).
Table 6. Multiple regression analysis with the physical health (PCM) as outcome variable.
VariableModel 1Model 2Model 3
BSEBSEBSE
Constant32.2932.43025.3166.08820.7136.320
Noise0.2620.5500.3570.5580.1050.526
Lighting and view−0.7950.747−1.1740.759−1.0720.720
Temperature and humidity0.5650.8240.4410.8560.3770.801
Air quality2.322 **0.8982.409 **0.9212.214 *0.864
Maintenance and cleanliness0.0660.6060.0410.622−0.3360.591
Floor of home 0.847 *0.4090.792 *0.393
Elevator 1.0321.0631.3341.004
Building location −0.1190.3130.3210.310
Housing type 0.3100.5730.0940.538
Home area 1.2040.7691.2720.713
Number of adults −0.2890.339−0.1180.315
Nonadults 0.7000.8330.1340.790
Living room window 0.0151.484−0.7311.389
Bedroom window 0.1792.9060.9602.782
Indoor plants 0.2840.4510.2170.444
Sex −0.5380.769
Age −1.404 *0.573
Educational status 0.4070.261
Marital status −0.732 *0.364
Monthly income 0.1330.302
Smoking status 0.8340.494
Alcohol consumption −0.6690.528
Physical activity level 0.9220.612
Health: cardiovascular diseases 1.726 *0.767
Health: chronic diseases 3.175 **0.785
Adjusted R20.2370.2970.500
R2 0.0600.203 **
Significant: B = regression coefficient, SE = standard error, *. p < 0.05, **. p < 0.01.

3.6. Effect of Perceived Housing Environment on Respondents’ Mental Health (MCM)

Table 7 presents the results of the three regression models that predicted the effect of the independent variables on mental health (outcome variables).
  • Model 1: Model 1 revealed that noise (B = 2.099, p < 0.01) significantly predict mental health (adjusted R2 = 0.077).
  • Model 2: When housing conditions were included in Model 2, the increase in R2 was significant (p < 0.05). In Model 2, the predicting roles of noise (B = 1.934, p < 0.01), elevator (B = 2.726, p < 0.05) and building location (B = −1.258, p < 0.01) were significant.
  • Model 3: The adjusted R2 value increased significantly from 0.103 (Model 2) to 0.204 (Model 3) after demographic and socioeconomic factors were entered into Model 3 (p < 0.01). In Model 3, the predicting role of noise was significant (B = 1.445, p < 0.05). In addition, three demographic and socioeconomic variables—educational level (B = 0.853, p < 0.05), monthly income (B = 1.025, p < 0.05), and alcohol consumption (B = 2.227, p < 0.01) —could significantly predict mental health. However, the other four environmental variables (lighting and view, temperature and humidity, air quality, and maintenance and cleanliness), and housing conditions had no significant effect on mental health (p > 0.05).
Table 7. Multiple regression analysis with the mental health (MCM) as outcome variable.
VariableModel 1Model 2Model 3
BSEBSEBSE
Constant30.2063.18529.3297.88922.3168.384
Noise2.099 **0.7221.934 **0.7221.445 *0.698
Lighting and view−0.0750.980−0.4130.984−0.0730.954
Temperature and humidity1.9421.0801.4911.1091.2101.062
Air quality−0.4071.1780.1181.1940.0561.145
Maintenance and cleanliness1.1100.7950.7060.8060.4400.784
Floor level of home 0.9720.5300.1400.521
Elevator 2.726 *1.3771.7521.331
Building location −1.258 **0.406−0.3840.411
Housing type 0.5170.7430.0010.713
Home area 0.2010.9960.3420.946
Number of adults −0.4290.439−0.2100.418
Nonadults −0.4261.079−0.2951.047
Living room window −0.4491.923−0.7461.842
Bedroom window 0.8113.765−0.3253.691
Indoor plants 0.1780.5850.3050.589
Sex 1.8741.020
Age −1.1940.760
Educational status 0.853 *0.347
Marital status −0.1430.483
Monthly income 1.025 *0.401
Smoking status −0.6990.655
Alcohol consumption 2.227 **0.700
Physical activity level 0.7210.812
Health: cardiovascular diseases 0.3351.018
Health: chronic diseases 0.7491.041
Adjusted R20.0770.1030.204
R2 0.026 *0.101 **
Significant: B = regression coefficient, SE = standard error, *. p < 0.05, **. p < 0.01.

4. Discussion

4.1. Relationship between Key Housing Environmental Factors and Overall Satisfaction and the Health of Older Adults

First, the relationship between the perceived housing environment and the overall satisfaction of older adults (RQ1) is discussed as follows. Table 8 illustrates a comparison between the present survey and other studies in terms of overall satisfaction. As shown in (Section 3.4), several environmental factors in a living space, including lighting and view, temperature and humidity, air quality, and maintenance and cleanliness, can positively predict the overall satisfaction of older adults. This finding has been widely observed in previous studies. Improvement in indoor lighting can promote the environmental satisfaction of older adults in their homes [31,34]. Several studies have noted that older adults preferred to stay in a warm environment in both winter and summer [43,44]. According to a survey conducted in Chinese residential care facilities for older adults, there was an association between the indoor physical environment (noise, lighting and view, temperature and humidity, and air quality) and the overall satisfaction of residents, although satisfaction varied seasonally [44]. However, our study concluded that there was no significant effect of environmental noise on the satisfaction of the home-living older adults, which differs from the findings of a previous study [43]. As shown in Table 2, most respondents in this study (50%) lived in urban areas, which normally have higher daily environmental noise levels. Thus, compared to the lighting and view, temperature and humidity, and air quality conditions, respondents may express lower levels of dissatisfaction with noise due to adaptation. However, older people living in urban buildings may not be highly sensitive to environmental noise because their auditory functions often decrease with age.
Second, the association between the perceived housing environment and the physical health of older adults (RQ2) is discussed as follows. Table 9 compares the present survey with other studies in terms of physical health of older adults. Based on an evaluation of the impact of different dimensions of perceived indoor environment qualities, this study found that air quality was a significant predictor of physical health in homes (Section 3.5). As discussed in a previous study [49], household air pollution exposure can lead to noncommunicable diseases, including stroke, ischemic heart disease, chronic obstructive pulmonary disease (COPD), and lung cancer. Therefore, enhancing the indoor air quality using purification devices can improve the cardiorespiratory health of older people [42]. Urban night noise has been proven to be a critical cause of cardiovascular diseases; thus, prolonged exposure to noise can be detrimental to older adults’ health [36]. A properly designed lighting environment can help older adults effectively perform their daily activities, thus promoting good health [31]. However, the present study did not reach a similar conclusion. We assume that this might be due to respondents’ high ratings on the lighting and view environment, which has achieved the base line required to keep a proper physical health status of older adults. In addition, our study did not support the hypothesis that the effects of indoor temperature and humidity on the health of older adults were significant, even though several previous studies have indicated an association between these two environmental factors and human health in homes [27,28,29,30,41]. It should be noted that all respondents were based in Northern Chinese cities that have a climate of cold or severely cold winters and warm summers (Section 2.1). According to Chinese building regulations [81], a proper level of thermal comfort in homes at these locations must be achieved through various solutions, including well-insulated building envelopes and active heating systems, and thus, we assume that there were no clear effects of housing temperature and humidity conditions on respondents’ physical health. Additionally, a previous study showed that regular cleaning of living spaces can help reduce the risk of disease and maintain good health among older adults [50]. However, in the present study, no clear effects of indoor maintenance or cleanliness on physical health were observed. We assume that most respondents lived in relatively clean environments (e.g., modern apartment buildings), which may not have caused serious harm to their physical health.
Third, a discussion of the relationship between the perceived housing environment and the mental Health of older adults (RQ3) is given as follows. Table 10 presents a comparison between the present survey and other studies in terms of mental health. Regarding mental health in homes, our study discovered that only environmental noise had a significant negative impact on older adults (Section 3.6). This finding agrees with the finding of a cross-sectional study [37] that exposure to external noise can cause annoyance and increase the psychological burden on home-living older adults. However, apart from noise, previous studies have demonstrated that poor indoor lighting and temperature and humidity conditions are the main causes of stress and mental disorders among older urban residents [31]. Prolonged exposure to highly polluted air environments can also be detrimental to the psychological health of residents [38,49]. Additionally, there is evidence to reduce the likelihood of depressive symptoms in older adults by improving the cleanliness of their homes [51]. The data surveyed in our study may not fully support the findings of psychological performance, which were based on different locations and housing conditions [31,38,49]. In addition, the present study was conducted during COVID-19 periods, when respondents spent most of their time in lockdown, and their mental wellbeing may be affected by multiple complex factors (including social and environmental aspects). Thus, it could be normal to see the differences from the findings achieved under regular circumstances (e.g., [31,38,49]). However, given the discussion above, lighting, temperature, air quality, and cleanliness had significant effects on satisfaction and physical health. Thus, the outcome with three dimensions (dependent variables) in our survey (Figure 2) may have led to some overlapping psychological responses among our study’s respondents. On the other hand, our study revealed that home-living older adults were more sensitive to noise than to other environmental factors in terms of psychological performance, and this requires further investigation.

4.2. Role of Demographic and Socioeconomic Variables

Several demographic and socioeconomic variables were assessed. First, the significant impact of age on physical health could be caused by a decline in physical function in older adults. Studies have shown significant variations in physical functions among older adults of different age groups. Many adults remain healthy and active in their 60s and 70s, and diseases often appear around the age of 75 years [82], while physical decline often occurs around the age of 85 [82]. The oldest old individuals (age ≥ 81 years) have a higher risk of cardiovascular disease [83]. Second, marital status was a significant predictor of physical health among older respondents. This may be because older people with spouses are able to take care of each other, leading to the development of healthy habits in terms of diet, living conditions, and other aspects. Moreover, a record of the respondents’ health (cardiovascular and chronic diseases) was direct proof of their physical health status.
This study found that three demographic and socioeconomic variables could influence respondents’ mental health. Educational status was a significant predictor of mental health. We posit that respondents with higher educational levels may be able to adjust their mental state by themselves and thus actively create conditions to meet their mental health needs. Second, monthly income significantly predicted mental health. We posit that a higher income level may lead to a higher quality of living for these respondents. Additionally, there was a clear link between alcohol consumption and respondents’ mental health.

4.3. Proposed Design Strategies

The lockdown period in the region to conduct this survey was from November 2021 to February 2022. Based on the main findings of this study, we propose design strategies to improve home-based care environments for older adults. First, well-designed acoustic insulation or noise barriers should be considered. Walls and ceilings can be filled with sound-absorbing materials, and existing windows can be converted into double-pane windows to achieve good noise insulation. Second, increasing the window size maximizes the availability of natural light. Dynamic lighting solutions can also be applied to adapt to the different behaviors of older adults (e.g., reading or watching television). Third, indoor temperature and humidity can be controlled using natural ventilation or by installing air conditioning equipment. Fourth, indoor pollutants can be monitored, and a smart indoor ventilation system can be established to improve the air quality. Finally, designers should strive to achieve an optimized solution to balance various requirements between lighting, acoustics, and ventilation, especially in an urban environment.

4.4. Strengths

The main strengths of this study are as follows. First, unlike studies on the environmental impact on older adults’ health in residential care homes and nursing homes, our survey focused on the home-based care environment—that is, the older adults’ own homes. Given both the new development and retrofitting of homes in China, our findings may highlight opportunities to improve the living environment in terms of the care requirements of home-living older adults. Second, our cross-sectional survey was conducted to test the association between multidimensional environmental variables (five domains) and the health of older adults (three outcome variables) in Chinese residential buildings. This research design can not only collect data from a larger population but also produce pilot test results to conduct an in-depth research study (e.g., cohort study). For instance, as the only effective factor associated with the psychological performance of an older adults, environmental noise may need to be tested specifically in older adults’ homes. Third, a subjective assessment was performed using self-developed (environmental variables) and validated (health variables) instruments. The self-developed instrument was retrieved from published studies, and its validity and reliability were tested. Compared to traditional physical measurements, these psychological measurements can be used to test the direct responses of home-living older adults. Fourth, multiple regression analysis can effectively test the main effects of environmental factors and their interactions. This is particularly important for studying the performance of older adults in multisensory care environments.

4.5. Limitations

This study has some limitations. First, the sample size applied in this survey was relatively small based on the population who are aging (≥60 years) in Northern China. This was caused by two factors: COVID-19 and the older adults’ low ability to use online tools. Further surveys in this field are required to obtain more reliable results. Second, for the analysis of the surveyed data, only the behavioral health variables (alcohol consumption, smoking status, and physical activity level) were considered confounding factors in multiple linear regressions, whereas the interaction between them and the architectural characteristics of care facilities was not further studied. The association between these two factors will be investigated in future studies. Third, as a cross-sectional survey was adopted, the findings might not fully reflect the long-term environmental effects in homes. A longitudinal investigation is needed to repeatedly examine the same individuals to detect any changes that may occur over time. Fourth, only subjective surveys were conducted to test the impact of perceived environmental factors on physical and mental health among the older adults, and there was a lack of objective measures for environmental factors (e.g., monitored data). Future research should adopt a mixed model (subjective and objective measures) to collect various types of data and enhance the reliability of the findings.

5. Conclusions and Implications

In our study, a cross-sectional survey was conducted during the COVID-19 pandemic (October 2021–March 2022) in Northern China to collect direct evidence of how perceived housing environmental qualities can affect health and satisfaction among the older adults who receive home-based care. Five environmental factors of residential buildings were assessed: noise, lighting and view, temperature and humidity, air quality, and maintenance and cleanliness. A total of 356 respondents (age ≥ 60 years) completed the online survey that used the validated SF-12 instrument. The key findings obtained through a multiple regression analysis are as follows. First, the overall satisfaction of the older adults can be positively predicted by four housing environmental qualities: lighting and view, temperature and humidity, air quality, and maintenance and cleanliness. Second, air quality was a predictor of physical health among the home-living older adults. Third, noise alone can significantly predict the mental health of older adults. Fourth, the physical health of the older adults was significantly predicted by age, marital status, and household health status (cardiovascular and chronic diseases), whereas educational status, monthly income, and alcohol consumption could predict the mental health of older adults. These findings can be used to develop guidelines to support the establishment of a healthy home-based care environment for the older adults in the region with similar climate-cultural contexts.
This study proposed a research approach to evaluate the health and satisfaction of the home-living older adults in China using subjective assessment and multifactor analysis. The research design and relevant instruments (self-developed and the SF-12) could be further tested among home-living older Chinese. A multiple regression data analysis could be considered in similar studies in the future. Such an analysis would identify not only the main cause of outcomes but also the interactions between various environmental interventions (e.g., lighting, acoustics, temperature and humidity, and ventilation). Further investigations may include experiments to test the interaction between architectural characteristics of care facilities and behavioral health variables, longitudinal surveys to explore the health performances among the same individuals over a long term, and on-site measurements of both subjective and objective performances.

Author Contributions

Conceptualization, F.L. and J.D.; methodology, F.L., J.D. and X.G.; formal analysis, Y.L. and J.D.; investigation, Y.L. and X.G.; resources, F.L.; data curation, Y.L. and X.G.; writing—original draft preparation, Y.L. and J.D.; writing—review and editing: F.L. and J.D.; supervision, F.L.; project administration, F.L.; funding acquisition, F.L. All authors have read and agreed to the published version of the manuscript.

Funding

This research project received the support through a standard grant (R&D Program of Beijing Municipal) of ‘Research and application of rehabilitation environment construction technology for old people with Venous Thromboembolism (VTE) (No. Z191100004419002)’. This study is sponsored by the BUCEA Postgraduate Innovation Project (PG2023082).

Institutional Review Board Statement

Ethical review and approval for this study were waived because the 356 study respondents provided their consent to participate voluntarily before answering the online questionnaire. This non-interventional study used an online survey and all respondents were informed that their anonymity would be guaranteed. They were fully explained why the research was being conducted, how their data would be used, and why there were no associated risks.

Informed Consent Statement

Informed consent was obtained from all subjects involved in the study.

Data Availability Statement

The data presented in this study are available on request from the corresponding authors. The data are not publicly available due to privacy.

Conflicts of Interest

The authors declare no conflict of interest.

References

  1. World Health Organization (WHO). Adolescent Health and Ageing Data Portal. 2021. Available online: https://www.who.int/health-topics/adolescenthealth#tab=tab_1 (accessed on 1 May 2023).
  2. World Health Organization (WHO). World Report on Ageing and Health. 2015. Available online: https://apps.who.int/iris/handle/10665/186463 (accessed on 1 May 2023).
  3. World Health Organization (WHO). National Programmes for Age-Friendly Cities and Communities: A Guide. Switzerland. 2023. Available online: https://www.who.int/teams/social-determinants-of-health/demographic-change-and-healthy-ageing/age-friendly-environments/national-programmes-afcc (accessed on 1 May 2023).
  4. National Bureau of Statistics of China. China Statistical Yearbook 2021. Available online: http://www.stats.gov.cn/tjsj/ndsj/2021/indexch.htm (accessed on 1 October 2022).
  5. Ministry of Housing and Urban-Rural Development of the People’s Republic of China. Code for Design of Residential Building for the Aged (GB50340P-2016); China Architecture Building Press: Beijing, China, 2016. [Google Scholar]
  6. Ministry of Housing and Urban-Rural Development of the People’s Republic of China. Standard for Design of Care Facilities for the Aged (JGJ 450-2018); China Architecture Building Press: Beijing, China, 2018. [Google Scholar]
  7. Gan, W.; Sanderson, W.T.; Browning, S.; Mannino, D.M. Different types of housing and respiratory health outcomes. Prev. Medep. 2017, 7, 124–129. [Google Scholar] [CrossRef] [PubMed]
  8. World Health Organization (WHO). WHO Housing and Health Guidelines. Switzerland. 2018. Available online: https://www.who.int/publications (accessed on 1 August 2022).
  9. The Office of the Deputy Prime Minster. Housing Health and Safety Rating System: Operating Guidance. London, UK. 2006. Available online: https://assets.publishing.service.gov.uk (accessed on 1 August 2022).
  10. Pevalin, D.J.; Reeves, A.; Baker, E.; Bentley, R. The impact of persistent poor housing conditions on mental health: A longitudinal population-based study. Prev. Med. 2017, 105, 304–310. [Google Scholar] [CrossRef] [PubMed]
  11. Jensen, H.A.R.; Rasmussen, B.; Ekholm, O. Neighbour noise annoyance is associated with various mental and physical health symptoms: Results from a nationwide study among individuals living in multi-storey housing. BMC Public Health 2019, 19, 1508. [Google Scholar] [CrossRef] [PubMed]
  12. Pedersen, E. City dweller responses to multiple stressors intruding into their homes: Noise, light, odour, and vibration. Int. J. Environ. Public Health 2015, 12, 3246–3263. [Google Scholar] [CrossRef] [PubMed]
  13. National Center for Healthy Housing American Public Health Association. National Healthy Housing Standardolumbia, MD: National Center for Healthy Housing. 2014. Available online: https://nchh.org/resource-library/national-healthy-housing-standard (accessed on 1 August 2022).
  14. Aries, M.B.C.; Aarts, M.P.J.; Hoof, J.V. Daylight and health: A review of the evidence and consequences for the built environment. Light. Res. Technol. 2015, 47, 6–27. [Google Scholar] [CrossRef]
  15. Morales-Bravo, J.; Navarrete-Hernandez, P. Enlightening wellbeing in the home: The impact of natural light design on perceived happiness and sadness in residential spaces. Build. Environ. 2022, 223, 109317. [Google Scholar] [CrossRef]
  16. Nagare, R.; Woo, M.; MacNaughton, P.; Plitnick, B.; Tinianov, B.; Figueiro, M. Access to daylight at home improves circadian alignment, sleep, and mental health in healthy adults: A crossover study. Int. J. Environ. Public Health 2021, 18, 9980. [Google Scholar] [CrossRef]
  17. Saeki, K.; Obayashi, K.; Iwamoto, J.; Tanaka, Y.; Tanaka, N.; Takata, S.; Kubo, H.; Okamoto, N.; Tomioka, K.; Nezu, S.; et al. Influence of room heating on ambulatory blood pressure in winter: A randomised controlled study. J. Epidemiol. Commun. Health 2013, 67, 484–490. [Google Scholar] [CrossRef]
  18. Kanno, I.; Hasegawa, K.; Nakamura, T.; Kogure, M.; Itabashi, F.; Narita, A.; Tsuchiya, N.; Hirata, T.; Nakaya, N.; Sugawara, J.; et al. Relationship between the housing coldness/warmth evaluation by CASBEE Housing Health Checklist and psychological distress based on TMM Community-Based Cohort Study: A cross-sectional analysis. Public Health 2022, 208, 98–104. [Google Scholar] [CrossRef]
  19. Sharpe, R.A.; Bearman, N.; Thornton, C.; Husk, K.; Osborne, N.J. Indoor fungal diversity and asthma: A meta-analysis and systematic review of risk factors. J. Allergy Clin. Immunol. 2015, 135, 110–122. [Google Scholar] [CrossRef]
  20. Jaakkola, M.S.; Quansah, R.; Hugg, T.T.; Heikkinen, S.A.M.; Jaakkola, J.J.K. Association of indoor dampness and molds with rhinitis risk: A systematic review and meta-analysis. J. Allergy Clin. Immunol. 2013, 132, 1099–1110. [Google Scholar] [CrossRef] [PubMed]
  21. Liddell, C.; Guiney, C. Living in a cold and damp home: Frameworks for understanding impacts on mental well-being. Public Health 2015, 129, 191–199. [Google Scholar] [CrossRef] [PubMed]
  22. Wang, J.; Lee, C.L.; Shirowzhan, S. Macro-Impacts of Air Quality on Property Values in China—A Meta-Regression Analysis of the Literature. Buildings 2021, 11, 48. [Google Scholar] [CrossRef]
  23. Wang, J.; Lee, C.L. The value of air quality in housing markets: A comparative study of housing sale and rental markets in China. Energy Policy 2022, 160, 112601. [Google Scholar] [CrossRef]
  24. Cheung, T.; Schiavon, S.; Graham, L.T.; Tham, K.W. Occupant satisfaction with the indoor environment in seven commercial buildings in Singapore. Build. Environ. 2020, 188, 107443. [Google Scholar] [CrossRef]
  25. Department of Health. Care Homes for Older People: National Minimum Standards and the Care Homes Regulations 2001; TSO: London, UK, 2003. [Google Scholar]
  26. Joseph, A.; Choi, Y.; Quan, X. Impact of the Physical Environment of Residential Health, Care, and Support Facilities (RHCSF) on Staff and Residents: A Systematic Review of the Literature. Environ. Behav. 2016, 48, 1203–1241. [Google Scholar] [CrossRef]
  27. Blatteis, C.M. Age-dependent changes in temperature regulation: A mini review. Gerontology 2012, 58, 289–295. [Google Scholar] [CrossRef]
  28. Soebarto, V.; Bennetts, H.; Hansen, A.; Zuo, J.; Williamson, T.; Pisaniello, D.; Hoof, J.V.; Visvanathan, R. Living environment, heating-cooling behaviours and well-being: Survey of older South Australians. Build. Environ. 2019, 157, 215–226. [Google Scholar] [CrossRef]
  29. Sunwoo, Y.; Chou, C.; Takeshita, J.; Murakami, M.; Tochihara, Y. Physiological and subjective responses to low relative humidity in young and elderly men. J. Physiol. Anthropol. 2006, 25, 229–238. [Google Scholar] [CrossRef]
  30. Jin, Y.; Wang, F.; Carpenter, M.; Weller, R.B.; Tabor, D.; Payne, S. The effect of indoor thermal and humidity condition on the oldest-old people’s comfort and skin condition in winter. Build. Environ. 2020, 174, 106790. [Google Scholar] [CrossRef]
  31. Falkenberg, H.K.; Kvikstad, T.M.; Eilertsen, G. Improved indoor lighting improved healthy aging at home—An intervention study in 77-year-old Norwegians. J. Multidiscip. Healthc. 2019, 12, 315–324. [Google Scholar] [CrossRef] [PubMed]
  32. Freeman, E.; Muñoz, B.; Rubin, G.; West, S. Visual field loss increases the risk of falls in older adults: The Salisbury eye evaluation. Investig. Ophthalmol. Vis. Sci. 2007, 48, 4445–4450. [Google Scholar] [CrossRef] [PubMed]
  33. van der Aa, H.P.; Comijs, H.C.; Penninx, B.W.; van Rens, G.H.; van Nispen, R.M. Major depressive and anxiety disorders in visually impaired older adults. Investig. Ophthalmol. Vis. Sci. 2015, 56, 849–854. [Google Scholar] [CrossRef] [PubMed]
  34. Grandner, M.A.; Kripke, D.F.; Langer, R.D. Light exposure is related to social and emotional functioning and to quality of life in older women. Psychiatry Res. 2006, 143, 35–42. [Google Scholar] [CrossRef]
  35. Shishegar, N.; Boubekri, M.; Stine-Morrow, E.A.; Rogers, W.A. Tuning environmental lighting improves objective and subjective sleep quality in older adults. Build. Environ. 2021, 204, 108096. [Google Scholar] [CrossRef]
  36. Azuma, K.; Uchiyama, I. Association between environmental noise and subjective symptoms related to cardiovascular diseases among elderly individuals in Japan. PLoS ONE 2017, 12, e0188236. [Google Scholar] [CrossRef]
  37. Riedel, N.; Köckler, H.; Scheiner, J.; van Kamp, I.; Erbel, R.; Loerbroks, A.; Claßen, T.; Bolte, G. Home as a Place of Noise Control for the Elderly? A Cross-Sectional Study on Potential Mediating Effects and Associations between Road Traffic Noise Exposure, Access to a Quiet Side, Dwelling-Related Green and Noise Annoyance. Int. J. Environ. Public Health 2018, 15, 1036. [Google Scholar] [CrossRef]
  38. Braithwaite, I.; Zhang, S.; Kirkbride, J.B.; Osborn, D.P.J.; Hayes, J. Air pollution (Particulate matter) exposure and associations with depression, anxiety, bipolar, psychosis and suicide risk: A systematic review and meta-analysis. Environ. Health Perspect. 2019, 127, 126002. [Google Scholar] [CrossRef]
  39. Mulliner, E.; Riley, M.; Maliene, V. Older people’s preferences for housing and environment characteristics. Sustainability 2020, 12, 5723. [Google Scholar] [CrossRef]
  40. Bian, Y.; Li, L. The Chinese General Social Survey (2003-8). Chin. Sociol. 2021, 45, 70–97. [Google Scholar] [CrossRef]
  41. Guo, M.; Zhou, M.; Li, B.; Du, C.; Yao, R.; Wang, L.; Yang, X.; Yu, W. Reducing indoor relative humidity can improve the circulation and cardiorespiratory health of older people in a cold environment: A field trial conducted in Chongqing, China. Sci. Total Environ. 2022, 817, 152695. [Google Scholar] [CrossRef] [PubMed]
  42. Guo, M.; Du, C.; Li, B.; Yao, R.; Tang, Y.; Jiang, Y.; Liu, H.; Su, H.; Zhou, Y.; Wang, L.; et al. Reducing particulates in indoor air can improve the circulation and cardiorespiratory health of old people: A randomized, double-blind crossover trial of air filtration. Sci. Total Environ. 2021, 798, 149248. [Google Scholar] [CrossRef]
  43. Tao, Y.; Gou, Z.; Yu, Z.; Fu, J.; Chen, X. The challenge of creating age-friendly indoor environments in a high-density city: Case study of Hong Kong’s care and attention homes. J. Build. Eng. 2020, 30, 101280. [Google Scholar] [CrossRef]
  44. Mu, J.; Kang, J. Indoor environmental quality of residential elderly care facilities in northeast China. Front. Public Health 2022, 10, 860976. [Google Scholar] [CrossRef]
  45. Leung, M.; Wang, C.; Chan, I.Y.S. A qualitative and quantitative investigation of effects of indoor built environment for people with dementia in care and attention homes. Build. Environ. 2019, 157, 89–100. [Google Scholar] [CrossRef]
  46. Zhang, F.; Shi, L.; Liu, S.; Cheng, M.; Zeng, F.; Li, J. Satisfaction among the Elderly Living in the Ancient Town of Xiangxi. Buildings 2023, 13, 1334. [Google Scholar] [CrossRef]
  47. Cui, P.; Zhang, J.; Li, T. Research on Acoustic Environment in the Building of Nursing Homes Based on Sound Preference of the Elderly People: A Case Study in Harbin, China. Front. Psychol. 2021, 12, 707457. [Google Scholar] [CrossRef]
  48. Li, L.; Sun, N.; Yu, L.; Dong, X.; Zhao, J.; Ying, Y. The Needs of Older Adults with Disabilities With Regard to Adaptation to Aging and Home Care: Questionnaire Study. JMIR Rehabil. Assist. Technol. 2020, 7, 16012. [Google Scholar] [CrossRef]
  49. Ju, K.; Lu, L.; Chen, T.; Duan, Z.; Chen, D.; Liao, W.; Zhou, Q.; Xu, Z.; Wang, W. Does long-term exposure to air pollution impair physical and mental health in the middle-aged and older adults?—A causal empirical analysis based on a longitudinal nationwide cohort in China. Sci. Total Environ. 2022, 827, 154312. [Google Scholar] [CrossRef]
  50. Leung, M.; Liang, Q. Developing structural facilities management–quality of life models for the elderly in the common areas of public and subsidized housings. Habitat Int. 2019, 94, 102067. [Google Scholar] [CrossRef]
  51. Li, C.; Zhou, Y. Residential environment and depressive symptoms among Chinese middle- and old-aged adults: A longitudinal population-based study. Health Place 2020, 66, 102463. [Google Scholar] [CrossRef] [PubMed]
  52. Chen, Y.; Cui, P.Y.; Pan, Y.Y.; Li, Y.X.; Waili, N.; Li, Y. Association between housing environment and depressive symptoms among older people: A multidimensional assessment. BMC Geriatr. 2021, 21, 259. [Google Scholar] [CrossRef] [PubMed]
  53. Krings, M.F.; van Wijngaarden, J.D.H.; Yuan, S.; Huijsman, R. China’s Elder Care Policies 1994–2020: A Narrative Document Analysis. Int. J. Environ. Public Health 2022, 19, 6141. [Google Scholar] [CrossRef] [PubMed]
  54. Kesmodel, U. Cross-sectional studies-what are they good for? Acta Obstet. Gynecol. Scand. 2018, 97, 388–393. [Google Scholar] [CrossRef]
  55. Haanes, G.G.; Hall, E.O.C.; Eilertsen, G. Acceptance and adjustment: A qualitative study of experiences of hearing and vision impairments and daily life among oldest old recipients of home care. Int. J. Older People Nurs. 2019, 14, 12236. [Google Scholar] [CrossRef]
  56. Vrdoljak, D.; Marković, B.B.; Puljak, L.; Lalić, D.I.; Kranjčević, K.; Vučak, J. Lifestyle intervention in general practice for physical activity, smoking, alcohol consumption and diet in elderly: A randomized controlled trial. Arch. Gerontol. Geriatr. 2014, 58, 160–169. [Google Scholar] [CrossRef]
  57. Jin, L.; Huang, Y.; Bi, Y.; Zhao, L.; Xu, M.; Xu, Y.; Chen, Y.; Gu, L.; Dai, M.; Wu, Y.; et al. Association between alcohol consumption and metabolic syndrome in 19,215 middle-aged and elderly Chinese. Diabet. Reslin. Pract. 2011, 92, 386–392. [Google Scholar] [CrossRef]
  58. Ran, J.; Zhang, Y.; Han, L.; Sun, S.; Zhao, S.; Shen, C.; Zhang, X.; Chan, K.P.; Lee, R.S.; Qiu, Y.; et al. The joint association of physical activity and fine particulate matter exposure with incident dementia in elderly Hong Kong residents. Environ. Int. 2021, 156, 106645. [Google Scholar] [CrossRef]
  59. Saqlain, M.; Riaz, A.; Ahmed, A.; Kamran, S.; Bilal, A.; Ali, H. Predictors of Health-Related Quality-of-Life Status Among Elderly Patients with Cardiovascular Diseases. Value Health Reg. Issues 2021, 24, 130–140. [Google Scholar] [CrossRef]
  60. Hao, L.J.; Omar, M.S.; Tohit, N. Polypharmacy and Willingness to Deprescribe Among Elderly with Chronic Diseases. Int. J. Gerontol. 2018, 12, 340–343. [Google Scholar]
  61. Weuve, J.; D’Souza, J.; Beck, T.; Evans, D.A.; Kaufman, J.D.; Rajan, K.B.; de Leon, C.F.M.; Adar, S.D. Long-term community noise exposure in relation to dementia, cognition, and cognitive decline in older adults. Alzheimers. Dement. 2021, 17, 525–533. [Google Scholar] [CrossRef] [PubMed]
  62. Thompson, R.; Smith, R.B.; Bou, K.Y.; Shen, C.; Drummond, K.; Teng, C.; Toledano, M.B. Noise pollution and human cognition: An updated systematic review and meta-analysis of recent evidence. Environ. Int. 2022, 158, 106905. [Google Scholar] [CrossRef] [PubMed]
  63. Durvasula, S.; Kok, C.; Sambrook, P.N.; Cumming, R.G.; Lord, S.R.; March, L.M.; Mason, R.S.; Seibel, M.J.; Simpson, J.M.; Cameron, I.D. Sunlight and health: Attitudes of older people living in intermediate care facilities in southern Australia. Arch. Gerontol. Geriatr. 2010, 51, 94–99. [Google Scholar] [CrossRef] [PubMed]
  64. Yang, H.; Guo, B.; Shi, Y.; Jia, C.; Li, X.; Liu, F. Interior daylight environment of an elderly nursing home in Beijing. Build. Environ. 2021, 200, 107915. [Google Scholar] [CrossRef]
  65. Ahrentzen, S.; Erickson, J.; Fonseca, E. Thermal and health outcomes of energy efficiency retrofits of homes of older adults. Indoor Air 2016, 26, 582–593. [Google Scholar] [CrossRef]
  66. Huang, X.; Ma, W.; Law, C.; Luo, J.; Zhao, N. Importance of applying Mixed Generalized Additive Model (MGAM) as a method for assessing the environmental health impacts: Ambient temperature and Acute Myocardial Infarction (AMI), among elderly in Shanghai, China. PLoS ONE 2021, 16, 0255767. [Google Scholar] [CrossRef]
  67. Grande, G.; Ljungman, P.L.S.; Eneroth, K.; Bellander, T.; Rizzuto, D. Association Between Cardiovascular Disease and Long-term Exposure to Air Pollution with the Risk of Dementia. JAMA Neurol. 2020, 77, 801–809. [Google Scholar] [CrossRef]
  68. Norbäck, D.; Zhang, X.; Fan, Q.; Zhang, Z.; Zhang, Y.; Li, B.; Zhao, Z.; Huang, C.; Deng, Q.; Lu, C.; et al. Home environment and health: Domestic risk factors for rhinitis, throat symptoms and non-respiratory symptoms among adults across China. Sci. Total Environ. 2019, 681, 320–330. [Google Scholar] [CrossRef]
  69. Ware, J.; Kosinski, M.A.; Tuner-Bowker, D.M.; Gandek, B. Version 2 of the SF12 health survey. SPINE 2002, 25, 3130–3139. [Google Scholar] [CrossRef]
  70. Pironi, L.; Paganelli, F.; Mosconi, P.; Morselli-Labate, A.M.; Spinucci, G.; Merli, C.; Guidetti, M.; Miglioli, M. The SF-36 Instrument for the Follow-Up of Health-Related Quality-Of-Life Assessment of Patients Undergoing Home Parenteral Nutrition for Benign Disease. Transplant. Proc. 2004, 36, 255–258. [Google Scholar] [CrossRef]
  71. Grassi, M.; Nucera, A. Dimensionality and Summary Measures of the SF-36 v1.6: Comparison of Scale- and Item-Based Approach Across ECRHS II Adults Population. Value Health 2010, 13, 469–478. [Google Scholar] [CrossRef] [PubMed]
  72. Chiatti, C.; Westerlund, Y.; Ståhl, A. Access to public mobility services and health in old age: A cross-sectional study in three Swedish cities. J. Transp. Health 2017, 7, 218–226. [Google Scholar] [CrossRef]
  73. Ormandy, D. Housing and Health in Europe: The WHO LARES Project; Routledge: London, UK, 2009. [Google Scholar]
  74. Lyu, Y.; Forsyth, A.; Worthington, S. Built Environment and Self-Rated Health: Comparing Young, Middle-Aged, and Older People in Chengdu, China. HERD 2021, 14, 229–246. [Google Scholar] [CrossRef]
  75. Frehlich, L.; Christie, C.; Ronksley, P.; Turin, T.C.; Doyle-Baker, P.; McCormack, G. Association between neighbourhood built environment and health-related fitness: A systematic review protocol. JBI Evid. Synth. 2021, 19, 2350–2358. [Google Scholar] [CrossRef] [PubMed]
  76. Forchuk, C.; Dickins, K.; Corring, D.J. Social Determinants of Health: Housing and Income. Healthc. Q. 2016, 18, 27–31. [Google Scholar] [CrossRef] [PubMed]
  77. Wu, F.; Guo, Y.; Zheng, Y.; Ma, W.; Kowal, P.; Chatterji, S.; Wang, L. Social-Economic Status and Cognitive Performance among Chinese Aged 50 Years and Older. PLoS ONE 2016, 11, e0166986. [Google Scholar] [CrossRef] [PubMed]
  78. Fornell, C.; Larcker, D.F. Evaluating Structural Equation Models with Unobservable Variables and Measurement Error. J. Markes. 1981, 18, 39–50. [Google Scholar]
  79. Leung, M.; Famakin, I.; Kwok, T. Relationships between indoor facilities management components and elderly people’s quality of life: A study of private domestic buildings. Habitat Int. 2017, 66, 13–23. [Google Scholar] [CrossRef]
  80. Yaman Sözbir, Ş.; Vural, G.; Ünal Toprak, F. A Study for Testing the Validity and Reliability of the Turkish Version of the Internalized Misogyny Scale. Int. J. Ment. Health Addict. 2020, 19, 1705–1715. [Google Scholar] [CrossRef]
  81. Ministry of Housing and Urban-Rural Development of the People’s Republic of China. Design Standard for Energy Efficiency of Residential Buildings in Severe Cold and Cold Zones (JGJ 26-2018); China Architecture Building Press: Beijing, China, 2018. [Google Scholar]
  82. Suzuki, T. Health status of older adults living in the community in Japan: Recent changes and significance in the super-aged society. Geriatr. Gerontol. Int. 2018, 18, 667–677. [Google Scholar] [CrossRef]
  83. Minghetti, A.; Donath, L.; Hanssen, H.; Roth, R.; Lichtenstein, E.; Zahner, L.; Faude, O. Physical Performance, Cardiovascular Health and Psychosocial Wellbeing in Older Adults Compared to Oldest-Old Residential Seniors. Int. J. Environ. Public Health 2022, 19, 1451. [Google Scholar] [CrossRef] [PubMed]
Figure 1. Conceptual framework of study.
Buildings 13 02875 g001
Figure 3. Research design: independent and dependent variables and covariates.
Buildings 13 02875 g003
Table 2. Descriptive statistics of housing and living conditions.
VariableItemsnPercentage
The floor of your home:1 (bungalow)9627
≤3 (multistory)6919.4
4–6 (multistory)10629.8
7–9 (multistory)298.1
≥10 (multistory)5615.7
Availability of elevator?Yes14340.2
No21359.8
Building location:City center6518.3
Non-city center urban area12234.3
Suburban6117.1
Outer suburban267.3
Rural area8223
Housing type:One-bedroom246.7
Two-bedroom16345.8
Three-bedroom12735.7
Other4211.8
Floor area of your home:<50 m2267.3
50–100 m221560.4
>100 m211532.3
Any windows in your living room?Yes32992.4
No277.6
Any windows in your bedroom?Yes35098.3
No61.7
Any nonadults living in your home?Yes12334.6
No23365.4
Number of adults living in your home:2.79 ± 1.19 (M + SD)
Number of indoor plants:2.41 ± 0.86 (M + SD) (1 = no, 2 = a little, 3 = some, 4 = a large amount)
Table 3. Perceived housing environment: principal component analysis and reliability.
ItemFactor LoadingsMeanSDCronbach’s Alpha
Noise 0.787
1: My home is quiet for most of the day and I can concentrate on my activity.0.643.890.99
2: I am rarely awakened by the noise outside when I sleep at night.0.823.791.03
3: At home, I am rarely disturbed by the outside noise.0.853.571.04
4: How satisfied are you with the noise in your home?0.813.701.01
Lighting and view 0.815
1: The indoor lighting is adequate during the day.0.803.960.96
2: With daylight, I can easily read books and newspapers.0.823.860.96
3: I feel comfortable with the brightness of my home lighting at night.0.703.950.90
4: I am satisfied with the view outside of my home’s windows.0.673.521.06
5: How do you feel satisfied with the lighting in your home?0.823.770.89
Temperature and humidity 0.884
1: In summer, I do not feel hot and stuffy at home.0.673.650.97
2: In spring and autumn, I feel the temperature is ok at home.0.753.960.85
3: In winter, I do not feel cold at home.0.713.561.07
4: In terms of overall temperature environment, how do you feel satisfied with you home throughout the year?0.803.720.82
5: In summer, my house does not feel damp.0.743.850.89
6: In spring and autumn, my house feels neither damp nor dry.0.793.850.86
7: In winter, my house does not feel too dry.0.693.740.87
8: How satisfied are you with the humidity condition in your home throughout the year?0.853.740.80
Air quality 0.793
1: Most of the time. there are few bad odors in my home.0.754.010.85
2: I rarely smell smoke from my neighbors’ kitchens or other odors from the outside.0.633.571.04
3: I do not smell toilet odor at home.0.753.750.96
4: With a good ventilation at home, I rarely feel stuffy.0.763.940.92
5: How satisfied are you with the air quality in your home?0.843.890.85
Maintenance and cleanliness 0.874
1: My home is regularly cleaned, and the floors maintained in good
condition.
0.883.920.93
2: My home is kept clean and tidy.0.913.770.92
3: How satisfied are you with the maintenance and cleanliness in your home?0.903.860.87
Table 4. Descriptive statistics and correlation matrix for the main variables.
VariableMeanSD12345678
Noise3.740.7910.468 **0.418 **0.504 **0.412 **0.411 **0.130 *0.255 **
Lighting and view3.810.72 10.621 **0.666 **0.588 **0.616 **0.120 *0.198 **
Temperature and humidity3.760.66 10.715 **0.505 **0.640 **0.180 **0.234 **
Air quality3.830.69 10.615 **0.642 **0.228 **0.212 **
Maintenance and cleanliness3.850.81 10.539 **0.137 **0.215 **
Overall satisfaction3.880.82 10.165 **0.174 **
Physical health (PCM)41.527.07 1−0.002
Mental health (MCM)47.789.44 1
Pearson correlation significant (2-tailed): *. p < 0.05, **. p < 0.01.
Table 8. Comparison between various studies: environmental factors and overall satisfaction among older adults.
Environmental FactorNoiseLighting and ViewTemperature and HumidityAir QualityMaintenance and Cleanliness
Present study ++++
[31,34] +
[43]+++
[44]++++
Factors affecting overall satisfaction: +.
Table 9. Comparison between various studies: environmental factors and physical health among older adults.
Environmental FactorNoiseLighting and ViewTemperature and HumidityAir QualityMaintenance and Cleanliness
Present study +
[27,28,29,30,41] +
[31] +
[36]+
[42,49] +
[50] +
Factors affecting physical health: +.
Table 10. Comparison between various studies: environmental factors and mental health among older adults.
Environmental FactorNoiseLighting and ViewTemperature and HumidityAir QualityMaintenance and Cleanliness
Our study+
[31] ++
[37]+
[38,49] +
[51] +
Factors affecting mental health: +.
Disclaimer/Publisher’s Note: The statements, opinions and data contained in all publications are solely those of the individual author(s) and contributor(s) and not of MDPI and/or the editor(s). MDPI and/or the editor(s) disclaim responsibility for any injury to people or property resulting from any ideas, methods, instructions or products referred to in the content.

