Article

Mechanical Properties of Post-Filling Coarse Aggregate Concrete under Biaxial Tension–Compression

1
State Key Laboratory of Coastal and Offshore Engineering, School of Civil Engineering, Dalian University of Technology, Dalian 116024, China
2
College of Ocean and Civil Engineering, Dalian Ocean University, Dalian 116023, China
*
Author to whom correspondence should be addressed.
Buildings 2024, 14(1), 203; https://doi.org/10.3390/buildings14010203
Submission received: 5 December 2023 / Revised: 2 January 2024 / Accepted: 9 January 2024 / Published: 12 January 2024
(This article belongs to the Section Building Materials, and Repair & Renovation)

Abstract

:
Post-filling coarse aggregate concrete (PFCC) is a new type of concrete that achieves energy-saving and emission-reduction goals through optimizing material proportions. The post-filled coarse aggregates can save the amount of cement material used, improve the strength and elastic modulus, prolong the service life of the material, and reduce expenses. We conducted a biaxial tension–compression test on PFCC cubic specimens, analyzed the strength and stress–strain curve regularity under different post-filling ratios (PFRs) and stress ratios, and proposed a new failure criterion suitable for PFCC. The results demonstrated that the tensile strength and compressive strength of each post-filling ratio concrete specimen under biaxial tension–compression action are lower than its uniaxial tensile and uniaxial compressive strength under the same post-filling ratio. Under the same stress ratio, the variation pattern of the post-filling ratio was the same as that under uniaxial stress, with the maximum value occurring at a PFR of 20%. The strength change rule was affected by both the stress ratio and the post-filling ratio. From the stress–strain curve, it can be seen that the presence of tensile stress significantly reduces the stiffness and ductility of PFCC under biaxial tensile and compressive loading. The strain corresponding to the peak strength of the σ3/fc-ε3 curve was much smaller than the peak strain under uniaxial compression. For example, at a stress ratio of (0.05:1), the strain ε3 in the compression direction was on average about 50% to 60% of the uniaxial compression strain under the same PFR. The stress–strain curve of PFCC under biaxial tensile and compressive loading was approximately linear throughout the loading process. A failure criterion for PFCC under biaxial tension–compression loading was established, and the calculated values agreed well with the test values. This paper provides references and research data for the study of PFCC under complex stress conditions.

1. Introduction

At present, concrete is the most widely used civil engineering material in the world, accounting for more than 90% of construction materials (cement, steel, and wood). The extensive use of concrete is accompanied by a large demand for cement production. The production of cement produces a large amount of CO2 and sulfide gases, which can cause great damage to the environment. The requirement of “strengthening the research and application of new cementitious materials, low-carbon concrete, wood and bamboo building materials, and other low-carbon building materials” was clearly put forward in the newly released “Action Plan for Carbon Peaking before 2030” in the chapter “Promoting the Carbon Peaking of Building Materials Industry”. Among them, green low-carbon concrete [1,2] has received widespread attention in recent years, which is characterized by environmental protection, high performance, and high durability.
Adjusting the properties of concrete by improving the mix ratio is one of the most commonly used methods. The resulting “coarse aggregate interlocking concrete” was proposed and developed by the United States, Japan, and other countries and has been in use ever since. Currently, “interlocking concrete” can be divided into the following four categories: roller compacted concrete, preplaced aggregate concrete, and rock-filled concrete [3,4,5]. Interlocking concrete can form an interlocking skeleton structure by increasing the amount of coarse aggregate, reducing the proportion of binding materials, and increasing the aggregate–cement ratio. In the concrete framework model [6], coarse aggregates form the most compact packing state under the action of mechanical stirring, vibration, and gravity according to a certain coordination form, and mortar is filled in the skeleton of coarse aggregates to play a bonding role, eventually combining to form a strong ensemble. This model reflects the skeleton role of “coarse aggregate interlocking concrete”. The coarse aggregate is the most strong and stable component of the raw materials of concrete [7,8]. When the volume fraction is between 40% and 80%, the basic strength and the elastic modulus of concrete will increase as the volume fraction of coarse aggregates increase [9]. Due to the high strength and strong crack resistance of the coarse aggregate, it can greatly improve the shrinkage deformation, elastic modulus, strength, and durability of concrete [10]. The enhancement of the coarse aggregate skeleton and the relative reduction in the amount of cementitious materials reduce the shrinkage deformation of the concrete, effectively improving early cracking problems, thus enhancing the durability of the concrete. At the same time, a reduction in the use of binding materials not only reduces the cost of concrete, but also reduces the environmental impact. Therefore, “coarse aggregate interlocking concrete”, as a new type of green low-carbon concrete, is an important breakthrough in the history of the development of new building materials. Currently, “coarse aggregate interlocking concrete” has been widely applied in some bridge and tunnel structures and large-scale water conservancy dams. Shen [11] first applied coarse aggregate interlocking concrete to building structures and proposed scattering filling coarse aggregate concrete. Research has shown that as the content of coarse aggregate increases from 10% to 30%, the strength of the concrete increases significantly [12]. By observing the interfacial transition zone (ITZ) of reference concrete and scattering filling coarse aggregate concrete using scanning electron microscopy (SEM), it was found that the interfacial transition zone of scattering filling coarse aggregate concrete is much denser than that of ordinary concrete [13]. This is due to the fact that the scattered coarse aggregate absorbs water from the reference concrete, which reduces the water–binder ratio in the interfacial transition zone, increases the density of the concrete, and improves its strength and durability.
Based on “coarse aggregate interlocking concrete”, our research group proposed a pumpable green low-carbon concrete—“post-filling coarse aggregate concrete” (PFCC) [14]. The post-filling coarse aggregate process is used to transport pumpable commercial concrete to the working face. Then, a certain proportion of coarse aggregate is added for secondary mixing, which is followed by concreting and vibration processes (Figure 1). Replacing cement with coarse aggregate can solve the problems of aggregate suspension and excessive slurry in high-performance concrete.
The “post-filling ratio” (PFR) refers to the volume fraction of the post-filled coarse aggregate in the PFCC relative to the reference concrete. The post-filled coarse aggregate makes the concrete interior more homogeneous, more compactly arranged, and with a higher degree of overlap [14]. As the PFR increases, it gradually reaches a state of interlocking and densification from a suspended state, thus forming a complete structural skeleton. It plays a role in increasing the compressive strength and elastic modulus [15]. In addition, the post-filled dry coarse aggregate can absorb part of the surrounding water, making cement hydration more complete, reducing the porosity, and making the ITZ denser, thus improving the concrete performance indicators determined by the bond strength of the ITZ [12]. Simultaneously, it reduces the early self-shrinkage of the concrete, reduces the possibility of early cracking in the structure, and improves durability to a certain extent. At the same time, reducing cement content can greatly reduce CO2 emissions. The improvement in performance and environmental friendliness positions PFCC as a sustainable green concrete.
So far, our research group has conducted experimental and theoretical research on PFCC [14]. As the PFR increases, its ability to resist deformation and cracking first increases to a maximum and then decreases. The deformation performance of concrete under uniaxial stress and the ability to transition from uniform plastic deformation to concentrated deformation are both improved. The optimal PFR at this time is 15% to 20%. In an experimental study of the components of PFCC, the axial compression column was found to have the highest bearing capacity when the PFR was 10%. An eccentric compression test [16] on the PFCC columns showed that when the PFR was 20%, the ultimate loading capacity of the column specimens was the highest, regardless of large or small eccentricity. When under small eccentric compression, the column with a 10% PFR had the best ductility, whereas for large eccentric compression, the highest ductility of the column appeared at a PFR of 20%. In a study of PFCC beam specimens, it was found that the shear resistance of the beam reached its maximum at a PFR between 10% and 15% [17], whereas the optimal flexural resistance appeared at a PFR of 20%. In some tests [17], it was found that the cement used in the PFCC was 90% of the reference concrete, which saved 10% cement.
At present, a large number of experimental studies have been conducted on the basic mechanical properties and durability of post-filling coarse aggregate concrete, as well as the mechanical properties of its components, but all under uniaxial stress conditions. In reality, it is very rare to be in an ideal uniaxial stress state. In roads, bridges, and building structures, there are many structures that are in a multiaxial tension–compression state, and the simultaneous existence of tension and compression will lead to a structural strength significantly lower than that under uniaxial stress, which is extremely unfavorable for the components under this stress condition. However, the mechanical properties of PFCC under complex actions have not yet been reported. In this context, this paper will analyze the mechanical and deformation properties of PFCC under uniaxial tension and biaxial tension–compression. Five different PFRs and four biaxial tension–compression stress ratios were used as variables to conduct experimental research on PFCC. We observed and analyzed the variation laws of failure modes, peak stresses, and strains with different PFRs. Ultimately, a biaxial tensile–compressive failure criterion applicable to PFCC is proposed.

2. Test Design

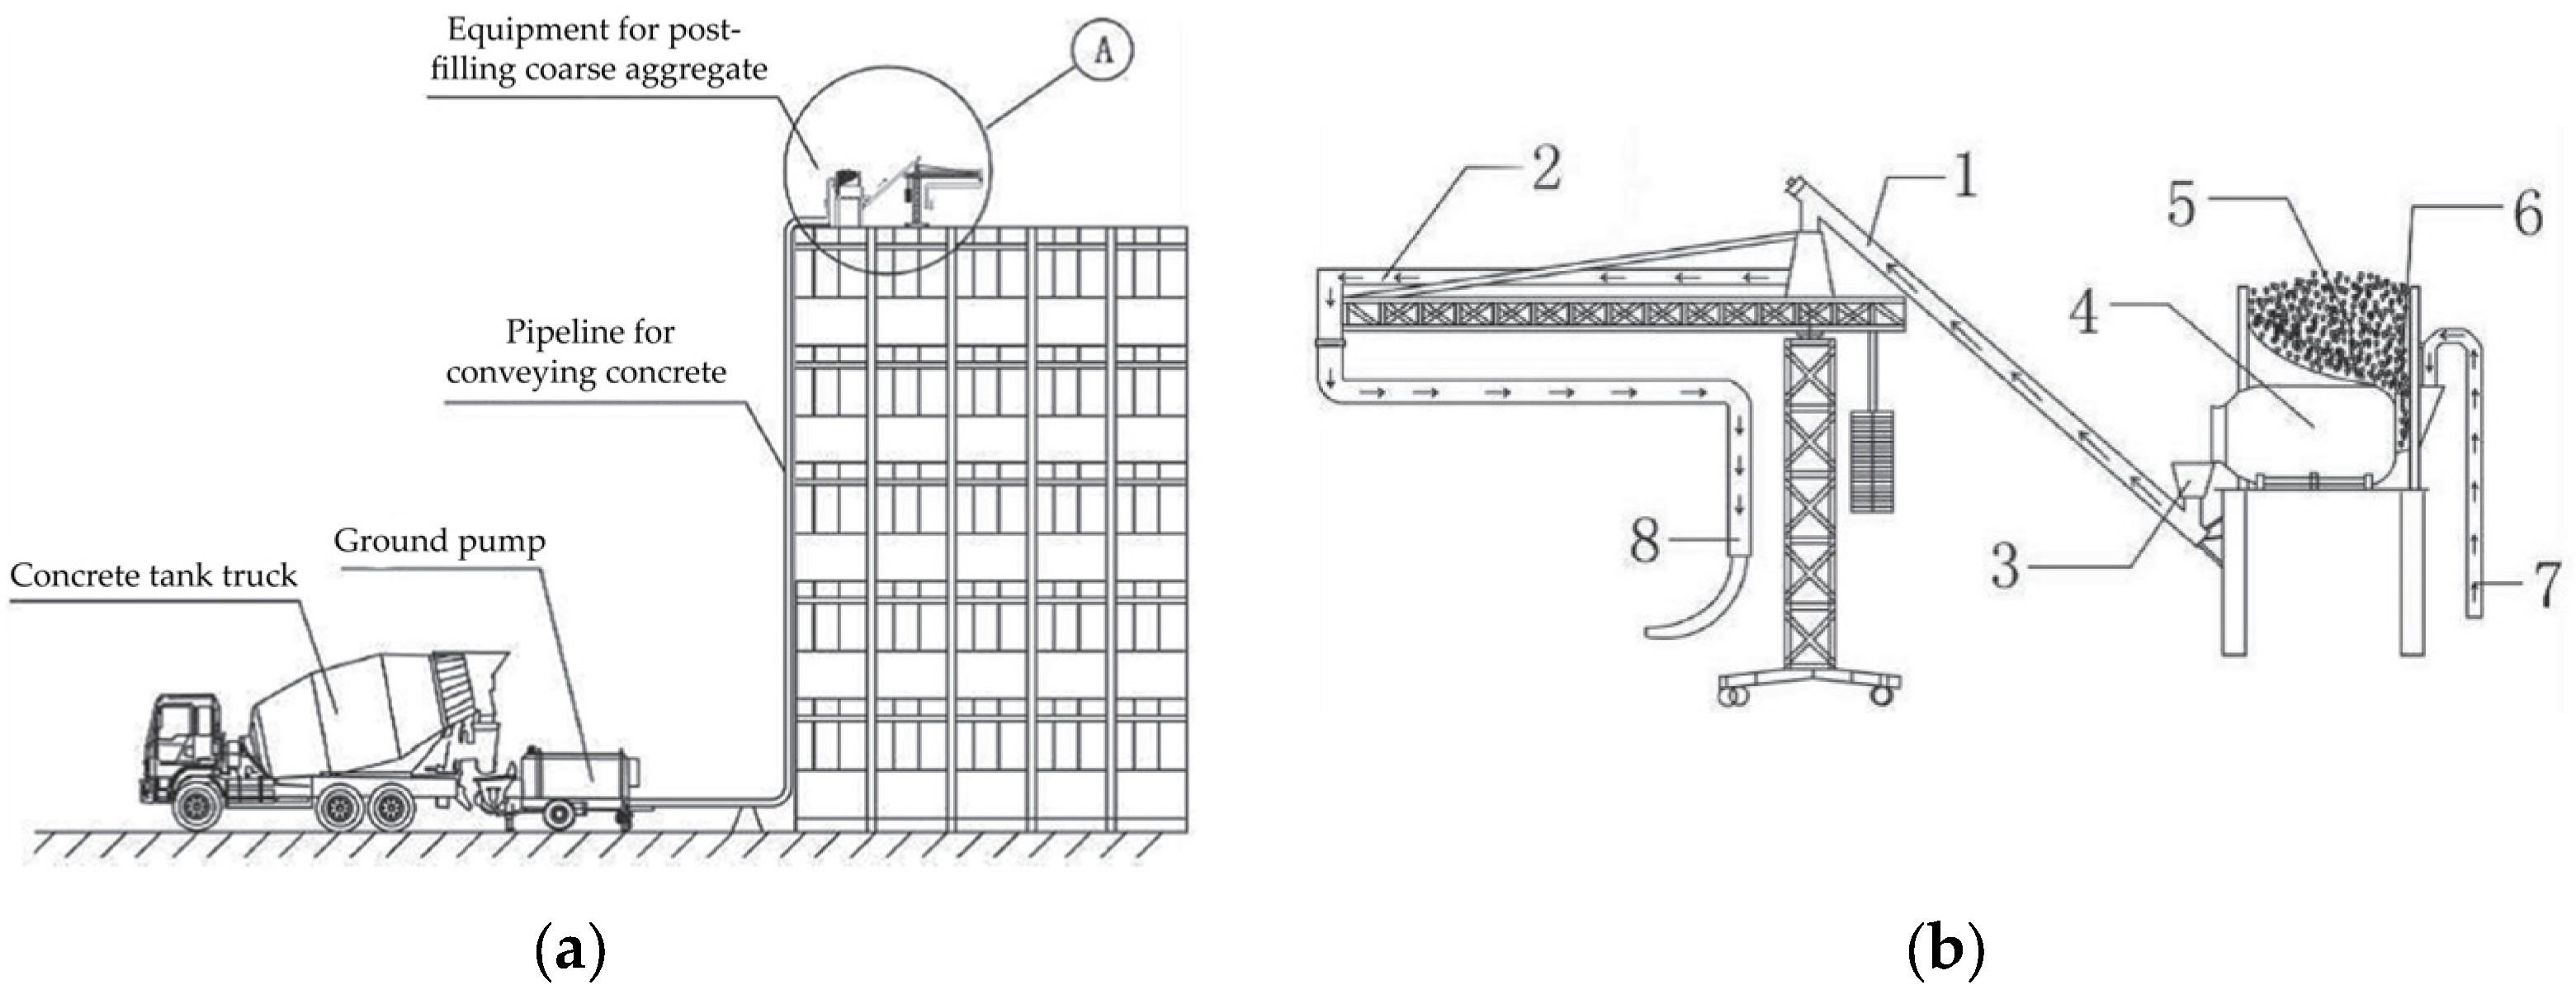
2.1. Concrete Mixtures and Specimen Preparation

The design strength of the concrete in this test was C30. P.O.42.5R grade ordinary Portland cement and grade I fly ash were used. The fine aggregate used was river sand, with an apparent density of 2600 kg/m3. The coarse aggregate used was local 5~16 mm continuously graded limestone crushed stone, and the post-filling coarse aggregate used was 10~20 mm graded limestone crushed stone. The water reducing agent used was ViscaCrete3301, with a specific gravity of 1.06~1.2 and a pH value of 6~8.
The PFCC mix proportions were determined according to the Standard for Test Method of Performance on Ordinary Fresh Concrete (GB/T 50080-2016) [18], which are listed in Table 1, with their slumps under six PFRs (0%, 10%, 15%, 20%, 25%, and 30%).
The preparation process of post-filling coarse aggregate concrete was as follows: The inner surface of the concrete mixer was first wet with water, and then weighted coarse aggregate, fine aggregate, cement, and fly-ash were added into the concrete mixer for premixing. After premixing, water containing water reducer was added while stirring and the reference concrete was obtained. The coarse aggregate was filled into the reference concrete at different post-filling ratios. The mixture was stirred for 30 s, poured into a mold (100 × 100 × 100 mm), and vibrated. After being released from the mold for 24 h, the PFCC specimens were cured in 20 ± 5 °C and 95% relative humidity for 27 days. Mechanical tests for uniaxial compression, uniaxial tension, and biaxial tension and compression were conducted according to the Standard for Test Method of Mechanical Properties on Ordinary Concrete (GB/T50081-2002) [19].

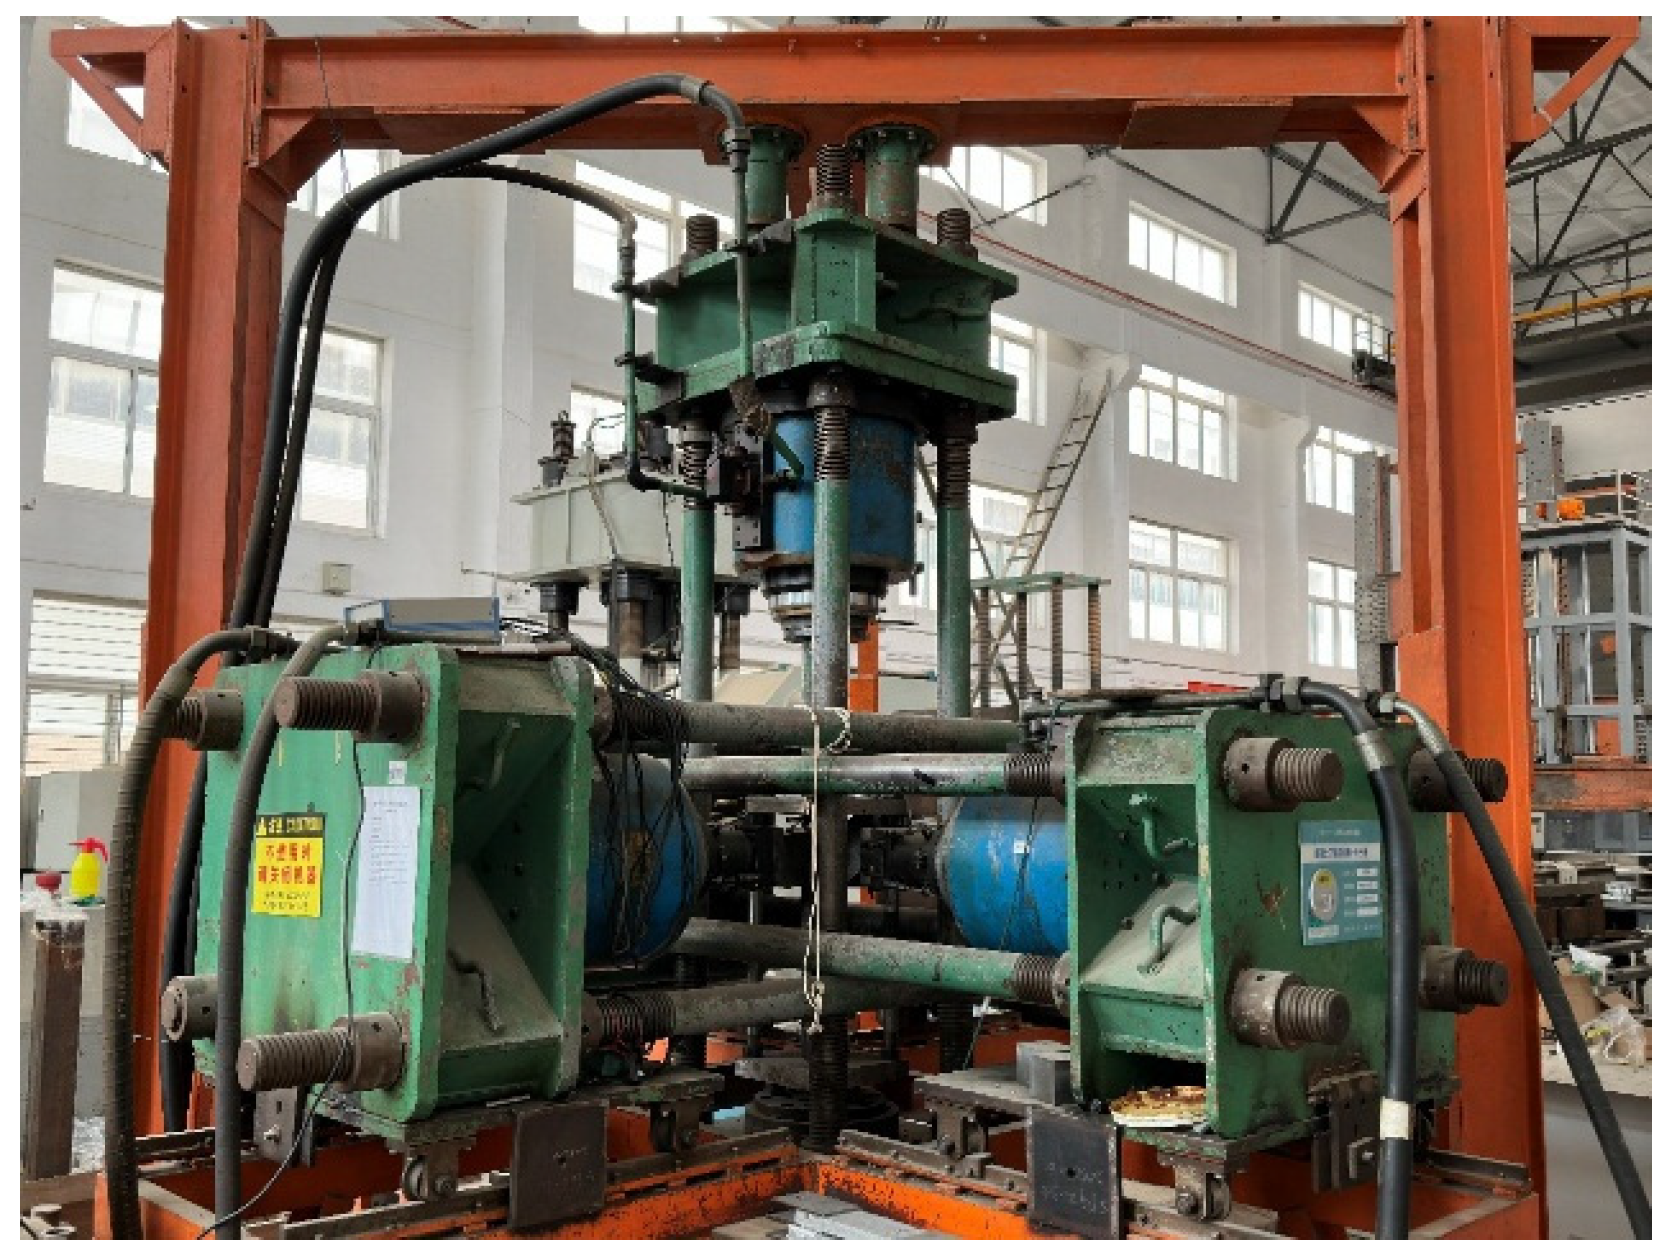
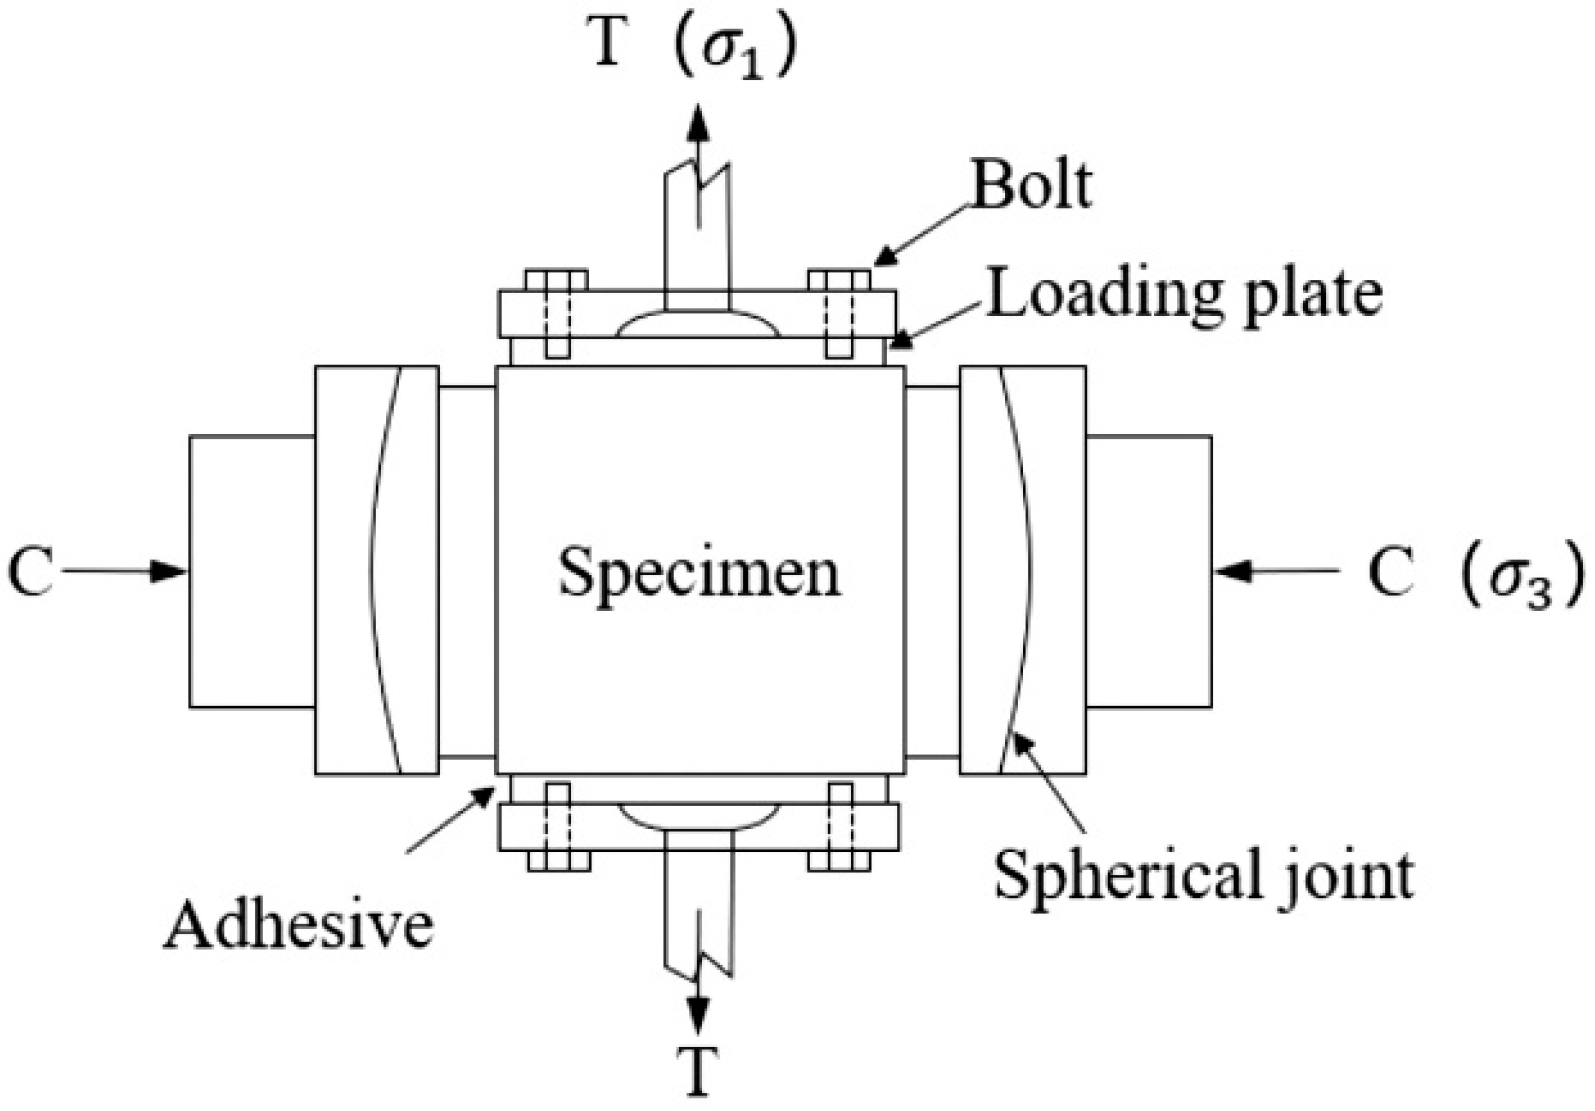
2.2. Loading Device and Test Process

The uniaxial compression, uniaxial tension, and biaxial tension–compression tests were conducted using a dynamic–static triaxial electro-hydraulic servo testing machine (Figure 2). This device can develop three independent tensile or compressive forces. LVDT was used to measure deformation, with two in each direction. The LVDTs measured the relative displacement of the two loading plates after loading, and then the average of the deformation values measured on the two opposing surfaces was calculated to obtain the strain value of the specimen in that direction. The test set the vertical z-direction (stress direction, σ 3 ) as compression and the horizontal x-direction (stress direction, σ 1 ) as tension (tension was denoted as positive and compression was denoted as negative). The tension–compression ratio was set to σ 1 : σ 3 = 0 (uniaxial compression), −0.05, −0.15, −0.25, −0.5, and ∞ (uniaxial tension). The specimens were tested using force control. The pressure was applied at a loading speed of 0.3–0.5 MPa/s in the direction of the principal stress ( σ 3 ) in uniaxial compression. The tensile force was applied with a loading speed of 0.03–0.05 MPa/s in the direction of the principal stress ( σ 1 ) in uniaxial tension and biaxial tension–compression.
In uniaxial compression and the compressive direction of biaxial tension–compression, due to friction between the loading plate of the testing machine and the concrete surface, deformation of the loading surface may be limited. It is well known that the change (increase or decrease) in concrete strength is caused by friction due to the difference in lateral stiffness between the concrete and the steel load plates [20]. Therefore, three layers of plastic film and glycerine were used between the two to reduce friction [21]. For the tensile direction, the tensile surface of the specimens was bonded to the tensile loading block using structural adhesive. To ensure that the loading block and the surface of the test specimens were firmly bonded together, the test piece surface was polished in advance to remove the weak layer of cement on the test specimen’s surface. A schematic diagram of biaxial tensile–compressive test specimen loading is shown in Figure 3 [22] (T represents the tensile direction and C represents the compressive direction).

3. Results and Discussion

3.1. Failure Mode

The failure mode of biaxial tension–compression is shown in Figure 4. The failure modes of the PFCC specimens with different post-filling ratios were basically the same, all of which exhibited tensile failure. During failure, tensile stress plays a major role, forming a through crack. The crack surface approximately forms a plane that is perpendicular to the direction of tensile stress. The locations of the cracks on the specimens lack a regular pattern and mainly depend on the distribution of tensile strength within the concrete, the initial stress, and the distribution of initial microcracks. The bonding layer on the surface of the specimen also influences the distribution of cracks. The main crack is blocked by coarse aggregate, resulting in irregular inclination angles and curvature.

3.2. Peak Stress

Table 2 shows the test values of the biaxial tension–compression peak stress of PFCC and the strain corresponding to the peak stress. The uniaxial tensile ft strength first increased and then decreased with an increase in the post-filling ratio. When the PFR reached 20%, the strength reached a maximum, which was 21.5% higher than that of the reference concrete (r = 0). The appropriate addition of post-filling coarse aggregate increased the internal compactness of the concrete, and an increase in coarse aggregate content also delayed the transition from cracking to the development of penetrating damage. Through data analysis, the relationship between the tensile strength of PFCC and the post- filling ratio was obtained as follows:
f t r f t = 7 . 887 r 2 + 2 . 503 r + 0 . 988   ( R 2 = 0 . 891 )
where ft and f t r are the uniaxial tensile strengths of the reference concrete and PFCC, respectively, and r is the post-filling ratio.
Under biaxial tension–compression, the tensile strengths and compressive strengths of concrete with different PFRs were lower than the uniaxial tensile strengths and uniaxial compressive strengths of concrete under the same PFR. The biaxial tensile strength increased as the absolute value of the stress ratio increased, reaching a maximum value when subjected to uniaxial tension. However, the compressive strength rapidly decreased as the the absolute value of the stress ratio increased, reaching a maximum value when subjected to uniaxial compression. This indicates that a larger stress ratio is more likely to cause tensile failure in concrete.
As can be seen from the table, under the same stress ratio, the variation rule in tensile strength and compressive strength with the PFR under biaxial tension–compression was the same as that under uniaxial stress. They both increased first and then decreased with increasing PFR, reaching a maximum at 20%. For example, when the stress ratio was (0.05:−1), the compressive strength and tensile strength of the concrete with a 20% post-filling ratio were −16.014 MPa and 2.402 MPa, respectively, which is 48.23% higher than that of the reference concrete. This indicates that the addition of post-filling coarse aggregate can still improve the mechanical properties of concrete under complex stress conditions.
Tensile stress can increase the rate of decline in the compressive strength of the test specimens. Taking a post-filling ratio of 30% as an example, when the stress ratio is (0.05:−1), the compressive strength is 57.72% of the uniaxial compressive strength, and when the stress ratio is (0.5:−1), the compressive strength is only 13.71% of the uniaxial compressive strength. In addition, the rate of decline in compressive strength is also related to the PFR. It was found that under the same stress ratio, the rate of decline first slows down and then increases with an increasing post-filling ratio. As the stress ratio increases, the difference in the rate of decline in compressive strength at different post-filling ratios gradually decreases. For example, at a stress ratio of (0.05:−1), the compressive strength with a post-filling ratio of 10% decreases by 41.06%, whereas the compressive strength with a post-filling ratio of 20% decreases by 36.83%, with a difference of 5%. When the stress ratio increases to (0.25:−1), the compressive strength of the two decreases at the same rate. This is due to the increase in lateral tensile stress, which intensifies the brittle failure of the specimens. Coarse aggregate is categorized as a brittle material, and its ability to resist tension is weak, so the difference in the rate of decline gradually decreases.

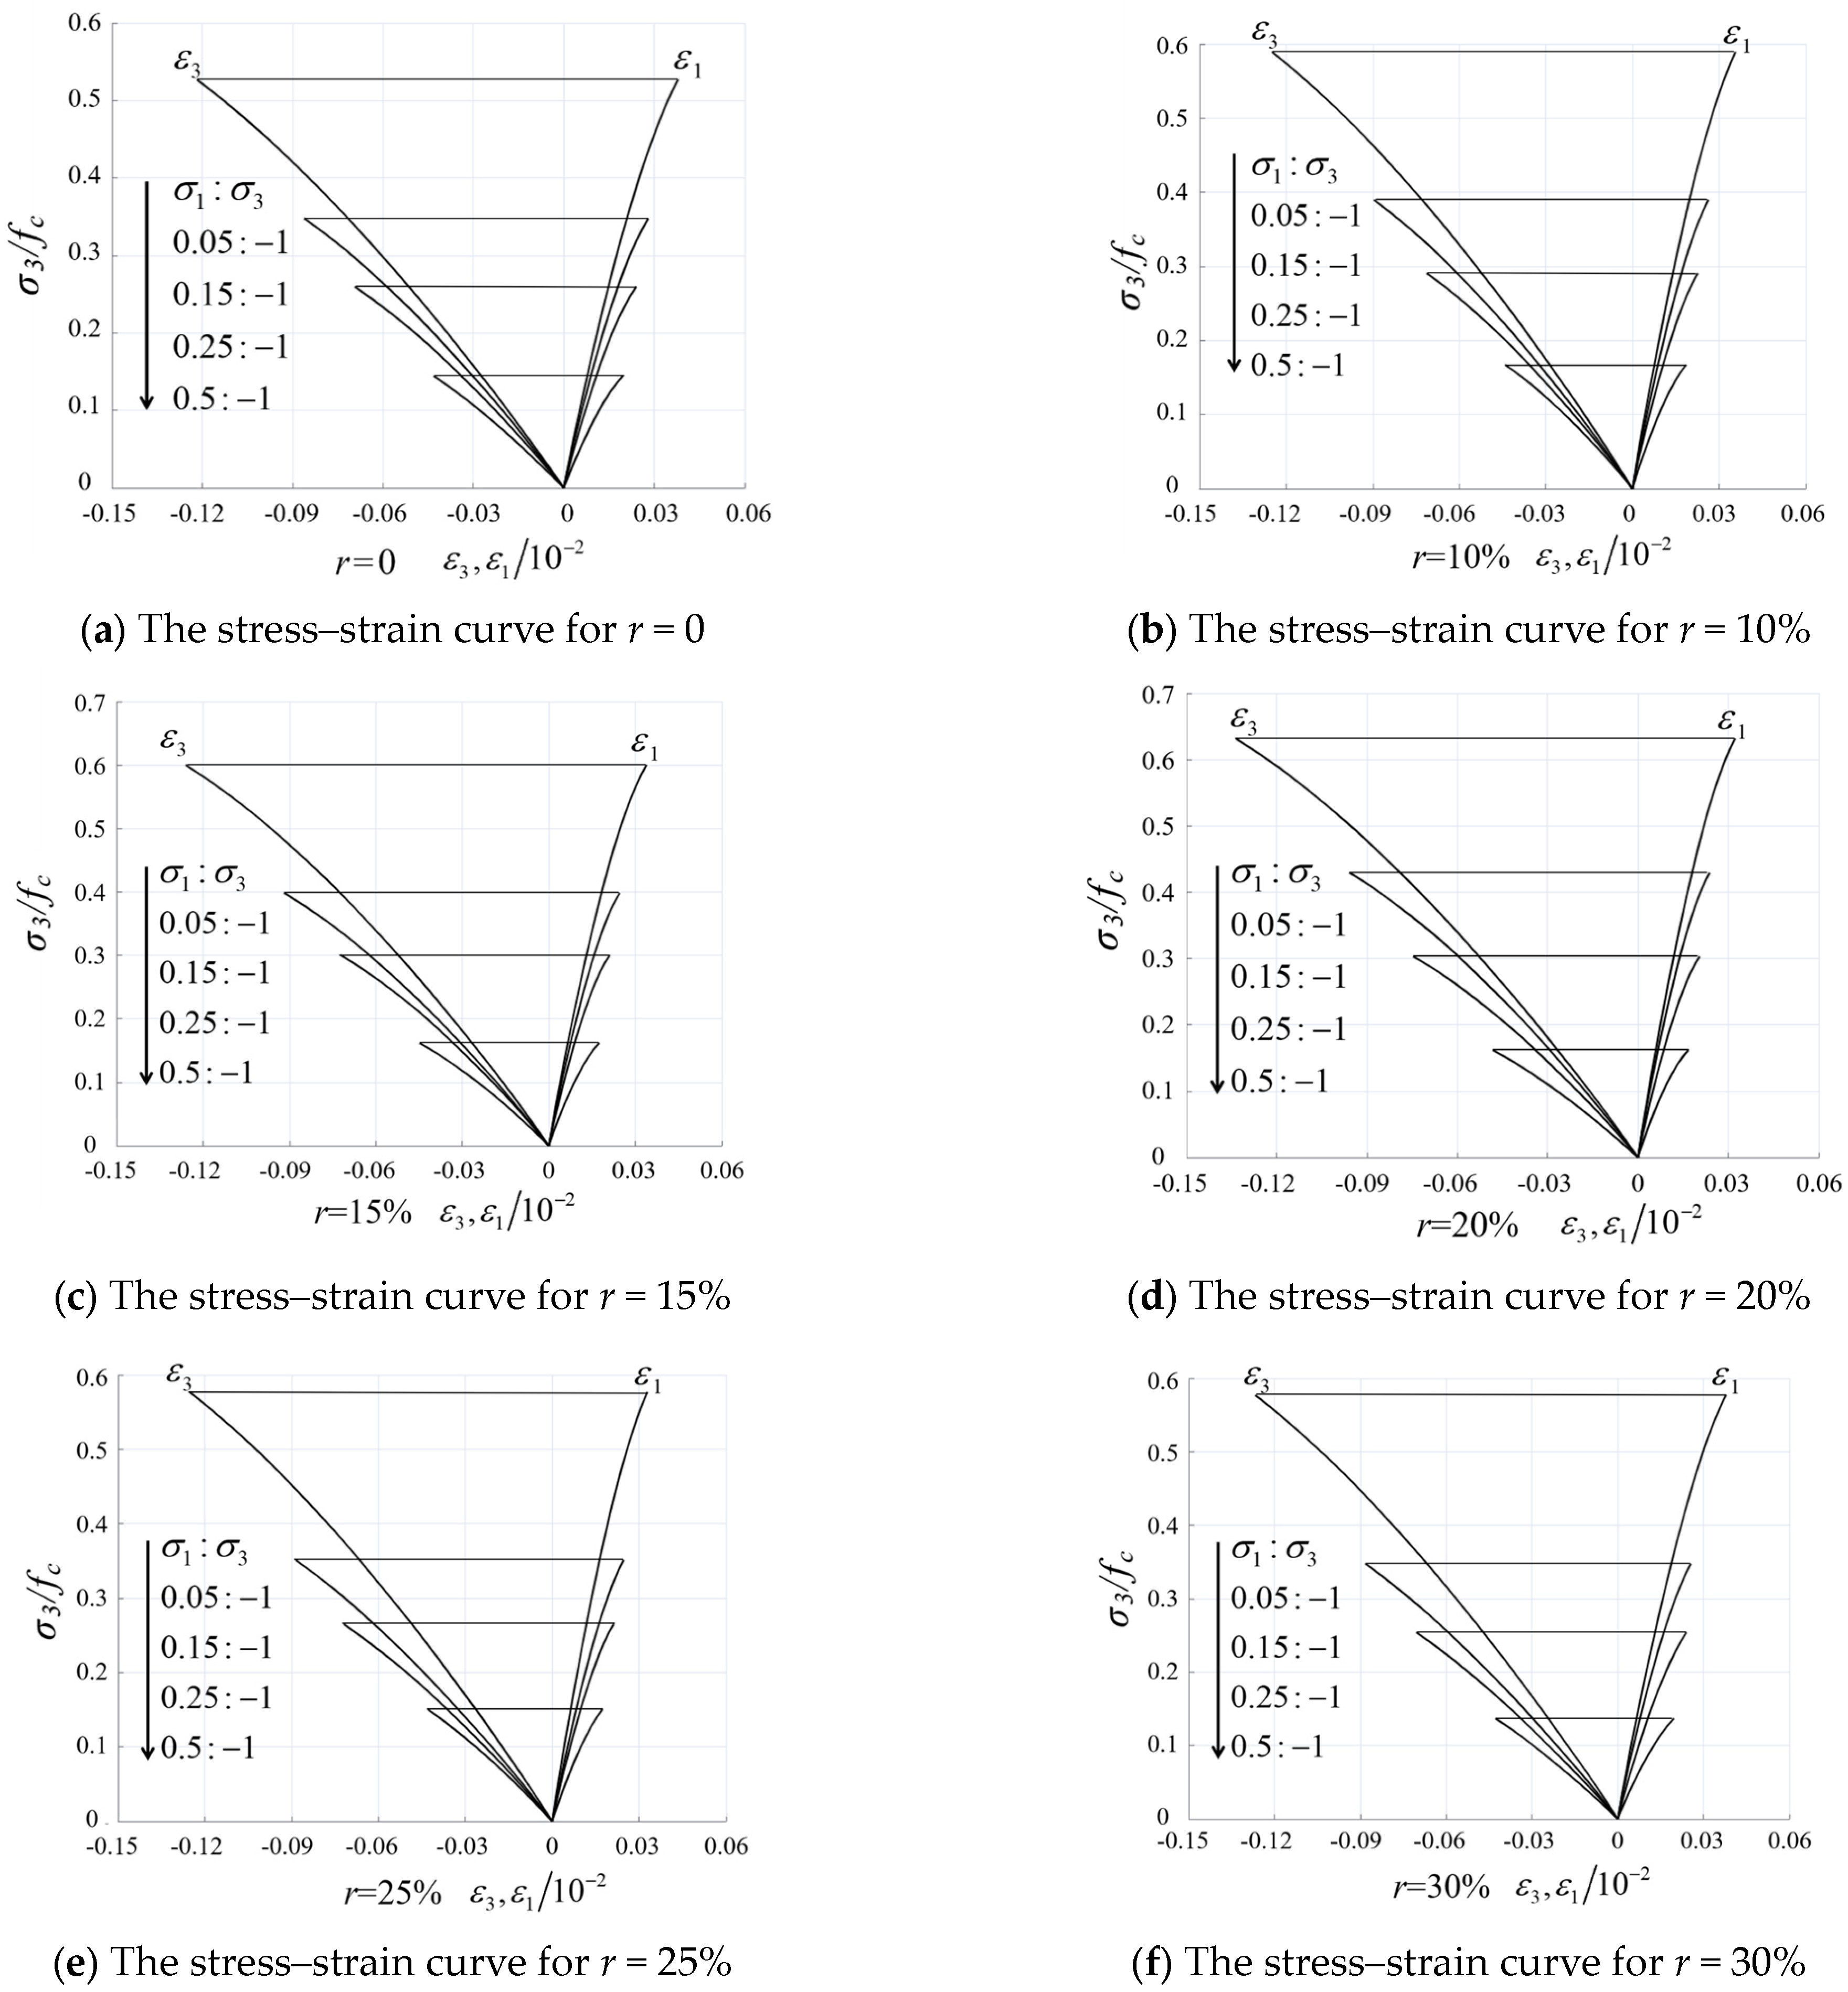
3.3. Stress–Strain Response

The biaxial tension–compression stress–strain curves at different post-filling ratios were plotted using measured data, as shown in Figure 5. Normalized stress (σ3/fc) was used as the vertical coordinate, and actual strain (ε1, ε3) was used as the horizontal coordinate. Due to the limitations of the experimental and measurement conditions, as well as the brittle nature of concrete, this experiment only obtained the rising segments of the stress–strain curves under different stress combinations in biaxial tension–compression.
As shown in the Figure 5, under biaxial tension–compression stress conditions, the stress–strain curves of different PFRs exhibited similar characteristics; that is, the rising segments of the curves were approximately linear. As the absolute value of the stress ratio increased, the linear behavior became more pronounced, and the slope of the curve gradually decreased. At the same time, the peak strain in the compressive and tensile directions also decreased rapidly.
From Figure 5 and Table 2, it can be concluded that lateral tension has a significant effect on concrete deformation. The strain corresponding to the peak strength of the σ3/fc-ε3 curve was much smaller than the peak strain under uniaxial compression. For example, at a stress ratio of (0.05:1), strain (ε3) in the compression direction was on average about 50% to 60% of the uniaxial compression strain under the same PFR. When the stress ratio reached (−0.5:1), strain (ε3) in the compression direction dropped to less than 20% of the uniaxial compression strain. This indicates that the increase in lateral tension greatly reduces concrete plastic deformation. Therefore, the σ3/fc-ε3 curve may be nonlinear only if the absolute value of the stress ratio is small.
The addition of post-filling coarse aggregate can increase the slope of the curve to a certain extent, reaching a maximum at a post-filling ratio of 20%. After this, it gradually decreases, which may be due to insufficient cement mortar to encapsulate an excess of coarse aggregate, resulting in initial defects in the interior structure, such as cracks and bubbles. When the concrete is subjected to external forces, there are weak links in the load transfer path, resulting in reduced mechanical properties [9].

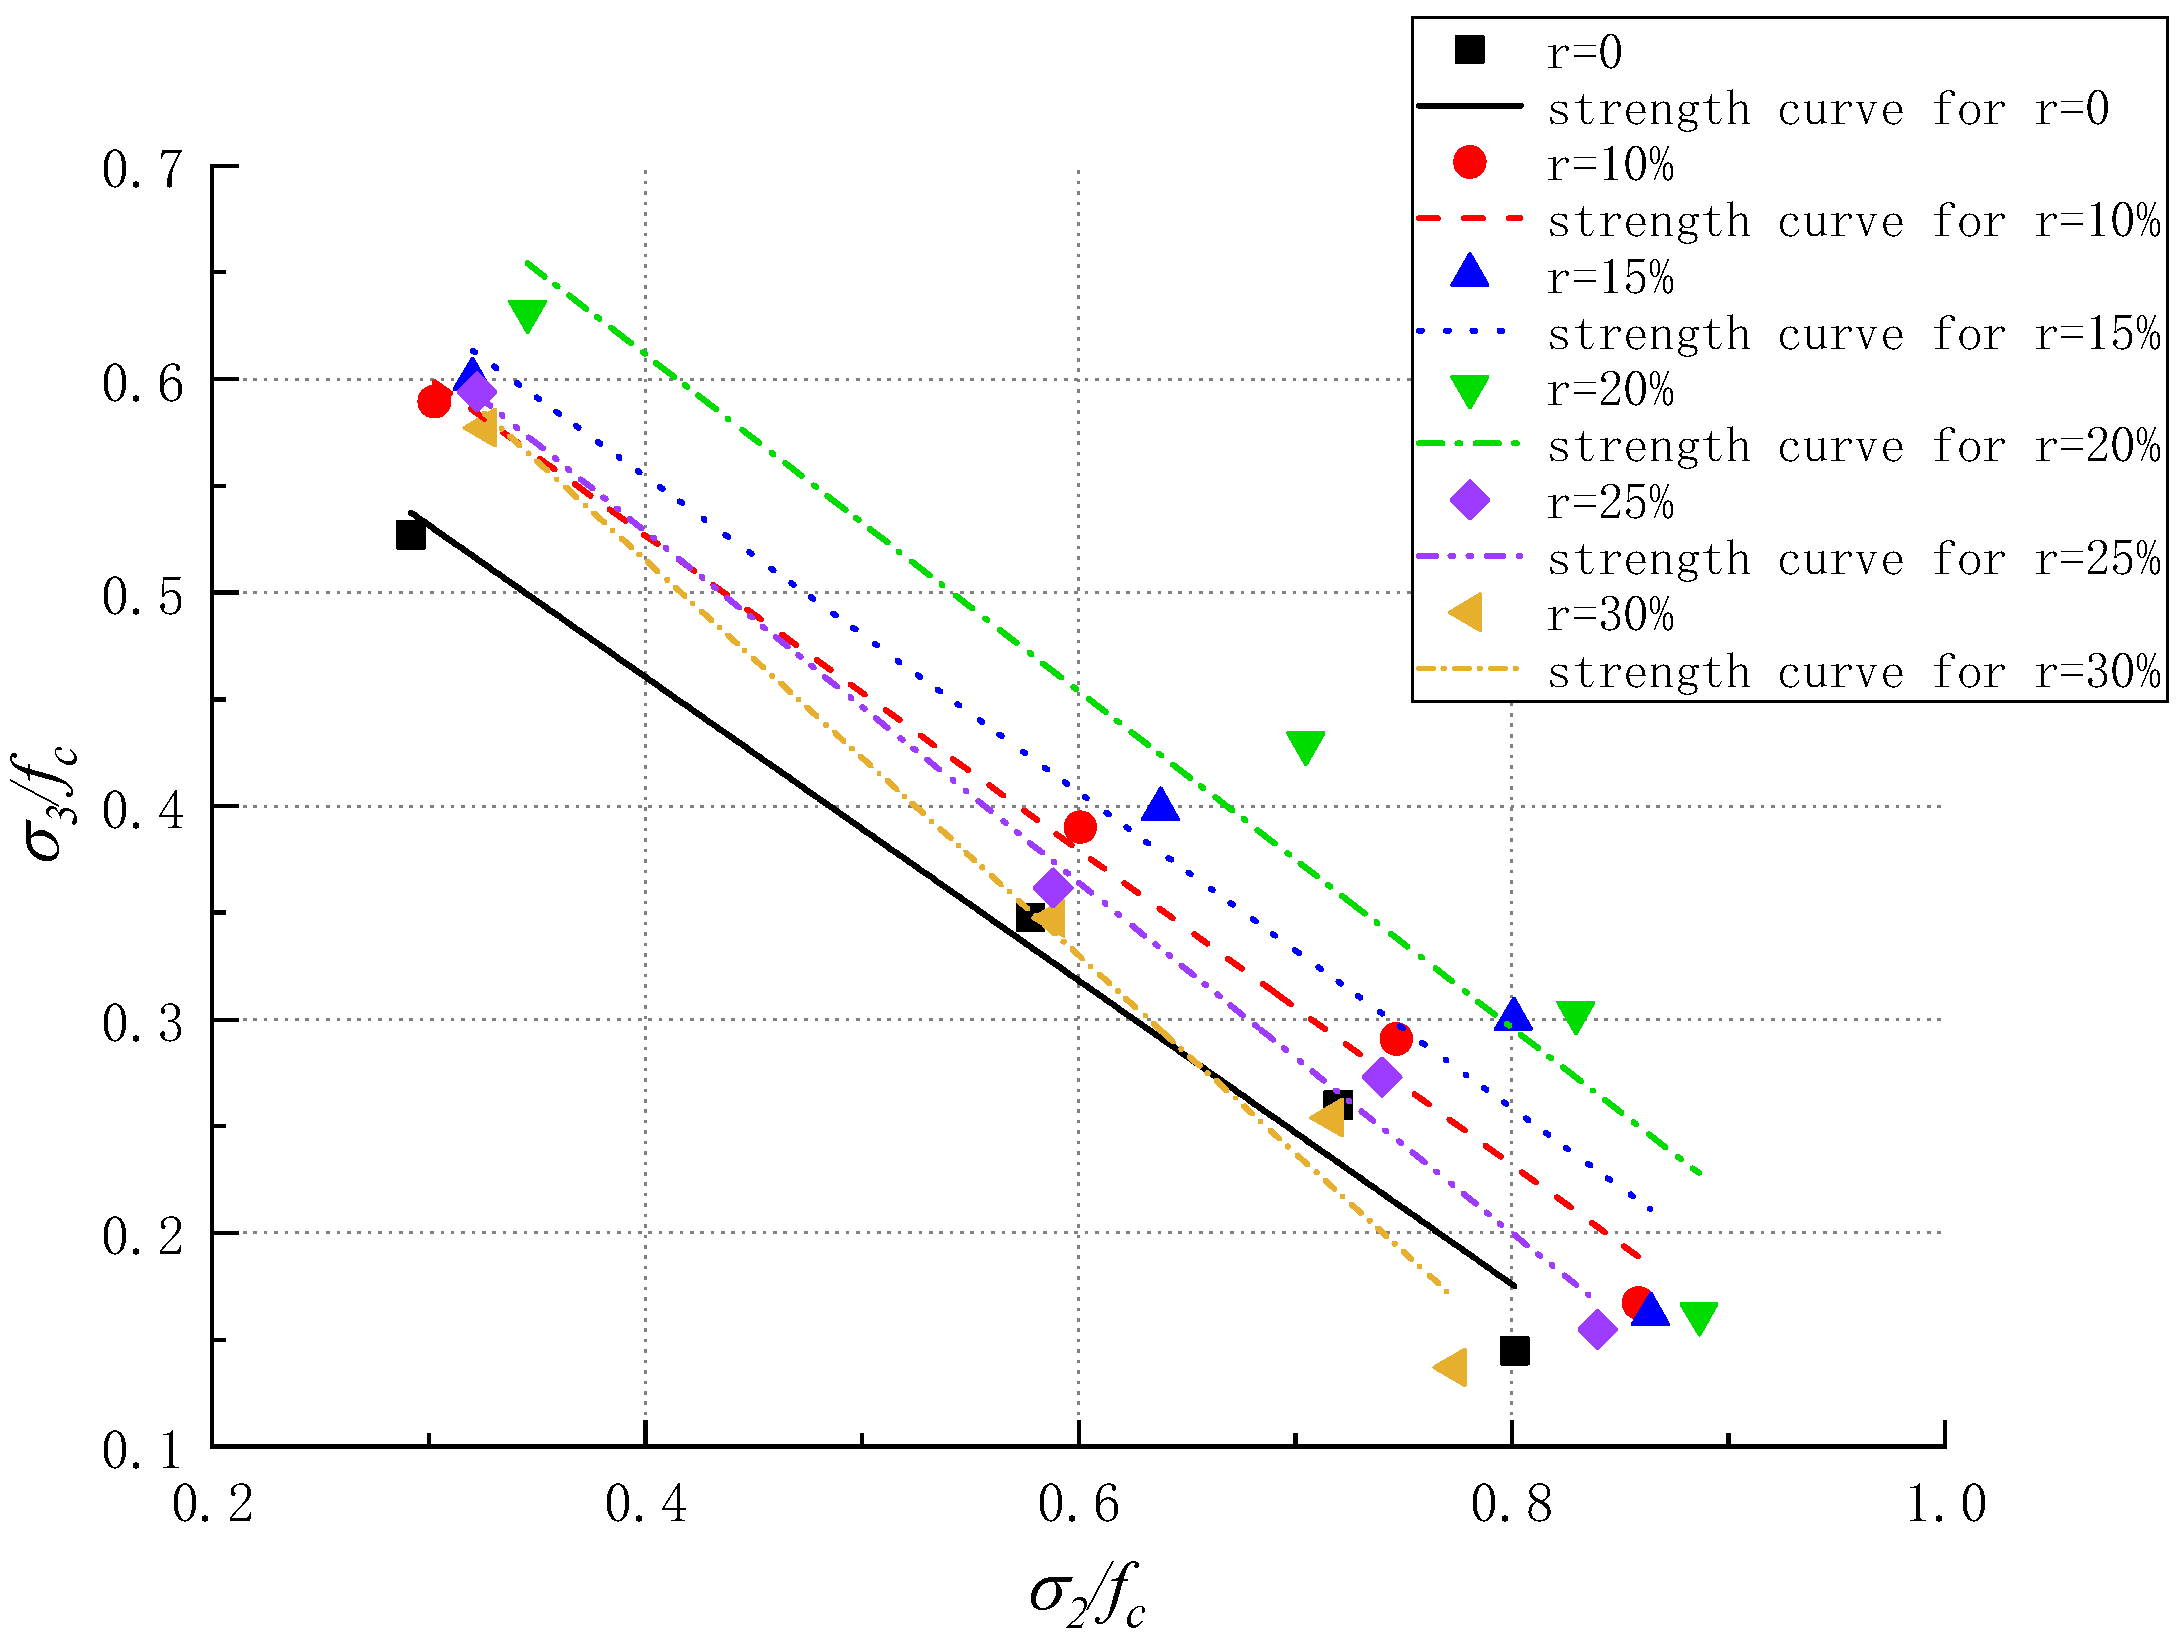
4. Failure Criterion

The variation rule of concrete strength under biaxial tension–compression with a stress ratio can be considered as either nonlinear or linear. We used the simplified biaxial tensile–compressive strength criterion for ordinary concrete proposed by Kupfer [23], which is approximately linear and is more consistent with the test results, as follows:
σ 3 f c = a × σ 1 f t + b
where f c and f t represent the uniaxial compressive strength and uniaxial tensile strength, respectively, σ 3 and σ 1 represent the compressive strength and tensile strength under biaxial tension–compression, respectively, and a and b represent parameters.
The values of a and b at different PFRs can be obtained through regression analysis, as shown in Table 3.
The parameters a and b in Table 3 were subjected to the least squares method at each post-filling ratio ( r ), resulting in the following formula:
{ a = 2.3463 r 2 + 1.1726 r + 0.7404 ( R 2 = 0.82 ) b = 3.1044 r 2 + 0.2756 r 0.7169 ( R 2 = 0.97 )
By substituting Equation (3) into Equation (2), a generalized expression for the PFCC biaxial tensile–compressive failure criterion was derived. A comparison of the damage criterion with the test values is given in Figure 6. Figure 6 demonstrates that the failure envelope of the principal stress for PFCC under biaxial tension–compression is in good agreement with the test data.

5. Conclusions

Based on the analysis of the results from both uniaxial and biaxial tension–compression tests for PFCC, the following conclusions were drawn:
  • The uniaxial tensile strength and the concrete strength under biaxial tension–compression both increase with increasing post-filling ratio, and then decrease, with the maximum value occurring at a PFR of 20%.
  • The tensile strength and compressive strength of concrete with different PFRs under biaxial tension–compression are lower than those under uniaxial tensile strength and uniaxial compressive strength at the same post-filling ratio. The variation of concrete strength with PFR is the same as that under uniaxial stress conditions.
  • The rate of decline in the compressive strength of the specimens under biaxial tension–compression is simultaneously affected by the tension–compression ratio and the post-filling ratio. Tensile stress can increase the rate of decline in compressive strength. However, the increase in the post-filling ratio first slows down and then increases the rate of decline in tensile strength.
  • From the stress–strain curves, it can be seen that tensile stress can significantly reduce the stiffness and ductility of PFCC under biaxial tension–compression. The stress–strain curve of PFCC subjected to biaxial tension–compression is approximately linear throughout the loading process.
  • We established failure criteria for biaxial tension–compression under different post-filling ratios and derived a formula for PFCC failure criteria under biaxial tension–compression through regression analysis.

Author Contributions

Conceptualization, J.J. and L.L.; methodology, L.L.; software, L.L.; validation, J.J., L.L. and W.L.; formal analysis, L.L.; investigation, L.L.; resources, J.J.; data curation, L.L.; writing—original draft preparation, L.L.; writing—review and editing, J.J.; visualization, L.L.; supervision, W.L.; project administration, W.L.; funding acquisition, J.J. and W.L. All authors have read and agreed to the published version of the manuscript.

Funding

The authors would like to acknowledge the financial support provided by the Foundation for High-Level Talent Innovation Support Program of Dalian (2019RD05), the National Key R&D Program of China (2018YFC1505302), the Liaoning Provincial Department of Education General Project (LJKZ0721), and the Liaoning Provincial Natural Science Foundation Joint Fund General Support Program Project (2023-MSLH-002).

Data Availability Statement

The data presented in this study are available on request from the corresponding author.

Conflicts of Interest

The authors declare no conflict of interest.

References

  1. Li, Q.; Yue, Q.; Jin, H.; Fen, P. Research progress on carbon emission of steel structure buildings based on carbon peak and carbon neutral. Build. Struct. 2023, 53, 1–7+36. [Google Scholar]
  2. Gan, V.J.L.; Cheng, J.C.P.; Lo, I.M.C. A Systematic Approach for Low Carbon Concrete Mix Design and Production. In Proceedings of the 3rd International Conference on Civil Engineering, Architecture and Sustainable Infrastructure (ICCEASI), Hong Kong, China, 1–3 July 2015. [Google Scholar]
  3. Modarres, A.; Hosseini, Z. Mechanical properties of roller compacted concrete containing rice husk ash with original and recycled asphalt pavement material. Mater. Des. 2014, 64, 227–236. [Google Scholar] [CrossRef]
  4. Najjar, M.F.; Soliman, A.M.; Nehdi, M.L. Critical overview of two-stage concrete: Properties and applications. Constr. Build. Mater. 2014, 62, 47–58. [Google Scholar] [CrossRef]
  5. An, X.; Wu, Q.; Jin, F.; Huang, M.; Zhou, H.; Chen, C.; Liu, C. Rock-filled concrete, the new norm of SCC in hydraulic engineering in China. Cem. Concr. Compos. 2014, 54, 89–99. [Google Scholar] [CrossRef]
  6. Wang, L.; Cao, M. Research on concrete aggregate frame model (AFM). In Proceedings of the 6th International Symposium on Cement and Concrete/Canmet-ACI International Symposium on Concrete Technology for Sustainable Development, Xi’an, China, 19–22 September 2006. [Google Scholar]
  7. Beshr, H.; Almusallam, A.A.; Maslehuddin, M. Effect of coarse aggregate quality on the mechanical properties of high strength concrete. Constr. Build. Mater. 2003, 17, 97–103. [Google Scholar] [CrossRef]
  8. Ozturan, T.; Cecen, C. Effect of coarse aggregate type on mechanical properties of concretes with different strengths. Cem. Concr. Res. 1997, 27, 165–170. [Google Scholar] [CrossRef]
  9. Stock, A.F.; Hannant, D.J.; Williams, R.I.T. Effect of Aggregate Concentration upon the Strength and Modulus of Elasticity of Concrete. Mag. Concr. Res. 1979, 31, 225–234. [Google Scholar] [CrossRef]
  10. Akçaoglu, T.; Tokyay, M.; Çelik, T. Effect of coarse aggregate size on interfacial cracking under uniaxial compression. Mater. Lett. 2002, 57, 828–833. [Google Scholar] [CrossRef]
  11. Shen, W.G.; Yang, Z.G.; Yang, Z.F.; Li, J.F.; Cao, L.; Zhang, C. Scattering-Filling Stone Concrete: Mechanism, Experiment and Utilization. Key Eng. Mater. 2014, 629–630, 522–527. [Google Scholar] [CrossRef]
  12. Shen, W.; Dong, R.; Li, J.; Zhou, M.; Ma, W.; Zha, J. Experimental investigation on aggregate interlocking concrete prepared with scattering–filling coarse aggregate process. Constr. Build. Mater. 2010, 24, 2312–2316. [Google Scholar] [CrossRef]
  13. Shen, W.; Zhang, T.; Zhou, M.; Cai, Z.; Hu, J.; Li, J. Investigation on the scattering-filling coarse aggregate self-consolidating concrete. Mater. Struct. 2010, 43, 1343–1350. [Google Scholar] [CrossRef]
  14. Jia, J.; Cao, Q.; Luan, L.; Wang, Z.; Zhang, L. Mechanical Properties of Large Slump Concrete Made by Post-Filling Coarse Aggregate Mixing Procedure. Materials 2020, 13, 2761. [Google Scholar] [CrossRef] [PubMed]
  15. Li, B.; Yu, Y.; Zhang, C.; Zhang, Y. Mesoscopic Fracture Model of Coarse Aggregate Interlocking Concrete. Adv. Mater. Sci. Eng. 2022, 2022, 3453797. [Google Scholar] [CrossRef]
  16. Cao, Q.; Jia, J.; Zhang, L.; Ye, H. Steel reinforced post-filling coarse aggregate concrete columns under eccentric compression. Constr. Build. Mater. 2021, 270, 121420. [Google Scholar] [CrossRef]
  17. Jia, J.; Cao, Q.; Zhang, L.; Hu, Y.; Meng, Z. Shear Behavior of Reinforced Post-Filling Coarse Aggregate Concrete Beams Produced by Creative Construction Process. Buildings 2021, 11, 576. [Google Scholar] [CrossRef]
  18. GB/T 50080-2016; Standard for Test Method of Performance on Ordinary Fresh Concrete. China Architecture and Building Press: Beijing, China, 2016.
  19. GB/T50081-2002; Standard for Test Method of Mechanical Properties on Ordinary Concrete. China Architecture and Building Press: Beijing, China, 2003; 69p.
  20. Shang, H.; Yang, S.; Niu, X. Mechanical behavior of different types of concrete under multiaxial tension–compression. Constr. Build. Mater. 2014, 73, 764–770. [Google Scholar] [CrossRef]
  21. Shang, H.; Song, Y. Experimental study of strength and deformation of plain concrete under biaxial compression after freezing and thawing cycles. Cem. Concr. Res. 2006, 36, 1857–1864. [Google Scholar] [CrossRef]
  22. Cao, Q.; Lv, X.; Wu, Z.; Zhou, C.; Wang, X. Failure Criteria and Constitutive Model of Polypropylene Fiber-Reinforced Expansive Self-Consolidating Concrete under Biaxial Loading. J. Mater. Civ. Eng. 2021, 33, 04021371. [Google Scholar] [CrossRef]
  23. Kupfer, H.; Hilsdorf, H.K.; Rusch, H. Behavior of Concrete under Biaxial Stresses. ACI J. Proc. 1969, 66, 656–666. [Google Scholar] [CrossRef]
Figure 1. Schematic diagram of innovative concrete placement technology for PFCC in engineering construction. 1. First spiral mixing conveyor, 2. secondary spiral mixing conveyor, 3. connection funnel, 4. forced mixer, 5. coarse aggregate storage silo, 6. electronic feeding controller, 7. concrete pumping pipe with commercial concrete, 8. concrete distribution pipe. (a) Concrete placement technology for post-filling coarse aggregate concrete; (b) zoom in view of “A”.
Buildings 14 00203 g001
Figure 2. Dynamic–static triaxial electro-hydraulic servo testing machine.
Buildings 14 00203 g002
Figure 3. Loading diagram of the biaxial tension–compression test.
Buildings 14 00203 g003
Figure 4. Failure mode under biaxial tension–compression.
Buildings 14 00203 g004
Figure 5. The stress–strain curve of PFCC under biaxial tension–compression.
Buildings 14 00203 g005
Figure 6. Comparison between the failure criteria and the test data for PFCC under biaxial tension–compression.
Buildings 14 00203 g006
Table 1. PFCC mix proportion and slump.
Concrete GradePFR (%)Mass per Unit Volume (kg/m3)Slump (mm)
CementFly AshCoarse AggregateSandWater ReducerWaterPost-Filling Coarse Aggregate
C300326829508425.302000220
10293748557584.77180260180
15277708087164.51170390165
20261667606744.24160520140
25245627136323.98150650120
30228576655893.71140780100
Table 2. The biaxial tension–compression peak stress and the corresponding strain of PFCC.
Post-Filling Ratio/ r Stress Ratio
α = σ 1 : σ 3
σ 1 /MPa σ 3 /MPa ε 1 / 10 2 ε 3 / 10 2
00:−10−31.060-−0.245
0.05:−10.819−16.3720.038−0.122
0.15:−11.621−10.8030.028−0.086
0.25:−12.019−8.0760.024−0.069
0.50:−12.248−4.4950.020−0.043
1:02.8050.0000.015-
10%0:−10.000−34.250-−0.231
0.05:−11.009−20.1860.036−0.125
0.15:−12.004−13.3570.026−0.090
0.25:−12.490−9.9610.023−0.071
0.50:−12.863−5.7260.019−0.044
1:03.1350.0000.015-
15%0:−10.000−35.810-−0.216
0.05:−11.075−21.4920.034−0.126
0.15:−12.141−14.2720.025−0.092
0.25:−12.688−10.7510.021−0.072
0.50:−12.900−5.8000.018−0.045
1:03.3560.0000.014-
20%0:−10.000−37.290-−0.209
0.05:−11.178−23.5560.032−0.133
0.15:−12.402−16.0140.024−0.096
0.25:−12.827−11.3090.020−0.075
0.50:−13.021−6.0420.017−0.048
1:03.4080.0000.014-
25%0:−10.000−34.530-−0.217
0.05:−10.996−19.9210.033−0.125
0.15:−11.818−12.1220.025−0.089
0.25:−12.288−9.1500.021−0.072
0.50:−12.595−5.1910.017−0.043
1:03.0910.0000.014-
30%0:−10.000−32.470-−0.245
0.05:−10.937−18.7440.038−0.127
0.15:−11.693−11.2850.026−0.088
0.25:−12.063−8.2500.024−0.070
0.50:−12.226−4.4510.020−0.043
1:02.8770.0000.014-
Table 3. Regression coefficients of the failure criterion for PFCC.
010%15%20%25%30%
a 0.7450.8210.8500.9270.8570.886
b −0.711−0.737−0.740−0.789−0.822−0.926
R 2 0.9750.9890.9530.9230.9920.979
Disclaimer/Publisher’s Note: The statements, opinions and data contained in all publications are solely those of the individual author(s) and contributor(s) and not of MDPI and/or the editor(s). MDPI and/or the editor(s) disclaim responsibility for any injury to people or property resulting from any ideas, methods, instructions or products referred to in the content.

