
Thermal Performance of Residential Roofs in Malaysia: Experimental Study Using an Indoor Solar Simulator


Abstract
1. Introduction
1.1. Research Background
1.2. Previous Work
1.3. Research Objectives
2. Laboratory Measurement—Indoor Solar Simulator
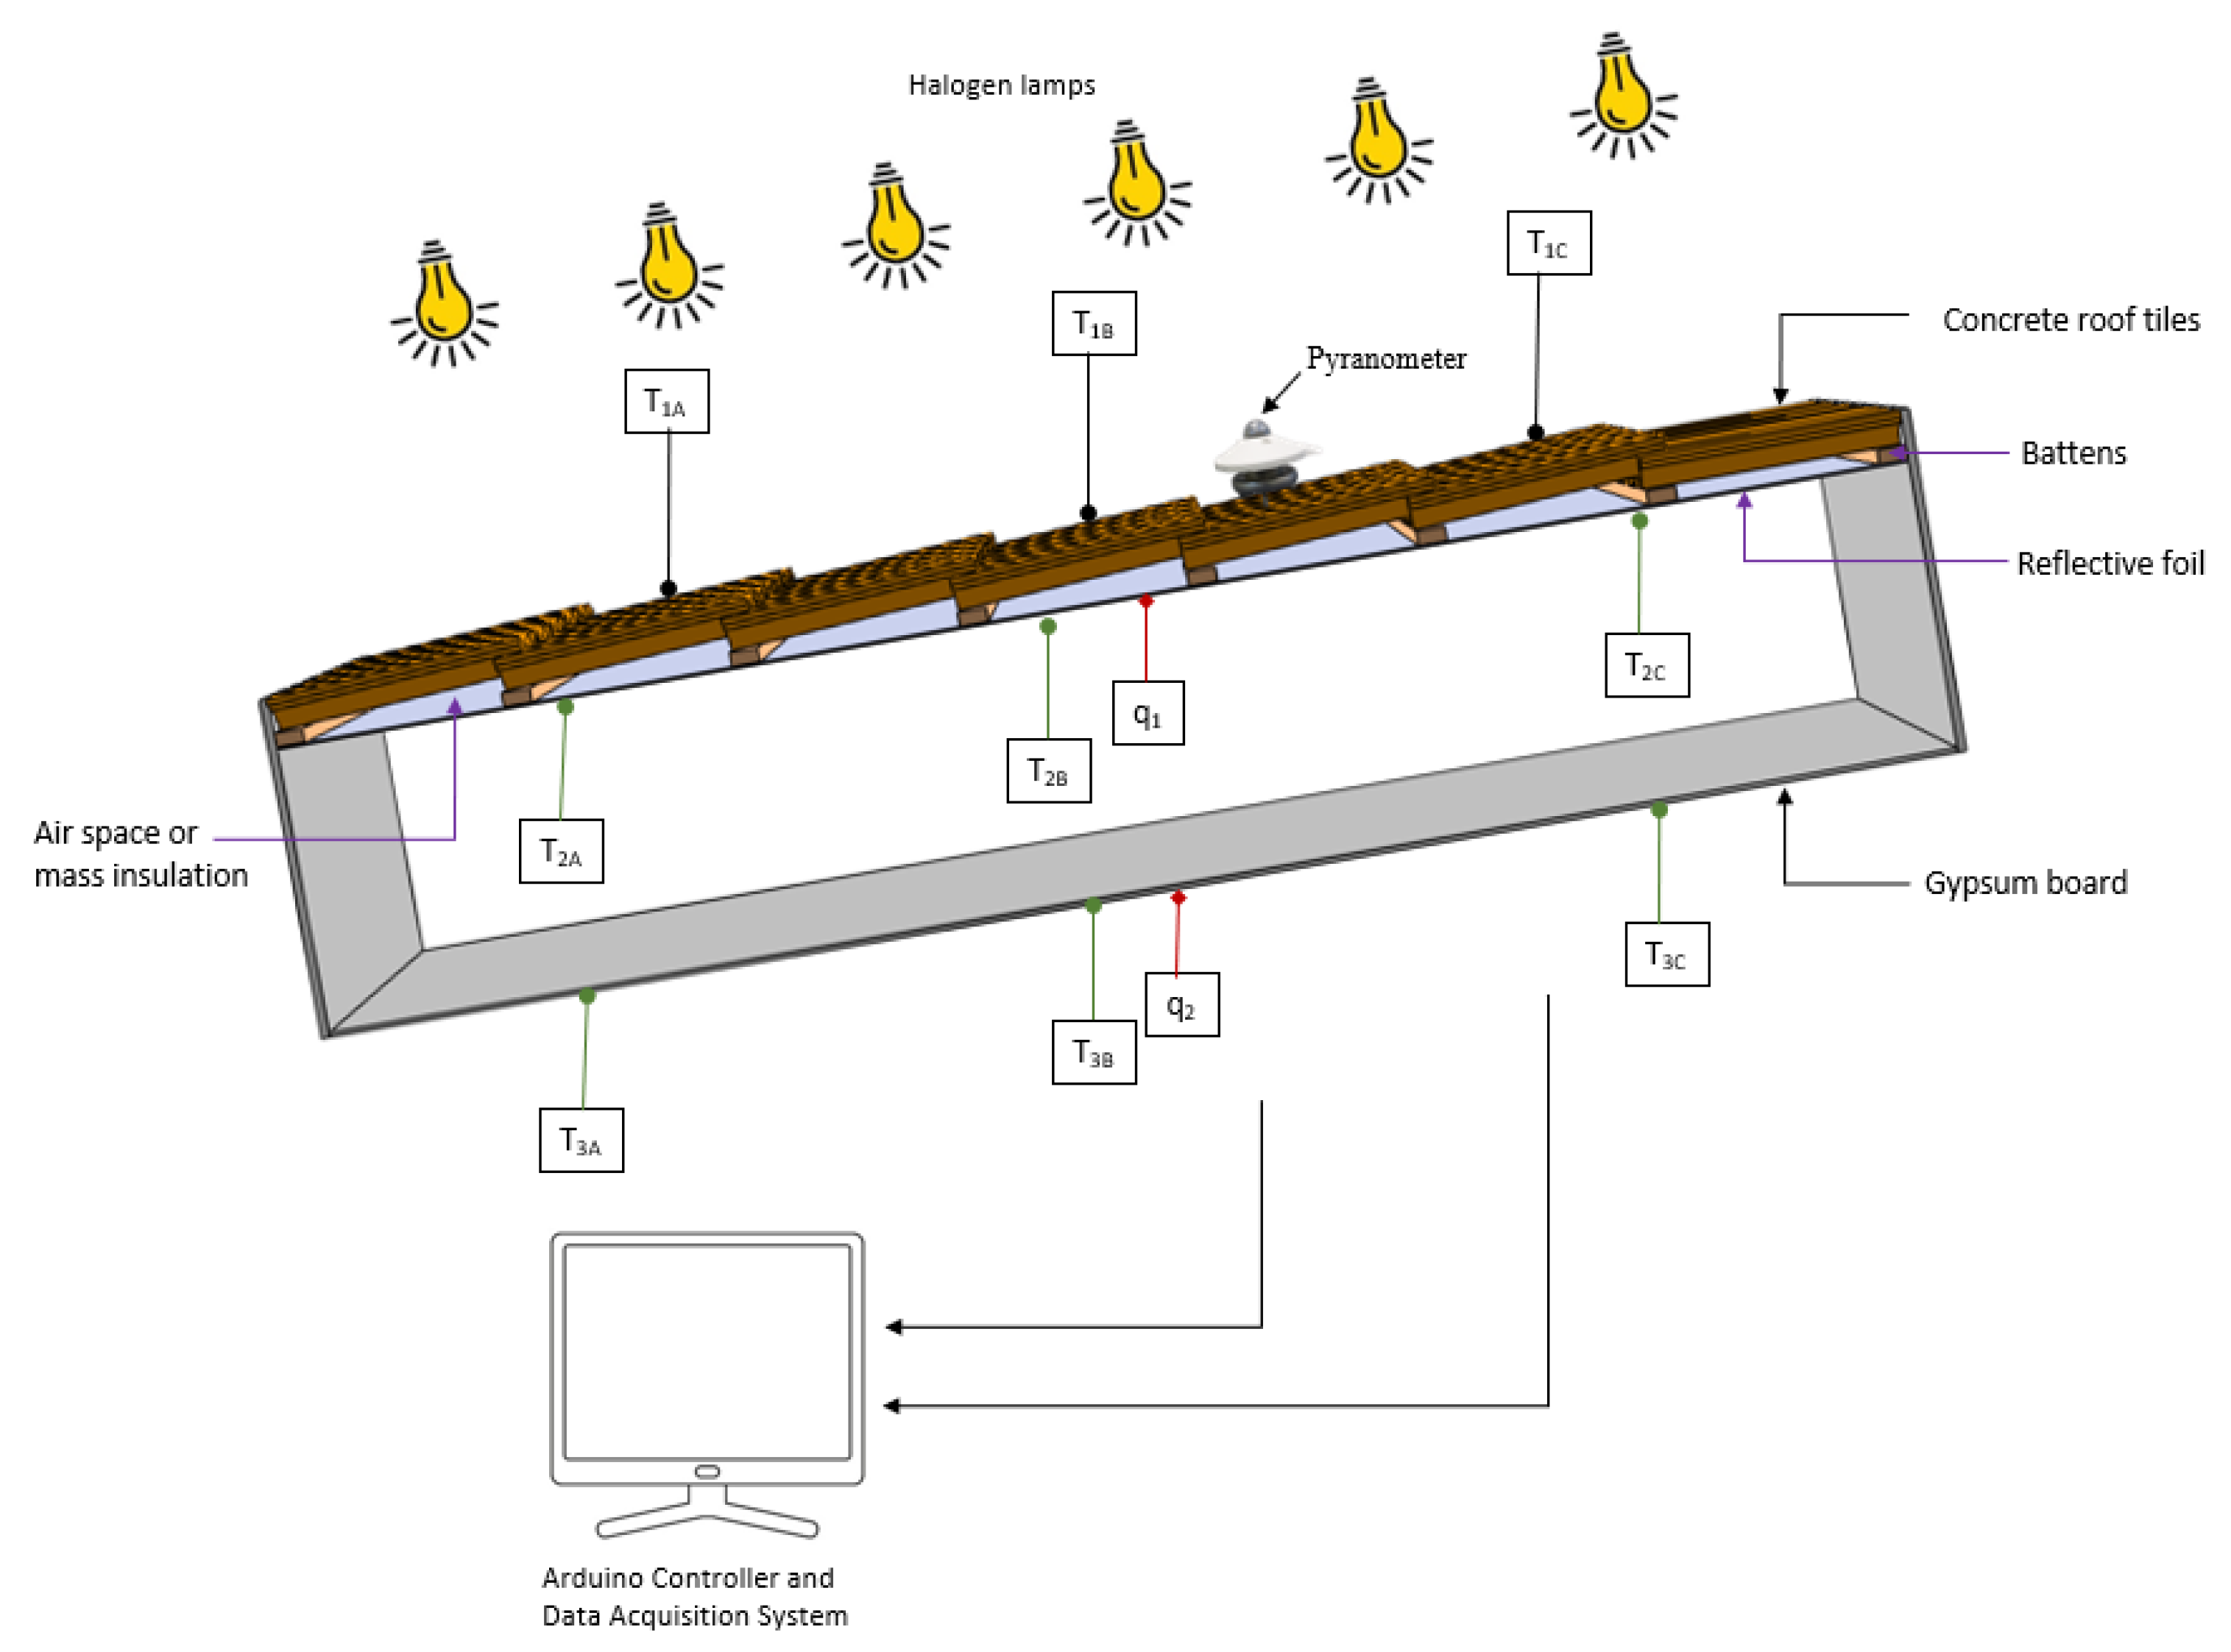
2.1. Sensors and Data Acquisition System
2.2. Properties of the Concrete Roof Tile and Insulation Materials
3. Methodology
3.1. Test Method Validation Using Outdoor Roof Tile Surface Temperature
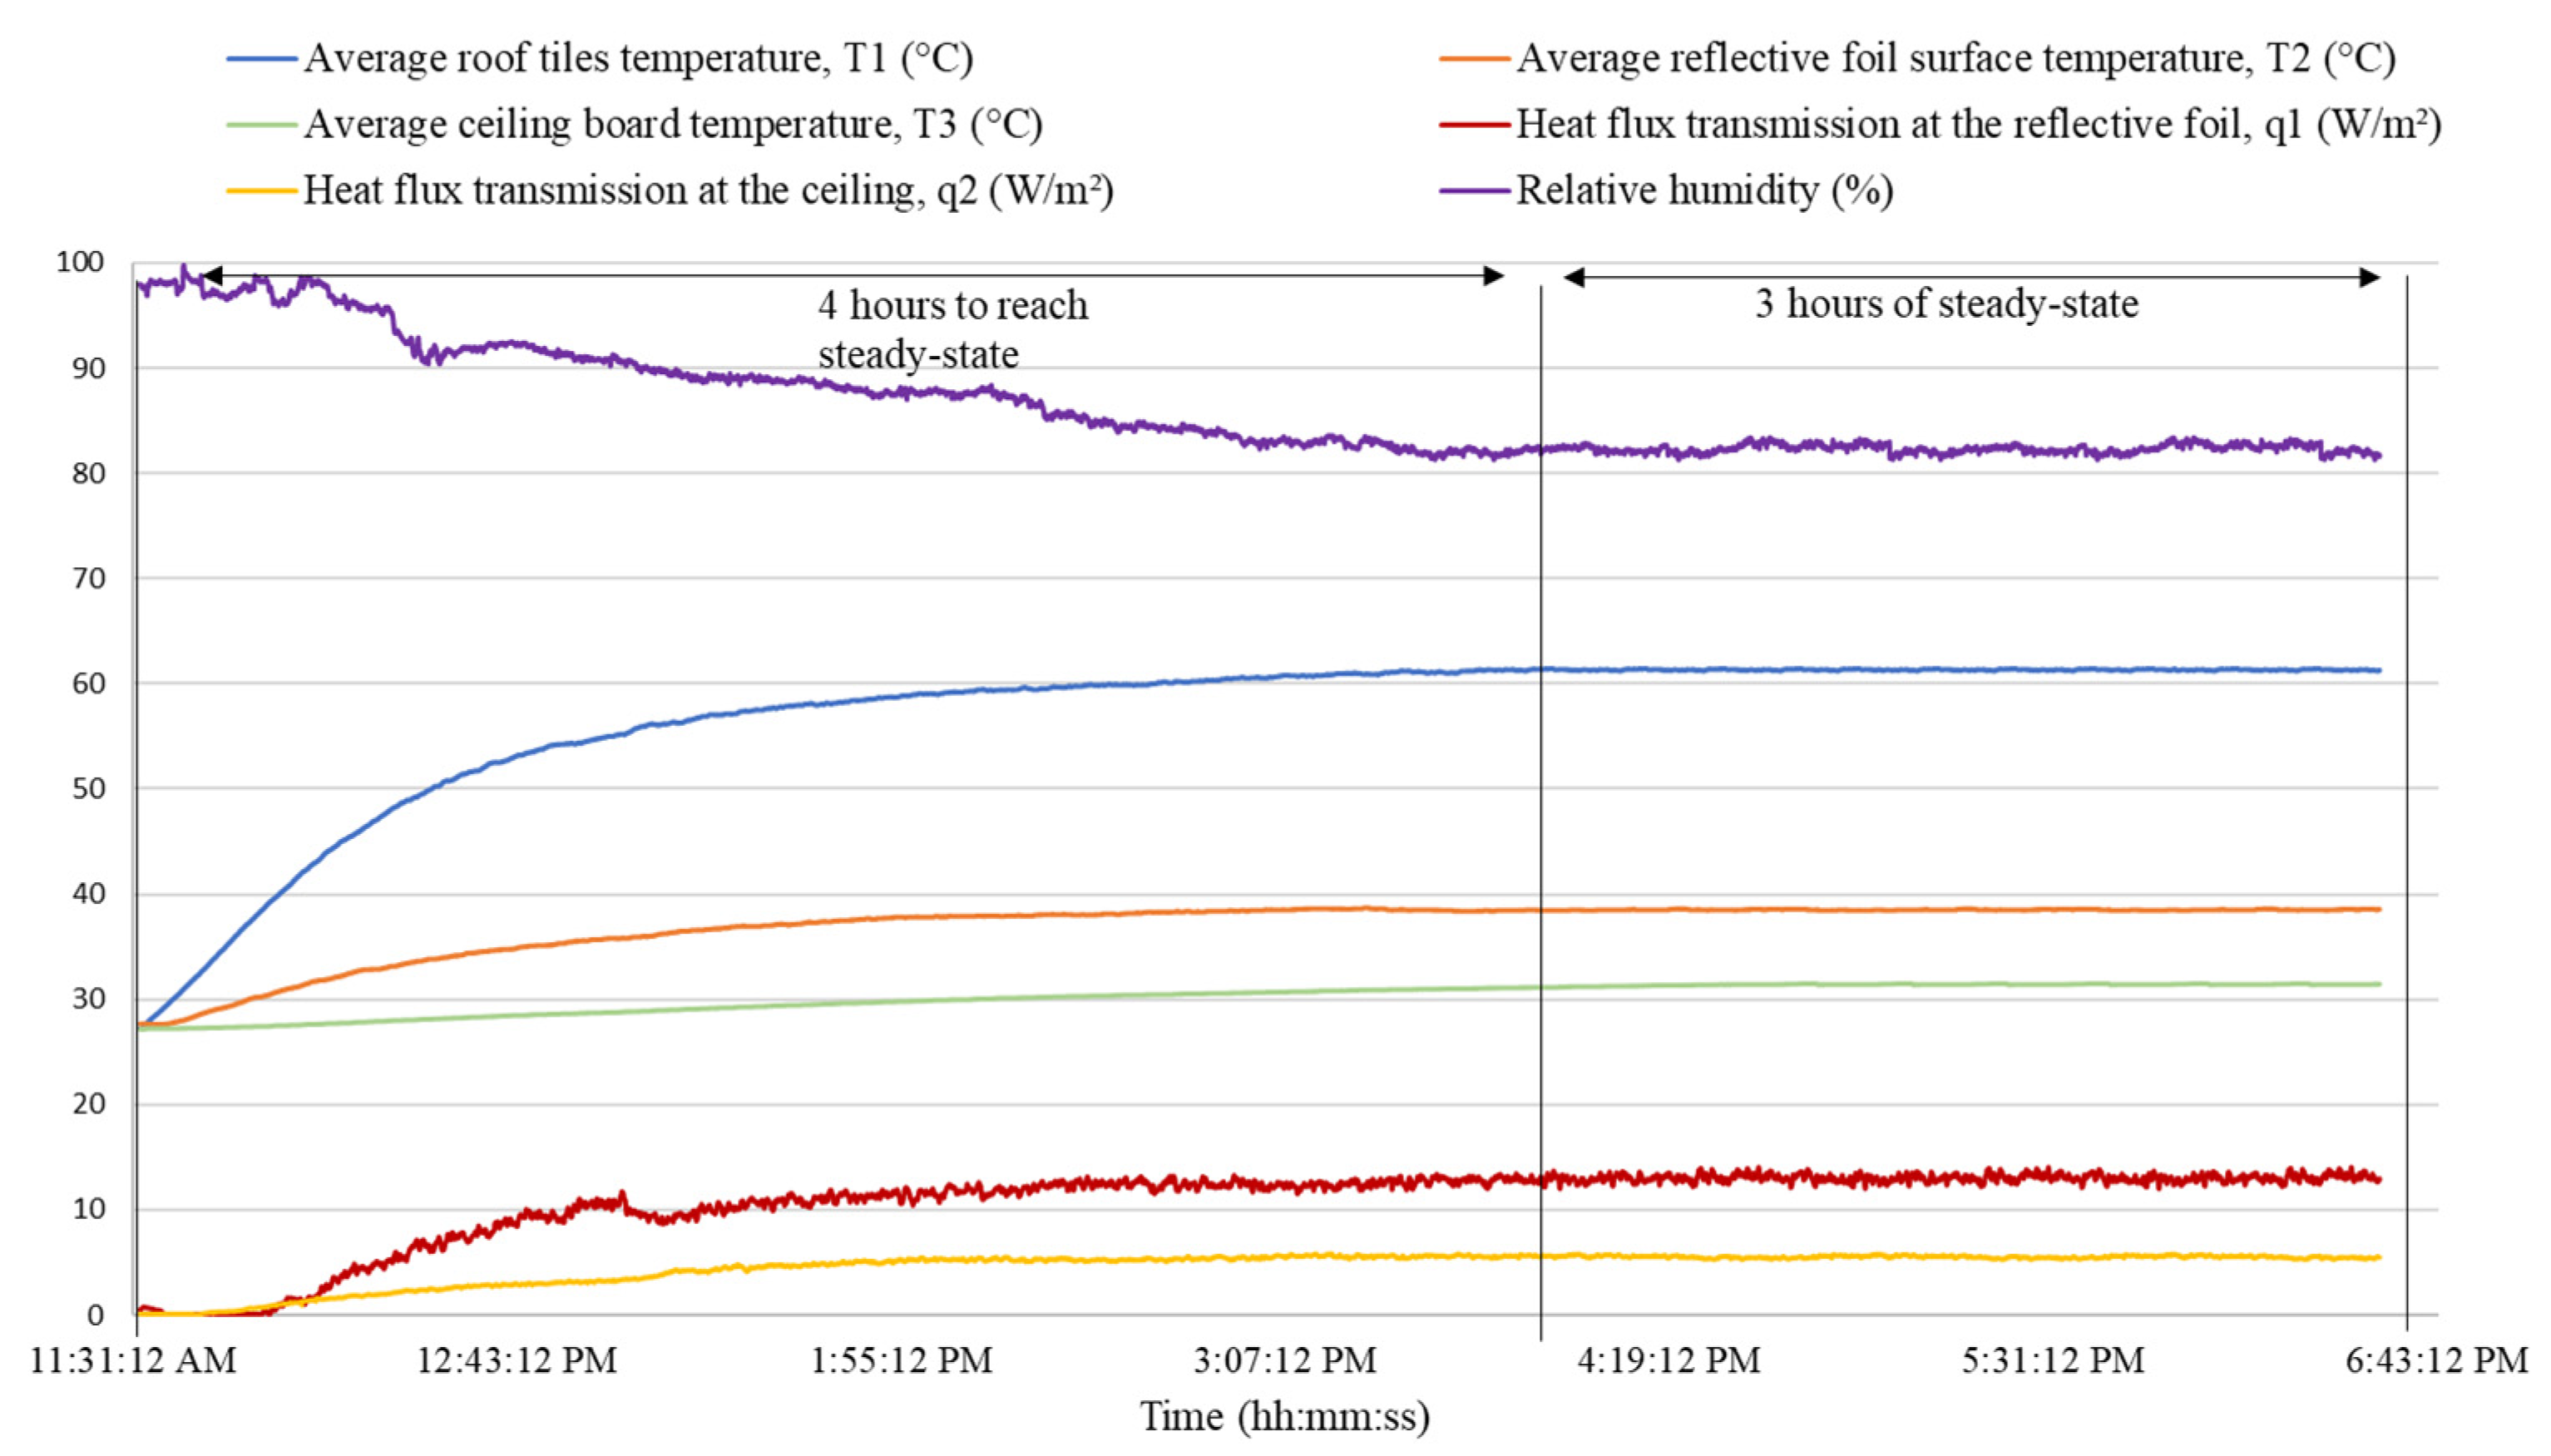
3.2. Method of Data Collection
3.3. Method of RSI Value Calculation
- RSIA is the RSI value of the reflective air space, m2K/W;
- RSIB is the RSI value of the attic air space, m2K/W;
- RSITotal is the RSI of the entire roof assembly, m2K/W;
- T1_avg is the average surface temperature of roof tiles, K;
- T2_avg is the average surface temperature of reflective foil, K;
- T3_avg is the average surface temperature of the ceiling, K;
- q1 is the heat flux transmission at the reflective air space, W/m2;
- q2 is the heat flux transmission at the ceiling, W/m2.
3.4. The Residential Roof Configurations Investigated in This Study
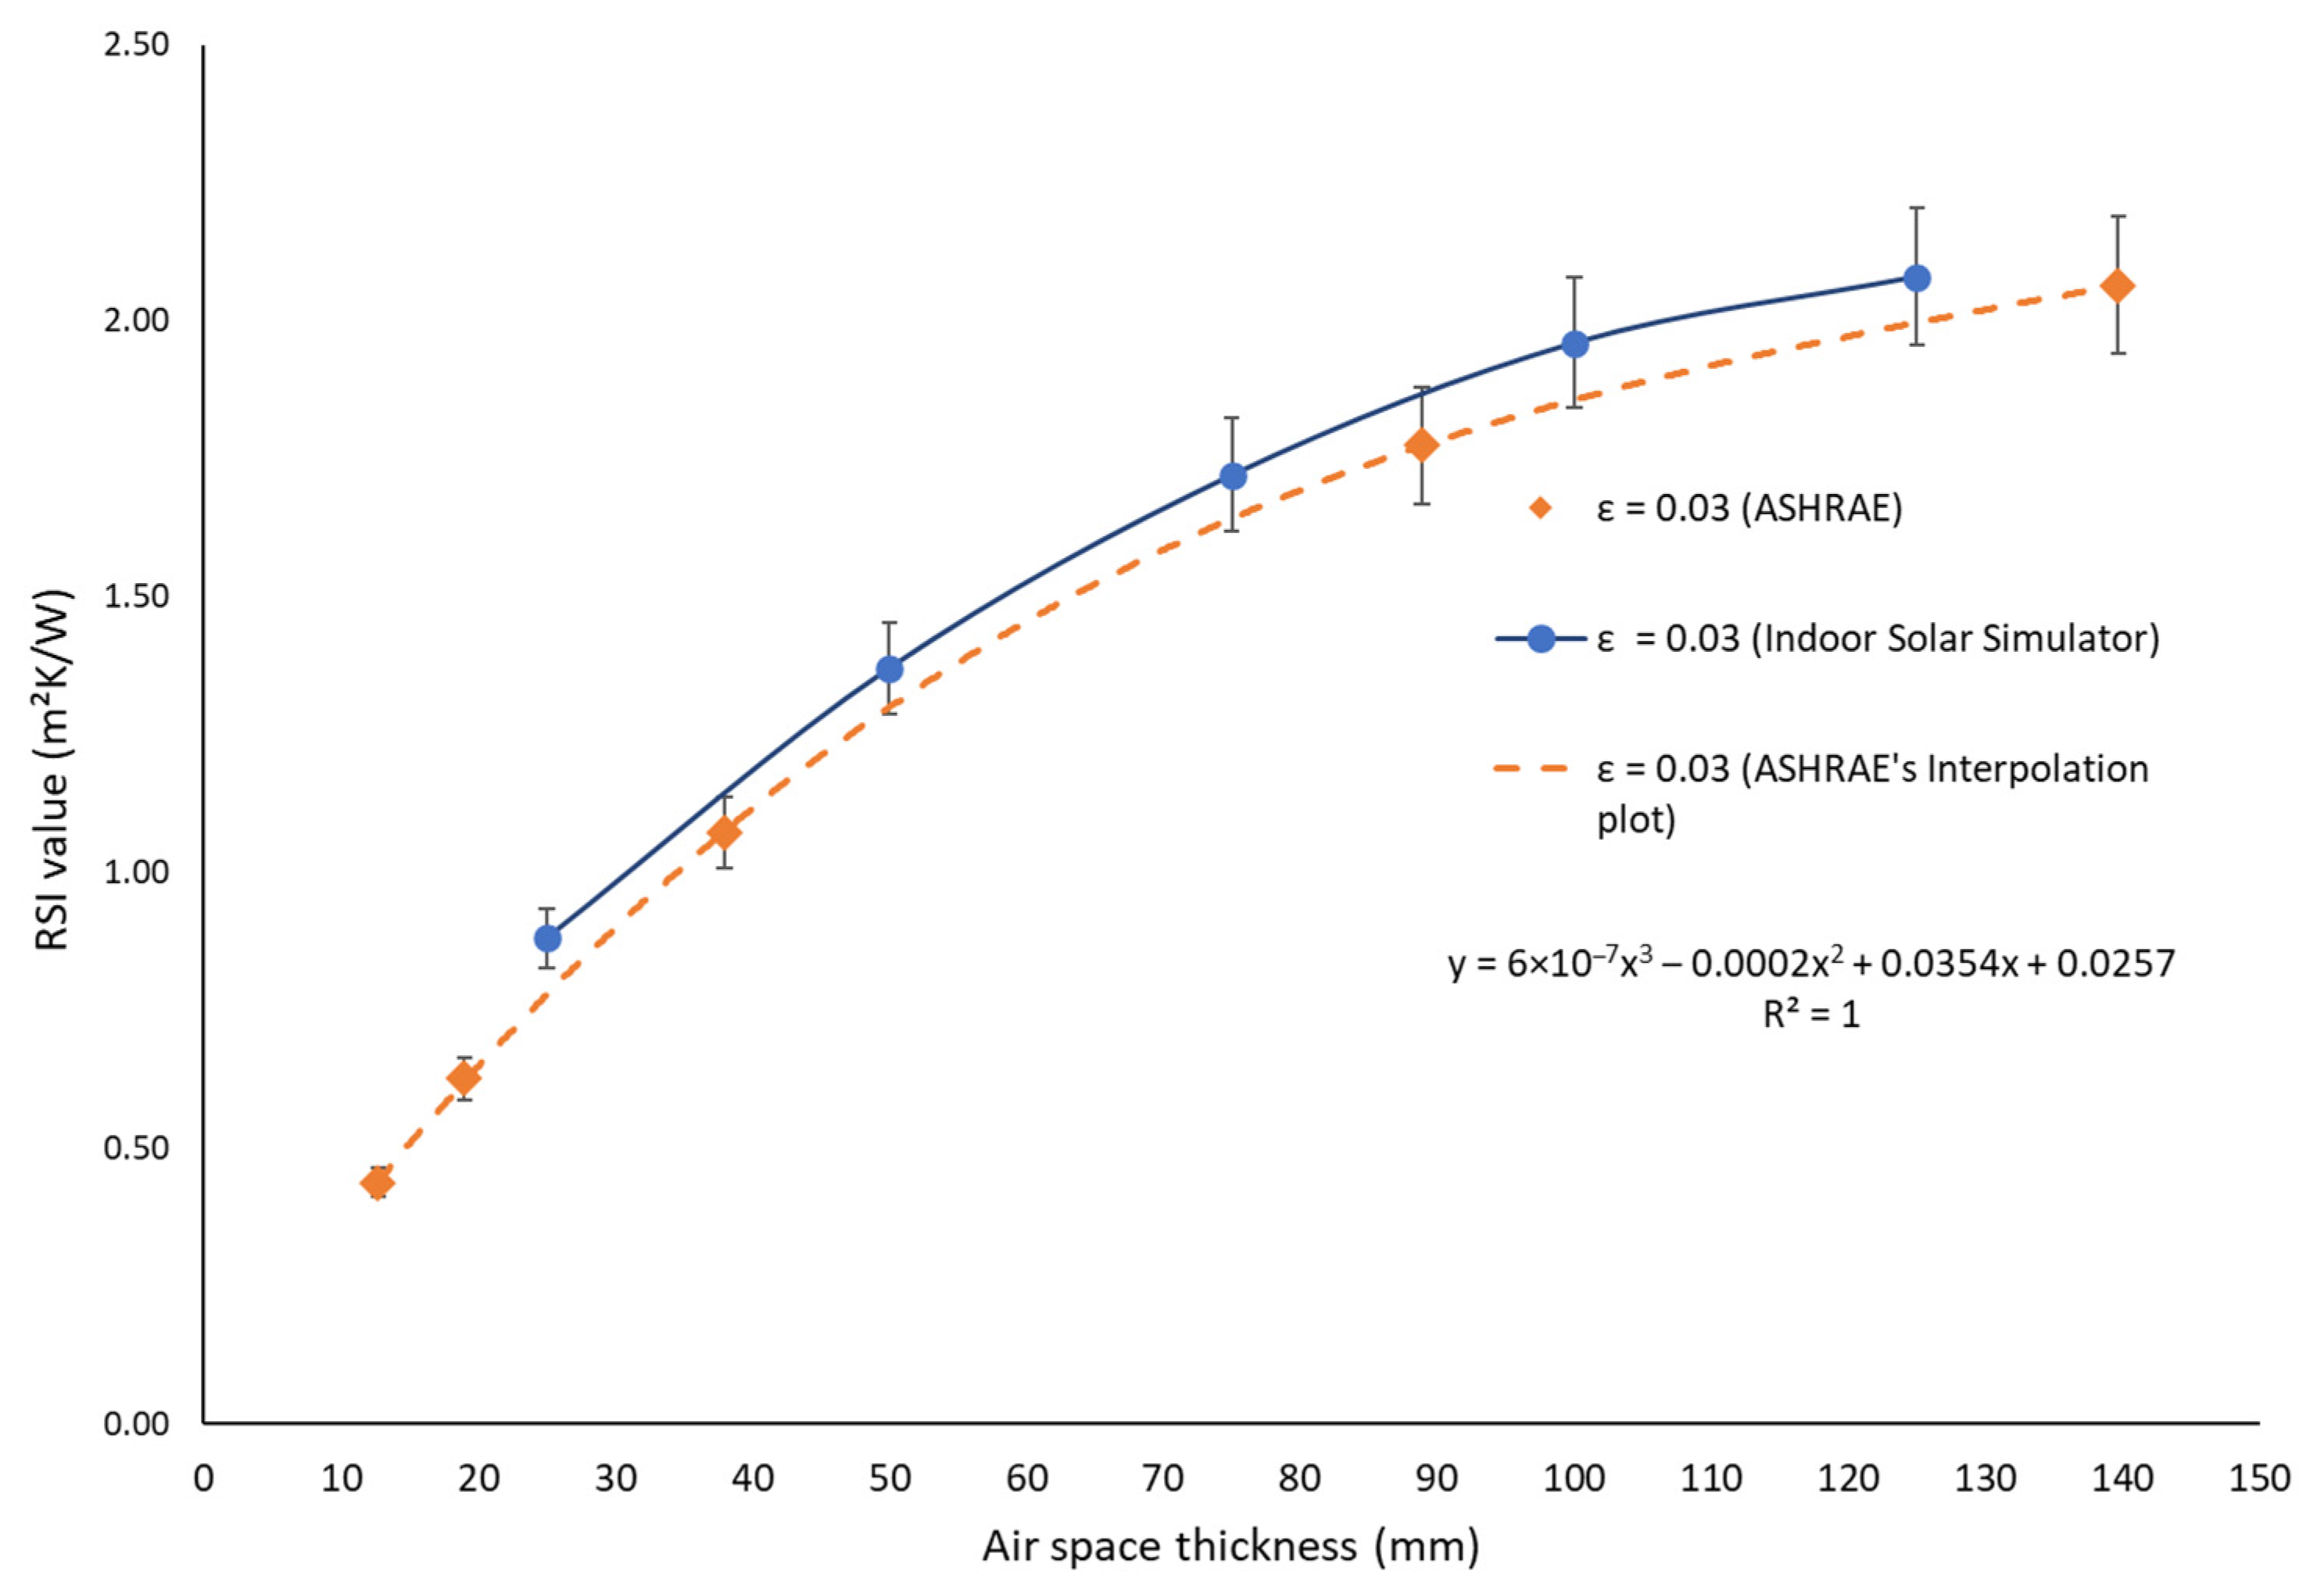
4. Validating the Test Results Obtained from the Indoor Solar Simulator in Relation to the ASHRAE Standard
5. Result and Discussion
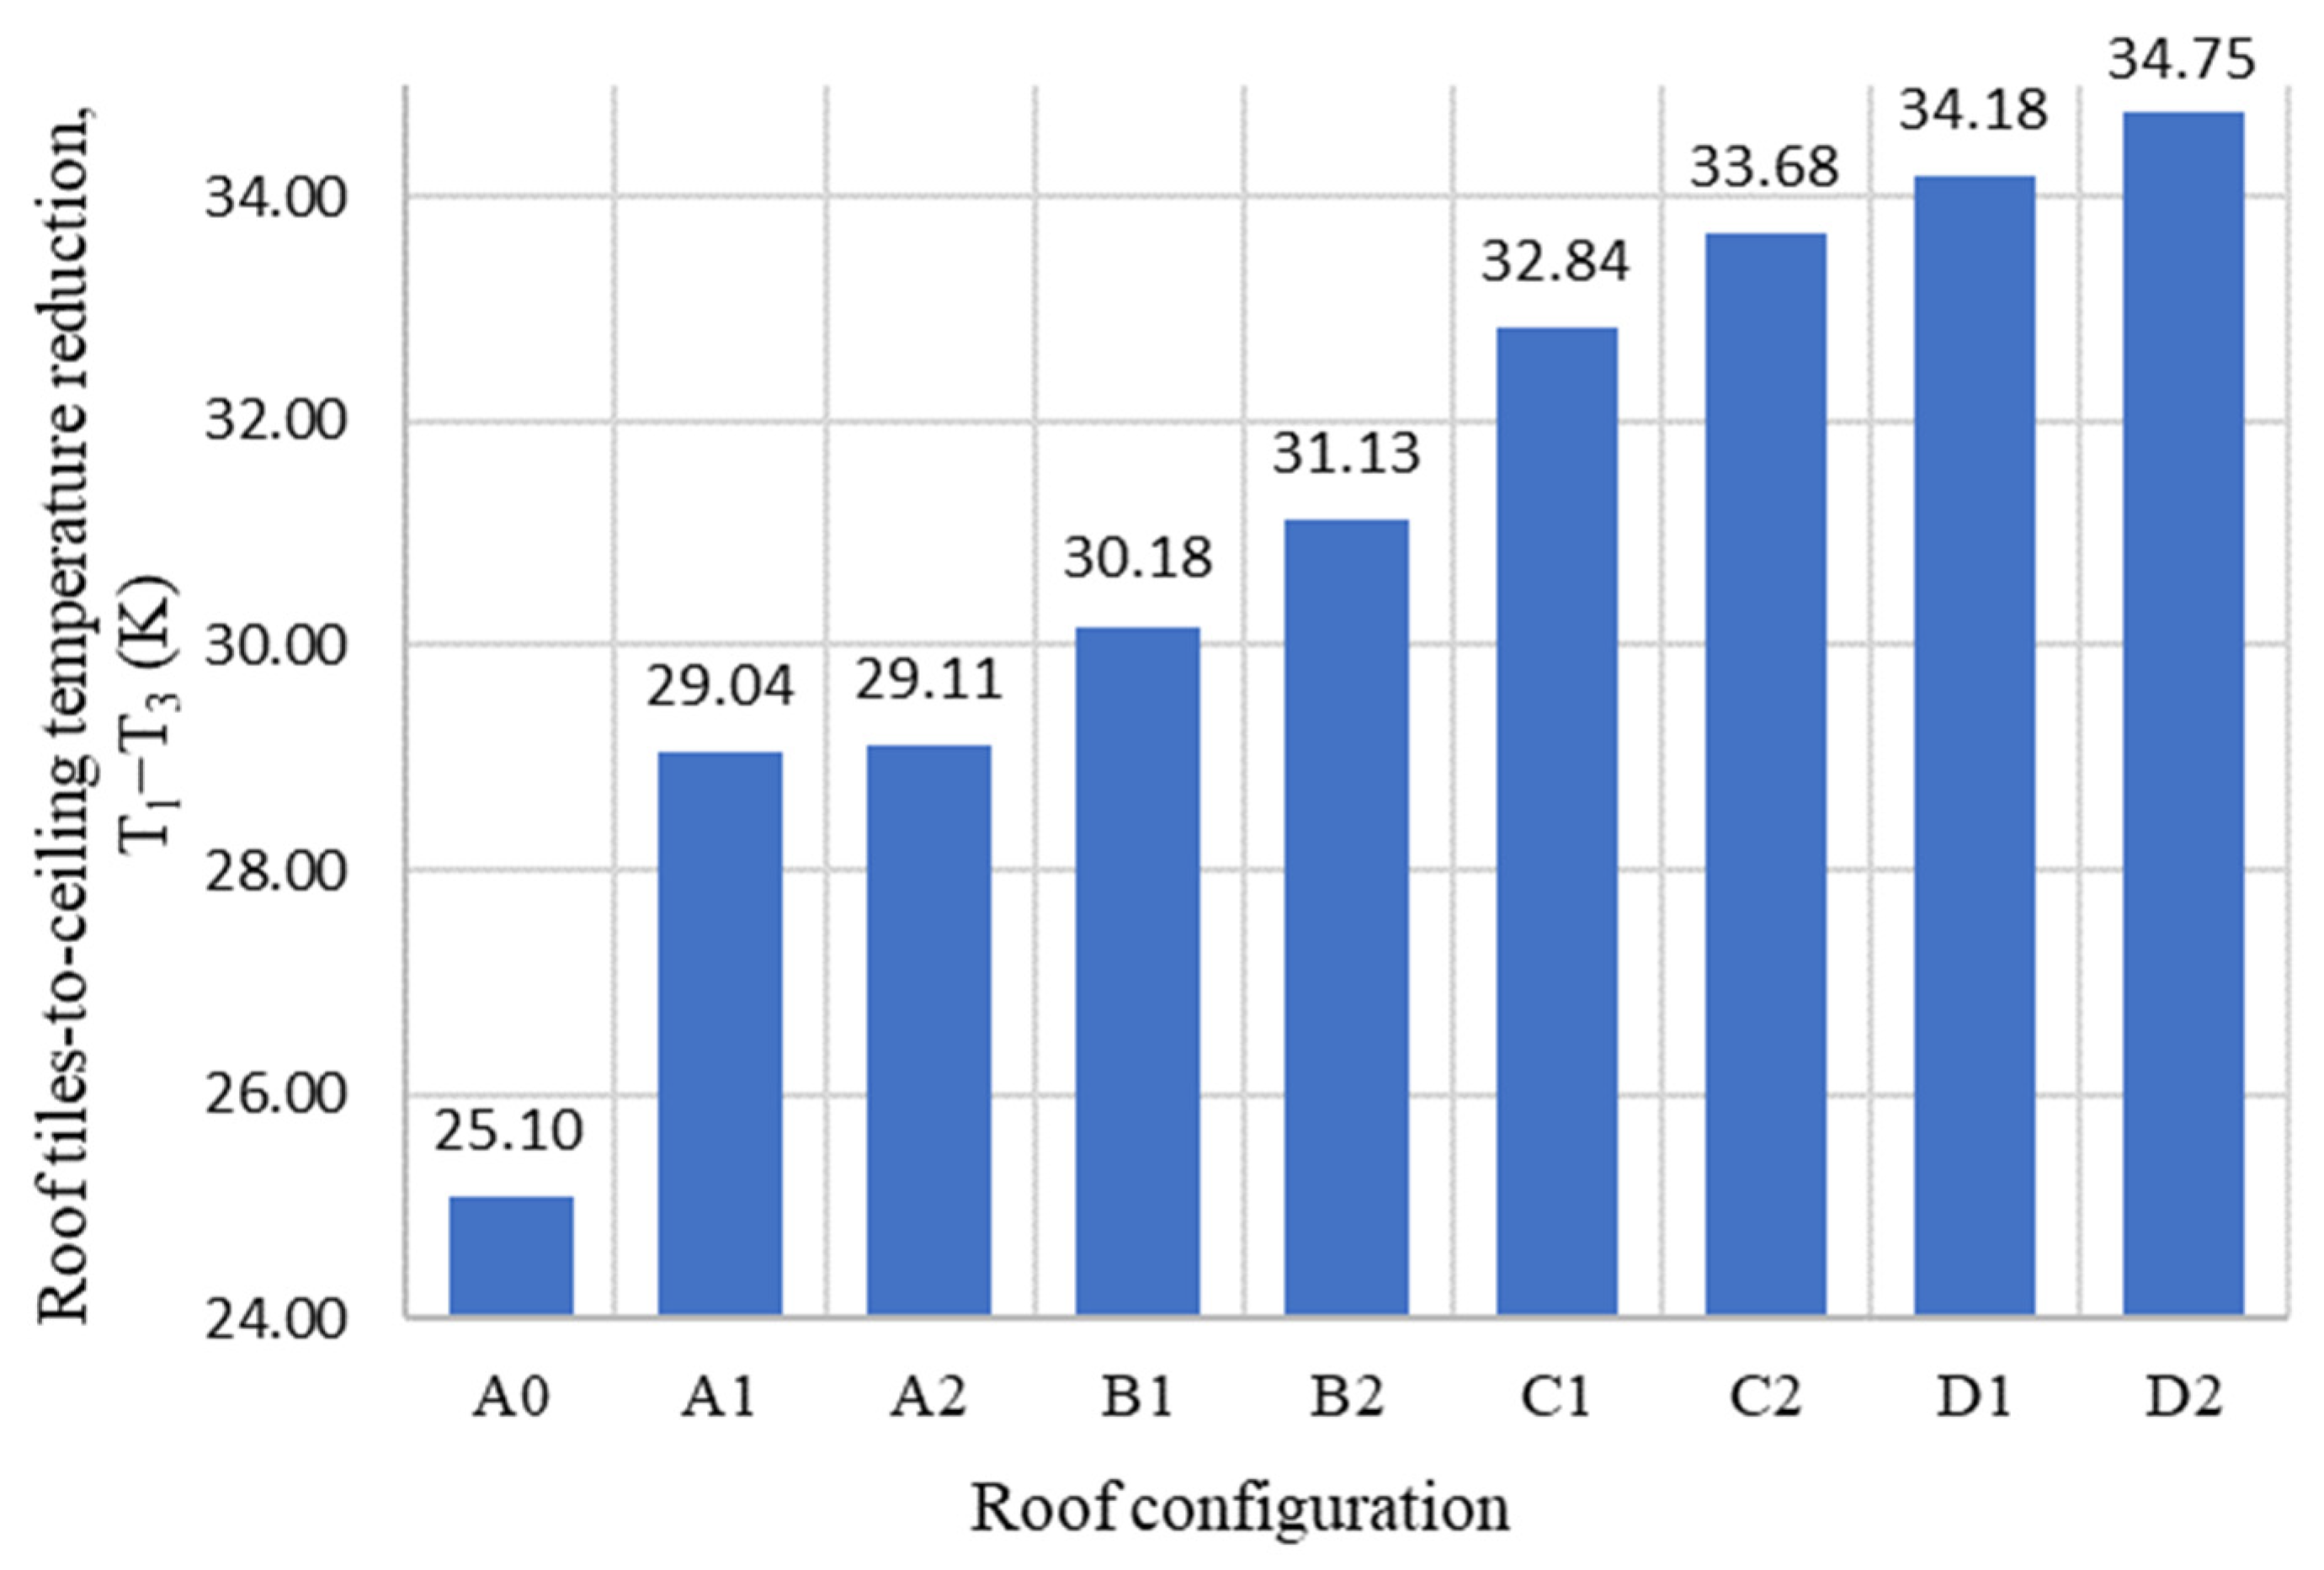
5.1. The Roof Tiles-to-Ceiling Temperature Reduction, T1–T3
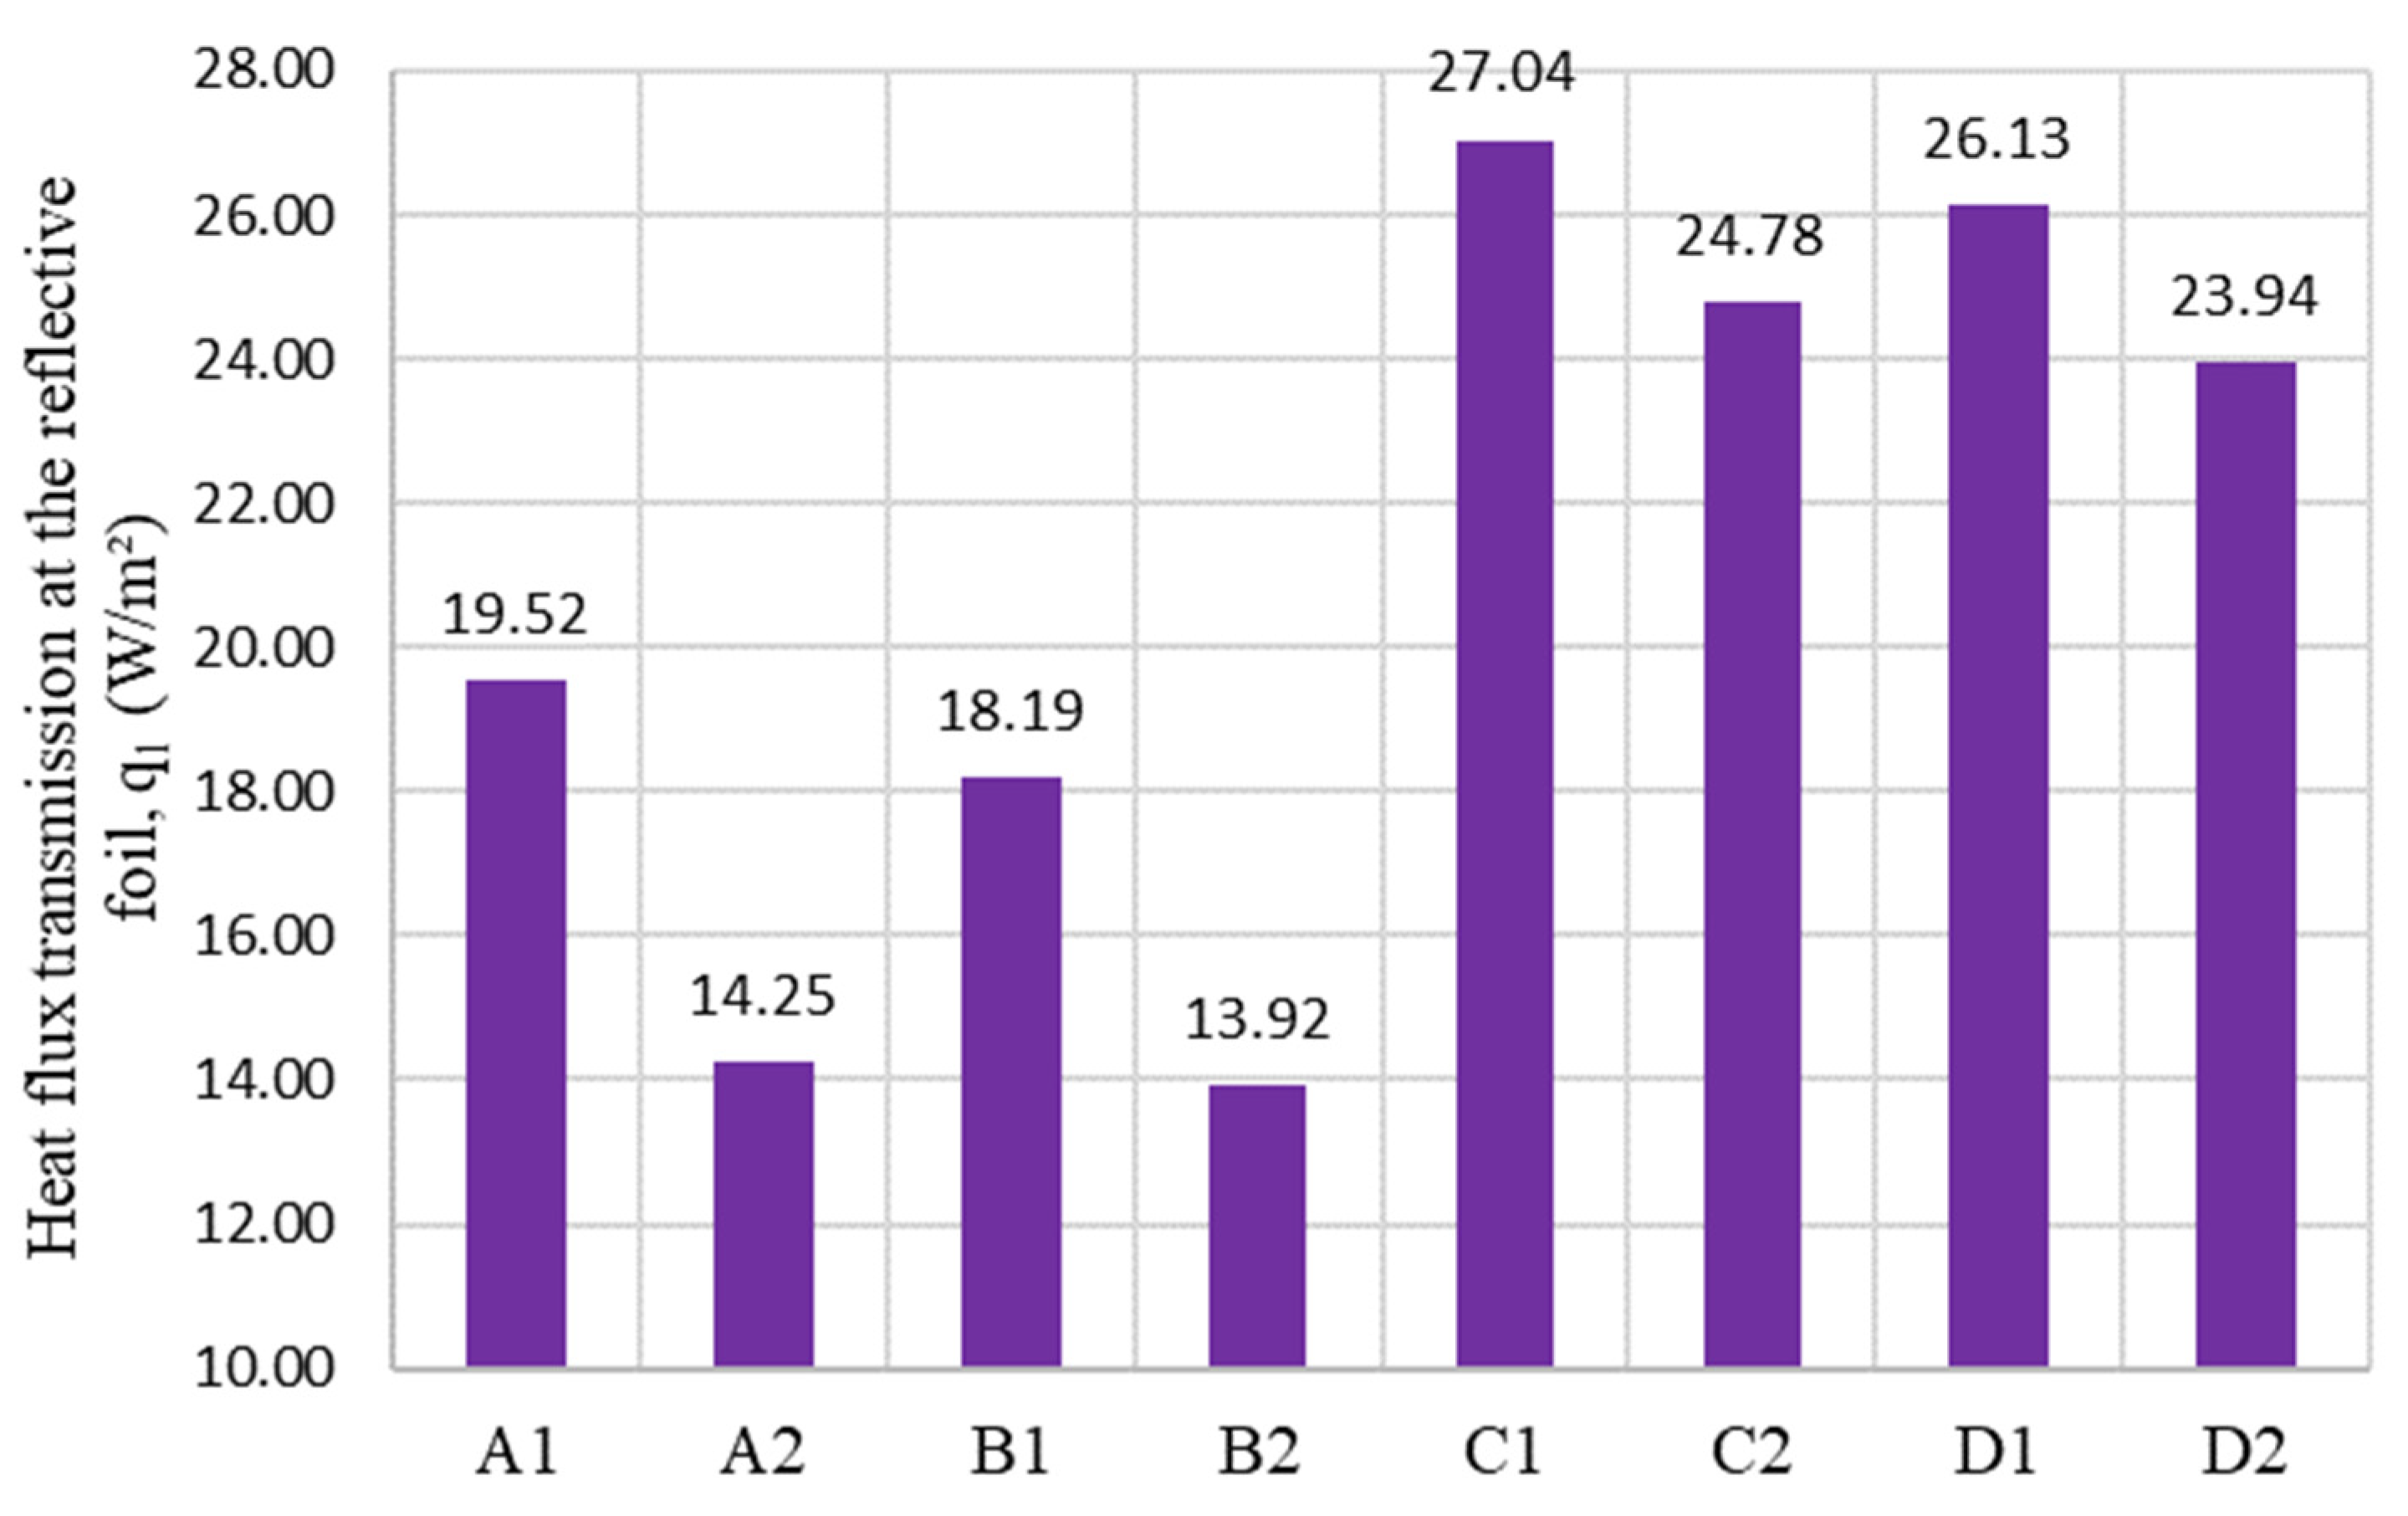
5.2. The Heat Flux Transmission at the Reflective Foil and the Ceiling, q1 and q2
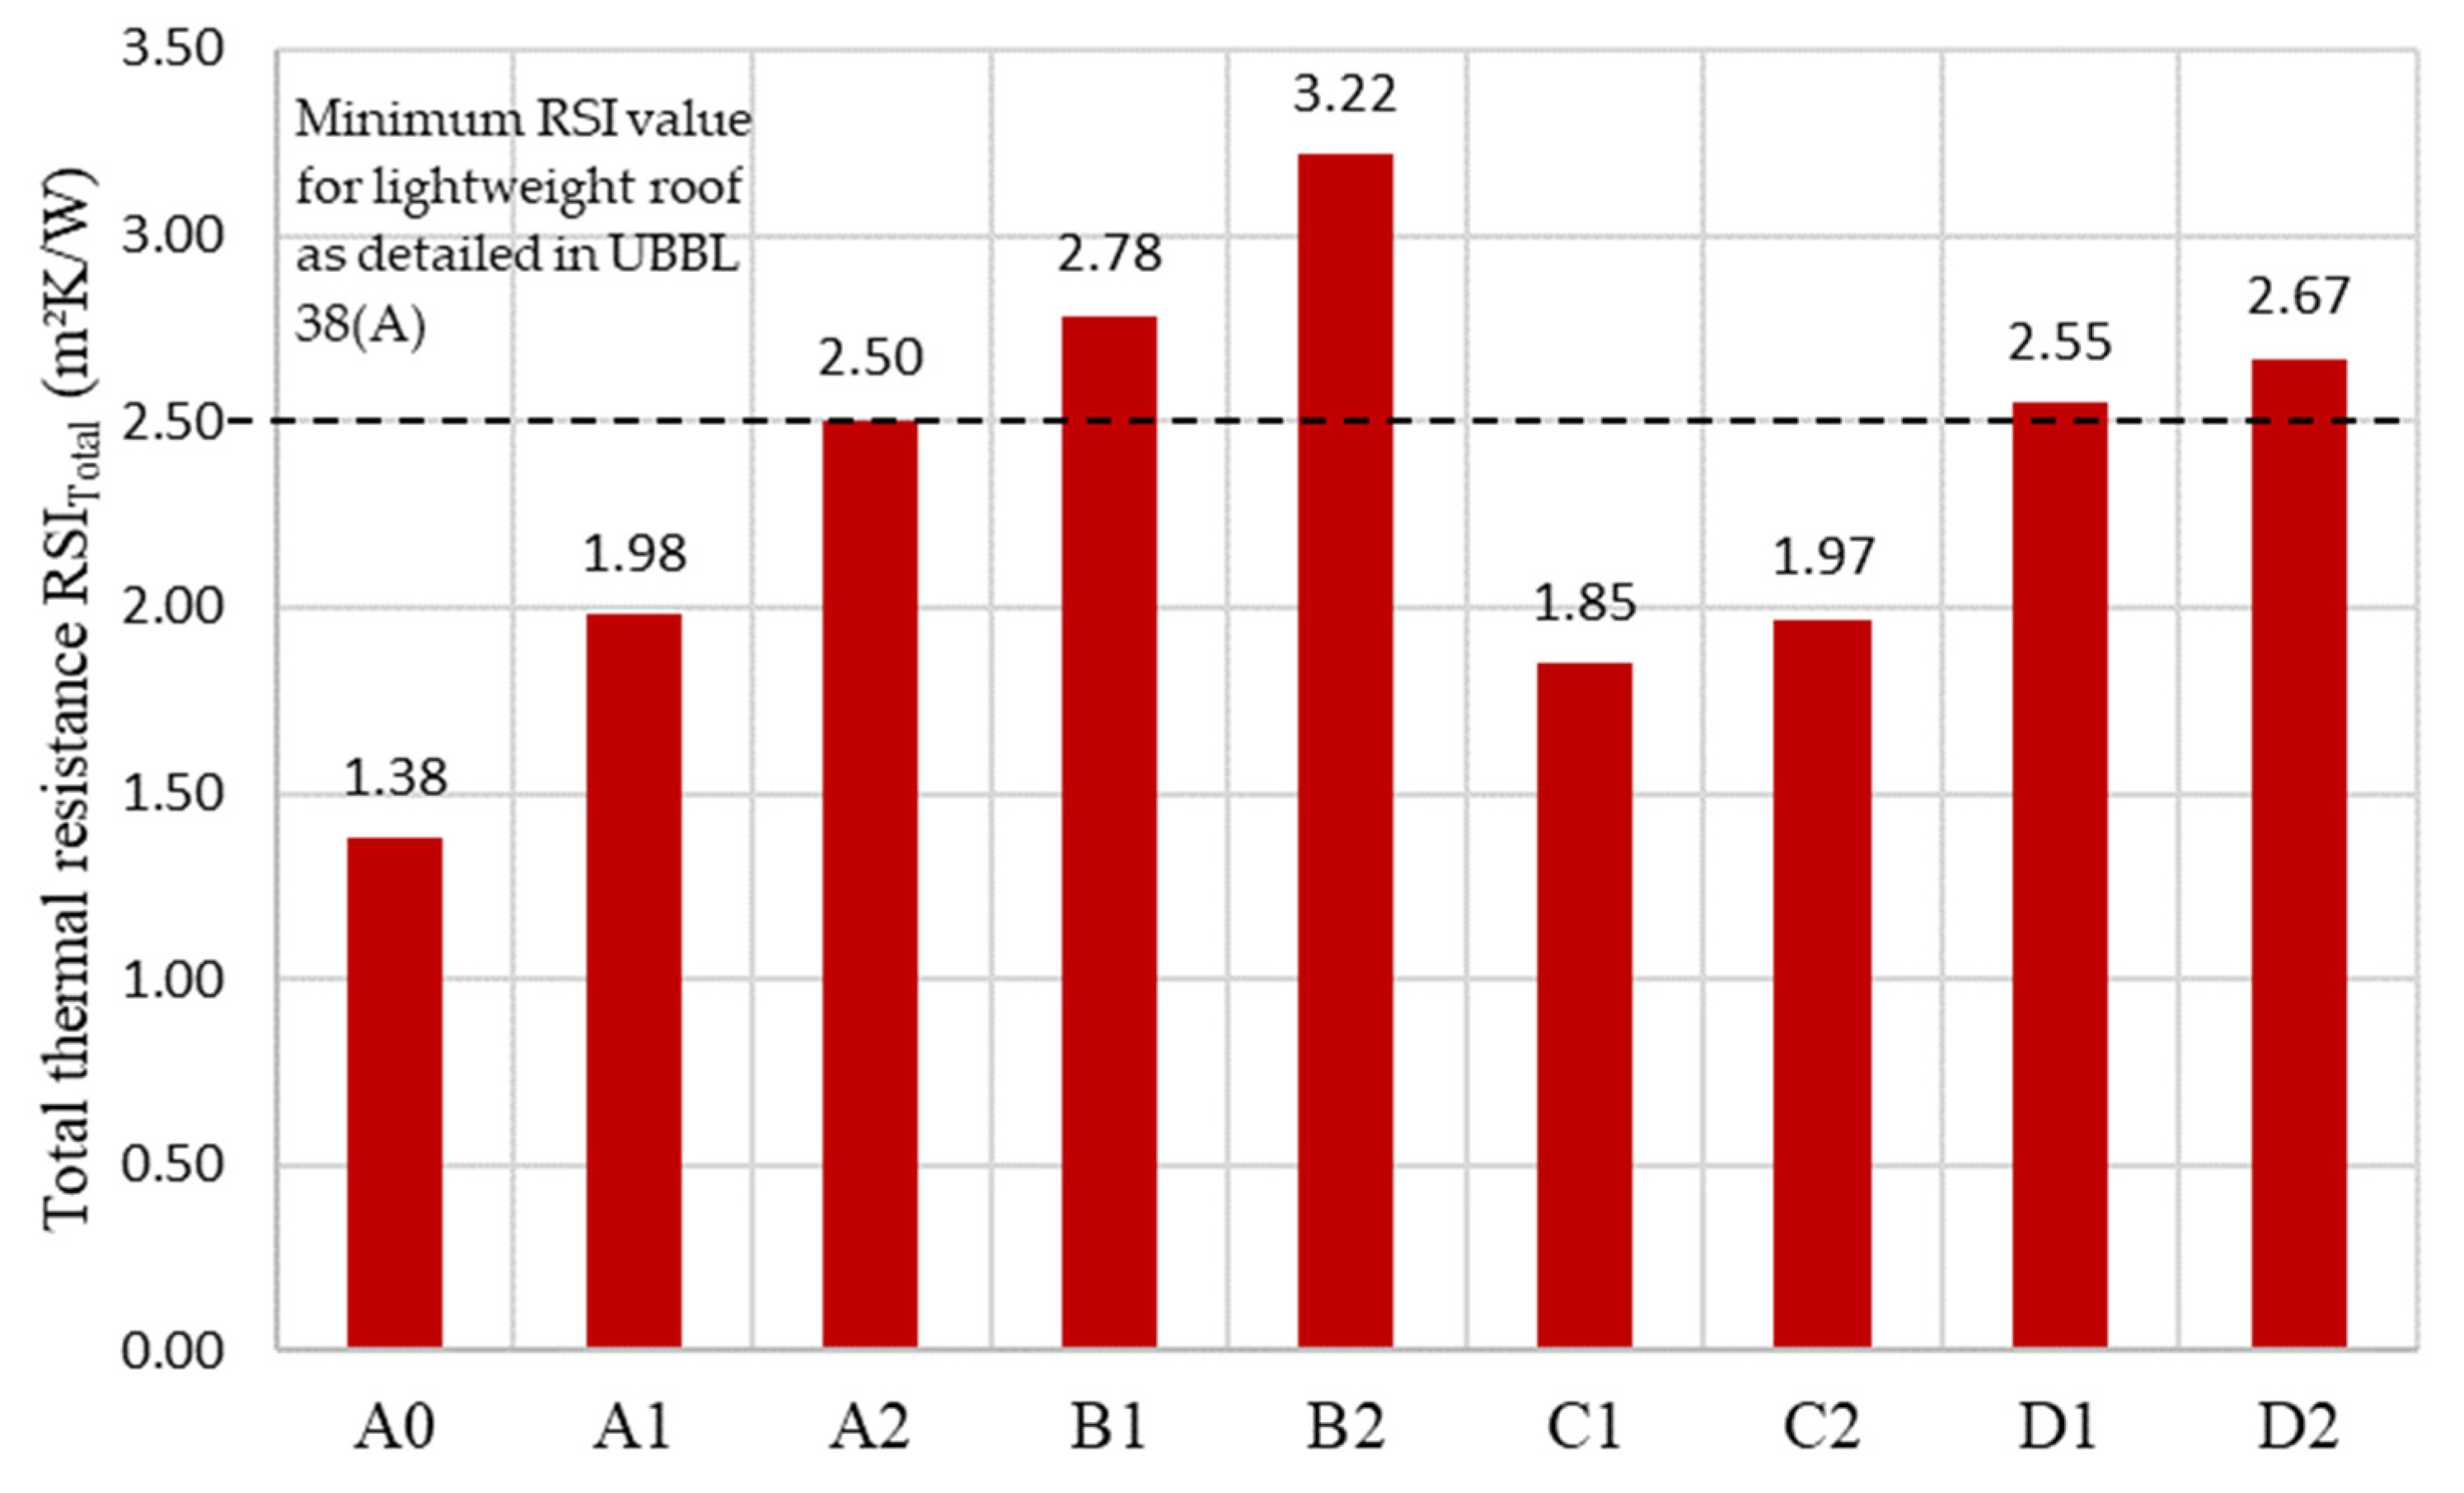
5.3. The Total Thermal Resistance of All Roof Configurations, RSITotal
6. Conclusions
- Bubble foil reflective insulation is much more effective than a radiant barrier in enhancing the thermal efficiency of residential roof assemblies. This is because the heat flux transmission at the ceiling is reduced by 27.83–43.15% when bubble foil reflective insulation is used.
- When evaluating the thickness of an enclosed air space of 25 mm and 50 mm, it can be seen that the enclosed air space of 50 mm outperforms the 25 mm gap in lowering the heat flux transmission at the reflective foil by a range of 23.49% to 27.02%.
- By adding more insulating material into the enclosed air space, the heat flux transmission at the reflective foil is enhanced. The addition of mineral glass wool and stone wool to the reflective foil results in a 41.9–47.3% increase in heat flux transmission relative to a 50 mm thick enclosed air space. Consequently, the presence of an air space next to the radiant barrier or bubble reflective insulation decreases the amount of heat transmitted through the reflective foil.
- Regarding total thermal resistance, it can be concluded that roof configurations with bubble foil reflective insulation resulted in high total thermal resistance and passed the minimum RSI value of 2.5 m2K/W under the UBBL 38 (A) requirements. Most of the roof configurations with radiant barriers did not pass UBBL 38 (A), except for that with an enclosed air space of 50 mm (A2). This shows that it is essential to have a thick, enclosed air space parallel to the radiant barrier to reduce heat gain effectively.
Author Contributions
Funding
Data Availability Statement
Conflicts of Interest
References
- Energy Commission. Malaysia Energy Statistics Handbook 2020; Suruhanjaya Tenaga (Energy Commission): Putrajaya, Malaysia, 2020. Available online: https://www.st.gov.my/en/contents/files/download/116/Malaysia_Energy_Statistics_Handbook_20201.pdf (accessed on 15 September 2023).
- MS 1525:2014; Energy Efficiency and Use of Renewable Energy for Non-Residential Buildings—Code of Practice. Department of Standards Malaysia: Cyberjaya, Malaysia, 2014.
- Dominguez, A.; Kleissl, J.; Luvall, J.C. Effects of solar photovoltaic panels on roof heat transfer. Sol. Energy 2011, 85, 2244–2255. [Google Scholar] [CrossRef]
- Zhang, Y.; Sun, H.; Long, J.; Zeng, L.; Shen, X. Experimental and Numerical Study on the Insulation Performance of a Photo-Thermal Roof in Hot Summer and Cold Winter Areas. Buildings 2022, 12, 410. [Google Scholar] [CrossRef]
- Zingre, K.T.; Wan, M.P.; Tong, S.; Li, H.; Chang, V.W.C.; Wong, S.K.; Thian Toh, W.B.; Leng Lee, I.Y. Modeling of cool roof heat transfer in tropical climate. Renew. Energy 2015, 75, 210–223. [Google Scholar] [CrossRef]
- Wang, H.; Huang, Y.; Yang, L. Integrated Economic and Environmental Assessment-Based Optimization Design Method of Building Roof Thermal Insulation. Buildings 2022, 12, 916. [Google Scholar] [CrossRef]
- Lee, S.W.; Lim, C.H.; Salleh, E.@.I.B. Reflective thermal insulation systems in building: A review on radiant barrier and reflective insulation. Renew. Sustain. Energy Rev. 2016, 65, 643–661. [Google Scholar] [CrossRef]
- Reflective Insulation Manufacturers Association International (RIMA-I). Reflective Insulation, Radiant Barriers and Radiation Control Coatings; RIMA International: Olathe, KS, USA, 2002; Available online: https://www.rimainternational.org/pdf/handbook.pdf (accessed on 25 August 2023).
- Ashhar, M.Z.M.; Haw, L.C. Recent research and development on the use of reflective technology in buildings—A review. J. Build. Eng. 2021, 45, 103552. [Google Scholar] [CrossRef]
- Materials Market. Glasswool vs. Rockwool: What’s the Difference? 2023. Available online: https://materialsmarket.com/articles/whats-the-difference-between-rock-mineral-wool-and-glass-mineral-wool/ (accessed on 31 May 2023).
- BUILD. Rock Wool Insulation. 2023. Available online: https://build.com.au/rock-wool-insulation#:~:text=How does rock wool insulation,air pocket to the next (accessed on 31 May 2023).
- Shrestha, S.; Miller, W.; Desjarlais, A. Thermal Performance Evaluation of Attic Radiant Barrier Systems Using the Large Scale Climate Simulator (LSCS); ASHRAE Trans.; ASHRAE: Peachtree Corners, GA, USA, 2013. [Google Scholar]
- Fantucci, S.; Serra, V. Investigating the performance of reflective insulation and low emissivity paints for the energy retrofit of roof attics. Energy Build. 2019, 182, 300–310. [Google Scholar] [CrossRef]
- Ferreira, M.; Corvacho, H. The effect of the use of radiant barriers in building roofs on summer comfort conditions—A case study. Energy Build. 2018, 176, 163–178. [Google Scholar] [CrossRef]
- Michels, C.; Lamberts, R.; Güths, S. Evaluation of heat flux reduction provided by the use of radiant barriers in clay tile roofs. Energy Build. 2008, 40, 445–451. [Google Scholar] [CrossRef]
- Teh, K.S.; Yarbrough, D.W.; Lim, C.H.; Salleh, E. Field evaluation of reflective insulation in south east Asia. Open Eng. 2017, 7, 352–362. [Google Scholar] [CrossRef]
- Medina, M.A. On the performance of radiant barriers in combination with different attic insulation levels. Energy Build. 2000, 33, 31–40. [Google Scholar] [CrossRef]
- D’Orazio, M.; Di Perna, C.; Di Giuseppe, E.; Morodo, M. Thermal performance of an insulated roof with reflective insulation: Field tests under hot climatic conditions. J. Build. Phys. 2013, 36, 229–246. [Google Scholar] [CrossRef]
- Hauser, G.; Kersken, M.; Sinnesbichler, H.; Schade, A. Experimental and numerical investigations for comparing the thermal performance of infrared reflecting insulation and of mineral wool. Energy Build. 2013, 58, 131–140. [Google Scholar] [CrossRef]
- Amer, E.H. Passive options for solar cooling of buildings in arid areas. Energy 2006, 31, 1332–1344. [Google Scholar] [CrossRef]
- Ong, K.S. Temperature reduction in attic and ceiling via insulation of several passive roof designs. Energy Convers. Manag. 2011, 52, 2405–2411. [Google Scholar] [CrossRef]
- Muhieldeen, M.W.; Yang, L.Z.; Lye, L.C.; Adam, N.M. Analysis of optimum thickness of glasswool roof thermal insulation performance. J. Adv. Res. Fluid Mech. Therm. Sci. 2020, 76, 1–11. [Google Scholar] [CrossRef]
- Roels, S.; Deurinck, M. The effect of a reflective underlay on the global thermal behaviour of pitched roofs. Build. Environ. 2011, 46, 134–143. [Google Scholar] [CrossRef]
- RS Components Ltd. Platinum Resistance Thermometer (PRT) Selection Guide. 2020. Available online: https://docs.rs-online.com/a6bf/0900766b815e5755.pdf (accessed on 26 December 2023).
- International Thermal Instrumental Company. Geo Thermal Heat Flux Tranducers. 2023. Available online: https://thermalinstrumentcompany.com/products/geothermalheatfluxtransducers (accessed on 26 December 2023).
- Kipp & Zonen. Pyranometers For the Accurate Measurement of Solar Irradiance. 2023. Available online: https://www.kippzonen.com/Download/70/Brochure-Pyranometers (accessed on 26 December 2023).
- Lama. Lama Roman Tiles. 2014. Available online: http://lamatiles.com.my/UserFile/editor/file/catalogue-lama-ROMAN-tile-new. (accessed on 15 September 2023).
- ROCKWOOL. Cool ‘n’ Comfort Blanket and Slab. Available online: https://p-cdn.rockwool.com/siteassets/rw-sa/product-documentation/product/building-insulation/data-sheets/cool-n-comfort/cool-n-comfort-data-sheet-v2.pdf?f=20210304074052 (accessed on 21 September 2023).
- Polyglass Fibre Insulation. Ecowool Brownie Blanket; Polyglass Fibre Insulation: Perai, Malaysia, 2019. [Google Scholar]
- YH Laminated Products Sdn Bhd. SN3-Class-O-Catalog. 2020. Available online: https://www.yhlp.com.my/wp-content/uploads/2020/05/SN3-Class-O-catalog.pdf (accessed on 21 September 2023).
- YH Laminated Products Sdn Bhd. SB400-FR-Catalog. 2020. Available online: https://www.yhlp.com.my/wp-content/uploads/2020/05/SB400-FR-catalog.pdf (accessed on 21 September 2023).
- Kosmina, L. Guide to In-Situ U-Value Measurement of Walls in Existing Dwellings In-Situ Measurement of U-Value ISO 9869. 2016. Available online: www.bre.co.uk/uvalues (accessed on 21 September 2023).
- ASHRAE. Chapter 26: Heat, air and moisture control in building assemblies—Material properties. In ASHRAE Handbook of Fundamentals; ASHRAE: Peachtree Corners, GA, USA, 2009; pp. 26.1–26.22. [Google Scholar]
- Pourghorban, A.; Kari, B.M. Evaluation of reflective insulation systems in wall application by guarded hot box apparatus, and comparative investigation with ASHRAE and ISO 15099. Constr. Build. Mater. 2019, 207, 84–97. [Google Scholar] [CrossRef]
- Ashhar, M.Z.M.; Lim, C.H. Development of an indoor solar simulator for the evaluation of the thermal roof performance for commercial buildings in Malaysia. J. Build. Eng. 2023, 76, 107204. [Google Scholar] [CrossRef]


| Equipment | Manufacturer | Function | Accuracy | Range | Reference |
|---|---|---|---|---|---|
K-type thermocouple | RS Components (London, UK) | To obtain the temperature of a surface | ±1 °C | −200–1000 °C | [24] |
Heat Flux Sensor (GHT-2C-ENV#0695) | International Thermal Instrument Company, Inc. (Del Mar, CA, USA) | To evaluate heat flux transmission across a surface | ±1% | 0–3155 W/m2 | [25] |
Pyranometer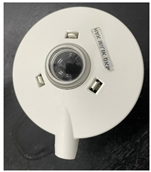 | Kipp & Zonen (Delft, The Netherlands) | Measure solar irradiance | ±3% | 0–2000 W/m2 | [26] |
| Material | Specification |
|---|---|
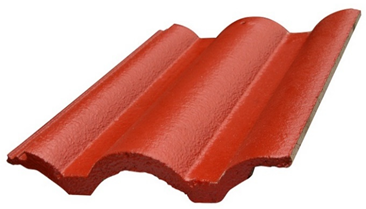 | Extruded concrete roofing tile with fused pigmented colour coating [27]; Thickness: 12 mm; Thermal conductivity = 0.836 W/mK; RSI value = 0.014 m2K/W. |
| Concrete roof tile | |
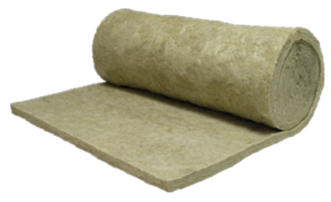 | Stone wool is made of basalt—a type of volcanic stone. It is non-combustible, which also can be used for thermal insulation, fire, and sound protection. At a thickness of 50 mm and a density of 40 kg/m3, it has an RSI value of 1.39 m2K/W and thermal conductivity of 0.036 W/mK [28]. |
| Stone wool | |
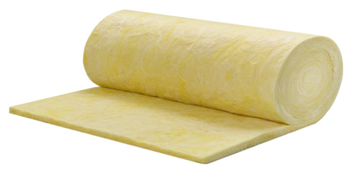 | Mineral glass wool is commonly used as insulation for metal deck roofs and roof tiles. At a thickness of 50 mm and density of 16 kg/m3, it has a thermal conductivity of 0.0366 W/mK and RSI value of 1.35 m2K/W [29]. |
| Mineral glass wool | |
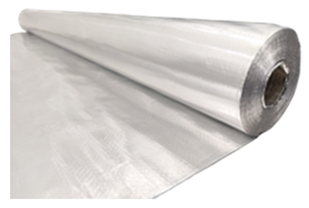 | The radiant barrier is an aluminium foil laminated to a high-density polyurethane woven fabric. One side of the surface is pure aluminium with a low emissivity of 0.02. Another side of the surface is made out of metalized aluminium. The thickness of the radiant barrier is 0.17 mm and has a density of 160 g/m2 [30]. It has an RSI value of 0.000 m2K/W. |
| Radiant barrier | |
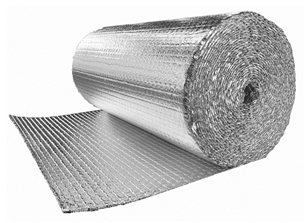 | Bubble foil reflective insulation is aluminium laminated to a polyethylene bubble sheet. Both sides of the surfaces are made out of pure aluminium with a low emissivity value of 0.01. The bubble pockets have a diameter of 10 mm and a density of 380 g/m2. The thermal conductivity is 0.0537 W/mK, and the RSI value of the material is 0.1694 m2K/W. The thickness of the foil is 9 mm [31]. |
| Bubble foil reflective insulation | |
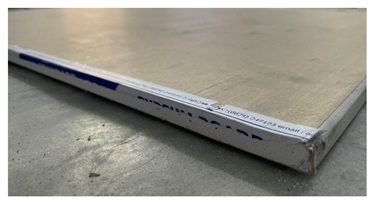 | Gypsum plasterboard as the ceiling. It has a thickness of 12 mm. Density: 9.7 kg/m2; Thermal conductivity: 0.25 W/mK; RSI value: 0.05 m2K/W. |
| Gypsum ceiling board |
| Roof Configuration | Visual Representation | Composition |
|---|---|---|
| A0 | 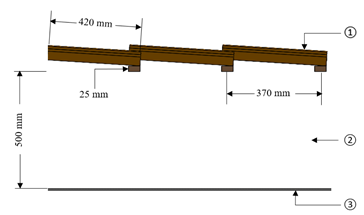 |
|
| A1 |  |
|
| A2 | 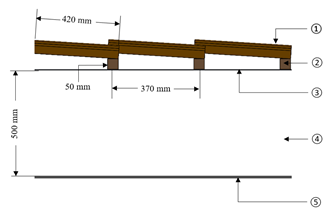 |
|
| B1 | 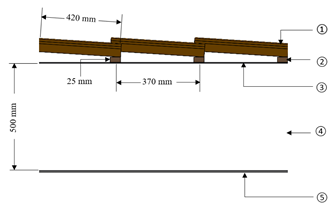 |
|
| B2 | 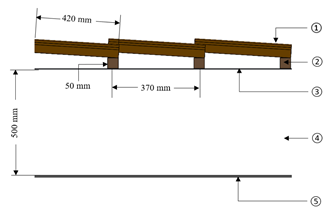 |
|
| C1 | 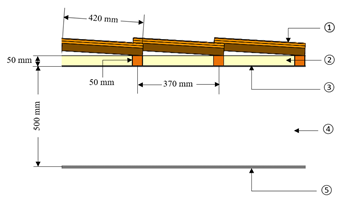 |
|
| C2 | 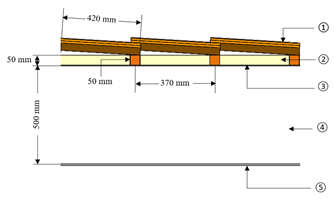 |
|
| D1 | 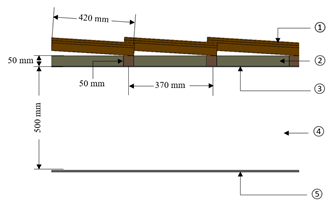 |
|
| D2 | 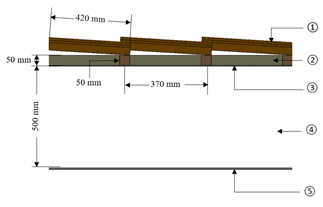 |
|
| Roof Tiles-To-Ceiling Temperature Reduction, T1–T3 (K) | |||
|---|---|---|---|
| Type of Reflective Foil | Mineral Glass Wool | Stone Wool | Percentage Difference (%) |
| Radiant barrier | 32.84 | 33.68 | 2.50 |
| Bubble foil reflective insulation | 34.18 | 34.75 | 1.62 |
| Roof Tiles-To-Ceiling Temperature Reduction, T1–T3 (K) | |||
|---|---|---|---|
| Enclosed Air Space Thickness or Insulation Type | Radiant Barrier | Bubble Foil Reflective Insulation | Percentage Difference (%) |
| 25 mm air space | 29.04 | 30.18 | 3.76% |
| 50 mm air space | 29.11 | 31.13 | 6.48% |
| Mineral glass wool | 32.84 | 34.18 | 3.93% |
| Stone wool | 33.68 | 34.75 | 3.06% |
| Heat Flux Transmission at the Reflective Foil, q1 (W/m2) | |||
|---|---|---|---|
| Type of Reflective Foil | 25 mm Enclosed Air Space | 50 mm Enclosed Air Space | Percentage Difference (%) |
| Radiant barrier | 19.52 | 14.25 | 27.02 |
| Bubble foil reflective insulation | 18.19 | 13.92 | 23.49 |
| Heat Flux Transmission at the Reflective Foil, q1 (W/m2) | |||
|---|---|---|---|
| Enclosed Air Space Thickness or Insulation Type | Radiant Barrier | Bubble Foil Reflective Insulation | Percentage Difference (%) |
| 25 mm air space | 19.52 | 18.19 | 6.84 |
| 50 mm air space | 14.25 | 13.92 | 2.34 |
| Mineral glass wool | 27.04 | 26.13 | 3.35 |
| Stone wool | 24.78 | 23.94 | 3.38 |
| Heat Flux Transmission at the Reflective Foil, q1 (W/m2) | |||
|---|---|---|---|
| Type of Reflective Foil | 50 mm Air Space | Mineral Glass Wool (50 mm) | Stone Wool (50 mm) |
| Radiant barrier | 14.25 | 27.04 (↑ 47.3%) | 24.78 (↑ 42.5%) |
| Bubble foil reflective insulation | 13.92 | 26.13 (↑ 46.7%) | 23.94 (↑ 41.9%) |
| Heat Flux Transmission at the Ceiling, q2 (W/m2) | |||
|---|---|---|---|
| Enclosed Air Space Thickness or Insulation Type | Radiant Barrier | Bubble Foil Reflective Insulation | Percentage Difference (%) |
| 25 mm air space | 9.25 | 5.26 | 43.15 |
| 50 mm air space | 7.27 | 5.25 | 27.83 |
| Mineral glass wool | 8.87 | 5.61 | 36.76 |
| Stone wool | 8.72 | 5.51 | 36.85 |
Disclaimer/Publisher’s Note: The statements, opinions and data contained in all publications are solely those of the individual author(s) and contributor(s) and not of MDPI and/or the editor(s). MDPI and/or the editor(s) disclaim responsibility for any injury to people or property resulting from any ideas, methods, instructions or products referred to in the content. |
© 2024 by the authors. Licensee MDPI, Basel, Switzerland. This article is an open access article distributed under the terms and conditions of the Creative Commons Attribution (CC BY) license (https://creativecommons.org/licenses/by/4.0/).
Share and Cite
Mohd Ashhar, M.Z.; Lim, C.H. Thermal Performance of Residential Roofs in Malaysia: Experimental Study Using an Indoor Solar Simulator. Buildings 2024, 14, 178. https://doi.org/10.3390/buildings14010178
Mohd Ashhar MZ, Lim CH. Thermal Performance of Residential Roofs in Malaysia: Experimental Study Using an Indoor Solar Simulator. Buildings. 2024; 14(1):178. https://doi.org/10.3390/buildings14010178
Chicago/Turabian StyleMohd Ashhar, Muhamad Zahin, and Chin Haw Lim. 2024. "Thermal Performance of Residential Roofs in Malaysia: Experimental Study Using an Indoor Solar Simulator" Buildings 14, no. 1: 178. https://doi.org/10.3390/buildings14010178
APA StyleMohd Ashhar, M. Z., & Lim, C. H. (2024). Thermal Performance of Residential Roofs in Malaysia: Experimental Study Using an Indoor Solar Simulator. Buildings, 14(1), 178. https://doi.org/10.3390/buildings14010178