
Study on Numerical Simulation of Arch Mechanism of Bridge Pile Foundation


Abstract
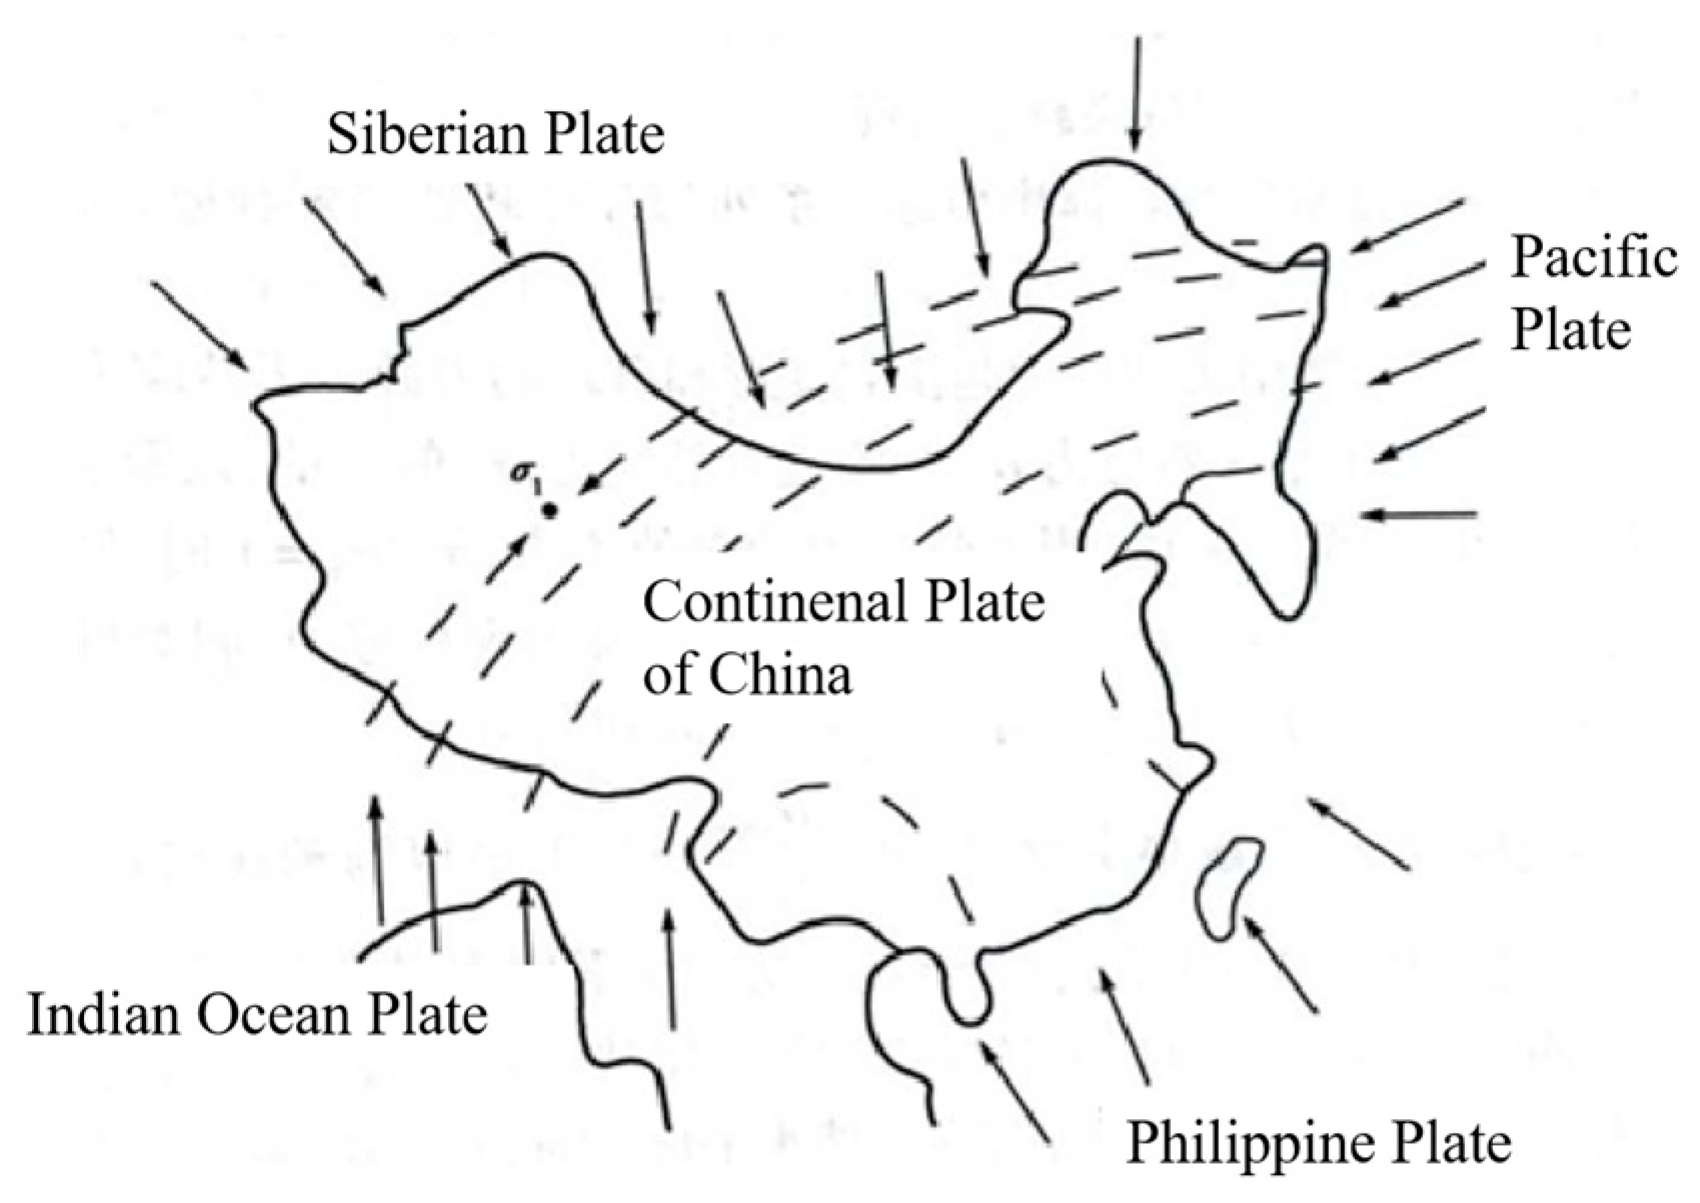
1. Introduction
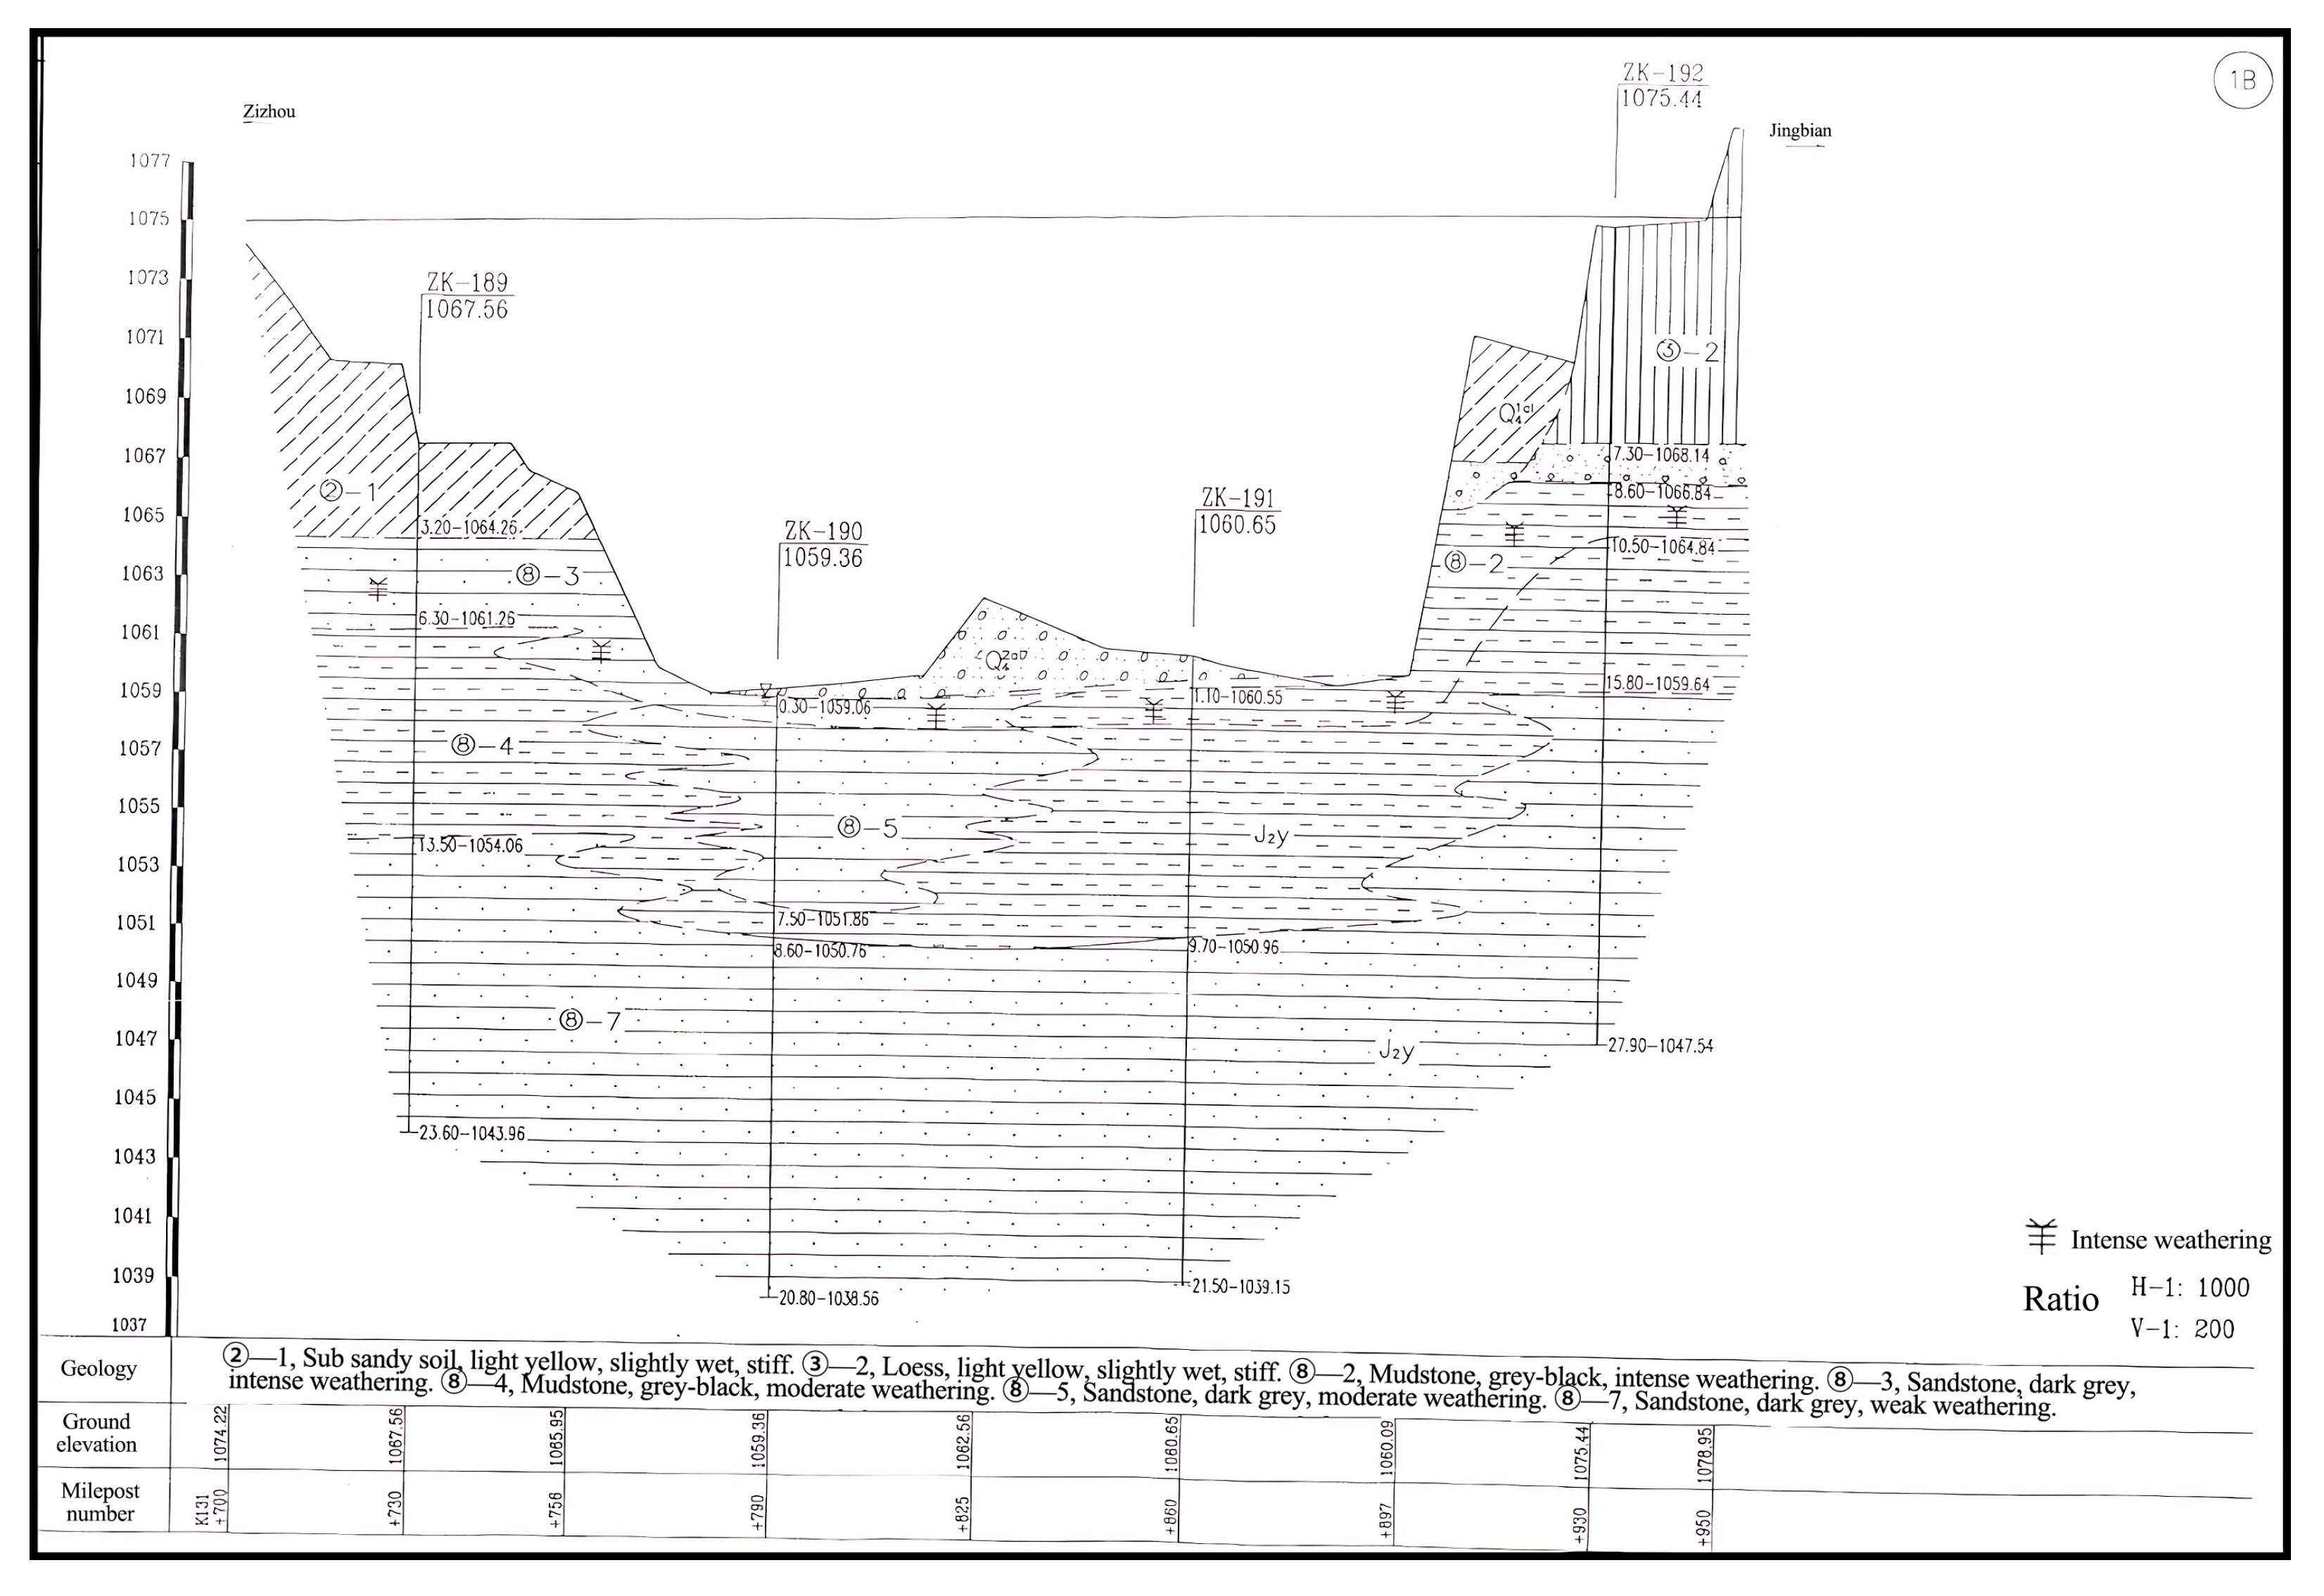
2. Bridge Area Overview
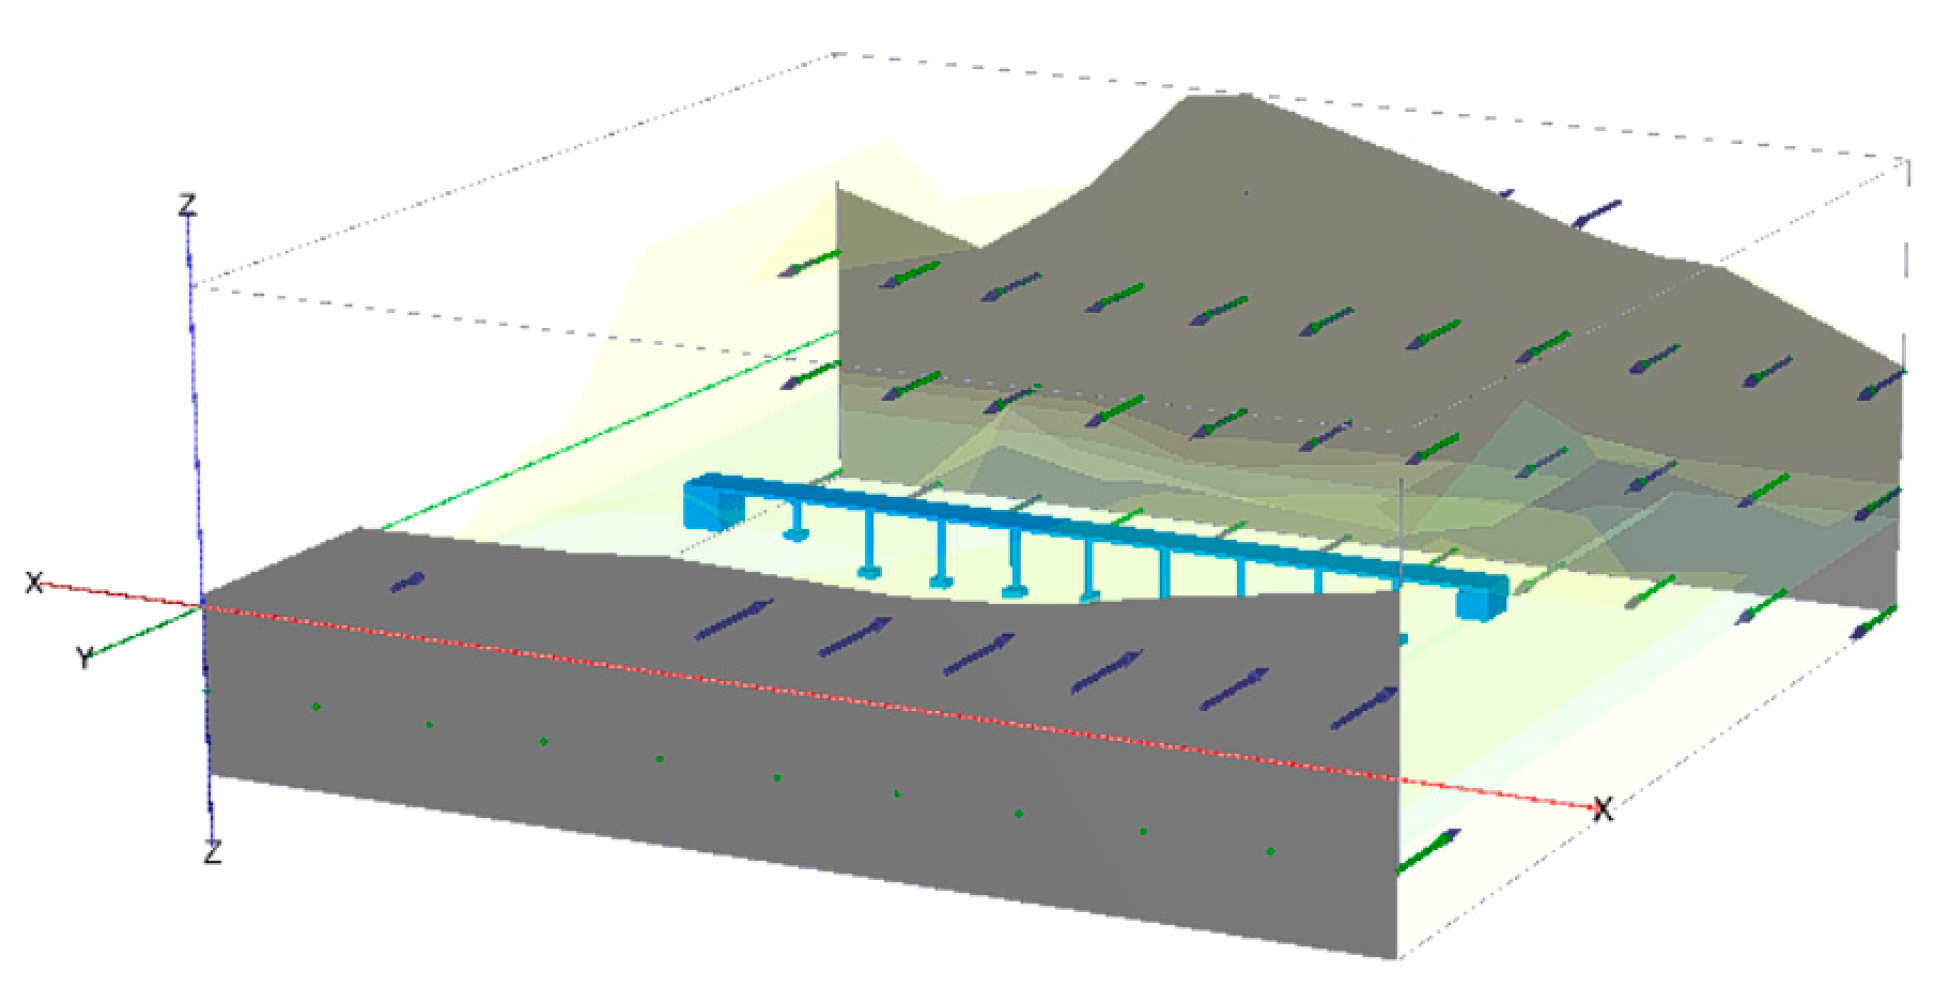
3. Model Building
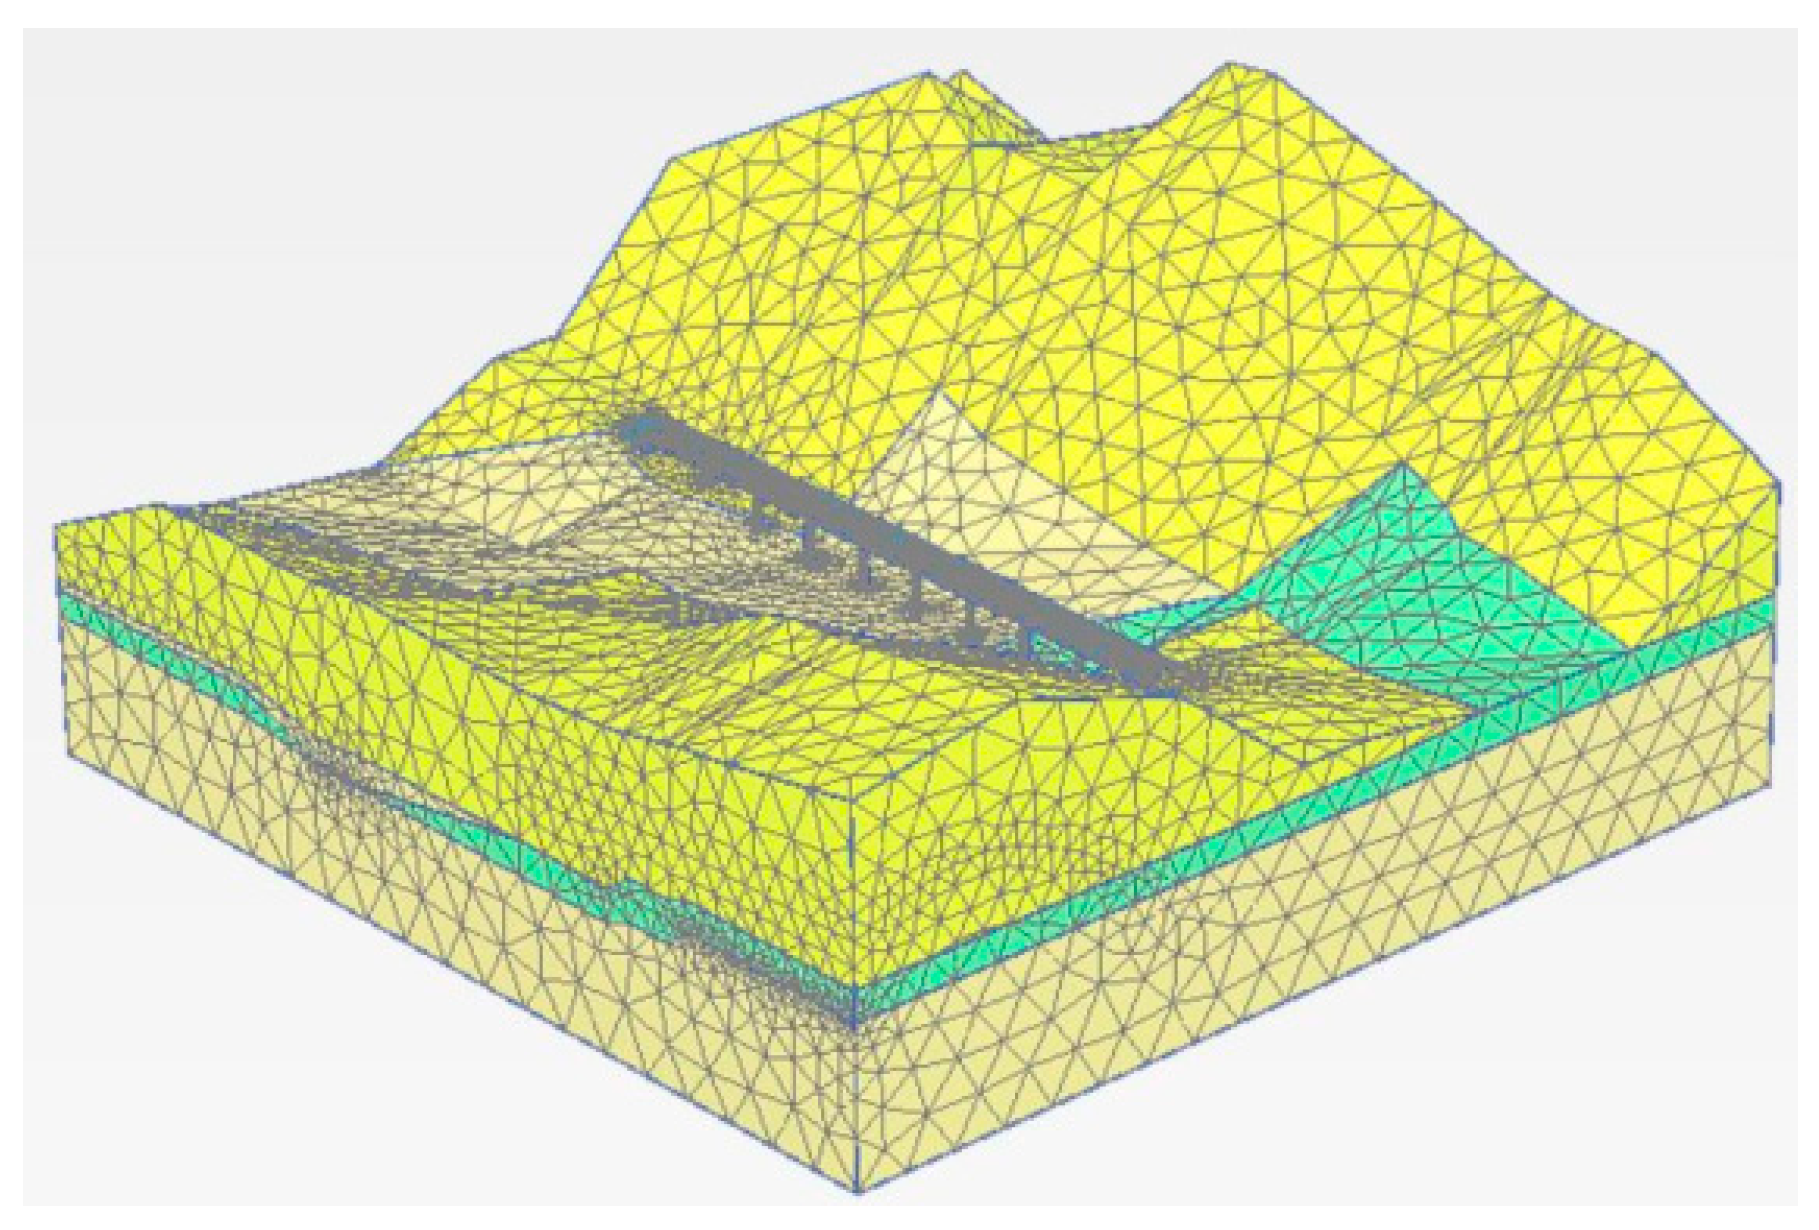
3.1. Geological Model
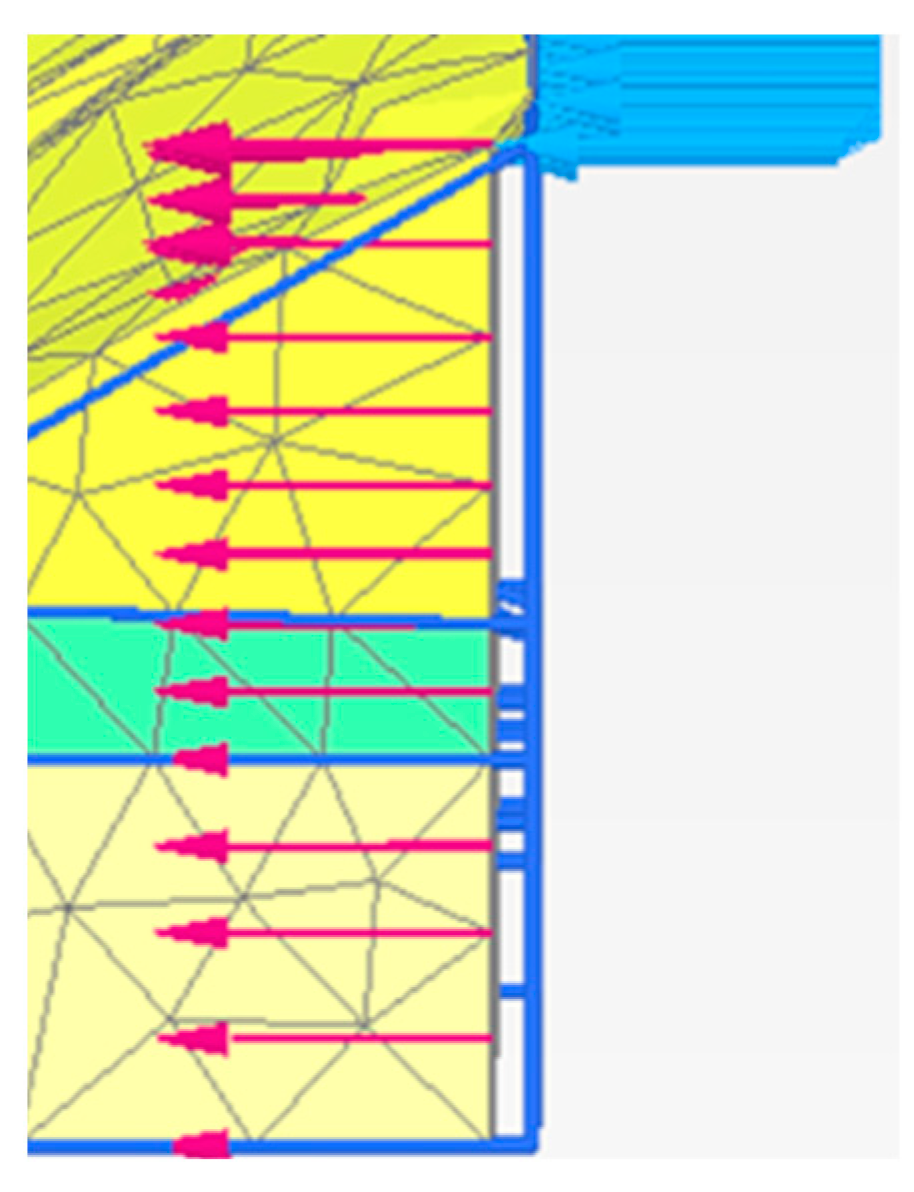
3.2. Material Characteristics and Boundary Conditions
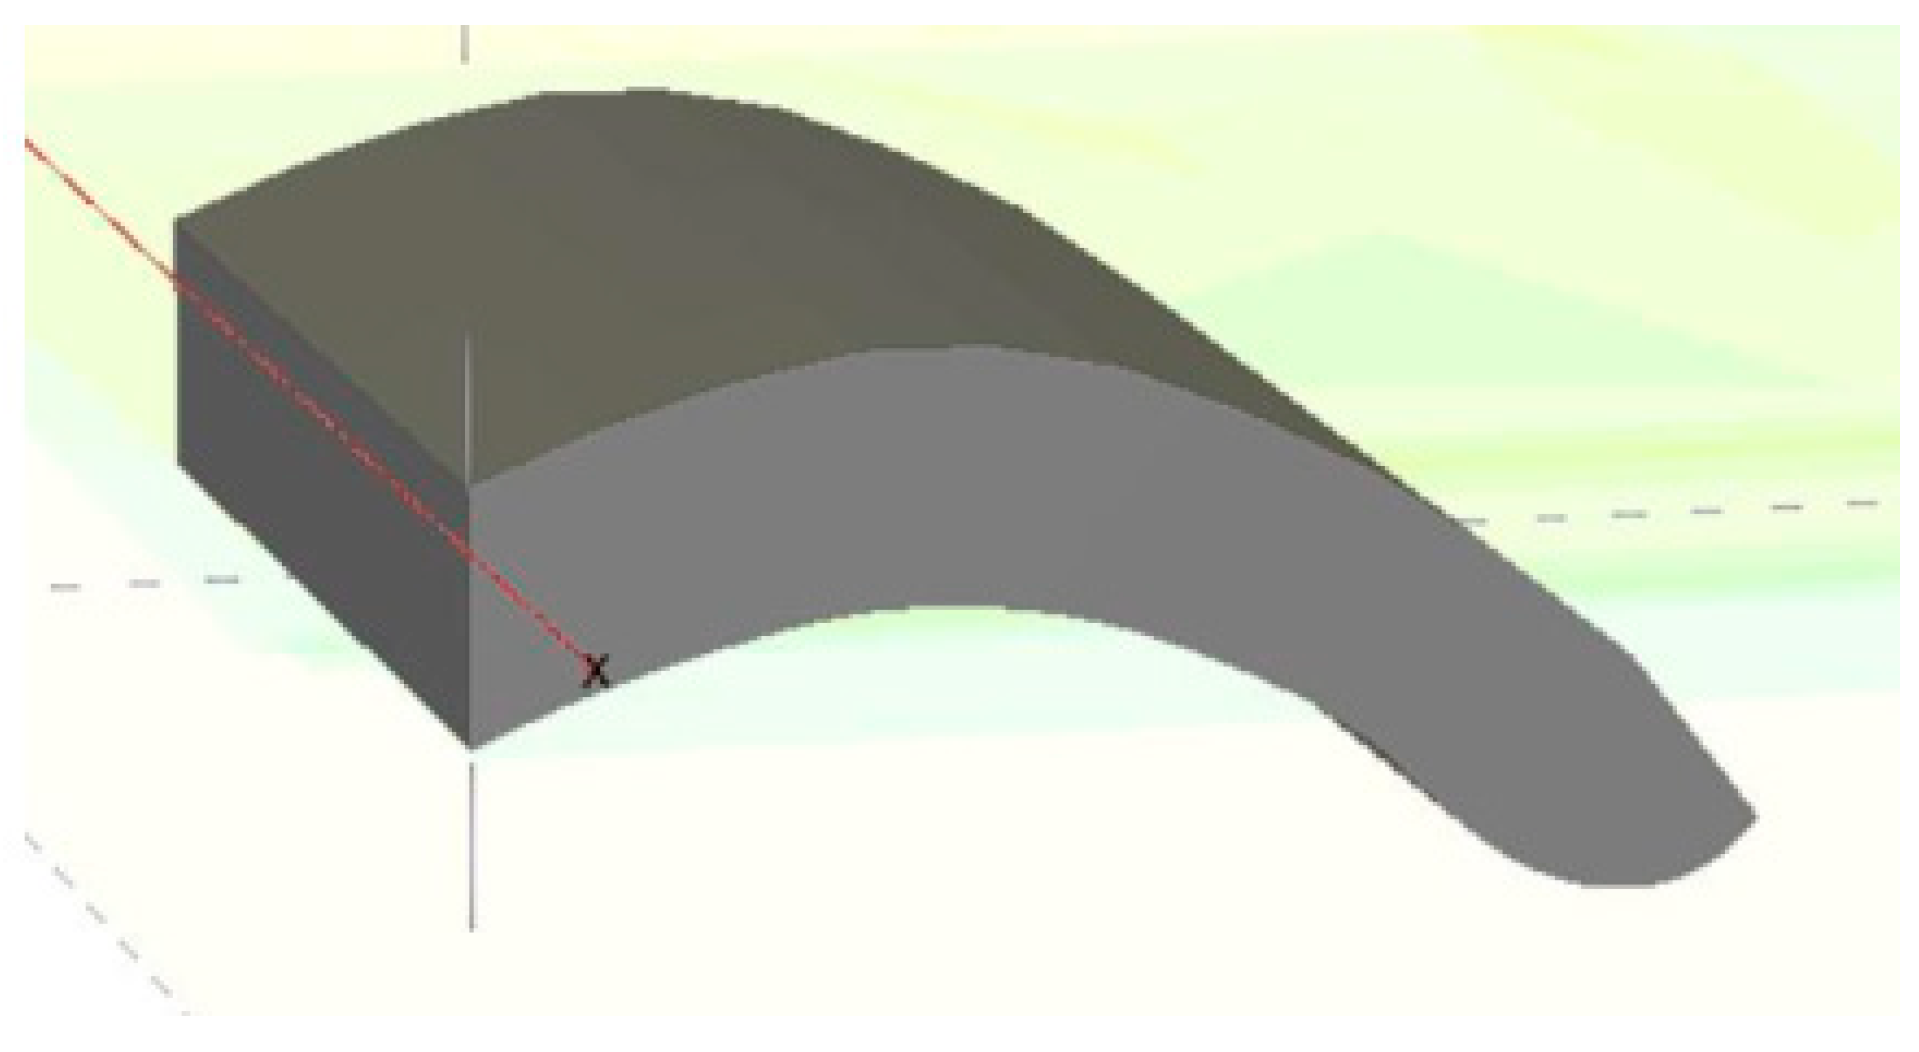
3.3. Goaf Model
4. Numerical Simulation Results and Analysis
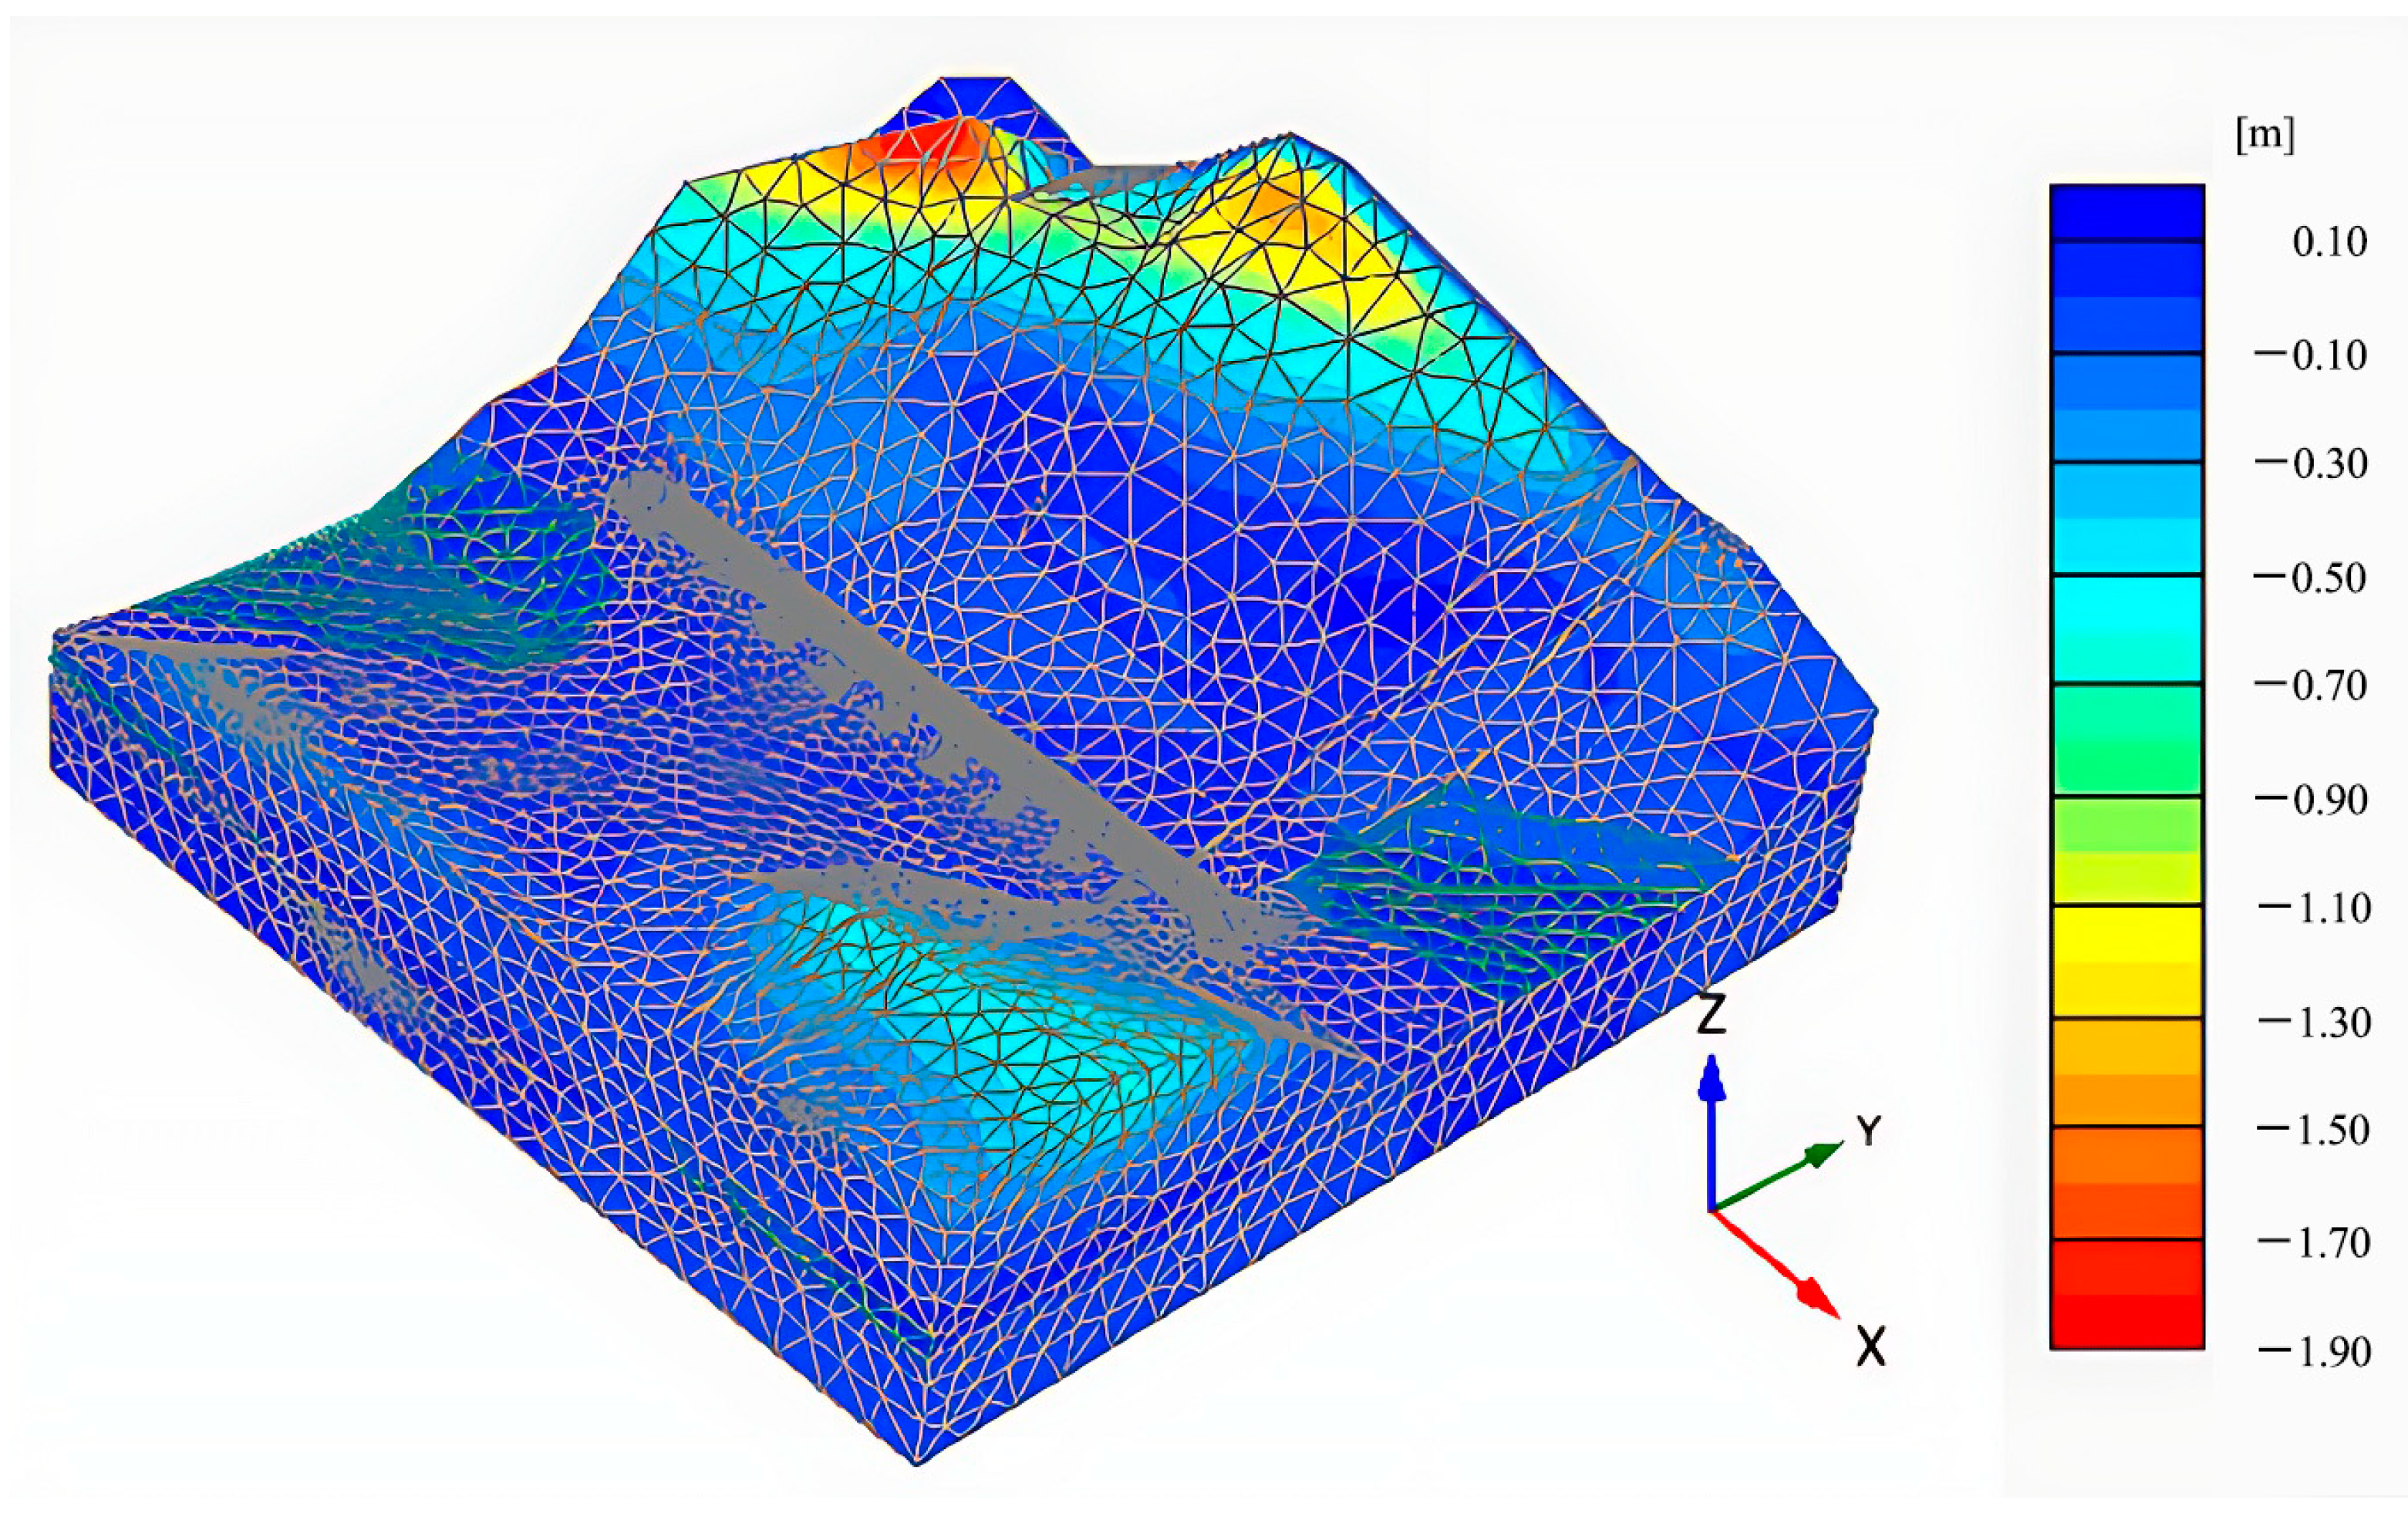
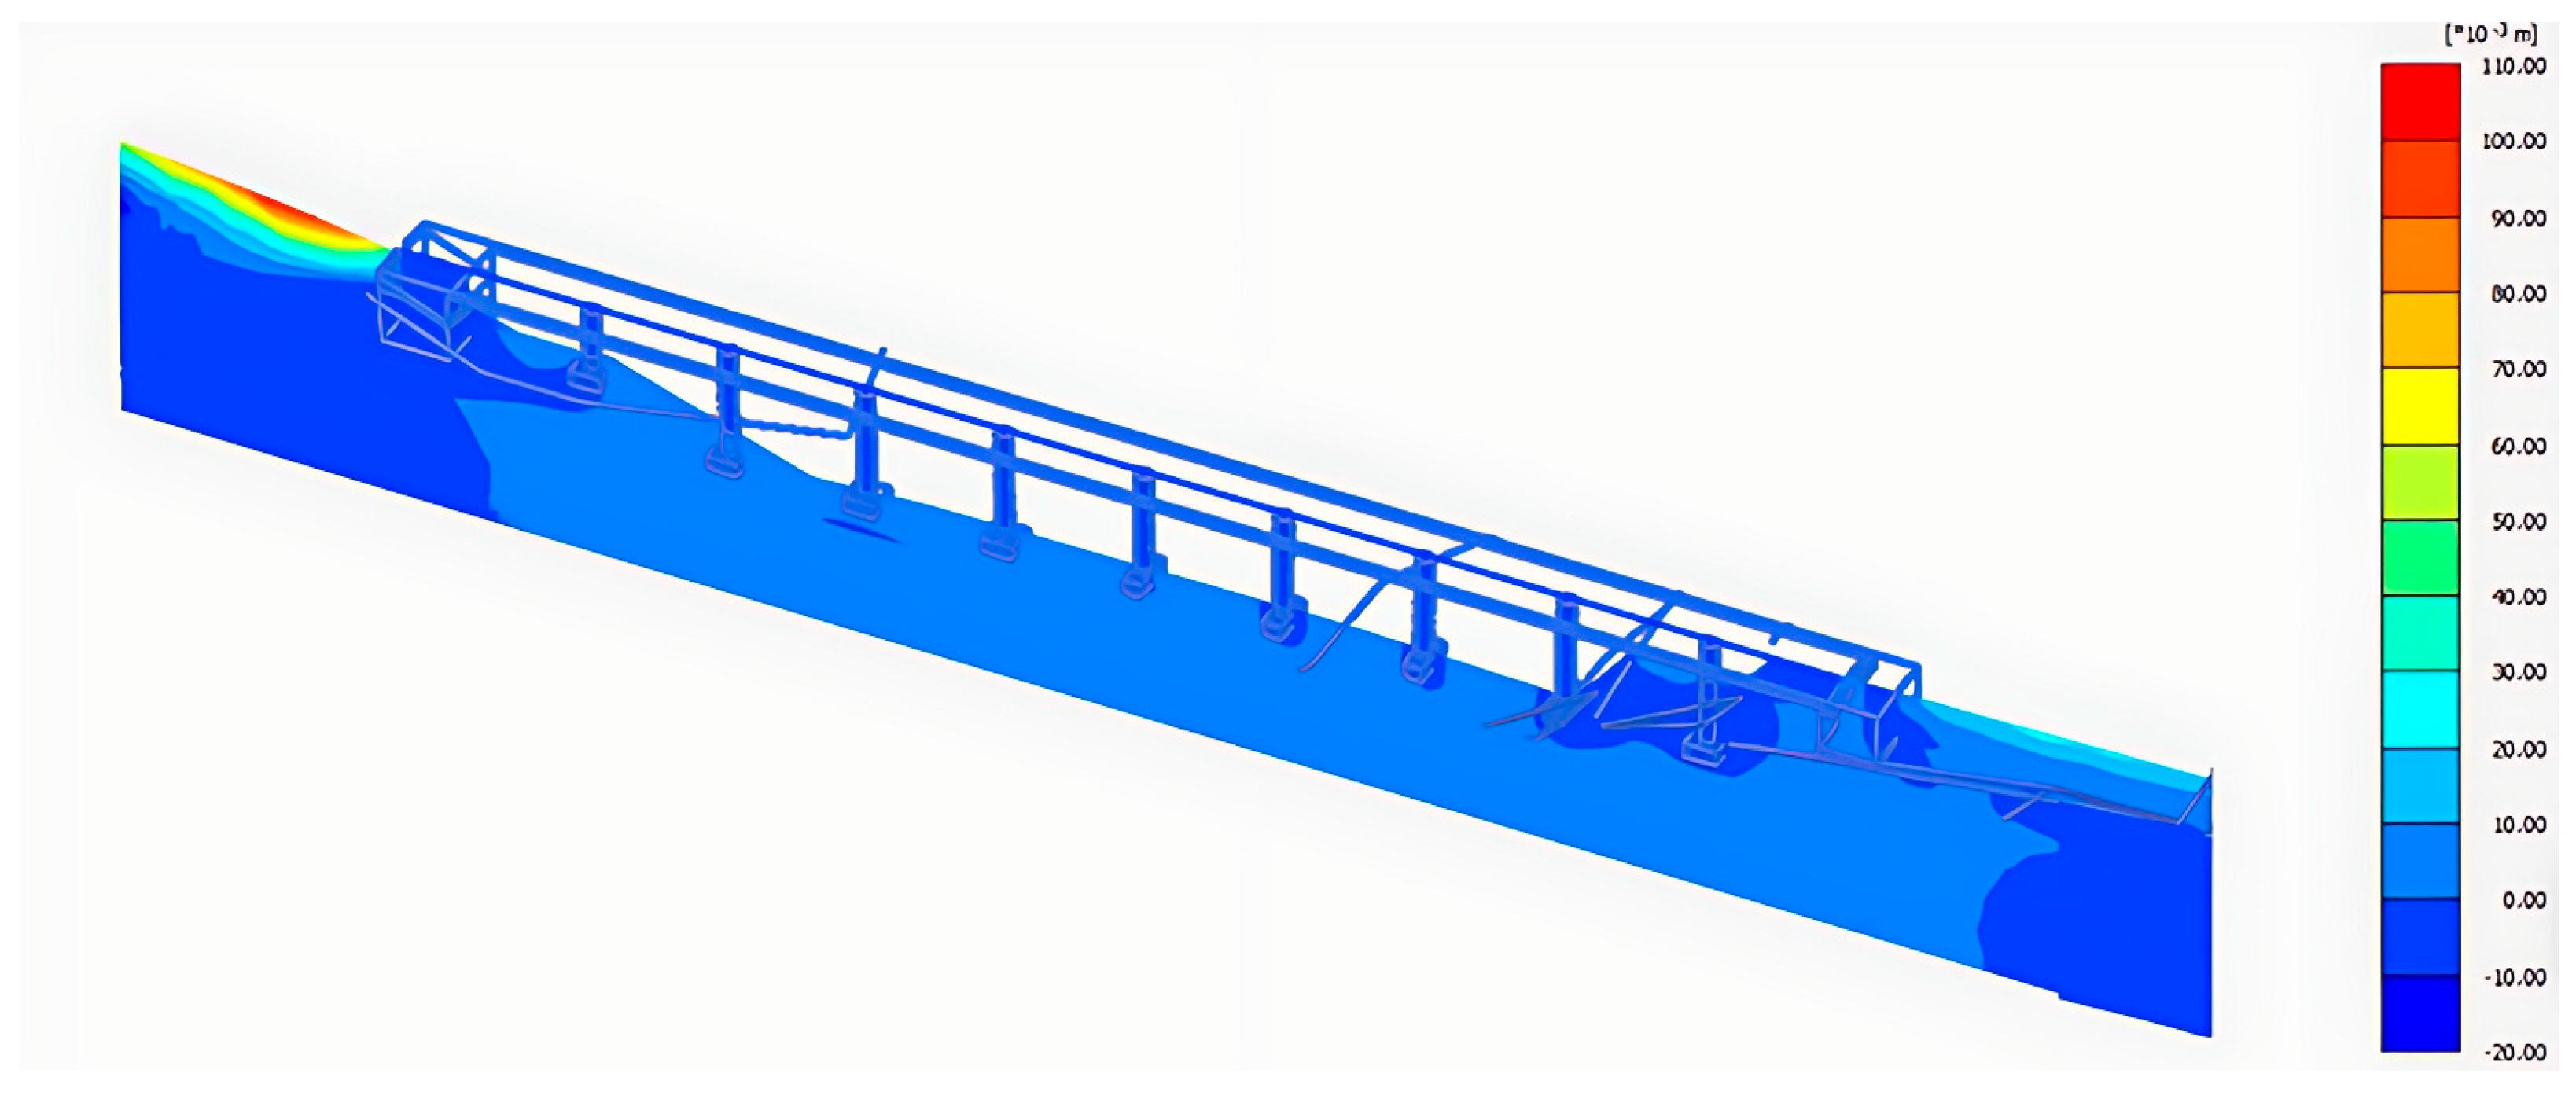
4.1. Numerical Simulation of Ground Stress
4.1.1. Working Condition 1: Natural Bridge-Formation State without Applying Ground Stress
4.1.2. Working Condition 2: The Bridge-Formation State with Equivalent Ground Stress Applied
4.1.3. Working Condition 3: Bridge-Formation State of Ground Stress Harmoniously Distributed along the Z-Axis Direction
4.1.4. Working Condition 4: The Simplified Model of the Second Joint Pier Column of the Bridge
4.2. Numerical Simulation of the Goaf Area
4.2.1. Working Condition 1: Impact of Goaf on River Valley Area under Natural State
4.2.2. Working Condition 2: Impact of Goaf on River Valley Area under Bridge-Formation State
5. Conclusions
Author Contributions
Funding
Data Availability Statement
Conflicts of Interest
Notation
| le | cell mesh size |
| re | relative unit size factor |
| xmax | maximum size of the model in the x-axis direction |
| xmin | minimum size of the model in the x-axis direction |
| ymax | maximum size of the model in the y-axis direction |
| ymin | minimum size of the model in the y-axis direction |
| zmax | maximum size of the model in the z-axis direction |
| zmin | minimum size of the model in the z-axis direction |
| E | the elastic modulus of sandstone |
| ε | total strain value |
| σ | maximum ground stress value |
References
- Fang, S.; Xu, X.; Wang, T. Influence of New Bridge Loading on Additional Foundation Settlement of Existing Bridge. J. Railw. Sci. Eng. 2022, 19, 1187–1195. [Google Scholar]
- Zhou, T.; Xu, F.; Yang, Q.; Wu, Y. A Method for Calculating the Consolidation and Creep-induced Settlement of Bridge Pile Foundation of High-speed Railway. J. Railw. Sci. Eng. 2021, 18, 1968–1977. [Google Scholar]
- Zhang, C.; Zhao, Y.; Zhang, Z.; Zhu, B. Case Study of Underground Shield Tunnels in Interchange Piles Foundation Underpinning Construction. Appl. Sci. 2021, 11, 1611. [Google Scholar] [CrossRef]
- Liu, G. Reasons Analysis and Treatment of Foundation Subsidence in Bridge Later Period under Mining Influence. J. Min. Strat. Control Eng. 2019, 24, 86–89+119. [Google Scholar]
- Liu, J. Evaluation Analysis and Reinforcement Treatment for Settlement of Double-column-type Highway Bridge Pier Foundation. Railw. Eng. 2018, 58, 27–29+41. [Google Scholar]
- Wang, Y.; Liang, S.; Huang, C.; Wang, R. Foundation Settlement Response of Existing High-Speed Railway Bridge Induced by Construction of Undercrossing Roads. Sustainability 2022, 14, 8700. [Google Scholar] [CrossRef]
- Zhang, C. Analysis of Settlement Characteristics of Friction Pile Groups of High Speed Railway Bridge Caused by Pressure Drop of Confined Water. Railw. Eng. 2021, 61, 36–40. [Google Scholar]
- Jie, J.; Hou, K.; Ou, X.; Liu, Z.; Long, T. Nonlinear Analysis of Bearing Characteristics of Single Pile in Expansive Soil. J. Basic Sci. Eng. 2021, 29, 741–751. [Google Scholar]
- Duan, J.; Yang, G.; Liu, Y.; Kan, J.; Qiu, M. Deformation characteristics of double-line ballastless track subgrade under water immersion of expansive rock foundation. J. Cent. South Univ. Sci. Technol. 2020, 51, 156–164. [Google Scholar]
- Wang, B.; Xu, B.; Liu, H. Failure Model Analysis for Piedmont Gentle Slopes Due to Temporary Confined Water. Geol. J. China Univ. 2020, 26, 665–673. [Google Scholar]
- Liu, B.; Zhang, D.; Yang, W.; Li, X. Prediction formula and its application of underlying existing tunnel heave induced by deep excavation based on case statistics. J. Cent. South Univ. Sci. Technol. 2022, 53, 1416–1428. [Google Scholar]
- Zhou, X.; Wang, S.; Li, X.; Meng, J.; Li, Z.; Zhang, L.; Pu, D.; Wang, L. Research on Theory and Technology of Floor Heave Control in Semicoal Rock Roadway: Taking Longhu Coal Mine in Qitaihe Mining Area as an Example. Lithosphere 2022, 2022, 3810988. [Google Scholar] [CrossRef]
- Krishna, P.H.; Murty, V.R. Long-term Field Heave Studies on Various Foundation Techniques in Expansive Soils. Indian Geotech. J. 2021, 51, 909–923. [Google Scholar] [CrossRef]
- Zhao, J.; Duan, S.; Chen, B.; Li, L.; He, B.; Li, P.; Liu, G. Failure mechanism of rock masses with complex geological conditions in a large underground cavern: A case study. Soil Dyn. Earthq. Eng. 2024, 177, 108439. [Google Scholar]
- Xu, C.; Zhang, W. Risk Analysis of Slope Edge Uplift of Coal Mining Area Based on New Response Surface Method. J. Wuhan Univ. Technol. 2017, 39, 56–61. [Google Scholar]
- Zhang, Z.T.; Gao, W.H.; Wang, X.; Zhang, J.Q.; Tang, X.Y. Degradation-induced evolution of particle roundness and its effect on the shear behaviour of railway ballast. Transp. Geotech. 2020, 24, 100388. [Google Scholar] [CrossRef]
- Savvides, A.A.; Papadrakakis, M. A computational study on the uncertainty quantification of failure of clays with a modified Cam-Clay yield criterion. SN Appl. Sci. 2021, 3, 659. [Google Scholar] [CrossRef]
- Chwala, M. Undrained bearing capacity of spatially random soil for rectangular footings. Soils Found. 2019, 59, 1508–1521. [Google Scholar] [CrossRef]
- Yan, C.; Xu, J.; Bao, H. Rock Mass Mechanics; Beijing People’s Communications Press: Beijing, China, 2017; pp. 123–125. [Google Scholar]
- Zhang, Z.; Liu, H. A Special Case of History the Environmental Impact by Underground Mining-The Mechanism and Measure of the Ground Upheaval Deformation of Hancheng Power Plant. Earth Sci. Front. 2001, 8, 285–295. [Google Scholar]


| Measurement Point Location | #0 | #1 | #2 | #3 | #4 | #5 | #6 | #7 | #8 | #9 | #10 | |
|---|---|---|---|---|---|---|---|---|---|---|---|---|
| Left | Parapet Side | −5.0 | −8.0 | 0.0 | 3.0 | 4.0 | 18.0 | 78.0 | 148.0 | 295.0 | 17.0 | 0.0 |
| Central Divider Side | −1.0 | 2.0 | 3.0 | 19.0 | 31.0 | 51.0 | 121.0 | 185.0 | 258.0 | −8.0 | −22.0 | |
| Right | Parapet Side | −2.0 | −3.0 | 3.0 | 88.0 | 112.0 | 103.0 | 90.0 | 267.0 | 309.0 | 34.0 | −2.0 |
| Central Divider Side | 1.0 | −32.0 | 21.0 | 97.0 | 82.0 | 58.0 | 51.0 | 228.0 | 270.0 | −5.0 | −21.0 | |
| Project | Parameter Values |
|---|---|
| Nature Density γ/(kN/m3) | 24.18 |
| Saturated Density γsat/(kN/m3) | 24.35 |
| Void Ratio e | 0.02 |
| Modulus of Elasticity E/(kN/m2) | 4.11 × 10⁵ |
| Poisson Ratio ν | 0.232 |
| Cohesive Strength c/(kN/m2) | 112.6 |
| Internal Friction Angle Φ/(°) | 26 |
| Global Density Level | Value re |
|---|---|
| Very Coarse | 2.0 |
| Coarse | 1.5 |
| Medium | 1.0 |
| Fine | 0.7 |
| Very Fine | 0.5 |
Disclaimer/Publisher’s Note: The statements, opinions and data contained in all publications are solely those of the individual author(s) and contributor(s) and not of MDPI and/or the editor(s). MDPI and/or the editor(s) disclaim responsibility for any injury to people or property resulting from any ideas, methods, instructions or products referred to in the content. |
© 2024 by the authors. Licensee MDPI, Basel, Switzerland. This article is an open access article distributed under the terms and conditions of the Creative Commons Attribution (CC BY) license (https://creativecommons.org/licenses/by/4.0/).
Share and Cite
Qu, Z.; Han, Z.; Tang, H.; Xu, J.; Wang, H.; Liu, Y. Study on Numerical Simulation of Arch Mechanism of Bridge Pile Foundation. Buildings 2024, 14, 146. https://doi.org/10.3390/buildings14010146
Qu Z, Han Z, Tang H, Xu J, Wang H, Liu Y. Study on Numerical Simulation of Arch Mechanism of Bridge Pile Foundation. Buildings. 2024; 14(1):146. https://doi.org/10.3390/buildings14010146
Chicago/Turabian StyleQu, Zhanhui, Zemin Han, Haoyu Tang, Jiangbo Xu, Heping Wang, and Yifan Liu. 2024. "Study on Numerical Simulation of Arch Mechanism of Bridge Pile Foundation" Buildings 14, no. 1: 146. https://doi.org/10.3390/buildings14010146
APA StyleQu, Z., Han, Z., Tang, H., Xu, J., Wang, H., & Liu, Y. (2024). Study on Numerical Simulation of Arch Mechanism of Bridge Pile Foundation. Buildings, 14(1), 146. https://doi.org/10.3390/buildings14010146