Article

Field Investigation of Water Infiltration into a Three-Layer Capillary Barrier Landfill Cover System Using Local Soils and Construction Waste

1
Key Laboratory of Ministry of Education for Geomechanics and Embankment Engineering, Hohai University, Nanjing 210098, China
2
Geotechnical Engineering Research Center of Jiangsu Province, Nanjing 210098, China
3
Engineering Research Center of Dredging Technology of Ministry of Education, Hohai University, Changzhou 213000, China
*
Author to whom correspondence should be addressed.
Buildings 2024, 14(1), 139; https://doi.org/10.3390/buildings14010139
Submission received: 31 October 2023 / Revised: 30 December 2023 / Accepted: 3 January 2024 / Published: 5 January 2024
(This article belongs to the Special Issue Research towards the Green and Sustainable Buildings and Cities)

Abstract

:
In response to the rapid urban expansion and the burgeoning number of landfill sites, managing water infiltration in these areas has become a critical challenge, especially in cities like Shenzhen, Hong Kong, and Singapore where traditional cover materials such as silt, clayey gravel, and sand are scarce. A three-layer (silt/gravelly sand/clay) capillary barrier cover system has been proposed to address this issue in humid climates. As an alternative to scarce traditional materials, using local soils and construction waste (CW) for this system presents a viable solution. However, the real-world performance of this adapted three-layer system, constructed with local soils and CW under natural rainfall conditions, remains to be fully evaluated. This paper presents a field test evaluating the water infiltration behavior of a three-layer capillary barrier landfill cover system under natural conditions. The tri-layered system is comprised of a 0.6 m loose local unscreened soil layer, covered by a 0.4 m CW layer and topped by a 0.8 m heavily compacted local screened soil layer. Monitoring findings reveal that, during the wet season, infiltration through the top two layers was staved off until the third rainfall, after which these layers retained moisture until 15 September 2016. The fluctuation in pore water pressure in the topmost layers showed each rainfall was contingent not only on the day’s precipitation but also the hydraulic state. Beyond the hydraulic state’s influence, a deeper tensiometer showed resulted in a diminished correlation between the surge in pore water pressure and daily rainfall. This declining correlation with depth can be attributed to the capillary effect and the reduced permeability of the screened soil layer. Rainfall patterns significantly affect percolation, with the combination of a short-duration, intense rainfall and prolonged weak rainfall resulting in a marked increase in percolation. In the foundational screened soil layer, the pore water pressure remained relatively low, with the cumulative percolation over six months (June to December) registering approximately 10 mm. These findings suggest a promising performance of the three-layer capillary barrier cover system, integrating local soils and CW, in the year of the study conducted in a humid environment.

1. Introduction

Recently, a three-layer capillary barrier cover system has been proposed to minimize water infiltration into municipal solid waste in humid climates [1,2]. The three-layer cover system consists of a fine-grained soil layer (e.g., silt layer) overlying a coarse-grained layer (e.g., gravelly sand layer), which in turn overlies a fine-grained soil layer such as clay layer. Results obtained from numerical simulations [1], soil column tests [3], and physical flume model tests [2] show that the three-layer cover system performed well under heavy rainfalls. The breakthrough of the upper two layers occurred after heavy rainfalls. The percolation through the three-layer capillary barrier cover system was negligible, primarily because the low permeability of the bottom clay layer redirected most of the infiltrated rainwater laterally along the gravelly sand layer. This transformation meant that the gravelly sand layer’s role shifted from a capillary barrier to a lateral diversion passage, due to the influence of the clay layer following the upper layers. Recently, construction waste has been extensively used in engineering construction. An optimized system based on the three-layer capillary barrier cover has been proposed [4], particularly addressing the challenges of material availability in urban areas such as Shenzhen, Hong Kong, and Singapore. To reduce costs in a landfill cover system, construction waste was used instead of gravel in the middle layer, and local soil replaced kaolinite. Additionally, a vegetative layer was added on top. A field test was conducted to assess the system’s impermeability. However, the performances of this three-layer capillary barrier system in responding to different rainfall patterns in field tests are limited.
Field monitoring programs have been carried out extensively on traditional landfill covers, for instance, compacted clay cover [5], evapotranspiration cover [6,7], two-layer capillary barrier [8,9], and multi-layered cover [10]. In these field sites, monitoring data were usually recorded by a data logger or collected manually at a low frequency. However, some rainfalls only lasted a few hours and thus the data may be missed. Moreover, landfills usually are located far away from downtown and thus lack computers and electricity for the data logger. To solve these difficulties, a wireless system based on a General Packet Radio Service (GPRS) network was used to establish the monitoring system at a high frequency [11]. In this system, the computer could be fixed far away from the testing site (e.g., landfill) and the instruments can be installed in the testing site where the GPRS network covers. However, the GPRS network may not be stable sometimes due to the interference from significant noise and impairments at the site [12]. Under such conditions, the monitoring system in the landfill may not work effectively.
In this study, an architecture with local and GPRS networks at a high logging frequency was established in the landfill where the GPRS network may not be good sometimes. Based on this architecture, the study investigated the performance of a three-layer cover system using local soils and construction waste (CW) under various natural rainfall conditions in a humid climate. Additionally, the research explored the performances of the three-layer capillary barrier system responding to different types of rainfall. For each heavy rainfall, the responses of measured pore water pressure in the local soils and CW were measured. In addition, the percolation was directly measured with drain gauges to better understand the performance of the three-layer cover system using the local soils and CW.

2. Materials and Methods
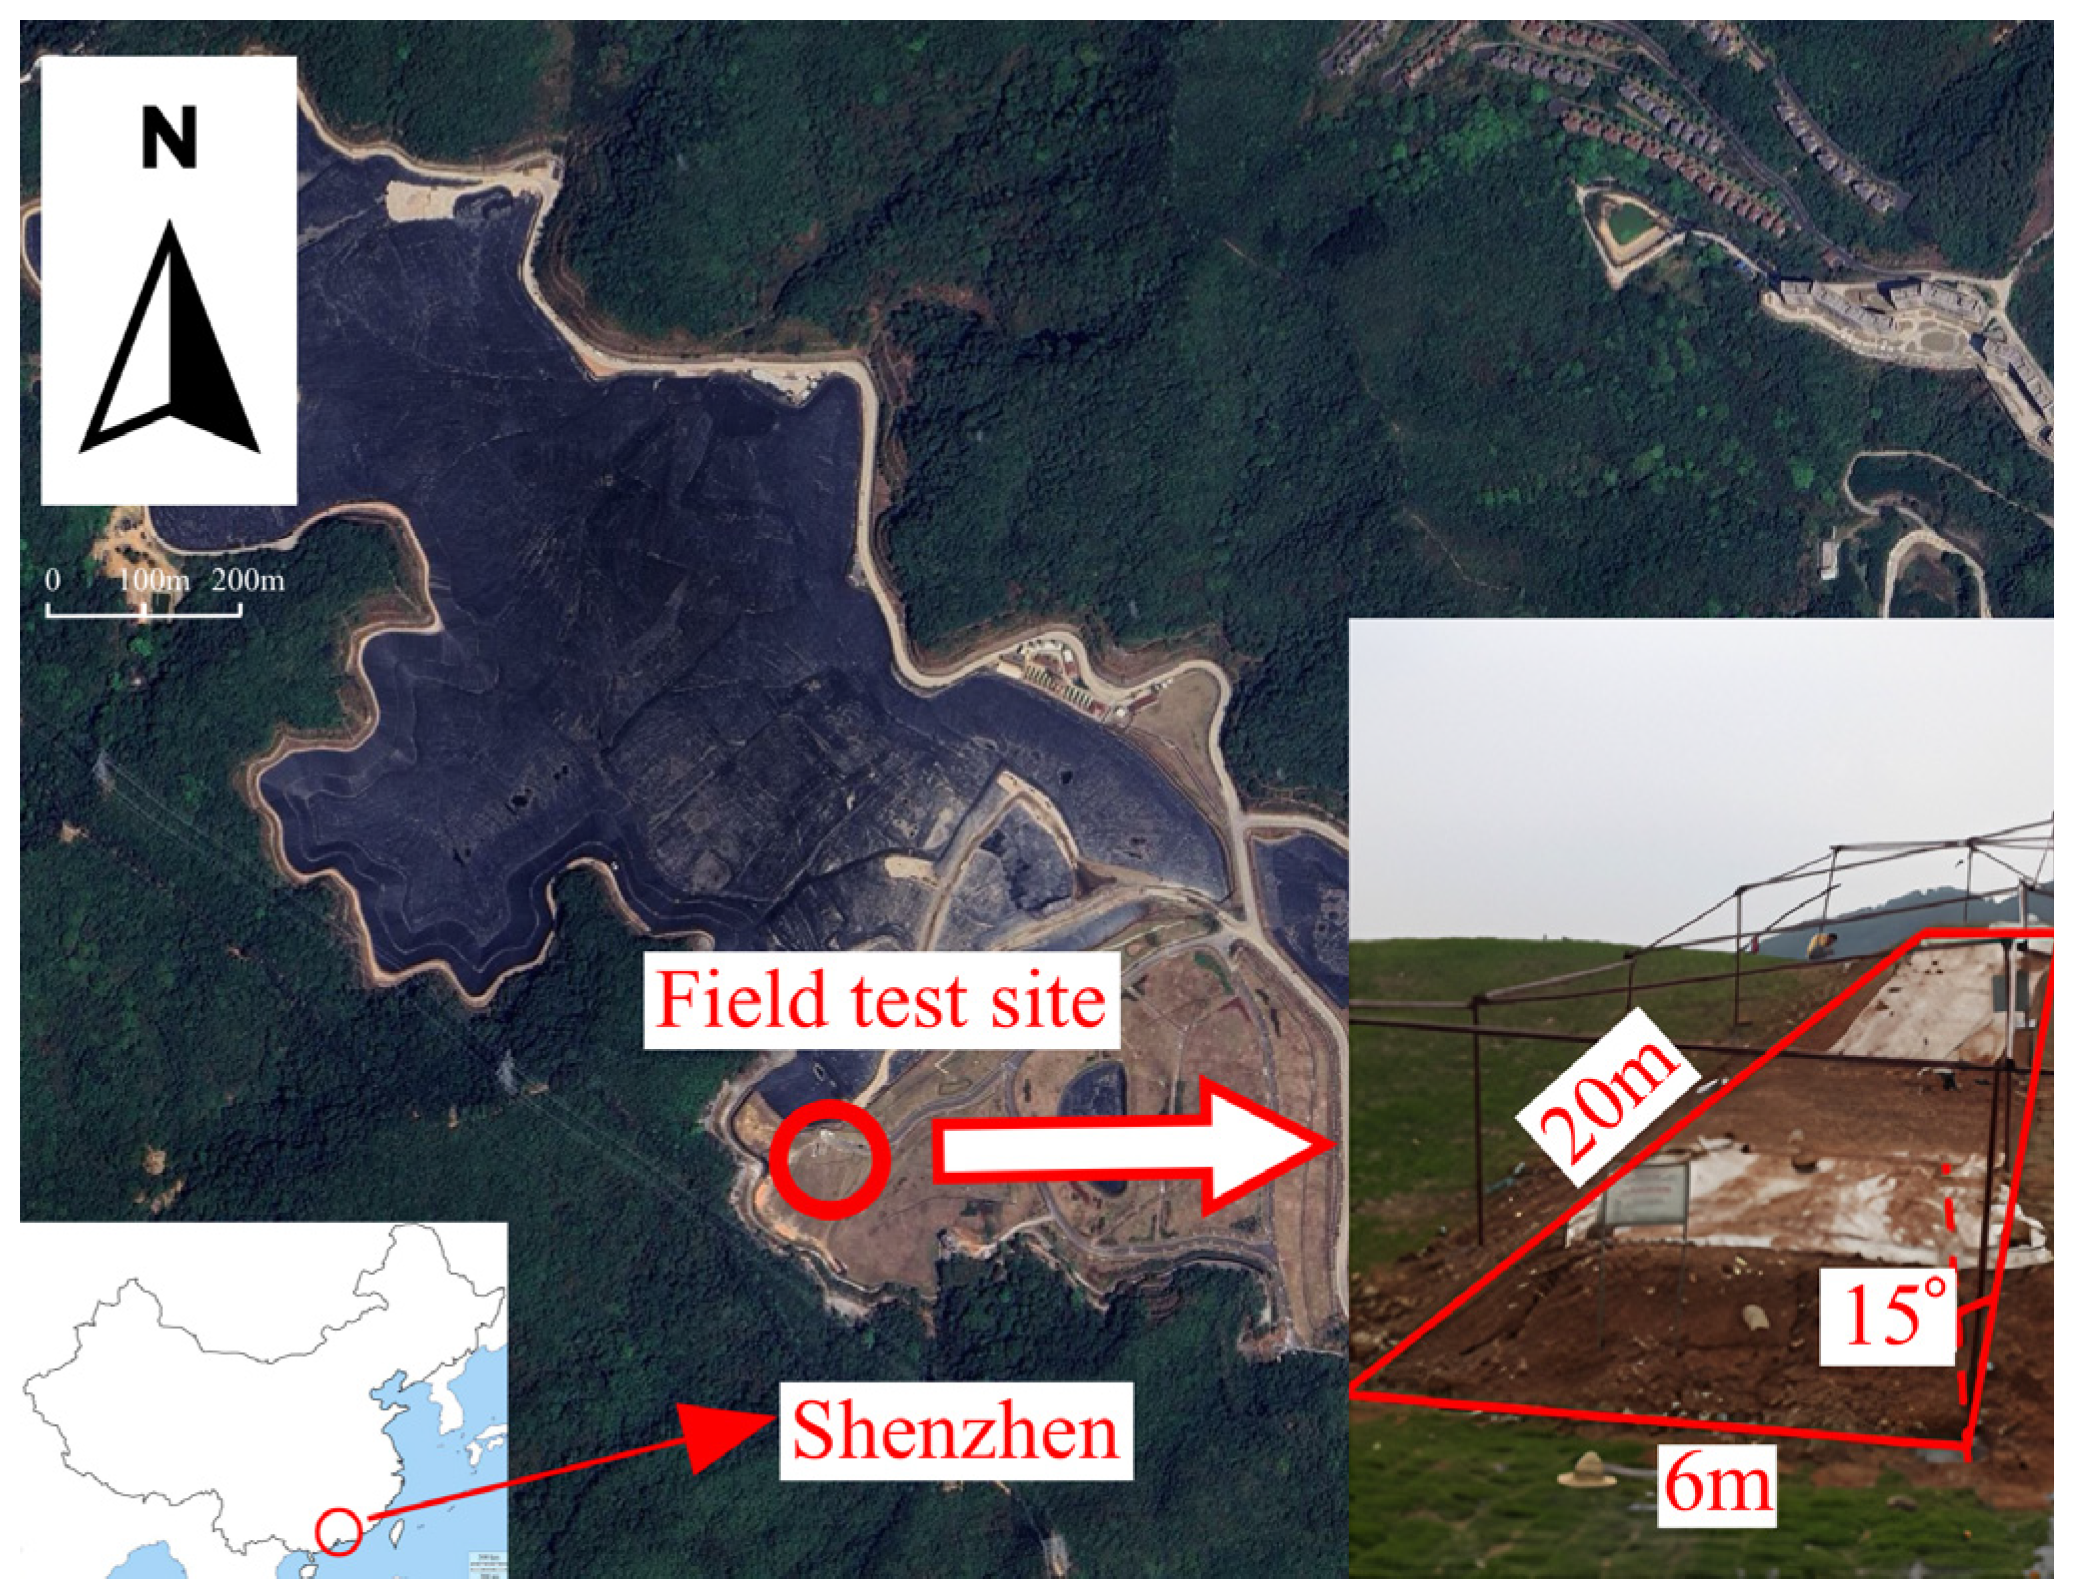
2.1. Testing Site

The testing site is located at the Xiaping solid waste landfill in Shenzhen, Guangdong China, as shown in Figure 1. The Xiaping landfill, the largest one in Shenzhen, receives an average of 5300 t of domestic waste per day. More than 6 Mt domestic wastes have been dumped in the landfill. After the landfill reaches the designed height, a final cover system has been installed over the waste.
This testing site is in a humid region with an average annual rainfall of about 1932.9 mm. The daily evaporation potential values are about 4.6 and 3.3 mm in wet and dry seasons, respectively. The average monthly maximum and minimum temperatures range from 19.8 °C to 32.3 °C and from 12.5 °C to 26.3 °C, respectively. No freezing temperature was observed at the site.
An area, 6 m wide by 20 m long, was selected on a slope along the western side of the Xiaping solid waste landfill. The test area has an average slope angle of about 15° and a height of 5 m. Based on the conceptual framework from Ng et al. [1,2], the three-layer capillary barrier cover system in this study consisted of a 0.6 m thick loose local unscreened soil layer overlying a 0.4 m thick construction waste layer and a 0.8 m thick heavily local compacted screened soil layer. The screened local soil was obtained by screening the local soil through a layer of metal mesh with a 10 mm aperture.
The cover system primarily consists of three layers: unscreened soil, construction waste, and screened soil. The unscreened and screened soils are sourced locally, while the construction waste predominantly comprises waste concrete and bricks. These types of construction waste are generally considered to be environmentally inert. This implies that under natural conditions, they are less prone to chemical reactions.

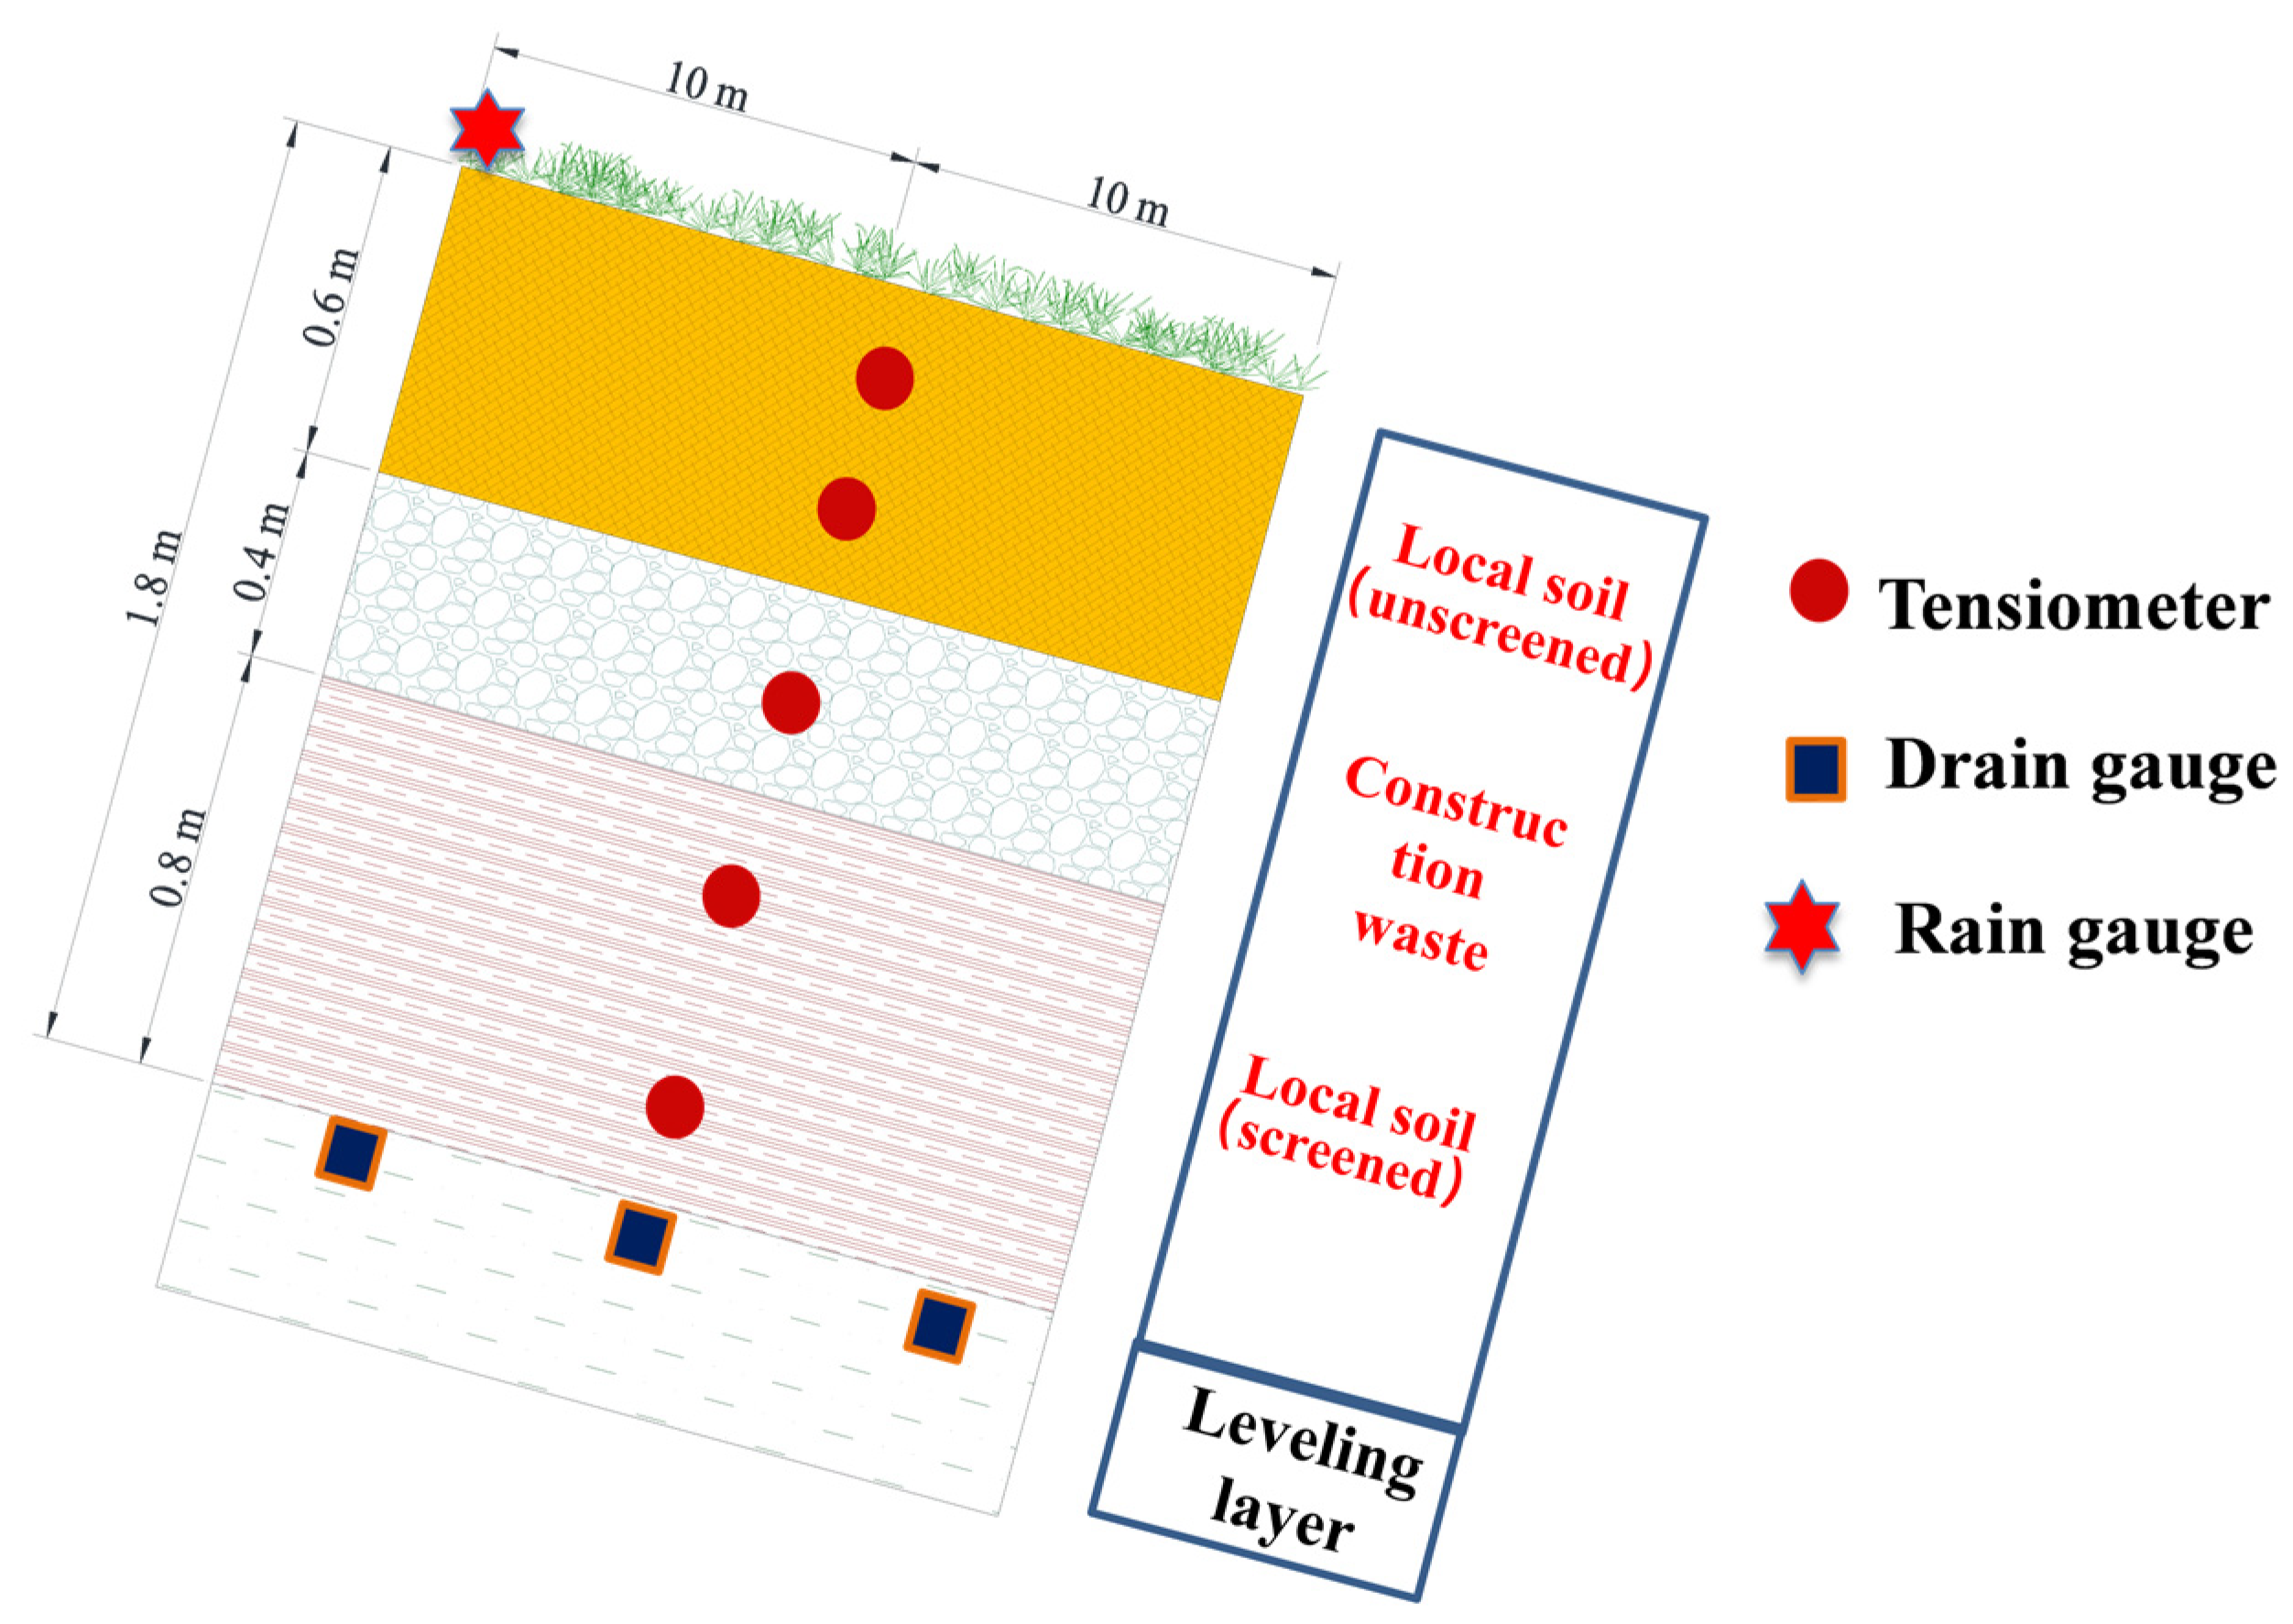
2.2. Materials and Construction Methods

A sampling program was conducted during the construction of the cover. The samples were analyzed for particle size distribution (ASTM D 422) [13], Atterberg limits (ASTM D 4318) [14], compaction characteristics (ASTM D 698) [15], and saturated permeability properties (ASTM D 5084) [16]. Table 1 summaries the physical properties of the three soils (i.e., unscreened soil, CW, and screened soil). The unscreened soil exhibited D60, D30, and D10 values of 0.298 mm, 0.091 mm, and 0.006 mm, respectively, while the screened soil showed values of 0.165 mm, 0.032 mm, and 0.003 mm. The fine content was 25.2% for the unscreened soil and 40% for the screened soil. After screening, an increase in fine content was observed, leading to a decrease in the saturated hydraulic conductivity (ks). The main difference between the CW layer and the local soil lies in the overall larger particle size, with D60, D30, and D10 values of 20.1 mm, 8.9 mm, and 2.3 mm, respectively. The saturated hydraulic conductivity of the CW layer is 6–7 orders of magnitude higher than that of the screened soil, enabling it to form a cover system with capillary barrier effects (CCBE) with the unscreened soil. Construction waste mainly consists of inert waste, non-inert waste, and contaminated waste; the CW chosen for this study mainly consists of recycled crushed concrete and bricks. The particle size of these materials determines their hydraulic properties. These are classified as inert waste and have no environmental impacts under natural conditions [17,18]. For the upper two layers, the relative densities of unscreened soil and CW were 80% and 94%. For the bottom layer, the screened soil was compacted to 95% of its maximum dry density, aiming to obtain a low coefficient of water saturated permeability and porosity.
The three-layer landfill cover was constructed from July 2015 to May 2016. The soils were compacted at four sublayers for the bottom layer, three sublayers for the middle layer, and three sublayers for the top layer using a mini roller compactor with a weight of 1 t. As suggested by Ng et al. [2], geotextiles were installed at the interface between the two soil layers at depths of 0.6 and 1.0 m to prevent soil particle migration. The geotextiles used in our study were non-woven, with a thickness of 0.9 mm, and had an equivalent pore size ranging from approximately 0.07 mm to 0.2 mm, the saturated permeability of geotextile (i.e., 7 × 10⁻² m/s) was significantly higher than that of the uppermost soil layer (i.e., 5 × 10⁻⁷∼9 × 10⁻⁷ m/s), water penetration was not affected. After the construction of the cover system, the instrumentation and monitoring system were installed at the testing site.

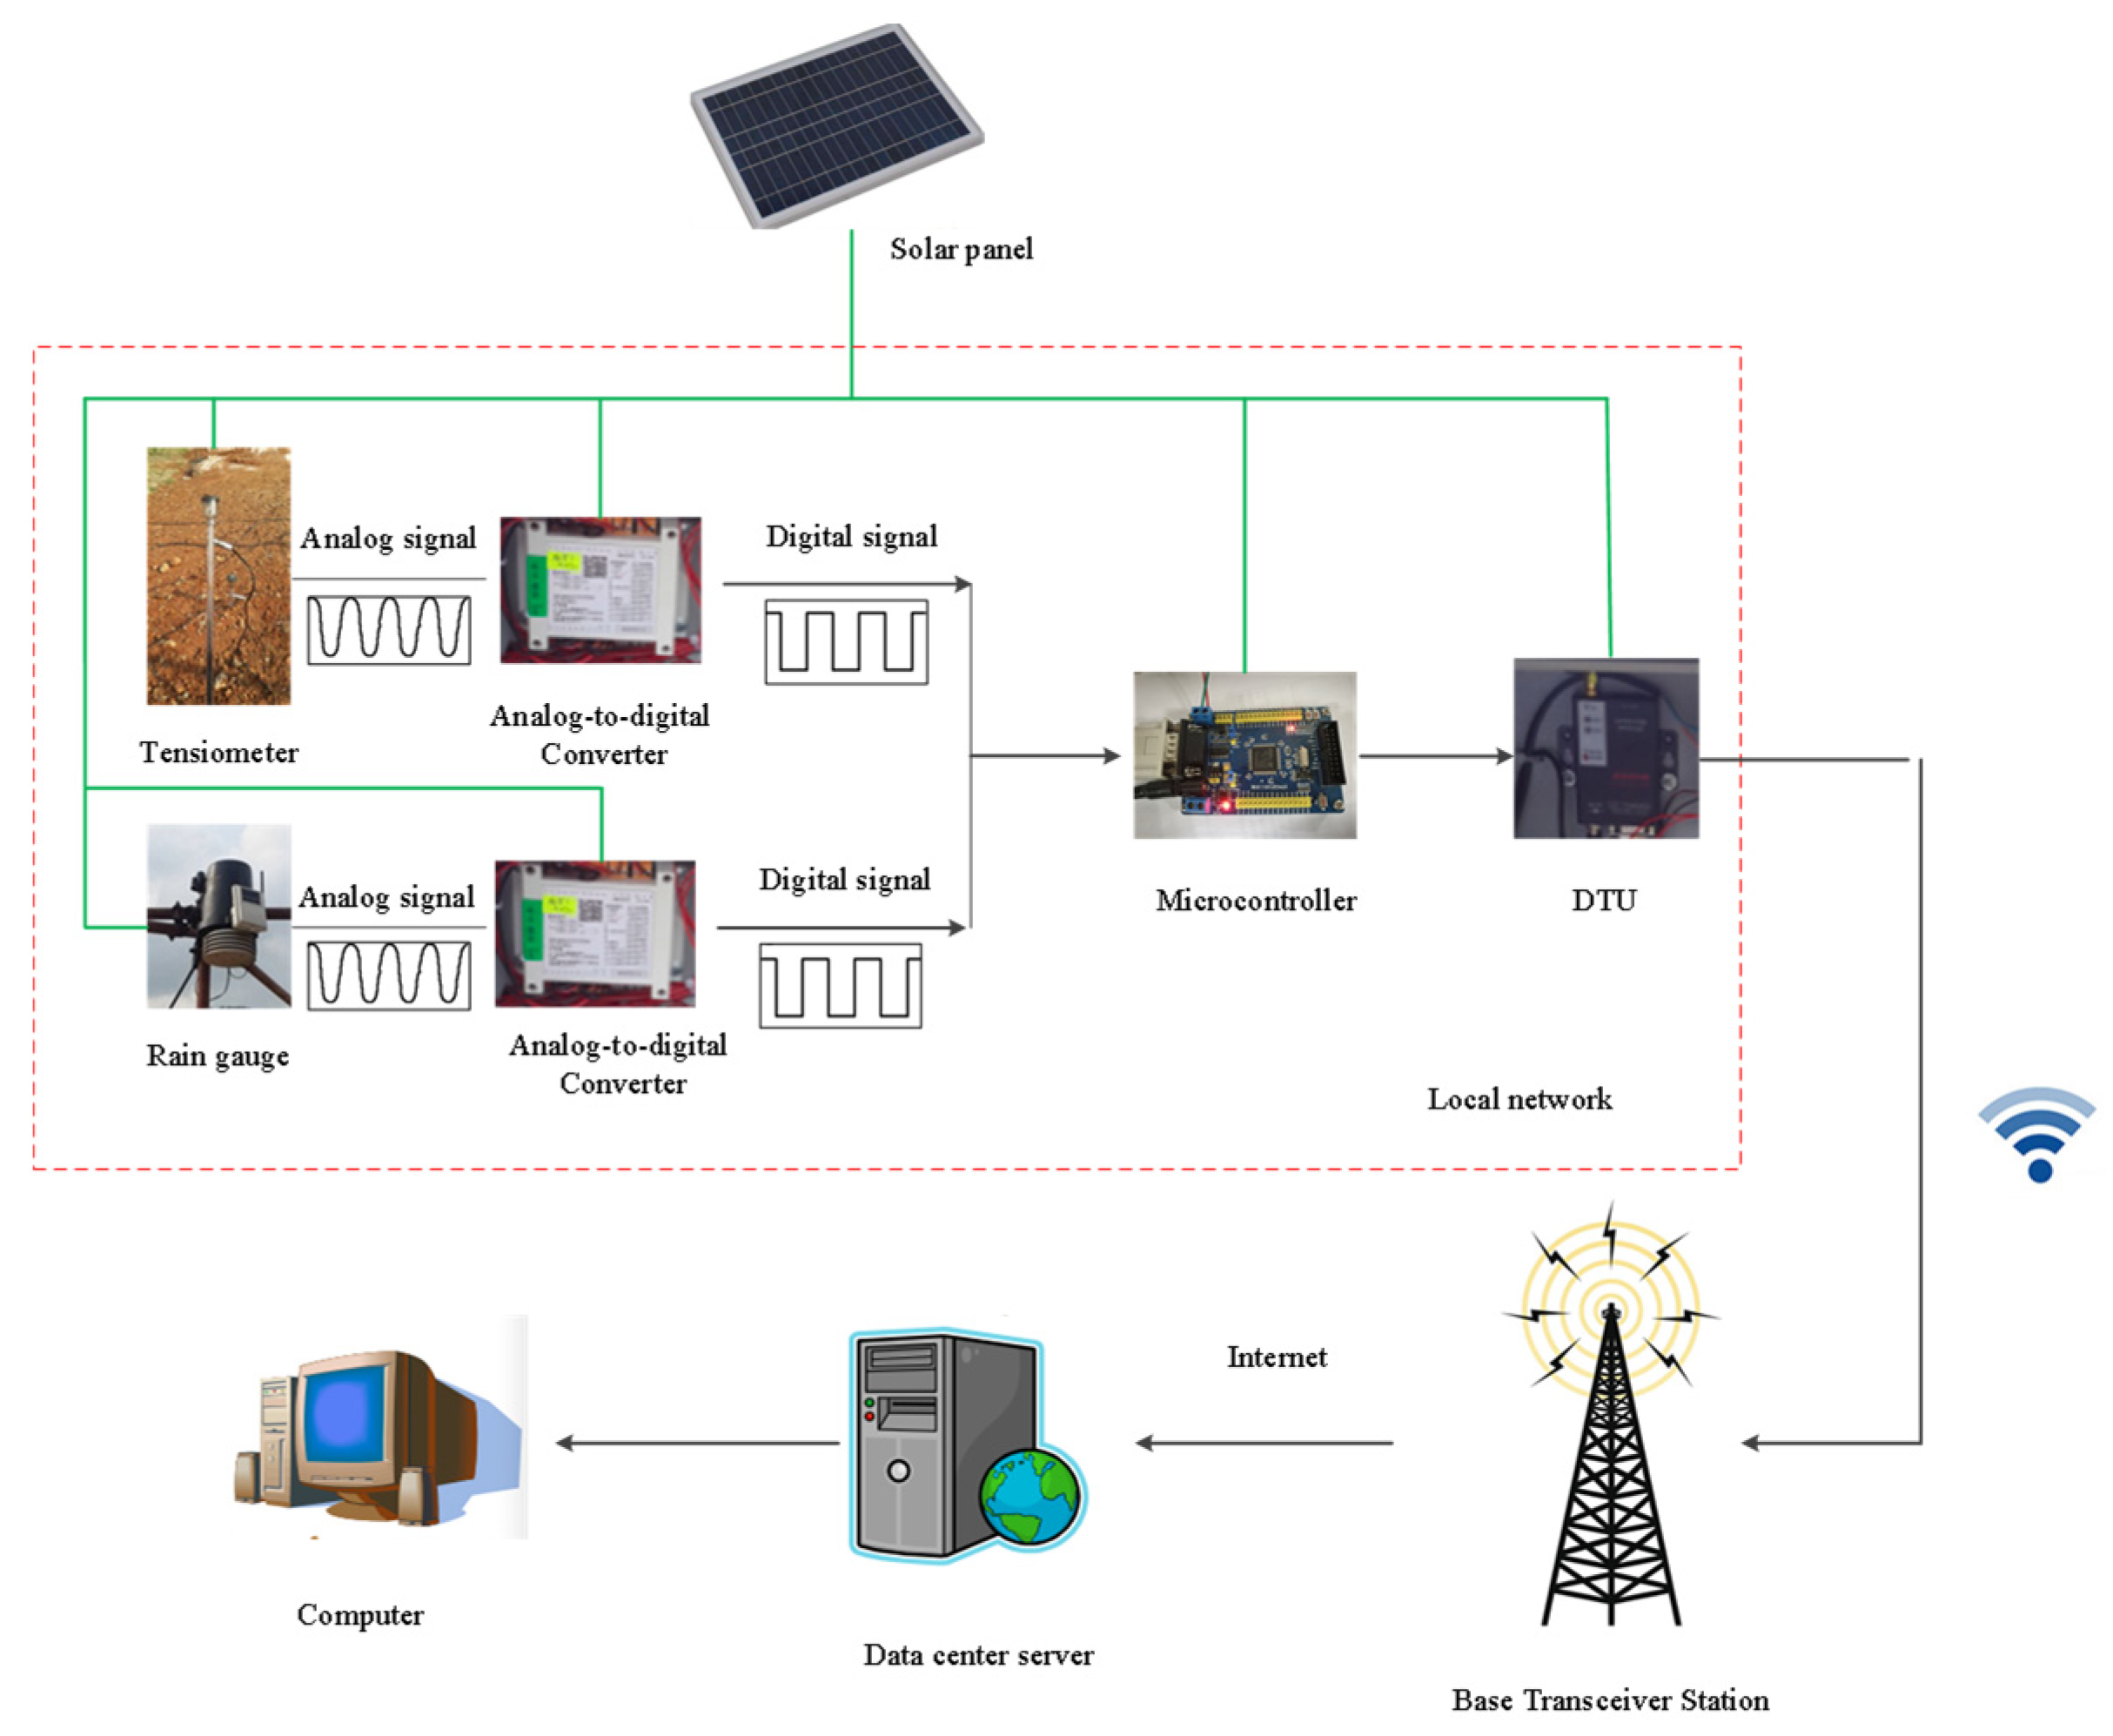
2.3. Instrumentation Program

2.3.1. Layout of Instruments

Figure 2 shows the layout of all instruments used in the field monitoring program. The instruments included a rain gauge for recording precipitation, jet-filled tensiometers with pore pressure transducer for negative pore water pressure, and drain gauges for percolation. The details for each instrument are summarized in Table 2.
Five tensiometers were installed only at the middle section of the cover system. These tensiometers were spaced 0.5 m apart. For each depth (i.e., 0.2 m, 0.4 m, 0.8 m, 1.2 m, and 1.6 m), there was one tensiometer to study water seepage characteristics in the three-layer cover system. The rain gauge was installed at the crest of the slope. These instruments were connected to a wireless network system for data collection. For detailed information on the Data Transmission System, please refer to the Appendix A.

2.3.2. Instruments, Calibrations, and Installing Methods

Rain gauge—The rain gauge is a freestanding receptacle for measuring precipitation. As water is collected, the tipping bucket fills to the point that it tips over, causing a momentary closure of a switch to incrementally measure rainfall accumulation. This action empties the bucket in preparation for additional measurement. Water discharged by the tipping bucket passes out of the rain gauge with no need for emptying. A simple device consisting of a peristaltic pump with transparent hose was used for calibration as presented by Vasvári [19].
Jet-filled tensiometer—Negative pore water pressure was measured by jet-filled tensiometer manufactured by the Soil moisture Equipment Corporation [20]. In order to increase the accuracy and automatically record data, a pore pressure transducer (PPT) was employed, taking the place of a vacuum gauge. Different from the traditional artificial reading for the vacuum gauge, the use of PPT could decrease the workload of reading and increase the recording frequency to meet the requirements for recording water infiltration during the process of rainfall. Before installation, all tensiometers with PPT were calibrated using the method proposed by Chen et al. [21] and Feng et al. [22]. The measurement accuracy of PPT was 0.1 kPa, about 5% of the accuracy of vacuum gauge.
Drain gauge—The drain gauge was a buried tank with an open top that collected any infiltrated water from the overlying soil mass. The diameter of the tank was designed as 1 m. In the tank, the soil mass was compacted with a water content to a dry density identical to the surrounding soil mass. At the bottom of the tank, a drain tube with porous stone was connected to carry water from the tank to a collection tank. The mass of the infiltrated water collected in the collection tank was measured by a balance. Then, the infiltration rate can be calculated by the mass changes of the collection tank over the measuring duration. The accuracy of mass measurements is 0.5 g. it has been widely adopted and confirmed to exhibit outstanding reliability and high precision [23].

3. Results

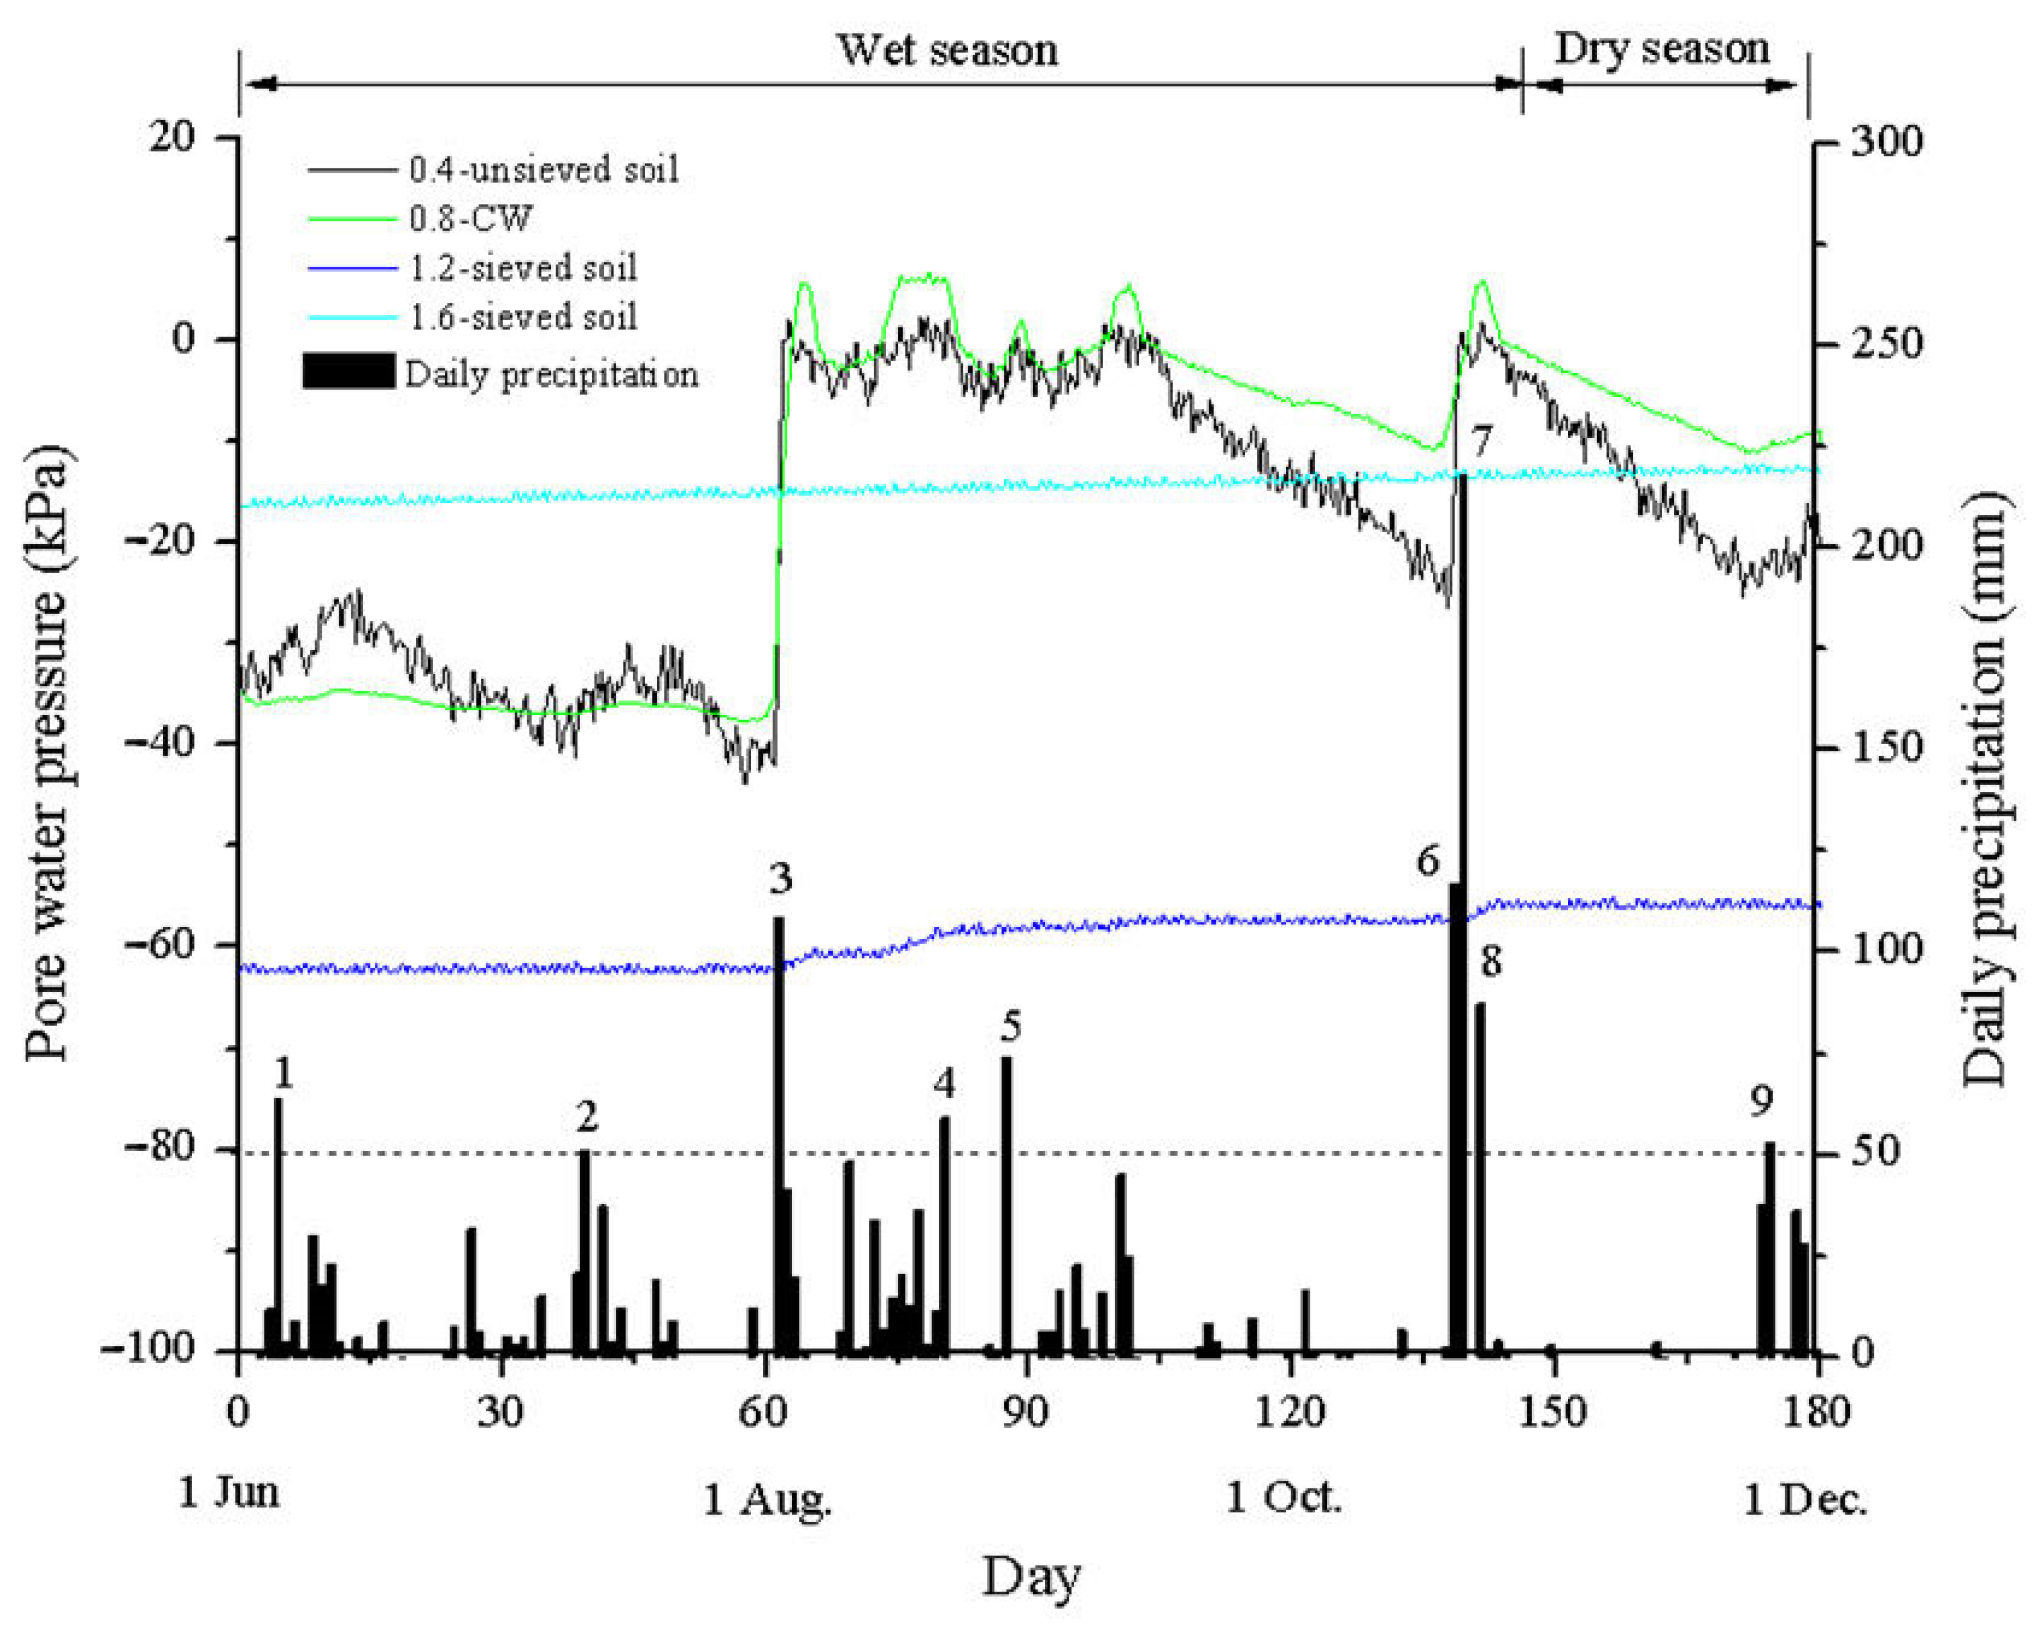
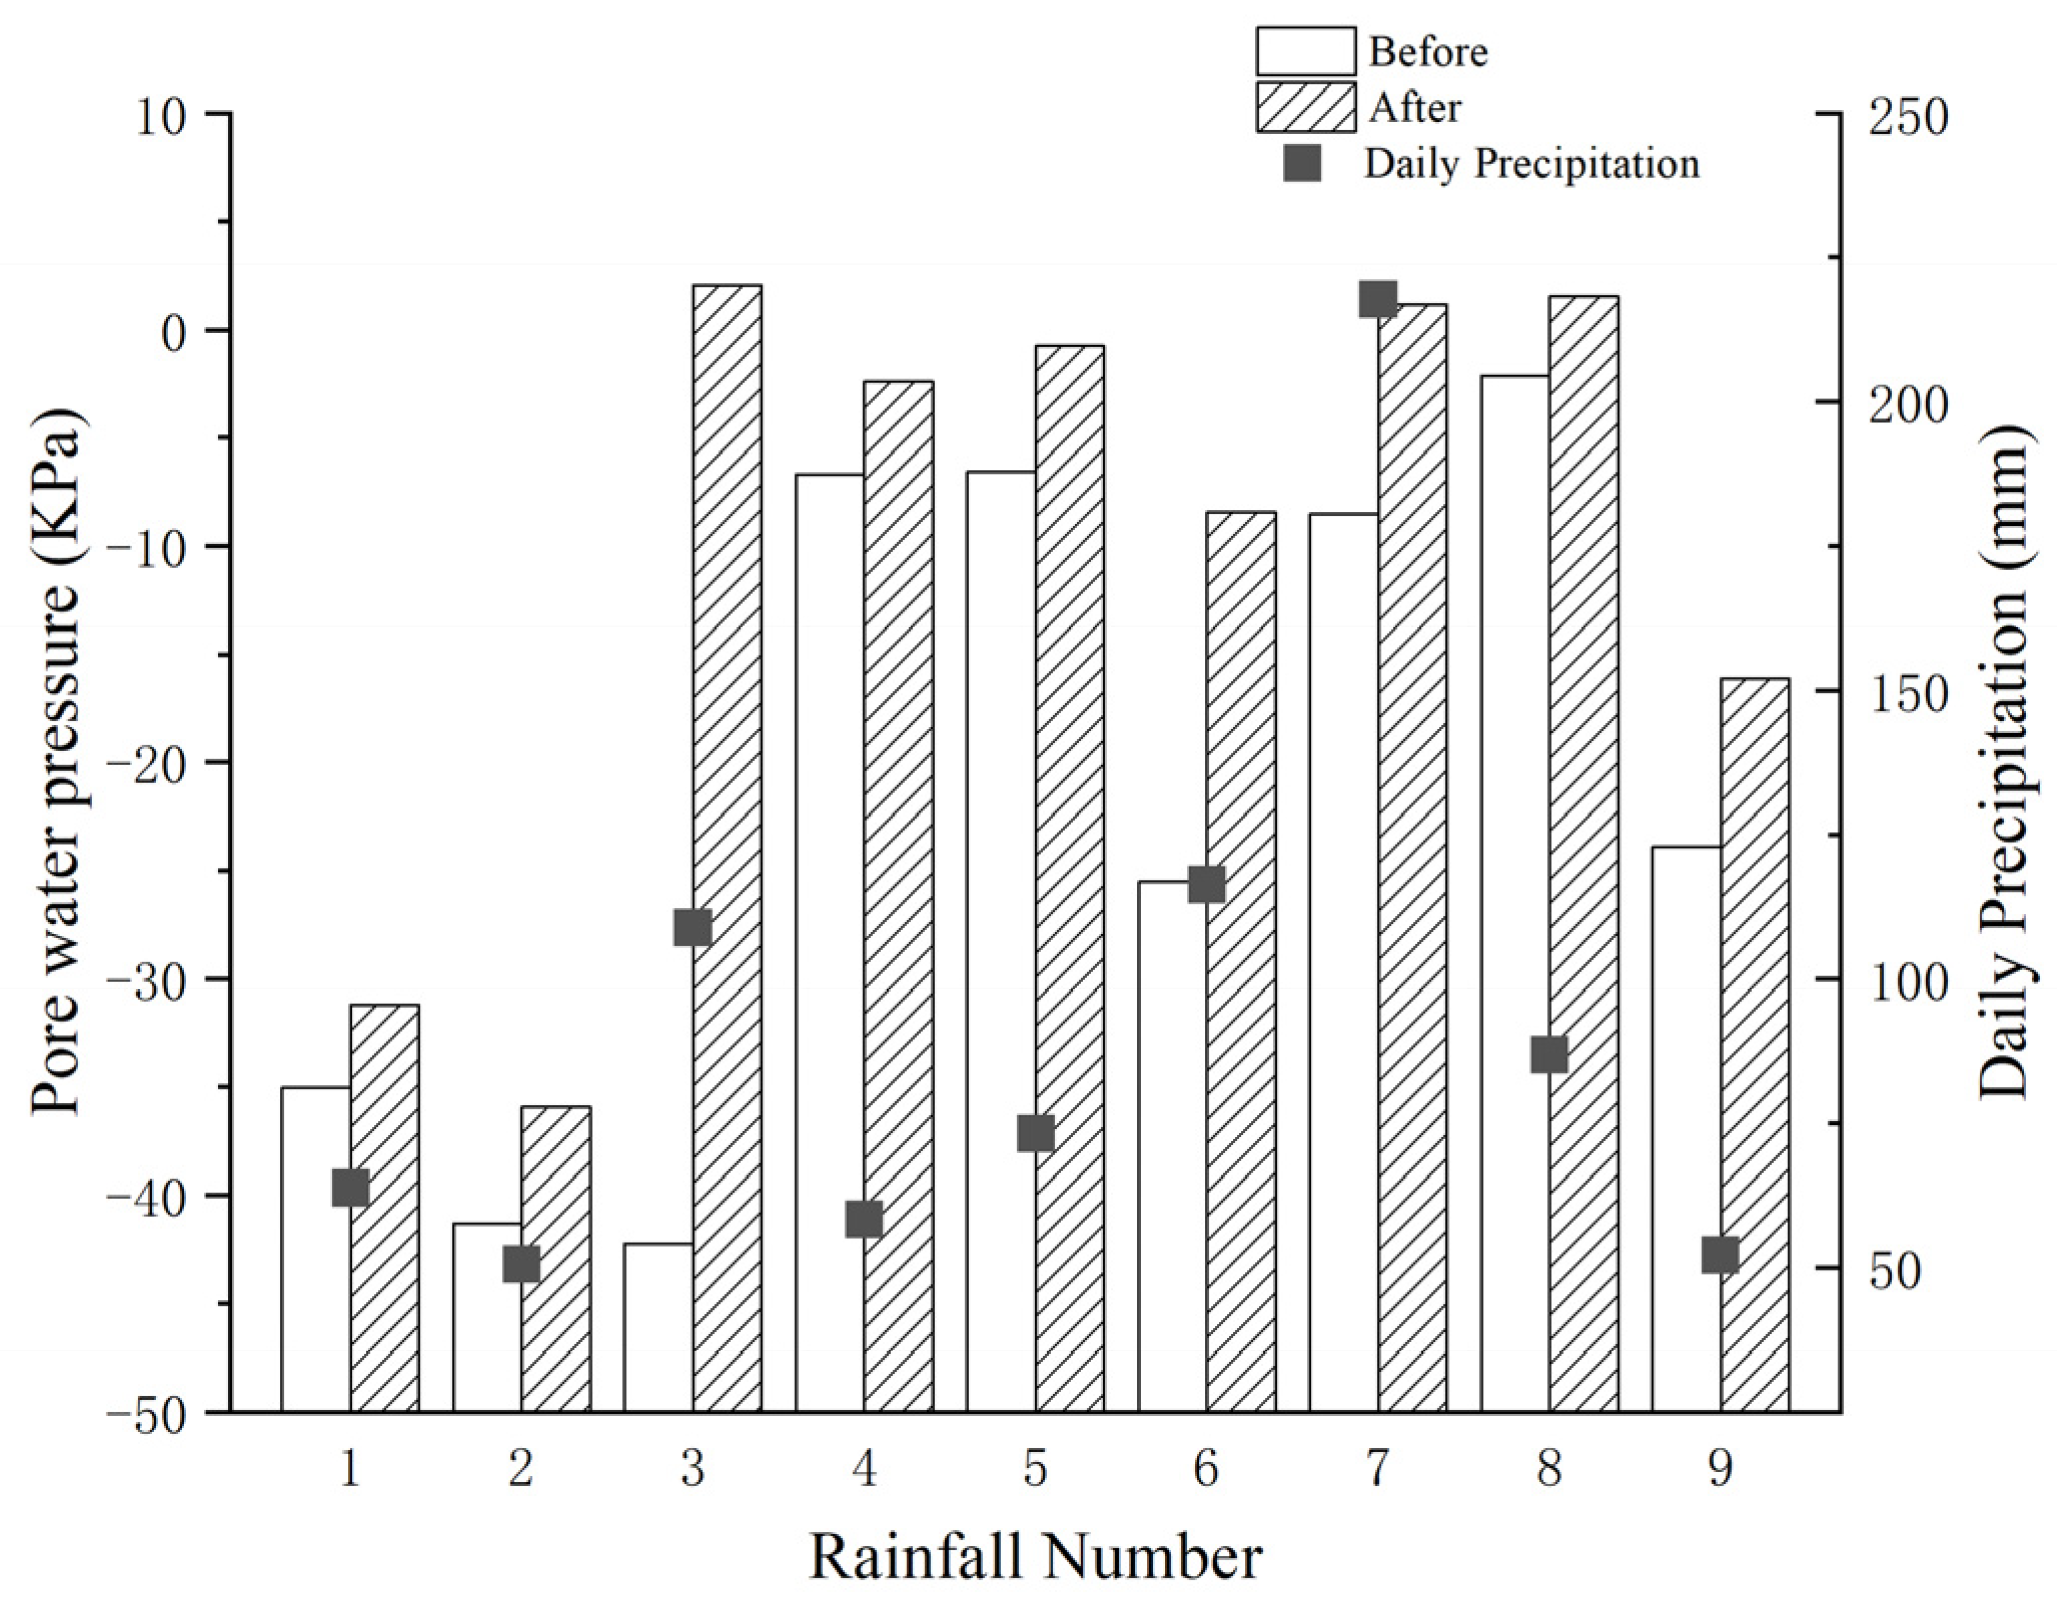
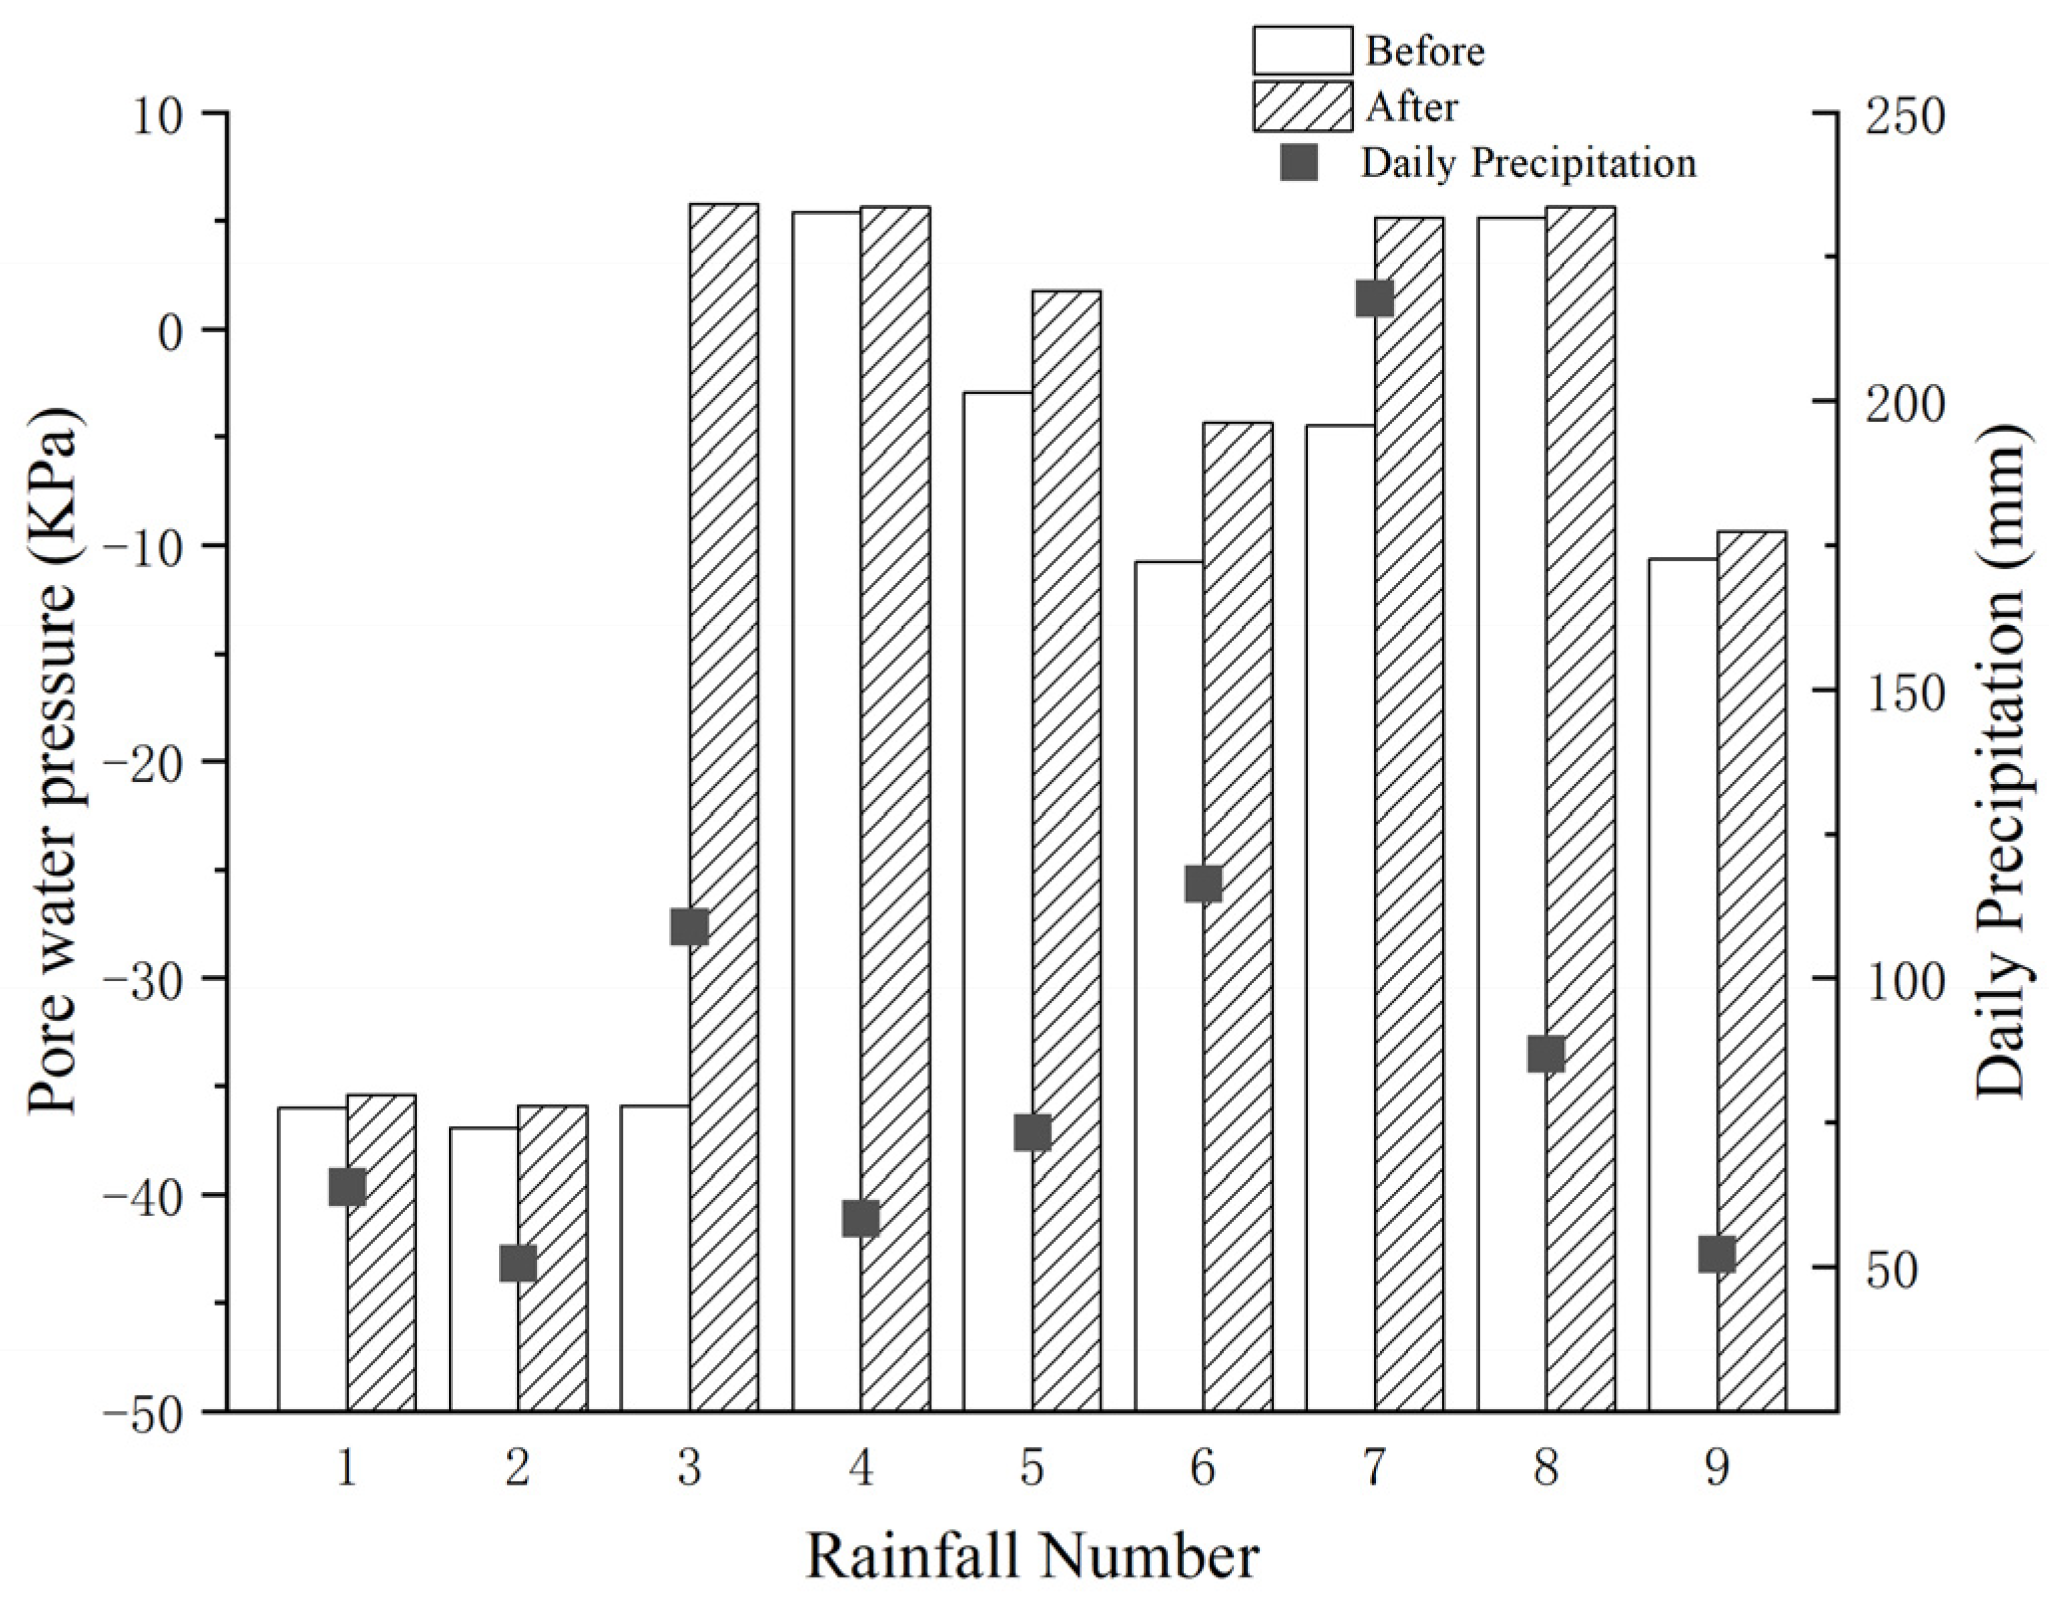
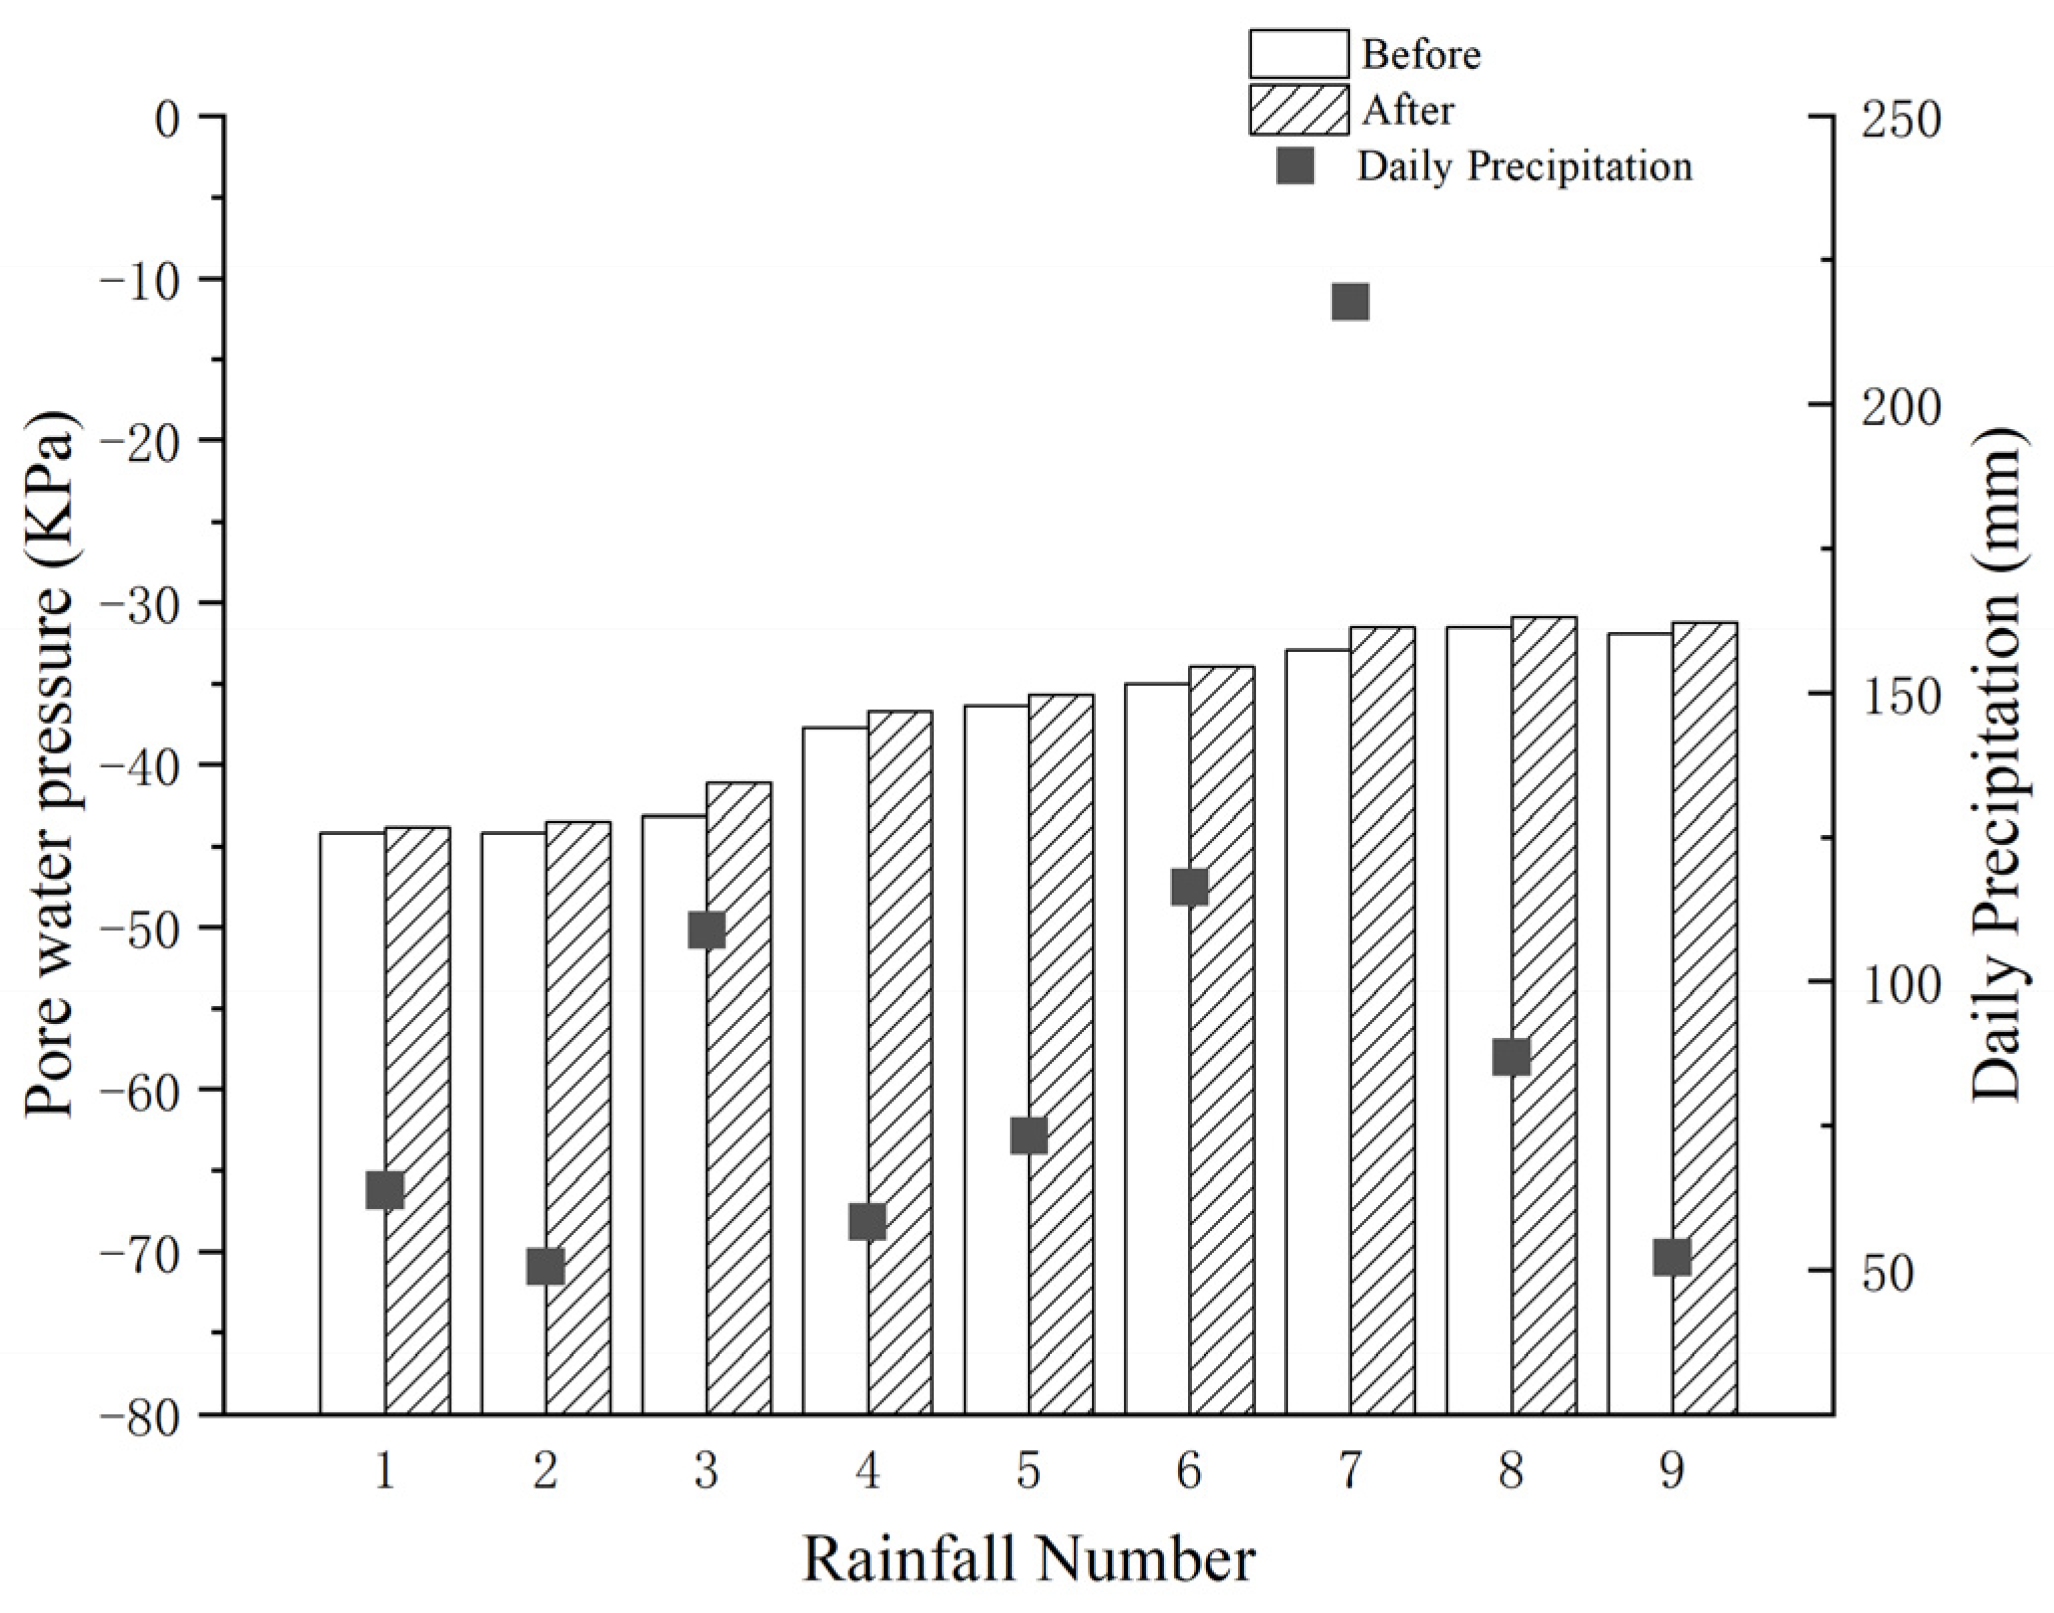
3.1. Pore Water Pressure

Figure 3 shows the record of daily precipitation from 1 June 2016 to 1 December 2016. After construction, the cover system was first subjected to a wet season lasting about five months and then a dry season lasting about 1 month. According to data from the Shenzhen Meteorological Bureau [24], the total precipitation in Shenzhen for the year 2016 was 2490.6 mm. The maximum and minimum annual rainfalls recorded over the past 50 years in Shenzhen were 2747.3 mm and 1269.7 mm, respectively, indicating that the 2016 precipitation level is representative of the typical climatic conditions in Shenzhen. During the wet season, the condition was a relatively high humidity and the total precipitation was 1551 mm, approximately 65% of Shenzhen’s annual rainfall. According to the meteorological report formulated by the Shenzhen Meteorological Bureau [24], the number of rainy days in the rainy season is 64, which accounts for about 45% of the total number of days in this period. To study the effectiveness of the cover system under natural rainfall conditions over a year, daily rainfall data were selected as the metric. It should be noted that eight heavy rainfalls (or rainstorms) whose daily precipitation (labeled in the figure) was higher than 50 mm [25] occurred during the wet season. The maximum daily precipitation was as large as 217.8 mm (No. 7). In the dry season, the soil humidity was low and the total precipitation was only 162.3 mm, with the heavy rainfall event No. 9 contributing 52.2 mm to this total. In the dry season, the number of no-rainfall days reached 23 and the number of the maximum continuous no-rainfall days was 11.
The development of pore water pressure at each depth was also included in Figure 3. Due to the evaporation, the cavitation in the tensiometer at a depth of 0.2 m occurred and its data were not shown in the figure. As expected, the pore water pressure increased in response to each rain at depths of 0.4 and 0.8 m, particularly subjected to nine heavy rainfalls. At a depth of 1.2 m, the increases in the pore water pressure were smaller than those at depths of 0.4 m and 0.8 m. It indicates that little water infiltrated into the screened layer at the bottom [2]. On the other hand, the pore water pressure in the upper two layers decreased in the no-rainfall days, e.g., from 15 September 2016 to 16 October 2016 and from 22 October 2016 to 21 November 2016. In the upper two layers, the pore water pressure in the top layer decreased more than in the layer beneath during periods without rainfall. At depths of 1.2 m, the pore water pressure was maintained as constant. It was due to the low permeability in the CW layer during drying and thus the water loss in the underlying screened soil layers was small. Similar changes in pore water pressure were obtained using numerical simulations by Ng et al. [26]. In this study, “breakthrough” refers to the movement of water through the top two soil layers under rainfall conditions. In this three-layer system, when a breakthrough occurs in the top two layers, the presence of a low-permeability soil layer impedes the infiltration of rainwater. A breakthrough is characterized by pore water pressure, correlating with field capacity. Correspondingly, pore water pressure shows increased sensitivity during rainfall events as soil approaches saturation [27]. It should be noted that before 2 August 2016, the total precipitation was 423 mm, approximately 21% of Shenzhen’s annual rainfall. However, the pore water pressure remained relatively low (ranging from −25 to −45 kPa) at the depths of 0.4 and 0.8 m. The breakthrough of the upper two layers did not occur. It may be because the maximum daily precipitation was 63.8 mm, smaller than the rain intensity when the breakthrough of the upper two layers occurred (e.g., No. 3 with 108.8 mm, No. 6 with 116.3 mm, and No. 7 with 217.8 mm). At a depth of 1.2 m, the pore water pressure remained at −62 kPa. After the breakthrough (e.g., No. 3 rainfall with 108.8 mm), the pore water pressure remained near zero until 15 September 2016. In this period, positive pore water pressure was observed in the upper two layers subjected to each heavy rainfall.
The Xiaping solid waste landfill generates landfill gas (LFG) primarily through the biodegradation of municipal solid waste (MSW). The gas composition predominantly consists of approximately 60% methane (CH4) and 40% carbon dioxide (CO2). The LFG production rate at this landfill is approximately 1.109 × 10³ m3/h, based on estimates [28]. At a depth of 1.6 m in the screened soil layer, the pore water pressure varied from −10 kPa to −22 kPa, unrelated to the daily precipitation. Its value was approximately 40 kPa larger than that at a depth of 1.2 m in the same soil layer. It may be induced by the high humidity of landfill gas under the cover [29]. In other words, wet landfill gas may be important for a minimum of landfill gas emission [26].
As previously mentioned, the heavy rainfalls were important for the breakthrough of the upper two layers. Figure 4, Figure 5 and Figure 6 summarize the change in pore water pressure subjected to the nine heavy rainfalls at a depth of 0.4 m (unscreened soil layer), 0.8 m (CW layer), and 1.2 m (screened soil layer). At a depth of 0.4 m, the maximum increase in the pore water pressure was 42.2 kPa subjected to a No. 3 heavy rainfall. However, the daily precipitation of No. 3 rain was 108.8 mm (not maximum). The daily precipitation seemed not to be the sole factor to the change in pore water pressure. It may be due to the hydraulic state of the cover system. After the rains of No. 3, 7, and 8, the unscreened soil was wet. In the wet state, it was easy to reach the maximum pore water pressure for the cover system. The maximum pore water pressure was approximately 2 kPa at a depth of 0.4 m. It should be noted that the maximum pore water pressure was smaller than its hydrostatic pressure (i.e., 4 kPa for the tensiometers at a depth of 0.4 m) by assuming that the cover system was saturated. It may be due to desiccation cracking near the top of the unscreened soil layer [5]. A similar change to pore water pressure also occurred at a depth of 0.8 m. The maximum pore water pressure of 5.5 kPa also occurred after No. 3 rain.
Different from the depths of 0.4 and 0.8 m, the increase in the pore water pressure at a depth of 1.2 m changed only slightly after each heavy rainfall. The wetter the CW layer, the larger the increase in the pore water pressure, for example, No. 3, 4, 5, and 8 rainfalls. The maximum increase in pore water pressure was 1 kPa. It may be because the wet CW layer increased the pore water pressure in the top boundary of the underlying screened soil layer.
The No. 3, 7, and 8 rainfall events, although of different intensities (108.8 mm, 217.8 mm, and 86.9 mm), all caused the soil to reach the maximum pore water pressure, which will be maintained regardless of the amount of rainfall. Except for these three rainfalls, Figure 7 shows the relationship between daily precipitation and the increase in pore water pressure. As expected, increases in the daily precipitation and increases in pore water pressure in each soil layer were observed. The deeper the tensiometer, the smaller the ratio between the increase in pore water pressure and daily precipitation. As water seeped from the unscreened soil layer into the CW layer, this ratio decreased by approximately 48% (from 0.1771 to 0.0918). It was due to the capillary effect formed by the upper two layers. Once water seeped from the CW layer into the screened soil layer, the ratio decreased by approximately 98% (from 0.0918 to 0.0018). It was due to the low permeability of the screened soil. It indicates that the screened soil layer served as the major function for preventing water seepage in the three-layer cover system.

3.2. Percolation

Figure 8 shows the cumulative percolation at three sections. It should be noted that the cumulative percolation in a 6-month duration (i.e., from June to December) was about 10 mm. It indicates that the performance of the three-layer capillary barrier cover system using local soils and CW in the field condition was satisfactory under a humid climate where an annual rainfall is about 2000 mm.
From 1 June to 1 December 2016, the cumulative percolation development underwent distinct phases under varying rainfall conditions. In the initial phase (1 June–2 August), the initial pore water pressures from top to bottom were approximately −30 kPa, −35 kPa, −62 kPa, and −18 kPa. Characterized by prolonged weak rainfall, despite a total rainfall of 423.2 mm, the pore water pressure in the top two layers remained low, ranging from −25 kPa to −45 kPa at the 0.4 m (unscreened soil layer), while the pore water pressures in the other layers remained largely unchanged. No breakthroughs were observed, resulting in a negligible increase in cumulative percolation. The subsequent phase (2 August–5 September) experienced a combination of short-duration, high-intensity rainfall and continued prolonged weak rainfall. During this phase, the initial pore water pressures from top to bottom were approximately −30 kPa, −35 kPa, −60 kPa, and −18 kPa. After experiencing short-duration, high-intensity rainfall, the pore water pressures in the unscreened soil layer and CW layer increased to around 0 kPa, followed by a prolonged period of weak rainfall where the top two layers’ pore water pressures remained persistently around zero. This condition led to breakthrough events, with a total rainfall of 602.2 mm and a significant cumulative percolation increase of approximately 8 mm. The final phase (5 September–1 December) was marked by a predominantly short-term intense rainfall, with initial pore water pressures from top to bottom of approximately −20 kPa, −10 kPa, −55 kPa, and −12 kPa. After experiencing a short-duration, high-intensity rainfall, the top two layers’ pore water pressures briefly rose to around 0 kPa, with most pore water pressure readings remaining negative. Despite the total rainfall in this phase being higher at 687.8 mm than in the previous phase, the additional cumulative percolation was around 2 mm, which is less than the 8 mm increase observed in the second phase.
Regarding the percolation process, the pore water pressure in the CW layer, which serves as the top boundary of the screened soil layer, plays a crucial role. Figure 9 shows the relationship between percolation rate and average pore water pressure in the CW layer. As expected, the percolation rate increased as the average pore water pressure in the CW layer increased. It indicates that even in the period without rainfall, water will percolate when the CW layer is wet. According to the design criterion recommended by the US EPA, the percolation rate should not exceed 30 mm/year [30]. Following the U.S. EPA’s ACAP guidelines, our study indicates that the CW layer’s pore water pressure should remain below −3 kPa in humid climates.

4. Discussion

This field test examined a three-layer capillary barrier cover system, employing unscreened soil (25.2% fines content) and screened soil (40.0% fines content), combined with construction waste (CW), under natural rainfall. The focus was on the dynamics of pore water pressure and percolation across varying depths and under different rainfall intensities.
Below 1.2 m, pore water pressure remained largely constant, mirroring the simulated trends by Ng et al., (2015) [26], indicating minimal water infiltration to the lower layer. In high-rainfall scenarios, pore water pressures in the upper layers were positive, aligning with Ng et al.’s indoor model findings [2]. A notable deviation from these models was the slight rise in pore water pressure below 1.2 m during ongoing rainfall, attributed to increased pressure within the CW layer due to extended precipitation. Analysis revealed a direct proportionality between the percolation rate in the CW layer and the average pore water pressure.
Figure 4 and Figure 8 reveal that prolonged weak rainfall, without breakthrough in the top two layers, results in minimal changes in cumulative percolation. However, breakthroughs occur when these layers transition from unsaturated to saturated states during short-duration, high-intensity rainfall, and continued weak rainfall prevents the layers from returning to an unsaturated state promptly, leading to percolation. Although short-duration, high-intensity rainfall was found to have a lesser impact on percolation, when followed by prolonged weak rainfall, it resulted in significant percolation. Despite the top two layers being in a saturated state, the CW layer, acting as a drainage layer, still effectively reduces percolation [4]. The effect of short-duration, high-intensity rainfall in elevating moisture levels substantially influences the landfill’s response to further rainfall events.
The high relative humidity in landfill gas might influence the pore water pressure in the screened soil at the bottom [29], which could in turn affect landfill gas emissions [26].
The measured data and parameters of our study, conducted on a three-layer capillary barrier landfill cover system using local soils and construction waste, are subject to various environmental uncertainties. For example, measurement errors during heavy rain due to the inertia of tipping buckets, and factors like evaporation, wind effects, surface runoff generation, and lateral drainage were not fully incorporated in our boundary conditions. These elements could affect the system’s performance under diverse environmental scenarios [31]. Future research should focus on quantifying these uncertainties to better predict system behavior.
Future research should focus on exploring the applicability of the cover system in different regions, particularly considering variations in soil and climate. Conducting long-term experiments under a variety of environmental conditions is crucial for understanding the system’s response to climate change and aging. This includes a detailed analysis of the aging characteristics of materials, such as studying the changes in physical and chemical properties over time of materials used in the cover system, and how these changes affect the overall performance of the system. Additionally, the long-term monitoring of structural integrity is essential, requiring assessment of how structural damages (such as cracks and collapses) develop over time and impact the system’s permeability and effectiveness.

5. Conclusions

A field test was carried out to study the performance of a three-layer cover system using local soils and construction waste. The detailed response of pore water pressure and percolation during rainfalls could be captured. Based on the measured results, the following conclusions may be drawn:
(1)
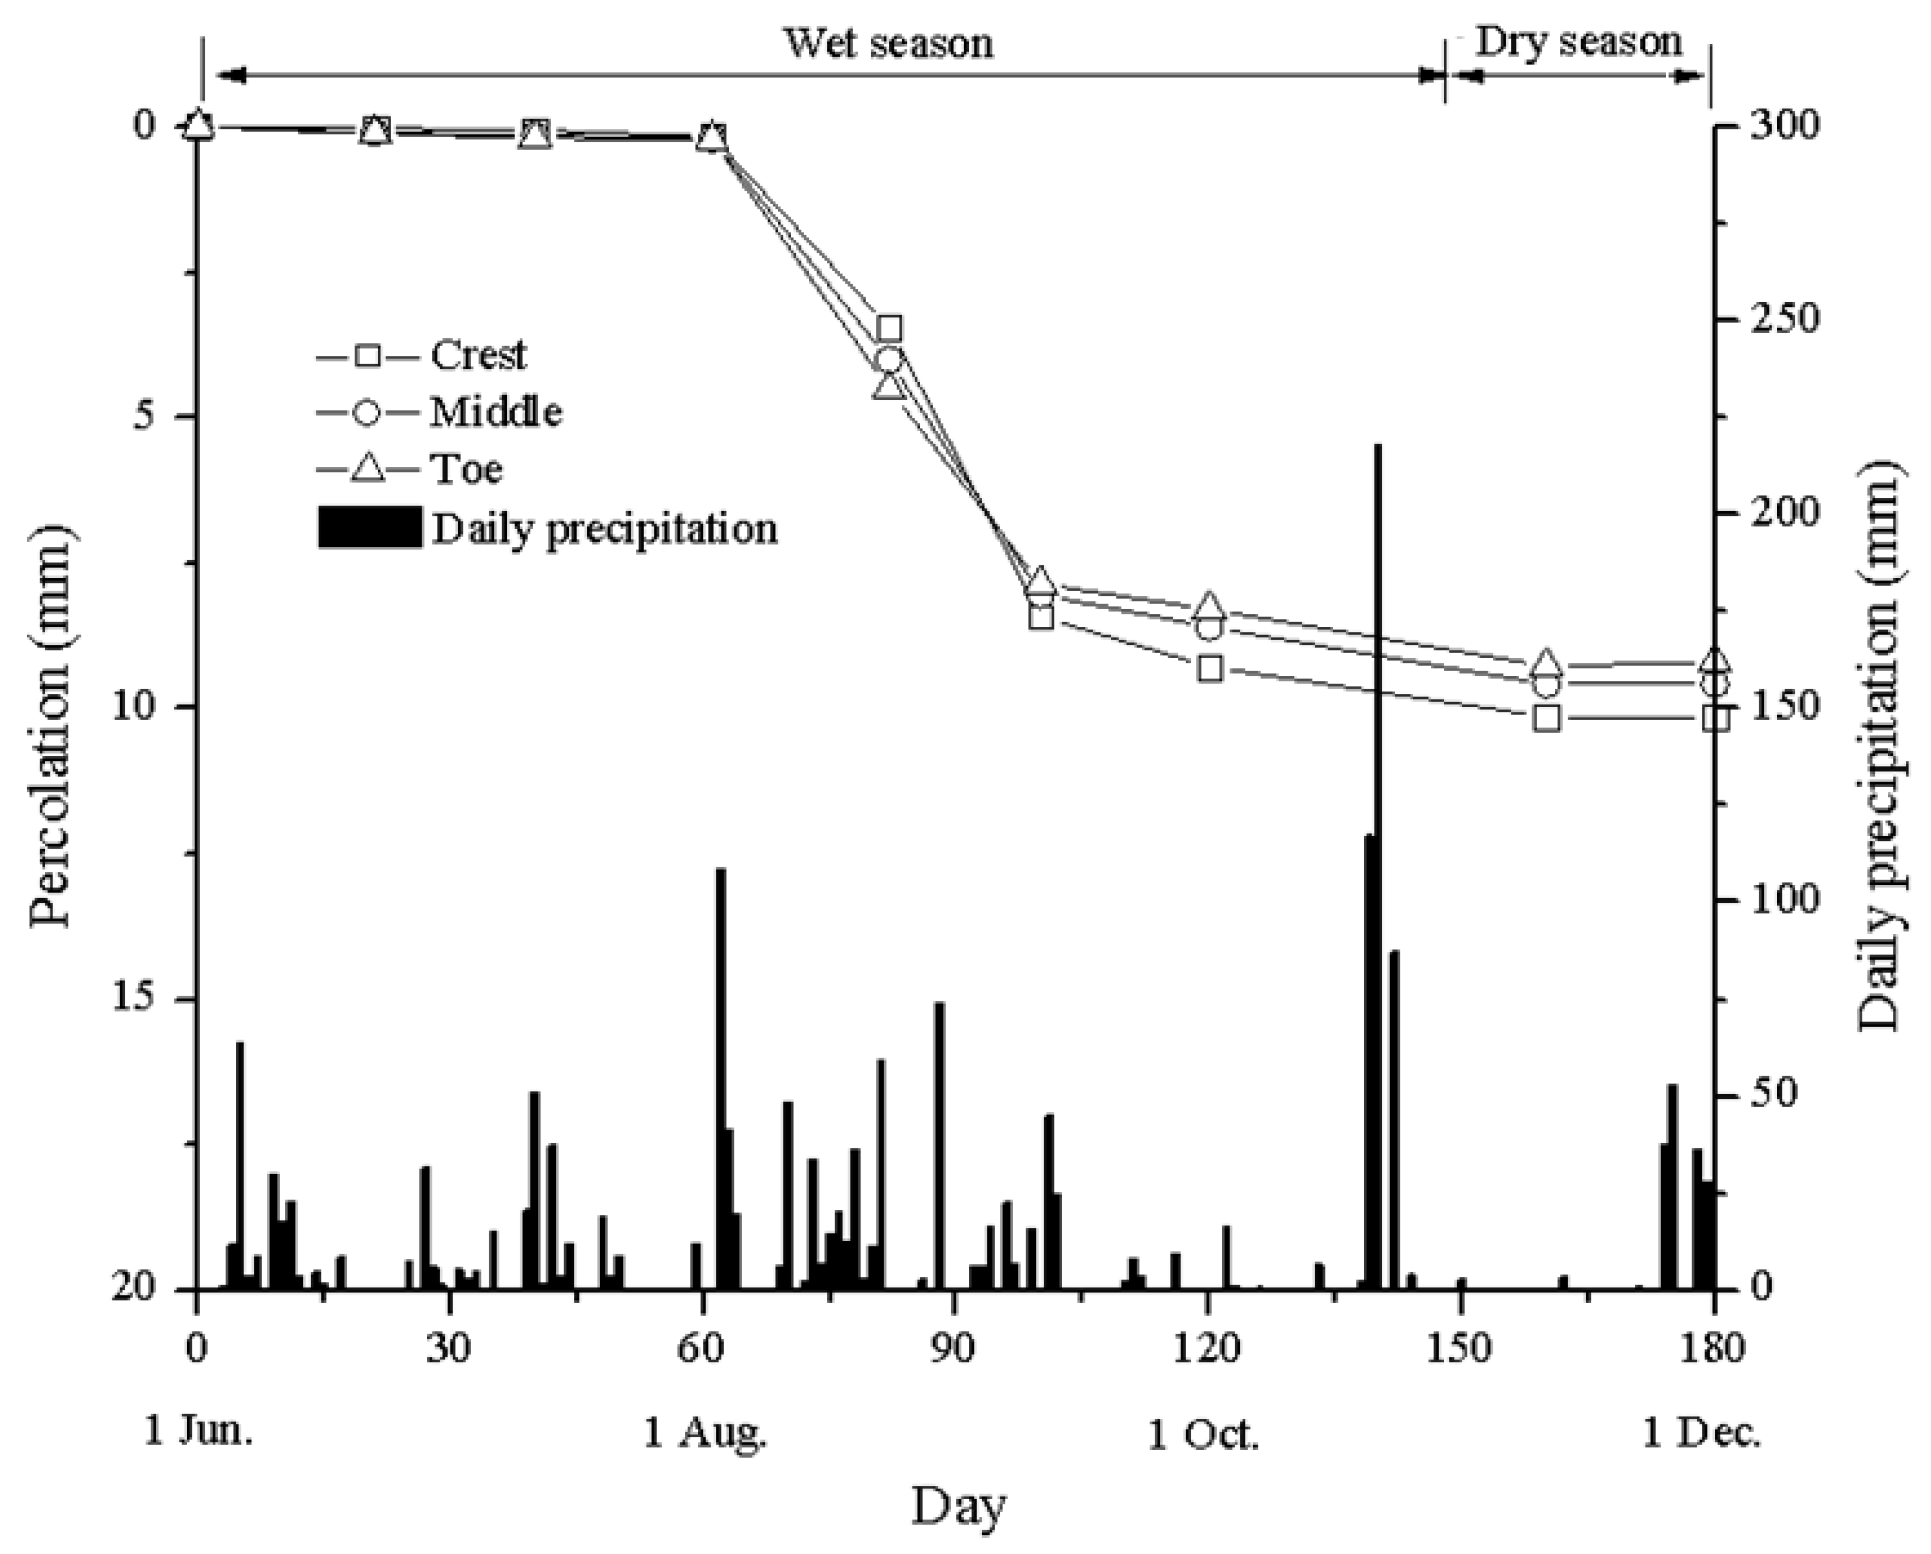
In the wet season, the breakthrough of the upper two layers did not occur until a No. 3 rainfall whose daily precipitation was 108.8 mm. After the breakthrough, the upper two layers were wet until 15 September 2016. In this period, the pore water pressure in the underlying screened soil layer increased slightly and thus a major percolation occurred.
(2)
The pore water pressure in the screened soil layer near the bottom was at a high level, and not correlated with daily precipitation. It may be due to the influence of the high humidity of the landfill gas.
(3)
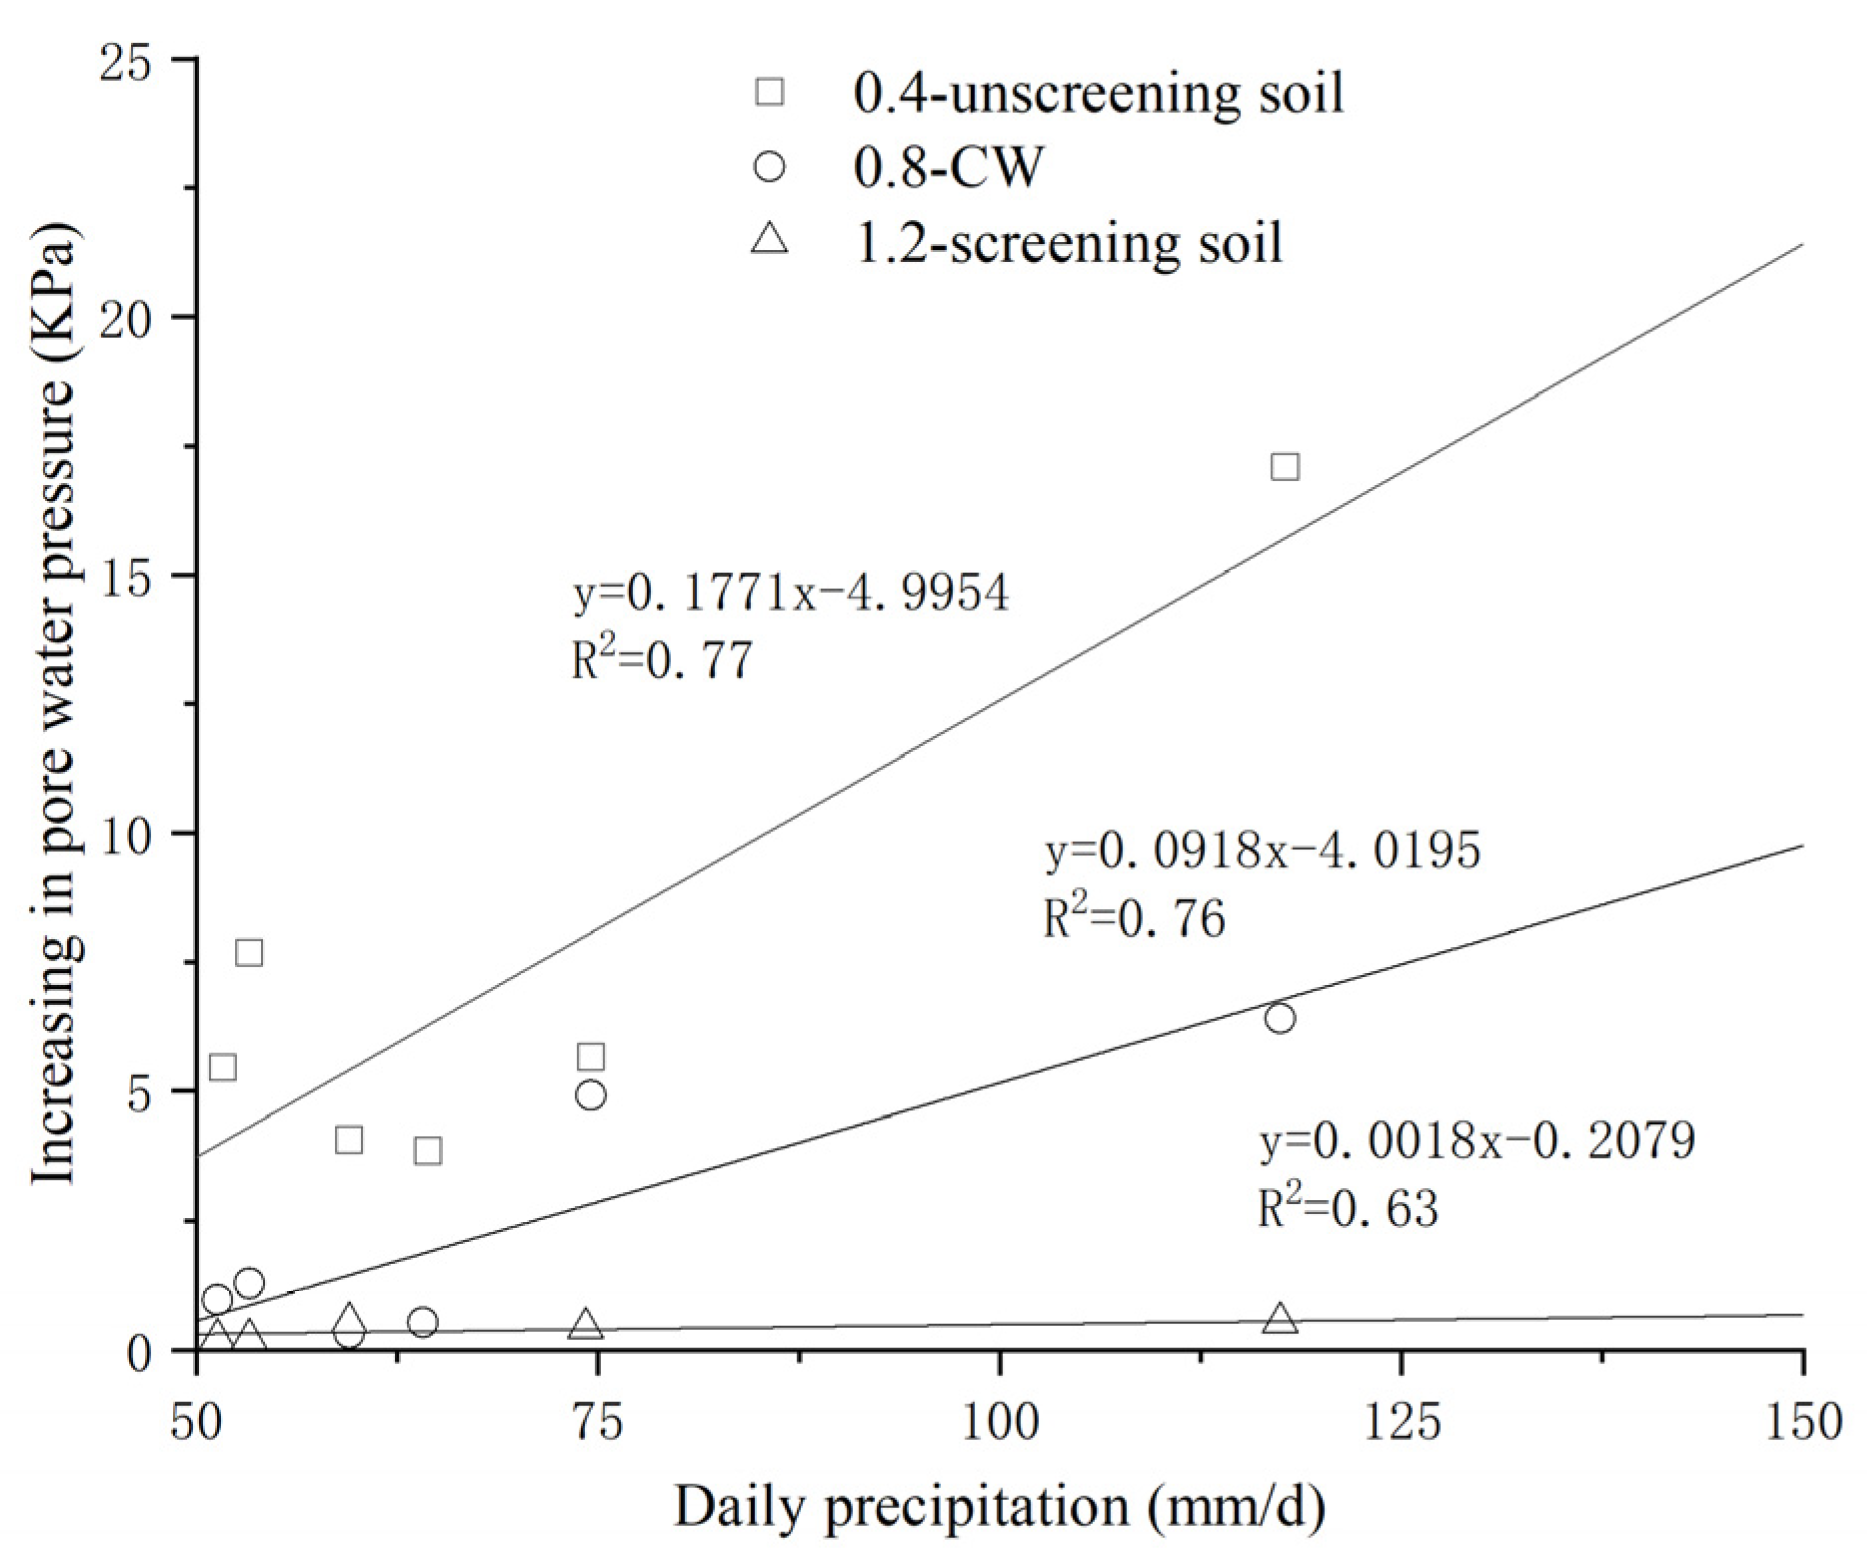
The increase in the pore water pressure in the upper two layers subjected to heavy rainfalls depended on not only the daily precipitation, but also the hydraulic state. Rainfall patterns significantly impact pore water pressure and percolation, with the combination of a short-duration, intense rainfall and prolonged weak rainfall notably extending the duration of saturated conditions and leading to significant percolation.
(4)
Over the six-month period from June to December, the cumulative percolation in the study measured approximately 10 mm. These results indicate that the three-layer capillary barrier cover system, which integrates local soils and construction waste (CW), demonstrated initial effectiveness under the field conditions of a humid climate observed during the study period.
(5)
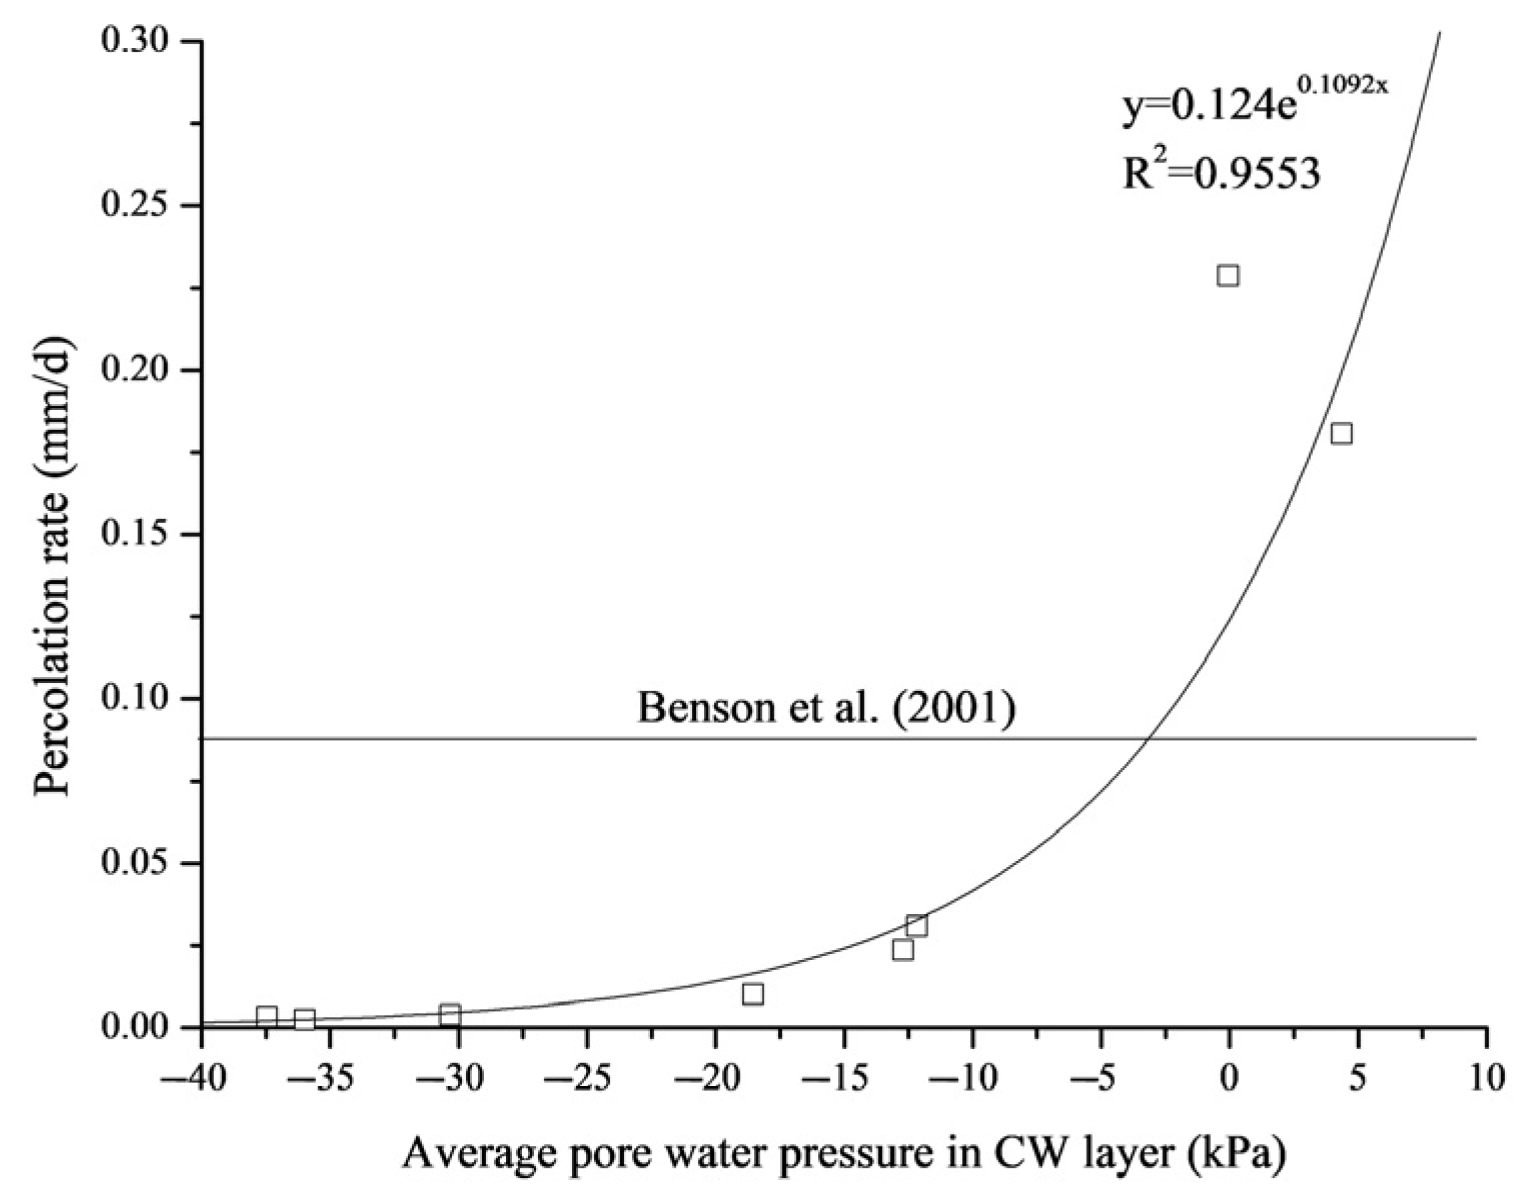
The percolation rate increased as the average pore water pressure in the CW layer increased. In order to satisfy the allowable percolation rate of 30 mm/year, the pore water pressure in the CW layer should be smaller than −3 kPa.

Author Contributions

Conceptualization: J.L. and Y.W.; methodology: J.L. and Y.W.; software: J.R.; validation: J.R. and Y.W.; formal analysis: J.L., J.R. and Y.W.; investigation: J.L.; resources: Y.W. and J.R.; data curation: J.L. and J.R.; writing—original draft preparation: J.L. and J.R.; writing—review and editing: Y.W.; visualization: J.R.; supervision: Y.W.; project administration: J.L.; funding acquisition: J.L. All authors have read and agreed to the published version of the manuscript.

Funding

This work was supported in part by the National Natural Science Foundation of China under Grant 52378337.

Data Availability Statement

The data presented in this study are available in this article.

Conflicts of Interest

The authors declare no conflicts of interest.

Appendix A

Data Transmission System:
Figure A1 shows the architecture of the network system. The network system consisted of several analog-to-digital converters, a microcontroller, a data terminal unit (DTU) based on GPRS, a base transceiver station, a data center server, a computer, a solar panel, and a battery.
Figure A1. Architecture of network system.
Buildings 14 00139 g0a1
In this architecture, the analog signal from each instrument was first sampled at regular time intervals in the analog-to-digital converter. Each sample was then evaluated in terms of a binary number and output in the form of the digital signal. This process may introduce errors, because a continuously varying analog signal was replaced by a discrete set of points at each time interval. In order to reduce the sample error to a level which could be accepted in field monitoring of the landfill cover system, the sample frequency was set as 1 Hz. The measuring range and accuracy of the analog-to-digital converter used in this study were ±60 mV and 0.01 mV, respectively.
All the analog-to-digital converters were connected to a microcontroller to establish a local area network. In this network, each analog-to-digital converter was a slave whereas the microcontroller was a master. The microcontroller would send a request message to all the analog-to-digital converters and receive reply messages from the analog-to-digital converters with the desired address. All the received messages would be first saved to a storage unit in the microcontroller. It should be noted that even if the GPRS was not good, the local area network still worked. In other words, the data from each instrument were recorded and saved to the storage units and were independent of the GPRS network. On the other hand, the microcontroller was also connected to a DTU to form another area GPRS network. Based on this GPRS network, the microcontroller would send the data saved in the storage unit to a data center server. It should be noted that the results are saved in the storage unit during the period of poor GPRS quality.
The DTU is a wireless device which is applied to transmit the digital signal through the GPRS networks. Therefore, the DTU needed a build-in subscriber identification module (SIM) card which was used to apply for GPRS services. One of the advantages of GPRS networks is that it supports the DTU to permanently stay online. Another is that the GPRS network has covered almost all the provinces, municipalities, and autonomous regions. Once the DTU powered on, DTU first connected to a mobile station nearby and kept this communication link online. Subsequently, the digital signal from the analog-to-digital converter was read out by the DTU and saved in its cache. Finally, the DTU encapsulated the information in the cache into an information packet and sent the packet to a fixed internet protocol (IP) address which was configured in advance.
The base transceiver station is a piece of equipment that operates in the 3.5 GHz band for fourth-generation (4 G) mobile communication between user equipment (e.g., DTU, mobile phone) and a network. Via the communication, the base transceiver station could receive the information packet from DTU and then send it to the external public internet.
The data center server maintained online with a fixed IP address and could receive the information packets from DTUs. Once receiving the packets, the server would extract the useful data from the information packets and save it on the hard drive. When the data were required to be analyzed, a computer could be used to connect the server and download the data.
The solar panel and battery could supply enough electric energy for all instruments which were installed in the landfill cover. The solar panel first absorbed the sunlight as a source of energy to generate electricity. This electricity was then stored in a battery. The battery was connected to all instruments and supplies enough electricity for them.

References

  1. Ng, C.W.W.; Liu, J.; Chen, R.; Lim, C.J. Numerical parametric study of an alternative three-layer capillary barrier cover system. Environ. Earth Sci. 2015, 74, 4419–4429. [Google Scholar] [CrossRef]
  2. Ng, C.W.; Liu, J.; Chen, R.; Xu, J. Physical and numerical modeling of an inclined three-layer (silt/gravelly sand/clay) capillary barrier cover system under extreme rainfall. Waste Manag. 2015, 38, 210–221. [Google Scholar] [CrossRef] [PubMed]
  3. Ng, C.W.; Coo, J.L.; Chen, Z.K.; Chen, R. Water Infiltration into a New Three-Layer Landfill Cover System. J. Environ. Eng. 2015, 142, 04016007. [Google Scholar] [CrossRef]
  4. Ng, C.W.W.; Guo, H.; Ni, J.; Chen, R.; Xue, Q.; Zhang, Y.; Feng, Y.; Chen, Z.; Feng, S.; Zhang, Q. Long-term field performance of non-vegetated and vegetated three-layer landfill cover systems using construction waste without geomembrane. Geotechnique 2022. ahead of the print. [Google Scholar] [CrossRef]
  5. Albrecht, B.A.; Benson, C.H. Effect of Desiccation on Compacted Natural Clays. J. Geotech. Geoenviron. Eng. 2001, 127, 67–75. [Google Scholar] [CrossRef]
  6. Barnswell, K.D.; Dwyer, D.F. Two-year performance by evapotranspiration covers for municipal solid waste landfills in northwest Ohio. Waste Manag. 2012, 32, 2336–2341. [Google Scholar] [CrossRef] [PubMed]
  7. Zhan, G.; Lattin, D.; Keller, J.; Milczarek, M. 20 Years of Evapotranspiration Cover Performance of the Leach Pads at Richmond Hill Mine. Mine Water Environ. 2019, 38, 402–409. [Google Scholar] [CrossRef]
  8. Rahardjo, H.; Santoso, V.A.; Leong, E.C.; Ng, Y.S.; Hua, C.J. Performance of an Instrumented Slope Covered by a Capillary Barrier System. J. Geotech. Geoenviron. Eng. 2012, 138, 481–490. [Google Scholar] [CrossRef]
  9. Zhan, L.T.; Li, G.Y.; Jiao, W.G.; Lan, J.W.; Chen, Y.M.; Shi, W. Performance of a compacted loess/gravel cover as a capillary barrier and landfill gas emissions controller in Northwest China. Sci. Total Environ. 2020, 718, 137195. [Google Scholar] [CrossRef]
  10. Shaikh, J.; Bordoloi, S.; Yamsani, S.K.; Sekharan, S.; Rakesh, R.R.; Sarmah, A.K. Long-term hydraulic performance of landfill cover system in extreme humid region: Field monitoring and numerical approach. Sci. Total Environ. 2019, 688, 409–423. [Google Scholar] [CrossRef]
  11. Yu, Y.; Zhao, X.; Shi, Y.; Ou, J. Design of a real-time overload monitoring system for bridges and roads based on structural response. Measurement 2013, 46, 345–352. [Google Scholar] [CrossRef]
  12. Kraimeche, B. Performance of a GSM/GPRS System Subject to Interference. In Proceedings of the 2005 5th International Conference on Information Communications & Signal Processing, Bangkok, Thailand, 6–9 December 2005; pp. 249–252. [Google Scholar] [CrossRef]
  13. ASTM D 422; Standard Test Methods for Particle-Size Analysis of Soils. ASTM International: West Conshohocken, PA, USA, 2007.
  14. ASTM D 4318; Standard Test Methods for Liquid Limit, Plastic Limit, and Plasticity Index of Soils. ASTM International: West Conshohocken, PA, USA, 2017.
  15. ASTM D 698; Standard Test Methods for Laboratory Compaction Characteristics of Soil Using Standard Effort [12,400 ft-lbf/ft3 (600 kN-m/m3)]. ASTM International: West Conshohocken, PA, USA, 2021.
  16. ASTM D 5084; Standard Test Methods for Measurement of Hydraulic Conductivity of Saturated Porous Materials Using a Flexible Wall Permeameter. ASTM International: West Conshohocken, PA, USA, 2016.
  17. Simion, I.M.; Fortuna, M.E.; Bonoli, A.; Gavrilescu, M. Comparing environmental impacts of natural inert and recycled construction and demolition waste processing using LCA. J. Environ. Eng. Landsc. Manag. 2013, 21, 273–287. [Google Scholar] [CrossRef]
  18. Chen, Z.; Feng, Q.; Yue, R.; Chen, Z.; Moselhi, O.; Soliman, A.; Hammad, A.; An, C. Construction, renovation, and demolition waste in landfill: A review of waste characteristics, environmental impacts, and mitigation measures. Environ. Sci. Pollut. Res. 2022, 29, 46509–46526. [Google Scholar] [CrossRef] [PubMed]
  19. Vasvári, V. Calibration of tipping bucket rain gauges in the Graz urban research area. Atmos. Res. 2005, 77, 18–28. [Google Scholar] [CrossRef]
  20. Soilmoisture. Model 2725A Jet Fill Tensiometer Operating Instructions; Soilmoisture Equipment Corp.: Santa Barbara, CA, USA, 1997. [Google Scholar]
  21. Chen, R.; Liu, J.; Ng, C.W.W.; Qiao, J. Development of a new assembled-type tensiometer. Rock Soil Mech. 2013, 34, 3028–3032. [Google Scholar] [CrossRef]
  22. Feng, W.Q.; Liu, Z.Y.; Tam, H.Y.; Yin, J.H. The pore water pressure sensor based on Sagnac interferometer with polarization-maintaining photonic crystal fiber for the geotechnical engineering. Measurement 2016, 90, 208–214. [Google Scholar] [CrossRef]
  23. Wang, L.; Liu, S.; Shen, C.; Lu, Y. Laboratory test and modelling of gas pressure under geomembrane subjected to the rise of groundwater in plain reservoirs. Geotext. Geomembr. 2020, 49, 81–96. [Google Scholar] [CrossRef]
  24. Shenzhen Statistics Bureau, NBS Survey Office in Shenzhen. Shenzhen Statistical Yearbook; China Statistics Press: Beijing, China, 2017. [Google Scholar]
  25. Wu, M.; Lam, H.; Li, K. Characterization and indexing of heavy rainstorms in Hong Kong. Meteorol. Appl. 2015, 22, 25–36. [Google Scholar] [CrossRef]
  26. Ng, C.W.; Liu, J.; Chen, R. Numerical Investigation on Gas Emission from Three Landfill Soil Covers under Dry Weather Conditions. Vadose Zone J. 2015, 14, vzj2014.12.0180. [Google Scholar] [CrossRef]
  27. Avzalshoev, Z.; Uchimura, T. An experimental approach to investigating Quasi-Saturation using Darcy’s Law. Sustainability 2023, 15, 10459. [Google Scholar] [CrossRef]
  28. Yang, J.; Ma, X.Q. The benefit of landfill gas power generation to the reduction of the greenhouse gas emission. Environ. Pollut. Control 2006, 28, 461–464. [Google Scholar]
  29. Piechota, G.; Hagmann, M.; Buczkowski, R. Removal and determination of trimethylsilanol from the landfill gas. Bioresour. Technol. 2012, 103, 16–20. [Google Scholar] [CrossRef] [PubMed]
  30. Benson, C.; Abichou, T.; Albright, W.; Gee, G.; Roesler, A. Field Evaluation of Alternative Earthen Final Covers. Int. J. Phytoremediat. 2001, 3, 105–127. [Google Scholar] [CrossRef]
  31. Baker, E.A.; Manenti, S.; Reali, A.; Sangalli, G.; Tamellini, L.; Todeschini, S. Combining noisy well data and expert knowledge in a Bayesian calibration of a flow model under uncertainties: An application to solute transport in the Ticino basin. arXiv 2022, arXiv:2210.17388. [Google Scholar] [CrossRef]
Figure 1. Overview of the field test site.
Buildings 14 00139 g001
Figure 2. Layout of instruments in the landfill cover.
Buildings 14 00139 g002
Figure 3. Changes of pore water pressure in the three-layer cover system at different soil depths under natural conditions.
Buildings 14 00139 g003
Figure 4. Change in pore water pressure subjected to heavy rainfalls at depth of 0.4 m in unscreened soil layer.
Buildings 14 00139 g004
Figure 5. Change in pore water pressure subjected to heavy rainfalls at depth of 0.8 m in CW layer.
Buildings 14 00139 g005
Figure 6. Change in pore water pressure subjected to heavy rainfalls at depth of 1.2 m in screened soil layer.
Buildings 14 00139 g006
Figure 7. Relationship between daily precipitation and increase in pore water pressure except No. 3, 7, and 8 rains.
Buildings 14 00139 g007
Figure 8. Development of percolation under daily precipitation condition.
Buildings 14 00139 g008
Figure 9. Relationship between percolation rate and average pore water pressure in CW layer [30].
Buildings 14 00139 g009
Table 1. Properties of local soils and construction waste used in the field test.
Soil TypeUnscreened SoilConstruction WasteScreened Soil
Unified soil classification systemSCGWSC
Liquid limit, LL (%)37/37
Plastic limit, PL (%)20/20
Grain size distributionD60 (mm)0.29820.10.165
D30 (mm)0.0918.90.032
D10 (mm)0.0062.30.003
Fine content (0.075 mm; %)25.2/40.0
Coefficient of uniformity, Cu49.68.755
Coefficient of curvature, Cc4.61.72.1
Maximum dry density, ρd (Mg/m3)1.861.891.82
Saturated coefficient of permeability, ks (m/s)5 × 10−7–9 × 10−76 × 10−2–1 × 10−11.0 × 10−8–3.0 × 10⁻⁸
Table 2. Summary of instruments.
No.MeasurementType of InstrumentQuantityMeasuring Range/Accuracy
1Pore water pressureJet-fill tensiometers5−90–100 kPa/0.1 kPa
2Pore pressure transducers5
3PercolationDrain gauge3No limit/0.1 mm
4PrecipitationRain gauge10–50 mm/min/0.2 mm/min
Disclaimer/Publisher’s Note: The statements, opinions and data contained in all publications are solely those of the individual author(s) and contributor(s) and not of MDPI and/or the editor(s). MDPI and/or the editor(s) disclaim responsibility for any injury to people or property resulting from any ideas, methods, instructions or products referred to in the content.

