Abstract
PDC (polycrystalline diamond compact) drill bits are widely employed for rock-breaking in many industries like underground engineering and building constructions. The cutter layout would directly affect the overall performance of the drill bits. Field applications show that the staggered cutter layout strategy of dual-cutter can increase the drilling efficiency of the PDC bit. In order to explore the rock breaking mechanism of this type of drill bit, a numerical model of a dual-cutter and rock breaking with damage evolution based on a hybrid finite and cohesive element method (FCEM) has been established in this work. The model is verified through Brazilian disk tests. The rock breaking processes of this type of bit have been analyzed, including crack initiation, propagation, and the formation of rock debris. Moreover, the effects of horizontal and vertical offset of the back cutter on the MSE (mechanical special energy) have been investigated. Results demonstrate that the dual-cutter can prominently reduce the MSE compared to a single-cutter. The vertical offset of the back cutter has a minor effect on the MSE, while the horizontal offset is of great significance on the MSE. On this basis, the relationships between the MSE and both the vertical and horizontal offset coefficients have been built based on the response surface methodology (RSM). Finally, an optimized layout solution, with optimal vertical and horizontal offset coefficients of 0.641 and 0.497, is determined via the Gray Wolf algorithm.
1. Introduction
Rock breaking with drilling bits exists in many applications like underground engineering, oil and gas exploration, mining processes, and civil engineering. PDC (polycrystalline diamond compact) is an extremely hard composite material made of diamond powder and cemented carbide substrate under high temperature and ultra-high pressure conditions. It combines the performance benefits of polycrystalline diamond and cemented carbide [1]. A PDC drill bit has many advantages like no moving parts, high drilling speed, and high cutting efficiency, and it has been broadly applied for rock breaking in numerous industries like oil and gas exploration and production, mining engineering, and geological engineering [2,3,4].
The rock-breaking efficiency is related to many parameters. Take the rock breaking in oil and gas exploration, for instance. The drilling efficiency for deep wells is mainly affected by low drilling rates and high energy consumption due to extreme temperature, high stress, and deep rock intense hardness when oil and gas exploration advances gradually to greater depths. The structure of the PDC drill bit is an essential factor that directly affects deep formation ROP (rate of penetration) [5,6], apart from formation characteristics and drilling parameters. In recent years, the shortcomings of conventional PDC bits caused by structures were made up by improving the material properties of PDC cutters [7,8]. However, optimizing the bit structure, particularly the cutter layout, is still a meaningful way to improve the integrated performance of the PDC drill bits.
The cutter layout of PDC bits directly affects their integrated performance, including mechanical drilling rate, wear rate, drilling stability, and maneuverability. A scientific and reasonable cutter layout can improve the efficiency of bit design, reduce the MSE (mechanical special energy), and enhance the rock breaking efficiency. To address this problem, in 2018, Halliburton Company introduced a different Stega cutter laying technology, the main feature of which is the staggered layout of front and back cutters, as shown in Figure 1 cited from [9]. Stega gear positioning technology makes full use of the bottom hole shape formed by the primary cutting structure so that the cutting track of the back cutter and the front cutter track partially overlap. This design can eliminate the load stress of the main cutting structure and ensure the meshing of the spare cutter, which can maximize the drilling efficiency. However, there are no related reports about the rock-breaking mechanism of this bit. Therefore, it is necessary to study the mechanism of this dual-cutter cutting in order to promote this technology.
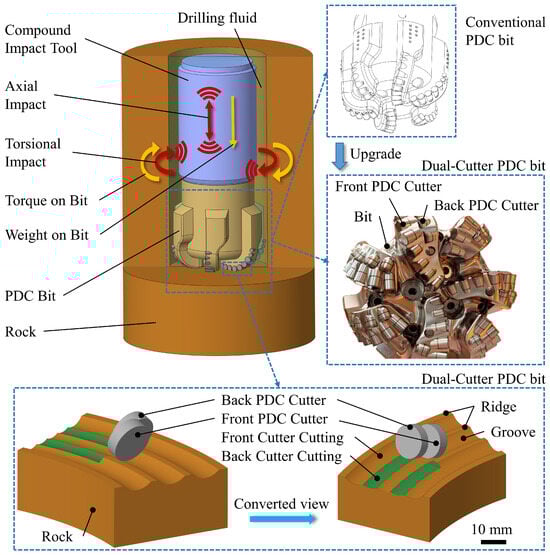
Figure 1.
Comparison between conventional PDC bit and dual-cutter PDC bit and the working schematic.
As the rock-breaking process of PDC is a highly complex physical process, generally, the rock-breaking mechanism cannot be fully explored by experimental research. Computer simulations were mainly employed to study the mechanisms of rock breaking [10,11]. Zeuch. D. H. et al. [12], D. V. Swenson et al. [13], and J. T. Finger et al. [14], respectively, studied the fragmentation of rock through single-cutter cutting experiments. Rojek et al. [15] used DEM to conduct two-dimensional and three-dimensional modeling of the rock fracture process. The numerical results of the fracture forces and their spectra from the simulation analysis perfectly agree with the experimental results, which shows that the DEM modeling method is reasonable for accurately modeling rock fractures. Loui [16] used a two-dimensional nonlinear finite element method to simulate progressive rock failure and used local stability factors to classify potential failure units. The model can effectively reproduce the crack propagation path and failure type (shear failure and partial tensile failure). However, the numerical peak crushing force is about higher than the corresponding experimental results. Jaime [17] improved a finite element program that uses a plastic damage model to predict rock crushing force and fracture characteristics, considering the influence of complex physical properties of the rock itself on accurate simulation of the cracking process, and confirmed that it is reasonable to use plastic damage model to simulate rock cracking. Menezes [18] adopted the explicit finite element method to simulate the crushing process by using the damage constitutive model. It was verified that the explicit finite element method could accurately predict the fracture force and reproduce the chip formation process by performing a series of rock fracture simulations at different fracture depths. Different studies also use numerical methods to study rock-breaking to reveal the rock-breaking mechanism and improve the rock-breaking ability of mechanical tools [19,20].
Even though many results have been obtained in previous works, there are few studies for the drill bit with the dual-cutter. Here, in this work, the drilling process of the dual-cutters is focused. A three-dimensional numerical model of rock breaking is created utilizing the hybrid finite and cohesive element method (FCEM) in order to simulate the rock crushing process correctly. The experimental and numerical data from the Brazilian disc test are compared and examined, and the model is improved and tested. The following issues are investigated using the validated numerical model: (a) Analysis rock fracture and cuttings formation in the dual-cutter rock breaking process, including fracture region, crack propagation path and cuttings morphology; (b) The effect of horizontal and vertical offset on rock breaking efficiency was evaluated by MSE; (c) The response surface method and Gray Wolf algorithm are used to optimize the horizontal and vertical offset distance of the dual-cutter and find an optimal or proper offset.
The rest of this article is arranged as follows. Section 2 describes the employed numerical model, including the controlling equations, geometry model, and simulation conditions. Section 3 demonstrates the results of cutting mechanisms and the analysis for relative distance between the dual-cutters. Conclusions of this study are drawn in Section 4.
2. Model Description
The research focuses on the cutting mechanism of dual-cutters, particularly in relation to the process of breaking rocks. In order to construct the simulation model, certain assumptions have been made:
- (1)
- The wear and deformation of the bit are not taken into consideration since its strength and hardness surpass that of rock. Therefore, the bit is treated as a rigid body during modeling.
- (2)
- The influence of failed rock elements is disregarded, whereby element failure refers to their removal from the system.
- (3)
- The pressure exerted by liquids on rocks remains constant, while any impact caused by fluid jets on rocks is not accounted for.
- (4)
- The effects of rock reaction forces located far from the cutting area are not considered in this study.
2.1. Governing Equations
2.1.1. Explicit Dynamics Calculation for Finite Elements
During finite element analysis (FEA), a computational domain could be discretized into a certain amount of elements. For the nonlinear simulation processes, such as rock impact breaking, the explicit dynamic can effectively avoid the non-convergence of the calculation. The calculating process is described as follows [21,22]. The first step is to establish the dynamic equilibrium equation, which is given by
where M is the mass matrix of the node, is the acceleration of the node, P is the external force exerted, and T is the internal force of the element. Then, the second step is to explicitly integrate the time by calculating:
where is the velocity of the node, is the time increment. In the third step, according to the strain rate , calculate the element strain increment , and calculate the stress according to the constitutive relation:
The calculation would be continually repeated until the results of all elements are stabilized.
2.1.2. Contact Mode of Drilling Bit and Rock
The nonlinear contact between the cutter and rock during the crushing process is primarily induced by the alteration of the contact surface resulting from the elimination of the rock failure element. Suppose that the contact system occupies the space domain at time t is , and the volume force, boundary stress, and Cauchy internal stress acting on the contact system are b, q, , and . The following equation can be used to represent the contact problem [23]:
In the given Equation (5), represents the stress boundary; denotes the contact boundary; e signifies the virtual strain; corresponds to density; and a stands for acceleration.
The spatial domain is discretized using the finite element method, and a virtual displacement field is incorporated, resulting in:
In the above Equation (6), m represents the mass matrix; denotes the acceleration vector; t stands for time; p symbolizes the external force vector; c encompasses both contact force and friction vector; f signifies the internal stress vector; u corresponds to the displacement; is the coefficient related to the contact surface; relates to the coefficient associated with the contact surface.
2.1.3. Rock Constitutive Model and Failure Criterion
A suitable material constitutive model plays a decisive role in the accuracy of numerical simulation. Drucker–Prager model is sufficiently accurate to simulate rock crushing [24,25]. The Drucker–Prager model can be expressed by the following equation:
where is the first invariant of stress, is the second invariant of stress, and K is the internal friction angle and rock bond force, , , , K, is represented as follows:
In the above equations, , , is the principal stress, is the internal friction angle.
The equivalent plastic strain criterion is used to judge the failure state of the rock element, which is given by
where, means equivalent plastic strain, means equivalent plastic strain when rock completely fails. When the equivalent plastic strain value is greater than or equal to , the rock element will be deleted.
2.1.4. Cohesive Elements with Damage
The cohesive element model in ABAQUS 2020 software uses the tractor-separation criterion to describe the mechanical behavior [26]. Initially, the cohesive element can be considered as linear elastic material, and when the stress exceeds the damage threshold, it enters the damage stage, and the mechanical behavior of the damaged element is defined by the damage evolution criterion. The initial linear elastic behavior of the cohesive element is defined by the elastic constitutive matrix [27,28]. The equation is as follows:
Here, t symbolizes the nominal traction stress vector, which can be decomposed into three orthogonal components: , , and in space problems. , and means nominal strain components. , , and means separation distances; is the initial thickness of the cohesive element.
In the field of damage mechanics, damage factor D is usually used to represent the overall damage, reflecting the comprehensive impact of all action conditions on the damage. The value of D ranges from 0 to 1, and it equals 0 when there is no damage and 1 when there is complete damage. The nominal stress of the tractor-separation model will change due to material damage, which is described by the following equation.
In a similar manner, the tensile and shear stiffness can be articulated as:
where , , , are, respectively, the normal, relative shear, relative shear, and effective traction; , , and are the relative normal, relative shear, relative shear, and effective displacements when damage initiates; , , and are the pure normal, pure shear, pure shear, and effective displacements.
To delineate the damage progression of a crack under a blend of normal and shear deformation across the crack surface, introduce an effective displacement as follows:
Here, is effective displacement, is the Macaulay bracket; equals when exceeds zero, otherwise equals zero. The equation for D is as follows:
Here, represents the maximum pure displacement. In addition to the damage evolution expression stated in Equation (21), it is necessary to incorporate a law that describes the initiation of stiffness degradation. In this study, we adopt a quadratic normal stress criterion, where damage is deemed to initiate when a quadratic interaction function involving the ratios of normal stresses reaches unity. This criterion can be expressed as follows:
2.1.5. Evaluation Model of Breaking Efficiency
Mechanical special energy (MSE) for rock-breaking pertains to the energy consumption per unit volume during the process of breaking rocks. It serves as a crucial metric in determining rock-breaking efficiency, which holds significant importance in efficiency calculations [29,30]. The initial rock-breaking specific work calculation formula [31,32] is:
Based on this premise, the MSE formula derived for the dual-cutter (combined MSE) is improved as follows:
where is the work by cutter, is the bit cutting area, is the cutting force, is the cutter displacement. is the cutting area. and are the front cutter torque and the back cutter torque. and are the front cutter rotation radius and the back cutter rotation radius, respectively. and are the front cutting area and rear cutting area.
2.2. Geometry Model
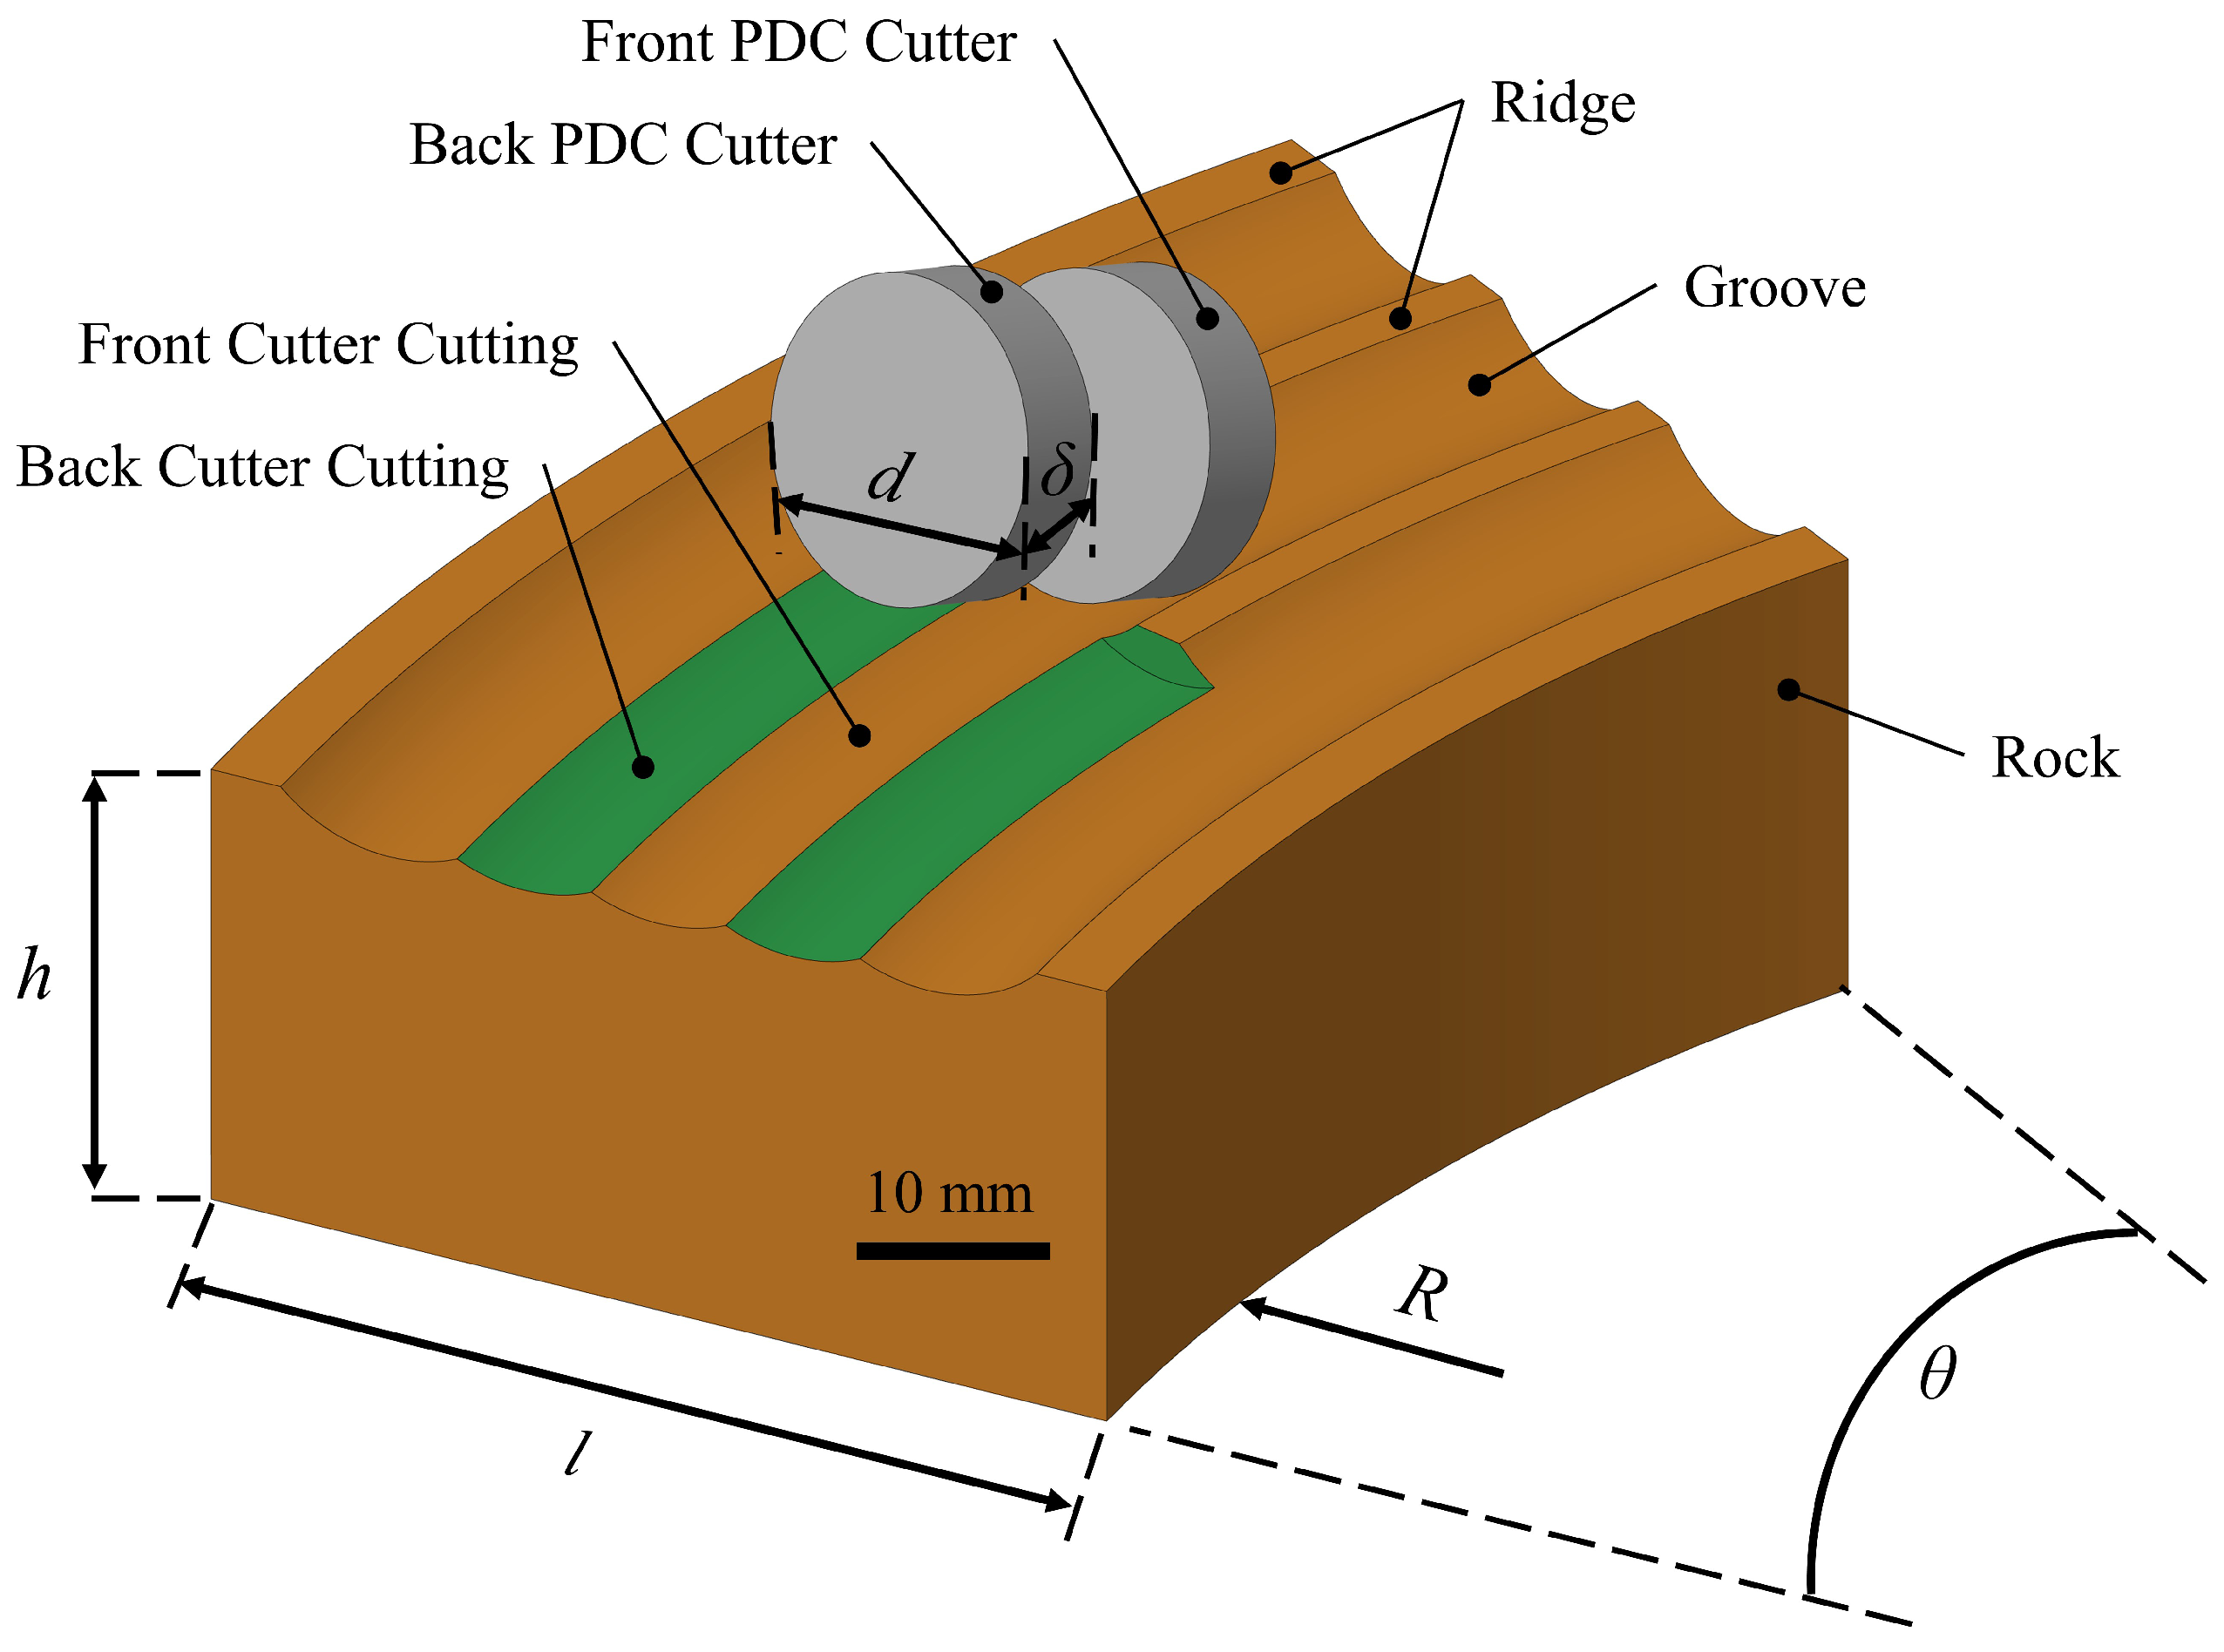
The simulations in the present work adopt the explicit dynamics module in the ABAQUS R2020 software package. The hardware environment contains dual Xeon E5-2630 V4 with 64 GB RAM, and the operating system is Windows 10 Enterprise Edition. To enhance computing efficiency, the rock model, compared with the real situation, is simplified as a one-twelfth ring with dimensions of outer diameter: mm, inner diameter: mm, and thickness: mm. The cylindrical cutter has a diameter of mm and a thickness of mm. Refer to Figure 2 below for a comprehensive illustration of the complete model.
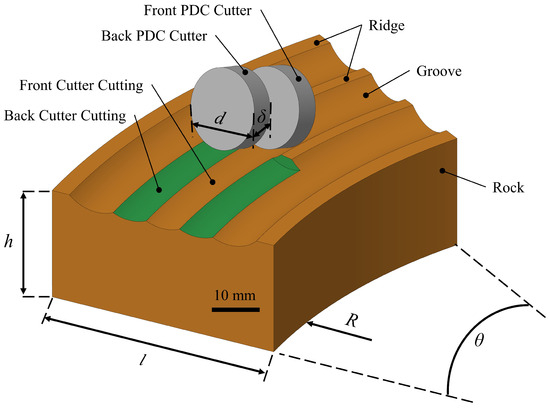
Figure 2.
Simulation model of the dual-cutter working on rock.
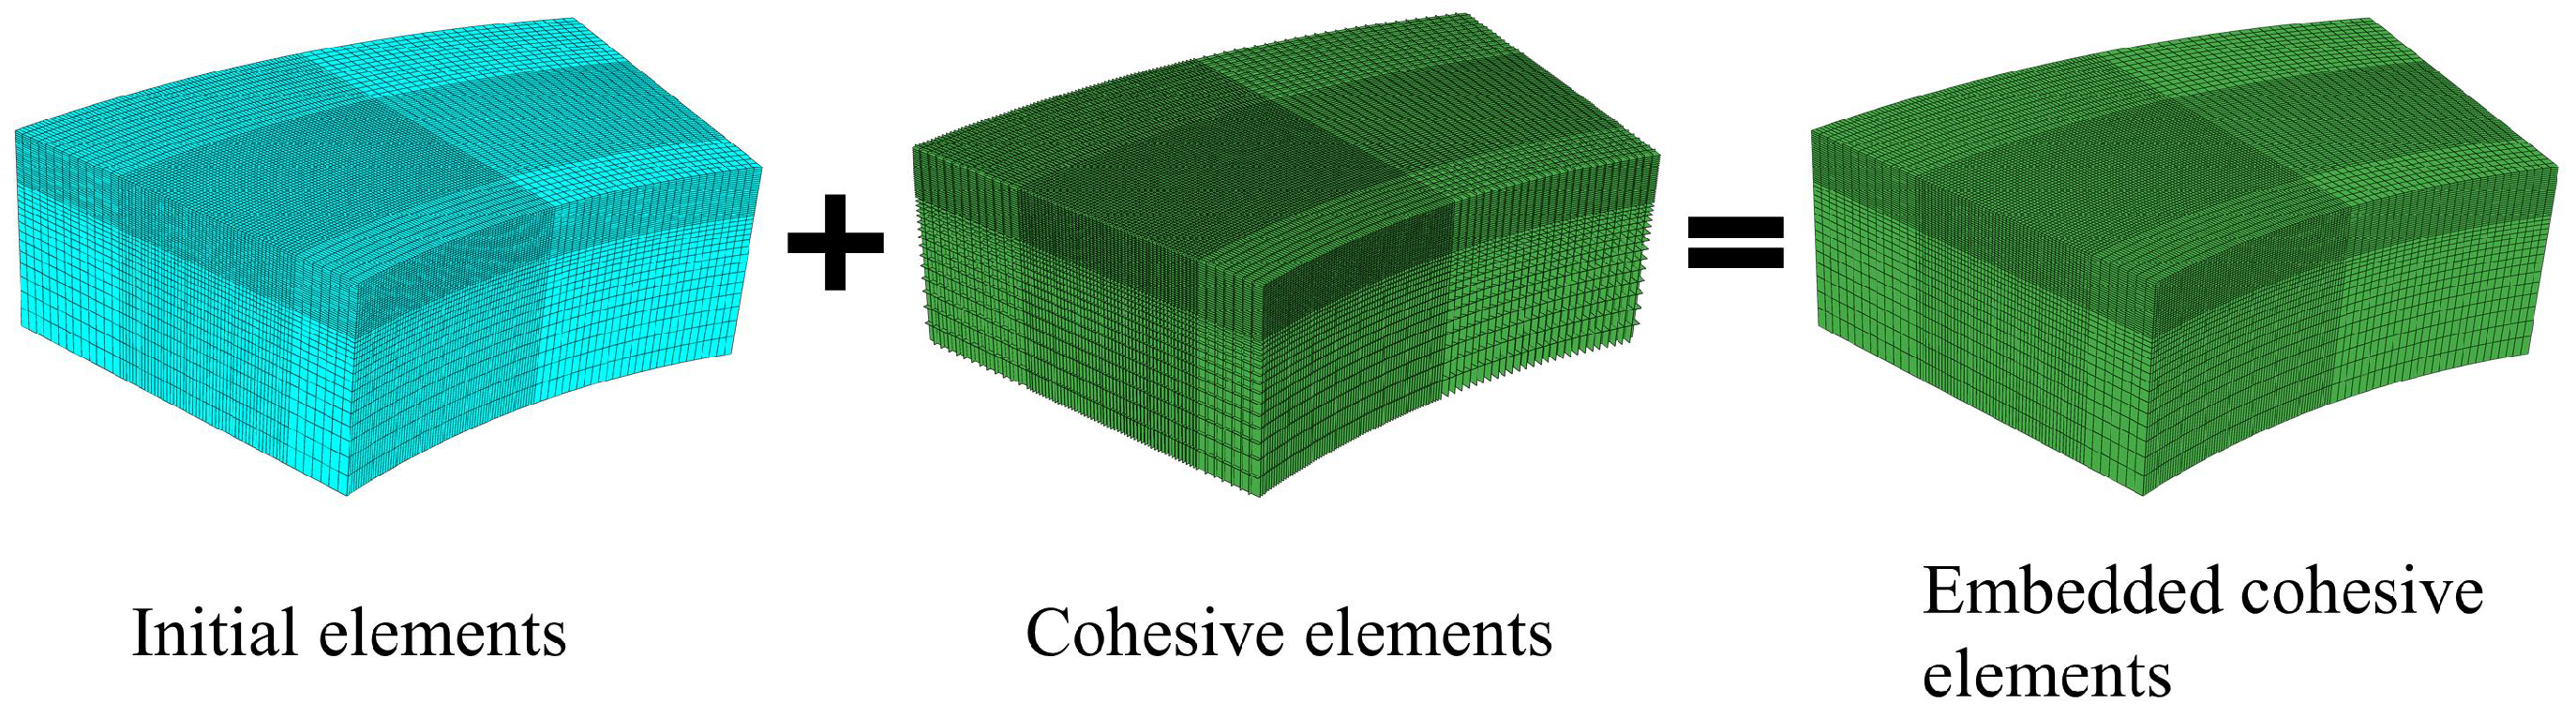
The zero-thickness cohesive element is then inserted into the initial finite element, as shown in Figure 3. Finally, numerical models of rocks containing solid and zero-thickness cohesive elements have been developed. The model contains 289,680 C3D8R (eight-node first-order reduction integral element) units and 854,878 COH3D8 (8-node three-dimensional cohesive element) units.
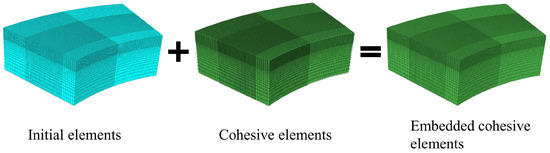
Figure 3.
Rock numerical model embedded with cohesive elements.
2.3. Simulation Conditions
The interaction between the drill bit and rock is characterized as a dynamic system of surfaces and nodes that dynamically update the contact surface upon rock fracturing, thereby simulating the removal of fragmented rock layers beneath the bit and exposing fresh surfaces during drilling. A fixed boundary is established at the base of the rock model, where pressure is applied to confine the cylinder surface while fluid pressure is exerted on the upper portion of the rock. The back-rake angle of the cutter is , the cutting depth of the cutter is fixed, and the cutter rotates at an angular speed of rad/s around the center of rotation, with a front cutter rotation radius of mm and a back cutter rotation radius of mm to mm. The illustration of Figure 4 demonstrates the configuration of bit model loading and the establishment of boundary conditions. The physical and mechanical parameters of the rock (granite) [33,34] are shown in Table 1. The confining pressure and fluid pressure are MPa, and MPa [35]. All the bit control parameters are shown in Table 2.
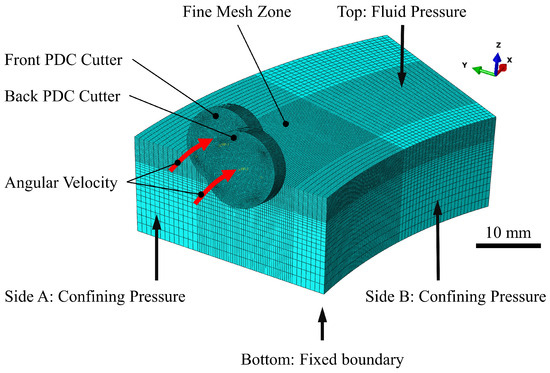
Figure 4.
Schematic of the boundary conditions.

Table 1.
Physical parameters of granite used in this work.
Table 2.
The simulated cutter control parameters.
2.4. Model Verification
The tensile strength of rock is one of the physical and mechanical properties of rock, which refers to the average tensile stress on the section perpendicular to the tensile force when the rock specimen is damaged under the action of tensile stress. The main failure factors of rock in the drilling process are tensile stress and shear stress, so measuring the tensile strength of rock is important to study the failure form of rock in the drilling process. The methods of measuring the tensile strength of materials include direct and indirect tensile methods. The direct tensile test of the rock sample in the processing is relatively difficult, and the test loading process sometimes becomes eccentric, which makes it difficult to ensure that the tensile force operates through the central axis of the sample and consequently results in test errors. Therefore, an indirect tensile method is used to measure the tensile strength of the rock in most cases. The indirect tensile methods include the Brazilian splitting test, three-point test, and ring splitting test. Among them, the Brazilian splitting test is the most widely applied. The common Brazilian test method is to place the processed disc-shaped sample between the pressure plate of the press, and the contact between the pressure plate and the rock sample is linear contact, which can change the applied pressure into linear load so that the tensile stress inside the sample is perpendicular to the direction of the upper and lower loads. The specimen is destroyed by tensile stress.
The validity of the constitutive rock model is confirmed by comparing the Brazilian splitting simulation results with experimental findings conducted by [36]. In their experiment, a GCTS (Geotechnical Consulting & Testing Systems) rock mechanics testing machine was utilized to perform a Brazilian splitting test on rock specimens measuring mm in diameter, and mm in thickness. The lower pressing plate of the testing apparatus remained stationary, while the upper pressing plate gradually descended at a rate of 0.1 mm/s to apply load onto the rock sample until it incurred damage. Similarly, the simulation model utilized rock samples measuring mm in diameter, and 25 mm in thickness. The physical and mechanical characteristics of the rocks employed in the simulation model can be found in Table 1. The experimental setup consisted of two upper and lower pressure plates, with the rock samples positioned along the XY direction for diameter measurement and Z direction for thickness measurement. When allowing translational freedom in the Y direction, the upper plate remained fixed in all other directions. To replicate a Brazilian splitting experiment, a gradual displacement load of 5 mm was applied at a rate of mm per second along the Y axis. As a matter of fact, this part has been verified in our previous work [37]. Figure 5 illustrates both the experimental system and simulation model used for this purpose.
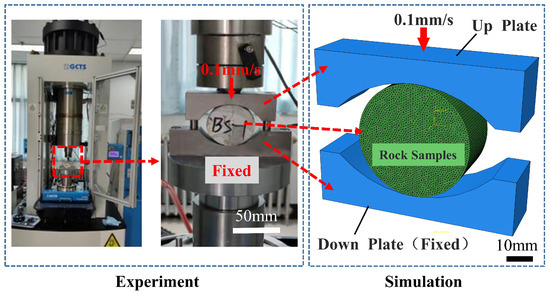
Figure 5.
Experimental system and simulation model of Brazilian splitting.
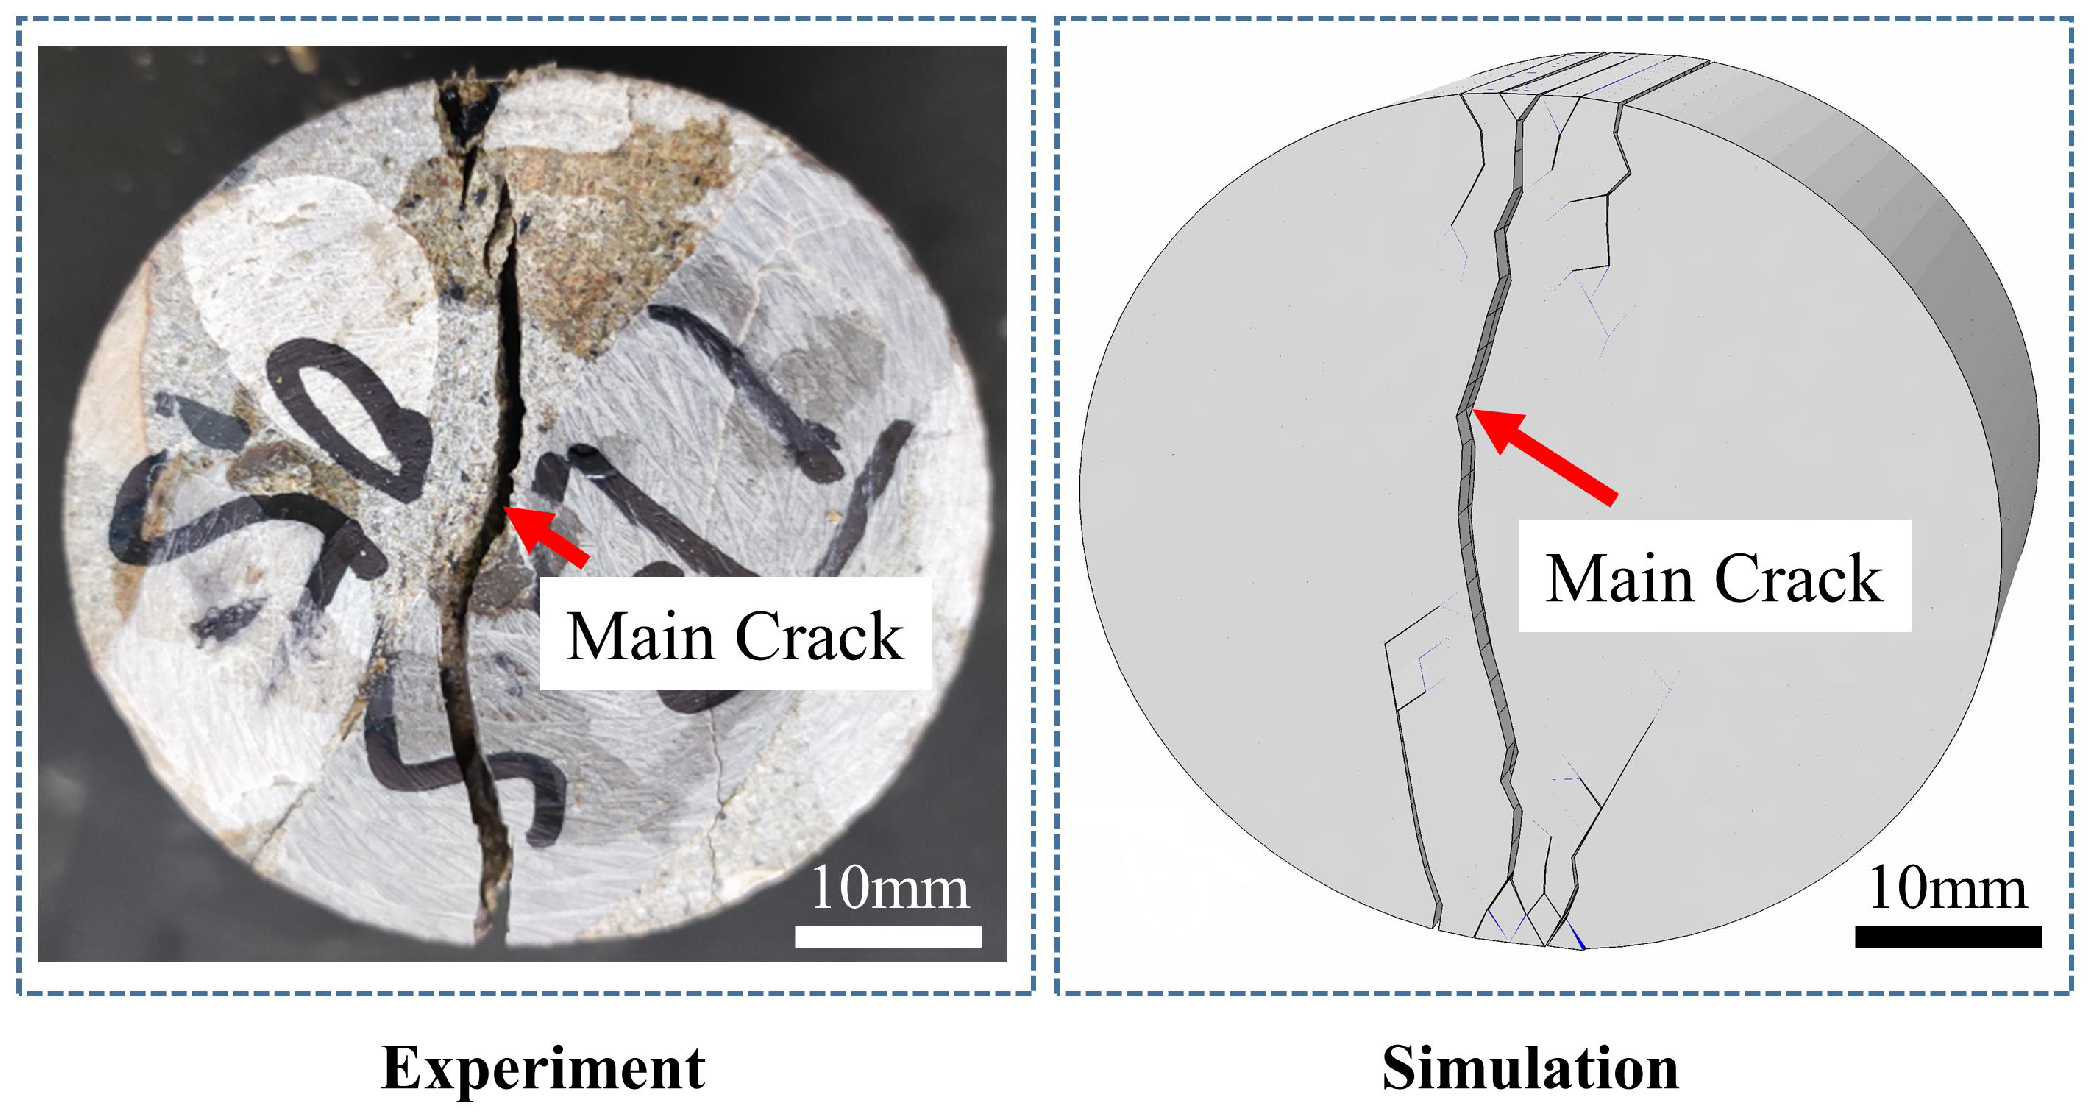
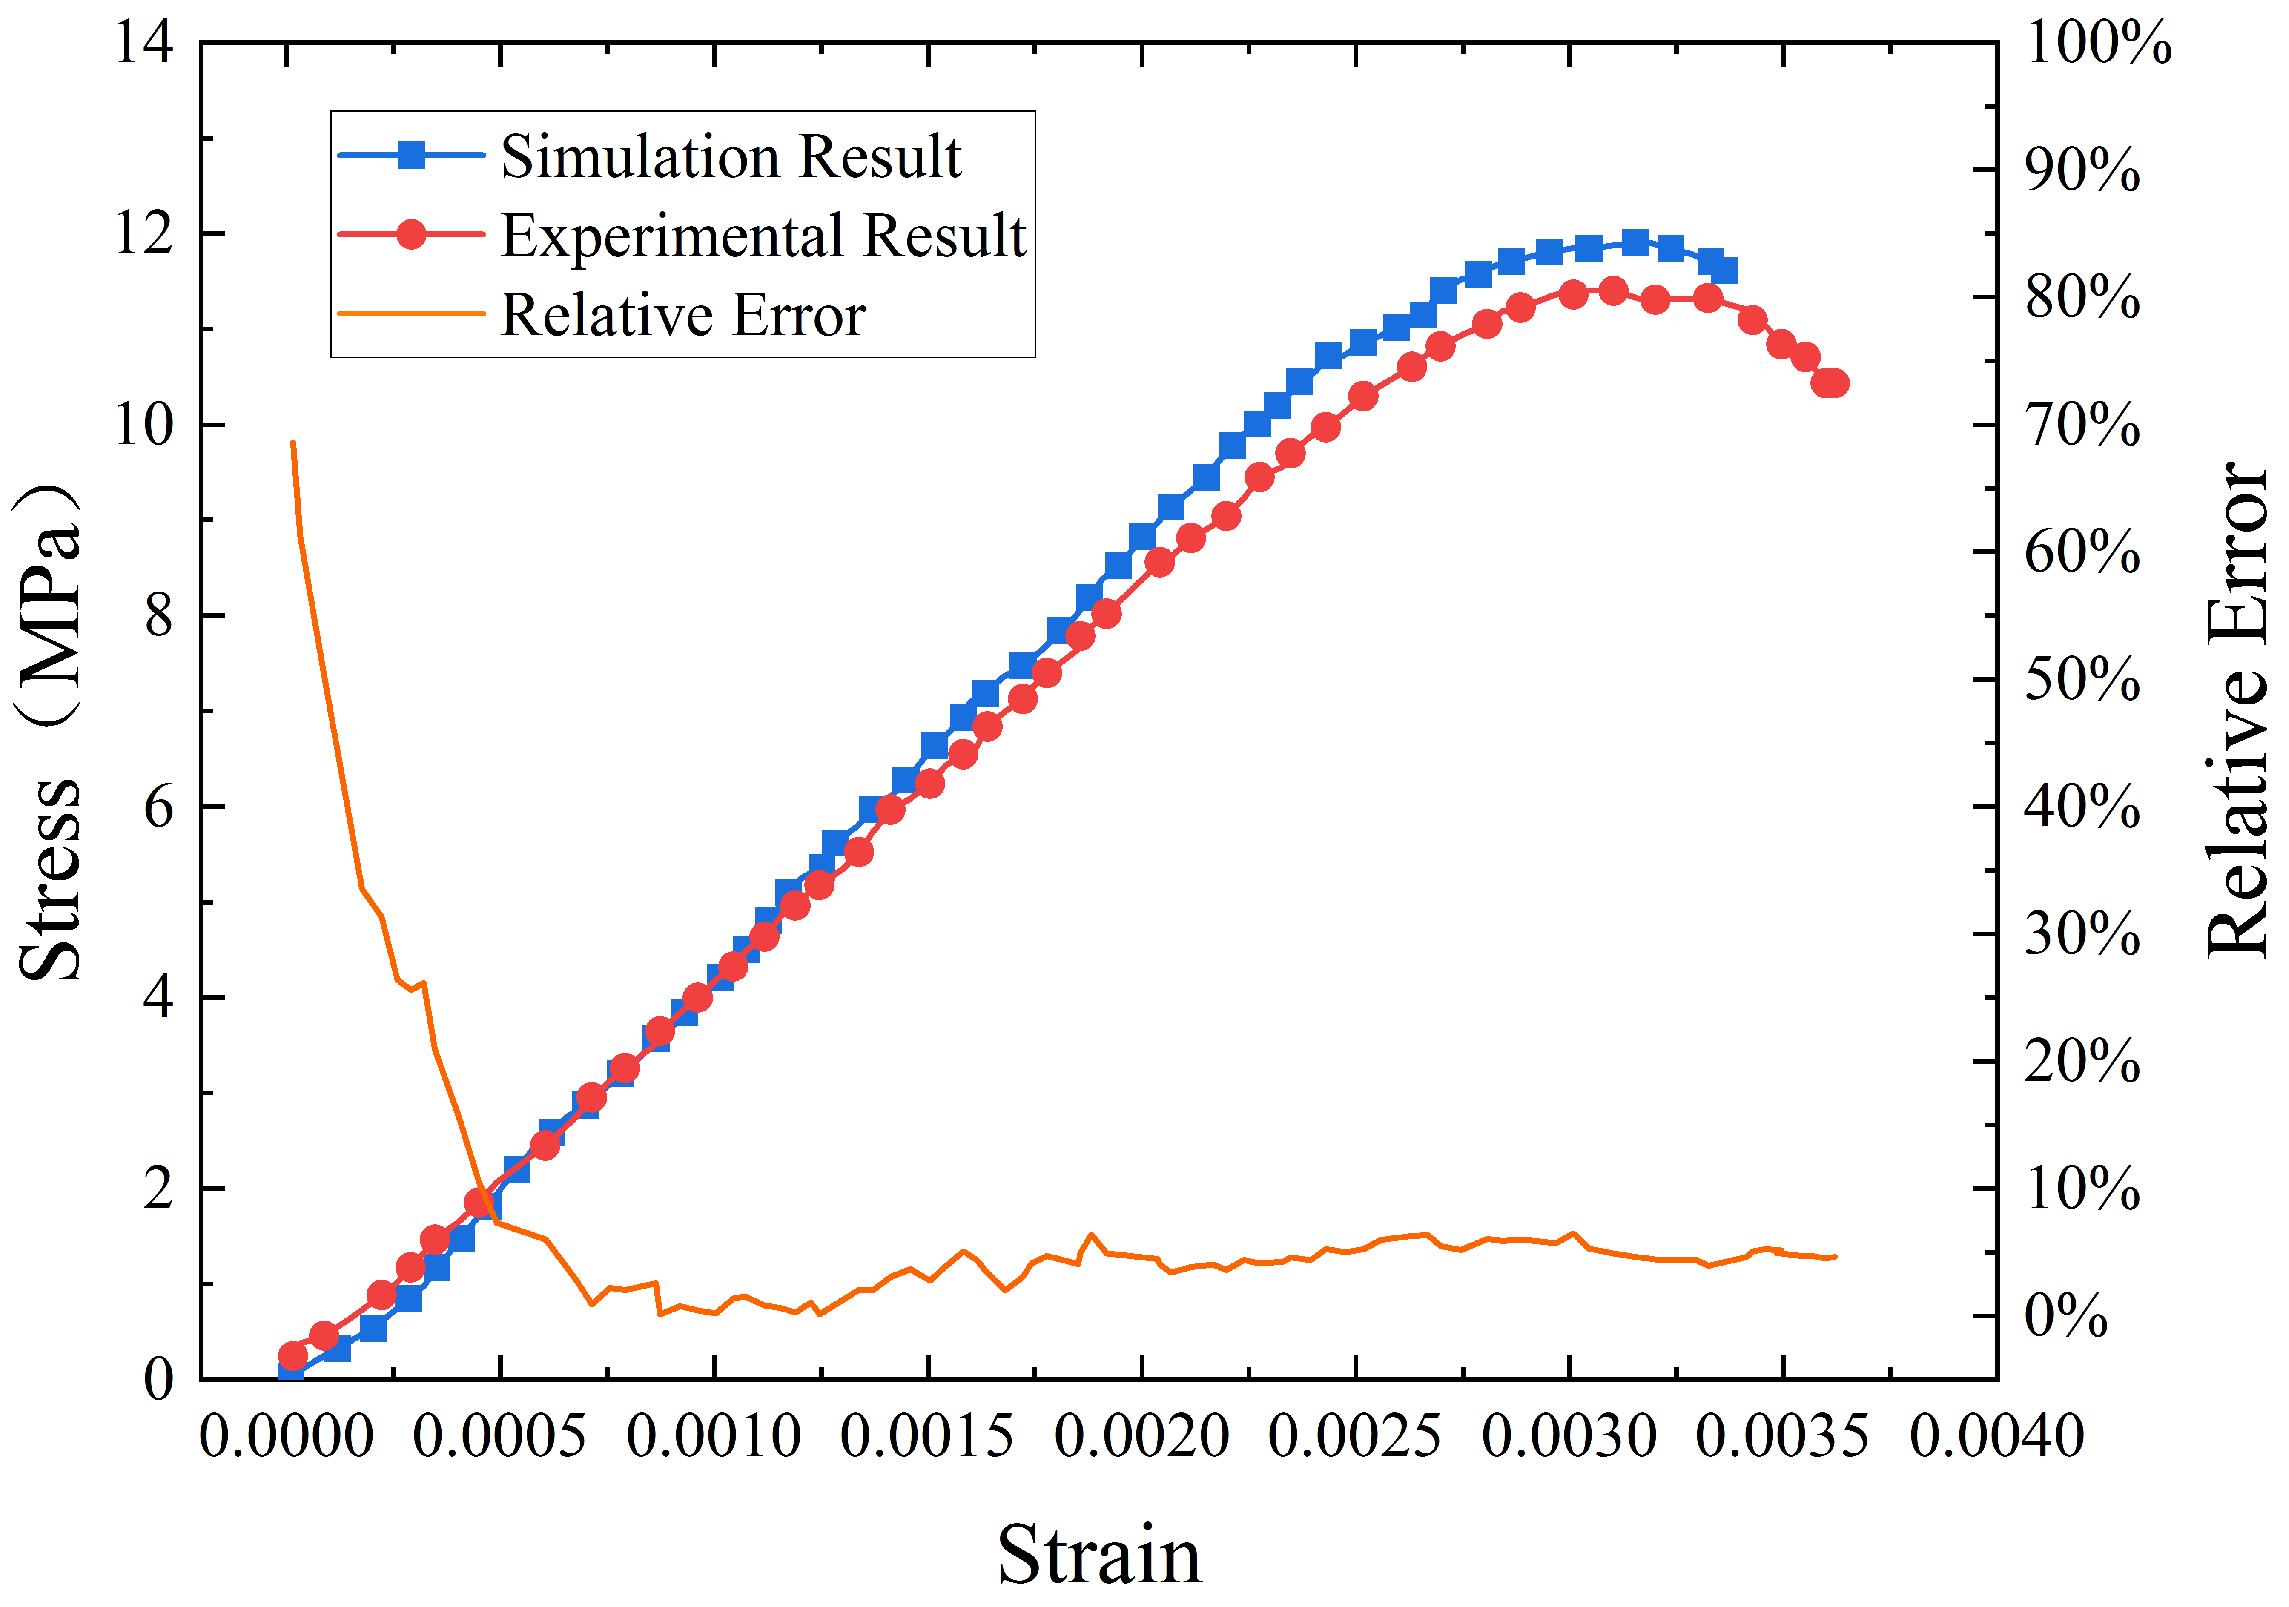
According to the findings presented in Figure 6, the primary crack observed in both the simulated rock samples and Brazil splitting test is identical. Additionally, Figure 7 illustrates the stress–strain relationship. The stress–strain curve obtained from simulation aligns perfectly with that extracted from experimentation, exhibiting similar characteristics such as equivalent slope during the elastic stage, peak strength of rock failure, and subsequent strength degradation post-failure. These combined experimental and simulation results affirm that the employed rock constitutive model accurately depicts the stress–strain behavior and damage properties of rocks.
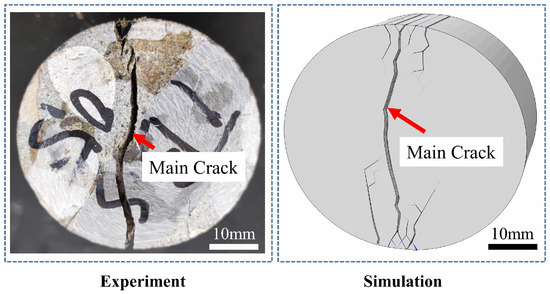
Figure 6.
Comparison of experimental and simulated rock Brazilian splitting.
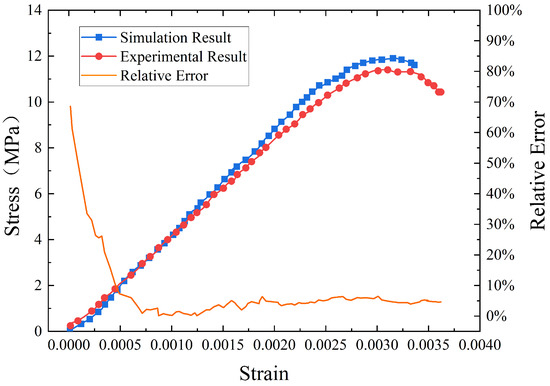
Figure 7.
Stress–strain curves under experiment and simulation.
3. Results and Discussions
3.1. Mechanism Analysis of Rock Breaking by Dual-Cutters
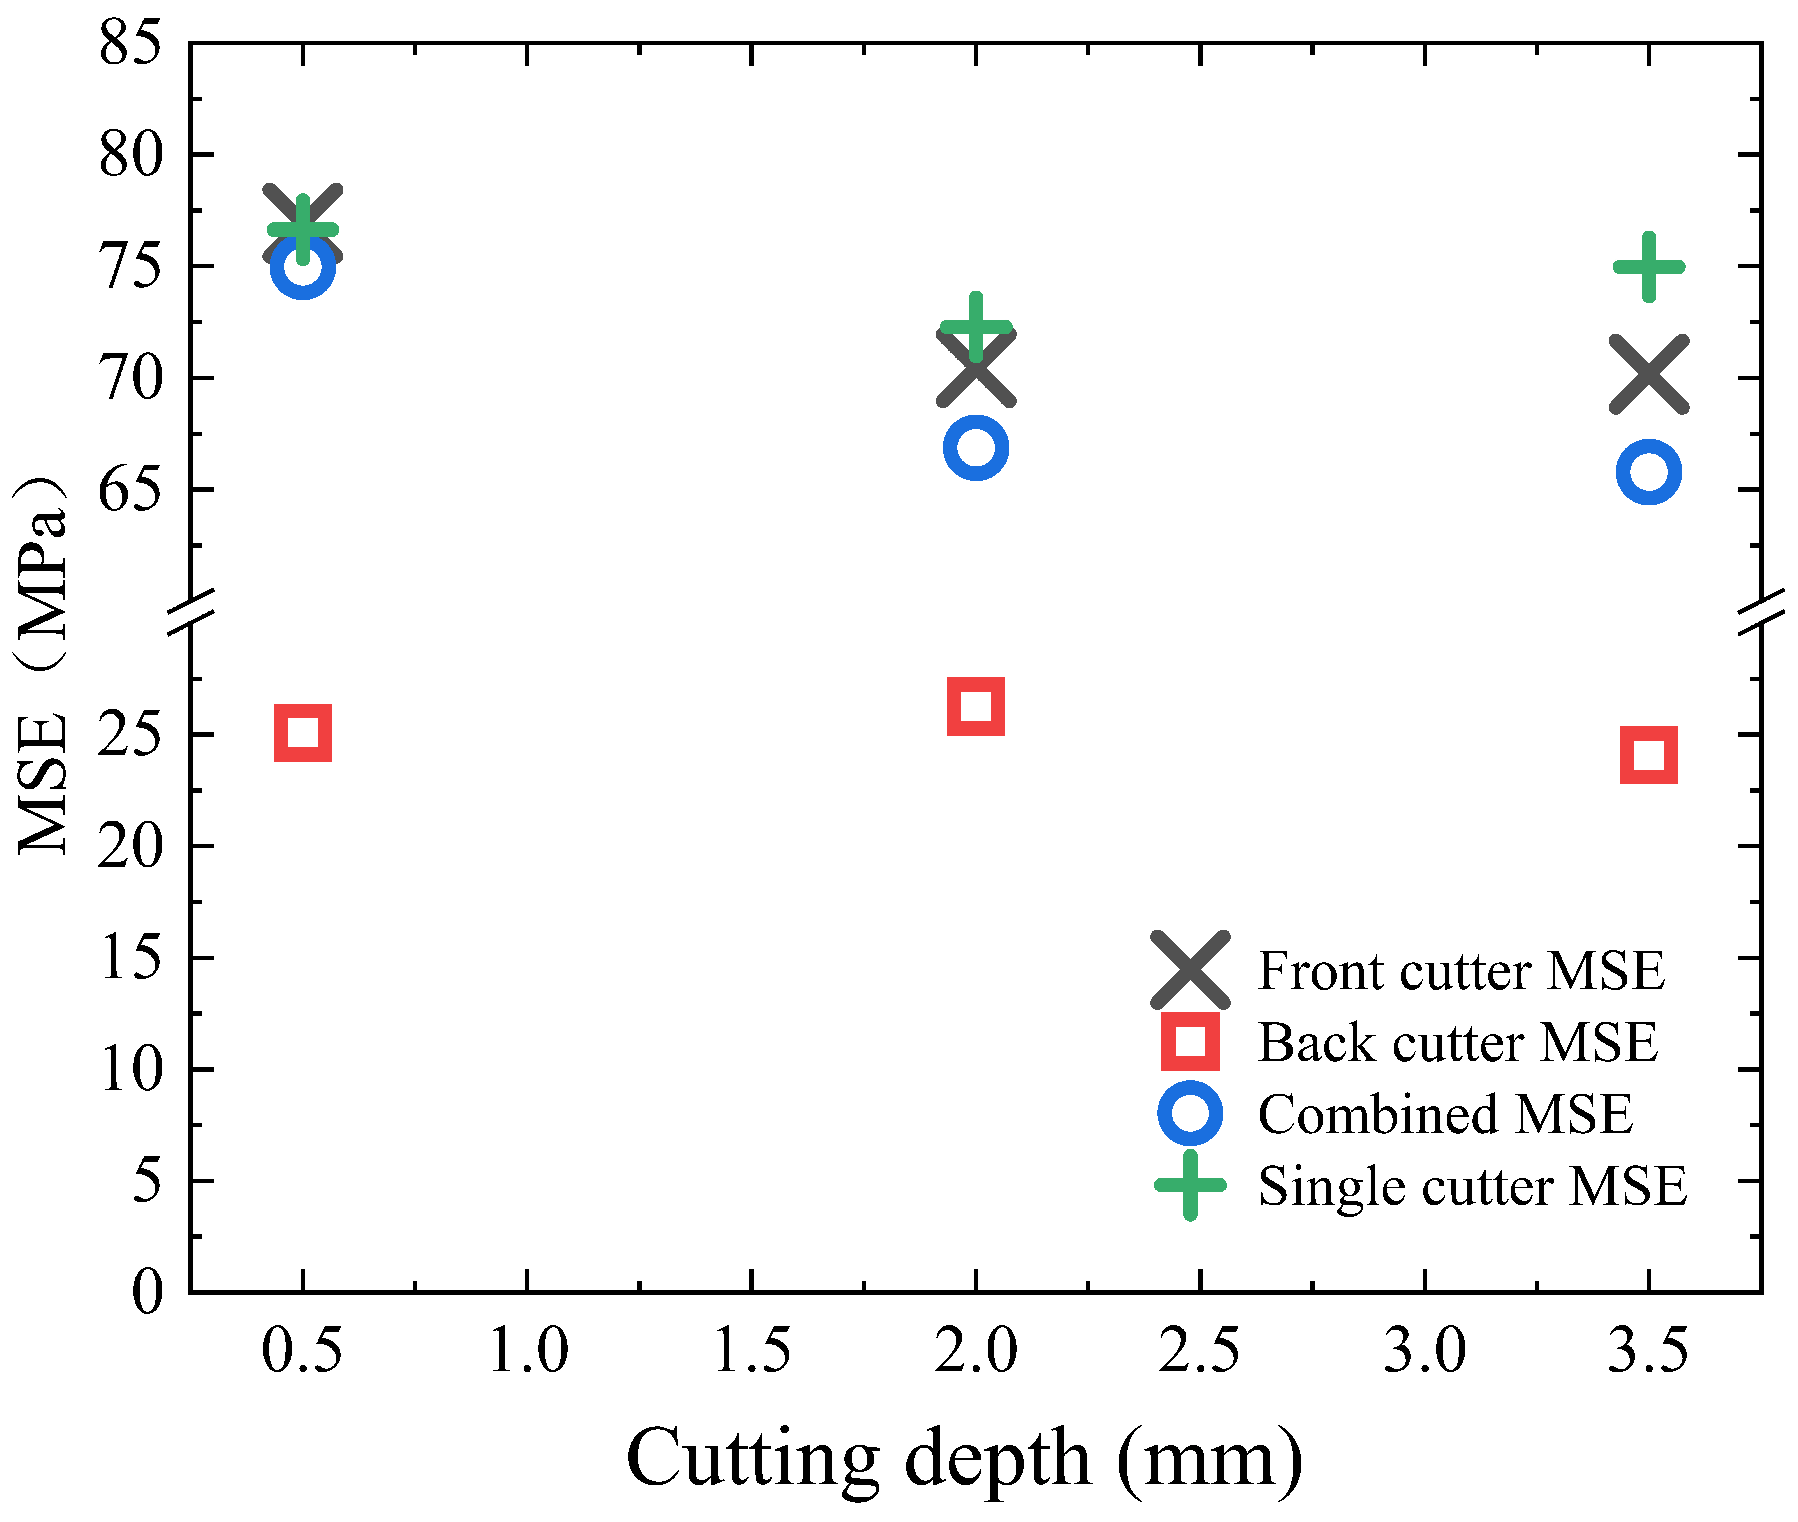
Figure 8 shows the MSE values for different cutting depths. In particular, it should be noted that the depth of cut in Figure 8 refers to the cutting depth of the front cutter for dual-cutter cutting, and the cutting depth of the back cutter is fixed at mm.
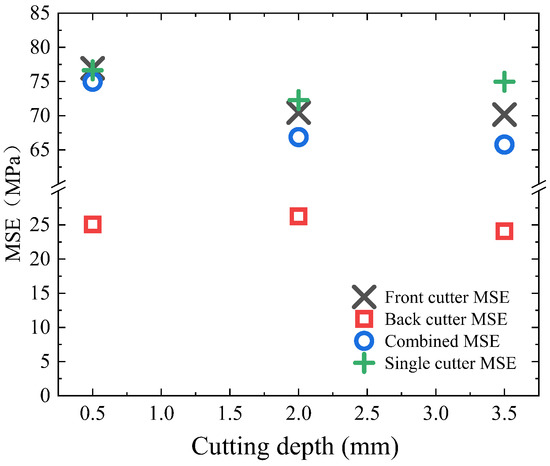
Figure 8.
The MSE for single-cutter and dual-cutter cutting.
When the cutting depth is mm, the MSE values of single-cutter cutting and dual-cutter cutting are not much different. When the cutting depth reaches mm, the MSE values of dual-cutter cutting(combined MSE) are lower than those of single-cutter cutting. When the cutting depth reaches mm, the MSE value of single-cutter cutting has a small increase, but the MSE value of dual-cutter cutting is basically unchanged. When cutting with dual-cutter, the MSE of the front cutter changes with the cutting depth in a similar way to that of the single-cutter cutting, which decreases with the increase in the cutting depth, and mostly remains unchanged after decreasing to a certain extent. The MSE of the back cutter is much smaller than that of the front cutter and single-cutter, and mostly does not change with the change of cutting depth. Above analysis confirms that the rock-breaking efficiency of dual-cutter cutting is higher than that of single-cutter cutting.
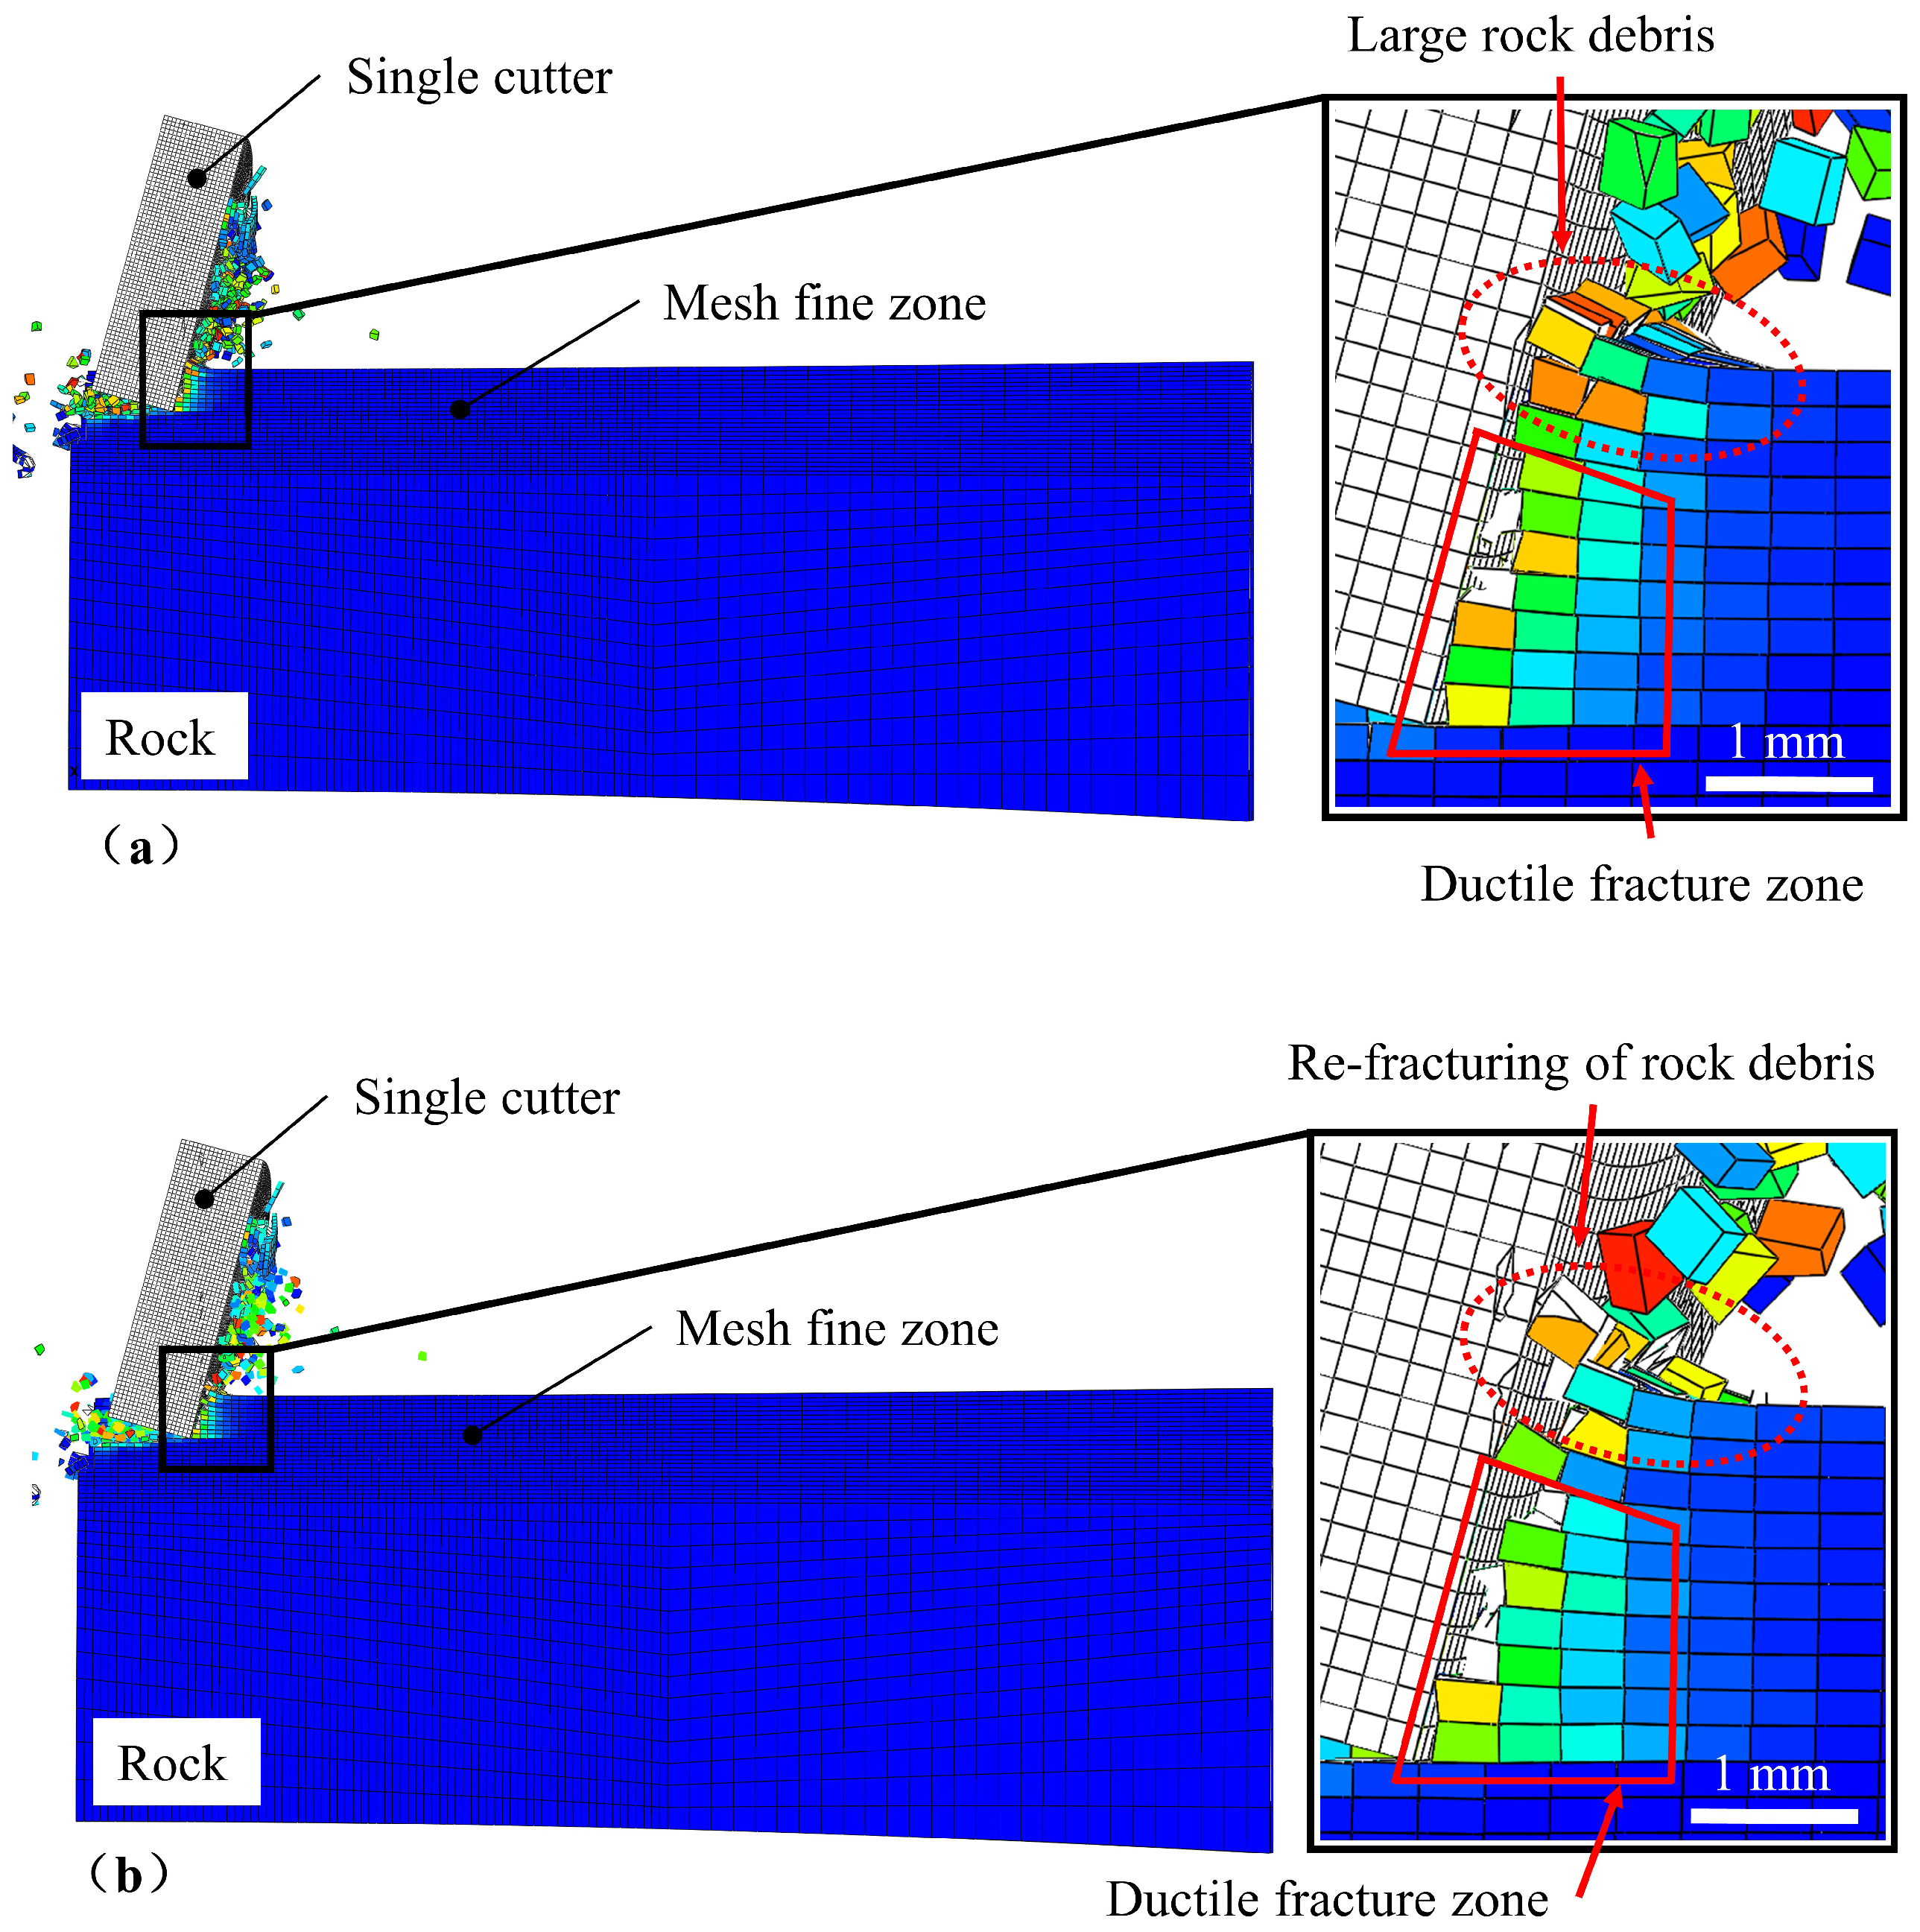
To further study the mechanism of different MSE values between single-cutter and dual-cutter cutting, it is necessary to analyze the rock-breaking process of the two rock-breaking modes. In particular, it is necessary to simulate the process of macroscopic crack generation and debris shedding. Figure 9 and Figure 10 are nephograms of the equivalent plastic strain (PEEQ) of the rock in rock-breaking. The equivalent plastic strain shows the condition and historical cumulative value of the plastic deformation of the rock. Figure 9 shows the PEEQ distributions of the rock in the process of single-cutter cutting. When the single-cutter enters the stable cutting, the part close to the surface will produce cracks parallel to the cutting direction, forming large pieces of cuttings. The rock near the bottom of the rock layer is crushed, forming a plastic fracture zone.
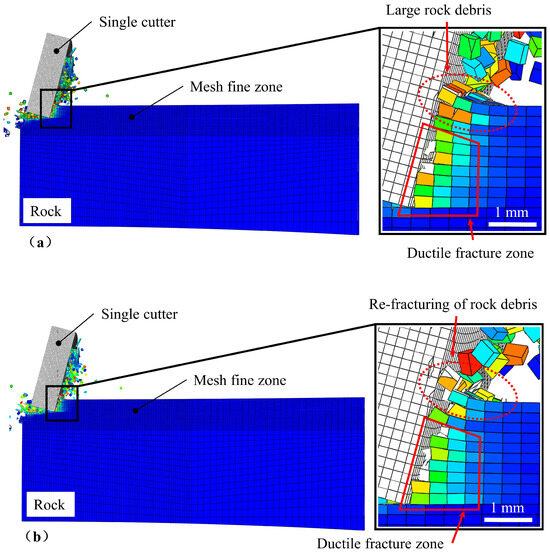
Figure 9.
The PEEQ distribution of singe cutter cutting at t = 33 ms (a) and t = 34 ms (b).
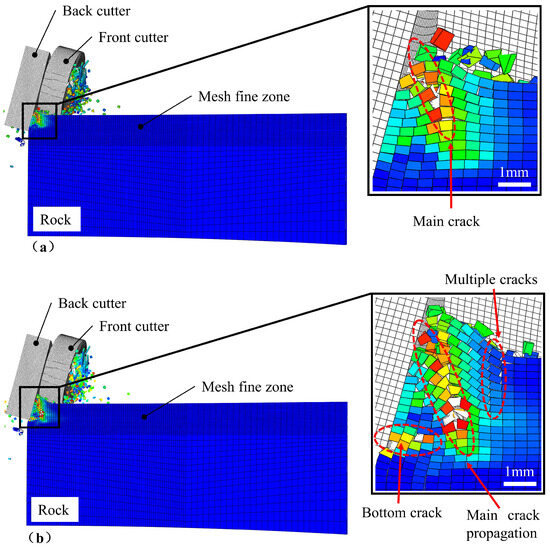
Figure 10.
The PEEQ distribution of dual-cutter cutting at t = 66 ms (a) and t = 68 ms (b).
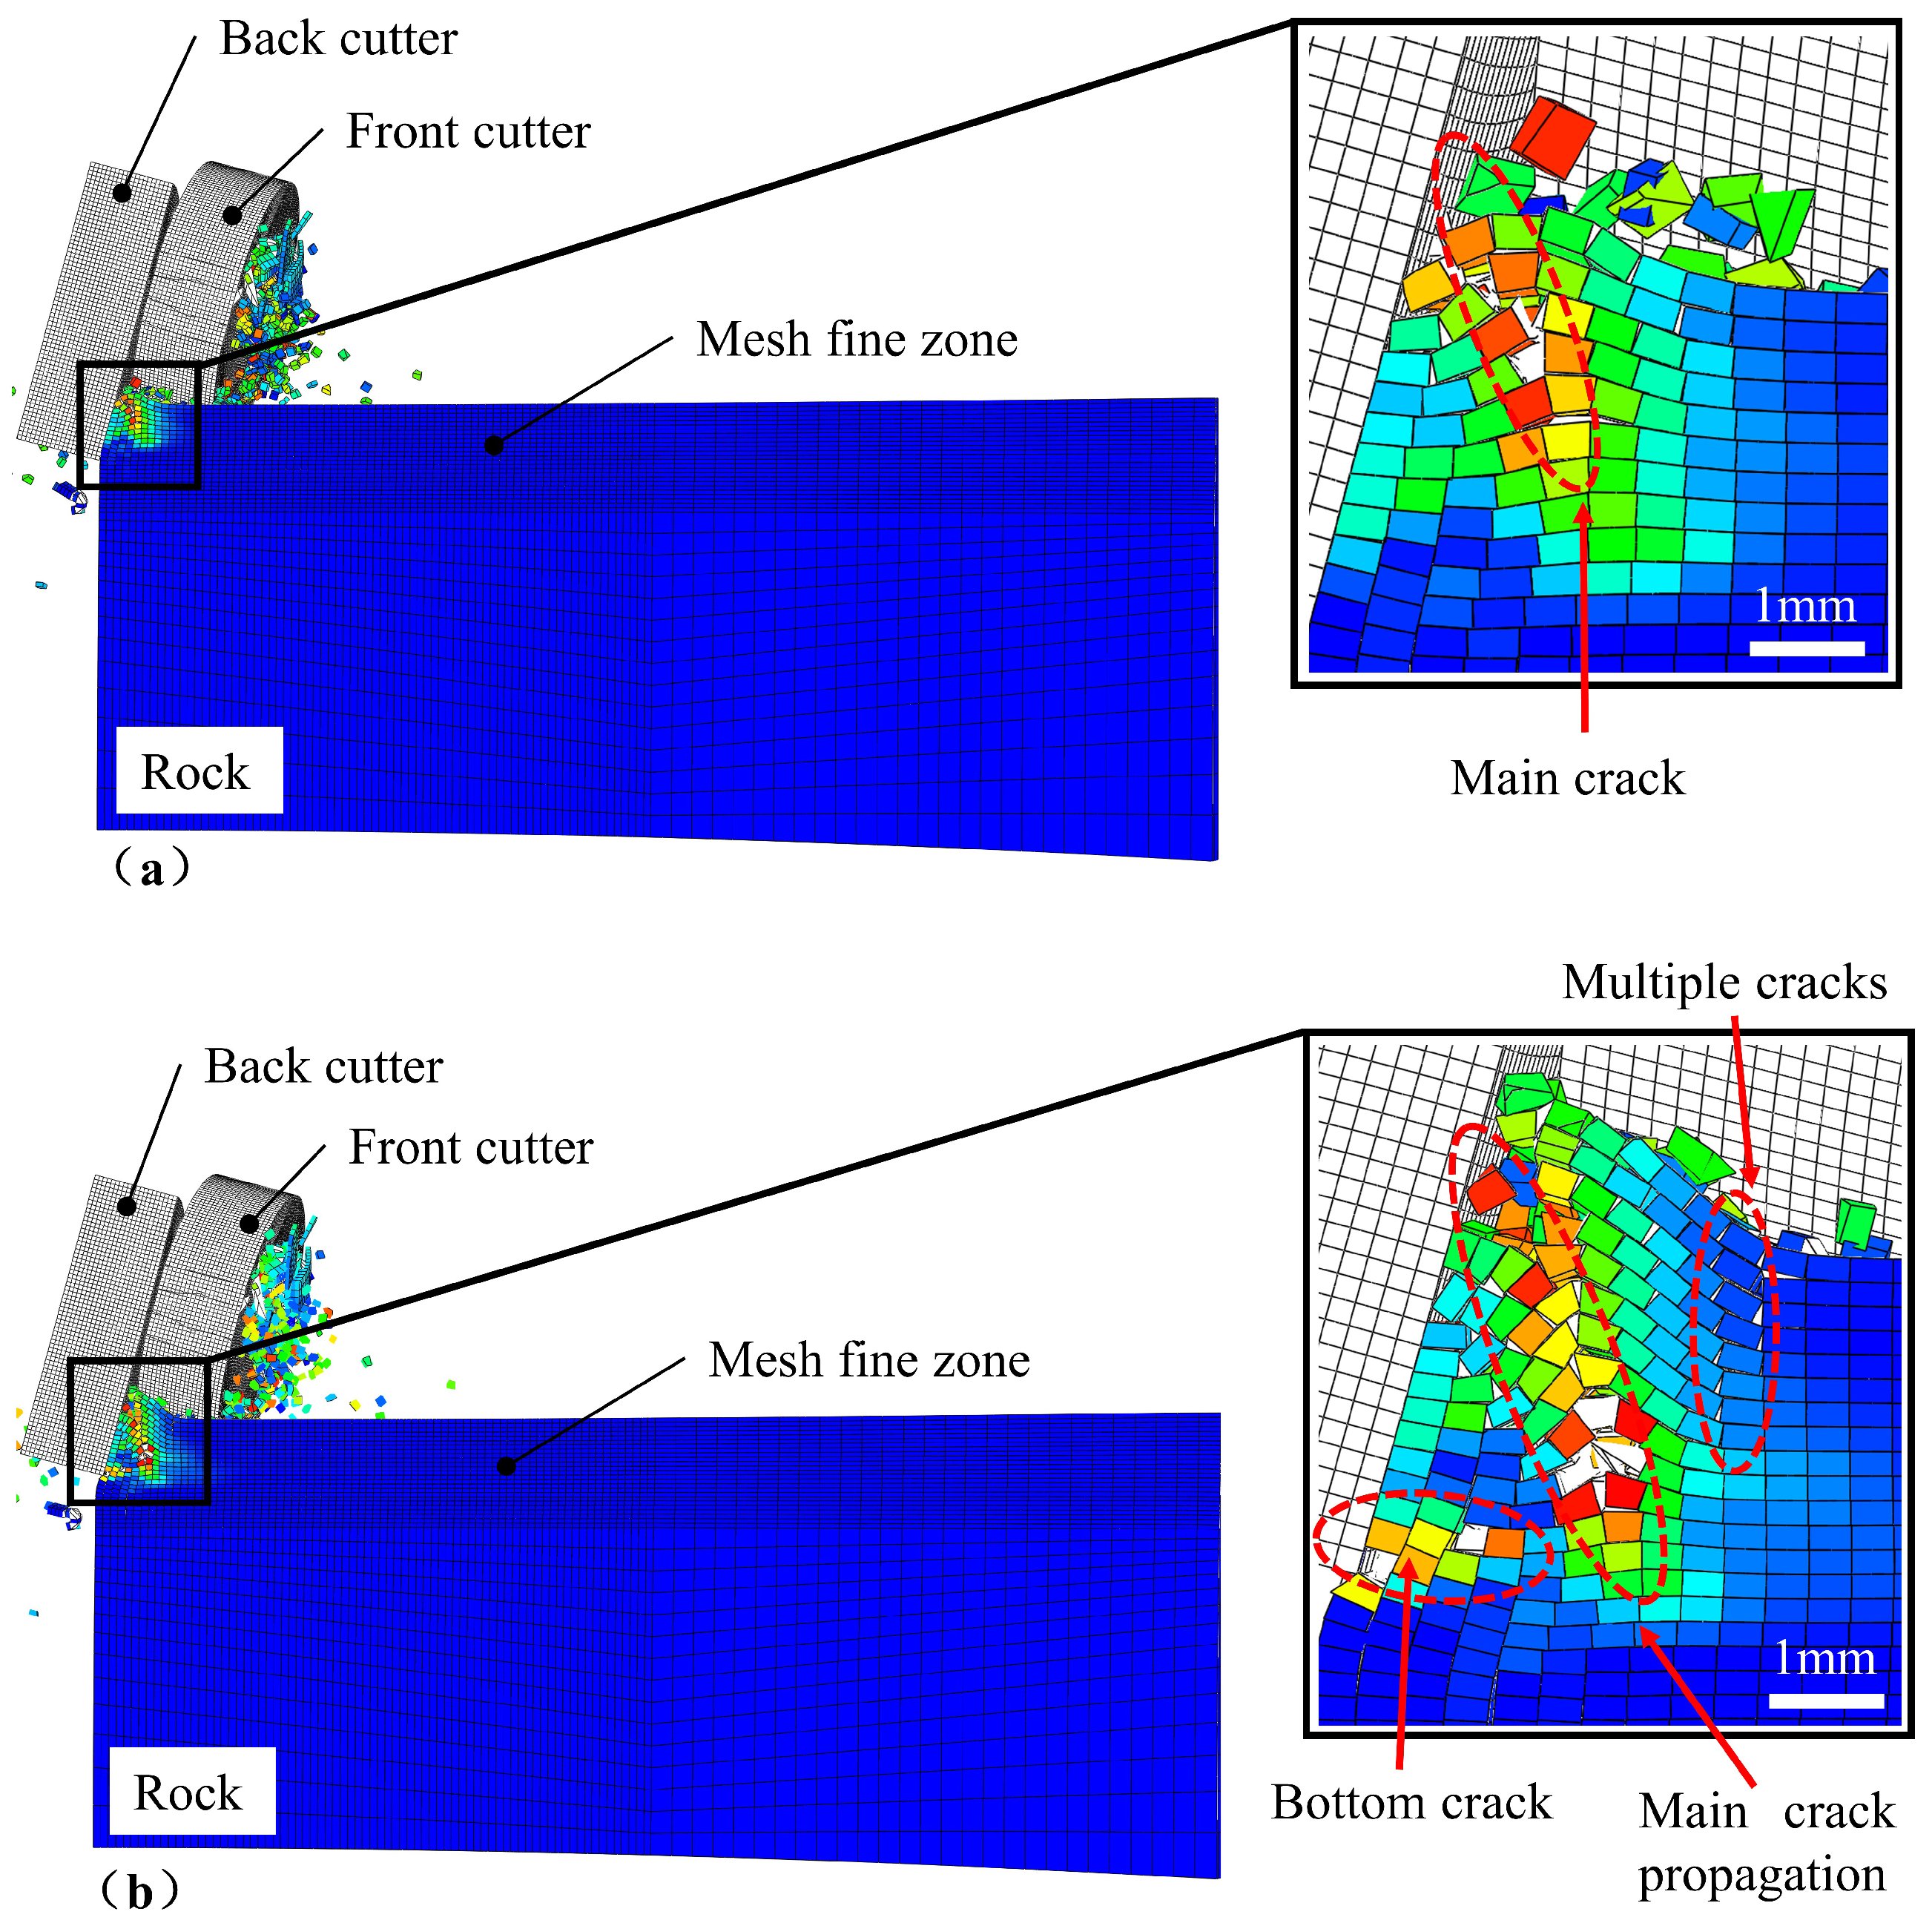
As the cutting process continues, the drill cutter will crush the large rock cuttings on the surface, which usually consumes energy and reduces the rock-breaking efficiency. Furthermore, the plastic failure of rock over a wide area can result in elevated energy consumption and decreased efficacy during the process of rock crushing.Figure 10 shows the PEEQ nephogram of rock in the rock-breaking process of dual-cutter cutting. The rock-breaking process of the front cutter of dual-cutter cutting is similar to that of single-cutter cutting, and the back cutter is different from that of single-cutter cutting. After analyzing the rock-breaking process of the back cutter, it shows that with the drill cutter squeezing the rock, the rock before the drill cutter forms a main crack extending from the rock surface to the deep. As the main crack expands, the rock in front of the cutter splits into two distinct brittle fracture zones. As the rock-breaking process continues, a bottom crack parallel to the cutting direction is formed at the bottom of the broken area at the back of the main crack, and some cracks perpendicular to the cutting direction are formed in the rock in front of the main crack. These cracks continue to expand and penetrate, forming large pieces of rock. In this way, the rock has continuous cutting.
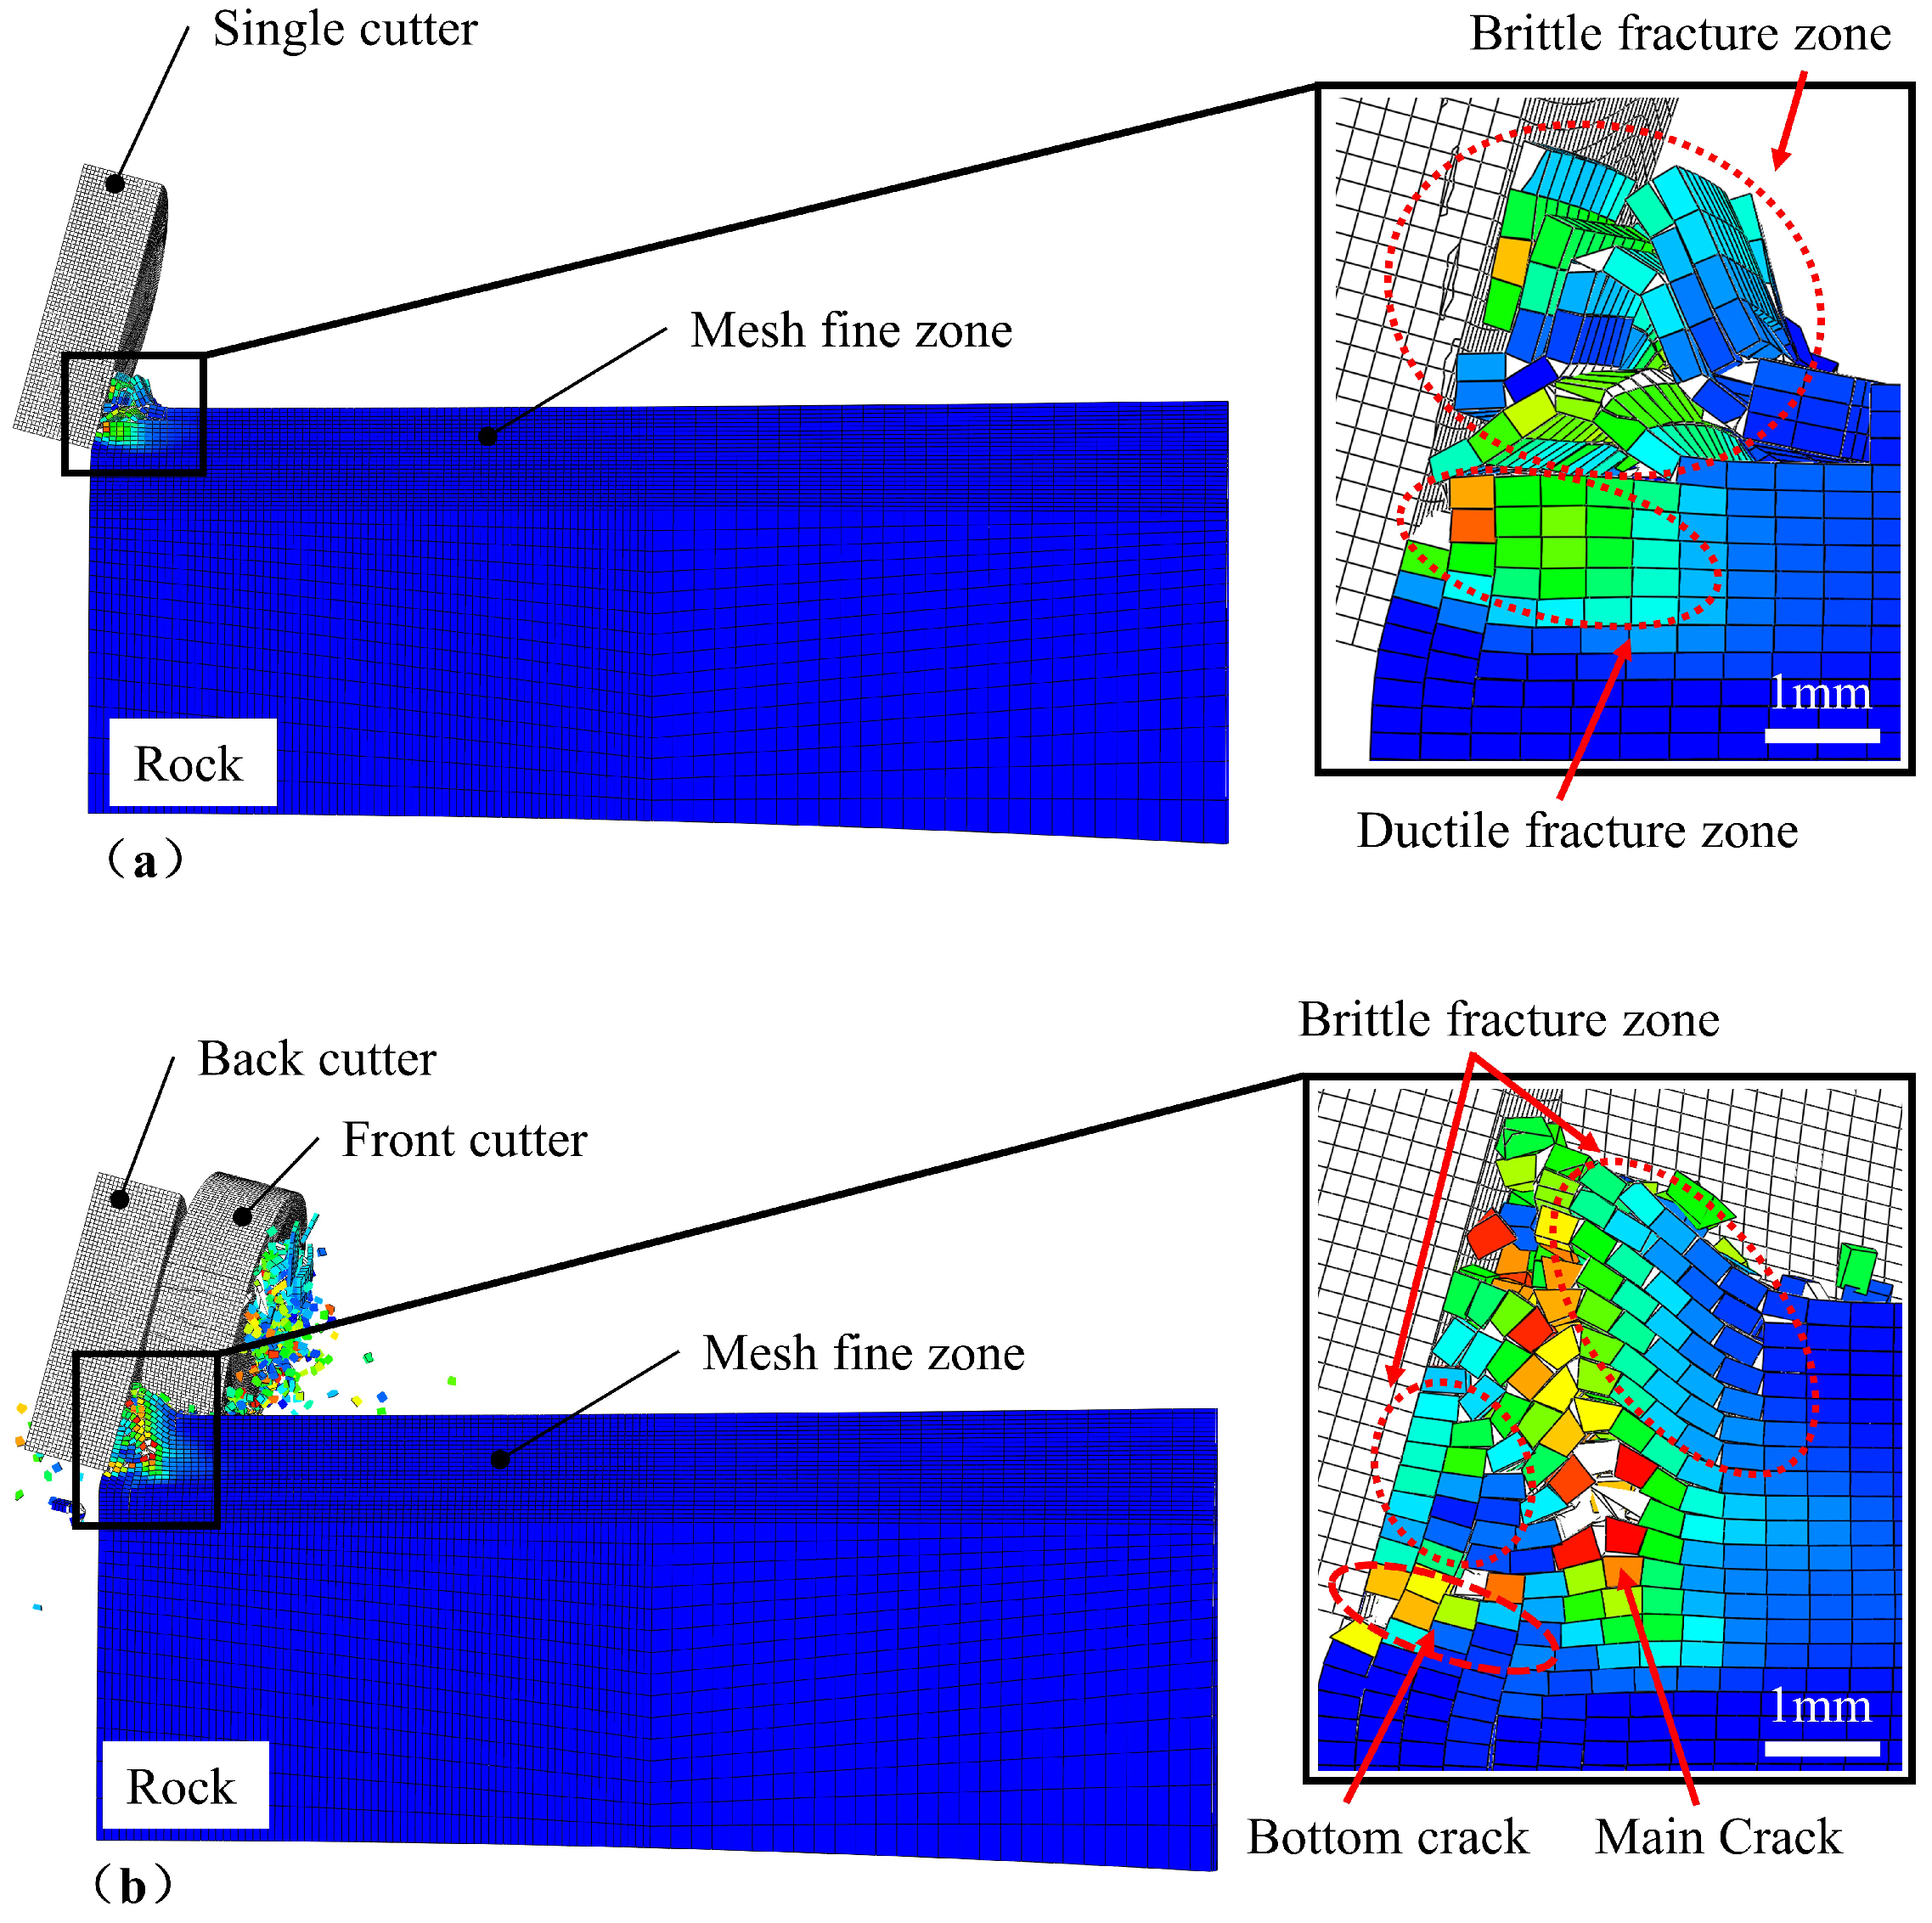
Figure 11 compares the difference between single-cutter cuts and dual-cutter cuts. In single-cutter cutting, the surface of the rock in front of the cutter is a brittle failure, and the deep rock is a plastic failure. Large fragments of rock formed by the brittle failure of the rock surface will produce repeated failures under the compression of the drill cutter. During the dual-cutter cutting process, the grooves formed by the front-cutters change the stress state of the rock surface, and residual plastic strain is also generated in the rock near the grooves. When the back cutter cuts along the spine in the middle of the two grooves, it can considerably reduce the consumption of cutting force and cutting energy, improve the energy utilization of rock breaking, and increase the efficiency of rock breaking. The shape of the crack produced by the back cutter during the dual-cutter cut also differs from that of the single-cutter cut. The difference that can be clearly observed is that a wide main crack will be formed in the direction of the cutting direction at an angle of about 60°, and there is a brittle failure area before and after the main crack. The brittle failure zone in front of the main fracture will generate multiple fractures perpendicular to the cutting direction as the bit progresses, and these fractures will spread through the rock surface to form large pieces of rock debris. The bottom of the brittle failure zone at the back of the main crack will form a bottom crack with the advance of the drill cutter, and the expansion of the bottom crack will intersect the main crack, thus forming a large piece of rock debris in the rear brittle failure zone. Compared with single-cutter cutting, two-cutter cutting can form a larger brittle failure area, and the probability of repeated breakage of cuttings is also more negligible. Thus, two-cutter cutting can improve drilling efficiency.
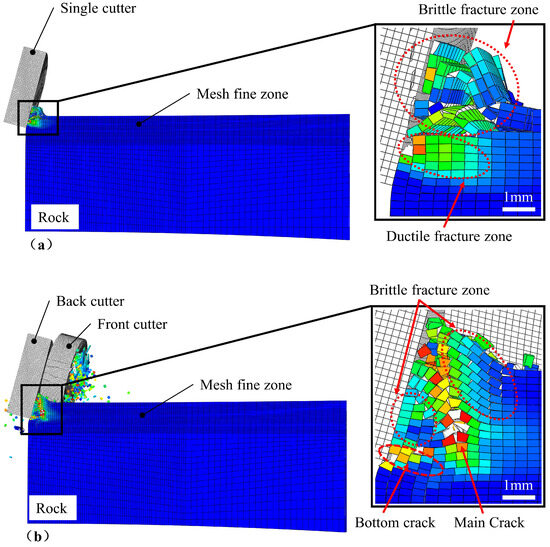
Figure 11.
The PEEQ distribution comparisons between single (a) and dual-cutter (b) cutting.
3.2. Influence of Horizontal and Vertical Offset Distance between Two Cutters
According to previous studies, changes in the horizontal and vertical offset distances of the back cutter would affect the MSE. To further investigate its effect on the MSE, simulation studies have been performed at different offset distances. The definitions of horizontal and vertical offset distances are shown in Figure 12. In order to eliminate the influence of the drill cutter diameter and cutting depth of the front cutter on the results, the horizontal offset coefficient is obtained by dividing the horizontal offset distance by the drill cutter diameter, and the vertical offset coefficient is obtained by dividing the vertical offset distance by the cutting depth of the previous cutter.
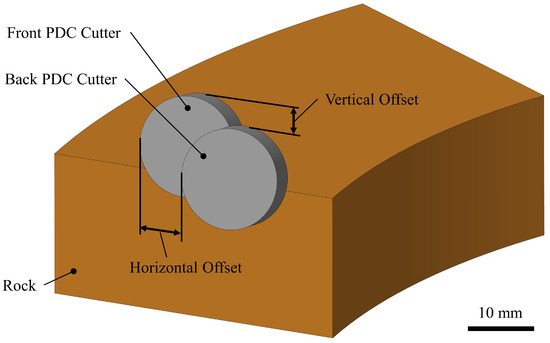
Figure 12.
Diagram of horizontal and vertical offset of the back cutter.
This section calculates and plots the MSE values for horizontal offset coefficients of −0.5, 0.0, and 0.5; vertical offset coefficients of 0.2, 0.3, and 0.5, respectively. It should be noted that the horizontal offset coefficient −0.5 corresponds to the outward offset distance of the back cutter to 0.5 times the drill cutter diameter, the coefficient 0.0 corresponds to the zero offset distance relative to the front cutter, and the coefficient 0.5 corresponds to the inward offset distance of the back cutter to 0.5 times the drill cutter diameter. It should be pointed out that the inward and outward offset here is relative to the front cutter. The distance between the back cutter and the rotation axis is greater than the front cutter for the outward offset, and the reverse is the inward offset. The vertical offset coefficients of 0.2, 0.3, and 0.5 indicate that the downward offset distance of the back cutter is 0.2 times, 0.3 times, and 0.5 times the depth of the front cutter.
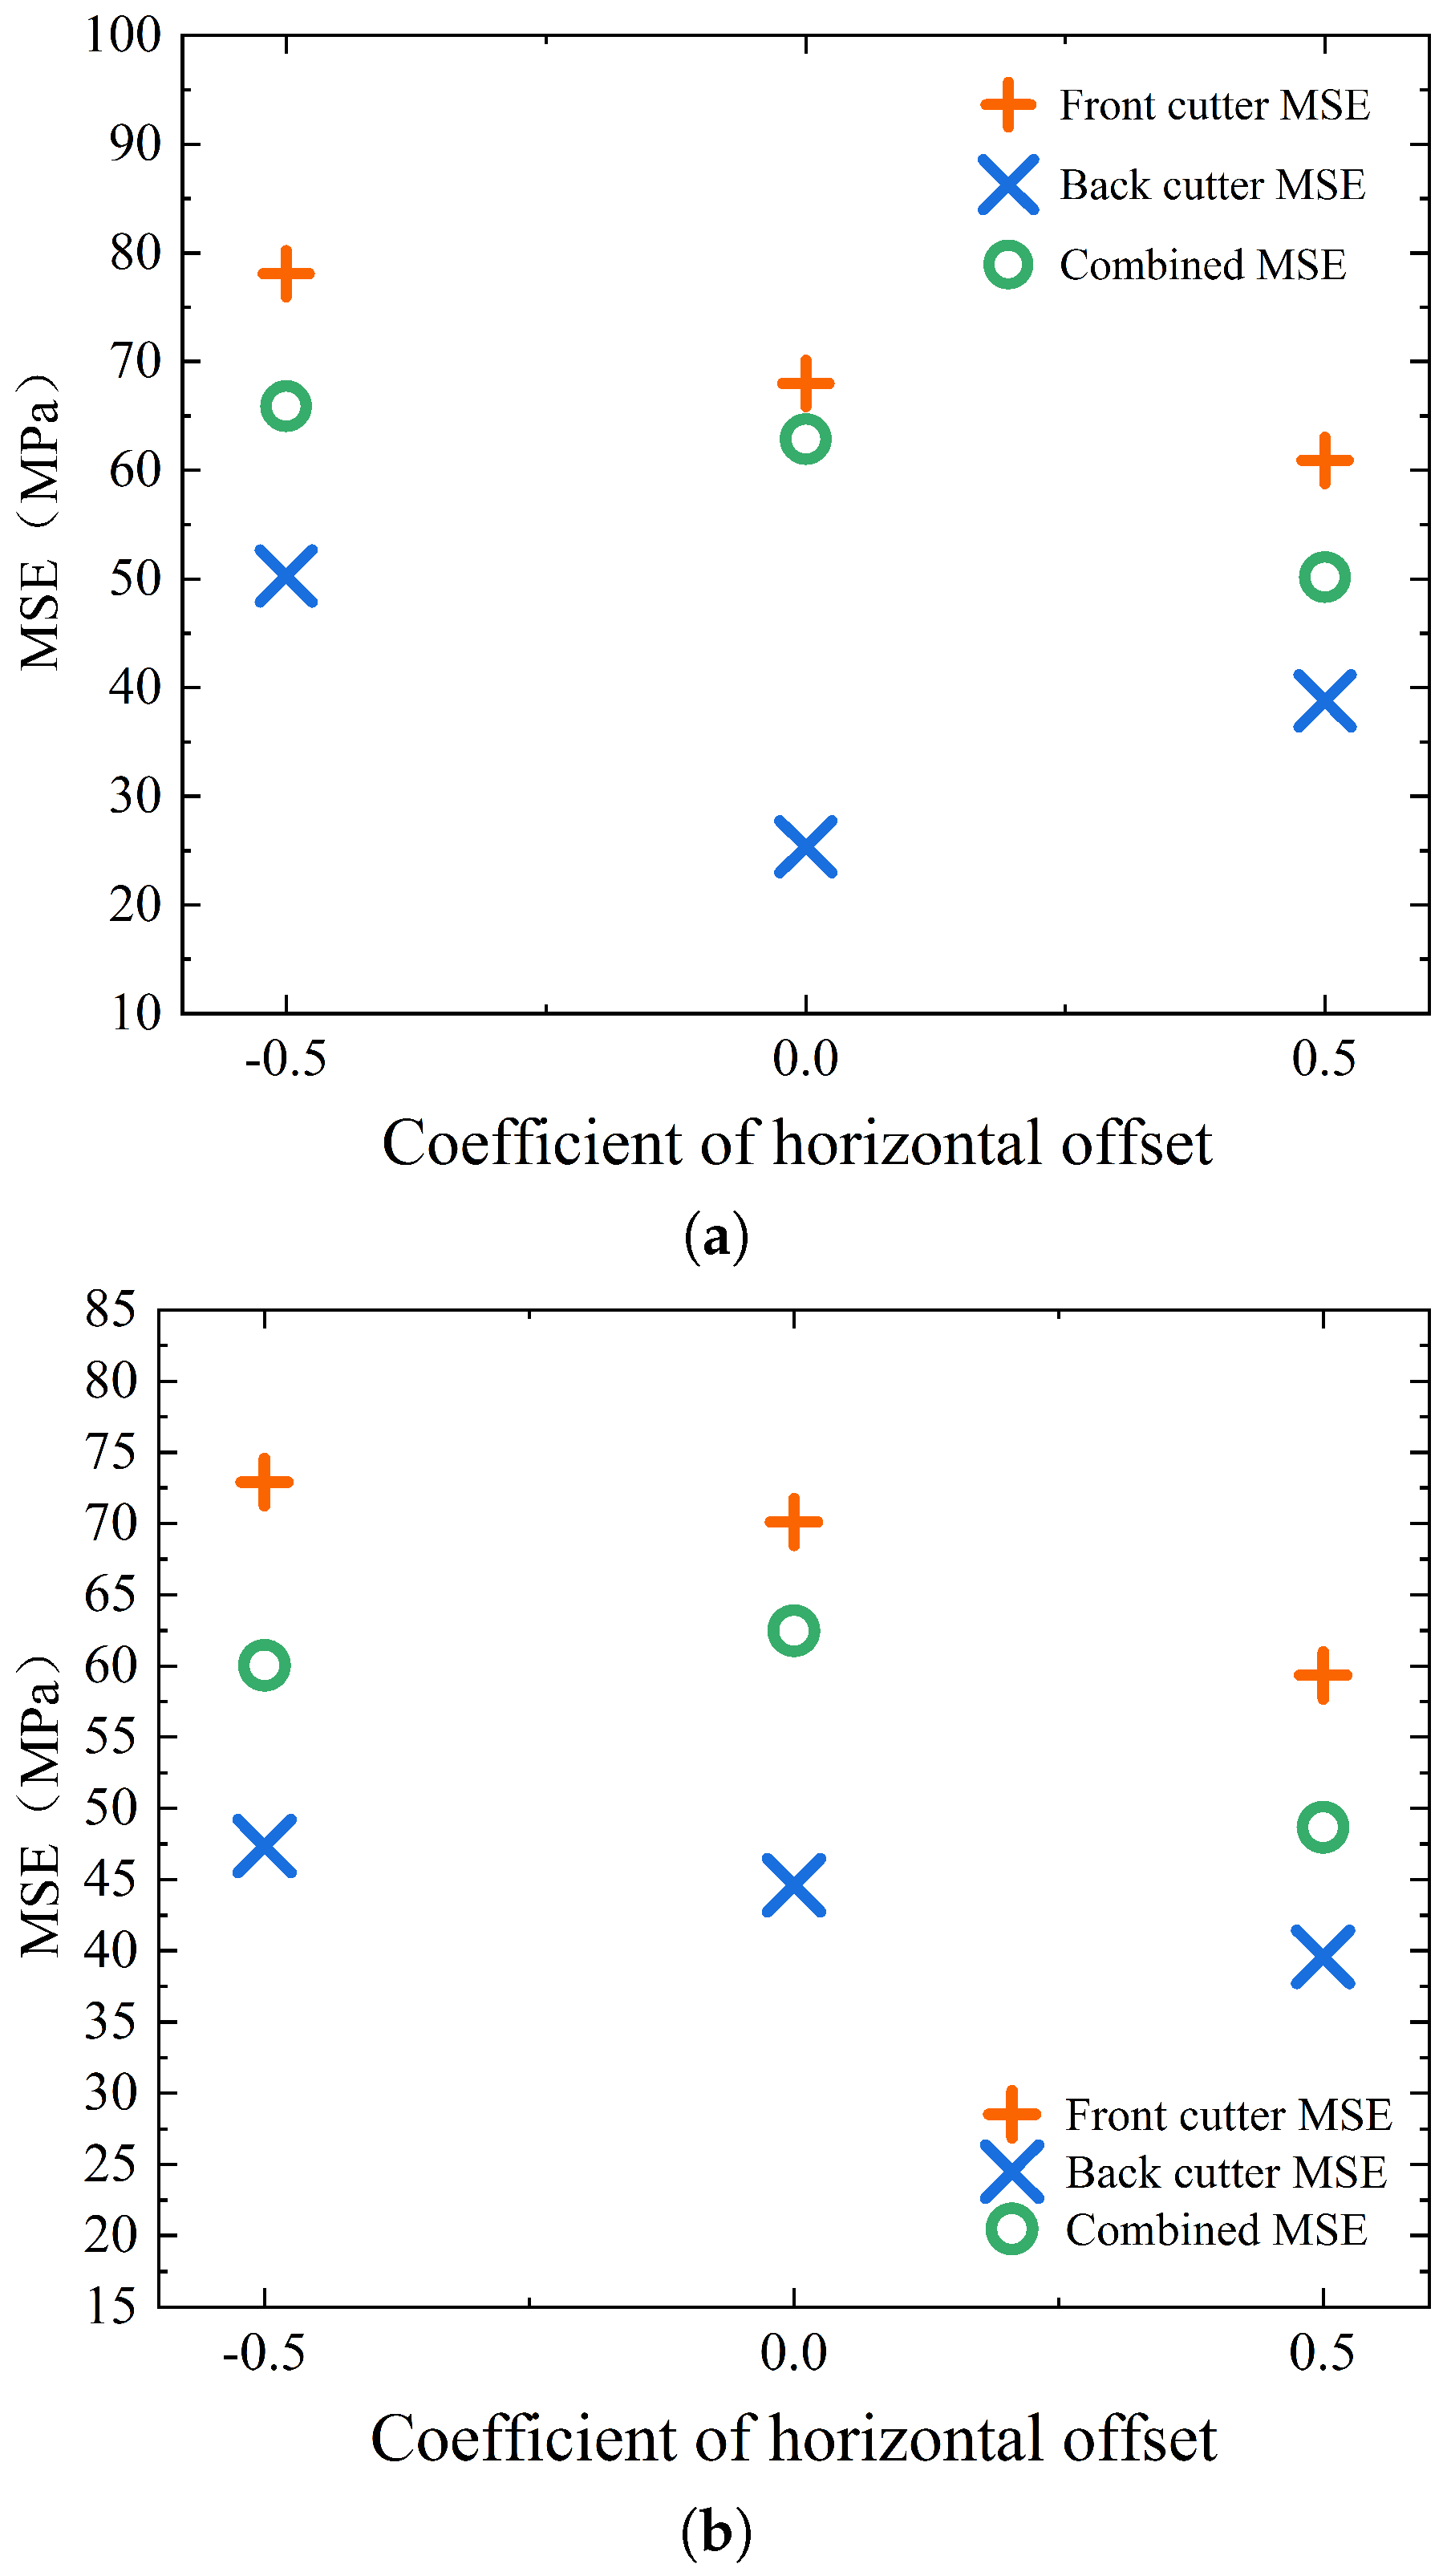
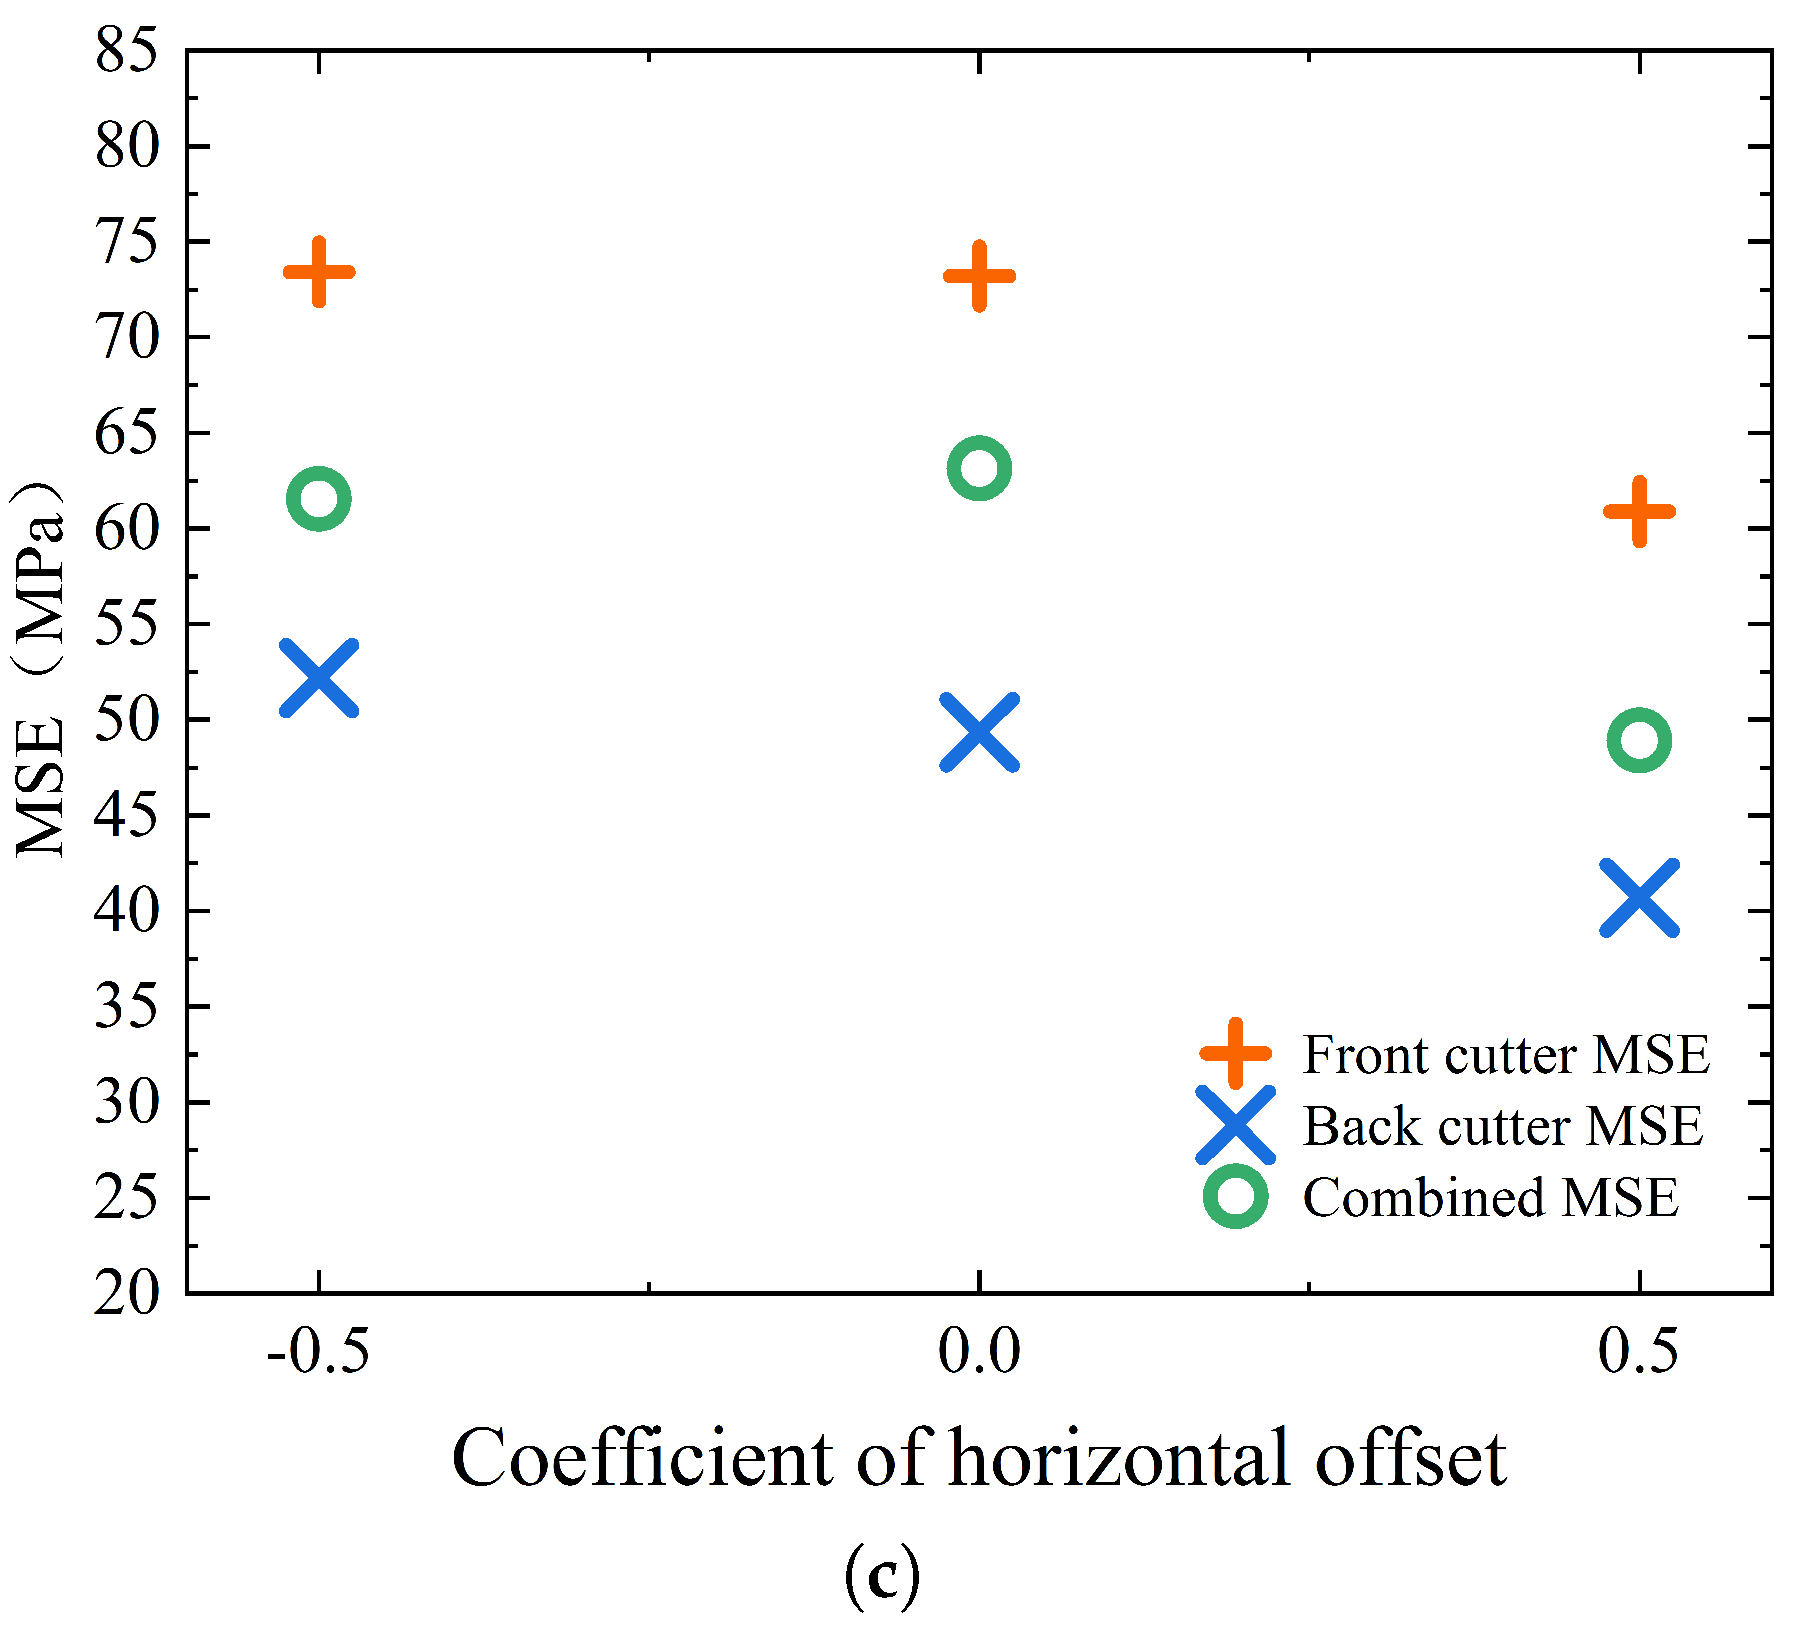
Figure 13a–c, respectively, show the relationship between MSE and horizontal offset coefficient when the vertical offset coefficient is 0.1, 0.3, and 0.5. The analysis shows that under the three vertical offset coefficients, the combined MSE mostly remains unchanged when the horizontal offset coefficient is between −0.5 and 0.0. The combined specific work decreases significantly when the horizontal offset coefficient ranges from 0.0 to 0.5.
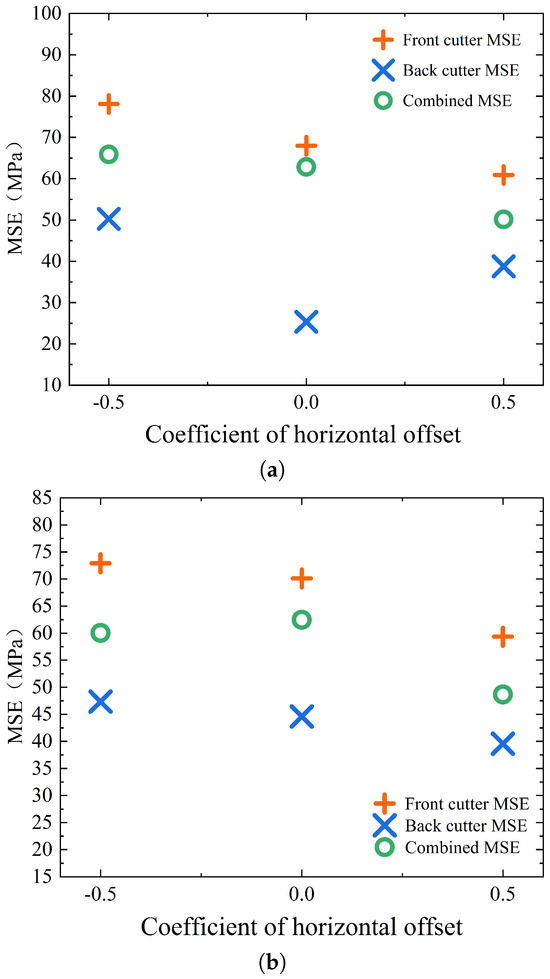
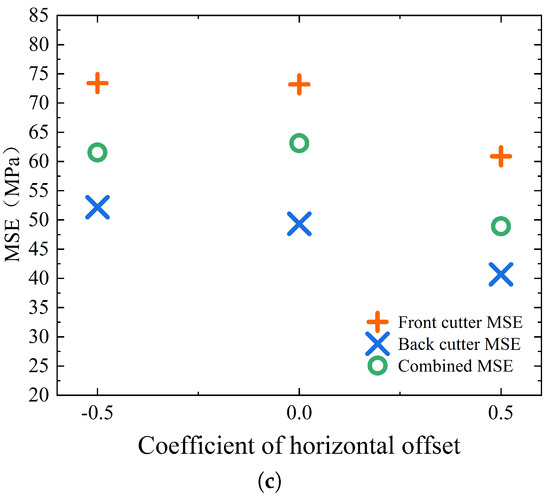
Figure 13.
Effect of horizontal offset on MSE when the vertical offset coefficient is, respectively, 0.1 (a), 0.3 (b) and 0.5 (c).
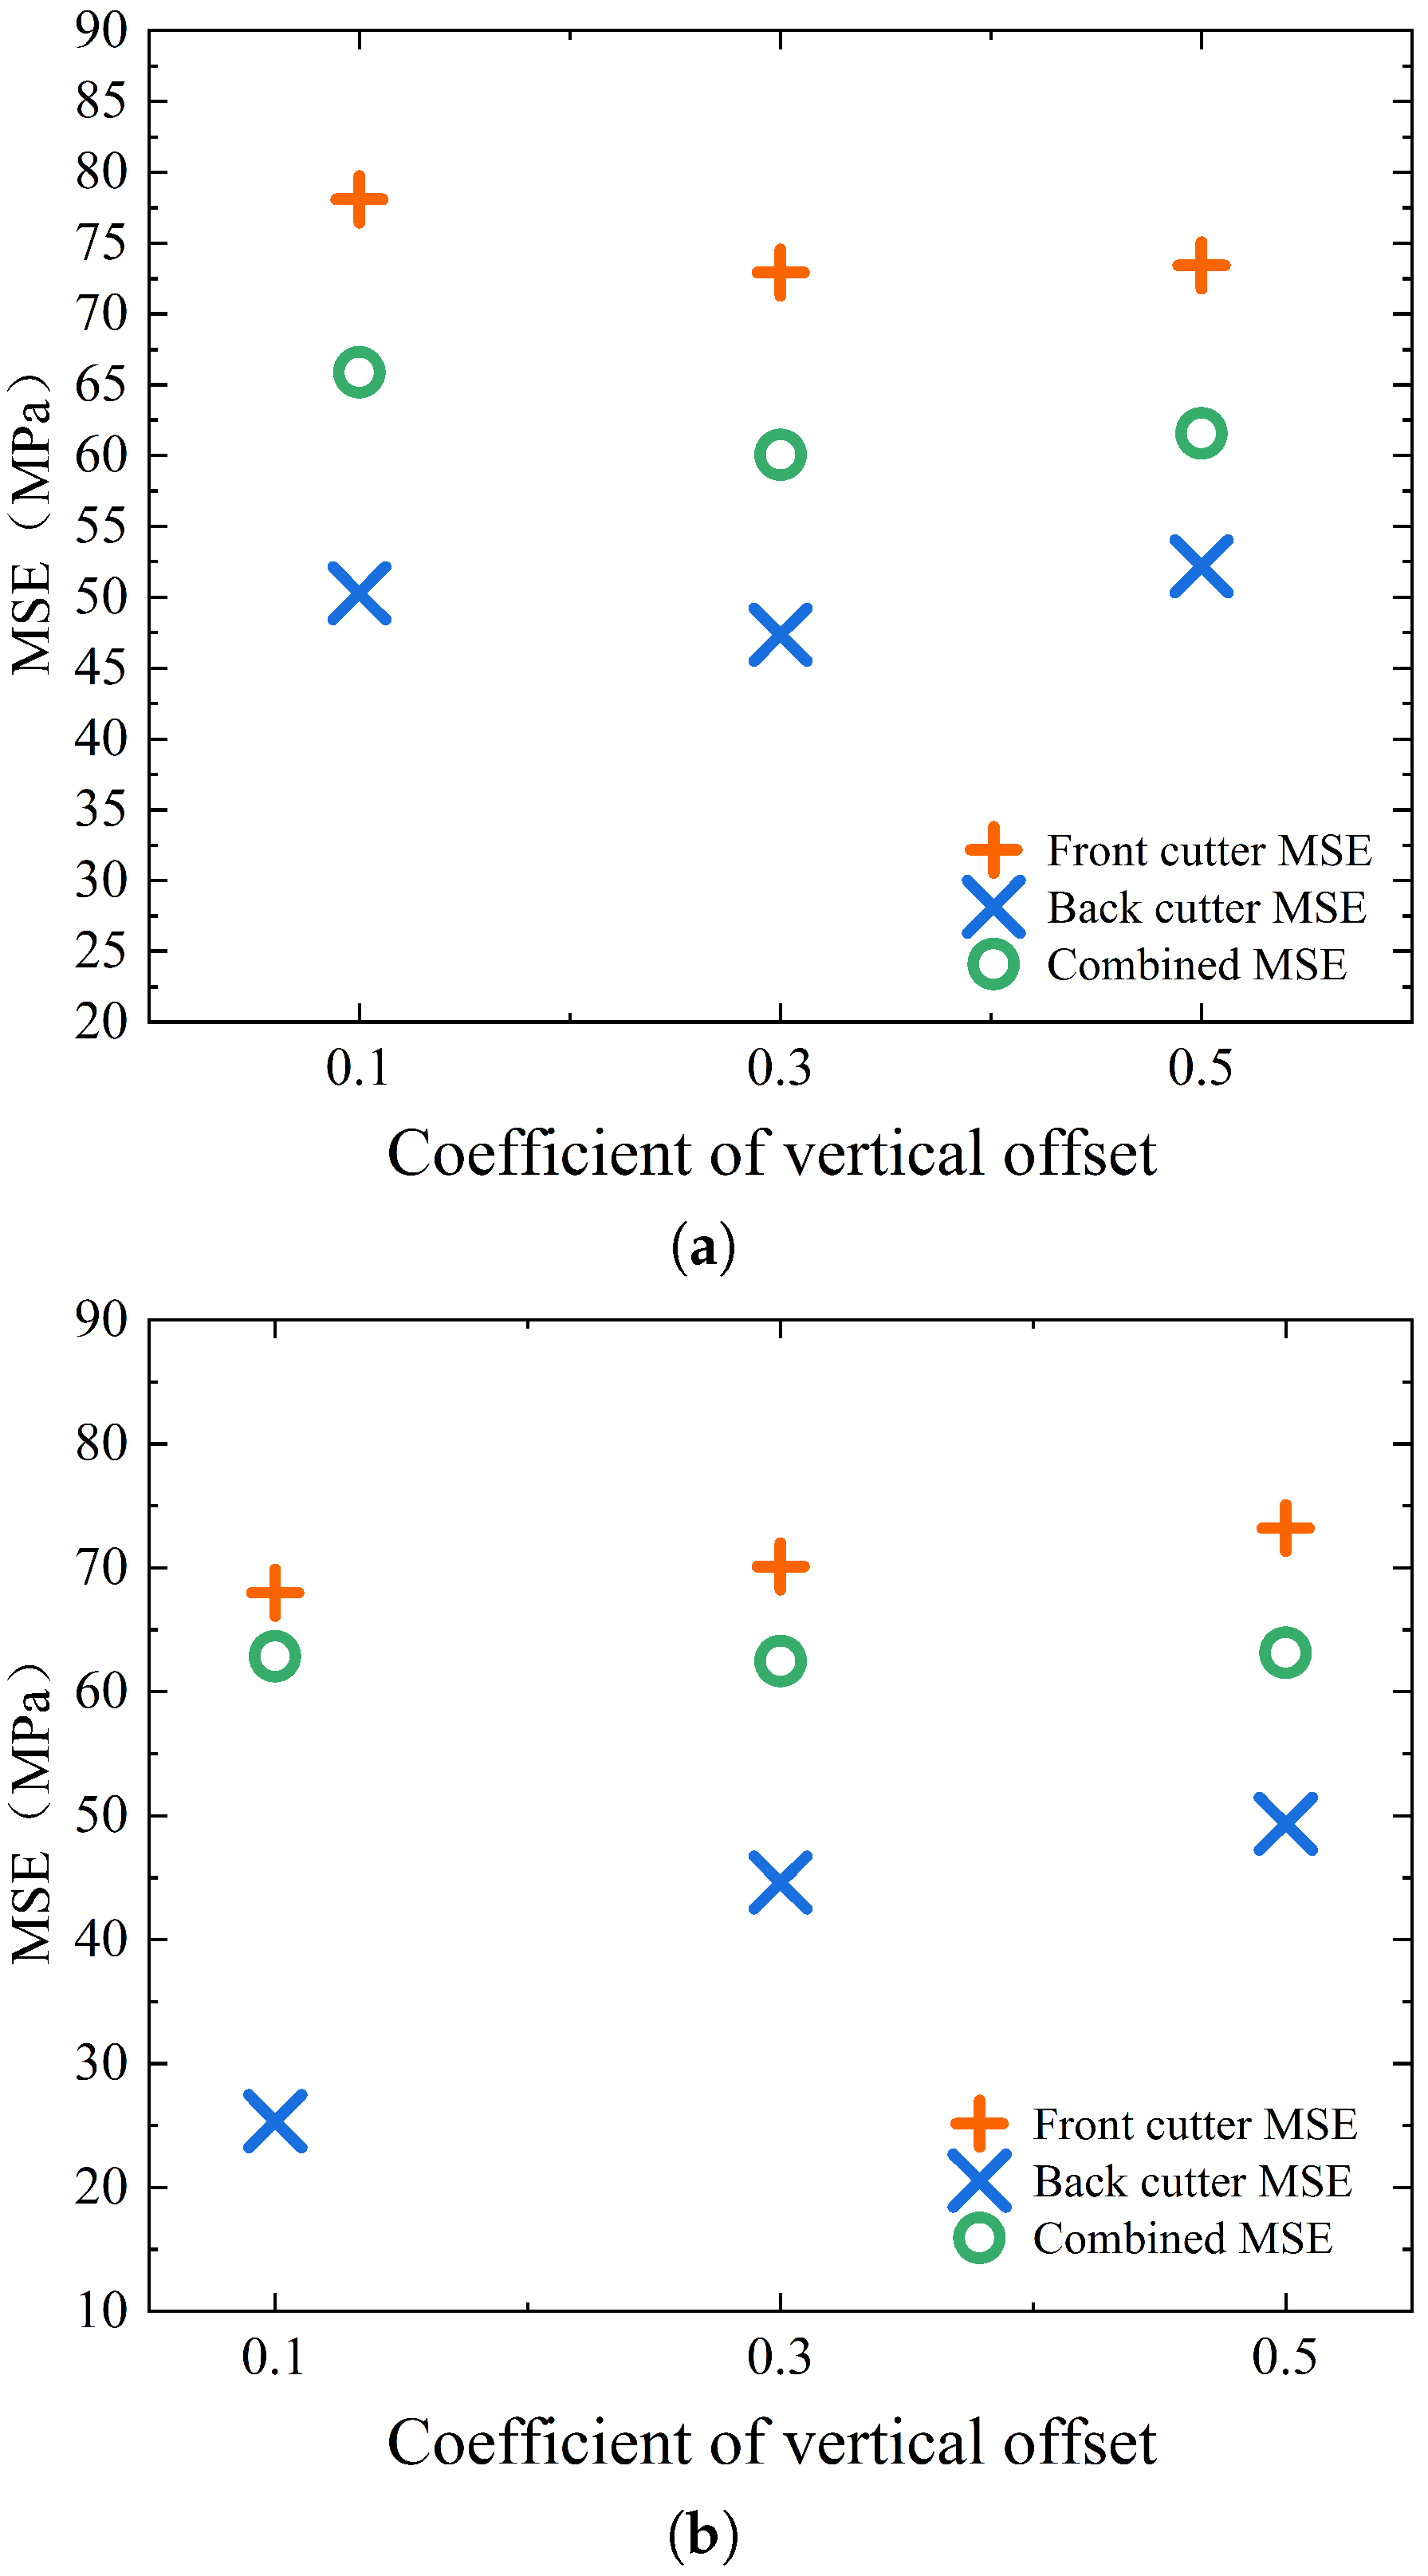
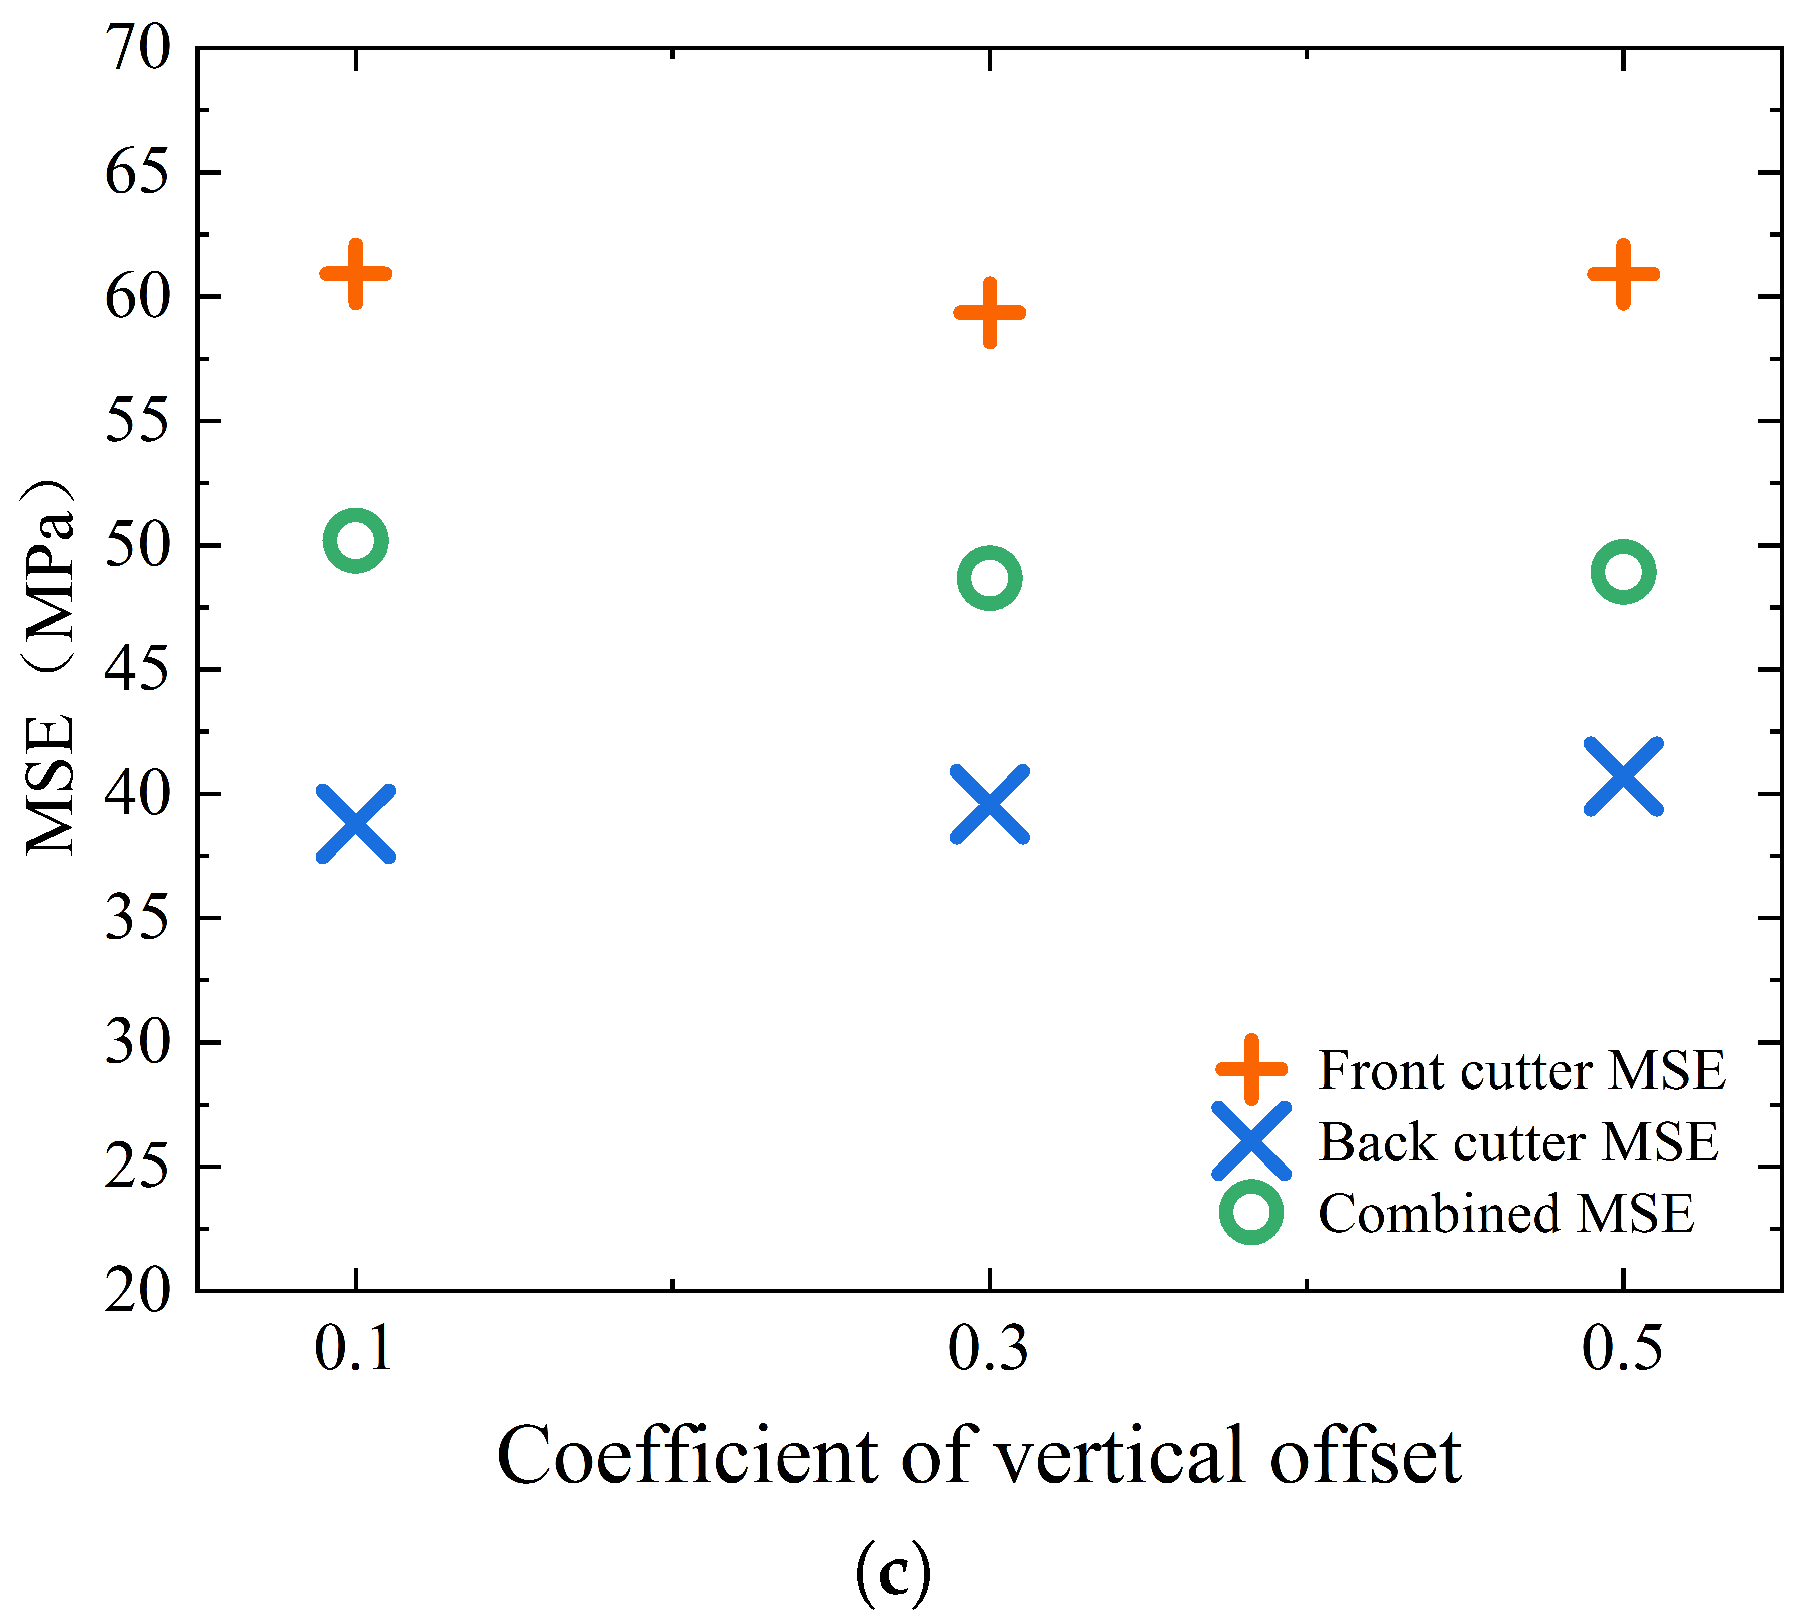
Figure 14a–c, respectively, show the relationship between MSE and vertical offset coefficient when the horizontal offset coefficient is −0.5, 0.0, and 0.5. It can be found that the vertical offset coefficient has a minor effect on the MSE and does not change mainly with the shift of the vertical offset coefficient. Only when the horizontal offset coefficient is −0.5 (Figure 14a) does the MSE value change significantly with the vertical offset coefficient. The minimum value is obtained when the vertical offset coefficient is 0.3.
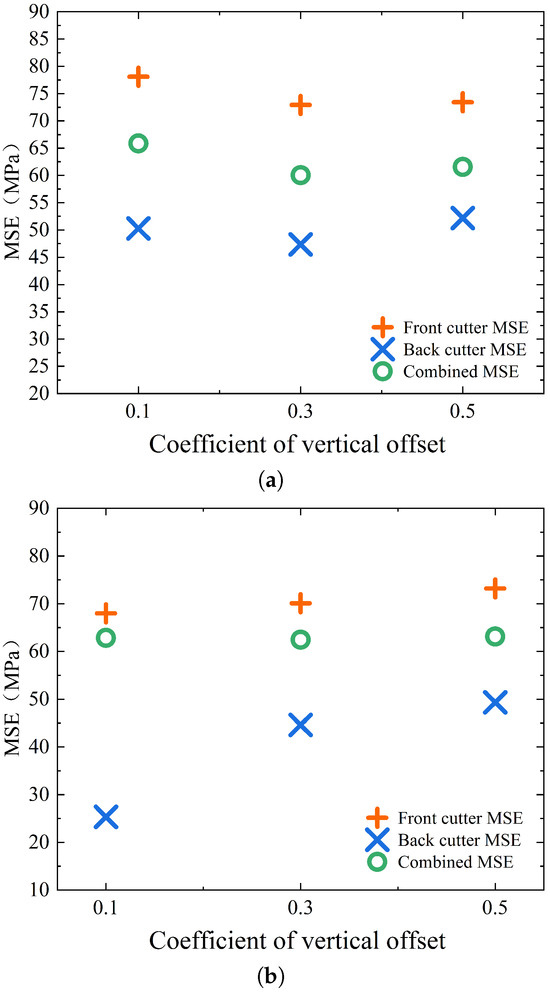
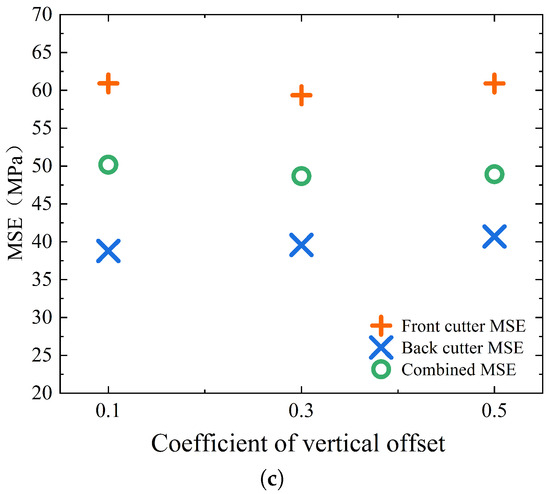
Figure 14.
Effect of vertical offset on MSE when the horizontal offset coefficient is −0.5 (a), 0.0 (b) and 0.5 (c).
3.3. Layout Optimization for the Dual-Cutters
3.3.1. Relationships between the Offset and MSE Based on Response Surface Methodology
The effects of horizontal and vertical offset on the rock-breaking MSE have been summarized phenomenologically in the previous sections. However, the inherent mathematical relation between them has not yet been investigated. The response surface methodology (RSM) here is applied to further explore the mathematical relationship between the MSE and the horizontal as well as vertical offsets.
Response surface methodology (RSM) is a statistical method to create an approximate pattern of complex phenomena using sampling points in the design space based on an improved stochastic process. By constructing a hyperbolic model of continuous variables, the main effects and interaction effects of different factors can be considered to find the quantitative law between the test index and each factor and determine the optimal range of test levels [38]. Compared with other test methods, the response surface method has the advantage that it can obtain better results through fewer test times and reduce the input of time and material resources [39]. Response surface methodology is also helpful in dealing with the problem of a multi-variable fitting process [40]. According to the results analyzed in Section 3.2, the horizontal and vertical offset coefficients of the drill cutter were selected as the test factors, and the MSE of rock breaking was selected as the response value. A two-factor and three-level (shown in Table 3) response surface test was designed, and the determined test factors and levels are shown in Table 4.
Table 3.
Offset coefficient and their range.
Table 4.
Experimental results of the response characteristics.
Table 5 gives the response surface variance analysis result. As can be observed, the p-value of the response surface test designed this time is 0.0003 < 0.05, indicating that it has reached a significant level and has statistical significance. The model fit is shown to be acceptable, and the experimental design is reasonable.
Table 5.
Response surface variance analysis.
Based on the results in Table 5, the data was analyzed, and the test factors and response values were fitted by quadratic multinomial regression. The regression equation for this test is given in the following equation:
where is MSE, variable A is the vertical offset coefficient, and variable B is the horizontal offset coefficient. The Equation (25) could be visualized and displayed as in Figure 15 below.
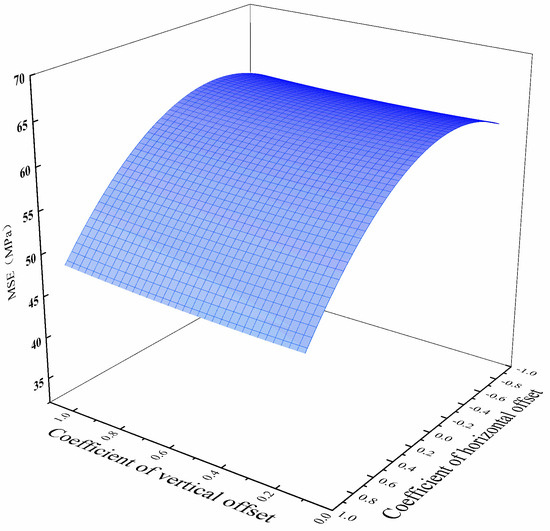
Figure 15.
Surface diagram of MSE in relation to horizontal and vertical offset coefficients.
3.3.2. Cutter Layout Optimization through Gray Wolf Algorithm
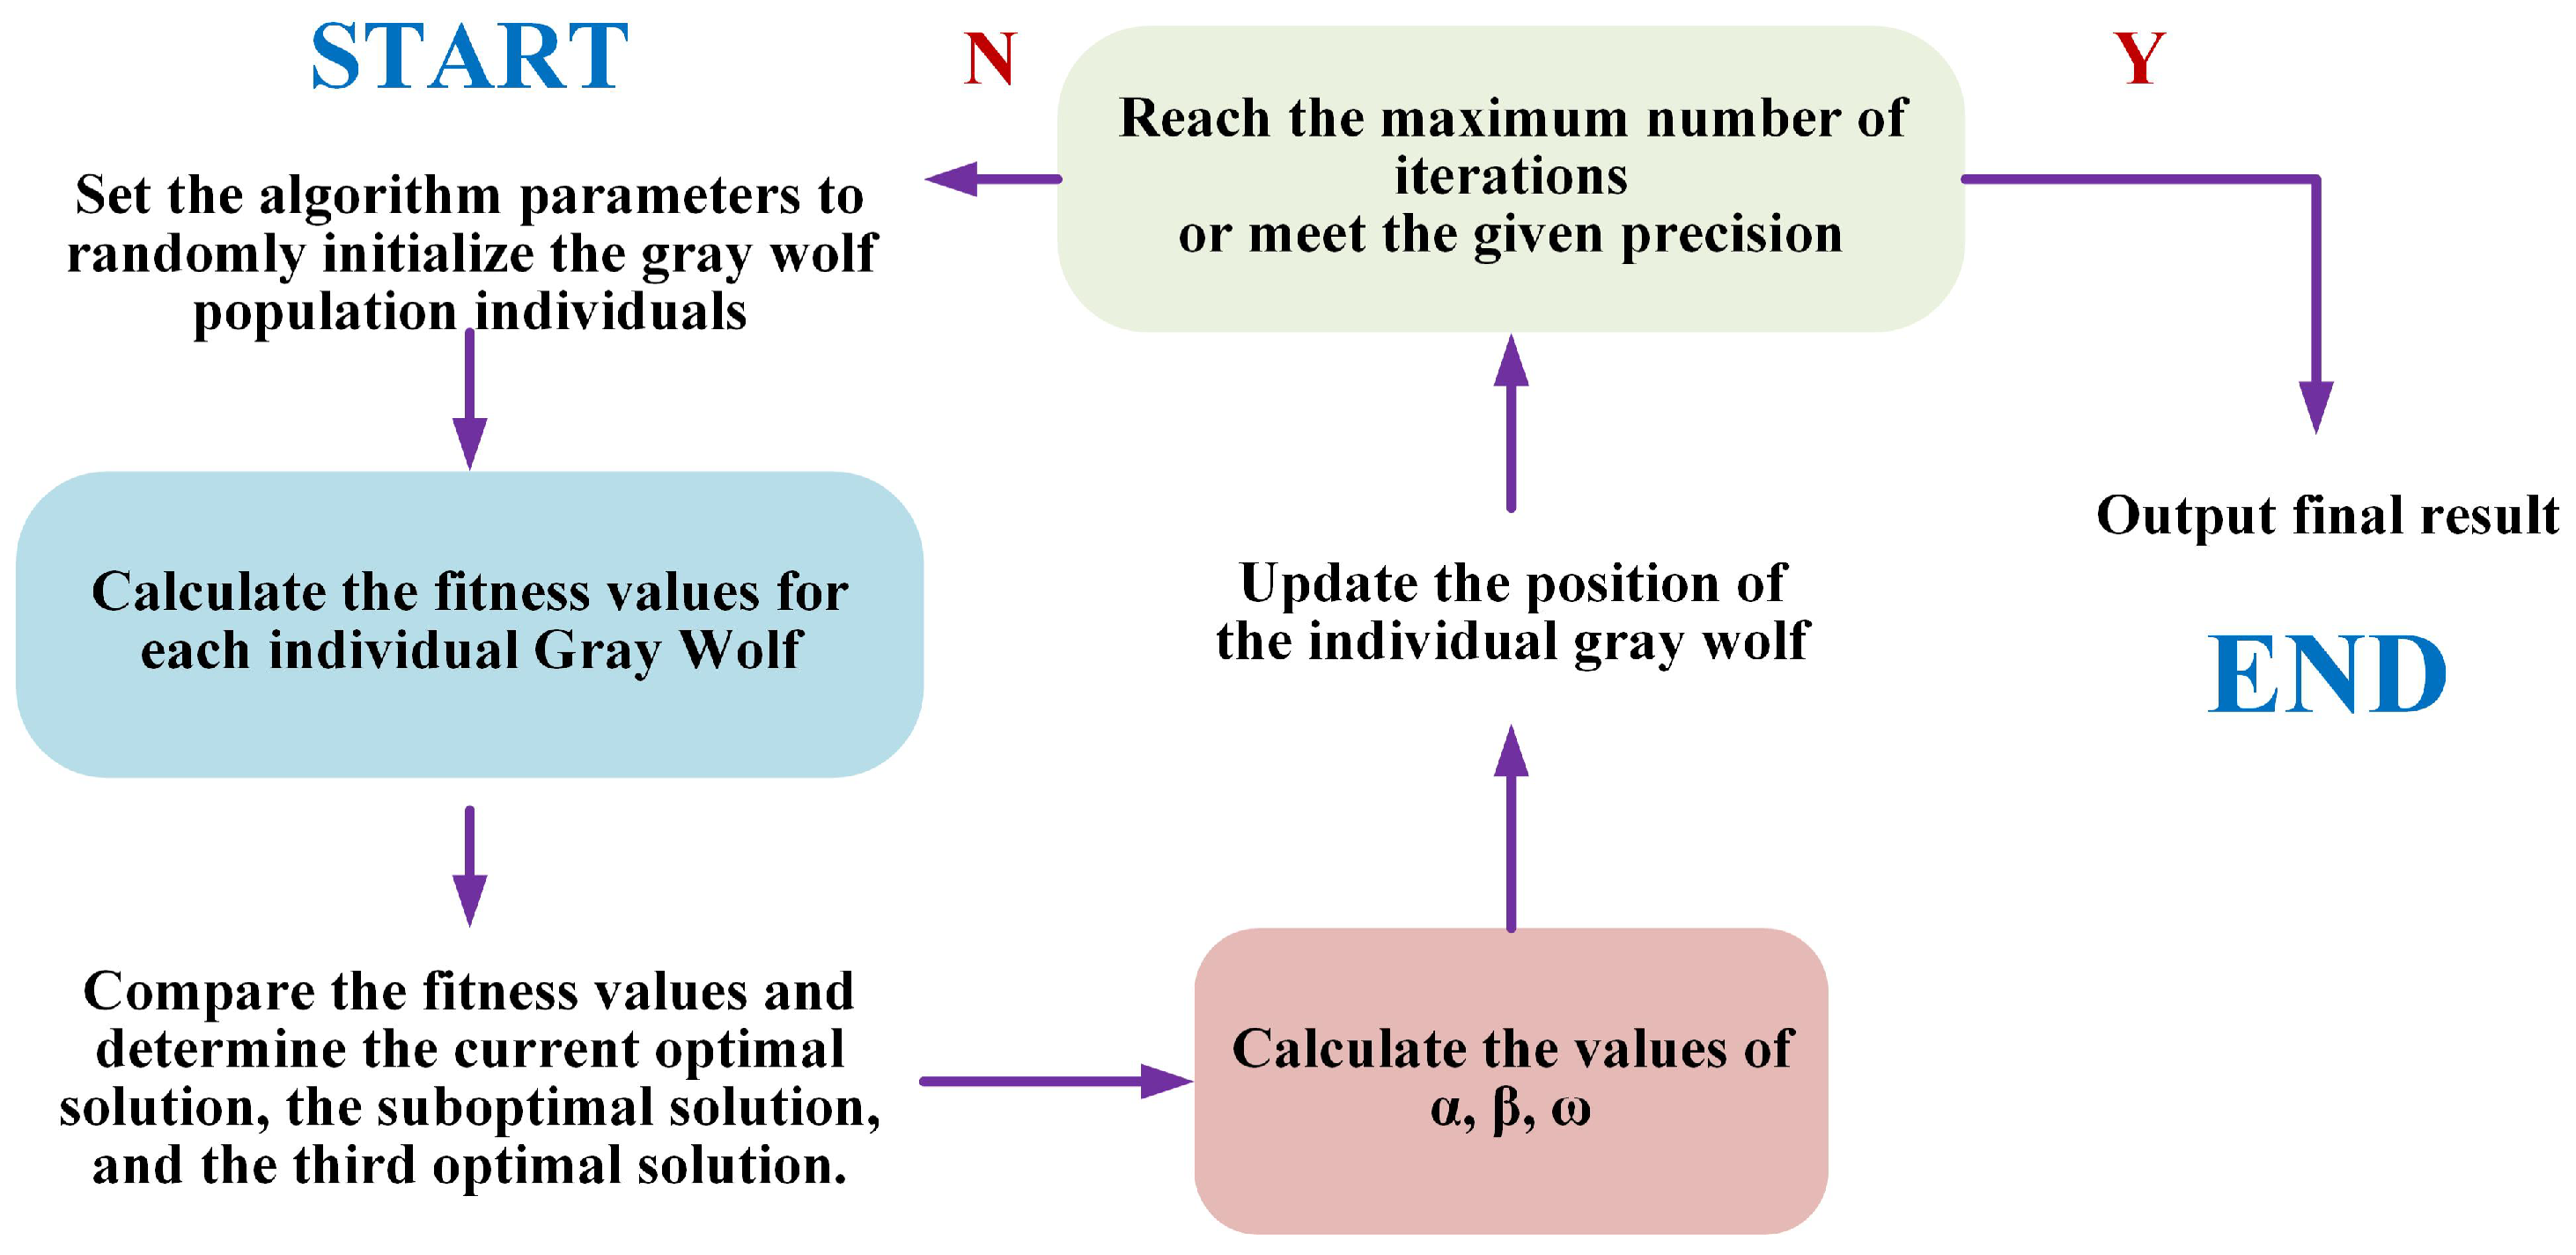
The Gray Wolf optimization algorithm, which models the wild predation behavior of the gray wolf population, is a population-wise optimization algorithm. By extracting characteristics of wolf pack activities and behaviors, individual members of the wolf pack can be divided into alpha wolves, beta wolves, and wolves, which are subordinate to and levels, and the hunting of gray wolves is divided into finding, tracking and approaching prey when hunted and surrounded, the prey ceases to move. The algorithm flow is shown in Figure 16 below.
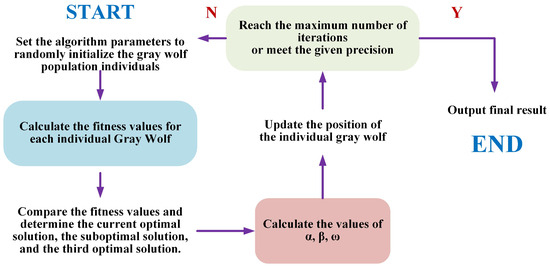
Figure 16.
Gray Wolf Algorithm optimization flow chart.
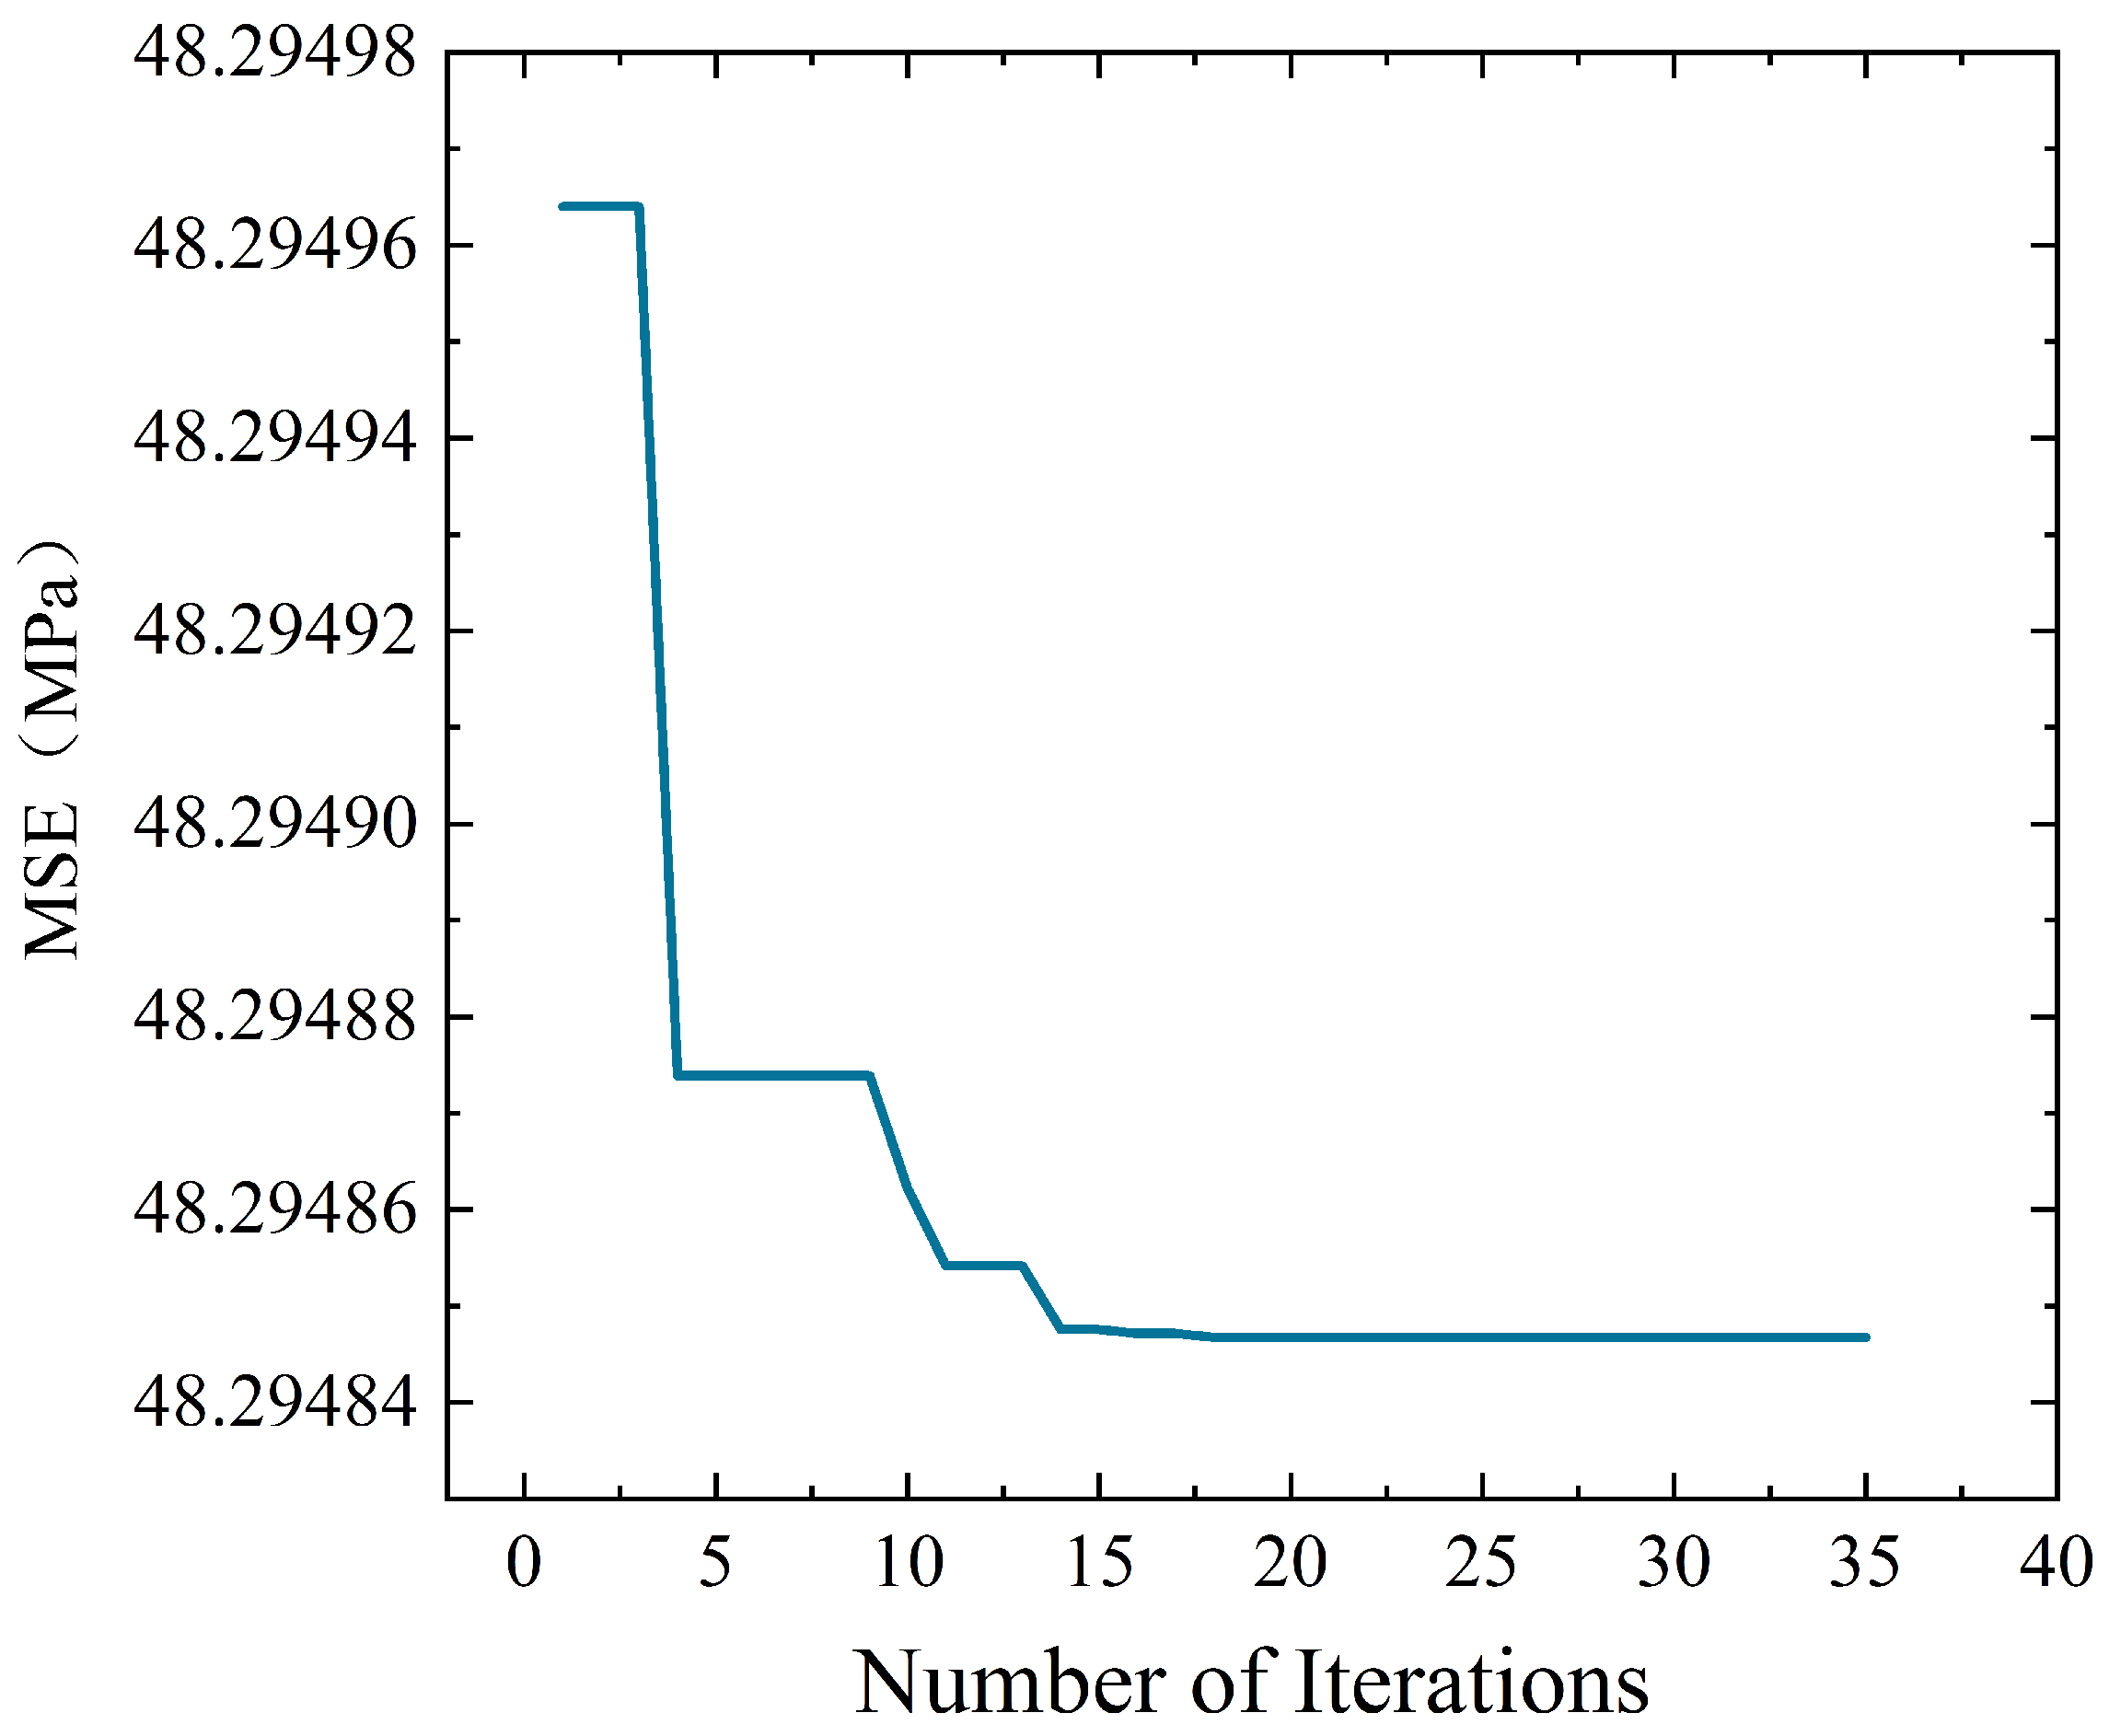
As shown in Figure 17, the curve of MSE values approaches the level after about 20 iterations, indicating that the optimal value has been reached by this time. The optimal parameters are given in Table 6. The optimal vertical offset coefficient is 0.641, and the optimal horizontal offset coefficient is 0.497.
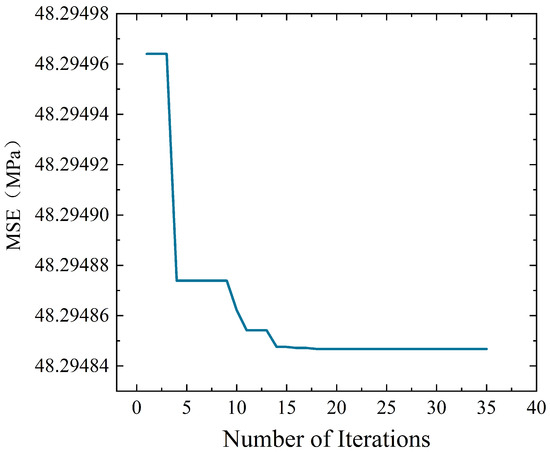
Figure 17.
Graph of number of iterations.
Table 6.
Optimized offset coefficient and their ranges.
3.3.3. Comparison in Field Tests
Based on the above optimized results, a new type of drill bit with a dual-cutter was developed and applied for three adjacent wells, namely Wells A, B, and C. These wells are located on the Shaximiao Formation [41] and Shaximiao–Liangshan Formation [42] in Sichuan, China. Field tests were carried out in Well A by our cooperative company by comparing it with its former single-cutter bit. Other conditions are barely the same except for the drill bit. Only a qualitative comparison could be made here based on the data we could obtain. Some other details are not available due to the requirement for confidentiality.
The ROP (Rate of penetration) is used to compare the performance. The drilling tools were lowered into the well and drilled according to conventional drilling methods, and the drilling footage and mechanical drilling speed were recorded during the test. The drilling footage was obtained by measuring the total length of the drilling tools lowered into the well. In addition, the ROP, namely the mechanical drilling speed, could be calculated as the footage per unit of time. Figure 18 gives the ROPs between wells. The first run of the second drilling in Well B is located in the interval of 1998–2623 m at the Shaximiao Formation. The single trip penetration is 625 m. The average ROP in the directing stage was obtained as 5.42 m/h, and the average ROP in the whole well was 6 m/h. Additionally, the first run of the second drilling of Well C is located in the depth range of 2008–2466 m at the Shaximiao Formation, with a single run penetration of 458 m. The average ROP in the Shaximiao formation is 7.54 m/h, and the average ROP of the whole well interval is 8.04 m/h. Comparatively, the first run of the second drilling in Well A is located in the depth range of 1964 m to 2320 m at the Shaximiao–Lianggaoshan Formation. The single run penetration is 356 m. The average ROP was calculated as 22 m/h, and the averaged ROP in Shaximiao Formation is 23 m/h.
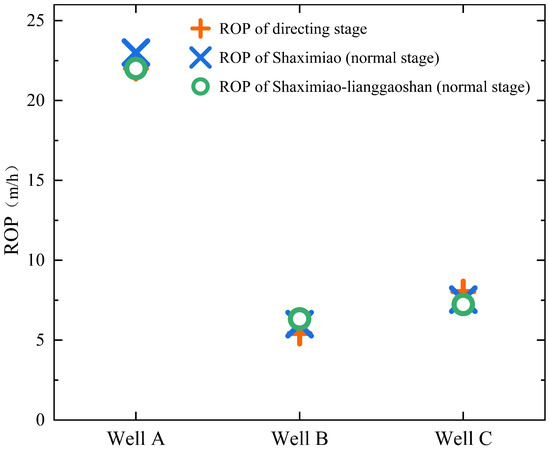
Figure 18.
Comparison of ROP between wells with different drill bits.
In general, the ROP in the tested Well A increased by 248% compared with the averaged ROP in the adjacent Well B (6.33 m/h) and raised by 204% in comparison to the ROP of the adjacent Well C (7.23 m/h). Therefore, it could be judged that the designed drill bit with a dual-cutter has better rock-breaking efficiency.
3.4. Advantages of the Dual-Cutter Cutting
The dual-cutter has advantages compared to a single-cutter drill bit. The foregoing study shows that after cutting, the front cutter will produce grooves on the rock surface, and a specific range of residual plastic deformation zones will occur surrounding the grooves. The groove will allow the stress of the rock surface to be redistributed under the effect of the liquid pressure and the confining pressure, resulting in the initial stress in this section of the rock being less than that in other areas. This area will shatter more readily due to the combination of the residual plastic deformation zone and the low-stress zone around the groove. When the back cutter cuts, its cutting path will partially overlap with the front cutter, which allows the back cutter to cut to the fragile region generated by the front cutter, increasing rock-breaking efficiency. For the rock crushing mode, the rock is mainly damaged by brittleness when the dual-cutter cuts and the rock debris formed is large; during single-cutter cutting, plastic failure happens mostly for the rock, and the cuttings are mainly small pieces and powder cuts. The energy is mostly used in the deformation of the rock in the case of plastic failure, whereas the energy is primarily wasted in the creation of fractures in the case of brittle failure. The varied energy consumption modalities also influence the length of the cracks created by brittle failure and efficiency. Dual-cutter cutting takes full advantage of the residual plastic deformation area and low-stress area. Brittle failure is dominant for the rock. In this way, the drilling efficiency and speed are improved.
There are still some shortcomings and limitations in the present study. It does not take into account the side angle of the front and back cutter, and the effect of repeated fragmentation of cuttings is not considered. Nevertheless, further research may be carried out on these issues.
4. Conclusions
In this work, finite element analysis has been employed to investigate the rock drilling process of a dual-cutter drill bit. The damage evolution of solid and cohesive units was introduced to accurately model the formation of cracks and cuttings during rock fracture. The model was verified by comparing the simulated Brazilian disc test with the actual experiments. The rock-breaking process of dual-cutter cutting and single-cutter cutting was studied, and the difference between the two rock-breaking modes was compared. The effects of horizontal and vertical offsets on the MSE of the back cutters were explored. Mathematical relations were quantitatively analyzed using the response surface method. Fitting functions were obtained between the horizontal and vertical offset coefficients and the MSE. The optimal horizontal and vertical offset coefficients for MSE minimum are obtained. The following conclusions can be drawn:
- (1)
- By comparing the results of the simulated and actual Brazilian disk tests, it turns out that the modeling method of global insertion of zero-thickness cohesive elements between solid elements can simulate rock failure nicely. According to the test results, the forms of rock crack initiation and expansion in the simulated experiment are consistent with the actual results, and the error of the obtained rock stress–strain curve is also minor (less than ) with the actual results. In general, the accuracy of this modeling approach is sufficient for applications in the field of fracture, and it can be applied to simulate fracture processes.
- (2)
- During the cutting of dual-cutters, the rock-breaking process of the front cutter is similar to that of the single-cutter, which forms a brittle failure area on the surface, and a plastic failure area is formed at a certain distance from the surface. However, when the back cutter cuts, the groove formed by the front cutter changes the stress state of the rock surface, and the rock near the groove also produces residual plastic strain. The two work together, and when the back cutter cuts along the spine in the middle of the two grooves, there will be a significant crack through the surface, forming large pieces of rock debris, while the brittle damaged area is more extensive. This cutting mode can considerably reduce the cutting force and energy consumption of the cut, improving the energy utilization of the rock-breaking process and its efficiency.
- (3)
- In the numerical simulation of the influence of different vertical and horizontal offset coefficients of the cutter after the study, the shift of the vertical offset coefficient has a minor influence on the combined specific work of rock breaking. The MSE changes significantly with the vertical offset coefficient only when the horizontal offset coefficient is , and the minimum value is obtained when the vertical offset coefficient is . The horizontal offset coefficient has an apparent effect on the MSE. The joint-specific work is unchanged when the vertical coefficient is constant and the horizontal offset coefficient is from to . However, when the horizontal offset coefficient is from to , the combined specific work decreases significantly, from 50–65 MPa to 50–60 MPa.
- (4)
- The response surface method has been employed to bond the offset coefficients and MSE. Additionally, the Gray Wolf algorithm was applied to optimize the offsets to obtain a minimum MSE. The optimal combination of offset coefficients: for vertical and for horizontal.
Author Contributions
Conceptualization, J.H. and J.L.; methodology, J.H. and J.L.; software, J.H.; validation, Y.H. and J.H.; formal analysis, J.H.; investigation, J.H.; resources, Q.X.; data curation, J.H., J.L., Y.H. and L.Q.; writing—original draft preparation, J.H.; writing—review and editing, Q.X.; visualization, J.H., Y.H., Q.X. and J.L.; supervision, Q.X.; project administration, Q.X. and L.Q.; funding acquisition, L.Q. All authors have read and agreed to the published version of the manuscript.
Funding
This research received funding from the development program of Hubei Province “Research on Intelligent High Temperature Resistant Rotary Steerable Bit and Supporting Well Control Technology (No. 2021BAA053)”, National Natural Science Foundation of China (No. 52178063) and Key Research and National Key Laboratory of Shale Oil and Gas Enrichment Mechanism and Effective Development (No. 20-YYGZ-KF-GC-16).
Data Availability Statement
The authors confirm that the data supporting the findings of this study are available within the article.
Conflicts of Interest
The authors declare no conflict of interest.
References
- Qiu, T.; Feng, J.; Cai, B.; Fan, G.; Zhang, W.; Liu, Y. Microstructural Evolution of Diamond-Based Composites at High Temperature and High Pressure. Materials 2022, 15, 8753. [Google Scholar] [CrossRef] [PubMed]
- Zuo, R.Q. International advancement of drilling bits for oil and gas well (4)-PDC bits progress and present trend (I). Explor. Eng. (Rock Soil Drill. Tunneling) 2016, 43, 40–48. [Google Scholar]
- Peng, N.; Ma, T.; Zhu, G.; Su, Q. Anti-drilling ability of Ziliujing conglomerate formation in Western Sichuan Basin of China. Petroleum 2023, 9, 41–52. [Google Scholar] [CrossRef]
- Dougherty, P.S.M.; Pudjoprawoto, R.; Fred Higgs, C. Bit cutter-on-rock tribometry: Analyzing friction and rate-of-penetration for deep well drilling substrates. Tribol. Int. 2014, 77, 178–185. [Google Scholar] [CrossRef]
- Negm, S.; Aguib, K.; Karuppiah, V.; ElOufy, M.; Remah, M.; Zayyan, M.; Sheikh, O.E. The Disruptive Concept of 3D Cutters and Hybrid Bits in Polycrystalline Diamond Compact Drill-bit Design. In Proceedings of the SPE Abu Dhabi International Petroleum Exhibition and Conference, Abu Dhabi, United Arab Emirates, 7–10 November 2016; SPE-183335-MS. pp. 1–10. [Google Scholar]
- Hsieh, L.; Endress, A. Better and better, bit by bit/New drill bits utilize cutting structures, cutter element shapes, advanced modeling to increase ROP, control, durability. Drill. Contract. 2015, 71, 48–60. [Google Scholar]
- Yahiaoui, M.; Gerbaud, L.; Paris, J.Y.; Denape, J.; Dourfaye, A. A study on PDC drill bits quality. Wear 2013, 298–299, 32–41. [Google Scholar] [CrossRef]
- Perneder, L.; Detournay, E.; Downton, G. Bit/rock interface laws in directional drilling. Int. J. Rock Mech. Min. Sci. 2012, 51, 81–90. [Google Scholar] [CrossRef]
- Halliburton. New Halliburton Drill Bit Optimizes Cutter Layout for Increased Durability and Drilling Speed. Available online: https://drilling-contractor.org/new-halliburton-drill-bit-optimizes-cutter-layout-increased-durability-drilling-speed-46374 (accessed on 20 August 2023).
- Pryhorovska, T.O.; Chaplinskiy, S.S.; Kudriavtsev, I.O. Finite element modelling of rock mass cutting by cutters for PDC drill bits. Pet. Explor. Dev. 2015, 42, 888–892. [Google Scholar] [CrossRef]
- Zhang, Z.; Zhao, D.; Zhao, Y.; Zhou, Y.; Tang, Q.; Han, J. Simulation and experimental study on temperature and stress field of full-sized PDC bits in rock breaking process. J. Pet. Sci. Eng. 2020, 186, 106679. [Google Scholar] [CrossRef]
- Zeuch, D.H.; Finger, J.T. Rock Breakage Mechanisms with a PDC Cutter. In Proceedings of the SPE Annual Technical Conference and Exhibition, Presented at the SPE Annual Technical Conference and Exhibition, Society of Petroleum Engineers, Las Vegas, NV, USA, 22–26 September 1985. [Google Scholar]
- Swenson, D.V.; Wesenberg, D.L.; Jones, A.K. Analytical and Experimental Investigations of Rock Cutting Using PDC Drag Cutters. In Proceedings of the the SPE Annual Technical Conference and Exhibition, San Antonio, TX, USA, 4–7 October 1981. [Google Scholar]
- Zeuch, D.H.; Finger, J.T. Rock Breakage Mechanisms with a PDC Cutter. In Proceedings of the All Days, SPE, Las Vegas, NV, USA, 22 September 1985. SPE-14219-MS. [Google Scholar]
- Rojek, J.; Oñate, E.; Labra, C.; Kargl, H. Discrete element simulation of rock cutting. Int. J. Rock Mech. Min. Sci. 2011, 48, 996–1010. [Google Scholar] [CrossRef]
- Loui, J.P.; Rao Karanam, U.M. Numerical Studies on Chip Formation in Drag-Pick Cutting of Rocks. Geotech. Geol. Eng. 2012, 30, 145–161. [Google Scholar] [CrossRef]
- Jaime, M.C.; Zhou, Y.; Lin, J.-S.; Gamwo, I.K. Finite element modeling of rock cutting and its fragmentation process. Int. J. Rock Mech. Min. Sci. 2015, 80, 137–146. [Google Scholar] [CrossRef]
- Menezes, P.L.; Lovell, M.R.; Avdeev, I.V.; Lin, J.S.; Higgs, C.F. Studies on the formation of discontinuous chips during rock cutting using an explicit finite element model. Int. J. Adv. Manuf. Technol. 2014, 70, 635–648. [Google Scholar] [CrossRef]
- Yang, D.; Li, J.; Wang, L.; Gao, K.; Tang, Y.; Wang, Y. Experimental and theoretical design for decreasing wear in conical picks in rotation-drilling cutting process. Int. J. Adv. Manuf. Technol. 2015, 77, 1571–1579. [Google Scholar] [CrossRef]
- Zhang, X.P.; Ji, P.Q.; Liu, Q.S.; Liu, Q.; Zhang, Q.; Peng, Z.H. Physical and numerical studies of rock fragmentation subject to wedge cutter indentation in the mixed ground. Tunn. Undergr. Space Technol. 2018, 71, 354–365. [Google Scholar] [CrossRef]
- Lundqvist, O.G.S.; Chauhan, M. A Plane-Stress Plasticity Model for Masonry for the Explicit Finite Element Time Integration Scheme. RakMek 2020, 53, 240–258. [Google Scholar] [CrossRef]
- Zhao, J.; Xiao, M.; Chen, J.; Li, D. Explicit Dynamic DDA Method Considering Dynamic Contact Force. Shock Vib. 2016, 2016, 7431245. [Google Scholar] [CrossRef]
- Yang, Y.; Zhang, C.; Lin, M.; Chen, L. Research on rock-breaking mechanism of cross-cutting PDC bit. J. Pet. Sci. Eng. 2018, 161, 657–666. [Google Scholar] [CrossRef]
- Liu, W.; Qian, X.; Li, T.; Zhou, Y.; Zhu, X. Investigation of the tool-rock interaction using Drucker-Prager failure criterion. J. Pet. Sci. Eng. 2019, 173, 269–278. [Google Scholar] [CrossRef]
- Wang, W.; Liu, G.; Li, J.; Zha, C.; Lian, W. Numerical simulation study on rock-breaking process and mechanism of compound impact drilling. Energy Rep. 2021, 7, 3137–3148. [Google Scholar] [CrossRef]
- Yao, Y. Linear Elastic and Cohesive Fracture Analysis to Model Hydraulic Fracture in Brittle and Ductile Rocks. Rock Mech. Rock Eng. 2012, 45, 375–387. [Google Scholar] [CrossRef]
- Wang, H. Numerical modeling of non-planar hydraulic fracture propagation in brittle and ductile rocks using XFEM with cohesive zone method. J. Pet. Sci. Eng. 2015, 135, 127–140. [Google Scholar] [CrossRef]
- Zhou, W.; Tang, L.; Liu, X.; Ma, G.; Chen, M. Mesoscopic simulation of the dynamic tensile behaviour of concrete based on a rate-dependent cohesive model. Int. J. Impact Eng. 2016, 95, 165–175. [Google Scholar] [CrossRef]
- Anemangely, M.; Ramezanzadeh, A.; Behboud, M.M. Geomechanical parameter estimation from mechanical specific energy using artificial intelligence. J. Pet. Sci. Eng. 2019, 175, 407–429. [Google Scholar] [CrossRef]
- Al-Sudani, J.A. Real-time monitoring of mechanical specific energy and bit wear using control engineering systems. J. Pet. Sci. Eng. 2017, 149, 171–182. [Google Scholar] [CrossRef]
- Badrouchi, F.; Rasouli, V.; Badrouchi, N. Impact of hole cleaning and drilling performance on the equivalent circulating density. J. Pet. Sci. Eng. 2022, 211, 110150. [Google Scholar] [CrossRef]
- Najjarpour, M.; Jalalifar, H.; Norouzi-Apourvari, S. Fifty years of experience in rate of penetration management: Managed pressure drilling technology, mechanical specific energy concept, bit management approach and expert systems—A review. J. Pet. Sci. Eng. 2022, 208, 109184. [Google Scholar] [CrossRef]
- Liu, Z.; Wu, W.; Hao, Q.; Sun, P.; Ding, Y. Theoretical and Experimental Study of the Effects of Impact Drilling Parameters on the Properties of Surrounding Rock Damage. Shock Vib. 2020, 2020, 8865619. [Google Scholar] [CrossRef]
- Li, Y.; Zhang, T.; Tian, Z.; Zheng, Y.; Yang, Z. Simulation on compound percussive drilling: Estimation based on multidimensional impact cutting with a single cutter. Energy Rep. 2021, 7, 3833–3843. [Google Scholar] [CrossRef]
- Xie, H.; Li, C.; He, Z.; Li, C.; Lu, Y.; Zhang, R.; Gao, M.; Gao, F. Experimental study on rock mechanical behavior retaining the in situ geological conditions at different depths. Int. J. Rock Mech. Min. Sci. 2021, 138, 104548. [Google Scholar] [CrossRef]
- Shams, G.; Rivard, P.; Moradian, O. Observation of Fracture Process Zone and Produced Fracture Surface Roughness in Granite under Brazilian Splitting Tests. Theor. Appl. Fract. Mech. 2023, 125, 103680. [Google Scholar] [CrossRef]
- Huang, J.; Zeng, B.; He, Y.; Wang, X.; Qian, L.; Xia, C.; Yi, X. Numerical study of rock-breaking mechanism in hard rock with full PDC bit model in compound impact drilling. Energy Rep. 2023, 9, 3896–3909. [Google Scholar] [CrossRef]
- Íñiguez-Macedo, S.; Lostado-Lorza, R.; Escribano-García, R.; Martínez-Calvo, M.Á. Finite Element Model Updating Combined with Multi-Response Optimization for Hyper-Elastic Materials Characterization. Materials 2019, 12, 1019. [Google Scholar] [CrossRef] [PubMed]
- Qin, B.; Qin, W.; Lin, X.; Tang, S. Optimization of stamping process parameters of heat shield based on BBD design and response surface methodology. Autom. Manuf. Ind. 2015, 37, 57–60. [Google Scholar]
- Rodrigues, F.; Pelletier, L.G.; Rocchi, M.; Neiva, H.P.; Teixeira, D.S.; Cid, L.; Silva, L.; Monteiro, D. Trainer-exerciser relationship: The congruency effect on exerciser psychological needs using response surface analysis. Scand. J. Med. Sci. Sport. 2021, 31, 226–241. [Google Scholar] [CrossRef]
- Wang, Q.; Chen, D.; Wang, F.; Gao, X.; Zou, Y.; Tian, Z.; Li, S.; Chang, S.; Yao, D. Origin and distribution of an under-pressured tight sandstone reservoir: The Shaximiao Formation, Central Sichuan Basin. Mar. Pet. Geol. 2021, 132, 105208. [Google Scholar] [CrossRef]
- Peng, W.; Hu, G.; Wang, Y.; Liu, D.; Lv, Y.; Luo, X.; Chen, Z. Geochemical characteristics of light hydrocarbons and their influencing factors in natural gases of the Kuqa Depression, Tarim Basin, NW China. Geol. J. 2018, 2863, 2863–2873. [Google Scholar] [CrossRef]


Disclaimer/Publisher’s Note: The statements, opinions and data contained in all publications are solely those of the individual author(s) and contributor(s) and not of MDPI and/or the editor(s). MDPI and/or the editor(s) disclaim responsibility for any injury to people or property resulting from any ideas, methods, instructions or products referred to in the content. |
© 2024 by the authors. Licensee MDPI, Basel, Switzerland. This article is an open access article distributed under the terms and conditions of the Creative Commons Attribution (CC BY) license (https://creativecommons.org/licenses/by/4.0/).