Abstract
The shear strength characteristics and weakening effect of soils under freeze–thaw (FT) cycling are the key problems that should be solved to ensure the integrity of infrastructure construction in seasonally frozen soil areas. Thus far, however, the research on the mechanism of strength deterioration resulting from microstructural changes induced by FT cycles remains insufficiently comprehensive. To investigate the deterioration characteristics of the shear strength of seasonally frozen soils in FT cycles, a series of laboratory experiments were conducted using compacted silty clay subjected to a maximum of five closed-system FT cycles. The stress–strain curve, secant module, shear strength, and microscopic structure were measured for specimens before and after the FT cycles. The stress–strain curves of the unfrozen and thawed specimens demonstrated a strain-hardening behavior, indicating an increase in resistance to deformation. Moreover, the shear strength and secant modulus of the unfrozen specimen surpassed those of the thawed specimen significantly. As the number of FT cycles increased, there was a gradual decline observed in the strength, stiffness, cohesive properties, and internal friction angle of the thawed specimen. The nuclear magnetic resonance technique was employed to interpret the experimental findings. It was demonstrated that the micro-pores undergo continuous enlargement and transformation into medium-sized and large-sized pores, leading to FT deterioration. Based on the experimental results, a modified Duncan–Chang model was developed to simulate the mechanical behavior of compacted silty clay while considering the influence of FT cycles.
1. Introduction
The freeze–thaw (FT) phenomenon refers to the cyclic freezing and thawing of liquid water within a substance. It is commonly observed in regions with seasonally frozen soil [1,2,3]. With repeated FT cycles, the pore structure of soils undergoes significant transformations, compromising their mechanical behavior due to enhanced deterioration caused by the FT action. Consequently, this leads to substantial alterations in the bearing capacities of foundations [4,5,6,7,8,9]. The freeze–thaw problem of soils in engineering construction projects (such as highways, wind power, and high-speed railways) located in regions with seasonally frozen soil is a crucial factor that must be considered during the design phase, due to the higher deformation requirements involved [10,11,12]. Therefore, the study of soil’s mechanical behavior under FT cycling is highly significant.
The strength of soils under various freeze–thaw (FT) cycles has been a subject of extensive research across multiple disciplines for several decades, owing to its significance in soil behavior. Konrad [13] investigated the impact of freezing and thawing on the structure of clayey silt at different overconsolidation ratios, revealing that the overall void ratio of thawed soil can either increase in lightly overconsolidated soils or decrease in heavily overconsolidated soils. Simonsen [14] observed the resilient behavior of soil during freezing and thawing through triaxial compression tests with variable and constant confining pressures, thereby confirming a strong correlation between the measurement method employed and the resilient moduli. The stress–strain behavior curves of compacted fine-grained clay were found to be unaffected by the freeze–thaw process, as reported by Wang [15]. However, the number of freeze–thaw cycles significantly influenced both the resilient modulus and failure strength.
Qi [16] proposed that the modulus of silty soil consistently decreases following freeze–thaw cycles, while variations in the cohesion, soil density, and preconsolidation pressure were closely associated with the initial dry unit weight. Cui [17] conducted a comparative analysis on the dynamic characteristics of thawed soil and undisturbed soil, revealing an increase in the maximum dynamic stress after freezing and thawing. Han [18] focused on analyzing the impact of FT cycles on the shear characteristics of saline soil through unconsolidated-undrained triaxial compression tests. The results confirmed a steadily decreasing trend in shear strength with increasing FT cycles, indicating a close relationship between the observed mechanical behavior and dynamic evolutions of soil microstructure. Similar conclusions were drawn by Gao [19].
To comprehensively investigate the degradation mechanism of soil’s mechanical properties caused by freeze–thaw cycles, Chen [20] investigated the microscopic changes in soil pore structure after FT cycles from a microscopic perspective through mercury injection porosimetry (MIP) tests. The results revealed a decrease in volume of intra-aggregate pores and an increase in volume of inter-aggregate pores with increasing FT cycles. The nuclear magnetic resonance (NMR) technique was employed by Li [21] to explore the spatial distribution of sandstone pores following repeated freeze−thaw cycles, and found that the pore sizes increased, especially the small- and medium-sized pores. Zou [3] performed scanning electron microscopy (SEM) and MIP analyses to elucidate the microstructural evolution of a compacted clay during FT cycles, revealing the progressive development and expansion of cracks with increasing FT cycles. Li [9] studied the microstructure properties of soils after FT cycles by combining NMR and SEM technology. The results showed that under a low load, the FT action resulted in structural damage to the soil, leading to a loose pore structure characterized by cracks, while under a high load, the soil formed a dense pore structure. Apparently, the aforementioned studies’ results considerably revealed the strength characteristics of soil in response to FT cycling. To quantitatively analyze the strength characteristics of seasonally frozen soil and effectively evaluate the foundation stability, however, it is necessary to further study the mechanism of strength deterioration resulting from microstructural changes induced by FT cycles.
In this research, several triaxial compression and NMR tests were conducted on never-frozen and thawed silty soil, respectively. The geomechanical properties of silty soil subjected to FT cycles, including the stress–strain response, secant modulus, shear strength, and strength indexes (cohesion and internal friction angle), are systematically revealed. The variations in these properties with the number of FT cycles and the effective confining pressure are characterized. With the aid of NMR techniques, the mechanism of strength deterioration resulting from microstructural changes induced by FT cycles is elucidated. Particularly, based on the experimental results obtained in this research, a formulation for evaluating the shear strength of compacted silty clay considering the influence of FT cycles is proposed.
2. Materials and Methods
2.1. Materials
The soil utilized in this investigation was a natural silty clay sampled from Xilinhot, Nei Mongol Province, China. The grain size distribution curve of the tested soil is illustrated in Figure 1. According to the Unified Soil Classification System (USCS), the composition of the tested soil consisted of 57.5% quartz sand, 33.4% silt, and 9.1% clay. The tested soil has a specific gravity Gs of 2.69, a plastic limit of 13.11%, a liquid limit of 26.01%, and a plasticity index of 12.90. Ethylene glycol aqueous solution was employed as the confining and refrigerant fluid. The water used in this study was self-made distilled water with an electrical conductivity of 1.8 μs/cm.
Figure 1.
Grain size distribution of the tested soil.
2.2. Testing Procedures
This total experiment consisted of a triaxial compression test and an NMR test. The triaxial compression test is used for analyzing the strength characteristics of soil subjected to the FT cycles. The NMR test is adopted to reveal microstructural changes in soil corresponding to the FT cycles.
2.2.1. Specimen Preparation
Based on the Standard for Geotechnical Testing Method (GB/T 50123-2019), the dry soil was thoroughly premixed with specified amounts of distilled water in a sealed plastic bag, according to the targeted moisture content (w0 = 10%) and dry density () of the specimen. To ensure that water was uniformly distributed within the soil, the wet soil was placed into a sealed container and stored for approximately 48 h. Afterwards, the wet soil was poured into a stainless mold and compacted into a cylindrical specimen (diameter = 50 mm and height = 100 mm), layer by layer in 4 layers, each with a thickness of 25 mm, via the static compaction method. The surface of each layer was roughened after compaction to ensure optimal interlayer contact.
Subsequently, the compacted specimen was extracted from the mold and referred to as a never-frozen specimen. For the thawed specimen, the above-compacted specimen was wrapped with cling film and tinfoil. Then, the specimen was placed in a refrigerating chamber at −10 °C for 12 h to ensure complete freezing of the soil. In the following time, the temperature was increased to T = 10 °C for thawing the frozen specimen. Generally, the thawing process lasted about 12 h. This process of freezing and thawing constituted one closed-system FT cycle. In this study, the specimen was subjected to a maximum of 5 closed-system FT cycles.
2.2.2. NMR Analysis
The testing setup for microstructure in this study primarily comprised an NMR system (MacroMR12-150H-I, 12.58 MHz, Suzhou Niumag Analytical Instrument Corporation, Suzhou, China), a temperature control system, and a data acquisition and analysis system. The Car–Purcell–Meiboom–Gill (CPMG) pulse sequence was utilized to measure the NMR-T2 distribution curves of liquid water in both the unfrozen specimen and thawing specimen subjected to varying numbers (1~5 times) of FT cycles.
2.2.3. Triaxial Compression
A detailed introduction of the triaxial testing apparatus employed can be found in Yang [22]. Following the NMR test, the specimen was positioned on the test pedestal and enveloped with a latex membrane (0.5 mm in thickness). Subsequently, the specimen was installed within the confining chamber. Several consolidation-drained compression (CD) tests were conducted on both the unfrozen specimens and thawed specimens (without ice), which underwent 1 to 5 freeze–thaw (FT) cycles. Various effective confining pressures of 0.2, 0.5, and 1.0 MPa were applied during the CD tests, while axial loading was controlled by a strain pattern at a constant deformation rate of 1 mm/min. The shear procedure continued until the axial strain reached 20%. The temperature of the never-frozen and thawed specimens was maintained at 10 °C.
3. Results and Discussion
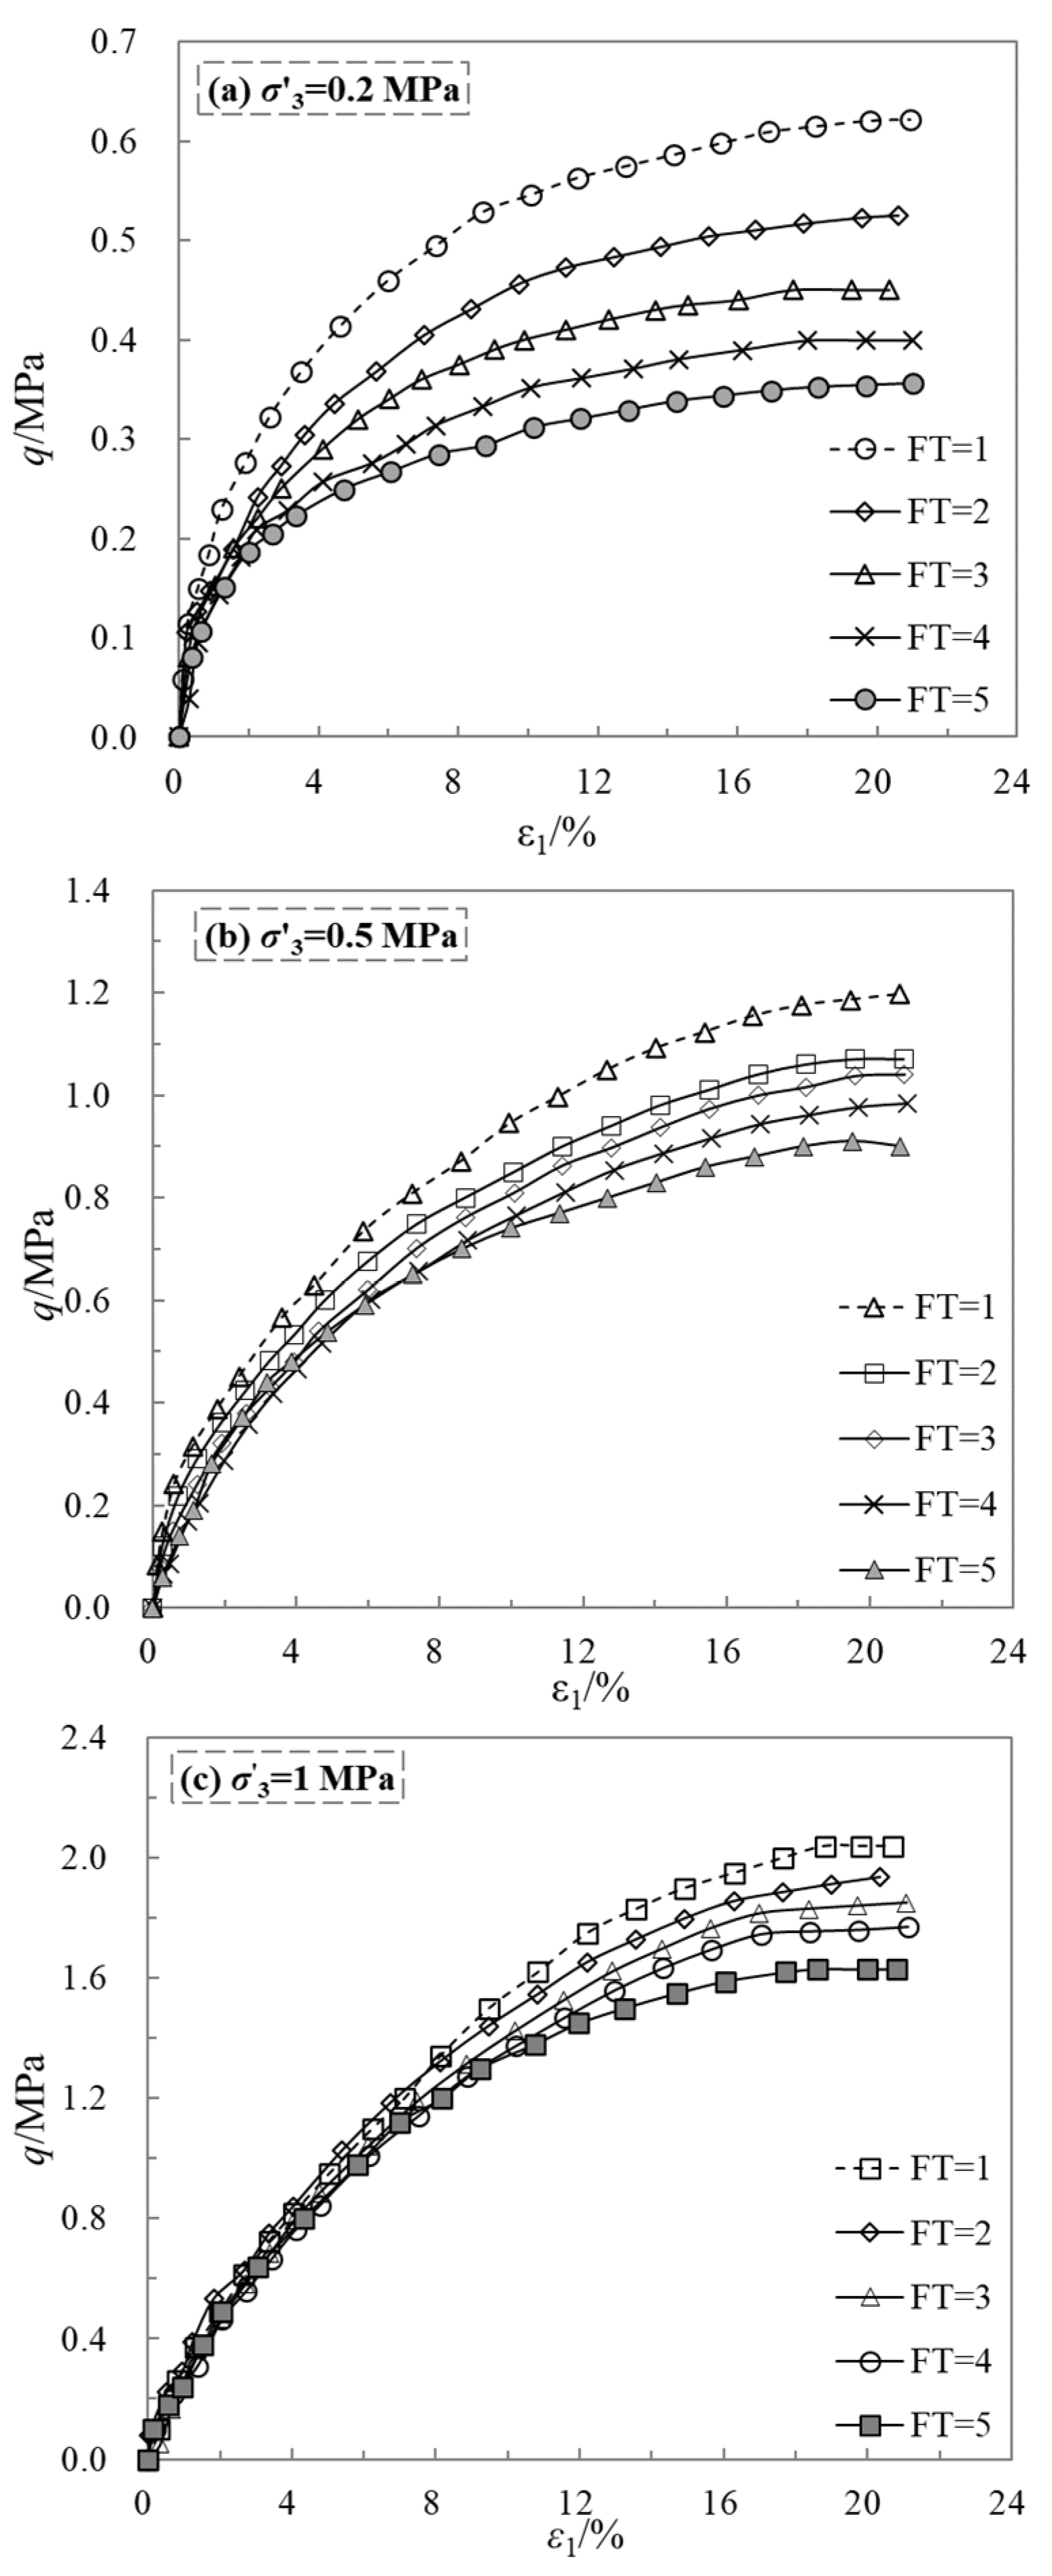
3.1. Stress–Strain Curves
The relationships between the deviatoric stress () and axial strain for the never-frozen specimens and thawed specimens after one FT cycle under effective confining pressures () of 0.2, 0.5, and 1 MPa are shown in Figure 2. It can be clearly seen that the characteristics of all of the specimens manifest an evident strain-hardening behavior, which is independent of . With an increase in axial strain, the increases sharply at first, and then tends to be constant. As the effective confining pressure increases, both the shear strength and the stiffness increase. This may be due to the fact that under a high effective confining pressure, the soil structure is compressed more densely, and thus exhibits better resistance to deformation and damage. By comparison, it can be found that the curves of the thawed specimens are lower than that of the unfrozen specimens, and the stiffness and shear strength of the specimen are also observably reduced. The results suggest that the FT cycle plays a key role in the deteriorating stress–strain behavior. These results have also been observed in previous studies [18].
Figure 2.
Comparison of curves of unfrozen and thawed specimens for different effective confining pressures.
Figure 3 further depicts the influence of the number of FT cycles on the characteristics for the thawed specimens under different effective confining pressures ( = 0.2, 0.5, and 1 MPa). Apparently, as the number of FT cycles increases from 1 to 5, the curves of the thawed specimens shift downward monotonically. As shown in Figure 2 and Figure 3a, under of 0.2 MPa, the (i.e., the deviatoric stress corresponding the of 15%) of the unfrozen specimen (i.e., FT = 0) was determined to be 0.94 MPa, whereas the thawed specimen with FT = 1, 2, 3, 4, 5 had deviatoric stresses down to 0.60 MPa, 0.50 MPa, 0.44 MPa, 0.38 MPa, 0.34 MPa, respectively, about 36.34%, 46.34%, 53.69%, 59.53%, and 63.43% of that for unfroze specimen, respectively. Figure 3b,c show the variations of thawed specimens subjected to different FT cycles under of 0.5 and 1.0 MPa. Obviously, the change trend is similar to that of the 0.2 MPa effective confining pressure. These results clearly indicate tshat the mechanical behavior of the specimens was significantly degraded by FT action. The results mentioned above can be attributed to alterations in the microstructure of the pores caused by FT cycling, as elaborated upon subsequently.
Figure 3.
Comparison of curves of thawed specimens for different FT cycle times and effective confining pressures.
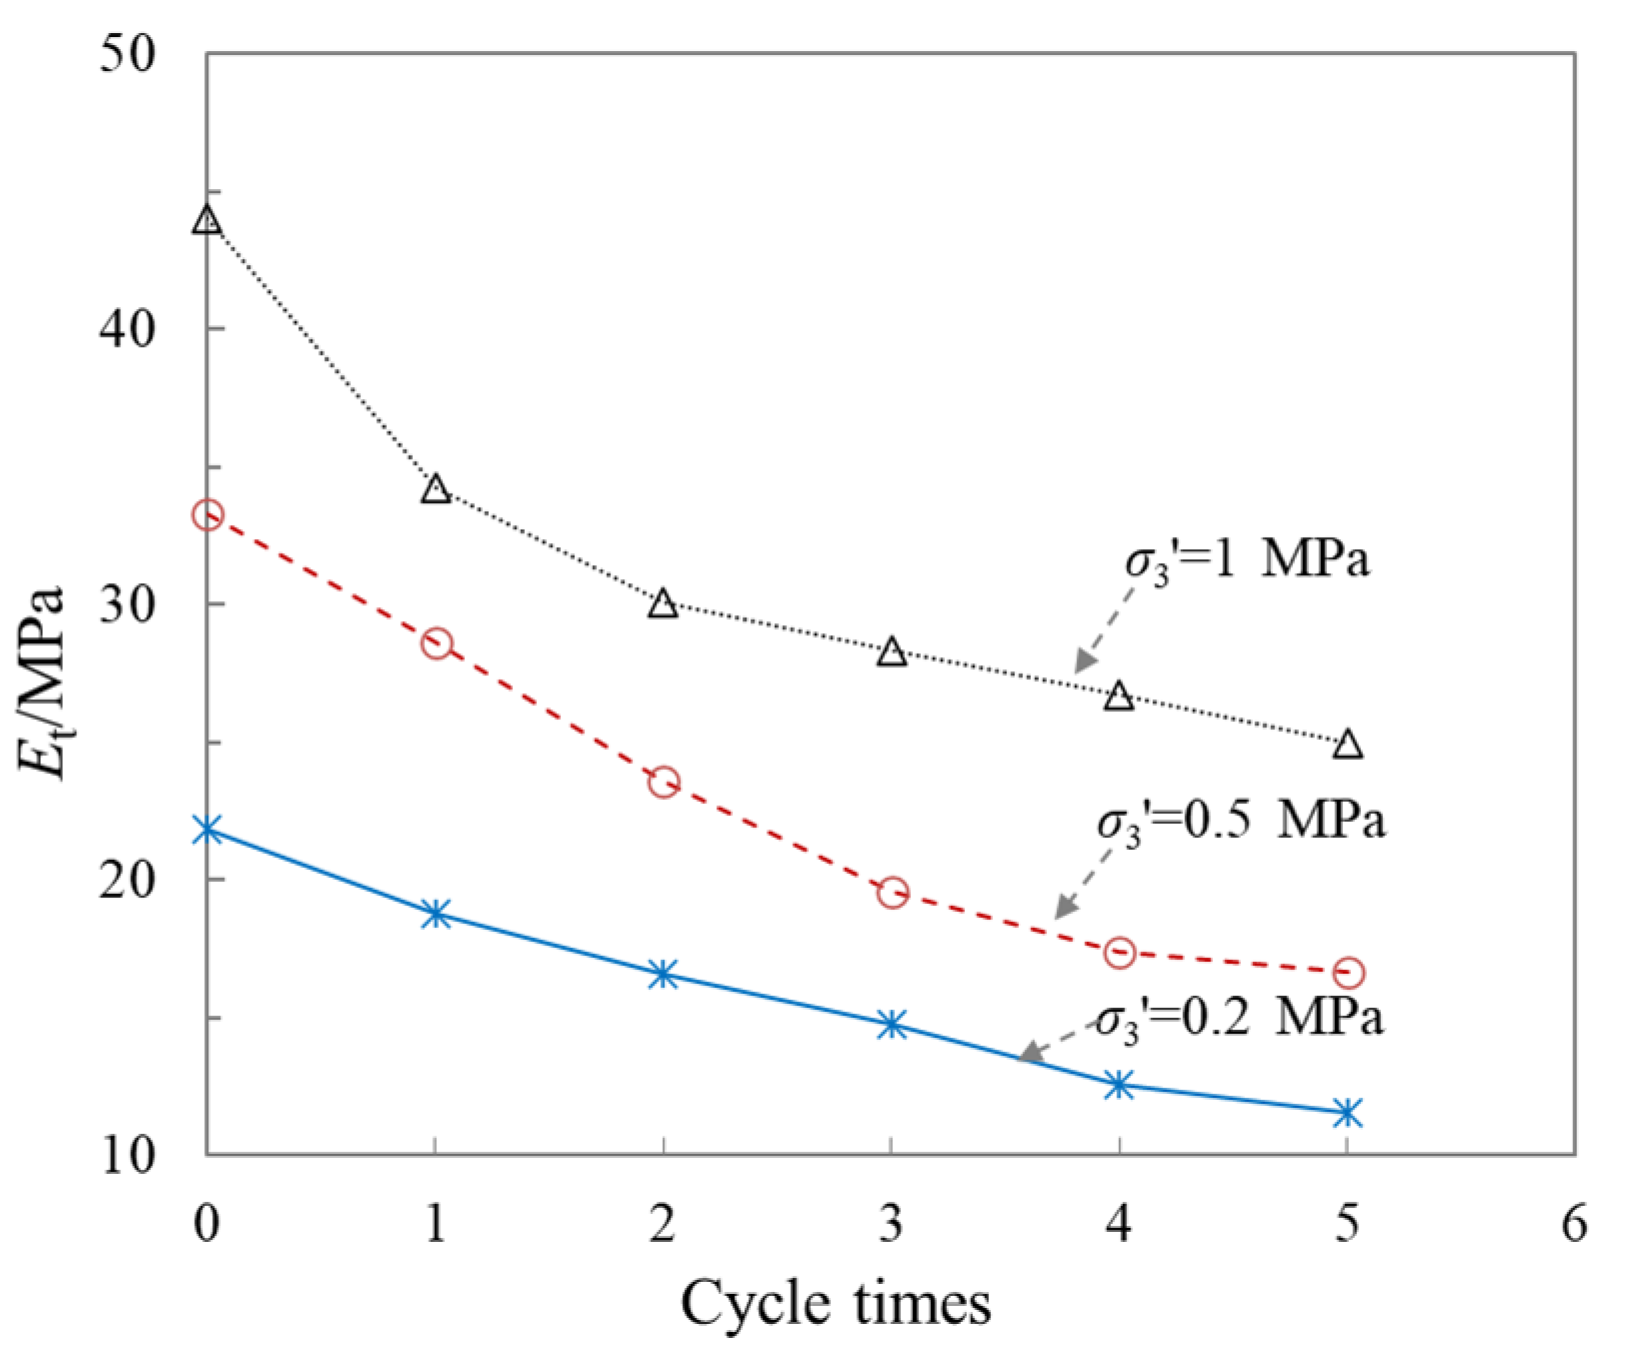
3.2. Secant Modulus and Shear Strength
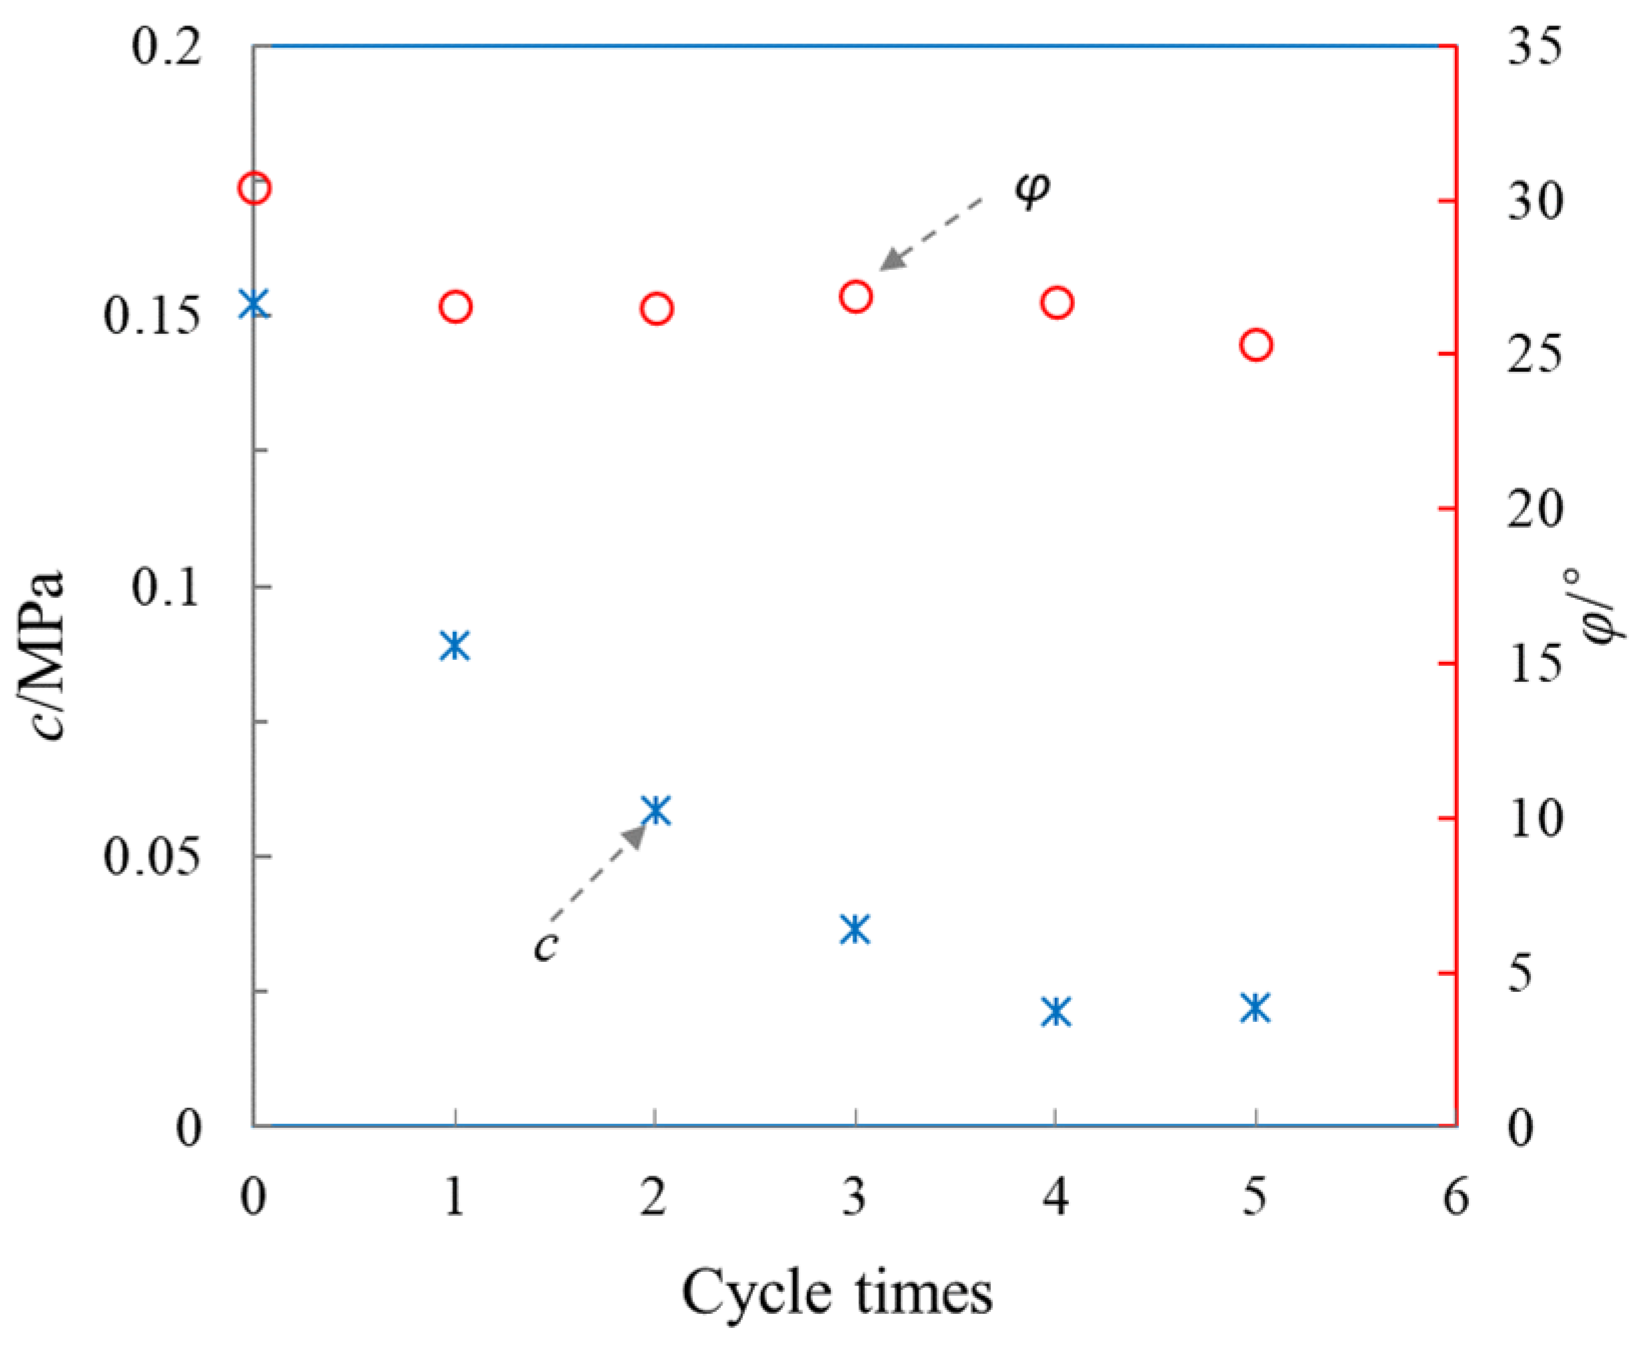
In order to specifically analyze the effect of FT cycles on the stiffness characteristics of the specimen, the secant modulus was used. Here, is defined as a ratio of the deviatoric stress increment at 1% axial strain to the axial strain increment , which can be expressed as , where is the deviatoric stress at 1.0% axial strain (), and and are the initial axial strain and deviatoric stress, respectively [15,23]. Figure 4 presents the variations in with cycle times for the specimens under of 0.2, 0.5, and 1 MPa. Here, the zero cycle represents the soil that was never exposed to freeze–thawing, that is, the unfrozen specimen.
Figure 4.
Variations in with FT cycles under various effective confining pressures.
It can be observed that decreases sharply at first, and then slightly with the increase in FT times. At = 0.2 MPa, of the unfrozen specimen (FT = 0) was determined to be 21.80 MPa, whereas the thawed specimen with FT = 1, 2, 3, 4, 5 had secant moduli down to 18.78 MPa, 16.61 Mpa, 14.73 Mpa, 12.56 Mpa, and 11.58 MPa, respectively, about 86.14%, 76.20%, 67.60%, 57.60%, and 53.11% of that for the frozen specimen, respectively. At = 0.5 MPa and 1.0 MPa, decreases 50.68% and 43.64% as the number of FT cycles increases from 1 to 5, respectively.
Figure 5 shows the changes in shear strength with freeze–thaw cycles for the specimens under different values. Based on the Standard for Geotechnical Testing Method (GB/T 50123-2019), the () is defined as the deviatoric stress at an of 15%. It can be seen that the decreases dramatically at first (FT from 0 to 1), and then slightly (FT from 1 to 5) as the number of FT cycle increases within the range of the tested cycles. Similar results had been observed by Wang [15].
Figure 5.
Variations in with FT cycles under various effective confining pressures.
The results mentioned above clearly demonstrate that the number of FT cycles has a significant deterioration effect on the secant modulus and shear strength of the specimens. Initially, as the specimens undergo the first FT cycle (from 0 to 1), there is a noticeable decrease in both the secant modulus and shear strength of the specimens. This decline can be attributed to the expansion of pore water within the specimen during freezing. As the water freezes, it exerts pressure on the pore walls, causing the micro-pores to expand, and new micro-pores and cracks to form. These cracks and micro-pores tend to persist even after the thawing process [6]. Furthermore, the secant modulus and shear strength of the thawed specimens (FT from 1 to 5) slightly decreases due to further alterations in the microstructure of the pores.
3.3. Strength Index
To deeply reveal the effect of FT action on the of specimens from a microscopic viewpoint, the cohesion () and internal friction angle () were determined based on the above experimental data. The detailed calculations can be found in Yang [22] and Zhou [24]. The relationships among the , , and the number of FT cycles are depicted in Figure 6. It is evident that both and consistently decreased as the number of FT cycles increased within the tested range. In general, the cohesion is mainly reflected by the joint action of various physicochemical forces (Coulomb force and bonding action, etc.), and is controlled by the space between soil particles. On the other hand, the internal friction angle is mainly reflected by the sliding and interlocking of solid particles against one another [15]. These results indicate that the pore space between soil particles may increase as the number of FT cycles increases. In other words, new micro-pores and/or cracks appear and expand in the soils.
Figure 6.
Strength index of tested soil versus the number of FT cycles.
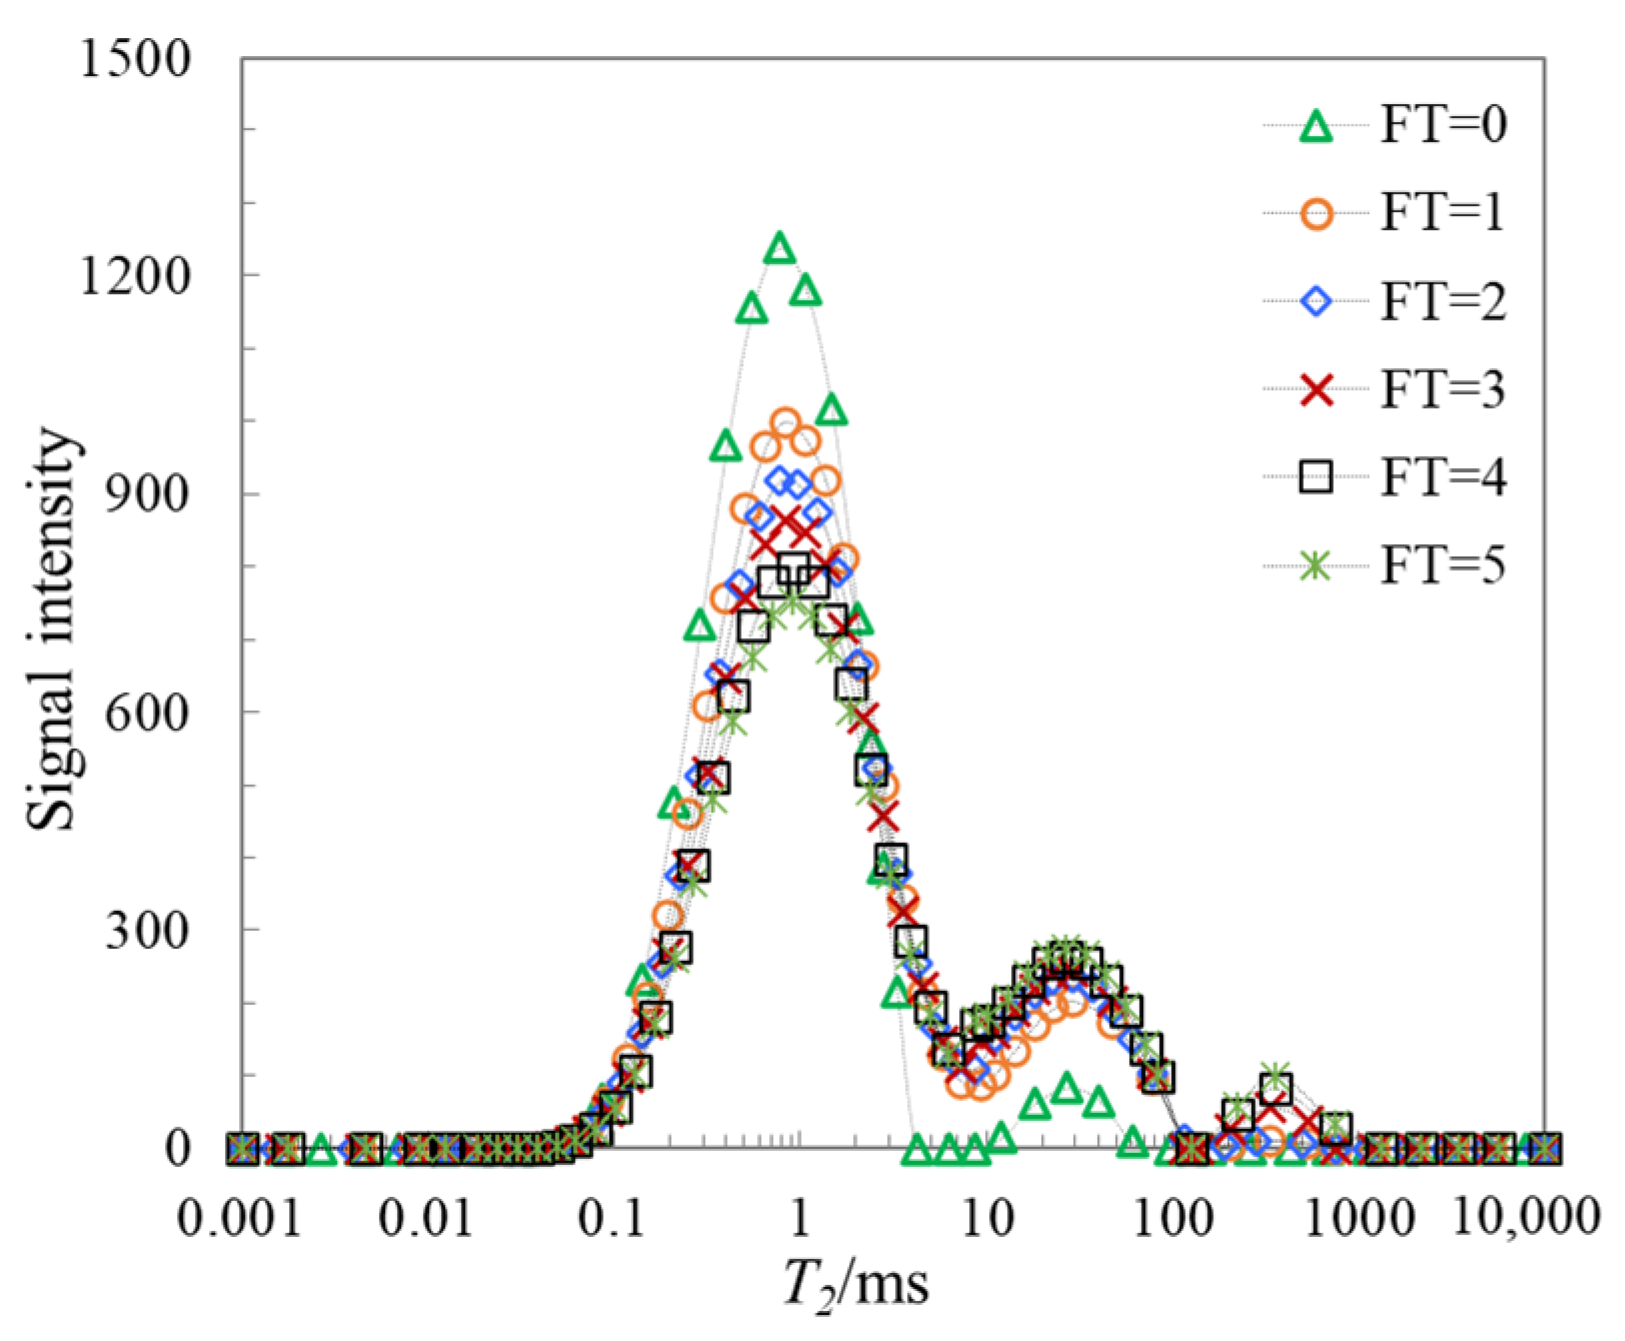
3.4. NMR-T2 Distribution
Based on the abovementioned analyses, the mechanism of deterioration of the soil’s mechanical properties from FT cycling largely depends on variations in micro-pore structure. In order to elucidate the changes in soil microstructure during FT cycling, NMR tests were conducted on specimens subject to different FT cycles.
The distribution curve of the transverse relaxation time (T2) can be utilized to characterize the distribution characteristics of hydrogen-containing substances, specifically water in this context. In general, there exists a positive correlation between the NMR-T2 value and the pore radius (r) of the soil. Currently, due to its advantages of efficiency and non-destructiveness, the NMR technique has been extensively employed for investigating pore distributions within soils [25,26,27,28]. The variations in the NMR-T2 distribution curves of the specimens subjected to different FT cycles are depicted in Figure 7.
Figure 7.
The T2 distribution of tested soil for different FT cycle times.
It can be observed that the NMR-T2 distribution of the never-frozen specimen (partially water-saturated state) exhibits a clear bimodal peak (green triangle), wherein the left peak represents pore water in smaller pores with T2 coordinates ranging from 0.02 to 6.29 ms, while the right peak represents pore water in larger pores with T2 coordinates ranging from 8.71 to 60.81 ms. Following the initial freeze–thaw cycle, the NMR-T2 distribution curve of the thawed specimen exhibits a noticeable rightward shift, indicating a displacement towards larger pore sizes in terms of NMR-T2. In addition, it can be found that the left peak shrinks and the right peak expands. These results clearly indicate that the smaller pores decrease and larger pores increase after the first freeze–thaw cycle. The observed outcomes can be attributed to the phenomenon where freezing and expansion of pore water within the specimen causes displacement of soil particles by pore ice, resulting in separation of soil aggregates and subsequent expansion of smaller pores towards larger ones. After thawing, the enlarged pores did not fully recover and predominantly persisted, leading to an augmented presence of large pores within the specimen. As a consequence, the mechanical behavior of the thawed specimen deteriorated compared to that of the unfrozen specimen.
The NMR-T2 distribution curve exhibits three distinct peaks with the increase in the number of FT cycles (from 1 to 5). It is evident that the left peak is diminishing, while the middle and right peaks are expanding. Particularly, the emergence of a third peak (ranging from 116.23 to 748.81 ms) on the right potentially indicates the presence of macroscopic pores, such as voids and cracks. These results suggest that the FT action leads to a continuous enlargement and development of micro-pores into medium-sized and large-sized pores within the soil, thereby further segmenting the soil structures and causing FT deterioration. Similar behavior was observed in sandstone by Li [21].
4. Theorical Model Development
4.1. Modified Duncan–Chang Model
According to Figure 2 and Figure 3, the deviatoric stress ()–axial strain () curves of the compacted specimens for various FT cycle times and effective confining pressures () exhibit a hyperbolic pattern. Therefore, Duncan–Chang’s hyperbolic model can be adopted to address the above constitutive relationship. In the original Duncan–Chang model, the functional relationship between the and can be expressed as follows [29]:
where and are two model parameters that are related with the soil characteristics, and expressed in detail as follows [30,31]:
where , , and are the initial elastic modulus, failure ratio (the value usually ranges from 0.75 to 0.95 [32]), and the shear strength, respectively.
Based on the abovementioned analyses, both and can be influenced by the effective confining pressure (i.e., enhancement) and the freeze–thaw action (i.e., deterioration). To take into account these effects, we modified an empirical formula for the initial modulus by Junbu [33] and the Mohr–Coulomb criterion for the shear strength, respectively. Explicitly, the following is proposed:
where , , and are the initial elastic modulus, cohesion, and internal friction angle of the unfrozen specimen, respectively; is the number of FT cycles, , , , and are four parameters considering the influences of , and is a parameter considering the influence of . In this research, a hyperbolic function of was embedded into the right-hand side of Equation (4), and a power function of was embedded into the right-hand side of Equation (5) to address the deterioration of FT cycling, respectively. Note that Equation (5) ignores the effect of the number of FT cycles on , and assumes that the deteriorated of the soil mainly results from decreasing cohesion.
Based on the above modeling, parameter is obtained using Equations (2) and (4), and parameter is obtained according to Equations (3) and (5). Then, using the obtained model parameters and Equation (1), the − curves of compacted specimens for various FT cycle times and effective confining pressures can be predicted.
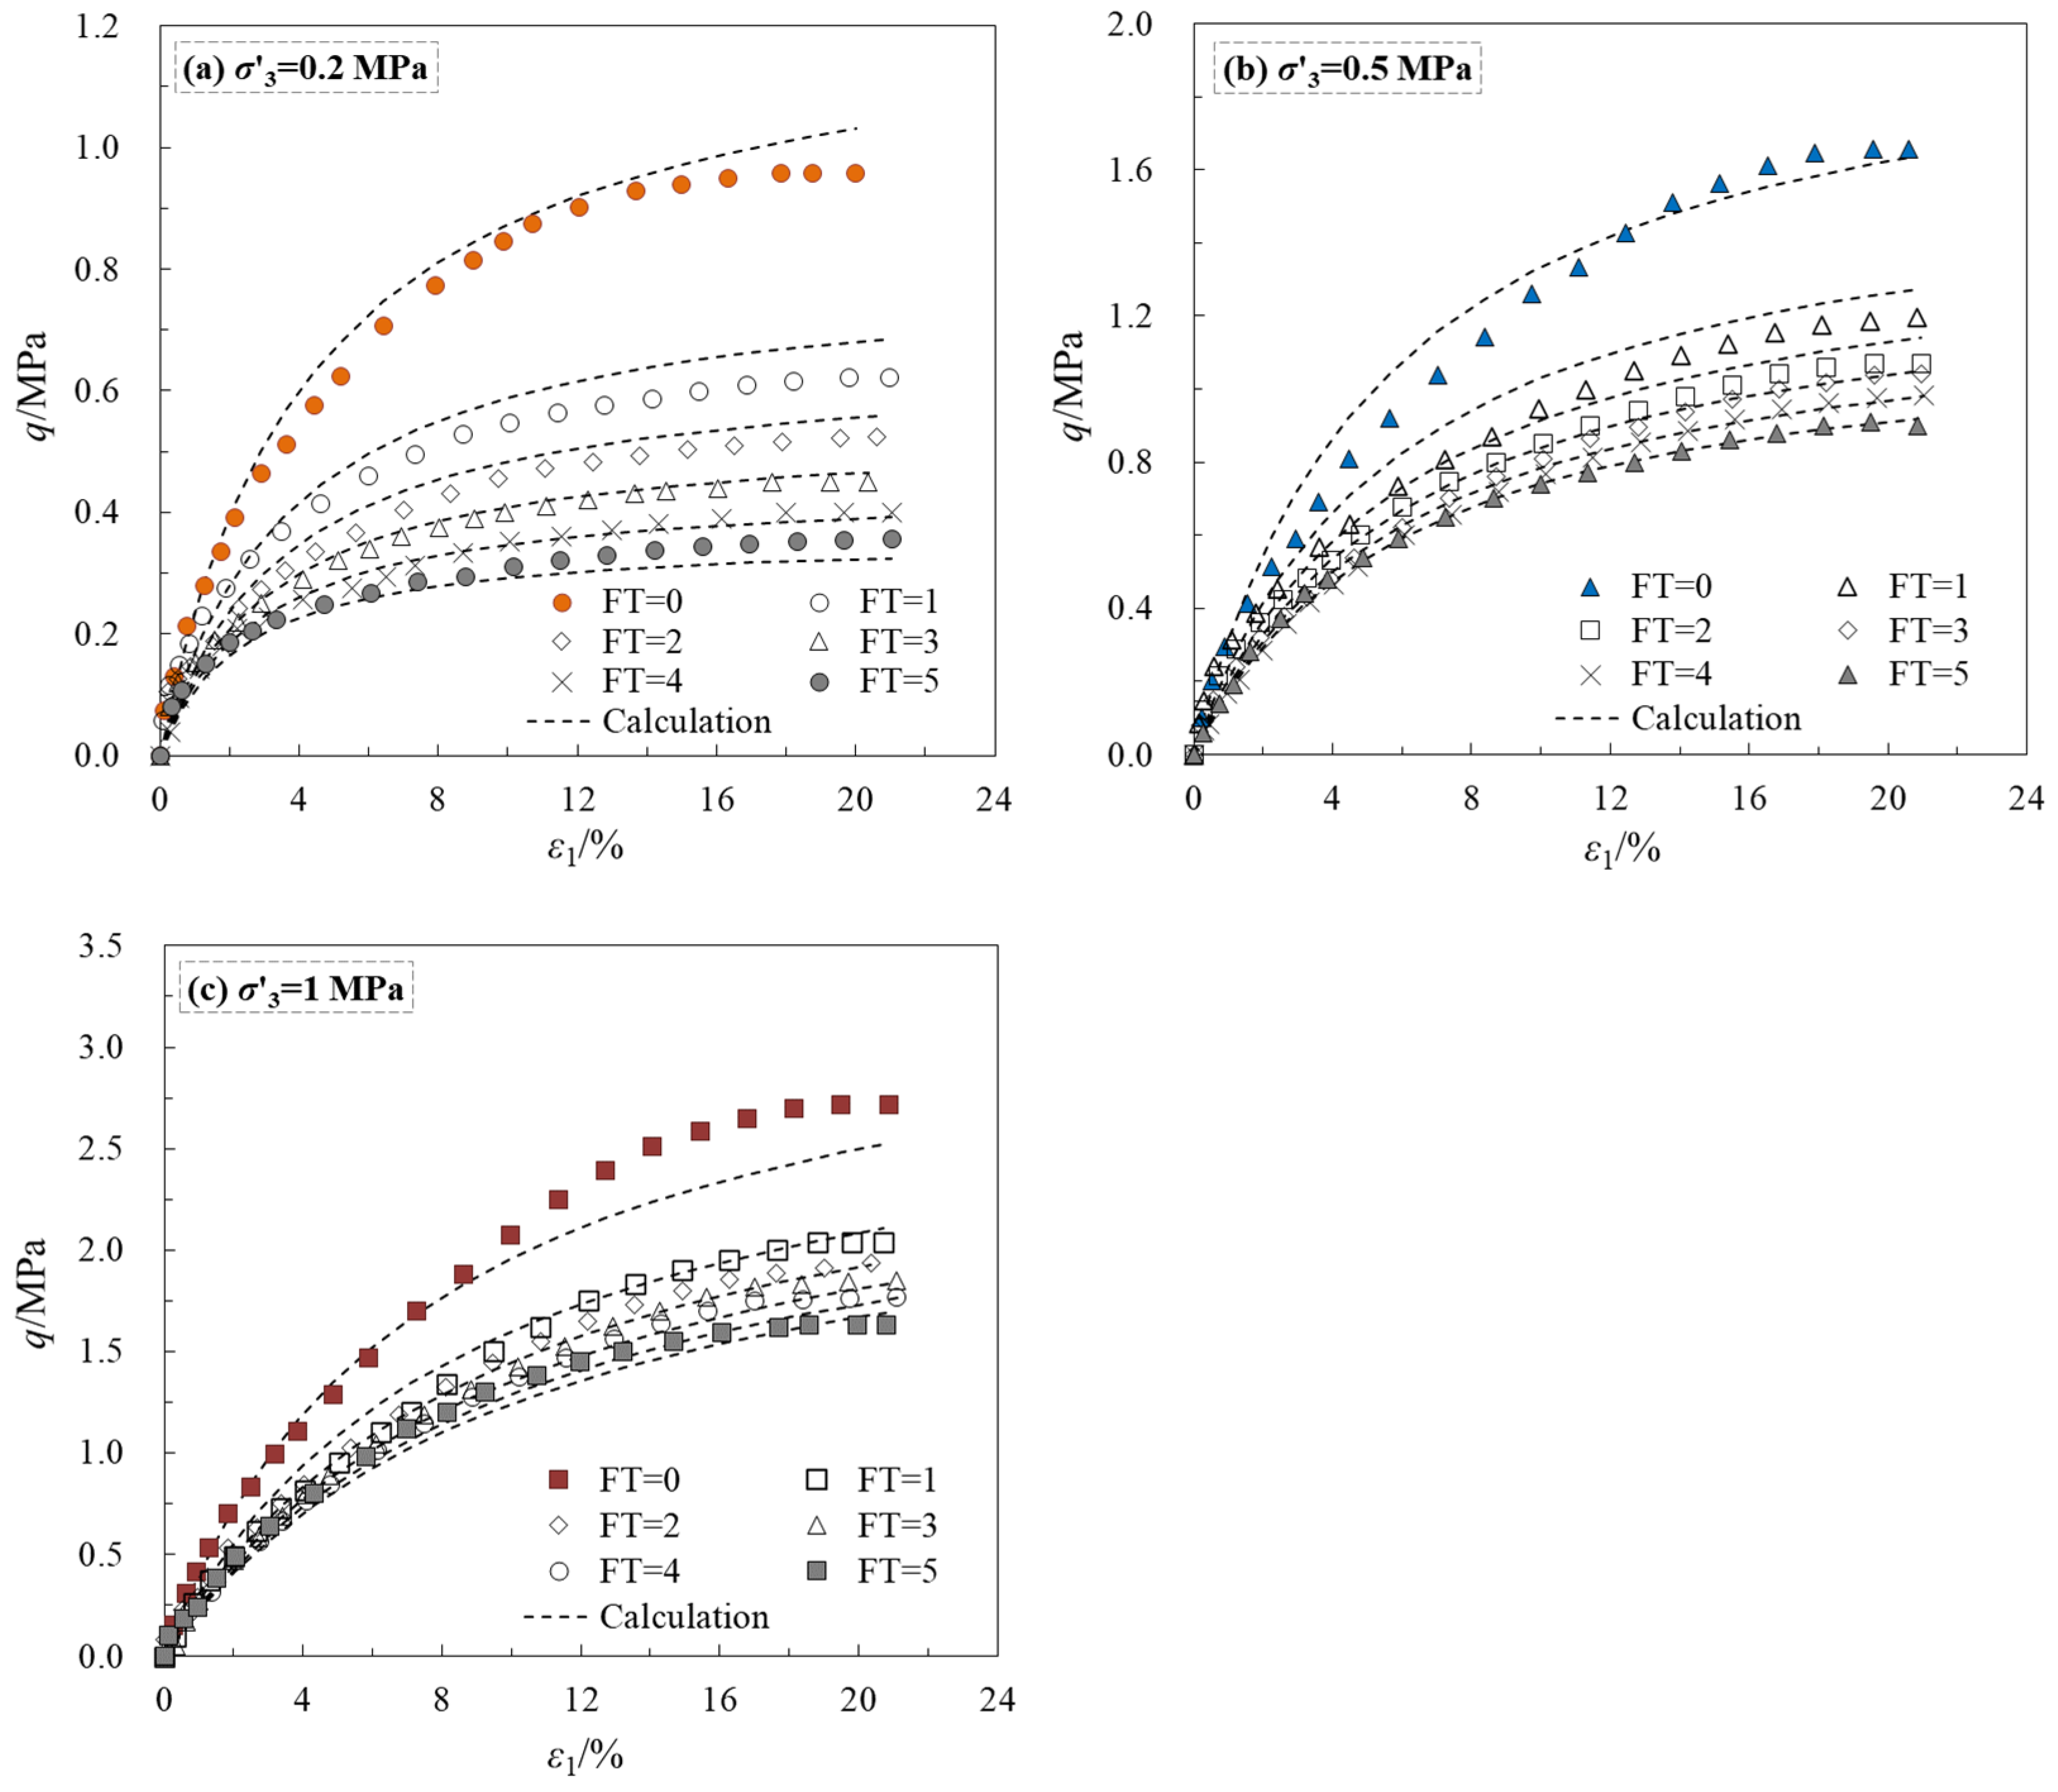
4.2. Model Validation and Performance
Clearly in this study, the parameters of the proposed model mainly include , , , , , , , , and . Among them, , , , and are the parameters of unfrozen specimens, which can be obtained based on the curves of unfrozen specimens. Other parameters (i.e., , , , , and ) can be obtained by fitting the − curves of thawed specimens with different FT cycle times and effective confining pressures. Based on the above mention, the − curves were calculated using the proposed model and compared with the experimental results. The model parameters used in the calculation are presented in Table 1.
Table 1.
Model parameters.
Figure 8 demonstrates the calculated results of the specimens with various FT cycles under different of 0.2, 0.5, and 1.0 MPa. For comparison, the experimental data are also given in Figure 8. Apparently, this proposed model can efficaciously describe the basic mechanical characteristics of the specimens with various FT cycles. Due to the FT effect, the stiffness and strength of the specimens decrease dramatically with an increase in FT cycle times. The modified model satisfyingly reflects the effect of FT action on the − characteristics of the tested soil.
Figure 8.
Comparisons between the experimental and calculated results for unfrozen and thawed specimens for different effective confining pressures.
5. Conclusions
In this study, several triaxial compression and NMR tests were carried out to explore the stress–strain behavior of compacted silty clay specimens with various FT cycles under different . According to the experimental data, the mechanical characteristics (e.g., the stress–strain response, shear strength, secant modulus, strength index) of the specimen were systematically revealed. The following conclusions may be drawn:
- The stress–strain curves of all the compacted specimens under various manifest strain-hardening behavior. The mechanical response of the specimens was significantly impaired by FT action, as evidenced by a gradual decrease in strength, stiffness, cohesive properties, and internal friction angle with an increasing number of FT cycles.
- The T2 distribution curve of the unfrozen specimen exhibits a bimodal peak pattern. With an increase in the number of FT cycles, the micro-pores became continuously enlarged and developed into medium- and large-sized pores, resulting in deterioration of the mechanical behavior of the thawed specimen.
- An empirical equation was proposed for the − response of the compacted silty clay considering the deterioration of FT cycling, and then applied to effectively describe the – characteristics of the tested soil.
Author Contributions
Conceptualization, J.J. and D.Y.; methodology, J.J.; software, H.W.; validation, D.Y. and Y.W.; formal analysis, H.W.; investigation, J.J.; resources, J.J. and D.Y.; data curation, Y.W.; writing—original draft preparation, J.J.; writing—review and editing, D.Y.; visualization, H.W.; supervision, Y.W.; project administration, Y.W.; funding acquisition, D.Y. All authors have read and agreed to the published version of the manuscript.
Funding
This research was funded by the Guangxi Key Laboratory of Geomechanics and Geotechnical Engineering (No. 20-Y-XT-04), and the Enhance the Theoretical Basis and Practical Ability of Young and Middle-aged Teachers in Colleges of Guangxi (No. 2023KY0221).
Institutional Review Board Statement
Not applicable.
Data Availability Statement
Some or all of the data, models, or code that support the Guangxi Key Laboratory of Geomechanics and Geotechnical Engineering (No. 20-Y-XT-04), as well as the findings of this study, are available from the corresponding author upon reasonable request.
Acknowledgments
The authors gratefully acknowledge the support provided from the Enhance the Theoretical Basis and Practical Ability of Young and Middle-aged Teachers in Colleges of Guangxi (No. 2023KY0221).
Conflicts of Interest
The authors declare no conflict of interest.
References
- Xie, S.B.; Qu, J.J.; Lai, Y.M.; Zhou, Z.W.; Xu, X.T. Effects of freeze-thaw cycles on soil mechanical and physical properties in the Qinghai-Tibet Plateau. J. Mt. Sci. 2015, 12, 999–1009. [Google Scholar] [CrossRef]
- Liu, J.K.; Chang, D.; Yu, Q.M. Influence of freeze-thaw cycles on mechanical properties of a silty sand. Eng. Geol. 2016, 210, 23–32. [Google Scholar] [CrossRef]
- Zou, W.L.; Ding, L.Q.; Han, Z.; Wang, X.Q. Effects of freeze-thaw cycles on the moisture sensitivity of a compacted clay. Eng. Geol. 2020, 278, 105832. [Google Scholar] [CrossRef]
- Al-Omari, A.; Beck, K.; Brunetaud, X.; Török, Á.; Al-Mukhtar, M. Critical degree of saturation: A control factor of freeze-thaw damage of porous limestones at Castle of Chambord, France. Eng. Geol. 2015, 185, 71–80. [Google Scholar] [CrossRef]
- Özgan, E.; Serin, S.; Ertürk, S.; Vural, I. Effects of freezing and thawing cycles on the engineering properties of soils. Soil. Mech. Found. Eng. 2012, 52, 95–99. [Google Scholar] [CrossRef]
- Li, J.L.; Kaunda, B.R.; Zhou, K.P. Experimental investigations on the effects of ambient freeze-thaw cycling on dynamic properties and rock pore structure deterioration of sandstone. Cold Reg. Sci. Technol. 2018, 154, 133–141. [Google Scholar] [CrossRef]
- Lu, J.G.; Zhang, M.Y.; Zhang, X.Y.; Pei, W.S.; Bi, J. Experimental study on the freezing–thawing deformation of a silty clay. Cold Reg. Sci. Technol. 2018, 151, 19–27. [Google Scholar] [CrossRef]
- Tian, L.H.; Yu, L.L.; Liu, S.M.; Zhang, B. Deformation research of silty clay under freeze-thaw cycles. KSCE J. Civ. Eng. 2020, 24, 435–442. [Google Scholar] [CrossRef]
- Li, T.G.; Kong, L.W.; Guo, A.G. The deformation and microstructure characteristics of expansive soil under freeze–thaw cycles with loads. Cold Reg. Sci. Technol. 2021, 192, 103393. [Google Scholar] [CrossRef]
- Ma, W.; Cheng, G.D.; Wu, Q.B. Construction on permafrost foundations: Lessons learned from the Qinghai–Tibet railroad. Cold Reg. Sci. Technol. 2009, 59, 3–11. [Google Scholar]
- Zhou, Z.W.; Ma, W.; Zhang, S.J.; Mu, Y.H.; Li, G.Y. Effect of freeze-thaw cycles in mechanical behaviors of frozen loess. Cold Reg. Sci. Technol. 2018, 146, 9–18. [Google Scholar] [CrossRef]
- Sheng, Z.J. Weathering resistant design-an important aspect of future development of geotechnical engineering design. Chin. J. Geotech. Eng. 2004, 26, 866–869. [Google Scholar]
- Konrad, J.M. Physical processes during freeze-thaw cycles in clayey silts. Cold Reg. Sci. Technol. 1989, 16, 291–303. [Google Scholar] [CrossRef]
- Simonsen, E.; Isacsson, U. Soil behavior during freezing and thawing using variable and constant confining pressure triaxial tests. Can. Geotech. J. 2001, 38, 863–875. [Google Scholar] [CrossRef]
- Wang, D.Y.; Ma, W.; Niu, Y.H.; Chang, X.X.; Wen, Z. Effects of cyclic freezing and thawing on mechanical properties of Qinghai–Tibet clay. Cold Reg. Sci. Technol. 2007, 48, 34–43. [Google Scholar] [CrossRef]
- Qi, J.L.; Ma, W.; Song, C.X. Influence of freeze-thaw on engineering properties of a silty soil. Cold Reg. Sci. Technol. 2008, 53, 397–404. [Google Scholar] [CrossRef]
- Cui, Z.D.; He, P.P.; Yang, W.H. Mechanical properties of a silty clay subjected to freezing-thawing. Cold Reg. Sci. Technol. 2014, 98, 26–34. [Google Scholar] [CrossRef]
- Han, Y.; Wang, Q.; Wang, N.; Wang, Q.J.; Zhang, X.D.; Cheng, S.K.; Kong, Y.Y. Effect of freeze-thaw cycles on shear strength of saline soil. Cold Reg. Sci. Technol. 2018, 154, 42–53. [Google Scholar] [CrossRef]
- Gao, Z.N.; Zhong, X.M.; Wang, Q.; Su, Y.Q.; Wang, J. The influence of freeze-thaw cycles on unconfined compressive strength of lignin fiber-reinforced loess. J. Renew. Mater. 2022, 10, 1063. [Google Scholar] [CrossRef]
- Chen, Z.F.; Chen, H.E.; Li, J.F.; Li, H.; Ma, W.L. Study on the changing rules of silty clay’s pore structure under freeze-thaw cycles. Adv. Civ. Eng. 2019, 2019, 7493872. [Google Scholar] [CrossRef]
- Li, J.L.; Zhou, K.P.; Liu, W.J.; Deng, H.W. NMR research on deterioration characteristics of microscopic structure of sandstones in freeze-thaw cycles. Trans. Nonferrous Met. Soc. China 2016, 26, 2997–3003. [Google Scholar] [CrossRef]
- Yang, D.H.; Yan, R.T.; Yan, M.Q.; Lu, D.; Wei, C.F. Geomechanical properties of artificial methane hydrate-bearing fine-grained sediments. Gas Sci. Eng. 2023, 109, 104852. [Google Scholar] [CrossRef]
- Zhang, X.H.; Luo, D.S.; Lu, X.B.; Liu, L.L.; Liu, C.L. Mechanical properties of gas hydrate-bearing sediments during hydrate dissociation. Acta Mech. Sin. 2018, 34, 266–274. [Google Scholar] [CrossRef]
- Zhou, J.Z.; Yang, Z.J.; Wei, C.F.; Chen, P.; Yan, R.T. Mechanical behavior of hydrate-bearing sands with fine particles under isotropic and triaxial compression. Gas Sci. Eng. 2021, 92, 103991. [Google Scholar] [CrossRef]
- Bird, N.R.A.; Preston, A.R.; Randall, E.W.; Whalley, W.R.; Whitmore, A.P. Measurement of the size distribution of water-filled pores at different matric potentials by stray field nuclear magnetic resonance. Eur. J. Soil. Sci. 2005, 56, 135–143. [Google Scholar] [CrossRef]
- Jaeger, F.; Bowe, S.; Van As, H.; Schaumann, G.E. Evaluation of 1H NMR relaxometry for the assessment of pore-size distribution in soil samples. Eur. J. Soil. Sci. 2009, 60, 1052–1064. [Google Scholar] [CrossRef]
- Tian, H.H.; Wei, C.F.; Wei, H.C.; Zhou, J.Z. Freezing and thawing characteristics of frozen soils: Bound water content and hysteresis phenomenon. Cold Reg. Sci. Technol. 2014, 103, 74–81. [Google Scholar] [CrossRef]
- Yang, D.H.; Yan, R.T.; Cheng, F.; Lu, D.; Wei, C.F.; Tian, H.H. Influencing Factors of Hydration Number of Synthesized Methane Hydrates in Sediment. Energy Fuels 2023, 37, 1929–1939. [Google Scholar] [CrossRef]
- Duncan, J.M.; Chang, C.Y. Nonlinear analysis of stress and strain in soils. J. Soil. Mech. Fdn. Div. 1970, 96, 1629–1653. [Google Scholar] [CrossRef]
- Yamaguchi, T.; Aoki, K.; Tenma, N. A nonlinear elastic model for triaxial compressive properties of artificial methane-hydrate-bearing sediment samples. Energies 2012, 5, 4057–4075. [Google Scholar]
- Yan, M.Q.; Yan, R.T.; Yu, H.H. Strain-Softening Characteristics of Hydrate-Bearing Sediments and Modified Duncan–Chang Model. Adv. Mater. Sci. Eng. 2021, 2021, 2809370. [Google Scholar] [CrossRef]
- Luo, T.; Yao, Y.; Hou, W. Soil Constitutive Models; China Communications Press: Beijing, China, 2010; pp. 65–67. [Google Scholar]
- Janbu, N. Soil Compressibility as determined by oedometer and triaxial test. Soil. Mech. Fdn. Eng. Wiesbaden. Ger. 1963, 1963, 19–25. [Google Scholar]
Disclaimer/Publisher’s Note: The statements, opinions and data contained in all publications are solely those of the individual author(s) and contributor(s) and not of MDPI and/or the editor(s). MDPI and/or the editor(s) disclaim responsibility for any injury to people or property resulting from any ideas, methods, instructions or products referred to in the content. |
© 2023 by the authors. Licensee MDPI, Basel, Switzerland. This article is an open access article distributed under the terms and conditions of the Creative Commons Attribution (CC BY) license (https://creativecommons.org/licenses/by/4.0/).