Abstract
This research studied the effect of recycled steel fibers extracted from twisted cable waste on the fresh and hardened states of high-performance concretes. Accordingly, slump, water absorption (WA), compressive strength (CS), flexural strength (FS), and split tensile strength (STS) were measured in the laboratory using mixtures generated by the response surface methodology (RSM). The RSM-based central composite design (CCD) was used to assess the influence of water-to-binder (W/B) ratios from 0.27 to 0.31, length-to-diameter (L/d = 46 to 80) and steel fiber content (SFC) in the range of 19 to 29 kg/m3 on the behavior of high-performance fiber-reinforced concrete (HPFRC). The accuracy and validation of the generated models were evaluated by employing analysis of variance (ANOVA) and optimal parameters. The experimental findings revealed that the use of an L/d ratio of 63, a W/B ratio of approximately 0.28, and an SFC of around 22 kg/m3 resulted in high workability in terms of slump. While a notable increase in compressive strength was observed when employing an L/d ratio of approximately 70, a W/B ratio of around 0.28, and the maximum SFC of 29 kg/m3, as confirmed by scanning electron microscopy (SEM) and X-ray diffraction (XRD) analysis.
1. Introduction
High-performance concrete, recognized for its exceptional strength, durability, and workability, serves as a preferred choice in high-rise buildings, bridges, infrastructure rehabilitation, and a myriad of architectural applications.
This type of concrete requires a special mix design, incorporating mineral admixtures, such as silica fume, fly ash, and slag, as well as fiber reinforcement, such as steel fibers or polypropylene fibers, to enhance its mechanical properties, durability, and overall performance.
Among the most effective solutions for improving the performance of high-performance concrete is the incorporation of steel fibers, which have been extensively proven to deliver remarkable improvements in various properties, such as compressive and flexural strength, toughness, ductility, and crack resistance [1,2,3]. Furthermore, steel fibers can be utilized to prevent reinforcement congestion, reduce implementation costs, and contribute to the sustainable use of resources [4,5].
In recent times, the construction sector has increasingly investigated the possibilities of incorporating end-of-life tire by-products into cementitious materials, with a specific focus on the utilization of recycled steel fibers as reinforcement [6]. Research findings indicate that concrete reinforced with tire steel fibers demonstrates enhanced mechanical properties similar to those reinforced with industrial steel fibers [7,8]. Moreover, the specific characteristics of steel fibers extracted from discarded tires, such as their length and aspect ratio, have been found to significantly influence the mechanical and physical properties of the resulting concrete, as highlighted by Awolusi et al. [9].
The utilization of recycled fibers offers a valuable opportunity to minimize environmental impact and reduce waste disposal in landfills. Extensive studies have shown the feasibility and economic viability of incorporating different types of fibers recovered from waste sources in the production of reinforced concrete [10,11,12]. Wire ropes, consisting of high carbon steel strands and wires, are subject to various deterioration mechanisms, such as corrosion and inter-wire friction caused by fatigue [13,14]. While it is crucial to understand the stress behavior of individual wires, predicting the behavior of the cable as a whole requires taking into account the elevated stress resistance exhibited by the insulated wire that is embedded within the cable [15].
Steel and synthetic fibers are frequently used to enhance the mechanical properties of cementitious materials, leading to improvements in tensile and flexural strength, as well as enhancing crack resistance and toughness [16,17]. Nevertheless, the utilization of these fibers is accompanied by certain drawbacks, including high costs and significant CO2 emissions during production [18]. The incorporation of fibrous reinforcement effectively mitigates the brittleness of concrete, which is typically brittle and possesses low tensile strength in its unreinforced state [19,20].
Several studies have also reported that the mechanical properties of concrete are influenced by the volume and the length of fibers [21]. Mohtasham Moein et al. [22] found that the addition of steel fibers to concrete improved its mechanical properties. Specifically, the use of hooked steel fibers was more effective in increasing the impact strength of the concrete compared to crimped steel fibers, despite having their low length-to-diameter ratio. This suggests that the shape and configuration of the steel fibers play a significant role in enhancing the impact resistance of the concrete.
Kytinou et al. [23] conducted a study to examine how varying the fiber content (ranging from 0.5% to 3% per volume) affected the performance of concrete beams reinforced with steel fibers. Their investigation, which involved both experimental and numerical analysis, demonstrated that the addition of fibers provides several benefits. These include improved tensile characteristics, better control of crack width in the concrete, enhanced cyclic behavior, increased residual stiffness, higher load-bearing capacity, improved deformation ability, greater energy dissipation ability, enhanced cracking performance, and overall improved integrity of the steel fiber-reinforced concrete beams when subjected to reversal cyclic loading tests.
Bayramov et al. [19] conducted a study on the fracture properties of steel-fiber reinforced concretes and reported that the aspect ratio and volume fraction of steel fibers have notable effects. Their findings revealed that for an aspect ratio of 65, increasing the fiber volume fraction from 0.26% to 0.64% resulted in a substantial 30% increase in compressive strength. However, for aspect ratios of 55 and 80, no significant change in compressive strength was observed when the fiber volume fraction was increased.
Holschemacher et al. [24] demonstrated that the addition of steel fibers to high-strength concrete resulted in enhanced ductility and increased load-carrying capacity after cracking [24]. This indicates an ability of the concrete to withstand higher loads without failure and with better resistance to cracking.
Fiber properties, such as L/d aspect ratio, volumetric fraction, and fiber distribution, significantly influence the mechanical properties of concrete [19,20,24]. It has been recommended that the volume fraction of steel fibers in concrete should range from 1% to 2% of the absolute volume of concrete [25,26,27]. Higher fiber content can reduce workability, often requiring the addition of chemical admixtures, such as plasticizers [28,29]. According to Altun et al. [30], the volume fraction of steel fiber in concrete should ideally range between 1% and 2.5%.
The consistency and uniformity of the mixture may suffer if steel fibers are not added to the concrete mix in an even manner. Additionally, this unequal distribution may cause fiber clustering, which in turn affects how the reinforcement affects the mechanical properties of the concrete [31]. Park et al. [32] noted a scarcity of research concerning the performance of high-strength deformed steel fibers in ultra-high-performance concrete (UHPC) with significant shrinkage. Specifically, the correlation between pullout load and slip response remains underexplored.
This knowledge gap indicates a lack of comprehension about the behavior of these fibers when encountering forces that lead to their extraction from the concrete, particularly in UHPC with elevated shrinkage. Viktorovich et al. [33] suggest that addressing the practical challenges linked to fiber-reinforced concrete’s application requires the development of a method to compute its crack resistance across diverse load conditions and design attributes. This approach would empower engineers to evaluate the crack resistance of fiber-reinforced concrete, ensuring its structural durability and integrity in a range of construction contexts. Eik and Puttonen (2011) reported also that the efficiency of load transfer depends on the bonding interface between the matrix and fibers, the fiber orientation, and the crack propagation [34].
The response surface methodology (RSM) serves as an effective statistical tool for experimental design, modeling, evaluating factor effects, and optimizing conditions [35,36]. This methodology identifies both linear interactions and quadratic contributions of independent variables to concrete properties, allowing the optimization of the desired outcomes. The application of RSM to the precise formulation of recycled steel fiber-reinforced concrete offers several benefits, including the improvement of its fresh and hardened properties and the facilitation of efficient project execution [37,38,39].
The analysis of variance (ANOVA) is a statistical method employed to assess correlations between variables and to determine significant differences existing among groups. It helps in estimating statistical parameters and comprehending to what extent each source of variation influences the observed overall variability. Through the use of ANOVA, we can discern the influence of independent variables (factors) on dependent variables (responses) and determine the statistical significance of these relationships. This allows for a comprehensive understanding of the factors contributing to the observed variation and their respective impacts on the dependent variables [40,41,42].
The validation of the optimal design proportions derived from the RSM model involves a comparative analysis of the desirability and the absolute relative percent error with the experimental results, demonstrating minimal values and indicating the accurate prediction of the desired responses. This affirms the reliability and accuracy of the RSM model in providing precise predictions for the specified design proportions. Additionally, the “ramp view diagram for optimization” is a graphical representation that serves to visualize the optimization process and to facilitate the comparison between the different variables’ influence on the desired outcome [43,44,45].
The objective of this study is to investigate the characteristics of recycled fiber-reinforced concrete in its fresh and hardened states. It aims to develop mathematical models using RSM by analyzing experimental data. The focus is on recovering steel fibers from fragile twisted cable waste (19 strands * 7 wires) for utilization in high-performance concrete formulations. Additionally, the study aims to assess the combined effects of water/binder (W/B) ratio, fiber aspect ratio (L/d), and steel fiber content (SFC) on the performance of the concrete.
The validation of the generated models involved the utilization of three optimal parameters. Furthermore, a comparative analysis of the desirability and the absolute relative percent error, as well as an assessment based on the ramp view diagram, was conducted to ensure maximum accuracy and reliability.
2. Materials and Methods
2.1. Materials
In this study, the cement employed was a Portland cement CPA—CEM I 42.5 R produced by LAFARGE cement factory located in Biskra, Algeria. The cement exhibits a specific area of 3600 cm2/g and a density of 3.14 g/cm3. The silica fume (SF) (MEDAPLAST HP) utilized in this study was obtained from Granitex factory in Algeria. It possesses a density of 2.24 and a specific area of 10000 cm2/g. This investigation employed a local dune sand as fine aggregate extracted from Oued Souf (South-eastern of Algeria). It is characterized by a high sand equivalent value of 88%, a density of 2.60, and a fineness modulus of 1.95. Furthermore, it is classified as fine sand and exhibits a significant quartz content.
The chemical compositions of cement, dune sand, and silica fume are given in Table 1.

Table 1.
Chemical properties of cement, dune sand, and silica fume.
Table 2 provides a summary of the physical properties of the utilized gravel types, namely G 3/8 and G 8/16. These gravels are obtained through the crushing of limestone rock sourced from a quarry situated in Setif, Algeria.

Table 2.
Physical characteristics of used gravels.
The particle size analysis of the materials used for the confection of HPFRC is presented in Figure 1.
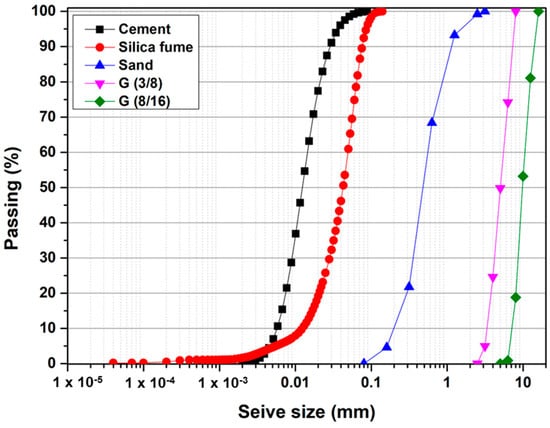
Figure 1.
Particle size curves of materials.
For this study, a high-water-reducing superplasticizer (SP) called MEDAFLOW RE 25 was employed with a density of 1.06. Additionally, 4 cables and steel wires consisting of 19 strands with 7 wires were used; these were obtained from a construction and demolition site located in Bordj Bou Arreridj (north-east of Algeria). To remove impurities, organic compounds, and rust, these cables and wires were subjected to a degreasing process in a 10% caustic soda NaOH solution for 24 h, as depicted in Figure 2.
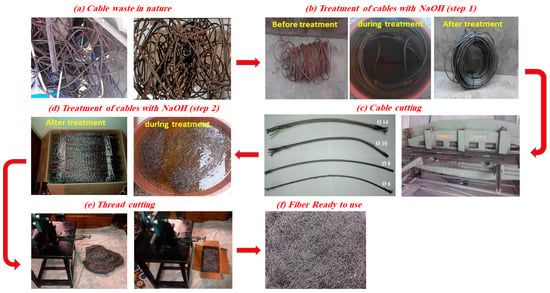
Figure 2.
Preparation and NaOH treatment of recycled cables.
At the end of the treatment, the threads are brushed and washed with distilled water. The fibers utilized in this study were derived from waste cable and were cut into five (5) required wavy shapes with specific aspect ratios, as illustrated in Figure 3.
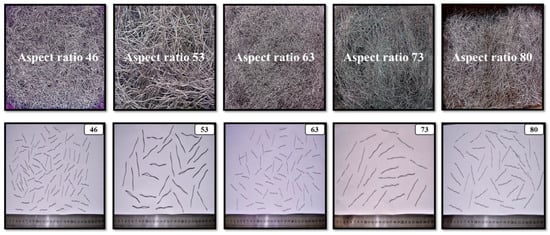
Figure 3.
Aspect ratios (L/d) of the used fibers.
The five (5) aspect ratios (L/d) of the chosen fibers are presented in Table 3.

Table 3.
Aspect ratios (L/d) of recycled steel fibers.
Standardized specimens of different diameters (0.35, 0.50, 0.67, and 0.92mm) with a length of 200 mm were prepared according to the ISO 6892 standard [46] The used wires had different diameters, an average tensile strength of 1850 MPa, and an elasticity modulus less than 200 GPa.
2.2. Experimental Procedure
Twenty compositions were selected using CCD of RSM in order to carry out the experimental tests as shown in Figure 4 [47].
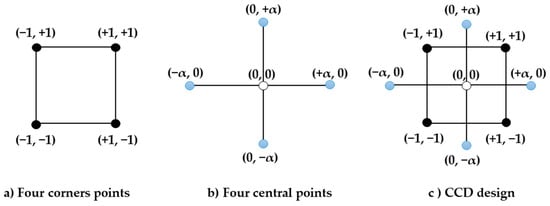
Figure 4.
CCD design module [45].
Indeed, this method was used to predict dependent variables (responses), including slump, CS, FS, STS, and WA. In this design, three parameters, referred to as independent variables or factors, were considered. These parameters included the water-to-binder ratios (W/B), the length–diameter aspect ratio (L/d), and steel fiber content (SFC) in kg/m³, denoted as A, B, and C in coded terms, respectively. Each factor value varied on five (5) levels, namely: the axial points (−α= −1.68/+α = +1.68), factorial points (−1/+1), and central point (0) [39]. The number of experiments, summarized in Table 4, is determined by Equation (1):
where k is the number of independent variables, 2k are the factorial points, 2k is the axial points, and c is the number of experiments at the central point [48]. The model used to predict the response and give its relationship with the independent variables is represented by the second-order polynomial Equation (2) [49,50,51,52]:
where Y is the response function (in our case it is represented by slump, CS, FS, STS, and WA), β0 is a constant coefficient, βi, βii, and βij are the coefficients of linear, quadratic, and interactive terms, respectively, Xi and Xj are the variables, and E is the random error [53].
N = 2k + 2k + c

Table 4.
Coding and real levels for CCD models.
Multiple regression is a statistical approach utilized to determine the optimal coefficients for each independent variable, ensuring the best possible fit for the experimental data and facilitating the prediction of the dependent variables. This technique is achieved using the least squares or the maximum likelihood estimations [54,55]. Valuable information can be obtained from the multiple regression approach regarding the collective effect of multiple independent variables on the dependent variable, which allows accurate predictions to be made based on the relationships established in the regression model [44,56].
The formulation of HPFRC without entrained air was adopted in this study [5]. This method, derived from Sherbrooke University, is based on the same principle as ACI 211. 1-91, 1991 [57]. The Dreux–Gorisse concrete formulation method was adopted for the determination of the granular composition of coarse aggregates [58]. The sand content was adjusted for the different compositions to obtain a cubic meter of concrete.
Table 4 presents a comprehensive overview of the input variables employed in the experimental design, including their coding and corresponding actual levels.
The incorporation of a high dosage of fibers in the concrete has the potential to disrupt the granular arrangement of the matrix, leading to a decrease in the mixture’s workability and altering its compactness [59]. It is obvious that this disturbance is all the more important as the percentage of fibers increases. It is therefore on this basis that the steel fiber contents were chosen, ranging from 15 to 30 kg/m3. Researchers who used recycled steel fibers extracted from tires in concrete concluded that the geometric characterization of these fibers is highly variable; the nominal diameter varies from 0.1 to 2 mm with an average aspect ratio varying from 20 to 150 [60]. These deviations mainly depend on both the recycling process and the original source.
The mixing time was approximately 5 to 7 min in order to ensure an acceptable coating of the aggregates and a suitable uniformity in the mixture [39]. Cubic molds with dimensions of 100 × 100 × 100 mm were used for preparing concrete specimens for compressive strength testing. Prismatic samples with dimensions of 70 × 70 × 280 mm were cast for flexural strength testing. Cylindrical specimens with a diameter of 100 mm and a height of 200 mm were utilized for split tensile strength. All samples were kept for 24 h in the molds, then demolded and subjected to a curing period of 28 days within a temperature-controlled water bath in the control room of the laboratory, maintained at 20 °C. This preconditioning was carried out before conducting the performance tests.
The concrete mix design for the twenty (20) samples generated by the RSM is presented in Table 5. It is important to note that the water content was kept constant for all concrete mixtures. Therefore, the evolution of W/B in this case study is attributed only to variations in the binder content (i.e., an increase in W/B from 0.27 to 0.31 indicates a corresponding decrease in the binder content from 518.51 kg/m3 to 451.61 kg/m3).

Table 5.
Proportions of HPFRC mixtures (kg/m3).
The methodology employed in the experiments is depicted through a flow chart presented in Figure 5. This visual representation outlines the sequential approach of the experimental process, aiding comprehension and practical implementation with added details [61].
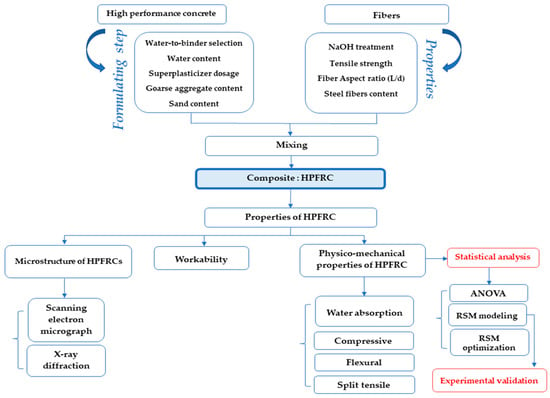
Figure 5.
Flow chart illustrating the overall methodology.
After each curing age, the following tests were conducted. The slump test was measured according to BS EN 12350-2 [62]. The compressive strength (CS) was carried out using cubic test specimens of (100 × 100 × 100) mm3 following BS EN 12390-3 [63]. The FS was conducted using prismatic samples with a dimension of (70 × 70 × 280) mm3 in accordance with BS EN 12390-5 [64]. The STS was carried out on cylindrical specimens of 100 mm diameter and 200 mm height conforming to BS EN 12390-6 [65]. WA was carried out on cubic specimens with dimensions of (100 × 100 × 100) mm3 according to ASTM C 642-06 [66]. It should be noted that all formulations were meticulously prepared following uniform procedures, employing identical material resources, and cast within identical mold geometries under closely controlled conditions.
3. Results and Discussion
3.1. Physicomechanical Properties of HPFRC
The laboratory test results are listed in Table 6. Each reported value is the average of three (3) readings obtained from three different specimens.

Table 6.
Experimental results.
3.2. Modeling and Analysis
The test results obtained from the mixtures, prepared with variations in W/B, L/d, and SFC, were utilized to develop mathematical models. These models aimed to describe the individual and combined effects of each factor on the properties of HPFRC in both the fresh and hardened state, including slump, CS, FS, STS, and WA. The quadratic mathematical models, obtained in terms of coded factors elaborated by a statistical software (Expert design. Version 13), are expressed by Equations (3)–(7).
In the generated models, the factors A, B, and C correspond to the water-to-binder ratio (W/B), the aspect ratio (L/d), and the steel fiber content (SFC), respectively. It is important to note that an increase in the values of factor coefficients signifies an increase in the corresponding modeled response, whereas a decrease represented by negative values results in a reduction in the response [67].
Slump (cm) = +25.02 − 1.37A + 0.30B − 1.28C +0.13AB + 0.00AC + 0.00BC − 0.99A2 − 0.55B2 −1.16C2
CS (MPa) = +95.49 − 2.32A + 1.76B + 3.65C − 0.63AB + 0.16AC + 0.97BC − 1.61A2 − 2.97B2 − 1.12C2
FS (MPa) = +7.22 − 0.22A + 0.39B + 0.69C + 0.014AB + 0.052AC + 0.17BC − 0.26A2 − 0.095B2 − 0.23C2
STS (MPa) = +6.53 − 0.42A + 0.47B + 0.57C − 0.045AB + 0.053AC − 0.42BC − 0.23A2 − 0.10B2 − 2.907 × 10⁻³C2
WA (%) = +0.78 + 0.25A − 0.15B − 0.30C − 0.023AB + 0.044AC − 0.025BC + 0.26A2 + 0.29B2 + 0.41C2
ANOVA is a statistical technique utilized to assess the significance and contribution of different factors in explaining the observed variability in responses. The implementation of ANOVA also facilitates the dissection of distinct effects from the variance observed in the measured response. It should be noted that ANOVA analysis was carried out using Expert Design Software.
This analysis progressed through a methodical sequence involving crucial steps in the statistical study. The ANOVA process begins with data entry. Then, response surface methodology (RSM) is used to understand the interactions between distinct variables. The next step aims to specify the response of the model. The execution of the program is conducted through experimentation and the collection of critical data. Finally, the generation of the ANOVA tables constitutes a key analytical step of this method.
The resulting contributions of HPFRC properties in the fresh and hardened states are summarized in Table 7 and Table 8, respectively.

Table 7.
Analysis of variance (ANOVA) of HPFRC properties in the fresh state.

Table 8.
Analysis of variance (ANOVA) HPFRC properties in the hardened state.
ANOVA results reveal that the precision values for all models exceed 4, indicating their ability to adequately represent the relationship between independent variables and responses. The obtained results show a p-Value < 0.05 for all the parameters studied, which implies also that the models developed by the RSM method are significant. The coefficients of determination (R2), calculated to verify the adequacy of the models obtained, all exceed 80%, signifying a strong correlation between the predicted and experimental results. As the R2 value approaches one (1), the precision of the proposed model increases [39].
The significance of slump, CS, FS, STS, and WA is confirmed by the high F-values, which are 4.72, 5.54, 5.08, 8.67, and 7.40, respectively. Linear terms are statistically insignificant (p-Value > 0.05), i.e., term B for slump, CS, WA, and term A for FS, while the other linear terms are significant (p-Value < 0.05). The BC interaction effect on STS is significant, whereas the interaction effects on the other properties are insignificant. The quadratic terms A2, B2, and C2 are significant for WA. The A2 and C2 terms for slump, the B2 term for CS, and the A2 terms for STS are significant, while all other quadratic terms are insignificant.
According to the probability distribution of the experimental values depending on the predicted values shown in Figure 6a–e, it can be seen that the response clouds are all close to the fit line. This indicates that the developed models correctly predict the physicomechanical properties of HPFRC in terms of the chosen factors. It’s worth mentioning that the probability distribution points, ranging from blue to red, signifies the variation in values from minimum to maximum values as generated by Design Expert software.
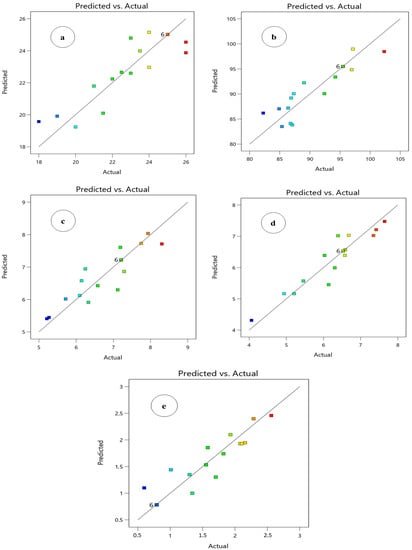
Figure 6.
Probability distribution plot of: (a) slump; (b) compressive strength at 28 days; (c) flexural strength at 28 days; (d) split tensile strength at 28 days; (e) water absorption.
3.3. RSM Optimization
The 2D contour plots and 3D surface curves are used to visualize the response surface and to evaluate the eventual and interactive relationship between the design parameters of the mix and the HPFRC properties. These graphs aim to establish the studied response values and desirable operating conditions and can give a clearer picture of the response surface. Contour plots and surface curves of slump, CS, FS, and WA show that the interactions between W/B, L/d, and SFC exhibit perfect elliptical contours. In contrast, the interactions among the STS factors exhibit elliptical contours that are relatively perfect.
The surface response plots presented in Figure 7a illustrate the variation of slump values as a function of W/B, L/d, and SFC. It is evident that the slump of the concrete mixtures was less influenced by the L/d ratio compared to the significant impact of SFC and W/B ratio. Varying W/B from 0.28 to 0.31 and SFC from 22 to 29 kg/m3 resulted in substantial differences in slump values of approximately 8 and 6 cm, respectively. However, despite the increase in L/d ratio, the change in slump values remained relatively consistent within a narrow range of 2 cm.
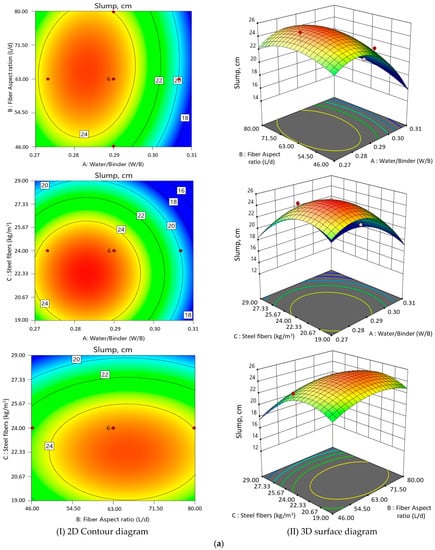
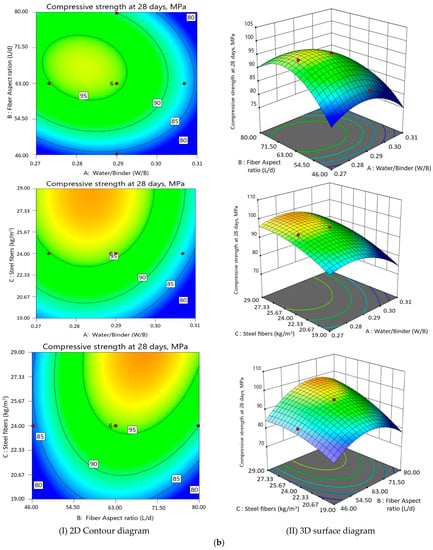
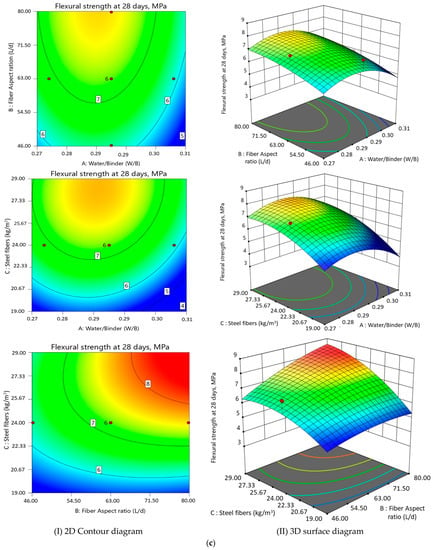
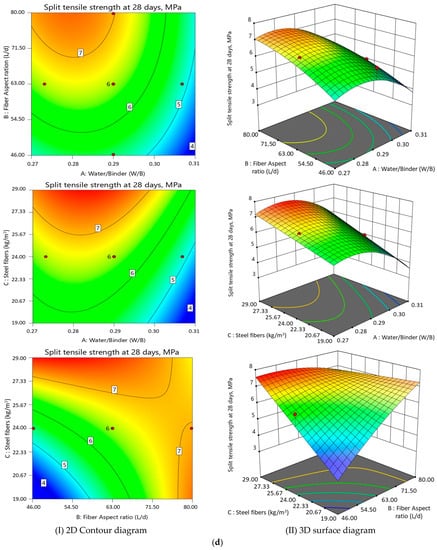
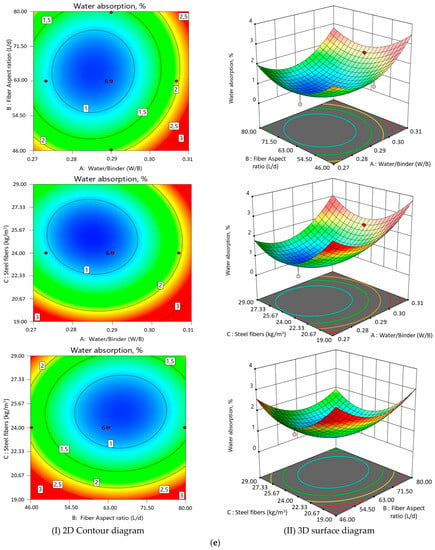
Figure 7.
(a). RSM analysis diagrams of slump. (b): compressive strength at 28 days. (c): flexural strength at 28 days. (d): split tensile strength at 28 days. (e): water absorption.
A high slump value was achieved for an L/d ratio of 63, a W/B ratio of around 0.28, and an SFC of approximately 22 kg/m3. Conversely, the lowest slump values were observed when both the W/B and FC were at their maximum values. The slump of HPFRC exhibited a decrease as the aspect ratio of the fibers increased, which is a phenomenon also observed in ordinary concrete [68,69]. This decrease can be attributed to the increase in the specific surface area resulting from the addition of fibers. The presence of steel fibers in the concrete acts as a structural framework that restricts the flowability of the mixture. Consequently, the hindrance caused by the fiber network leads to a reduction in the slump of the HPFRC [70,71,72].
Moreover, steel fibers with a high aspect ratio enhance the interlocking and bonding between fibers, resulting in an increased tendency toward fiber clustering or bundling. This phenomenon further restricts the fluidity of the mixture, leading to a decrease in slump [70,73].
It is important to note that the water content was kept constant for all concrete mixtures. Consequently, the observed changes in W/B can be attributed solely to variations in the binder content. Specifically, an increase in the W/B ratio from 0.27 to 0.31 corresponded to a decrease in the binder content from 518.51 kg/m3 to 451.61 kg/m3 (Table 6).
As depicted in the Figure 7a, it is also evident that an increase in the W/B ratio results in a decrease in the slump values. In other words, a reduction in the binder content leads to a decrease in flowability. Multiple studies have indicated that insufficient cement paste in concrete leads to a decrease in the workability. This adjustment is crucial to maintain the desired strength of the concrete while simultaneously achieving the desired level of workability [74,75,76]. A higher volume of binder in concrete mixtures decreases particle interactions and friction, leading to an increase in plastic viscosity, ultimately resulting in increasing flowability [77,78,79]. The results also indicate that the increase in L/d has a less significant effect on the slump, regardless of the variations in W/B and SFC values.
According to Figure 7b, high compressive strength values were achieved with an L/d ratio of approximately 70, a W/B ratio of around 0.28, and a maximum SFC (29 kg/m3). Conversely, the lowest compressive strength values were observed with the maximum W/B and minimum SFC values, regardless of the variations in L/d. Yu et al. [80] found that incorporating a low percentage of steel fibers (approximately 2.5% by volume) in concrete can enhance its compressive strength by suppressing the formation of cracks. This improvement can be attributed to the reinforcing effect of steel fibers, which fortify the concrete and enhance its resistance to fracture when it is subjected to pressure.
According to Jagadesh et al. [81], increasing the amount of binder in concrete involves increasing the proportion of cementitious material in the mixture, which hinders the formation of hydration products. Hydration is a chemical reaction that occurs between water and cement particles, resulting in the formation of calcium silicate hydrate (C-S-H) gel, which contributes to strength development. A higher binder content causes more water molecules to be consumed during hydration, leaving less available for other reactions. This reduction in available water can hinder or slow down further hydration reactions and limit the formation of additional C-S-H gel.
Sanjay, Aswath, and Singh [82] clarify that when there is too much binder in the mixture, it can cause the compressive strength to decrease. This happens because the extra binder does not join the process that makes the material strong, which leads to the material becoming less strong overall.
Based on response surface plots presented in Figure 7c, it can be observed that a high flexural strength was achieved when both the SFC and L/d were at their maximum values, regardless of W/B variations. On the other hand, the lowest values of flexural strength were observed for a low SFC and a high W/B ratio.
Incorporating steel fibers into concrete mixes has been shown to enhance the flexural strength, which represents the material’s resistance to bending or deformation under load. This improvement can be attributed to the strength of the steel fibers and their interlocking capability with other concrete components, resulting in an increased load-carrying capacity. However, it should be noted that a higher dosage of steel fibers can adversely affect workability, impacting the ease of handling and placing the concrete. Therefore, the fiber dosage should be carefully considered to strike a balance between improved flexural strength and workability [83,84].
The results obtained from Figure 7d demonstrate that an increase in both L/d and SFC, along with a low W/B ratio, led to higher split tensile strength values (up to 7 MPa). Conversely, the lowest values of split tensile strength were observed when the W/B ratio was high and both the SFC and L/d were at their minimum values. It can also be observed that there was a noticeable improvement in STS with low W/B ratio.
The incorporation of steel fibers in concrete has been observed to enhance its performance in terms of split tensile strength. This improvement can be attributed to the ability of the steel fibers to bridge cracks that develop when the concrete is subjected to stress. By bridging these cracks, the steel fibers enhance the ductility of the concrete, reducing its brittleness and increasing its load-carrying capacity. Consequently, the presence of steel fibers contributes to the overall improvement of the concrete’s performance in terms of split tensile strength [85,86,87].
The perfect elliptical contours depicted in Figure 7e suggest that HPFRC mixtures with an L/d ratio of about 65, SFC of approximately 25 kg/m3, and W/B ratio between 0.28 and 0.29 exhibit lower water absorption compared to other mixtures. Furthermore, it can be observed that mixtures containing a low SFC and a low L/d exhibit significantly high WA compared to the other mixtures.
According to Miloud et al. and Rahmani et al. [88,89], the addition of steel fibers to concrete can result in an increase in both water and gas permeability, regardless of the quantity or length of the fibers. This finding contradicts previous research, which indicated that steel fiber-reinforced concrete had lower WA and permeability compared to plain concrete. The presence of steel fibers in the concrete matrix can create interconnected voids and pathways, allowing for easier passage of water and gas. These findings highlight the need for careful consideration of the specific requirements and desired properties when incorporating steel fibers into concrete mixtures, especially in terms of permeability characteristics.
3.4. Experimental Validation
The objective of optimizing the concrete mix design is to strike a balance between multiple desired properties. In this study, the optimization process was utilized to determine the optimal values of the W/B ratio, L/d ratio, and SFC, with the aim of achieving favorable outcomes of compressive strength, tensile strength, flexural strength, slump, and water absorption. By considering all these factors simultaneously, a compromise optimum was sought to ensure desirable values for all the investigated responses. The validation of the generated models involved the use of three optimal parameters (W/B ratio of 0.28, L/d ratio of 63, and SFC of 25 kg/m3), which were shared across all the responses.
In order to validate the optimal design proportions derived from the RSM model, an extra experiment was conducted, and the outcomes are documented in Table 9. Comparative analysis of the desirability and absolute relative percent error between the RSM model and the experimental results revealed minimal values. This observation suggests that the RSM model effectively predicted the desired responses with precision. Consequently, the reliability and accuracy of the RSM model in providing accurate predictions for the specified design proportions can be affirmed [84]. The estimation of the absolute relative percent error (PE) was determined using Equation (8).

Table 9.
Experimental validation of the studied models.
The low values of PE indicate that the goal model accurately predicted the desired responses, providing reliable estimations for the experimental results. The results indicate that the measured values exhibit an absolute relative error of less than 6% and correspond to a correlation coefficient greater than 94%. The term “Target” denotes the precise value that is sought or intended in the optimization process. It represents the desired objective or goal for a specific parameter or variable. By establishing a target value, the optimization process is directed towards accomplishing the desired outcomes within the prescribed boundaries. The target value serves as a guiding principle, steering the optimization process towards achieving the intended results for the specified parameter or variable [90,91].
Desirability reflects the degree to which the responses align with the desired targets. The provided table presents both the optimized and experimental values for these properties, as well as the percentage variation between them. This allows for a comprehensive assessment of the extent to which the achieved values correspond to the desired targets for each response. A desirability value close to 1 signifies a high level of achievement in meeting the desired objectives or targets for the evaluated parameters or variables. Essentially, it indicates that the conditions under consideration are highly favorable for attaining the desired properties [45].
The ramp view diagram presented in Figure 8 offers a graphical representation that visually demonstrates the relationship between variables and their influence on the desired outcome during the optimization process. This diagram serves as a valuable tool for analyzing and comparing the effects of various factors, facilitating decision making and enhancing overall efficiency [92]. By examining the figure, it becomes evident how the optimal levels of W/B ratio (0.28), L/d ratio (63), and SFC (25 kg/m3) influence the various responses of interest, including slump, compressive strength, flexural strength, tensile strength, and water absorption.
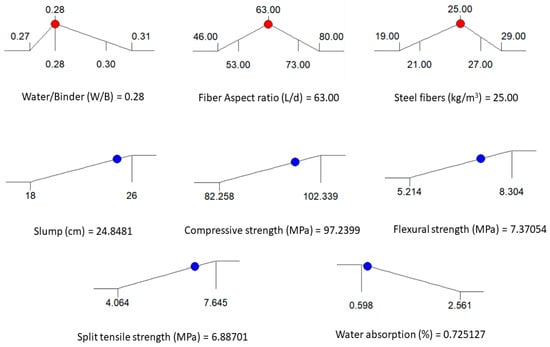
Figure 8.
Ramp view diagram of optimization.
3.5. Microstructure of HPFRCs
Figure 9a–e represent the scanning electron microscopic (SEM) analysis of the different optimal mixtures of HPFRCs. In general, there is a clear relationship between the aspect ratio (L/d) of fibers and the adhesion properties in fiber-reinforced concrete. The analysis conducted using scanning electron microscopy (SEM) reveals that concrete matrices with different fiber aspect ratios (46, 53, 73, and 80) exhibit distinct characteristics. Concrete specimens with higher aspect ratios tend to display more cracks, pores, and a weaker interface between the fibers and the concrete matrix. These observations suggest that the aspect ratio of the fibers plays a significant role in determining the adhesion quality and overall integrity of the fiber-reinforced concrete.
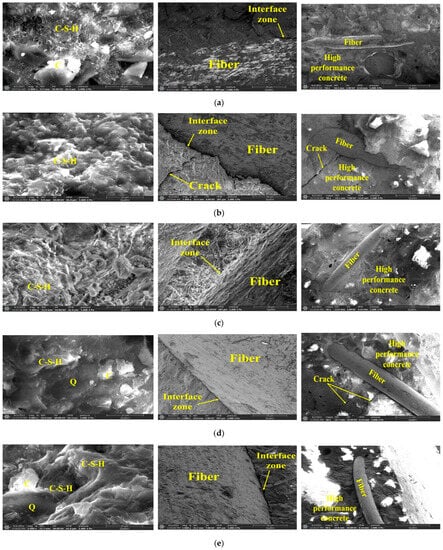
Figure 9.
Scanning electron micrograph of HPFRC mixtures at magnifications of 5000, 1000, and 50 (From left to right). (a): SEM of HPFRC11 mixture (L/d = 46). (b): SEM of HPFRC2 mixture (L/d = 53). (c): SEM of HPFRC14 mixture (L/d = 63). (d): SEM of HPFRC4 mixture (L/d = 73). (e): SEM of HPFRC12 mixture (L/d = 80).
Figure 9c corresponds to an aspect ratio of L/d = 63 (L = 22 mm and d = 0.35 mm), illustrating the emergence of hydration products surrounding the surface of steel fibers within the matrix. This phenomenon plays a crucial role in enhancing the interfacial adhesion force between the fibers and the matrix. As a result, the steel fibers react with calcium hydroxide (Ca(OH)2) and other soluble components, including silicon (Si), aluminum (Al), and calcium (Ca) in the matrix. This reaction facilitates the formation of calcium silicate hydrate gels, thereby promoting the generation of cement hydration products [93,94].
According to the findings of Khameneh Asl and Sadeghian [95], when the length of fibers in a cementitious composite is below their critical length, enhancing the bond strength between the fibers and the matrix through coating can lead to an improvement in fracture strength. This is attributed to the increased resistance to fiber pull-out from the matrix. The coating on the fibers enhances the interfacial adhesion, making it more challenging for the fibers to be pulled out, thereby increasing the overall fracture strength of the composite. These results highlight the potential benefits of optimizing the fiber–matrix interface to enhance the mechanical properties of fiber-reinforced cementitious materials.
Figure 10 presents the X-ray diffraction (XRD) analysis results of the investigated mixtures. The phase composition and crystallinity of the samples were analyzed using an X-ray diffraction (XRD) spectrometer. This instrument, specifically a Malvern Panalytical XRD spectrometer, utilized a graphite crystal monochromator and Cu-Kα1 radiation with a wavelength of 1.5406 Å, operating at 30 mA and 30 kV. The XRD test was conducted by scanning the diffraction angle (2θ) from 15° to 70° at a speed of 1.2°/min. The XRD analyses are carried out at the physicochemical analysis platform (PTAPC-LAGHOUAT) in South Algeria. For the purpose of conducting the experiments, samples were readied with particle sizes below 80 μm. These prepared samples were subsequently positioned within plastic sample holders and appropriately situated within the experimental apparatus.
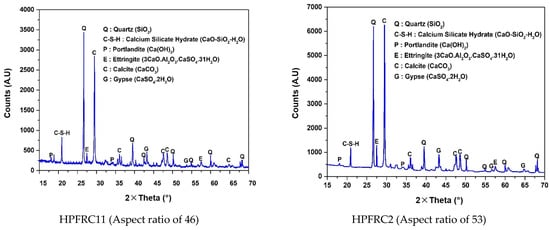
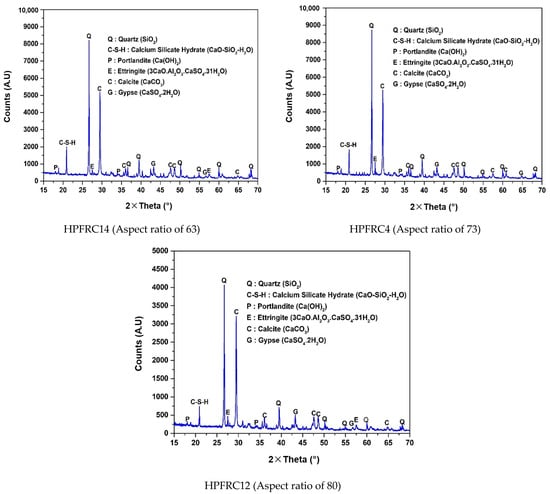
Figure 10.
X-ray diffraction (XRD) analysis of the studied HPFRC mixtures.
The XRD patterns reveal the presence of prominent peaks corresponding to calcium carbonate (CaCO3) and quartz (SiO2) in all the analyzed samples. The intensities of calcium carbonate (CaCO3) are remarkable in the HPFRC4 and HPFRC14 concretes of the order of 5265 and 5232, respectively. The HPFRC2 exhibits the most intense peak of 6269, while those of the HPFRC11 and HPFRC12 mixtures exhibit lower intensities, with values of 2844 and 3228, respectively. It is clear that the calcium carbonate (CaCO3) peaks of all the HPFRCs tested are at 29.45°. These observations are attributed to the calcareous nature of the fractions of gravel (3/8) and (8/16) used [96,97].
The intensities of quartz peaks (SiO2) were higher for the HPFRC4 and HPFRC14 mixtures achieving 8750 and 8228, respectively. HPFRC2 exhibited a peak intensity of 6205, whereas the intensities of HPFRC11 and HPFRC12 mixtures were lower, with values of 3452 and 4071, respectively. On the other hand, the HPFRC2, HPFRC4, HPFRC11, HPFRC12, and HPFRC14 presented quartz peaks that were positioned at an angle of 26.72°. Indeed, the high quartz content was due to the siliceous nature of silica fume and dune sand used [98].
The XRD analysis confirms the formation of calcium silicate hydrate C-S-H within the different HPFRC samples. The peaks characterizing the C-S-H in the HPFRC4 and HPFRC14 mixes are more visible and more intense, with intensities of 1851 and 2030, respectively, while they are weaker in the other mixtures located at 20.83°. The XRD analysis reveals prominent peaks of portlandite (Ca(OH)2) observed at 18.02°. These peaks exhibit high intensities, particularly in HPFRC4 and HPFRC14, with values of 626 and 593, respectively. In contrast, HPFRC2, HPFRC11, and HPFRC12 exhibit lower intensity peaks, with values of 541, 348, and 345, respectively. Similar results have been found by other authors [99,100].
4. Conclusions
The objective of this experimental study was to evaluate the physicomechanical behavior of high-performance fiber-reinforced concrete (HPFRC) by developing mixture design models incorporating recycled cable fibers. The analysis considered three variation parameters: water-to-binder ratios, length-to-diameter aspect ratio, and fiber content. Mathematical models were developed to predict the properties of HPFRC in both its fresh and hardened states. Based on the obtained results, the following conclusions can be drawn from this research:
- The RSM effectively predicted the different HPFRC properties. ANOVA analysis highlighted the generated models’ ability to capture the link between independent variables and responses. Probability distribution analysis further verified the model’s accuracy in predicting HPFRC properties.
- Optimal slump performance was achieved for an L/d ratio of 63 (L = 22 mm and d = 0.35 mm), a W/B ratio around 0.28, and an SFC of approximately 22 kg/m³. Conversely, the lowest slump values appeared for high W/B ratio and SFC.
- Compressive strength notably increased for an L/d ratio of around 70, a W/B ratio of about 0.28, and a maximum SFC of 29 kg/m³. Higher flexural strength was achieved for high L/d ratio and SFC, irrespective of W/B variations. In contrast, lower flexural strength values were found for a low fiber content and a high W/B ratio.
- The split tensile strength was improved by increasing both L/d ratio and SFC content with a low W/B ratio. Conversely, a weak split tensile strength was observed for high W/B ratios and low SFC and L/d ratios.
- HPFRC mixes featuring an L/d ratio of about 65, an SFC content of around 25 kg/m³, and a W/B ratio ranging from 0.28 to 0.29 exhibited reduced WA compared to other blends. Conversely, mixes with low SFC content and L/d ratio showed significantly higher WA.
- Scanning electron microscopy (SEM) images confirmed a strong bond between the cementitious matrix and recycled fibers with an aspect ratio (L/d) of 63, enhancing overall HPFRC performance. Additionally, X-ray Diffraction (XRD) analysis proved valuable in identifying mineral compounds within samples, providing insights into material composition and crystalline structure through diffraction patterns and peak intensities.
- Utilizing steel fibers extracted from cable waste in concrete proves to be an excellent approach and an effective solution for enhancing the properties of both fresh and hardened concrete. Moreover, this method contributes to waste reduction and environmental protection and reduces energy consumption during the recycling of industrial fibers.
Author Contributions
Conceptualization, Y.C. and R.Z.; methodology, Y.C. and R.Z.; investigation, Y.C. and R.Z.; resources, Y.C. and R.Z.; writing—original draft, Y.C.; writing—review and editing, Y.C., B.A.T., I.Y.H., F.D. and Y.K.; visualization, Y.C., B.A.T., I.Y.H., Y.K. and F.D.; resources, I.Y.H. All authors have read and agreed to the published version of the manuscript.
Funding
This research was funded by Deanship of Scientific Research at Najran University, under the Research Groups Funding program grant code (NU/RG/SERC/12/11).
Data Availability Statement
Not applicable.
Conflicts of Interest
The authors declare no conflict of interest.
References
- Fallah-Valukolaee, S.; Hashemi, S.K.; Nematzadeh, M. Effect of Steel Fiber on Flexural Performance of Bilayer Concrete Beams with Steel and GFRP Rebars: Experiments and Predictions. In Proceedings of the Structures; Elsevier: Amsterdam, The Netherlands, 2022; Volume 39, pp. 405–418. [Google Scholar]
- Fang, B.; Hu, Z.; Shi, T.; Liu, Y.; Wang, X.; Yang, D.; Zhu, K.; Zhao, X.; Zhao, Z. Research progress on the properties and applications of magnesium phosphate cement. Ceram. Int. 2022, 49, 4001–4016. [Google Scholar] [CrossRef]
- Shi, T.; Liu, Y.; Hu, Z.; Cen, M.; Zeng, C.; Xu, J.; Zhao, Z. Deformation Performance and Fracture Toughness of Carbon Nanofiber Modified Cement-Based Materials. ACI Mater. J. 2022, 119, 119–128. [Google Scholar]
- Abdolpour, H.; Niewiadomski, P.; Sadowski, Ł. Recycling of Steel Fibres and Spent Equilibrium Catalyst in Ultra-High Performance Concrete: Literature Review, Research Gaps, and Future Development. Constr. Build. Mater. 2021, 309, 125147. [Google Scholar] [CrossRef]
- Li, D.; Nie, J.H.; Wang, H.; Yan, J.B.; Hu, C.X.; Shen, P. Damage location, quantification and characterization of steel-concrete composite beams using acoustic emission. Eng. Struct. 2023, 283, 115866. [Google Scholar] [CrossRef]
- Onuaguluchi, O.; Banthia, N. Scrap Tire Steel Fiber as a Substitute for Commercial Steel Fiber in Cement Mortar: Engineering Properties and Cost-Benefit Analyses. Resour. Conserv. Recycl. 2018, 134, 248–256. [Google Scholar] [CrossRef]
- Cai, J.; Pan, J.; Li, G.; Elchalakani, M. Behaviors of eccentrically loaded ECC-encased CFST columns after fire exposure. Eng. Struct. 2023, 289, 116258. [Google Scholar] [CrossRef]
- Centonze, G.; Leone, M.; Aiello, M.A. Steel Fibers from Waste Tires as Reinforcement in Concrete: A Mechanical Characterization. Constr. Build. Mater. 2012, 36, 46–57. [Google Scholar] [CrossRef]
- Awolusi, T.F.; Oke, L.O.; Akinkurolere, O.O.; Ubani, D.P.; Bamisaye, R.T.; Aluko, O.G. The Application of Response Surface Methodology in Understanding the Compressive Strength and Water Absorption Capacity of Sandcrete Blocks. Silicon 2021, 13, 4123–4132. [Google Scholar] [CrossRef]
- Jin, M.; Ma, Y.; Li, W.; Huang, J.; Yan, Y.; Zeng, H.; Lu, C.; Liu, J. Multi-scale investigation on composition-structure of C-(A)-S-H with different Al/Si ratios under attack of decalcification action. Cem. Concr. Res. 2023, 172, 107251. [Google Scholar] [CrossRef]
- Zhou, S.; Lu, C.; Zhu, X.; Li, F. Preparation and Characterization of High-Strength Geopolymer Based on BH-1 Lunar Soil Simulant with Low Alkali Content. Engineering 2021, 7, 1631–1645. [Google Scholar] [CrossRef]
- Fakoor, M.; Nematzadeh, M. Evaluation of Post-Fire Pull-Out Behavior of Steel Rebars in High-Strength Concrete Containing Waste PET and Steel Fibers: Experimental and Theoretical Study. Constr. Build. Mater. 2021, 299, 123917. [Google Scholar] [CrossRef]
- Sun, L.; Wang, C.; Zhang, C.; Yang, Z.; Li, C.; Qiao, P. Experimental investigation on the bond performance of sea sand coral concrete with FRP bar reinforcement for marine environments. Adv. Struct. Eng. 2022, 26, 533–546. [Google Scholar] [CrossRef]
- Dieng, L.; Périer, V.; Gaillet, L.; Tessier, C. Mécanismes de Dégradation et Moyens de Protection des Câbles du Génie Civil: Exemple des Câbles de Haubanage. Mech. Ind. 2009, 10, 33–42. [Google Scholar] [CrossRef]
- Becker, K. La Resistance a la Fatigue des Cables D’acier-Influence sur la Duree de vie des Cables D’extraction; Le tréfilé; MEISENBACH KG: Fischbachtal, Germany, 1979; pp. 212–215. Available online: https://trid.trb.org/view/1045369 (accessed on 17 July 2023).
- Zhang, W.; Kang, S.; Liu, X.; Lin, B.; Huang, Y. Experimental study of a composite beam externally bonded with a carbon fiber-reinforced plastic plate. J. Build. Eng. 2023, 71, 106522. [Google Scholar] [CrossRef]
- As’ad, S.; Gunawan, P.; Alaydrus, M.S. Fresh State Behavior of Self Compacting Concrete Containing Waste Material Fibres. Procedia Eng. 2011, 14, 797–804. [Google Scholar] [CrossRef][Green Version]
- Denzin Tonoli, G.H.; de Souza Almeida, A.E.F.; Pereira-da-Silva, M.A.; Bassa, A.; Oyakawa, D.; Savastano, H., Jr. Surface Properties of Eucalyptus Pulp Fibres as Reinforcement of Cement-Based Composites. Holzforschung 2010, 64, 595–601. [Google Scholar] [CrossRef]
- Bayramov, F.; Taşdemir, C.; Taşdemir, M. Optimisation of Steel Fibre Reinforced Concretes by Means of Statistical Response surface Method. Cem. Concr. Compos. 2004, 26, 665–675. [Google Scholar] [CrossRef]
- Yazıcı, Ş.; İnan, G.; Tabak, V. Effect of Aspect Ratio and Volume Fraction of Steel Fiber on the Mechanical Properties of SFRC. Constr. Build. Mater. 2007, 21, 1250–1253. [Google Scholar] [CrossRef]
- Qu, D.; Cai, X.; Chang, W. Evaluating the Effects of Steel Fibers on Mechanical Properties of Ultra-High Performance Concrete Using Artificial Neural Networks. Appl. Sci. 2018, 8, 1120. [Google Scholar] [CrossRef]
- Mohtasham Moein, M.; Saradar, A.; Rahmati, K.; Hatami Shirkouh, A.; Sadrinejad, I.; Aramali, V.; Karakouzian, M. Investigation of Impact Resistance of High-Strength Portland Cement Concrete Containing Steel Fibers. Materials 2022, 15, 7157. [Google Scholar] [CrossRef]
- Kytinou, V.K.; Chalioris, C.E.; Karayannis, C.G.; Elenas, A. Effect of Steel Fibers on the Hysteretic Performance of Concrete beams with Steel Reinforcement—Tests and Analysis. Materials 2020, 13, 2923. [Google Scholar] [CrossRef]
- Holschemacher, K.; Mueller, T.; Ribakov, Y. Effect of Steel Fibres on Mechanical Properties of High-Strength Concrete. Mater. Des. 2010, 31, 2604–2615. [Google Scholar] [CrossRef]
- Huang, H.; Yuan, Y.; Zhang, W.; Zhu, L. Property Assessment of High-Performance Concrete Containing Three Types of Fibers. Int. J. Concr. Struct. Mater. 2021, 15, 39. [Google Scholar] [CrossRef]
- Chun, B.; Yoo, D.-Y. Hybrid Effect of Macro and Micro Steel Fibers on the Pullout and Tensile Behaviors of Ultra-High-Performance Concrete. Compos. Part B Eng. 2019, 162, 344–360. [Google Scholar] [CrossRef]
- Park, J.-J.; Yoo, D.-Y.; Park, G.-J.; Kim, S.-W. Feasibility of Reducing the Fiber Content in Ultra-High-Performance Fiber-Reinforced Concrete under Flexure. Materials 2017, 10, 118. [Google Scholar] [CrossRef] [PubMed]
- Basser, H.; Shaghaghi, T.M.; Afshin, H.; Ahari, R.S.; Mirrezaei, S.S. An Experimental Investigation and Response Surface Methodology-Based Modeling for Predicting and Optimizing the Rheological and Mechanical Properties of Self-Compacting Concrete Containing Steel Fiber and PET. Constr. Build. Mater. 2022, 315, 125370. [Google Scholar] [CrossRef]
- Tang, H.; Yang, Y.; Li, H.; Xiao, L.; Ge, Y. Effects of chloride salt erosion and freeze–thaw cycle on interface shear behavior between ordinary concrete and self-compacting concrete. Structures 2023, 56, 104990. [Google Scholar] [CrossRef]
- Altun, F.; Haktanir, T.; Ari, K. Effects of Steel Fiber Addition on Mechanical Properties of Concrete and RC Beams. Constr. Build. Mater. 2007, 21, 654–661. [Google Scholar] [CrossRef]
- Ahmad, J.; Manan, A.; Ali, A.; Khan, M.W.; Asim, M.; Zaid, O. A Study on Mechanical and Durability Aspects of Concrete Modified with Steel Fibers (SFs). Civ. Eng. Arch. 2020, 8, 814–823. [Google Scholar] [CrossRef]
- Park, S.H.; Ryu, G.S.; Koh, K.T.; Kim, D.J. Effect of Shrinkage Reducing Agent on Pullout Resistance of High-Strength Steel Fibers Embedded in Ultra-High-Performance Concrete. Cem. Concr. Compos. 2014, 49, 59–69. [Google Scholar] [CrossRef]
- Viktorovich, T.V.; Serov, S.; Konstantinovich, N.V.; Dutov, A.S.; Rozhok, A. The Impact of Fiber Reinforcement on the Strength Characteristics of Concrete Used For the Construction of Hydraulic Structures. In Proceedings of the 4th International Youth Conference on Radio Electronics, Electrical and Power Engineering (REEPE), Moscow, Russia, 17–19 March 2022; pp. 1–5. [Google Scholar]
- Eik, M.; Puttonen, J. Challenges of Steel Fibre Reinforced Concrete in Load Bearing Structures. Raken. Mek. 2011, 44, 44–64. [Google Scholar]
- Rahim, N.I.; Mohammed, B.S.; Abdulkadir, I.; Dahim, M. Effect of Crumb Rubber, Fly Ash, and Nanosilica on the Properties of Self-Compacting Concrete Using Response Surface Methodology. Materials 2022, 15, 1501. [Google Scholar] [CrossRef] [PubMed]
- Alyamac, K.E.; Ghafari, E.; Ince, R. Development of Eco-Efficient Self-Compacting Concrete with Waste Marble Powder Using the Response Surface Method. J. Clean. Prod. 2017, 144, 192–202. [Google Scholar] [CrossRef]
- Uche, O.A.; Kelechi, S.E.; Adamu, M.; Ibrahim, Y.E.; Alanazi, H.; Okokpujie, I.P. Modelling and Optimizing the Durability Performance of Self Consolidating Concrete Incorporating Crumb Rubber and Calcium Carbide Residue Using Response Surface Methodology. Buildings 2022, 12, 398. [Google Scholar] [CrossRef]
- Adamu, M.; Ibrahim, Y.E.; Alanazi, H. Evaluating the Influence of Elevated Temperature on Compressive Strength of Date-Palm-Fiber-Reinforced Concrete Using Response Surface Methodology. Materials 2022, 15, 8129. [Google Scholar] [CrossRef] [PubMed]
- Ren, G.; Gao, X.; Zhang, H. Utilization of Hybrid Sisal and Steel Fibers to Improve Elevated Temperature Resistance of Ultra-High Performance Concrete. Cem. Concr. Compos. 2022, 130, 104555. [Google Scholar] [CrossRef]
- de la Rosa, Á.; Ruiz, G.; Poveda, E. Study of the Compression Behavior of Steel-Fiber Reinforced Concrete by Means of the Response Surface Methodology. Appl. Sci. 2019, 9, 5330. [Google Scholar] [CrossRef]
- Kostrzanowska-Siedlarz, A.; Gołaszewski, J. Statistical Models Supporting the High-Performance Self-Compacting Concrete (HPSCC) Design Process for High Strength. Materials 2022, 15, 690. [Google Scholar] [CrossRef]
- Akbar, M.; Umar, T.; Hussain, Z.; Pan, H.; Ou, G. Effect of Human Hair Fibers on the Performance of Concrete Incorporating High Dosage of Silica Fume. Appl. Sci. 2022, 13, 124. [Google Scholar] [CrossRef]
- Khan, M.B.; Shafiq, N.; Waqar, A.; Radu, D.; Cismaș, C.; Imran, M.; Almujibah, H.; Benjeddou, O. Effects of Jute Fiber on Fresh and Hardened Characteristics of Concrete with Environmental Assessment. Buildings 2023, 13, 1691. [Google Scholar] [CrossRef]
- Khan, M.B.; Waqar, A.; Bheel, N.; Shafiq, N.; Hamah Sor, N.; Radu, D.; Benjeddou, O. Optimization of Fresh and Mechanical Characteristics of Carbon Fiber-Reinforced Concrete Composites Using Response Surface Technique. Buildings 2023, 13, 852. [Google Scholar] [CrossRef]
- Mohammed, B.S.; Khed, V.C.; Liew, M.S. Optimization of Hybrid Fibres in Engineered Cementitious Composites. Constr. Build. Mater. 2018, 190, 24–37. [Google Scholar] [CrossRef]
- Aegerter, J.; Kühn, H.-J.; Frenz, H.; Weißmüller, C. EN ISO 6892-1:2009 Tensile Testing: Initial Experience from the Practical Implementation of the New Standard*. Mater. Test. 2011, 53, 595–603. [Google Scholar] [CrossRef]
- Mohammed, B.S.; Khed, V.C.; Nuruddin, M.F. Rubbercrete Mixture Optimization Using Response Surface Methodology. J. Clean. Prod. 2018, 171, 1605–1621. [Google Scholar] [CrossRef]
- Ghafari, E.; Costa, H.; Júlio, E. RSM-Based Model to Predict the Performance of Self-Compacting UHPC Reinforced with Hybrid Steel Micro-Fibers. Constr. Build. Mater. 2014, 66, 375–383. [Google Scholar] [CrossRef]
- Gong, Y.; Song, J.; Lin, S.; Yang, J.; He, Y.; Tan, G. Design Optimization of Rubber-Basalt Fiber-Modified Concrete Mix Ratios Based on a Response Surface Method. Appl. Sci. 2020, 10, 6753. [Google Scholar] [CrossRef]
- Chong, B.W.; Othman, R.; Putra Jaya, R.; Mohd Hasan, M.R.; Sandu, A.V.; Nabiałek, M.; Jeż, B.; Pietrusiewicz, P.; Kwiatkowski, D.; Postawa, P. Design of Experiment on Concrete Mechanical Properties Prediction: A Critical Review. Materials 2021, 14, 1866. [Google Scholar] [CrossRef]
- Montgomery, D.C. Design and Analysis of Experiments, 9th ed.; John Wiley & Sons: Hoboken, NJ, USA, 2017. [Google Scholar]
- Cornell, J.A. Response Surfaces: Designs and Analyses; Marcel Dekker, Inc.: New York, NY, USA, 1987; ISBN 0824776534. [Google Scholar]
- Dahmoune, F.; Remini, H.; Dairi, S.; Aoun, O.; Moussi, K.; Bouaoudia-Madi, N.; Adjeroud, N.; Kadri, N.; Lefsih, K.; Boughani, L. Ultrasound Assisted Extraction of Phenolic Compounds from P. Lentiscus L. Leaves: Comparative Study of Artificial Neural Network (ANN) versus Degree of Experiment for Prediction Ability of Phenolic Compounds Recovery. Ind. Crops Prod. 2015, 77, 251–261. [Google Scholar] [CrossRef]
- Wang, C.; Zhou, L.; Ma, J.; Shi, A.; Li, X.; Liu, L.; Zhang, Z.; Zhang, D. GB-RAR Deformation Information Estimation of High-Speed Railway Bridge in Consideration of the Effects of Colored Noise. Appl. Sci. 2022, 12, 10504. [Google Scholar] [CrossRef]
- Behnisch, M.; Poglitsch, H.; Krüger, T. Soil Sealing and the Complex Bundle of Influential Factors: Germany as a Case Study. ISPRS Int. J. Geo-Inf. 2016, 5, 132. [Google Scholar] [CrossRef]
- Guo, P.; Meng, W.; Xu, M.; Li, V.C.; Bao, Y. Predicting Mechanical Properties of High-Performance Fiber-Reinforced Cementitious Composites by Integrating Micromechanics and Machine Learning. Materials 2021, 14, 3143. [Google Scholar] [CrossRef] [PubMed]
- Dixon, D.E.; Prestrera, J.R.; Burg, G.R.; Chairman, S.A.; Abdun-Nur, E.A.; Barton, S.G.; Bell, L.W.; Blas, S.J., Jr.; Carrasquillo, R.L.; Carrasquillo, P.M. Standard Practice for Selecting Proportions for Normal, Heavyweight, and Mass Concrete (ACI 211.1-91); ACI: Farmingt, MI, USA, 1991. [Google Scholar]
- Dreux, G.; Festa, J. Nouveau Guide du Béton et de ses Constitutants; Eyrolles: Paris, France, 1998; ISBN 2212102313. [Google Scholar]
- Rossi, P. Le Développement Industriel des BÉtons de Fibres Métalliques: Projet National BEFIM: Conclusions et Recommandations; Presses de l’Ecole Nationale des Ponts et Chaussées: Paris, France, 2002; ISBN 2859783571. [Google Scholar]
- Hu, H.; Papastergiou, P.; Angelakopoulos, H.; Guadagnini, M.; Pilakoutas, K. Mechanical Properties of SFRC Using Blended Manufactured and Recycled Tyre Steel Fibres. Constr. Build. Mater. 2018, 163, 376–389. [Google Scholar] [CrossRef]
- Salmons, J. Doing Qualitative Research Online; SAGE Publications Ltd.: Newbury Park, CA, USA, 2021; pp. 1–100. [Google Scholar]
- BS EN 12350-2:2019; Testing Fresh Concrete. British Standard Institute: London, UK, 2019.
- BS EN 12390-3:2009; Testing Hardened Concrete. Part 3: Compressive Strength of Test Specimens. British Standard Institute: London, UK, 2009.
- UNE-EN 12390-5:2009; Testing Hardened Concrete—Part 5: Flexural Strength of Test Specimens. Asociación Española de Normalización: Madrid, Spain, 2009.
- CEN EN 12390-6:2009; Testing Hardened Concrete-Part 6: Tensile Splitting Strength of Test Specimens. British Standard Institute: London, UK, 2009.
- ASTM C642-06; Standard Test Method for Density, Absorption, and Voids in Hardened Concrete. ASTM International: West Conshohocken, PA, USA, 2006.
- Sahraoui, M.; Bouziani, T. Effect of Coarse Aggregates and Sand Contents on Workability and Static Stability of Self-Compacting Concrete. Adv. Concr. Constr. 2019, 7, 97. [Google Scholar]
- Pan, Y.; Kang, J.; Ichimaru, S.; Bolander, J.E. Multi-Field Models of Fiber Reinforced Concrete for Structural Applications. Appl. Sci. 2020, 11, 184. [Google Scholar] [CrossRef]
- Martinie, L.; Rossi, P.; Roussel, N. Rheology of Fiber Reinforced Cementitious Materials: Classification and Prediction. Cem. Concr. Res. 2010, 40, 226–234. [Google Scholar] [CrossRef]
- Bayraktar, O.Y.; Kaplan, G.; Shi, J.; Benli, A.; Bodur, B.; Turkoglu, M. The Effect of Steel Fiber Aspect-Ratio and Content on the Fresh, Flexural, and Mechanical Performance of Concrete Made with Recycled Fine Aggregate. Constr. Build. Mater. 2023, 368, 130497. [Google Scholar] [CrossRef]
- Pikus, G.A. Steel Fiber Concrete Mixture Workability. Procedia Eng. 2016, 150, 2119–2123. [Google Scholar] [CrossRef]
- Wu, Z.; Shi, C.; He, W.; Wu, L. Effects of Steel Fiber Content and Shape on Mechanical Properties of Ultra High Performance Concrete. Constr. Build. Mater. 2016, 103, 8–14. [Google Scholar] [CrossRef]
- Yu, R.; Spiesz, P.; Brouwers, H.J.H. Mix Design and Properties Assessment of Ultra-High Performance Fibre Reinforced Concrete (UHPFRC). Cem. Concr. Res. 2014, 56, 29–39. [Google Scholar] [CrossRef]
- Yardimci, M.Y.; Baradan, B.; Taşdemir, M.A. Effect of Fine to Coarse Aggregate Ratio on the Rheology and Fracture Energy of Steel Fibre Reinforced Self-Compacting Concretes. Sadhana 2014, 39, 1447–1469. [Google Scholar] [CrossRef]
- Dong, W.; Li, W.; Tao, Z. A Comprehensive Review on Performance of Cementitious and Geopolymeric Concretes with Recycled Waste Glass as Powder, Sand or Cullet. Resour. Conserv. Recycl. 2021, 172, 105664. [Google Scholar] [CrossRef]
- Su, J.H.; Cheng, Y.F.; Wu, N.J. Mixture Proportioning Design of Pervious Concrete Using the Paste Content Ratio Method (Aggregate Gradation 19 mm~9.5 mm and 9.5 mm~4.75 mm). In Proceedings of the Materials Science Forum; Trans Tech Publications: Stafa-Zurich, Switzerland, 2019; Volume 947, pp. 207–211. Available online: https://www.ijoi-online.org/attachments/article/146/0953%20Final.pdf (accessed on 17 July 2023).
- Kou, Y.; Jiang, H.; Ren, L.; Yilmaz, E.; Li, Y. Rheological Properties of Cemented Paste Backfill with Alkali-Activated Slag. Minerals 2020, 10, 288. [Google Scholar] [CrossRef]
- Tekle, B.H.; Hertwig, L.; Holschemacher, K. Rheology of Alkali-Activated Blended Binder Mixtures. Materials 2021, 14, 5405. [Google Scholar] [CrossRef] [PubMed]
- Khayat, K.H.; Meng, W.; Vallurupalli, K.; Teng, L. Rheological Properties of Ultra-High-Performance Concrete—An Overview. Cem. Concr. Res. 2019, 124, 105828. [Google Scholar] [CrossRef]
- Yu, R.; Spiesz, P.; Brouwers, H.J.H. Development of Ultra-High Performance Fibre Reinforced Concrete (UHPFRC): Towards an Efficient Utilization of Binders and Fibres. Constr. Build. Mater. 2015, 79, 273–282. [Google Scholar] [CrossRef]
- Jagadesh, P.; Juan-Valdés, A.; Guerra-Romero, M.I.; Morán-del Pozo, J.M.; García-González, J.; Martínez-García, R. Effect of Design Parameters on Compressive and Split Tensile Strength of Self-Compacting Concrete with Recycled Aggregate: An Overview. Appl. Sci. 2021, 11, 6028. [Google Scholar] [CrossRef]
- Sanjay, R.; Aswath, M.U.; Singh, S. An Experimental Study on Flexural Behaviour of Reinforced Geopolymer Concrete Beams with Recycled Aggregate in Bending. Int. J. Emerg. Trends Eng. Dev. 2012, 6, 186–199. Available online: http://www.rspublication.com/ijeted/ijeted_index.htm (accessed on 17 July 2023).
- Chachar, K.H.; Oad, M.; Memon, B.A.; Siyal, Z.A.; Siyal, K.F. Workability and Flexural Strength of Recycled Aggregate Concrete with Steel Fibers. Eng. Technol. Appl. Sci. Res. 2023, 13, 11051–11057. [Google Scholar] [CrossRef]
- Kim, S.; Park, C.; Kim, Y. Effect of SIFRCCs with Varying Steel Fiber Volume Fractions on Flexural Behavior. Appl. Sci. 2020, 10, 2072. [Google Scholar] [CrossRef]
- Simalti, A.; Singh, A.P. Comparative Study on Performance of Manufactured Steel Fiber and Shredded Tire Recycled Steel Fiber Reinforced Self-Consolidating Concrete. Constr. Build. Mater. 2021, 266, 121102. [Google Scholar] [CrossRef]
- Arunakanthi, E.; Kumar, J.D.C. Experimental Studies on Fiber Reinforced Concrete (FRC). Int. J. Civ. Eng. Technol. 2016, 7, 329–336. [Google Scholar]
- Ahmedin, A. Experimental Investigation on the Effects of Macro Steel Fibers on the Behavior of Concrete. Ph.D. Thesis, Hawassa University, Awasa, Ethiopia, 2019. [Google Scholar]
- Miloud, B. Permeability and Porosity Characteristics of Steel Fiber Reinforced Concrete. Asian J. Civ. Eng. Build. Hous. 2005, 6, 317–330. [Google Scholar]
- Rahmani, T.; Kiani, B.; Sami, F.; Fard, B.N.; Farnam, Y.; Shekarchizadeh, M. Durability of Glass, Polypropylene and Steel Fiber Reinforced Concrete. In Proceedings of the International Conference on Durability of Building Materials and Components, Porto, Portugal, 12–15 August 2011; pp. 12–15. [Google Scholar]
- Pilkington, J.L.; Preston, C.; Gomes, R.L. Comparison of Response Surface Methodology (RSM) and Artificial Neural Networks (ANN) towards Efficient Extraction of Artemisinin from Artemisia Annua. Ind. Crops Prod. 2014, 58, 15–24. [Google Scholar] [CrossRef]
- Botis, M.; Imre, L.; Conțiu, M. Numerical Method of Increasing the Critical Buckling Load for Straight Beam-Type Elements with Variable Cross-Sections. Appl. Sci. 2023, 13, 1460. [Google Scholar] [CrossRef]
- Hong, W.C.; Mohammed, B.S.; Abdulkadir, I.; Liew, M.S. Modeling and Optimizing the Effect of Palm Oil Fuel Ash on the Properties of Engineered Cementitious Composite. Buildings 2023, 13, 628. [Google Scholar] [CrossRef]
- Jun, H.-M.; Seo, D.-J.; Lim, D.-Y.; Park, J.-G.; Heo, G.-H. Effect of Carbon and Steel Fibers on the Strength Properties and Electrical Conductivity of Fiber-Reinforced Cement Mortar. Appl. Sci. 2023, 13, 3522. [Google Scholar] [CrossRef]
- Kaïkea, A.; Achoura, D.; Duplan, F.; Rizzuti, L. Effect of Mineral Admixtures and Steel Fiber Volume Contents on the Behavior of High Performance Fiber Reinforced Concrete. Mater. Des. 2014, 63, 493–499. [Google Scholar] [CrossRef]
- Khameneh Asl, S.; Sadeghian, A. Strength and Toughness of Reinforced Concrete with Coated Steel Fibers. Adv. Ceram. Prog. 2019, 5, 9–14. [Google Scholar]
- Bahmani, H.; Mostofinejad, D. Microstructure of Ultra-High-Performance Concrete (UHPC)—A Review Study. J. Build. Eng. 2022, 50, 104118. [Google Scholar] [CrossRef]
- Al-Attar, T.S.; Taha, A.A. Performance of High-Volume Fly Ash Self-Compacting Concrete Exposed to External Sulfate Attack. In Proceedings of the Proceedings of the 6th International Conference on Durability of Concrete Structures, ICDCS, Leeds, UK, 18–20 July 2018; pp. 18–20. [Google Scholar]
- Uzbas, B.; Aydin, A.C. Microstructural Analysis of Silica Fume Concrete with Scanning Electron Microscopy and X-ray Diffraction. Eng. Technol. Appl. Sci. Res. 2020, 10, 5845–5850. [Google Scholar] [CrossRef]
- Wu, J.; Liao, H.; Ma, Z.; Song, H.; Cheng, F. Effect of Different Initial CaO/SiO2 Molar Ratios and Curing Times on the Preparation and Formation Mechanism of Calcium Silicate Hydrate. Materials 2023, 16, 717. [Google Scholar] [CrossRef] [PubMed]
- Ma, Y.; Li, W.; Jin, M.; Liu, J.; Zhang, J.; Huang, J.; Lu, C.; Zeng, H.; Wang, J.; Zhao, H. Influences of Leaching on the Composition, Structure and Morphology of Calcium Silicate Hydrate (C–S–H) with Different Ca/Si Ratios. J. Build. Eng. 2022, 58, 105017. [Google Scholar] [CrossRef]
Disclaimer/Publisher’s Note: The statements, opinions and data contained in all publications are solely those of the individual author(s) and contributor(s) and not of MDPI and/or the editor(s). MDPI and/or the editor(s) disclaim responsibility for any injury to people or property resulting from any ideas, methods, instructions or products referred to in the content. |
© 2023 by the authors. Licensee MDPI, Basel, Switzerland. This article is an open access article distributed under the terms and conditions of the Creative Commons Attribution (CC BY) license (https://creativecommons.org/licenses/by/4.0/).