Abstract
The Brazilian housing program, Minha Casa, Minha Vida (MCMV) (My House, My Life), was launched in 2009 to address the housing deficit issue, with the goal of distributing contracted housing units throughout the Brazilian territory. However, the program faces criticisms regarding the distribution of these units. Thus, this paper aims to analyze the distribution heterogeneity of these contracted housing units (CHUs). Two analytical approaches were employed: temporal and spatial (states). To achieve this objective, inferential methods such as Ordinary Least Squares (OLS), Spatial Autoregressive Model (SAR), and panel data regressions were employed. The findings indicate that, from a temporal perspective, there is a positive relationship between the urban housing deficit (UHD) and CHUs. However, the relationship is negative from a spatial perspective, characterizing such heterogeneity among the states. In addition, bordering regions are subject to mutual spatial influences in terms of contracted units, thereby reinforcing this heterogeneity over time.
1. Introduction
Since the 1940s, government initiatives have been implemented in an attempt to mitigate the inadequacy or lack of housing for a large part of the Brazilian population [1]. Thus, the country experienced two major housing programs that were discontinued due to their lack of effectiveness in providing assistance to low-income families [2]. These programs, Fundação Casa Popular (Popular House Foundation) (1946–1964) and Banco Nacional da Habitação (National Housing Bank) (1964–1986), played a significant role in the field of social housing.
The emergence of the first program during the re-democratization process and the culmination of the Vargas’s Age in 1946 represented a pioneering effort in the realm of national organizations exclusively devoted to constructing subsidized housing for low-income segments. Nevertheless, it encountered financial constraints, primarily reliant on federal budgetary allocations, and consequently, it favored beneficiaries with political influence, impacting investment decision making and underscoring the intricacies inherent in the implementation of housing policies in Brazil [1,2].
Subsequently, during the 1960s, under the military dictatorship in Brazil (1964–1985), the National Housing Bank was established to subsidize real estate projects and provide credit with subsidized interest rates for sanitation and housing. The Housing Bank evolved into an urban development bank and centralized financing and urban planning at the federal level, affecting access to housing for lower-income segments. The housing policy favored middle-class real estate production, while informal urbanization and precarious settlements expanded. With the return to democracy, urban social movements emerged, advocating for political decentralization and social participation in shaping urban policies, a stance reinforced by the 1988 Constitution, which entrusted municipalities with the responsibility of local urban planning [2].
In the following decades, the Minha Casa, Minha Vida (MCMV) (My House, My Life) program, launched in 2009 and in effect under this name until 2021, incorporated the ideas propagated and developed by the previous programs, considering the political and legislative contexts [2,3]. The MCMV program assumed the dual role of addressing the housing deficit and stimulating economic growth in Brazil through intersectoral linkages [4,5]. Critiques continue to be directed at this program.
Thus, from the perspective of this research, the Urban Housing Deficit (UHD), specifically, is a fundamental parameter to assess the program’s performance. This parameter represents the number of households in precarious conditions or even absent, influenced by a multitude of factors such as social inequality, construction costs, and lack of government investments in social housing. The construction of new housing units is considered one of the primary means of combating UHD in all Brazilian states.
In 2019, the habitational deficit reached a total of 5.87 million households in Brazil [6]. Considering the significance of the housing needs issue, as well as Brazil’s territorial and socioeconomic characteristics, it becomes important to evaluate the MCMV program results regarding the distribution of contracted housing units (CHUs) across the 26 states plus the Federal District.
The literature shows that the program has received criticism regarding its real effectiveness [7,8]. There are studies that criticize the way the program has been implemented, addressing issues related to its operational characteristics, such as budgetary aspects and the transfer of responsibilities, which lead research results to uncertainties about the program’s real contributions [1,9,10].
Other studies emphasize certain current national and municipal housing program weaknesses [11,12]. In another approach, the dynamics of buying and selling social interest housing (SIH) within different regional contexts are highlighted [13,14]. Therefore, it seems relevant to develop the identification and evaluation of possible heterogeneity regarding the distribution of MCMV housing units over the years, considering all states in the federation.
Few studies link existing UHD eradication efforts in the country to socioeconomic factors, despite the fact that these factors are linked to Brazil’s continental dimensions, even though these geographical aspects were highlighted by [15]. Additionally, spatial issues concerning the influences that a particular state (UF) exerts on neighboring units as well as the influences it receives are rarely explored and can be relevant from an analytical standpoint.
Thus, we emphasize the evaluation of this potential heterogeneity from both a temporal and spatial perspective. Four important questions arise in this context: (1) Ten years after the program’s implementation, has the increase in UHD been matched by an increase in the number of CHUs across all Federation states? (2) If the answer to the first question is yes, have the efforts against UHD been carried out homogeneously or heterogeneously across all states in the studied period? (3) Do neighboring states have mutual spatial influences that amplify this potential heterogeneity? (4) If heterogeneity is confirmed, what factors or variables can explain it?
To answer these questions, we adopt descriptive statistical techniques as well as inferential techniques such as linear regression and spatial regression—using panel data—to explore the relationship between the number of CHUs and UHD across all Brazilian states from 2009 to 2021. Additionally, we incorporate state-specific socioeconomic variables to control for this relationship and thus explain, at least in part, the potential heterogeneity present in this context.
Our conclusions contribute to the advancement of the theoretical–empirical framework that incorporates socioeconomic variables into the SIH discussion within a federal housing program in the context of a developing economy with continental dimensions and significant social inequality.
2. Theory and Hypothesis
2.1. The My House, My Life Program
The MCMV program was implemented in 2009 with the aim of promoting the construction of social interest housing across all Brazilian states [16]. The segmentation of families residing in urban areas is based on income brackets: bracket 1 (gross monthly family income up to BRL 2640.00), bracket 2 (gross monthly family income between BRL 2640.01 and BRL 4400.00), and bracket 3 (gross monthly family income between BRL 4400.01 and BRL 8000.00) [17].
However, the MCMV indirectly proposes that the regularization and allocation of housing as a formal distribution of resources are controlled by the market, relativizing the concept of housing as a social good [5].
Therefore, the financial capital expansion now includes the market for SIH [5]. As a result, housing public policies start to follow the logic of supply and demand, adopting an economic policy framework and reducing the program to a real estate financing agent [18]. The MCMV is limited in reducing inequality and segregation [12]. This is due in part to the real estate market dynamics to which the program has been subjected.
The housing program does not consider territorial dimensions as a relevant aspect of housing policy, leading to the neglect of socio-spatial segregation issues in various Brazilian states, as argued by [5]. This reinforces the argument made by [19] regarding the legitimization of federal government social programs in rural areas of Brazilian regions.
2.2. Housing Deficit (HD) × Contracted Housing Units (CHUs)
The calculation of the HD in Brazil is one of the main ways to measure housing insufficiency. We focus exclusively on the HD urban portion, emphasizing three main components: precarious housing, cohabitation, and excessive rent burden. Precarious housing is one of the major housing problems faced by Brazilian families, who live in inadequate conditions with a lack of basic infrastructure, unhealthiness, lack of security, and vulnerability to natural disasters. Cohabitation is a common practice in urban areas, where more than one family shares the same housing space due to the high cost of housing. Finally, excessive rent burden occurs when a family spends more than 30% of its income on rent, compromising the household budget and potentially leading to default [6].
Analyzing HD numbers in the country’s macroregions, the Fundação João Pinheiro (FJP) (João Pinheiro Foundation) exposes the existing contrasts in numerical terms. In 2019, the latest update, the HD was concentrated at 12% for the states in the North region, 30% for those in the Northeast, 11% for those in the South, 38% for those in the Southeast, and 9% for those in the Midwest. These data show that the most populous regions—the Northeast and Southeast—jointly account for 68% of the entire Brazilian housing deficit.
At the municipal level, the source [2] addresses the MCMV performance in the metropolitan region of São Paulo regarding the population adequacy in receiving social housing, relating to the region’s housing deficit profile. It was found that the housing deficit in the “bracket 1” category (lowest income bracket) was greater than the other two categories, “bracket 2” and “bracket 3” (higher income brackets). However, this category not only received more peripheral development, as observed by [1] in their analysis of the city of São José do Rio Preto (São Paulo), but it was also the least favored in terms of the quantity of social interest housing provided.
Similar findings were reported by [20] in the Federal District, where approximately 83% of the housing deficit was concentrated in the “bracket 1” category, representing a demand of 86% out of the total of 120,000 required housing units. However, the “bracket 2” category was the most favored in terms of housing provision, accounting for 56% of the offers during the period between 2014 and 2017.
The reference [21] addressed this same discussion at the national level, covering the period from 2004 to 2013, and found that 91% of the housing deficit was concentrated in the “bracket 1” category, while only 40% of the total produced units were allocated to this target group. As a result, only 6% of the housing deficit for low-income families was effectively addressed, while 93% and 95% of the “bracket 2” and “bracket 3” categories, respectively, were served.
The discussion on the housing deficit gains more importance when inconsistencies are identified between federal government housing investments and the effective reduction in the Brazilian housing deficit. Between 2009 and 2015, the government spent 106 billion Brazilian reais on subsidies for social housing, and during the same period, 1.8 million CHUs were delivered [22]. However, FJP reports that in 2009, the Brazilian housing deficit stood at 5.1 million units, and by 2015, it had increased to 5.5 million.
In light of the above, despite the inconsistencies reported in the literature regarding the implementation of MCMV program policies throughout the Brazilian territory, these government initiatives have directed efforts, albeit heterogeneous, towards addressing the Brazilian housing deficit. Thus, we present our first research hypothesis:
Hypothesis 1 (H1).
The number of CHUs per state is positively related to their respective numbers of UHD.
In the same vein, the citation [23] argues that creating a social housing program based on household data that does not align with the current conditions of the Brazilian population and fails to address real housing needs is not a trivial matter, but rather an aspect that must be taken into consideration.
It is fundamental to understand the relationship between the housing deficit and the MCMV program to address housing-related issues [24]. Therefore, even though household data may have some inconsistencies, the understanding of the relationship between the housing deficit and CHUs is strengthened in this article by the incorporation of spatial socioeconomic dynamics related to geographical characteristics among Brazilian states.
Considering the existence of dynamism at the state level in terms of housing deficit, it is plausible to correlate it with dynamism in the distribution of CHUs. Thus, states that exhibit greater socioeconomic dynamism can be important agents for directing CHUs, potentially exerting a positive or negative influence on neighboring states, highlighting the spatial spillover characteristic [13].
In the field of economics, spatial spillover can be associated with the positive influence that the economic growth of a region exerts on its neighboring regions. States that experience significant economic growth, receive more public investments, or act as knowledge hubs are generally defined as regions exhibiting this effect [25]. In the context of a public housing program like MCMV, the monetary value of contracted housing units would be the variable that best fits the understanding of spatial spillover, as it is a macroeconomic variable that varies among states. In the context of this article, this variable will be replaced by the proxy number of constructed housing units.
In this logic, it can be stated that the distribution of CHUs among neighboring states is positively influenced by states that have large volumes of contracted units. Therefore, it is possible to define a second research hypothesis:
Hypothesis 2 (H2).
Bordering states influence each other positively in terms of the allocation of CHUs by the MCMV program.
3. Control Variables
The Brazilian territory comprises 26 states and one Federal District, encompassing a total of 5568 municipalities or urban concentrations, spread across 8,516,000 square kilometers. We propose that such dimensions provide significant heterogeneity among Brazilian states in terms of their socioeconomic, infrastructural, historical, cultural, and legal characteristics, among others. We focus on the first dimension.
3.1. Gross Domestic Product (GDP) per Capita, GINI Index, and NSCICC
3.1.1. GDP per Capita
The literature has adopted GDP per capita, or per capita income, in various contexts, highlighting its flexibility. As emphasized by [26], this variable can scrutinize the impact of a social income transfer program on the socioeconomic indicators of Brazilian municipalities, revealing a positive correlation between such programs and municipal GDP per capita.
The reference [27] discuss the contrasts between the country’s major regions in terms of GDP per capita and telecommunications investments, showing that most states in the North and Northeast regions have lower GDP per capita values, while the opposite occurs in the more dynamic regions of the Southeast, Central-West, and South. Thus, GDP per capita can be a useful measure for assessing the state’s economic growth [28] and linking it to the housing demands of its population.
3.1.2. GINI Index
In 2009, Brazil experienced one of the lowest levels of income inequality since 1960. However, it still ranked among the top 10 most unequal countries in the world [29]. Thus, economic growth in certain regions does not necessarily lead to a reduction in poverty and inequality. At the state level, in less economically developed regions, low-income families may face difficulties in accessing social programs, including the MCMV program [30].
In this context, the GINI index also exposes the heterogeneities related to the population’s income in each Brazilian state. Conceptually, the GINI index is a parameter that ranges from 0 to 1 and can be used to measure the inequality of income distribution among Brazilian states. Values close to 1 indicate greater income inequality [31].
According to the theoretical framework, this variable may be useful for analyzing CHU logic distribution in the MCMV program, using the criterion of household income, since low-income families appear to receive fewer CHUs [15,20,21].
3.1.3. National System of Costs and Indexes for Civil Construction (NSCICC)
The NSCICC is an important tool for planning and managing public works projects, such as the MCMV program, because it is accessible and accurately reflects regional variations in construction costs. Thus, despite the program’s good criteria established by law, it may be distorted not just by issues related to social inequalities but also by construction costs [32].
In general, per capita social expenditures on housing are higher in wealthier states than in poorer states. Although there are high constitutional transfers of funds to all states, the problem also involves the allocation of resources [33]. Furthermore, even though all these states are capable of budgeting, managing, and spending their resources, not all of them are equipped to address the issues related to social housing [19].
The urban space is marked by constant disputes involving various economic interests. Within this context, the struggle for housing and urban land constitutes a structural problem that favors those with significant capital at the expense of those with little. In other words, the competition for access to these assets sparks the interest of a large portion of society, leading to increased prices of both land and housing, making it difficult for more vulnerable families to access these assets [34].
As a result, the formal housing market ends up excluding the low-income population due to the high costs of construction materials and labor, loan interest rates, and contractor profits [34]. Throughout the national territory, resource acquisition for MCMV residential projects may be affected by limitations related to logistics or price fluctuations of raw materials and labor [35].
4. Database and Methods
To develop its empirical phase, we initially incorporated an exploratory group composed of socioeconomic and demographic variables, aligned with the theoretical argumentation developed. These variables, as well as their descriptive parameters, are listed in Table 1, alongside the main variables in this article—UHD and CHU. As such, Table 1 shows the collected variables gathered in a database titled “preliminary database”, which considers the states (UF) and time periods between 2009 and 2022. Data regarding the CHU variable were obtained through the Sistema Nacional de Habitação (National Housing System), which provides information on all contracts made by the MCMV and Casa Verde e Amarela (CVA) (Green and Yellow House) programs. The variable was calculated by summing the number of housing units from each contract, considering the state and the year in which the contract was signed. The methodological approach will focus solely on the contracts derived from the MCMV program due to limitations in the availability of certain data for the years 2020, 2021, and 2022.

Table 1.
Preliminary database—sample/descriptives.
The UHD variable was collected from the booklets provided by the FJP between 2012 and 2021, representing the sum of all households classified under the official concept of urban housing deficit. We chose to use this portion of the variable as the urban housing deficit portion since the MCMV program contracts are predominantly allocated in urban areas. The other research variables were incorporated based on their macroeconomic and social characteristics, with the purpose of controlling for the possible effects of UHD on CHU. Most variables were sourced from the databases of the Instituto Brasileiro de Geografia e Estatística (IBGE) (Brazilian Institute of Geography and Statistics). However, the data for two specific variables, NSCICC and CWS, were collected from alternative sources, namely the Relação Anual de Informações Sociais (RAIS) (Annual Report of Social Information) and the Sistema Nacional de Pesquisa de Custos e Índices da Construção Civil (SINAPI) (National System of Costs and Indices of Civil Construction). More comprehensive insights into CHU, RAIS, and SINAPI can be found within the Supplementary Materials section.
The variation in the number of observations is due to limitations in data collection by the respective institutions. The CHU and UHD variables exhibit higher standard deviations, indicating data asymmetry and implying a discernible pattern in the number of CHUs and UHD across the Brazilian territory over time.
Next, we extracted the selected variables from the preliminary database, based on a correlation study, to form the definitive database in order to guide the choice of control variables present in the statistical model. The absence of multicollinearity and alignment with this paper’s theoretical scope were the selection criteria. The definitive database consists of two main variables, i.e., UHD and CHU, and three control variables, i.e., GDPPC, GINIPHI, and NSCICC.
Statistical Model
The nature of the variables and the database—observed states (UF) over time (T)—led to the use of panel data regression techniques, comprising two main approaches: Pooled Data, which involves stacking the data over periods and applying the Ordinary Least Squares (OLS) method for analysis, and Fixed Effects Models, which encompass two variants aiming to isolate the effects of the identification variables UF and T through the techniques of individual or time fixed effects [36], i.e., Fixed Effects Panel/UF and Fixed Effects Panel/T, respectively. The fixed effects were included to capture effects that vary over time (T) but remain constant across Brazilian states and vice versa.
Additionally, the technique adopted in this study is panel data regression with the incorporation of spatial effects. [37,38]. The objective is to analyze the correlation between UHD and CHUs in different states and time periods, taking into account control variables and the presence of spatial clusters.
The potential incorporation of spatial effects is investigated using Moran’s I test [39]. The test is conducted with the average number of CHUs by state from 2013 to 2019 to determine if there is evidence to reject the null hypothesis of no spatial autocorrelation [25,40].
The spatial effects allowed for investigating the mutual influence—autocorrelation—that states exert in relation to the CHUs allocated to them and neighboring states. The application of these techniques and their variations allows for obtaining more robust and precise estimates. Based on the stated criteria, we conducted tests to determine the best spatial specification, considering the Spatial Autoregressive Model (SAR) and the Spatial Error Model (SEM). These tests included the Lagrange Multiplier (LM) test for spatial lag dependence, the LM test for spatial error dependence, and the Hausman specification test for spatial panel data models. Additionally, we employed locally robust LM tests for spatial lag dependence under spatial error and for spatial error dependence under spatial lag. These tests were performed to assess spatial dependence and identify the appropriate model for the data, ensuring robust and accurate results.
CHU = λ(IT⊗WUF)CHU +(ιT⊗IN)μ + β1UHD + β2GDPPC + β3GINIPHI + β4NSCICC + ε
CHU = (ιT⊗IN)μ + β1UHD + β2GDPPC + β3GINIPHI + β4NSCICC + ε, ε = ρ(IT⊗WFU)ε + ζ
Equation (1) represents the proposed model with SAR specification. N is the number of states (N = 27). This matrix was calculated from a shapefile of the Brazilian territorial grid provided by IBGE, using the Queen Contiguity criterion to determine neighboring states. λ is the autoregressive coefficient, IT is an identity matrix of dimension T, WUF is the spatial weighting matrix of dimension N × N, ιT is a T × 1 vector of values 1 in all elements, IN is an identity matrix, and ε is the idiosyncratic error term. Equation (2) corresponds to the SEM model, where ρ is the autoregressive term associated with the error term, εit ~ IID(0,) and ζit ~ IID(0,). We opted to use a balanced panel in this study, which means that all explanatory variables must have data available for all the periods analyzed. In the case of this study, the variables have data available between 2013 and 2019, totaling a common interval of 7 periods. Thus, we defined T = 7 as the number of periods analyzed. To assess the robustness of the estimators in the proposed model, additional analyses were conducted considering panel models without the inclusion of spatial effects, as well as testing with the presence of time-fixed effects. In order to account for potential clustering effects within the data, clustered standard errors were employed in the analysis. Moreover, due to the relatively small number of clusters in the dataset, an additional robustness test using wild bootstrap was also conducted [41]. The wild bootstrap method allows for the generation of pseudo-samples with replacement, addressing the limitations posed by the limited number of clusters and providing further validation of the model’s results [42].
5. Results and Discussion
This section begins by addressing the first research question presented in the introduction of this article. As a result, we include Figure 1a,b.
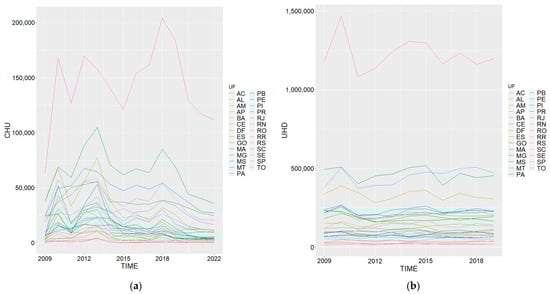
Figure 1.
Timeline for stacked variables by state. (a) Contracted housing units (CHUs); (b) urban housing deficit (UHD).
Figure 1a,b present the temporal distribution of CHUs and UHD, respectively, in each Brazilian state, between 2009 and 2021 (CHUs) and between 2009 and 2019 (UHD). Regarding Figure 1b (UHD), we identify three clusters based on the level of concentration (number of states) among the states. The first category, representing up to approximately 250,000 absent or precarious households, consists of 22 states plus the Federal District, showing a relatively stable behavior. The second category, represented by only three states with a relative fluctuation, ranges between 250,000 and 500,000 absent or precarious households. The third category is represented solely by the state of São Paulo, exhibiting significant fluctuations in the number of UHD, ranging between 1 million and 1.5 million absent or precarious households.
Figure 1a does not have the same clear categorization as observed in Figure 1b, although there is still a majority of states (17 and the Federal District) contracting an average of less than 20,000 housing units between 2009 and 2021. The second category highlighted in Figure 1a becomes larger and more fragmented than its counterpart in Figure 1b, with eight states contracting housing units with significant fluctuations ranging from 20,000 to 100,000 units. Once again, the state of São Paulo stands out in isolation, representing the third and final category, contracting above 100,000 CHUs (with high fluctuations), except in 2009.
Although the definitive answer to the first research question will be provided by the hypothesis tests in the regression models, we assume that Figure 1a,b indicates that government initiatives regarding the construction of social housing seem to be aimed at mitigating UHD in all Brazilian states. In this context, a consistent conclusion can be drawn: the state of São Paulo, being the most economically dynamic, has the highest number of absent or precarious dwellings and receives the highest levels of investment for the construction of social housing units under the MCMV program [43,44].
Such singularity may be a reflection of historical occupation processes that most states in the Midwest, South, and Southeast regions of the country have experienced. According to [45], during the period of the National Housing Bank (1964–1986), there was an attempt to organize housing production, driven by the industrial growth observed mainly in the Central-Southern region of Brazil. This phenomenon can be associated with the countryside’s modernization and the consequent rural exodus, leading to the prominence of most of these states in the analyzed graph. This fact will be further discussed during the analysis of spatial estimators.
Thus, the isolated condition of São Paulo justifies the second research question. The provisional answer is that the distribution of CHUs is not homogeneous throughout the Brazilian territory. Figure 2a,b seems to provide indications of this heterogeneity. Between 2013 and 2018, the two main variables’ behaviors are diametrically opposed. This discussion becomes more complex due to various issues.
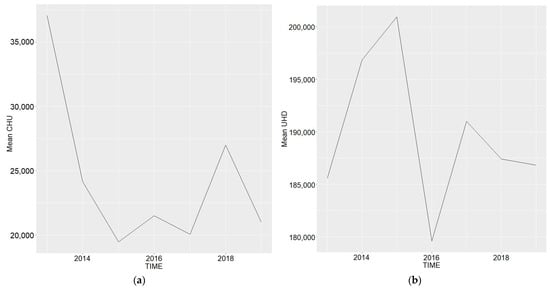
Figure 2.
(a) Average number of CHUs and (b) average of UHD over time.
Firstly, partitioning the period 2013–2019 into smaller periods, it would be fair to argue that the MCMV program needs time to react to the identified UHD. In other words, the positive and sharp variation in UHD between 2013 and 2015 would suggest a reactive and homogeneous strategy of positive variation in the number of CHUs in the immediately following periods. However, this scenario is not supported by Figure 2a,b, since the subsequent periods, 2014–2017, are precisely the ones in which the numbers of CHUs were the lowest over the total period.
Secondly, the homogeneity of MCMV’s reactive initiatives would lead to a constant and gradual reduction in UHD over time, across all states. This fact, according to Figure 2b, also does not occur. In reality, the opposite scenario has already been shown by [1,20,21].
The argument of the need for a certain amount of time to conclude UH contracts could arise in favor of public administrators, considering the diverse bureaucratic issues they must control. However, the fact that this specific housing industry product is included among those with reduced delivery periods may work against public administrators, even though these delivery periods vary across states. Central-South states have shorter average completion times for construction projects compared to other regions. The average cycle for project completion is around 3 years [43].
Moreover, it is crucial to acknowledge that not all Brazilian municipalities incorporate Zonas Especiais de Interesse Social (Special Zones of Social Interest) in their master plans. These zones are demarcated areas with specific urban planning regulations designed to facilitate affordable housing and foster social inclusion [46]. The absence of special zones of social interest in certain regions may exacerbate and impede the completion of housing unit contracts, posing additional challenges for public administrators in addressing the housing requirements of vulnerable populations in such localities.
Given this discussion’s complexity, additional considerations could be made regarding the political crisis and economic recession that occurred in Brazil between 2014 and 2016 [47], the legal analysis of economic policies [20], default rates associated with housing loans for low-income families [48], urban regularization and the application of instruments that could facilitate the implementation of the MCMV program [49], and the omission of fund transfers following the logic of state UHD [50], among other factors that could shed light on the challenges of achieving a homogeneous CHU delivery. However, none of these arguments are within the scope of this article.
Given the relevance of these issues, we highlight in the first hypothesis that the federal government established the social housing program with the purpose of addressing the Brazilian UHD. However, this program is widely questioned in the literature regarding its effectiveness. We emphasize and test such fragility, attributing to the program a high degree of heterogeneity across the Brazilian territory in the past 10 years (2009–2019), as shown in Figure 3.
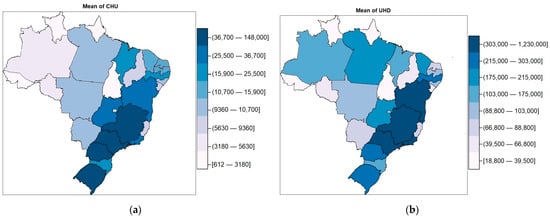
Figure 3.
(a) Distribution of mean of CHUs and (b) distribution of mean of UHD, both by states.
Figure 3 presents the average UHD and average number of CHUs for all states in Brazil between 2013 and 2019 as a thematic map. It clearly shows the MCMV’s heterogeneous implementation. States where the average UHD was relatively high—Bahia, Rio de Janeiro, Ceará, Pará, Espírito Santo, and Amazonas—had low averages of CHUs. States with relatively low UHD—Tocantins, Mato Grosso, Piauí, Mato Grosso do Sul, Amapá, Roraima, and Rondônia—received very few new CHUs. An exception is seen for states in the Southeast and South regions—São Paulo, Minas Gerais, Paraná, Santa Catarina, and Rio Grande do Sul—which received CHUs in proportion to their respective UHD.
At this point, the third research question can be revisited. Thus, we begin the analysis and discussion of the regression results, relating the heterogeneous CHU distribution to the socioeconomic environment of Brazilian states, such as GDP per capita, GINI index, and construction costs of housing units (NSCICC). The country’s geographic dimensions and distinct regional characteristics will be emphasized in this process. The correlation matrix, reflecting the relationships between the variables in the statistical model, is shown in Table 2.
Table 2.
Descriptive statistics and correlation matrix.
According to Table 2, the average UHD of Brazilian states from 2009 to 2019 was slightly more than 189,000 dwellings. The average number of CHUs across Brazilian states during the same period was slightly more than 22,000 units. The averages of GDP per capita (GDPPC = BRL 23,934 per capita), GINI index (GINIPHI = 0.515), and NSCICC construction costs (NSCICC = BRL 1105/m2) demonstrate the Brazilian reality. Data for all variables are distributed with significant dispersion, according to their respective standard deviations. In other words, there is high variability between their minimum and maximum values, reinforcing the suspicion of heterogeneity not only among the key variables of the MCMV program but also among the control variables.
The GDP per capita variable (GDPPC) is notable for the difference established between its minimum and maximum values, justifying its application as a variable that could explain the heterogeneity in CHU variable distribution. To a lesser extent but equally distinct, the minimum and maximum values of the GINI index and NSCICC construction costs are observed. There is a significant positive and high coefficient magnitude identified between UHD and CHU. Among the independent variables, the correlation coefficients found eliminate the model’s multicollinearity problem.
5.1. Regressions
Table 3 displays the regression models with the dependent variable CHU and the independent variable UHD, along with GDPPC, GINIPHI, and NSCICC included as control variables. To confirm the robustness of our results, we performed the wild bootstrap test for the variables that were statistically significant at or below the 10% level in models 1, 2, and 3, as shown in Table 4. The test results did not change the statistical significance of these variables substantially when we accounted for the clustered standard errors.
Table 3.
Regression models.
Table 4.
Wild bootstrap test.
Model 1 uses the Ordinary Least Squares method with panel-stacked data to estimate the relationship between CHUs and the independent variables. Model 2 takes into account the state-specific effects on the dependent variable, using a fixed intercept for each state. This allows us to analyze how the independent variables influence the number of CHUs (dependent variable) within each state over time, while controlling for the state-specific characteristics of each state. Model 3 takes into account the time-specific effects on the dependent variable, using a fixed intercept for each time period. This allows us to examine how the independent variables influence the number of CHUs in each period considering all states, while controlling for temporal trends.
Model 4 is based on Equation (1)—SAR specification—considering the influence of the state’s geographic location by incorporating fixed effects by state and addressing the mutual spatial dependence across different time periods. The decision to adopt the SAR specification with fixed effects was motivated by the rejection of the null hypothesis in the Hausman test for spatial models (χ2 = 204.53; p < 0.01) and the significant findings from Moran’s I test, which provided evidence of spatial correlation (statistic = 0.217; p < 0.01). These results strongly suggest the presence of a spatial relationship among the variables in the model and indicate that the intercepts related to the federative states are not randomly distributed.
Additionally, the LM tests for spatial lag dependence (LM = 31.812; p < 0.01) and spatial error dependence (LM = 24.71; p < 0.01) both rejected the null hypothesis, suggesting that both SAR and SEM could be valid specifications [51].
Nevertheless, considering the literature’s recommendation to use only one specification to avoid potential model instability arising from the need for distinct contingency matrices [52,53], we employed the locally robust LM test for spatial error dependence and sub-spatial lag, which confirmed the suitability of the SAR specification by accepting the null hypothesis (LM = 0.21952; p > 0.10). This was further supported by rejecting the null hypothesis of the locally robust LM test for spatial lag dependence sub-spatial error (LM = 7.3216; p < 0.01). According to the ANOVA test (F = 11.588; p < 0.01) [54], Table 3 demonstrates that individual effects (UF) are relevant. In other words, the Pooled and Fixed Effects (UF) estimators are significantly different.
In Models 1 and 3, analyzing the entire Brazilian territory, the average number of CHUs shows a positive relationship with the average UHD (β1 = 0.127; p-value < 0.01) in the OLS—Pooled model. The coefficient magnitude is similar in the Fixed Effects—T model, and the sign remains the same (β1 = 0.128; p-value < 0.01), demonstrating the estimator’s robustness. The similarity of the results obtained between Models 1 and 3 is due to the fact that Model 3, by fixing the time effects, evaluates the total number of CHUs of all states per year, which coincides with the analysis of Model 1, which takes into account the average number of CHUs in relation to the average UHD between 2013 and 2019, according to Figure 4a.
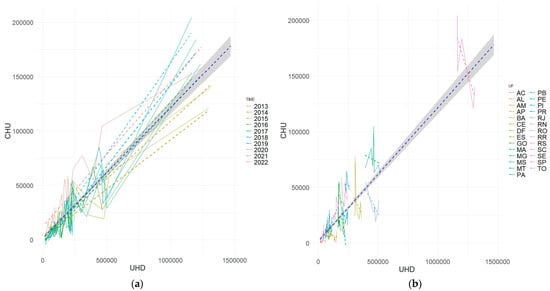
Figure 4.
(a) Representation of Models 1 and 3; (b) representation of Model 2, both for the relationship between CHUs and UHD.
In both graphs presented in Figure 4, the dashed blue line represents the estimation of the OLS—Pooled model. In Figure 4a, the lines representing the years all have positive slopes, indicating that when the fixed effects in the time dimension are isolated, a positive relationship between CHUs and UHD is established in all states. Thus, the positive relationship is observed from the perspective of the broad and national strategy to address the UHD over time.
Therefore, the answer to the first research question emerges definitively. The confirmation of Hypothesis 1 indicates that the number of contracted housing units followed the logic of the distribution of housing deficit in urban areas, although this condition was mainly driven by the disparities in CHU and UHD values relative to the country’s Southeast and South regions.
In Figure 4b, most of the lines representing each Brazilian state have a negative slope, indicating that when isolating the fixed effects in the “state” dimension, a negative relationship emerges in most states. In other words, the heterogeneity of this strategy becomes evident at the state level. Therefore, in the state dimension, periods with higher values of CHU are correlated with periods with lower values of UHD (Figure 2).
The percentage of UHD concentration in the major Brazilian regions indicates that 49% of the housing deficit is concentrated in the South and Southeast regions, compared to 42% in the North and Northeast regions [6]. It is worth noting the changes that occurred in the Brazilian UHD since the mid-1990s, especially in the Southeast region. According to [15], the Brazilian distribution map of the housing deficit in 1995 showed a greater concentration in the poorer regions (North and Northeast = 53%) compared to the South and Southeast regions (40.9%), contradicting the findings presented in Figure 3, with emphasis on the significant increase in the Southeast region (from 31.2% to 38%).
However, this author reinforces our research findings by stating that the greater the heterogeneity between regions, the greater the heterogeneity among the states within their respective regions, thus corroborating our hypothesis of heterogeneity and pointing to the issue of spatial spillover to be emphasized in the analysis of the parameter λ, according to Model 4. Therefore, this type of analysis suggests that the numbers from these regions over time are strong enough to disrupt the distribution of CHUs throughout the national territory. This phenomenon is reflected in the statistical significance presented by the results of Models 1 and 3.
Analyzing Model 2, i.e., fixed effects for states, the relationship between CHUs and UHD is negative (β1 = −0.211; p-value < 0.01). In other words, the majority of the relationship between the variables, when considering each Brazilian state in isolation and the period between 2013 and 2019, is negative, as evidenced in Figure 4b. Thus, at the state level, considering the different contexts operated by MCMV across the national territory, the relationship between CHUs and UHD may vary. Combining the analyses of Models 2 and 3 provided a definitive response to the second research question: within the studied period, the efforts against UHD have been carried out heterogeneously across the federative states.
The described scenario may be concerning from a social standpoint, given that the housing circumstances in large Brazilian cities such as São Paulo present significant challenges. Although the housing deficit proportion in the lowest income range (bracket 1) is lower in the São Paulo metropolitan region compared to cities like Fortaleza, the Rio de Janeiro metropolitan region, and Belém do Pará, for example, the number of households in housing deficit in this region is much higher than in those cities, which hinders the HD mitigation [2].
It is important to recognize that in Brazil, the right to housing does not encompass a significant portion of the population in the lowest income range (bracket 1), since the private property market seems to expand to meet primarily bracket 2’s demands, perpetuating the housing problems of a historically unequal society [55]. Between 2013 and 2018, at the national level, the volume of housing contracts under the MCMV for bracket 1 significantly decreased, while there was a significant increase in contracts for bracket 2. Among the realized contracts, 36% were allocated to brackets 1 and 1.5, while brackets 2 and 3 accounted for 64% of the total [43]. This fact is supported by [21], stating that the issue of housing deficit is more efficiently mitigated for brackets 2 and 3 in comparison to brackets 1 and 1.5.
The fact that the MCMV positively impacts the real estate market and the construction sector [56] means that the program is subject to the dynamics of supply and demand for housing units in each Brazilian state, which justifies the negative relationship presented by Models 2 and 4. To put it another way, there are states that prioritize the program’s mission, and there are states that prioritize market interests. Data from reference [57] shows that every year between 2015 and 2022, the MCMV accounted for a significant portion of residential launches, sales, and deliveries, representing at least 70% of the total monthly accumulation for each year.
Additionally, the impacts of these developments on employment generation, income, and tax revenue resulting from post-construction activities of residential buildings at the national level are substantial and have been measured by [58]. This research demonstrates, based on Brazilian input–output matrix studies, that a BRL 1000.00 investment in housing production will generate BRL 360.00 in expenses over the course of three years following the residence’s delivery.
Consequently, after the conclusion of construction, the building of housing units can generate an additional 36% of the housing value in terms of demand for various economic sectors (construction; textile product manufacturing; clothing and accessory manufacturing; wood product manufacturing; manufacturing of computer, electronic, and optical products; electronic equipment manufacturing; furniture manufacturing; and miscellaneous manufacturing industries).
Besides the economic impacts, the construction and delivery of CHUs also have significant effects on the urban landscape of cities. Improving the quality of housing production and ensuring adequate adaptation to different states is essential for the development of public housing policies in countries with continental dimensions, such as Brazil.
In this context, the importance of the ordinance on urban technical requirements, which establishes mandatory and additional transformations in urban insertion, project conception, execution of the work, and socio-territorial development [59], is highlighted. These guidelines aim to promote the improvement of urban conditions throughout the country, ensuring that CHUs are suitable and well-integrated into their surroundings, providing a better quality of life and well-being for residents.
Considering the national scope, the Ministério do Desenvolvimento Regional (Ministry of Regional Development) [59] ordinance stipulates that the housing unit must include at least one living room, two bedrooms, a kitchen, a laundry area, and a bathroom, all of which should accommodate the minimum required furniture. It is essential to note that these guidelines may vary from state to state, as housing policies can be adapted to meet the specific needs and realities of each region. Thus, specifications may be adjusted to address local particularities.
Furthermore, it is essential to consider the suitability of urban and rural areas to accommodate MCMV developments efficiently and sustainably. However, despite the existence of regulatory standards [59], their implementation is still immature in Brazilian territory, which witnesses disordered and unplanned urban land occupation [60]. This reality can compromise the sustainability of MCMV projects, leading them to become precarious environments over time [60,61]. The sustainable approach to MCMV projects presupposes the concept of a smart city, succeeding the traditional notion of a sustainable city [62].
The smart city concept emerges from an awareness of the finite natural resources and entails adopting information and communication technologies as complementary tools for sustainable growth. These technologies enable improvements in mobility, energy use, education, and urban governance, while sustainable financing instruments and appropriate land management are also essential [62]. Ensuring the proper integration of housing projects requires a careful selection of areas with easy access to essential services, such as public transportation, commerce, and community facilities, both in urban and rural regions. Public authorities must actively assist in the optimized use of land during construction and territorial development, inducing significant structural changes in localities and demanding a comprehensive analysis across various relevant fields [59,62].
Thus, in addition to the positive economic effects that MCMV projects can provide, the concept of a smart city can be emphasized by creating conditions that encourage occupants’ long-term residency through the appreciation of their units and an enhanced quality of life. In this way, the urban environment of a smart city can be developed based on urban planning models that prioritize nature views through windows [63], study the correlation between the presence of high-speed rails and the economic impacts of an urban spatial agglomeration structure [64], identify and quantify deteriorated urban areas that can be repurposed as urban agricultural areas [65], or even allocate urban land with an industrial vocation [66].
The MCMV projects in Brazilian states are oriented towards project sustainability, as envisaged in the Ministry of Regional Development requirements’ guidelines [59], particularly concerning the location of lands in consolidated urban areas. However, there is less rigor regarding the prior determination—by the city government—of these same lands. The same norm also advocates for projects that consider energy efficiency, water management, and passive strategies for environmental comfort. Throughout construction, norms for environmental impact and solid waste management are provided. Nonetheless, the concept of a smart city is not yet a reality in Brazilian social housing projects. Thus, Brazilian MCMV projects become strong candidates for future spatial resilience planning, encompassing actions that make them systems that embody redundancy, diversity, stability, and interoperability [67], to maintain stability when the system’s balance is disrupted [59,68].
Another issue we investigated focuses on analyzing the influence exerted by a federative unit on its neighboring regions. In this regard, we follow the idea of [13] by reaffirming the theoretical–empirical perspective that presupposes the use of spatial regression techniques for the analysis of neighborhood effects, in order to avoid potential biases in the results obtained. Therefore, regarding spatial estimators, the Model 4 approach was used to estimate the relationship between CHUs and UHD for each state between 2013 and 2019 (coefficient β), similar to Model 2.
The positive and significant value for the parameter λ indicates that neighboring UFs have a positive effect on the CHU values allocated to a particular UF. In other words, the allocation of CHUs in a UF is influenced not only by the characteristics of the UF itself but also by the presence and characteristics of neighboring UFs. In this sense, aligning with the discussion about Figure 1, the state of São Paulo, due to its higher values of CHU and UHD, seems to influence the states in its vicinity, exhibiting the characteristic of spatial spillover [13]. Therefore, the third research question is answered and Hypothesis 2 is confirmed.
Returning to the discussion on the South and Southeast regions’ influence on the allocation of CHUs, the results regarding the parameter λ confirm, now consistently, that the states in the South and Southeast regions indeed disrupt the framework of housing contracts under the MCMV program, and the state of São Paulo is the main driver. However, it is important to note that the values of the estimators, even with the presence of control variables, are subject to the influence of asymmetric data distribution.
5.2. Regressions—Control Variables
Firstly, for the variable GINIPHI (Table 3), both Models 1 and 3 showed a negative relationship: (β3 = −126,237.100; p < 0.01) and (β3 = −146,729.700; p < 0.01), respectively. Specifically, the results indicated that when isolating the heterogeneities between the study periods, states with higher levels of income inequality received lower quantities of CHUs. This result may reveal an important social discussion, as argued by [5], that the MCMV program does not seem to take into account the existing socioeconomic disparities in the Brazilian territory, which is a relevant phenomenon for housing policy articulation.
The social, economic, and demographic dynamics of these states are heavily debated by researchers such as [5,12,15,24], who argue about the different realities that the program faces during its implementation. The lack of statistical significance for Models 2 and 4 indicates that, when isolating the differences between states, there is no time correlation between income inequality and CHUs.
Secondly, the MCMV program aims to ensure access to adequate housing for the low-income population, according to criteria established by law. However, this can be hindered not only by social inequalities present in Brazilian regions but also by the costs of constructing affordable housing units [32]. In the given context, the variable of costs per square meter (NSCICC) exhibited a negative relationship with the number of affordable housing units in Model 1, which employed a Pooled OLS regression (β4 = −26.135; p < 0.10). Likewise, in Model 2, which utilized panel fixed effects with individual dummies, NSCICC showed a significantly negative association with the number of affordable housing units (β4 = −44.519; p < 0.01). Furthermore, in Model 4, which employed spatial panel fixed effects with individual dummies, NSCICC also demonstrated a statistically significant negative relationship with the number of affordable housing units (β4 = −29.090; p < 0.01).
These results were expected, considering that production costs are directly related to input prices. In summary, the heterogeneity of input costs in the Brazilian construction sector directly impacts the supply and demand for affordable housing, and, according to the estimated results from the presented models, it does so negatively. Besides, other factors such as the rising prices of increasingly scarce urban land also influence this issue [34]. According to [5], during housing unit construction for the lowest income bracket (bracket 1), the profit margin is fundamentally determined by factors such as the housing unit production cost.
In terms of the variable GDP per capita (GDPPC), Table 3 shows that there was no significant relationship in any of the analyzed models. Evaluating this outcome, it would be expected that states with higher GDPPC would have a lower demand for social interest housing, and vice versa. However, we have already demonstrated in this paper that the state with the highest GDPPC has the greatest SIH’s demand and supply. In order for this relationship to be true, there should be greater equity in income distribution across the population, which is not the case, as indicated by the GINIPHI variable. Therefore, even though the GDP per capita variable did not show statistical significance, the other two control variables demonstrated their interaction with the relationship between UHD and CHUs. Thus, the fourth and last research question was answered.
6. Conclusions
The objective of this study was to analyze and evaluate the federal social housing program “Minha Casa, Minha Vida” (MCMV), implemented throughout Brazil between 2009 and 2021. Based on a literature review, the main characteristic assessed was the probability that this program is being implemented in a highly heterogeneous manner among all Federation states, and therefore, its lack of effectiveness widely questioned in the literature could also be confirmed in this research.
We achieved the objective from two perspectives: temporal and spatial, both using variables of a socioeconomic nature. The temporal perspective allowed us to highlight that the MCMV program’s performance seems to follow the logic of distributing housing units according to the urban housing deficit (UHD) of each Brazilian state, answering the first research question. In other words, when analyzing only the period of MCMV’s overall implementation, disregarding the constant characteristic of the “state” variable, public managers seem to have the UHD of each state as the main criterion for encouraging construction industry investments in this segment. Hypothesis 1 confirmed that, in general, the higher the UHD, the greater the number of CHUs. This finding can be considered positive, as the program is expected to address the demand for decent housing in Brazilian states. However, the heterogeneity of its implementation was confirmed by descriptive and inferential models.
Thus, the paper’s objective was achieved and further deepened by proposing the likely reasons that could explain such heterogeneity by incorporating specific control variables for each state. From a spatial perspective, the different state contexts in which MCMV operates answer our second research question and reinforce the idea that the program meets heterogeneous housing demands, involving both public and private entities. We have excluded variables related to political, legal, and urban issues mainly due to limitations in collecting these variables, as well as econometric constraints. We focused on variables that reflect the population’s income level, the inequality of this income level, and production costs, which are important contributions to understanding the studied phenomenon. Moreover, we have broadened our scope of debate by introducing issues such as sustainable urban development, which ensures the longevity of the undertakings and enhances the quality of life for the benefiting families, land planning and usage, and topics related to the concept of smart cities.
In the same logic, the idea of spatial spillover was identified, answering the third research question and confirming Hypothesis 2. In other words, CHUs, in addition to being allocated to states with higher UHD, are positively influenced by neighboring regions, which characterizes a concentrated allocation dynamic in the southern and southeastern states, specifically in regions near São Paulo. Thus, the regions that are already being served tend to continue receiving and concentrating the majority of investments, creating a condition of self-reinforcement. This confirms that the high degree of heterogeneity of the program tends to consolidate over time.
The interpretation of the models also allowed us to identify that lower quantities of CHUs are correlated with regions with higher levels of income inequality. This aspect became evident when we found that the first bracket—the one with the lowest income—is the least served by the program. Additionally, regions with higher construction costs showed lower levels of contract signings, answering the fourth and final research question.
This paper presents an innovative contribution by examining the social housing program MCMV across the Brazilian territory, employing a temporal and spatial approach with state-level socioeconomic variables as control variables. By utilizing descriptive and inferential statistical techniques, including spatial analysis and regression, the research offers innovative insights into the application of these methods to evaluate the existing literature in this field of inquiry. Furthermore, the paper emphasizes the significance of considering regional factors in the analysis of this phenomenon. This methodological approach can contribute to the enhancement of public housing policies and the reduction in disparities in housing distribution in Brazil.
Finally, the results bring discussions that are directed at researchers and public managers in the field of public housing policies, treating social housing as a guaranteed object by constitutional act and a common right for all Brazilian citizens. It is recommended to conduct further research on this topic to strengthen the theoretical framework, particularly concerning sustainable urban development, smart cities, efficient land management, and sustainability. Additionally, an empirical approach should be employed to enhance the practical scope of the study. The identification of the sign of the relationship between UHD and CHUs in each of the Brazilian states was a question not addressed by this research and remains a recommendation for future studies.
Supplementary Materials
For more detailed information about CHU, RAIS, and SINAPI, you can visit the following links: CHU (contracted housing unit): http://sishab.mdr.gov.br/ (accessed on 6 March 2023); RAIS (Relação Anual de Informações Sociais): http://pdet.mte.gov.br/rais?view=default (accessed on 2 June 2023); SINAPI (Sistema Nacional de Pesquisa de Custos e Índices da Construção Civil): https://www.caixa.gov.br/poder-publico/modernizacao-gestao/sinapi/referencias-precos-insumos/Paginas/default.aspx (accessed on 2 June 2023).
Author Contributions
Conceptualization, F.G.P.M., L.E.C.S. and V.I.M.d.S.; methodology, F.G.P.M. and V.I.M.d.S.; software, V.I.M.d.S.; validation, F.G.P.M.; formal analysis, F.G.P.M.; investigation, F.G.P.M., L.E.C.S. and V.I.M.d.S.; writing—original draft preparation, L.E.C.S. and F.G.P.M.; writing—review and editing, L.E.C.S. and F.G.P.M.; visualization, L.E.C.S.; supervision, F.G.P.M. All authors have read and agreed to the published version of the manuscript.
Funding
The author received no financial support for the research, but received financial support for the publication of this article from PROPESP/PAPQ/UFPA, financed in part by the Coordenação de Aperfeiçoamento de Pessoal de Nível (CAPES) (Coordination for the Improvement of Higher Education Personnel)-Brazil-Finance Code 001.
Data Availability Statement
The data that support the findings of this study are available from the corresponding author upon reasonable request.
Conflicts of Interest
The authors declare no conflict of interest.
References
- Outeiro, G.M.; Nascimento, D.M. A Trajetória Da Política Habitacional a Partir da Perspectiva do Institucionalismo Histórico. Rev. Direito Cid. 2020, 12, 1160–1183. [Google Scholar] [CrossRef]
- Rodrigues, L.d.P. A Produção Habitacional Do Programa Minha Casa Minha Vida Na Região Metropolitana de Sao Paulo. 2015, Volume 13. Available online: https://www.teses.usp.br/teses/disponiveis/8/8131/tde-29072015-144127/pt-br.php (accessed on 20 February 2023).
- Nabil, B. Política Habitacional e Inclusão Social No Brasil: Revisão Histórica e Novas Perspectivas No Governo Lula. Rev. Eletrônica Arquitetura Urban. 2008, 1, 70–104. [Google Scholar]
- Chilvarquer, M. Aplicando O Quadro de Referência Para Análise Jurídica de Políticas Públicas: A Implementação do Programa Minha Casa, Minha Vida, Faixa 1, No Município De São Paulo. Rev. Estud. Inst. 2019, 5, 3, 1116–1141. [Google Scholar] [CrossRef]
- Rolnik, R.; Pereira, A.L.d.S.; Moreira, F.A.; Royer, L.d.O.; Iacovini, R.F.G.; Nisida, V.C. O Programa Minha Casa Minha Vida Nas Regiões Metropolitanas de São Paulo e Campinas: Aspectos Socioespaciais e Segregação. Cad. Metrópole 2015, 17, 127–154. [Google Scholar] [CrossRef]
- FJP—Fundação João Pinheiro. Deficit Habitacional e Inadequação de Moradias no Brasil. 2021. Available online: https://fjp.mg.gov.br/wp-content/uploads/2020/12/04.03_Cartilha_DH_compressed.pdf (accessed on 2 March 2023).
- Loureiro; Rita, M.; Macário, V.; Guerra, P.H. Legitimidade e Efetividade Em Arranjos Institucionais de Políticas Públicas: O Programa Minha Casa Minha Vida. Rev. Adm. Pública 2015, 49, 1531–1554. [Google Scholar] [CrossRef]
- Bloemer, S.; Maria, N.; Xavier, S.S. Programas Habitacionais: Indicadores de Avaliação. Rev. Bras. Gest. Desenvolv. Reg. 2013, 9, 54–74. [Google Scholar]
- Andrade, D.D.C.M. Os Entraves Jurídicos Ocasionados Pelo Direito e Pelo Estado Para a Não Concretização do Direito à Moradia. Rev. Direito Cid. 2018, 10, 2569–2616. [Google Scholar] [CrossRef]
- Lima; Vilela, M.F. O Direito à Moradia e as Políticas Públicas Habitacionais Brasileiras da Segunda Década do Século XXI. Geo UERJ 2020, 36, e48406. [Google Scholar] [CrossRef]
- Bandeira, L.F.; Reyes, E., Jr. Programa Minha Casa Minha Vida (2012–2016): Análise da Eficiência Relativa dos Municípios Brasileiros na Execução de Programas Federais. Rev. Adm. Pública 2021, 55, 309–330. [Google Scholar] [CrossRef]
- Maricato, E. 2017. The Future of Global Peripheral Cities. Lat. Am. Perspect. 2017, 44, 18–37. [Google Scholar] [CrossRef]
- Da Silva, C.F.; Alves, T.W. Dinâmica dos Financiamentos Habitacionais Nos Municípios do Rio Grande do Sul de 2006 a 2010: Uma Avaliação do Programa ‘Minha Casa, Minha Vida’. Rev. Adm. Publica 2014, 48, 27–54. [Google Scholar] [CrossRef]
- Chaves, C.A.B.M. The Selling and Renting of Houses on the Program ‘Minha Casa Minha Vida’ in Parnamirim/RN. Urbe 2019, 11, 1–14. [Google Scholar] [CrossRef]
- Gonçalves, R.R. O Déficit Habitacional Brasileiro: Um Mapeamento por Unidades da Federação e por Níveis de Renda Domiciliar; IPEA: Rio de janeiro, Brazil, 1998; Volume 32. Available online: https://repositorio.ipea.gov.br/handle/11058/2410 (accessed on 3 March 2023).
- Ministério da Economia. Relatório de Avaliação Programa Minha Casa Minha Vida. 2020; p. 85. Available online: https://www.gov.br/cgu/pt-br/assuntos/noticias/2021/04/cgu-divulga-prestacao-de-contas-do-presidente-da-republica-de-2020/relatorio-de-avaliacao-pmcmv.pdf (accessed on 4 March 2023).
- Ministério das Cidades. Programa Minha Casa, Minha Vida. Available online: https://www.gov.br/cidades/pt-br/assuntos/materias/programa-minha-casa-minha-vida (accessed on 7 June 2023).
- Royer, L.d.O. Financeirização da Politica Habitacional: Limites e Perspectivas. 2009. Available online: https://www.teses.usp.br/teses/disponiveis/16/16137/tde-19032010-114007/pt-br.php (accessed on 6 March 2023).
- Lavinas, L.; Eduardo, H.G.; Marcelo, R.d.A. Desigualdades Regionais e Retomada Do Crescimento Num Quadro de Integração Econômica. Economia. 1997. Available online: https://repositorio.ipea.gov.br/handle/11058/2221 (accessed on 14 March 2023).
- Moreira, C.F.; de Castro, M.F. A Análise Jurídica da Política Econômica Aplicada ao Programa Minha Casa, Minha Vida: Um Estudo de Caso de Brasília (2014–2017). Rev. Direito Cid. 2020, 12, 1459–1495. [Google Scholar] [CrossRef]
- Klintowitz, D.C. Entre a Reforma Urbana e a Reforma Imobiliária a Coordenação de Interesses na Política Habitacional Brasileira nos Anos 2000. Ph.D. Thesis, Escola de Administração de Empresas de São Paulo, São Paulo, Brazil, 2015. Available online: http://bibliotecadigital.fgv.br/dspace/handle/10438/13791 (accessed on 5 March 2023).
- Pessoa, S. Avaliação do Minha Casa Minha Vida. 2020. Available online: www1.folha.uol.com.br/colunas/samuelpessoa/2020/08/avaliacao-do-minha-casa-minha-vida.shtml (accessed on 10 June 2023).
- Feitosa, F.d.F. Aspectos territoriais na estimativa das necessidades habitacionais: Construindo alternativas metodológicas. In Ensaios e Discussões sobre o Déficit Habitacional no Brasil; Santos, E.C., Ed.; Fundação João Pinheiro: Belo Horizonte, Brazil, 2020; pp. 37–52. Available online: https://drive.google.com/file/d/1stJWtC0dMFtK_Zz0G0zFBjDgw2WxjL_i/view?usp=share_link (accessed on 21 June 2023).
- Gonçalves, R.R.; Castelo, A.M. Coabitação: Em busca de uma definição relevante e de uma mensuração possível. In Ensaios e Discussões sobre o Déficit Habitacional no Brasil; Santos, E.C., Ed.; Fundação João Pinheiro: Belo Horizonte, Brazil, 2020; pp. 303–317. Available online: https://drive.google.com/file/d/1stJWtC0dMFtK_Zz0G0zFBjDgw2WxjL_i/view?usp=share_link (accessed on 21 June 2023).
- Bellucco, D.; Marcos, M. Efeitos de Transbordamento Espacial do PIB per Capita nos Arranjos Populacionais Paulistas. 2021, pp. 1–19. Available online: https://brsa.org.br/wp-content/uploads/wpcf7-submissions/4302/Artigo_ENABER_2021_ID.pdf (accessed on 2 June 2023).
- Denes, G.; Komatsu, B.K.; Filho, N.M. Uma Avaliação Dos Impactos Macroeconômicos e Sociais de Programas de Transferência de Renda nos Municípios Brasileiros. Rev. Bras. Econ. 2018, 72, 292–312. [Google Scholar] [CrossRef]
- Carvalho, A.Y.d.; Mário, J.M.; José, J.d.S. Avaliando o Efeito Dos Investimentos Em Telecomunicações Sobre o PIB; Texto Para Discussão; IPEA: Sao Paulo, Brazil, 2017; pp. 7–45. Available online: https://repositorio.ipea.gov.br/handle/11058/8082 (accessed on 19 March 2023).
- Constantino, M.; Pegorare, A.B.; Da Costa, R.B. Desempenho Regional do IDH e do PIB per Capita dos Municípios de Mato Grosso do Sul, Brasil, Entre 2000 e 2010. Interações 2016, 17, 234–246. [Google Scholar] [CrossRef]
- Neri, M.C. Texto Principal A Nova Classe Média: O Lado Brilhante Dos Pobres (The Bright Side of the Poor). 2010. Available online: http://hdl.handle.net/10438/21942 (accessed on 2 March 2023).
- Acioly, C., Jr. Impacto ou resultado no acesso à habitação: Medir o déficit ou medir a necessidade habitacional? In Ensaios e Discussões sobre o Déficit Habitacional no Brasil; Santos, E.C., Ed.; Fundação João Pinheiro: Belo Horizonte, Brazil, 2020; pp. 151–161. Available online: https://drive.google.com/file/d/1stJWtC0dMFtK_Zz0G0zFBjDgw2WxjL_i/view?usp=share_link (accessed on 21 June 2023).
- IPECE—Ceará. Entendendo o Índice de Gini. 2012; p. 9. Available online: https://www.ipece.ce.gov.br/wp-content/uploads/sites/45/2015/02/Entendendo_Indice_GINI.pdf (accessed on 6 March 2023).
- Da Silva, M.L.; Tourinho, H.L.Z. O Banco Nacional de Habitação e o Programa Minha Casa Minha Vida: Duas Políticas Habitacionais e Uma Mesma Lógica Locacional. Cad. Metrópole 2015, 17, 401–417. [Google Scholar] [CrossRef]
- Arretche, M.T.S. Políticas Sociais no Brasil: Descentralização em um Estado Federativo. Rev. Bras. Ciências Sociais 1999, 14, 111–141. [Google Scholar] [CrossRef]
- Monteiro, R.A.; de Rezende Veras, A.T. A Questão Habitacional no Brasil. Mercator 2017, 14, 33–46. [Google Scholar] [CrossRef]
- Szajubok, N.K.; Alencar, L.H.; de Almeida, A.T. Modelo de Gerenciamento de Materiais na Construção Civil Utilizando Avaliação Multicritério. Production 2006, 16, 303–318. [Google Scholar] [CrossRef]
- Baltagi, B.H. Econometric Analysis of Panel Data; Springer: Berlin/Heidelberg, Germany, 2008; Volume 4. [Google Scholar]
- Anselin, L.; Gallo, J.L.; Jayet, H. Spatial panel econometrics. In The Econometrics of Panel Data: Fundamentals and Recent Developments in Theory and Practice; Springer: Berlin/Heidelberg, Germany, 2008; pp. 625–660. [Google Scholar]
- Millo, G.; Piras, G. Splm: Spatial panel data models in r. J. Stat. Softw. 2012, 47, 1–38. [Google Scholar] [CrossRef]
- Bivand, R.S.; Wong, D.W.S. Comparing Implementations of Global and Local Indicators of Spatial Association. Test 2018, 27, 716–748. [Google Scholar] [CrossRef]
- Anselin, L. Spatial Econometrics: Metodhs and Models; Springer: Berlin/Heidelberg, Germany, 1988; ISSN 1098-6596. [Google Scholar]
- Liang, J.; Alexeev, S. Harm Reduction or Amplification? The Adverse Impact of a Supervised Injection Room on Housing Prices. Reg. Sci. Urban Econ. 2023, 98, 103856. [Google Scholar] [CrossRef]
- Shaikh, A.M.; Santos, A.; Canay, I.A. The Wild Bootstrap with a Small Number of Large Clusters. Rev. Econ. Stat. 2021, 103, 346–363. [Google Scholar] [CrossRef]
- FIESP. Observatório da Construção. Evolução das Contratações e Investimentos do PMCMV. Available online: https://www.fiesp.com.br/observatoriodaconstrucao/noticias/evolucao-das-contratacoes-e-investimentos-do-pmcmv/ (accessed on 24 March 2023).
- Acolin, A.; Hoek-Smit, M.C.; Eloy, C.M. High Delinquency Rates in Brazil’s Minha Casa Minha Vida Housing Program: Possible Causes and Necessary Reforms. Habitat Int. 2019, 83, 99–110. [Google Scholar] [CrossRef]
- Calixto, M.J.M.S.; Bernardelli, M.L.F.D.H.; Maia, D.S.; de Araujo, C.M. Do BNH ao PMCMV: O Processo de Conformação de Novas Periferias Urbanas em Cidades Médias Brasileiras. GEOgraphia 2022, 24, 1–18. [Google Scholar] [CrossRef]
- Romeiro, P.S. Zonas Especiais de Interesse Social: Materialização de um Novo Paradigma no Tratamento de Assentamentos Informais Ocupados por População de Baixa Renda PUC-SP Zonas Especiais de Interesse Social: Materialização de um Novo Paradigma no Tratamento de Asse. 2010, p. 122. Available online: https://edisciplinas.usp.br/pluginfile.php/4108525/mod_resource/content/1/dissertação zeis.pdf (accessed on 26 July 2023).
- Brito, F.R.; de Oliveira Royer, L. O Setor Imobiliário Habitacional Pós-2015: Crise Ou Acomodação? Cad. Metrópole 2022, 24, 147–172. [Google Scholar] [CrossRef]
- Vieira, J.R.d.C.; Barboza, F.; Sobreiro, V.A.; Kimura, H. Machine Learning Models for Credit Analysis Improvements: Predicting Low-Income Families’ Default. Appl. Soft Comput. J. 2019, 83, 105640. [Google Scholar] [CrossRef]
- Jesus, P.; Denaldi, R. Experiências de Regulação Urbana e Suas Possibilidades: Análise a Partir do Programa Minha Casa Minha Vida na Região do Grande ABC (São Paulo). Eure 2018, 44, 67–87. [Google Scholar] [CrossRef]
- Menezes, R.L.V.d.S. O Programa Minha Casa, Minha Vida: Limites dos Arranjos Institucionais para uma Política Pública de Habitação de Interesse Social. In Direito Urbanístico? Ensaios por uma Cidade Sustentável. Quartier Latin, 1st ed.; 2016; pp. 263–286. Available online: https://edisciplinas.usp.br/pluginfile.php/4182405/mod_resource/content/1/Programa%20Minha%20Casa%20Minha%20Vida_Rafael%20Menezes_2014-2.pdf (accessed on 6 August 2023).
- Anselin, L.; Bera, A.K.; Florax, R.; Yoon, M.J. Simple diagnostic tests for spatial dependence. Reg. Sci. Urban Econ. 1996, 26, 77–104. [Google Scholar] [CrossRef]
- McMillen, D.P. Perspectives on Spatial Econometrics: Linear Smoothing with Structured Models. J. Reg. Sci. 2012, 52, 192–209. [Google Scholar] [CrossRef]
- Ywata, A.D.C.; Albuquerque, P.D.M. Métodos e modelos em econometria espacial. Uma revisão. Rev. Bras. de Biom. 2011, 29, 273–306. [Google Scholar]
- Fox, J. Applied Regression Analysis and Generalized Linear Models; Sage Publications: Thousand Oaks, CA, USA, 2015. [Google Scholar]
- Maricato, E. The Statute of the Peripheral City. The City Statute of Brazil: A Commentary. 2010, pp. 5–22. Available online: https://repositorio.usp.br/item/002480159 (accessed on 27 March 2023).
- Hirata, F. “Minha Casa, Minha Vida”: Política habitacional e de geração de emprego ou aprofundamento da segregação urbana? Rev. Aurora 2009, 27, 1–5. [Google Scholar] [CrossRef]
- ABRAINC. Índice FipeZap. Available online: https://www.fipe.org.br/pt-br/indices/abrainc/#indicador-mensal (accessed on 10 June 2023).
- CBIC. Pós-Obra: Geração de Renda e Emprego na Economia. 2021, pp. 1–42. Available online: https://cbic.org.br/wp-content/uploads/2021/02/pos-obraestudo-cbic.pdf (accessed on 26 July 2023).
- Brasil. Cartilha Portaria de Requisitos Técnicos, Urbanísticos e Socioterritoriais do Programa Casa Verde e Amarela. 2021; p. 33. Available online: https://www.gov.br/mdr/pt-br/assuntos/habitacao/eedus/2021_12_01ModeloCartilha_WEB.pdf (accessed on 6 July 2023).
- Fortunato, R.A. A Sustentabilidade Na Habitação De Interesse Social: Estudos de caso em reassentamentos do Programa Minha Casa, Minha Vida no Núcleo Urbano Central da Região Metropolitana de Curitiba-Brasil. In A Cidade e os Problemas Socioambientais Urbanos; UFPR: Curtiba, Brazil, 2020; p. 657. [Google Scholar]
- Marques, L.M.; Miron, L.I.G. Minha Casa Minha Vida: Análise da Percepção de Valor Sobre as Áreas Comuns. XVI Encontro Nacional de Tecnologia do Ambiente Construído. 2016. Available online: http://hdl.handle.net/10183/122525 (accessed on 6 August 2023).
- Locurcio, M.; Tajani, F.; Anelli, D. Sustainable Urban Planning Models for New Smart Cities and Effective Management of Land Take Dynamics. Land 2023, 12, 621. [Google Scholar] [CrossRef]
- Fikfak, A.; Zbašnik-Senegačnik, M.; Drobne, S. Greenery as an Element of Imageability in Window Views. Land 2022, 11, 2157. [Google Scholar] [CrossRef]
- He, Y.; de Sherbinin, A.; Shi, G.; Xia, H. The Economic Spatial Structure Evolution of Urban Agglomeration under the Impact of High-Speed Rail Construction: Is There a Difference between Developed and Developing Regions? Land 2022, 11, 1551. [Google Scholar] [CrossRef]
- Nkosi, D.S.; Moyo, T.; Musonda, I. Unlocking Land for Urban Agriculture: Lessons from Marginalised Areas in Johannesburg, South Africa. Land 2022, 11, 1713. [Google Scholar] [CrossRef]
- Zhang, C.; Yao, D.; Zhen, Y.; Li, W.; Li, K. Mismatched Relationship between Urban Industrial Land Consumption and Growth of Manufacturing: Evidence from the Yangtze River Delta. Land 2022, 11, 1390. [Google Scholar] [CrossRef]
- Zeng, Y.; Pan, H.; Chen, B.; Wang, Y. Study on Rural Planning in Plain and Lake Area from the Perspective of Spatial Resilience. Sustainability 2023, 15, 4285. [Google Scholar] [CrossRef]
- Kong, L.; Mu, X.; Hu, G.; Zhang, Z. The Application of Resilience Theory in Urban Development: A Literature Review. Environ. Sci. Pollut. Res. 2022, 29, 49651–49671. [Google Scholar] [CrossRef]


Disclaimer/Publisher’s Note: The statements, opinions and data contained in all publications are solely those of the individual author(s) and contributor(s) and not of MDPI and/or the editor(s). MDPI and/or the editor(s) disclaim responsibility for any injury to people or property resulting from any ideas, methods, instructions or products referred to in the content. |
© 2023 by the authors. Licensee MDPI, Basel, Switzerland. This article is an open access article distributed under the terms and conditions of the Creative Commons Attribution (CC BY) license (https://creativecommons.org/licenses/by/4.0/).