Article

Light Environment Evaluation of the Architecturalized Immersive New Media Public Art Installation from the Audiences’ Visual Safety Perspective

1
Faculty of Architecture and Urban Planning, Chongqing University, Chongqing 400030, China
2
Key Laboratory of New Technology for Construction of Cities in Mountain Area, Chongqing University, Chongqing 400030, China
3
Faculty of Engineering, The University of Sydney, Camperdown, NSW 2006, Australia
4
Faculty of Arts, Design & Architecture, University of New South Wales, Sydney, NSW 2021, Australia
5
School of Fine Arts, Sichuan Fine Arts Institute, Chongqing 401331, China
*
Authors to whom correspondence should be addressed.
Buildings 2023, 13(8), 2122; https://doi.org/10.3390/buildings13082122
Submission received: 21 July 2023 / Revised: 14 August 2023 / Accepted: 16 August 2023 / Published: 21 August 2023
(This article belongs to the Special Issue Advanced Technologies for Urban and Architectural Design)

Abstract

:
How to balance the artistry and comfort of the light environment in an architecturalized immersive new media public art installation (AINMPAI) to ensure the safety of the audiences’ visual safety has become a new issue. The lack of corresponding lighting design standards makes this issue more challenging. This paper explores the appropriate luminance range of the irregularly curved LED screens of the AINMPAI with high-luminance natural light as the background. The influence of the audience behavior mode on the brightness threshold of the LED screens in the AINMPAI under the background of Internet communication is discussed. Through software simulation and field measurement, the effectiveness of the design measures based on the local characteristics of the work is verified. The overall average luminance, the regional luminance, the partial luminance, and the corresponding luminance contrast of the inner screen surface were measured at every 10° change in the solar altitude angle during daytime. The nighttime light environment parameters and the temperature of the device throughout the day were also measured. A total of 487 visitors were interviewed for subjective evaluation of the comfort of the light and thermal environments. The results show that: (1) the overall average luminance cannot wholly describe the actual luminance of the critical parts of the special-shaped curved screen in the device and that two indicators, the regional luminance and the partial average luminance, need to be added; (2) the maximum brightness limit of LED screens in the daytime can be 1000 cd/m2 but at night it should be controlled within 200 cd/m2; (3) natural light is the main factor that causes the high average brightness and low contrast of the daytime device screen; (4) the recommended indicators for such artistic installations should balance the absolute values of average brightness, artistic effect, and transmission priority. This study can provide foundational data and a methodological reference for establishing AINMPAI light environment design guidelines or recommended standards based on audiences’ visual safety.

1. Introduction

With the fast growth of digital communication technology and LED display technology, as well as the significant decrease in manufacturing costs [1], outdoor LED screens and LED full-color spotlight sources are used as a new building façade material that enables information and data exchange. These new materials are widely applied on key building façades in urban central business districts and constitute an architectural “media façade” [2,3]. “Media façade” refers to the installation of LED or other illumination devices on building walls, with the use of video controls or network technology to generate huge images on the devices [2,4]. Through the use of interactive techniques, “media façades” can also create “virtual spaces” that perceive and respond to pedestrians, enabling two-way information transfer and communication [5]. Such large-scale media façades are considered as a living canvas that presents new media experiences to visitors through sound and motion pictures [6]. The emergence of media façades creates a new image in the monotonous urban environment, serving to connect people and communicate between them and the external environment in the digital age [7]; it even makes architecture new nighttime landmarks that attract tourists [8].
However, the rapid expansion of urban landscape lighting has led to the spread of extraordinarily scaled architectural media facades in major cities at an astonishing pace [9,10]. “Mega TVs”, composed of LED lattices, can be seen everywhere on urban streets, creating exaggerated urban illusions and making the urban landscape a spectacle at night [11]. This new way of viewing, with its strong visual impact, has shown a powerful influence and appeal in capturing attention [12], increasing the exposure of the city and boosting its nighttime tourism economy.
The visualization [13] and spectacle [14,15] of urban public spaces is a prominent feature of the age of mass media. Guy Debord stated, “In societies dominated by modern conditions of pro-duction, life is presented as an immense accumulation of spectacles”. In the landscape system, “…the present age…prefers the sign to the thing signified, the copy to the original, representation to reality, appearance to essence…” [16]. In this context, spectacle representation is overemphasized and the relatively microscopic perspective in which people situate as individuals is discarded [13]. Hundreds of high-rise building façades with LED linkages construct an image spectacle that has made the urban “light show” go viral. The huge investment has also brought popularity to the landscape lighting industry—in 2018, the scale of China’s landscape lighting industry approached CNY 100 billion [17,18].
However, landscape lighting also turns the street into a giant cinema where citizens and tourists become passive audiences [19]. The generalization of light images over the streets not only covers and eliminates the urban cultural and architectural features but also produces massive visual information overloads, causing information anxiety to the viewers. How to continue the urban context and dispose of the increasingly serious visual control of “image spectacles” on individuals has become a thorny problem [20].
The flashing of large-scale and high-luminance LED screens also creates light pollution, disturbing residents’ lives [21], transportation [22], and urban the ecological environment [23], causing a large number of complaints and legal disputes [21]. Kai Feng et al. [24] measured the luminance of 10 media façade buildings in Shanghai and Ningbo, China, using the maximum luminance, average luminance, and luminance contrast as the evaluating factors based on the GB/T 35626—2017 Specification for limitation to obtrusive light of outdoor lighting [25] and JGJ/T 163—2008 Code of lighting design of urban nightscape [26]. They compared the measurement result with the subjective evaluations of 365 pedestrians on their light pollution. Although the evaluation factors met the standards, the results showed negative responses from the pedestrians regarding light pollution, indicating an inconsistency between the current standard of light interference limits on the media façade and the people’s true feelings.
In addition, the high energy consumption of media façades and the limited lifetimes and rising maintenance costs of LED screens are also problems with media façades that are difficult to solve [27].
As we all know, public art has been used to help solve a series of urban problems and has proved itself to be a notable resource in the business of urban regeneration and development [28]. Aiming at the above problems, some cities have imposed strict restrictions on the settings for architectural media facades. In China, the Chongqing government has even encouraged the placing of immersive new media public art installations in public spaces to replace media facades [29].
The term new media art surfaces was coined in the mid 1990s and refers to the convergence of mass media, the new capabilities of data processing, and their intersections with art [30]. New media art is an artistic genre spanning several disciplines, including, but not limited to, the visual and performing arts. In these artistic practices, art, science, and technology are inherently intertwined. New media art uses science and technology as a medium instead of a tool [31]. “Immersive experience” refers to the process in which people pay high attention to their current activities, fully engage in them when they are in a certain state of concentration, and then obtain satisfaction after completion [32,33].
Immersive new media public art installations build an open and interactive [34] virtual and realistic space in physical spaces such as streets, squares, and parks. Compared with media façades, their appeal is not limited to the immense sense of volume, visual tension, or landmark commemoration [35]. Through the high degree of openness and interaction, the public’s viewing behavior becomes a part of the artworks [36], and the public space becomes a field for the exchange of emotions and collision of ideas [35]. The interaction between immersive new media public art installations and the public is bidirectional and dynamic, fundamentally breaking the static structure of traditional public art. The virtual space dispels the sense of distance between art and the public, bringing a new emotional experience [37].
“Publicity”, “locality”, and “intervention” are the three primary characteristics of immersive new media public art [38]. Immersive new media public art, in the context of contemporary art, must first be shown as the “independence of the artist”. The work must conform to the artist’s consistent creation system to add internal logic, criticism, and multi-dimensional cultural associations beyond its simple ornamental value. “Publicity” is the internal “source and core” of public arts [39], which takes serving the public and making them feel comfortable as the standard. “Locality” is subject to the requirements of the city’s laws and spatial functions [38]. “Intervention” is a part of immersive new media artworks through the public’s participation behavior, which derives new meanings.
Due to the complexity of its structure, form, and technology, artists alone find it difficult to complete immersive new media public art installations. It is no longer the product of an artist’s independent creation but a work jointly completed by artists, designers, scientists, and engineers through a particular cooperation mode [40,41]. Therefore, works often inevitably bear the imprint of other disciplines besides contemporary art, which is not only triggered a dispute over the boundaries of contemporary art, public art, and architecture [42] but also involved the balance of the relationship between art, technology, culture, and economy in the creation process. From repeated games to mutual compromise and inspiration, artists and multi-disciplinary experts obtain new inspiration and finally reach a creative consensus through consultation. This is a feature of immersive new media public art installation creation that is different from other types of art creation.
From the technical perspective, compared with building media facades, which are difficult for viewers to reach, immersive new media public art installations have the advantages of pleasant scale, low energy consumption, and low disturbance to the environment. As they are set in the city’s public area, the “public” and “local” attributes of the works determine that they must comply with the principles of safety and comfort, as well as the requirements of the relevant laws and regulations of urban planning and urban management. From the perspectives of scale and the construction method, it is closer to a small building or structure and has architectural characteristics. This paper calls these types of immersive public art installations architectural immersive new media public art installations (AINMPAIs). Therefore, it is necessary to evaluate the safety and comfort of the physical environment they construct and analysis of the impact of the light environment on the visual safety of the audience is essential. Unfortunately, there is no precedent for reference in the literature. In CIE, IESNA lighting design guidelines, and national lighting design standards, there are no relevant design guidelines or standards for the safety and comfort of the light environment of AINMPAIs.
Because of the above reasons, this paper intends to select an AINMPAI as a sample to measure and evaluate the light environment in the installation after completion.
In this study, we propose to measure the light environment parameters of the device during daytime and nighttime and compare the obtained parameters with the luminance limit indicators of outdoor LED screens in the current lighting design guidelines that are only applicable to night remote viewing conditions. Then, through subjective evaluation interviews with visitors on their light environment comfort, we will judge whether the device’s day and night light environment parameters are appropriate. This information will allow us to propose the luminance limits of LED screens in the AINMPAI during daytime and nighttime under the conditions of close viewing.
While measuring the light environment, measurement of the thermal environment and a subjective evaluation of the comfort level shall also be processed, ensuring the thermal comfort is within the acceptable range to avoid an adverse thermal environment affecting the accuracy of the visitors’ subjective evaluation of the light environment.
This study aims to collect data and propose recommendations on the daytime and nighttime luminance limits of LED screens for immersive new media art installations. The calculation method of average luminance and contrast of LED screens with the irregular curved surfaces is proposed. This study provides a data reference for the future design and creation of such art installations. The study also aims to provide a method for establishing light environment design guidelines or recommend standards for AINMPAIs based on audiences’ visual safety.

2. Sample Description

In 2018, Chinese contemporary artist Biao Zhong and architect/lighting designer Yonghong Yan collaborated on a large-scale of architecturalized immersive video interactive art installation “Through the Wormhole” [43], which attempted to reclaim the physical space that should belong to the public in the urban public space by utilizing tangible physical devices. It is a response to the visual violence generated by the new media images that are currently flooding the visual field and over-encroaching on the physical space of the city [19]. “Through the Wormhole” is an “architecturalized” new media art installation that bears noticeable signs of architectural creation. All of its construction materials are taken from the “media façade” of high-rise buildings: steel structure, aluminum buckle plates, glass curtain wall, and LED lattice; however, the materials are flipped, wrapping up the light and images so the starry sky is returned to the city. It is also an introspection into the light pollution caused by current urban landscape lighting [11].
This installation is based on the concept of site-specific design that incorporates daylight and digital images with various architectural techniques. The viewers can perceive the changes in light and shadow both inside and outside the installation by interactive methods such as viewing and gesture sensing. This is an interdisciplinary public art experiment using outdoor LED screen panels that are usually installed on building façades but are now used as a carrier of images in an art installation that can be viewed by visitors interactively at close range. The work achieves an all-weather, immersive art experience through internal ventilation, heat dissipation, and daylight control through openings on the surface of the installation [11].
Through the Wormhole” is a 1150 cm × 490 cm × 360 cm steel structure. The inner wall is composed of standard outdoor LED screen panels with size 256 mm × 1024 mm, resolution 16 pix × 64 pix/unit, and pixel pitch 16 mm. The outer skin is made from perforated aluminum plates and Low-E glass. It was created specifically for “Open Source—The First Shenzhen Art Biennale 2018” (hereinafter referred to as the “Shenzhen Exhibition”). The surrounding environment, the spatial relationship with other works, and the flow of the visitors jointly determine its volume, form, and orientation.
According to the pattern of annual solar radiation and solar altitude angle changes at the exhibition site, the designers used the parametric modeling software Rhinoceros 3D and the Grasshopper-platform-based plug-ins Ladybug and Honeybee, to simulate the lighting environment of the installation by connecting with simulation engines of Radiance, Daysim, etc.; then, they used the meteorological data plug-in WEATHER TOOL to simulate the average solar radiation heat gain from the outer skin of the device on a typical day, superimposed it with the heat generated by the LED screen, and deduced that the required structural cavity size for ventilation and heat dissipation of the installation should be 30 cm and that the average opening rate of the outer skin should be about 38%. To reduce the interference of direct natural light in the visual focus area of the image on top of the “Through the Wormhole” installation, the opening rate of the aluminum plate was increased from 17% on top of “Through the Wormhole” to 50% on its bottom sides. This improved the contrast and clarity of the main viewing area while ensuring heat dissipation and ventilation (Figure 1).
The cooperation between artists, architects, lighting designers, structural designers, building thermal experts, electrical designers, intelligent control experts, electroacoustic experts, musicians, 3D animation designers, LED screen manufacturers, curtain wall manufacturers, builders, and other experts in the 12 types of work created and constructed the “Through the Wormhole” installation. See Figure 2 for the collaboration between professions in the “Wormhole” light environment design.
The work has been exhibited in the cities of Shenzhen, Datong, Shanghai, and Chongqing, receiving about 1,436,000 visitors [11]. After more than a year of touring experience, it was found that the inner space of the installation did not suffer from overheating problems caused by different seasons, climates, and the various orientations of the exhibition sites. However, because the size and position of the holes on the installation surface were designed according to the change of incidence angle of direct sunlight in Shenzhen in summer, looking at the actual effects, the clarity of the images presented in the daytime was better in the Shenzhen exhibition, whereas the inner lighting environment was disturbed more by sunlight during some time segments in the Chongqing exhibition (Figure 3a,b).
Due to the constraints of exhibition time, venue, and visitor density, we were unable to conduct on-site measurements during the Shenzhen and Datong exhibitions (the Shanghai exhibition is an indoor exhibition and does not involve natural light interference, so is excluded). We only measured the lighting and thermal environment inside the installation during the Chongqing exhibition. As the latitude difference between Chongqing and Shenzhen is nearly 6°, the orientation and angle of the installation are different, and the exhibition is also taking place in a different season, Chongqing is not the best place for the presentation of the images in “Through the Wormhole”. However, it is still possible to obtain a rough idea of its internal thermal and lighting environment through on-site measured data and infer from this whether the architectural technical strategy of “Through the Wormhole” is appropriate.
The color vocabulary of the “Through the Wormhole” video images originates from the artist’s unique painting style. In order to reduce the difficulty of evaluation and focus on core issues, changes in the color parameters of scene images are not within the scope of this article. The “Through the Wormhole” art installation hereafter this text will be abbreviated as “Wormhole”.

3. Materials and Methods

3.1. Methods

According to the as-built drawing, the “Wormhole” device was simulated and reconstructed. First, the software simulation compared the device’s total solar irradiation obtained on the days of the exhibition in Shenzhen and Chongqing (Figure 4a,b). We then compared the available amount of direct sunlight entering the device in the afternoon at the two locations. According to Equations (B1) and (B2) in Appendix 8 in the GB/T 3840-1991 technical methods for making local emission standards of air pollutants [44], which are listed as Equations (1) and (2) below, the solar declination angles and altitude angles in Shenzhen on 12 May 2018 and in Chongqing on 7 April 2019 were calculated on an hour-by-hour basis. The results show the maximum solar altitude angles (where the azimuth angle is 0°, following the south-clockwise convention) at the two places on the days of the Shenzhen and Chongqing exhibitions were 85.38° and 66.93°, respectively, as in Figure 4a,b. Ecotect analysis software and Rhino Grasshhopper 7.0 Ladybug Tools 1.5.0 were used to construct the thermal model of the scene on that day (Figure 4a,b). It was calculated that the total solar irradiation on the day of the Chongqing exhibition was higher than that on the day of the Shenzhen exhibition (Figure 5). Therefore, if the measured temperature in the installation on the day of the Chongqing exhibition was within the acceptable range, we can generally assume that the thermal environment of the device was feasible. The environmental temperature in the installation on the day of the Chongqing exhibition will be measured over time in the following section.
δ = ( 0.006918 0.399912 cos θ 0 + 0.070257 sin θ 0 0.006758 cos 2 θ 0 + 0.000907 sin 2 θ 0 0.002697 cos 3 θ 0          + 0.001480 sin 3 θ 0 ) × 180 / π
where:
θ 0 : 360 × d n /365 (in degrees);
δ : Solar declination angle (in degrees);
d n : Day of year, counting from 0.
h 0 = sin 1 ( sin φ sin δ + cos φ cos δ cos Ω )
where:
h 0 : Solar altitude angle (in degrees);
φ : The latitude (in degrees);
Ω : The local hour angle (in degrees).
The calculations of solar azimuth angle from Zhang et al. [45] are shown below. The local latitude and longitude are denoted as ( φ s ,   λ s ) and the subsolar point’s coordinates are ( φ o ,   λ o ) .
φ s = δ ,
λ s = 15   T G M T 12 + E m i n / 60 ,
S x = cos φ s sin ( λ s λ o ) ,
S y = cos φ o sin φ s sin φ o cos φ s cos ( λ s λ o ) ,
S z = sin φ o sin φ s + cos φ o cos φ s cos ( λ s λ o )
The solar azimuth angle γ s following the south-clockwise convention is calculated as:
γ s = a t a n 2   ( S x , S y )
From the shadow simulations, the installation in the Chongqing exhibition is placed at an angle of 30° east of north (with the entrance orientation as the benchmark) and the solar altitude angle is lower than that in Shenzhen. Therefore, more direct sunlight was obliquely projected into the installation after noon, which led to overbrightness and a decrease in the contrast of the background images on the inner screen, which is not conducive to the presentation of the picture (Figure 4c,d).
The simulation and comparison results show that the light and thermal environments of “Wormhole” on the day of the Chongqing exhibition were more unfavorable than those for the Shenzhen exhibition. Therefore, the following can generally indicate whether the “Wormhole” device that was designed for the Shenzhen exhibition is appropriate in terms of its “local” technical strategy through the measurement and analysis of the sunlight and thermal environment of the Chongqing exhibition.

3.2. Evaluation Indicators

The lighting environment inside the “Wormhole” installation consisted of natural light and artificial light from LED screens. To obtain a good visual effect, in addition to the sufficient brightness of the visual target, the luminance contrast should also be within the appropriate range. The effect of daytime image presentation is closely related to natural light control, whereas the effect of nighttime images depends mainly on the setting of white screen luminance of the LED outdoor grille screens (hereinafter referred to as “inner screen”).
The post-construction evaluation of the lighting environment of the installation is based on four elements, screen luminance, background luminance, luminance contrast, and image clarity, as quantitative indicators. The screen glare is evaluated based on qualitative indicators from the visitors’ intuitive feelings at the scene.

3.2.1. Recommended Standards for Inner Screen Luminance

The relevant provisions of the standards and guidelines for outdoor LED displays, advertising, and signage lighting luminance limitations are shown in Table 1 [25,26,46,47,48].

3.2.2. Recommended Standards for Inner Screen Luminance Contrast

The recommended value in Table 1 is the brightness limit of outdoor LED screens under remote viewing at night. The current standard has no corresponding luminance limit in the daytime [49]. The “Wormhole” video is broadcast from 12:00 a.m. to 10:00 p.m. and is displayed day and night. As we all know, the background luminance of outdoor screens during daytime and nighttime is very different. The background luminance formed by natural light in the daytime can reach several thousand cd/m2, hundreds of times the background luminance at night. In such a bright background, it is necessary to improve the picture’s luminance significantly to meet the requirements of visual clarity. Therefore, evaluating the effect of the “Wormhole” interior screens should not only consider the single indicator of the visual luminance limit but also add the luminance contrast as an important indicator to evaluate visual comfort. From the perspective of visual comfort, the luminance contrast between the observed object and the background environment is not the same for different countries and organizations. However, it is mainly concentrated in the range between 2 and 10 [25,50,51,52,53] and recommended not to exceed 20 [25,54,55].

3.3. Formula and Assessment Methods

According to Table 1, the project only needs to measure whether the internal screen’s overall luminance meets the maximum luminance limit requirements. However, the evaluation method in Table 1 only describes the average luminance of the two-dimensional flat screens. When applied to three-dimensional and irregularly curved screens, its measurement and calculation methods are too rough to accurately describe the luminance distribution of various areas on those complexly shaped screens. Therefore, this paper divides the irregularly curved screen into two parts. Based on the overall average luminance L o ¯ of the inner screen, two indicators, namely the regional average luminance L o ¯ i and the local average luminance L o ¯ i j , are added.
The inner screen of the installation was divided into three areas: the entrance, middle, and exit of the “Wormhole”. Each area was subdivided into three parts: the left side, the top, and the right side (Figure 6c). According to the principle of even distribution, the measurement points were set by considering the visual trajectory of the visitor tour (Figure 6d).

3.3.1. Average Luminance of Inner Screens

The average luminance of a part is measured by taking the average of various measurement point values inside the part, denoted as L o ¯ i j . The zonal average luminance L o ¯ i and the entire average luminance L o ¯ are calculated through Equations (9) and (10).
L o ¯ = 1 3 i = 1 3 L o ¯ i
where:
L o ¯ : average luminance of all parts (entirety), cd/m2;
L o ¯ i : average luminance of the 3 parts (zone) in row i , cd/m2.
L o ¯ i = 1 3 j = 1 3 L o ¯ i j
where L o ¯ i j is the average luminance of the inner screen on the part at row i , column j , cd/m2.

3.3.2. Average Background Luminance of Inner Screens

The average background luminance of a part is measured by taking the average value of various measurement points at the gap of the inner screen parts, denoted as L b ¯ i j . The zonal average background luminance L b ¯ i and the entire average background luminance L b ¯ are calculated through Equations (11) and (12).
L b ¯ = 1 3 i = 1 3 L b ¯ i
where:
L b ¯ : average luminance of all parts (entirety), cd/m2;
L b ¯ i : average luminance of the 3 parts (zone) in row i , cd/m2.
L b ¯ i = 1 3 j = 1 3 L b ¯ i j
where L b ¯ i j is the average luminance of the inner screen on the part at row i , column j , cd/m2.

3.3.3. Average Luminance Contrast

Partial average luminance contrast C ¯ i j , zonal average luminance contrast C ¯ i , and entire luminance contrast C ¯ are calculated through Equations (13)–(15):
C ¯ = L o ¯ L b ¯ L b ¯
C ¯ i = L o ¯ i L b ¯ i L b ¯ i
C ¯ i j = L o ¯ i j L b ¯ i j L b ¯ i j

3.4. Measurement Method

During the Chongqing exhibition, to check whether the design of the “Wormhole” light environment in non-extreme weather conforms to the original idea, its light environment was measured. The measurement was conducted in the square in front of the Art Museum of Sichuan Fine Arts Institute on 7 April 2019, a sunny day with abundant direct sunlight and intense solar radiation (Figure 7). In order to avoid the temperature in the device being beyond the normal range influencing the visitors’ subjective evaluation of the light environment, the measurement of the thermal environment and the subjective evaluation of thermal comfort were carried out simultaneously. Six graduate architecture and architectural optics students conducted random sampling interviews with the audience in the daytime and at night. A total of 519 visitors were interviewed. The proportions of interviewees under 18 years old, 19–59 years old, and over 60 years old were approximately equal, and each age group consisted of a similar number of men and women. Among them, 304 visitors were selected in the daytime, where 285 valid samples were obtained, and 215 visitors were selected at night, where 202 of the samples were valid.
The measurement equipment used was an SRC-2 handheld spectral luminance meter, an Everfine BM-7 color luminance meter, an XYI-III full digital illuminance meter, and a HOBO U23 temperature and humidity meter.
A 10° change in the solar altitude angle was taken as then measurement interval for measuring the surface brightness of the inner screen of the device. Since most of the visitors came in the afternoon, the daytime test period started at 12:55 (time segment A), corresponding to the sun’s maximum altitude angle of 66.93° on the day, and ended at 18:38 (time segment G). The night test period was 21:00–22:00.
The luminance meter measures the surface brightness of the inner screen at fixed points. Each measuring point is continuously measured three times.
The background luminance was measured by switching the image on the screen through the intelligent control system. It measured the background luminance formed at the gap of the inner screens when the natural light passed through the perforated aluminum plates with a black screen. A total of three consecutive measurements were taken at each measurement point.
The air temperature inside and outside the installation was monitored simultaneously; the measurement height was 1.0 m (pedestrian height), and the measurements were stored automatically every 5 min.
The temperature difference between the inside and the outside of the installation was calculated using time-by-time measurements. Subjective evaluation of the thermal comfort of the “Wormhole” according to the visitors was recorded through interviews.

3.5. Light Environment Measurement Data

First, it is necessary to eliminate the impact of the thermal environment on the audience’s sense of experience. The measurement results of the thermal environment are as follows: During the daytime, T i < T o . The temperature difference between the inside and the outside of the installation was 3.7~4 °C during time segments A, B, and C, when the outdoor temperature was the highest. As time passed, the outdoor temperature dropped and the temperature inside and outside the installation converged gradually. The maximum temperature inside the installation on the measurement day was 31.8 °C. A total of 519 visitors were randomly selected for interviews on the thermal comfort inside the installation, and 487 valid samples were obtained. A total of 94.7% of the respondents considered the temperature inside the installation to be within an acceptable range (Figure 8). Therefore, it can be considered that the respondents completed the subjective evaluation of the light environment without being affected by an adverse thermal environment.

3.5.1. Measurement Data of Luminance and Contrast

  • Daytime luminance of inner screens
The five guidelines and standards in Table 1 can be used for comparison. Their suggestions on the maximum average brightness of outdoor LED screens are different and are 1000 cd/m2, 600 cd/m2, 500 cd/m2, and 400 cd/m2. This paper will compare them one by one.
The entire average luminance L o ¯ showed a general trend of decreasing over time, with the maximum luminance appearing during time segment B. L o ¯ did not exceed the maximum limit of 1000 cd/m2 recommended by CIE 150:2017 [48], CIE234:2019 [46] in Table 1 in all test time segments. Segments C–G meet the maximum limit of 600 cd/m2 set by GB/T 36101-2018 [47]; segments E–G meet the maximum limit of 400 cd/m2 set by JGJ/T 163-2008 [26]. The average background luminance L b ¯ showed a similar trend to L o ¯ , with the peak during the time segments A–C; the values for this period were in the range 315.86–490.38 cd/m2 (Figure 9).
  • The zonal average luminance L o ¯ i of the inner screen area did not exceed 1000 cd/m2. The values did not exceed 600 cd/m2 in time segments D–G, whereas in the F and G segments, the values met the most stringent requirement of 400 cd/m2 set by JGJ/T 163-2008 [26] (Figure 10);
  • Although both L o ¯ and L o ¯ i met the requirements of CIE 150:2017 [48] and CIE234:2019 [46], in terms of specific measurement parts, L o ¯ i j at the entrance (Figure 11), middle (Figure 12) and exit (Figure 13) varies widely.
  • L o ¯ i j 
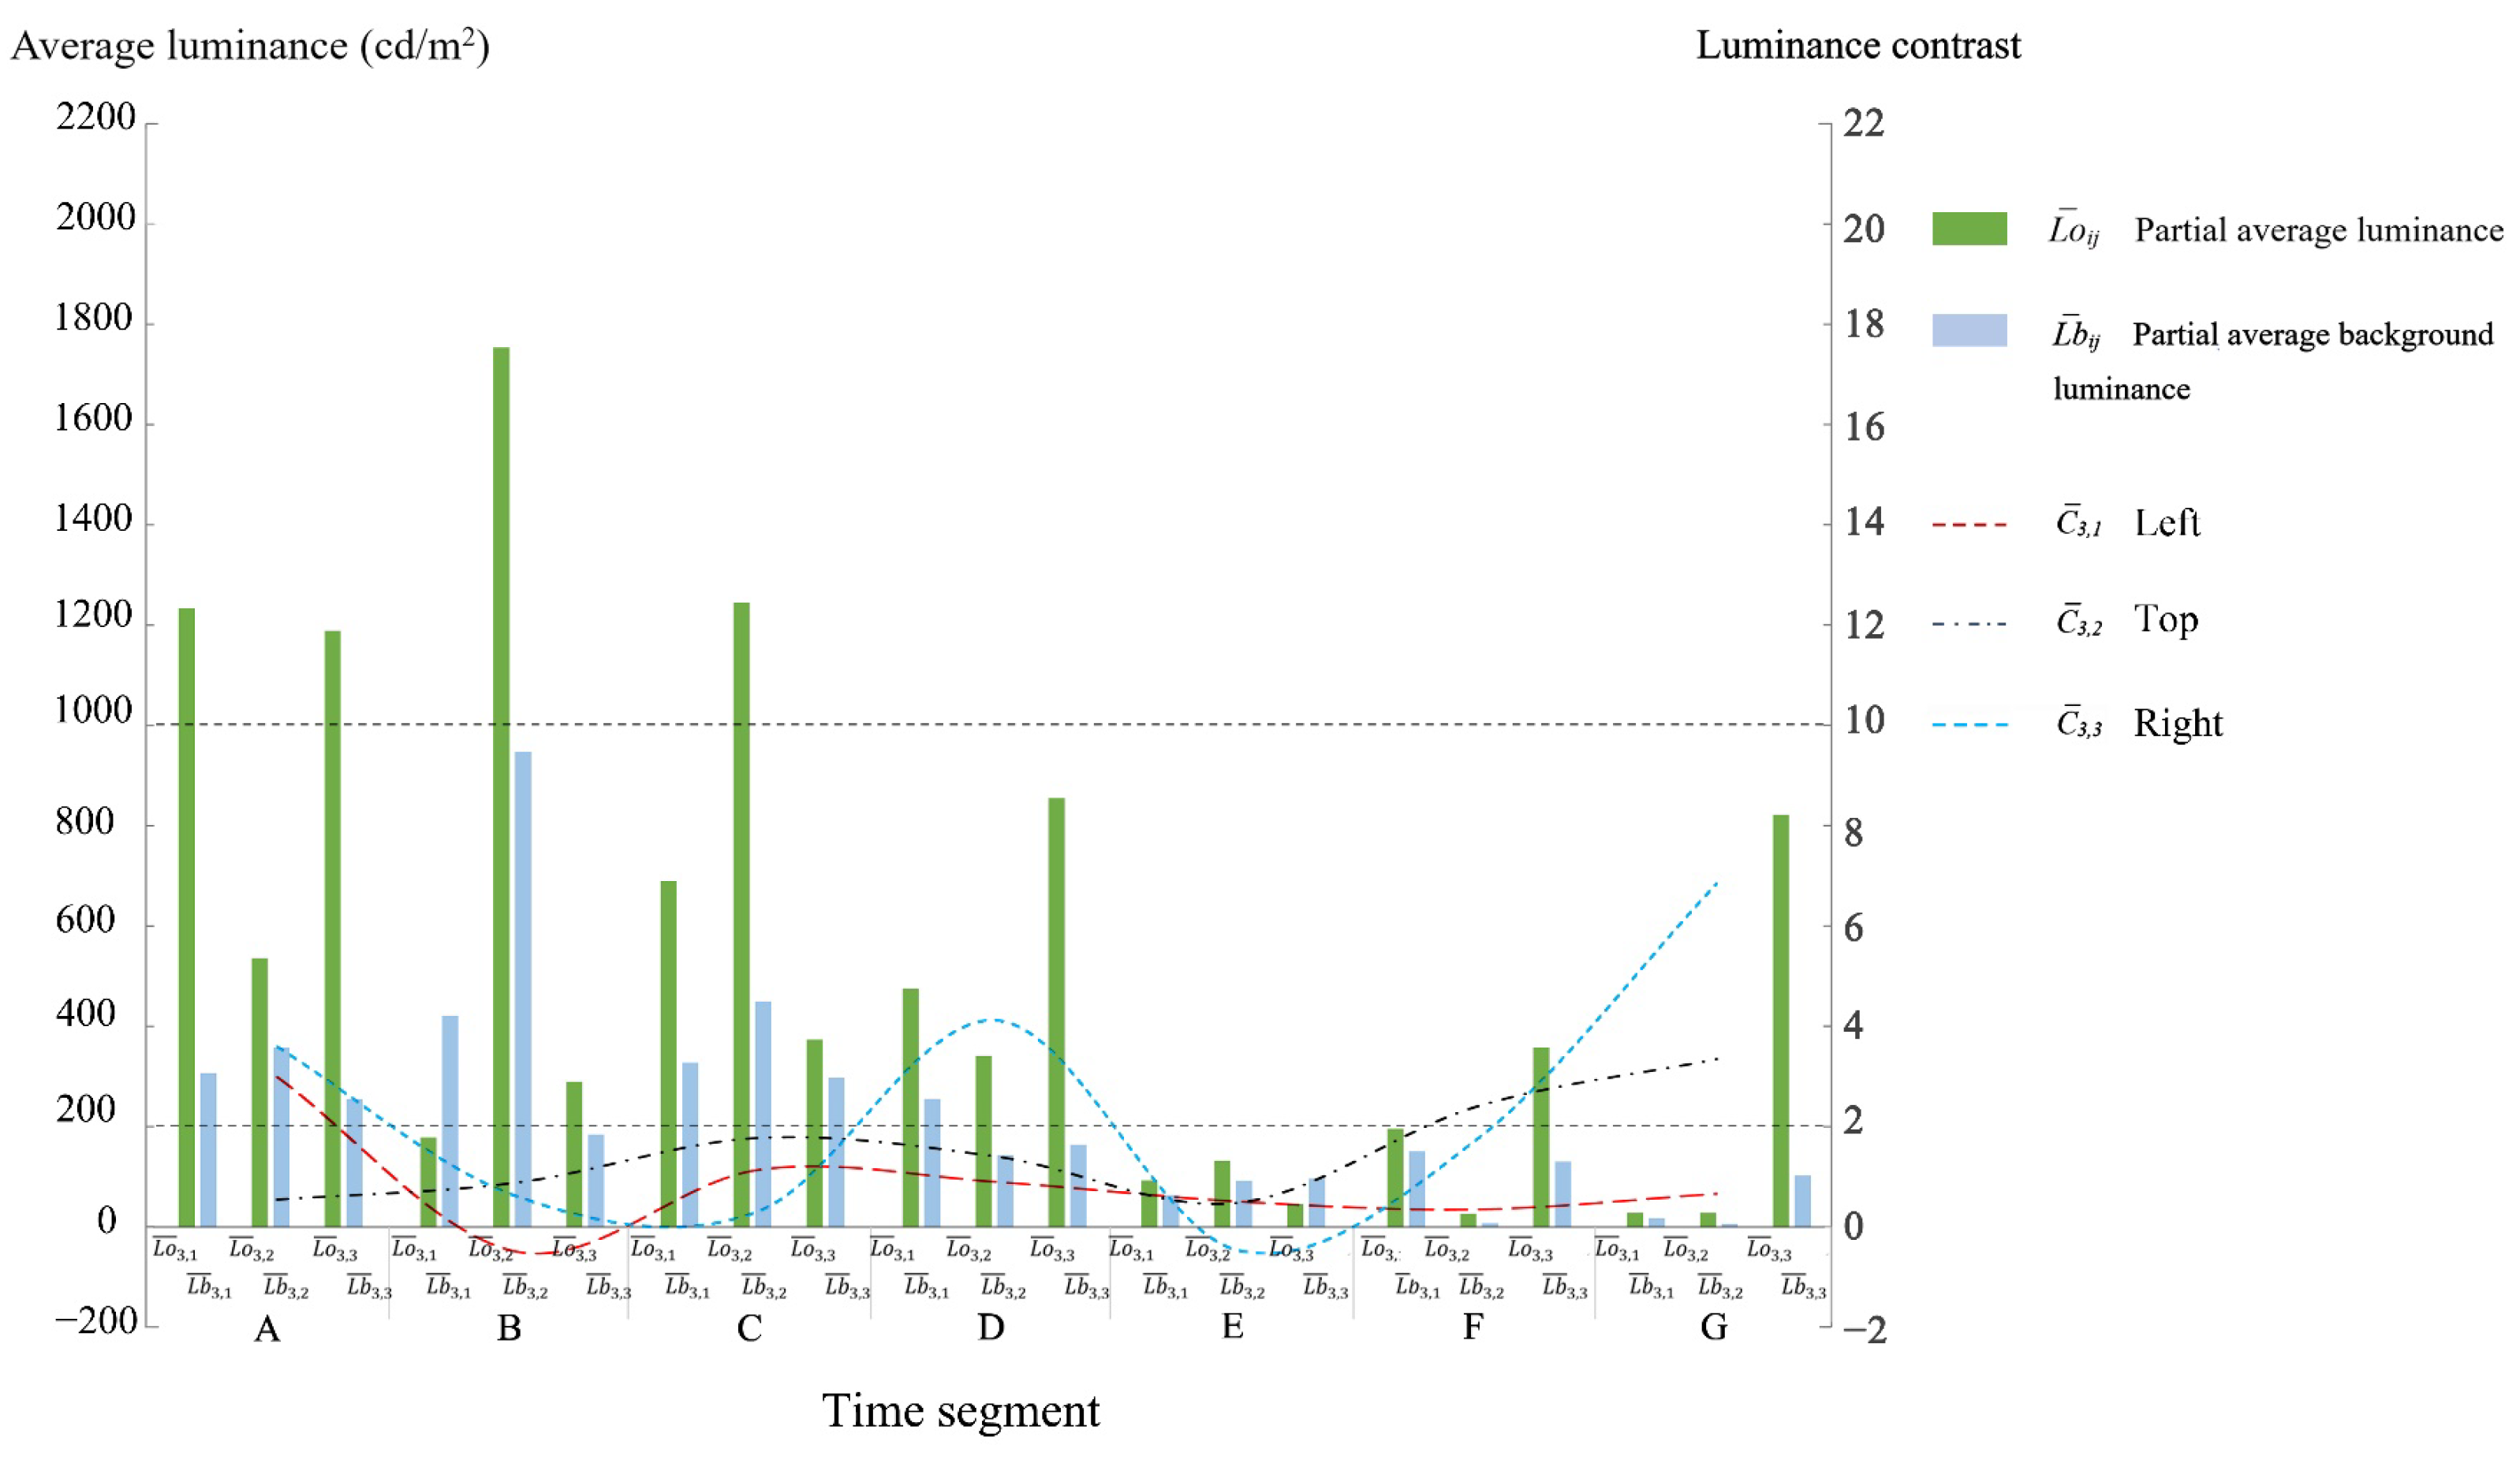
at the entrance’s top during segments B of “Wormhole” exceeded 1000 cd/m2 (Figure 11). L o ¯ i j at the exit’s left and top of “Wormhole” also exceeded 1000 cd/m2 during segments A–C. The maximum values for L o ¯ i j and L b ¯ i j appeared at the exit top during segment B, reaching 1750 cd/m2 and 945.58 cd/m2, respectively (Figure 13), indicating that the exit of the installation was too bright. The L o ¯ i j of all parts in “Wormhole” performed well within the limitation of 1000 cd/m2 (Figure 12).
In this project, the background luminance of the LED screen is the direct + reflected natural light luminance of each inner screen zone measured after turning off the artificial light on the screen, which reflects the intensity of the natural light entering the device at each time segment. Figure 10 shows that the background luminance formed by natural light during the A–C segments was as high as 291.29~516.62 cd/m2.
2.
Daytime Luminance Contrast of Inner Screens
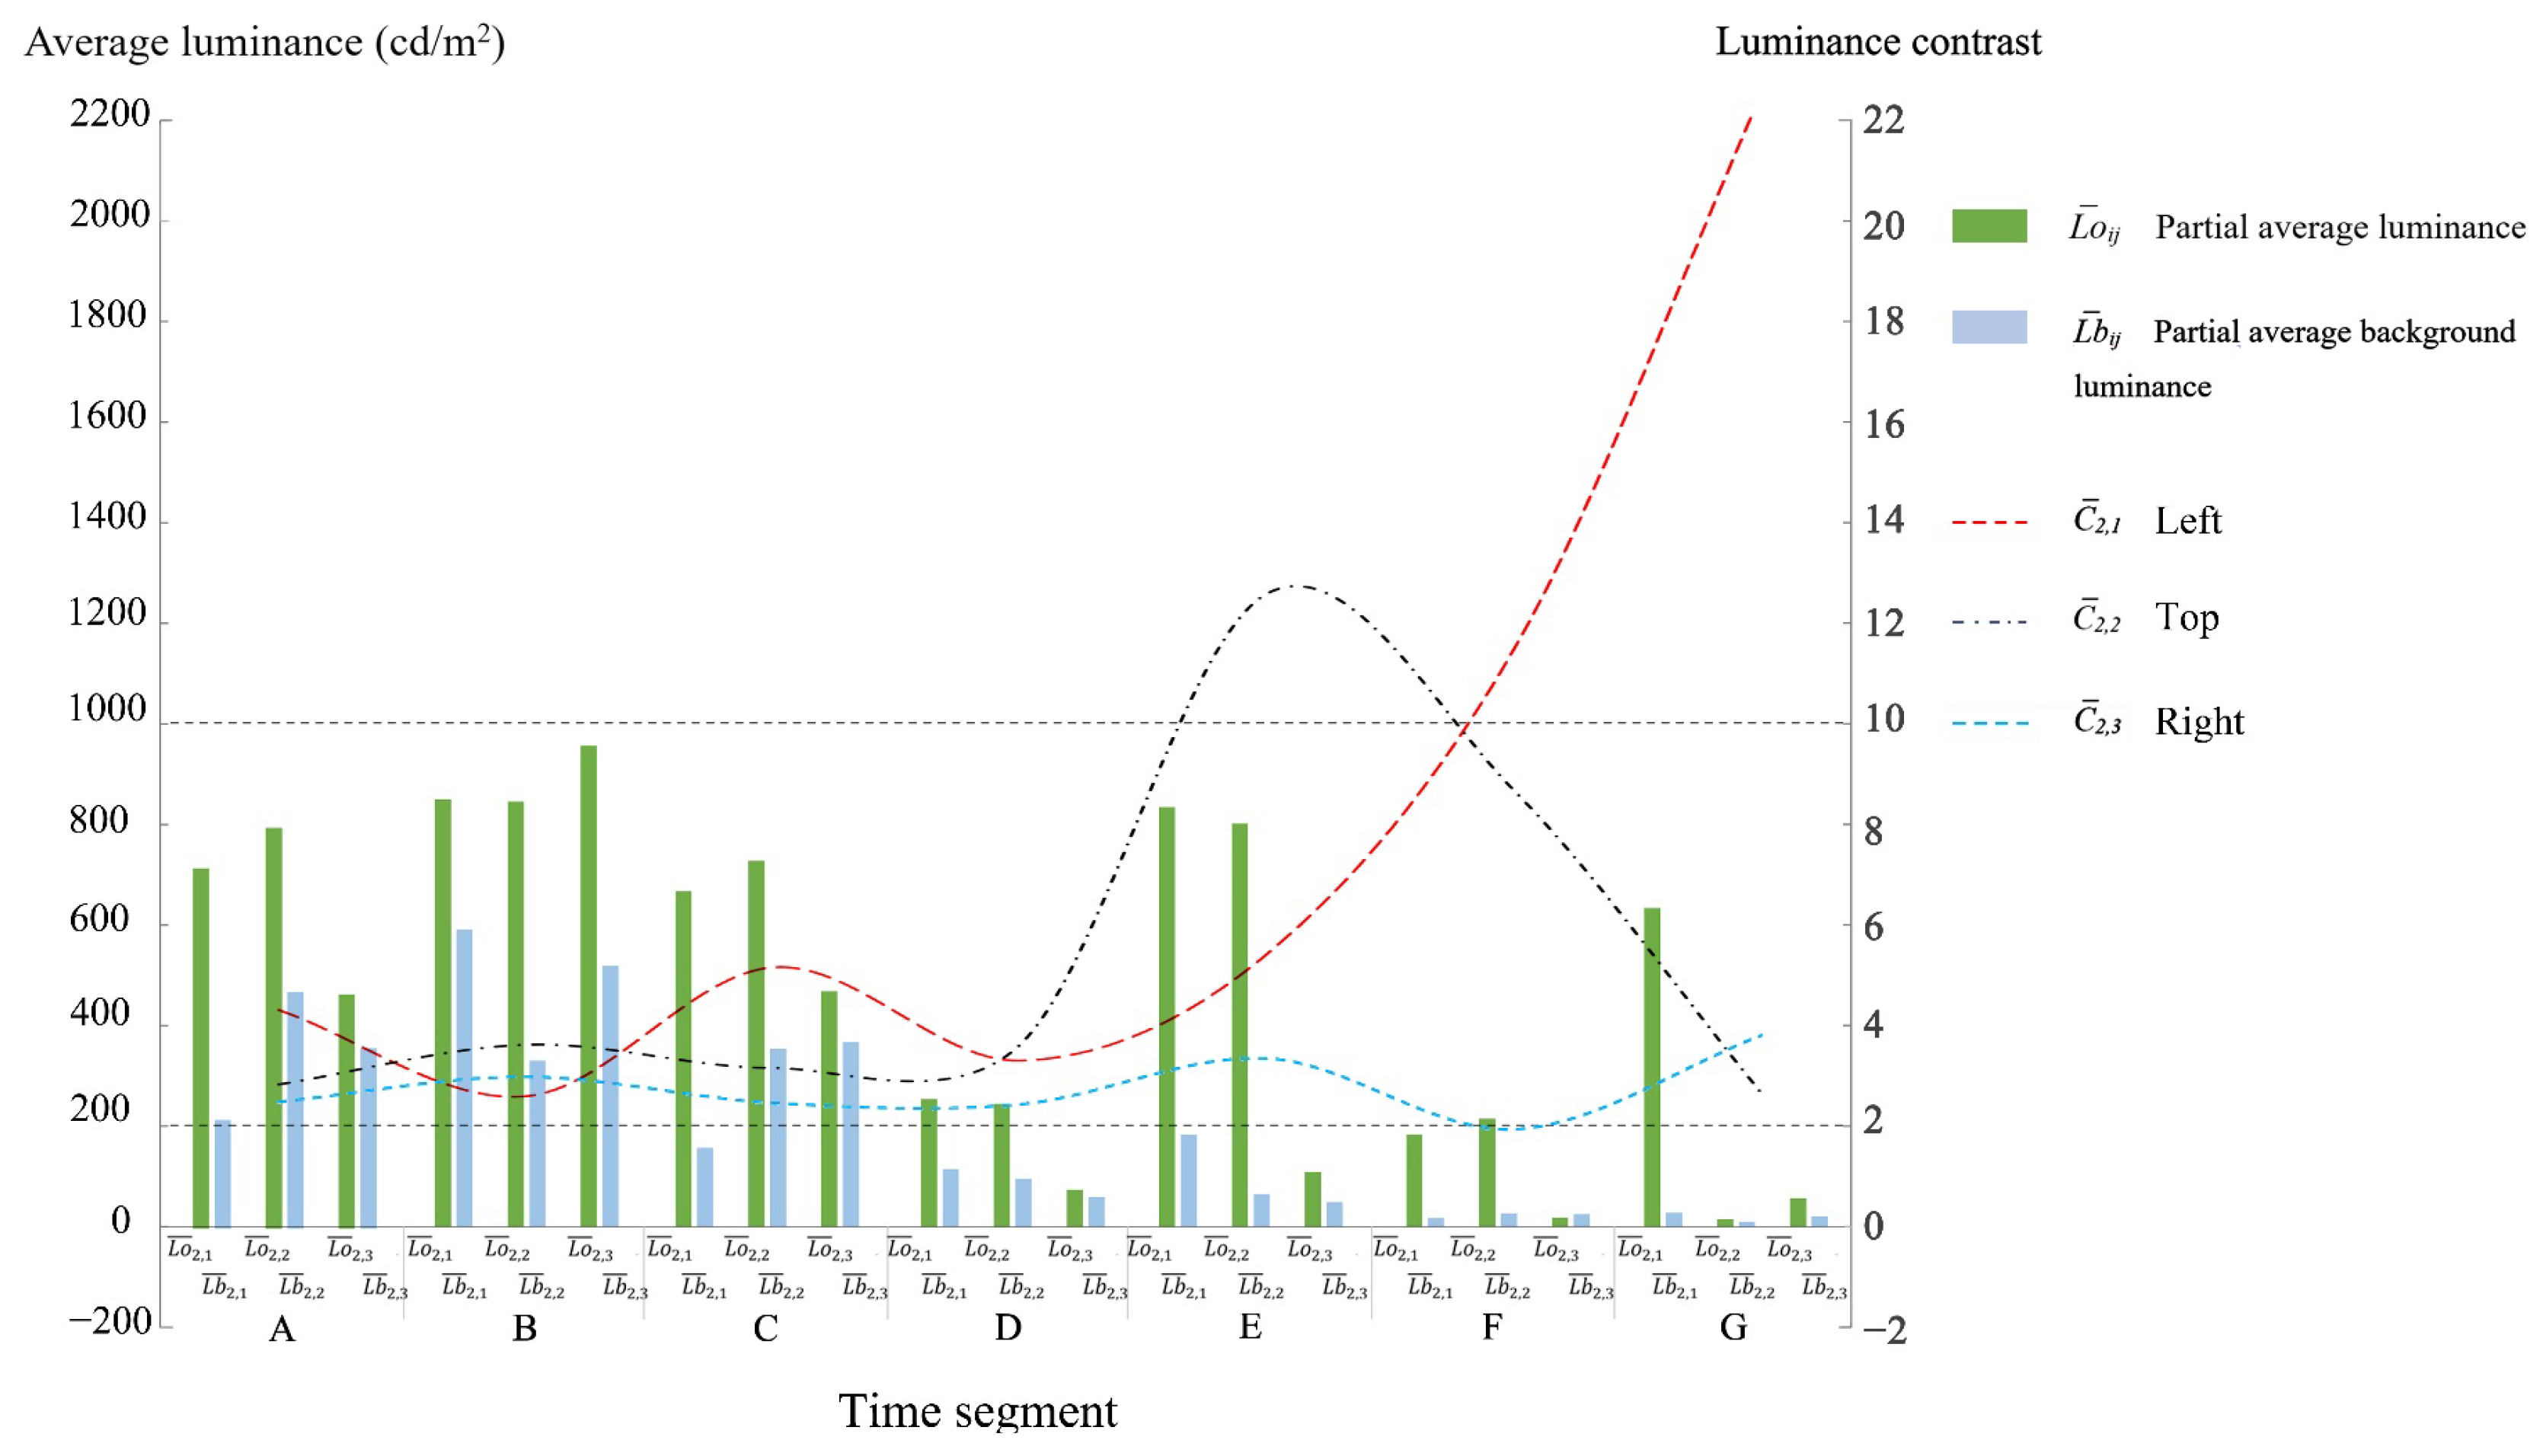
According to Section 3.2.2, this paper takes 2 to 10 as the appropriate range for the luminance contrast.
  • The entire average luminance C ¯ falls between 1:2–1:10 in the time segments E–G. C ¯ is lower during segments A–D, and within segments B and C, C ¯ < 1 (Figure 9), which is a negative contrast, indicating the installation was more disturbed during these two segments, resulting in less image clarity;
  • The zonal average luminance C ¯ i meets the requirements at the entrance of the “Wormhole” during segments F and G, at the middle of the “Wormhole” during segments E and F, and at the exit of the “Wormhole” during segments A and G (Figure 10). C ¯ i in the middle of the “Wormhole” is relatively higher;
  • The change in C ¯ i j by time is more dramatic, with negative contrast during certain time segments and high contrast during segments F and G. There are four positions where >10, three of them are in the middle of the “Wormhole”, and one is at the entrance. The maximum value for C ¯ i j reaches 22.44 (Figure 12).
Overall, as time passes and less natural light enters the “Wormhole”, the contrast rises and the picture becomes clearer; however, the partially excessive contrast reduces visual comfort.
3.
Nighttime Luminance of Inner Screens
The surrounding luminance at night is only 4 cd/m2, which is negligible compared with the screen luminance. At this time, the measured luminance of the inner screen is the average luminance corresponding to the content of the screen. Since there is no natural light on the inner screen at night, only L o ¯ and L o ¯ i need to be calculated.
It is calculated that L o ¯ is 138.7 cd/m2 and the L o ¯ i value at each position is: 196.4 cd/m2 at the entrance of the “Wormhole”, 131.88 cd/m2 in the middle of the “Wormhole”, and 87.7 cd/m2 at the exit of the “Wormhole”.

3.5.2. Subjective Evaluation of Visitors

During the thermal comfort satisfaction interview with the visitors, we also completed the interview with question on the brightness, contrast, glare, picture definition, overall visual comfort, and preferences when taking photos. According to the interview results, the satisfaction of the five indicators in the daytime exceeded 80%, and 86.8% of the visitors were satisfied with the overall visual comfort of the device. However, 11.9% of the audience believed that the brightness of the light environment was too dark, 14.1% thought that the contrast was too low, 14.7% thought that the clarity of the picture in some time segments was not enough, and 18.3% thought that the glare generated had an impact on the immersive experience.
The satisfaction of the night audience with the picture definition increased by 2.1% compared with that in the daytime. However, the number of people who believed that glare affects immersive experience increased by 3.9% and the number of people who felt intense glare increased by 4.6%. However, the audience’s dissatisfaction with glare does not affect the evaluation of the overall visual comfort. Compared with the daytime, the satisfaction of the overall visual comfort evaluation at night increased by 2.6 percentage points.
Regarding behavior preference, 73.1% of the audience preferred high-brightness pictures when taking photos.
Figure 14 and Figure 15 conclude the interview results.
Although the results of the interviews showed that glare had a certain impact on the immersive experience, it was observed that the dynamic images with high luminance and partial glare were the most popular among the visitors. The artist designed several images changing from low luminance to high luminance instantaneously. When gazing at the screen, one can feel the obvious glare. However, instead of avoiding such images, the visitors actively interacted with them, looking for the best angle for photos and short videos. This “brightness-chasing” behavior of the visitors seems to contradict the recommendations for screen luminance limitations and appropriate contrast ratios discussed above, as the flickering and dramatic dynamic images with high brightness and high saturation greatly aroused the visitors’ emotions.

4. Results

4.1. Analysis of Measured Data

  • The daytime entire average luminance L o ¯ meets the maximum luminance limitation for outdoor screens recommended by CIE 150:2017 [48] and CIE 234:2019 [46];
  • L o ¯ i and L b ¯ i are composed of artificial light + reflected light from the floor and direct natural light + reflected light from the floor, respectively. L b ¯ i in each installation area during segment G in the evening, when natural light is weak, is only 3.96~9.98% of that during segment B in the afternoon, when light is strong. L o ¯ i of the former is only 26.34~39.55% of the latter when the artificial light is exactly the same. This demonstrates that the contribution of natural light to the average daytime screen luminance is much greater than that of artificial light;
  • Before segment E in the afternoon, the contrast of the inner screen was low due to excessive natural light entering the “Wormhole” and having a negative impact on the clarity of the screen; after segment E, the contrast increased and the image clarity improved, whereas the contrast became too high in some parts in the evening. Therefore, the Chongqing exhibition is not the best place for displaying the installation in terms of the physical “site-specific” properties;
  • Compared with segment B, when daytime L o ¯ i was the highest, the nighttime L o ¯ i values at the entrance, the middle, and the exit of the “Wormhole” were 23.44%, 14.98%, and 14.15%, respectively. Nevertheless, these areas are quite popular among professional photographers due to nighttime images’ high contrast and sound clarity;
  • The higher the outdoor temperature, the greater the temperature difference between the inside and outside of the installation. This indicates that the ventilation and heat dissipation of the installation is good and that the perforation rate of the outer skin meets the requirements of thermal engineering and heat dissipation.

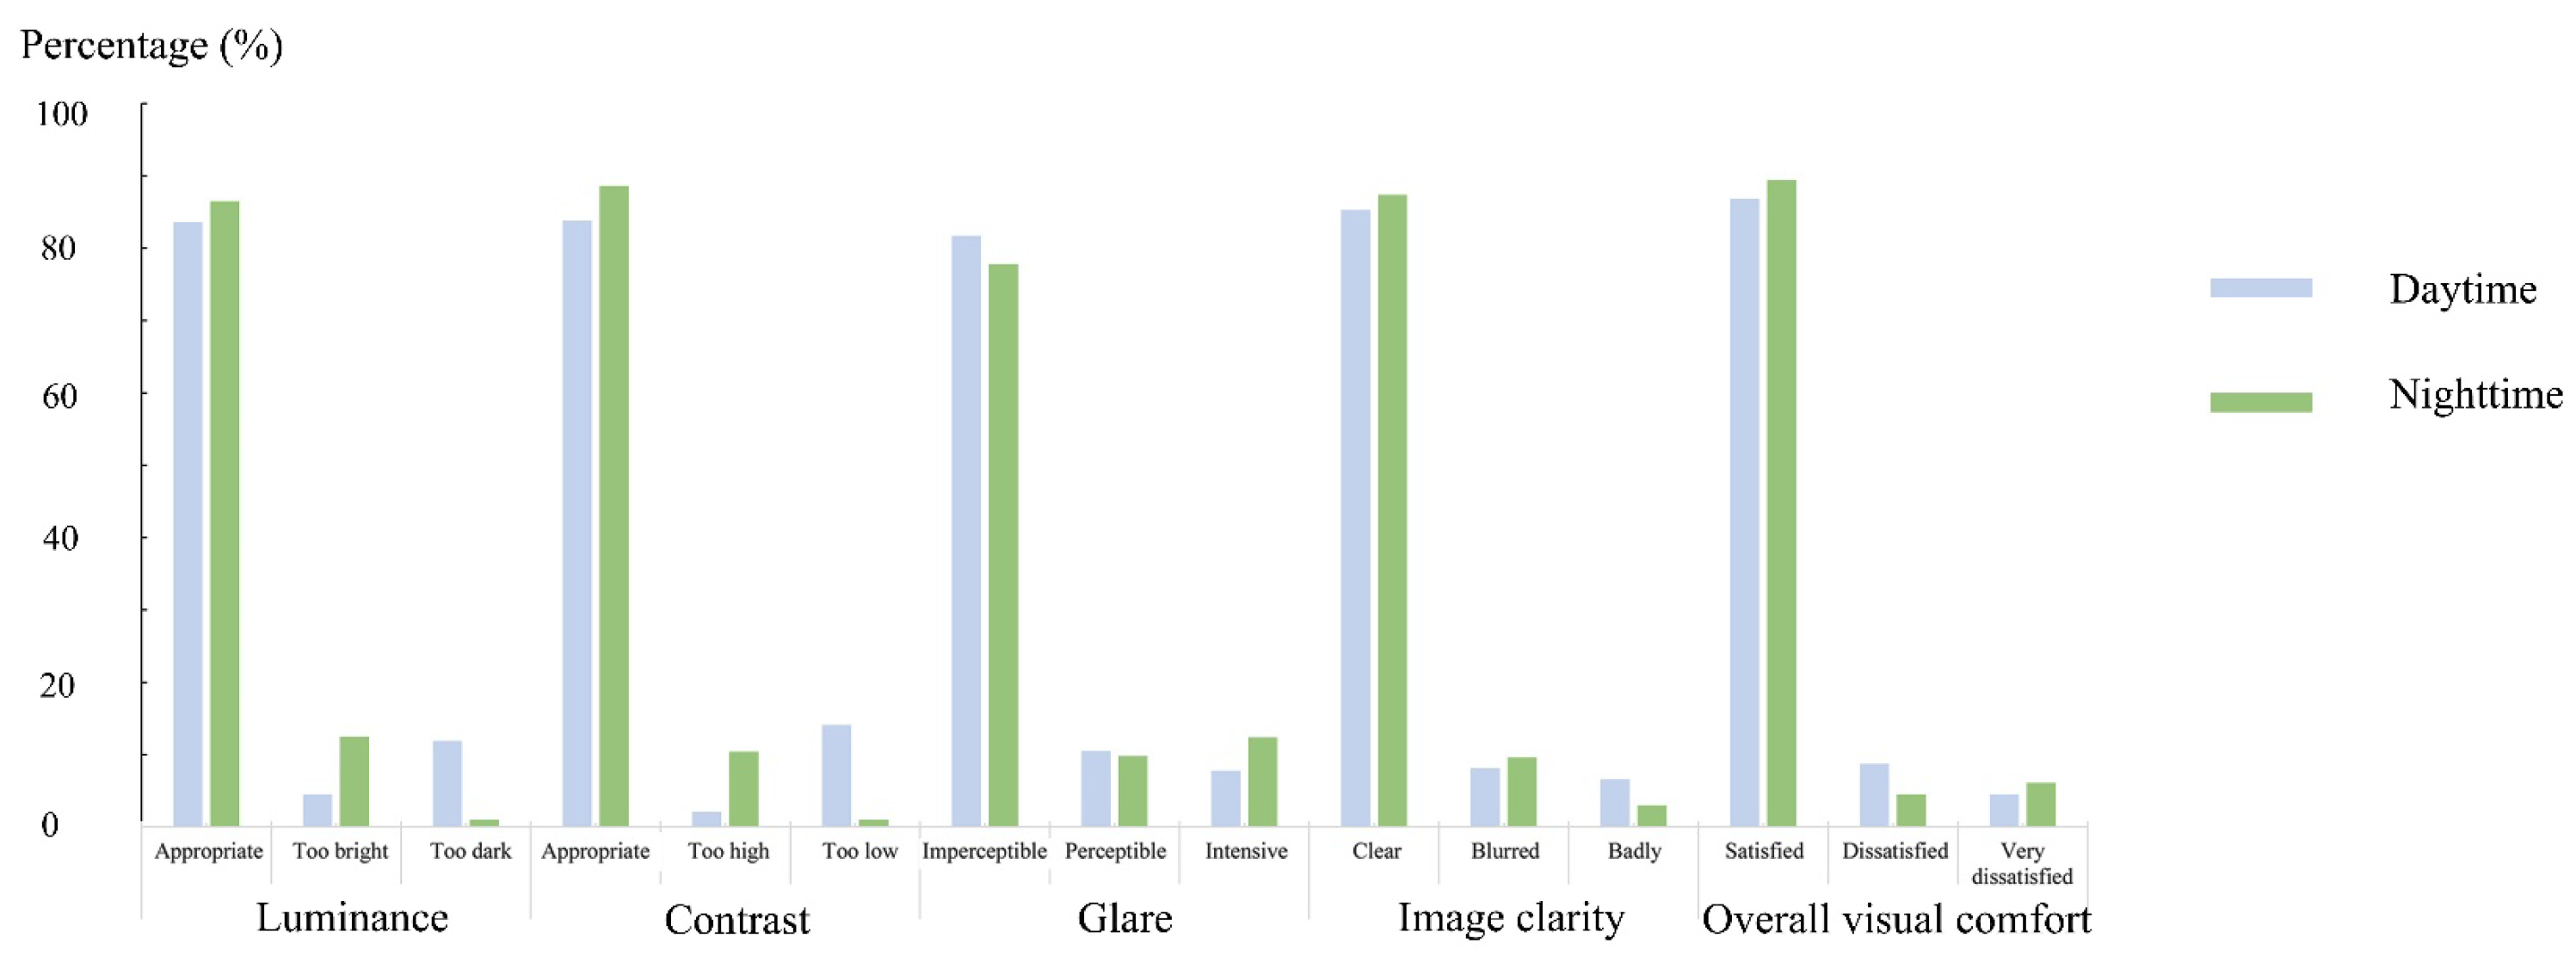
4.2. Subjective Evaluation Results

From the perspective of visual safety, adult viewers mostly took photos and short videos as the main interactive means of spreading the immersive art, where the image became the background of their filming rather than the object of their gaze. As a result, most adult viewers did not experience significant discomfort from the high-brightness, glare-laden images, whereas children were happy to walk back and forth, play, and linger in “Wormhole” and they stared at the images directly for a longer time. It was observed that when high-brightness images appeared, children’s eyes would automatically avoid the glare rather than gazing at the images for a long time due to the self-protection mechanisms of the human eye. Nevertheless, providing goggles to shield the glare for viewers who stay in the “Wormhole” for a long time is a safer and more reliable option.

4.3. On-Site Evaluation Results

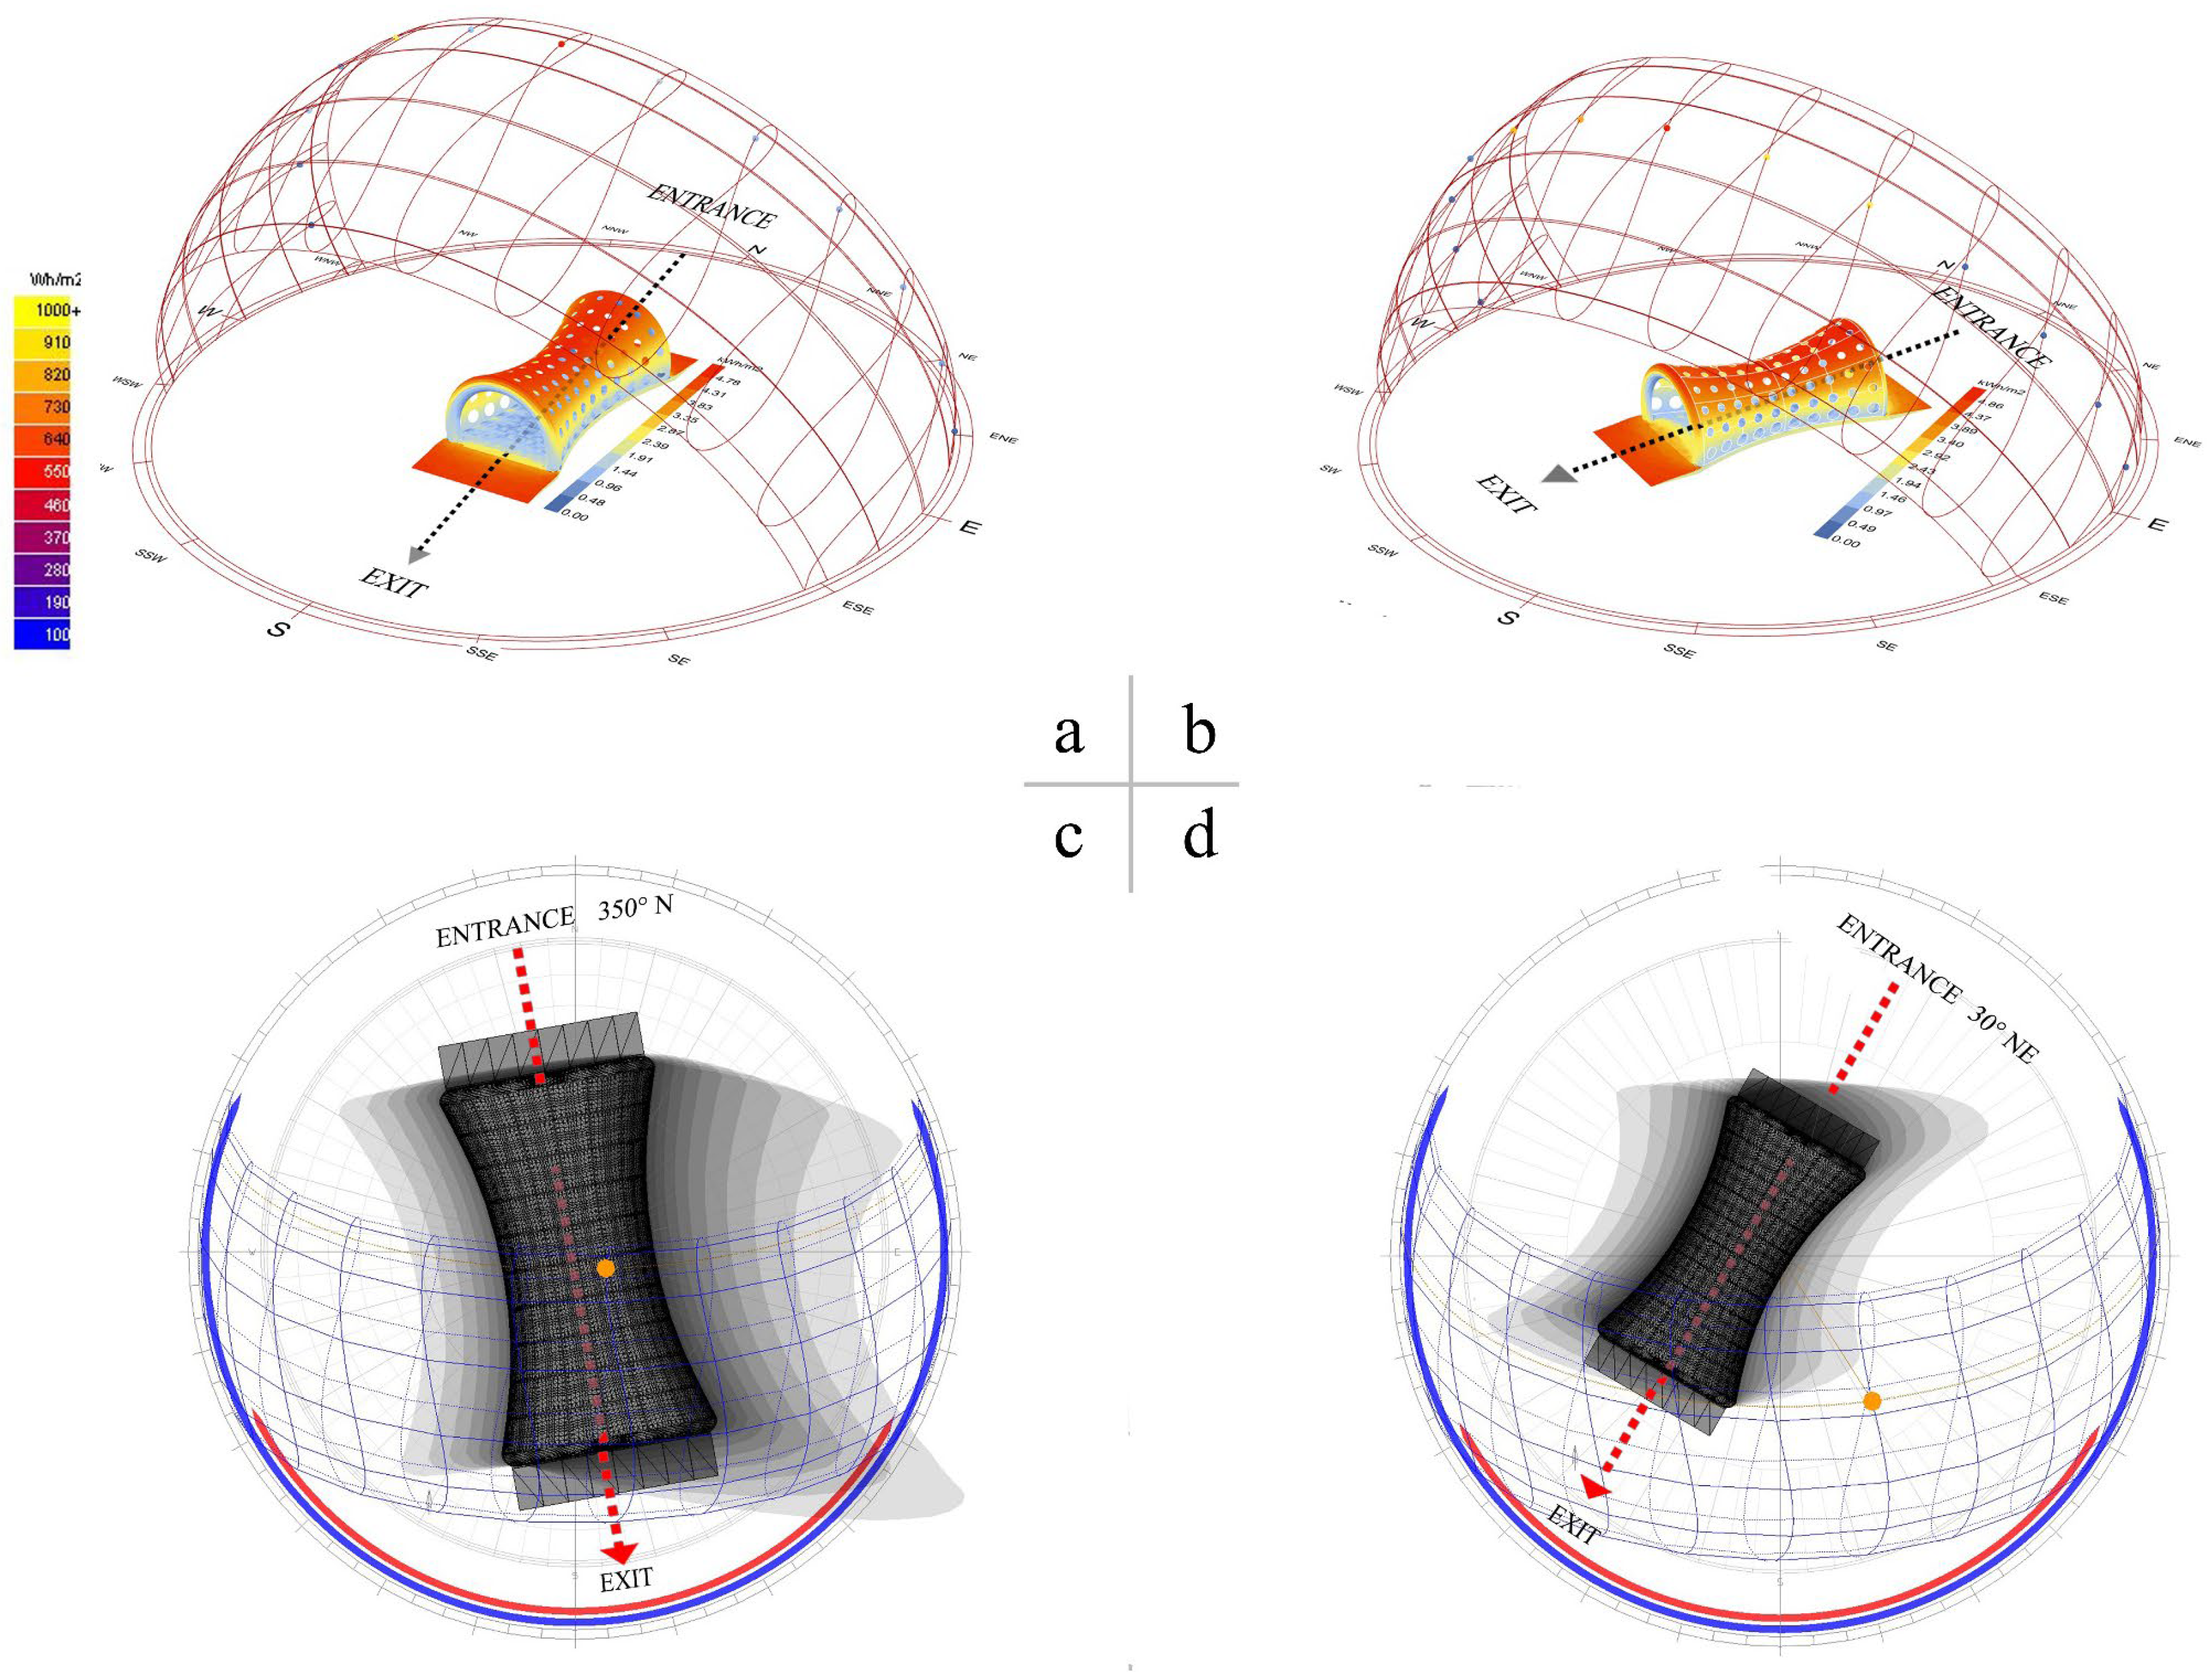
  • The natural light control design strategy of the installation is generally feasible. Because of the difference in the solar altitude angle and the orientation of the exhibition site, too much direct sunlight entered the device during some hours of the Chongqing exhibition, which interfered with the image and made the image presentation less clear than during the Shenzhen exhibition. However, combining the on-site experience, photo comparison, and the field data of the Chongqing exhibition, we can roughly assume that the natural light control design of “Wormhole” is basically in line with the light control requirements of the Shenzhen exhibition;
  • The settings of day and night white screen luminance in the installation are generally reasonable. Low contrast in some daytime hours does not originate from the white screen luminance or the screen luminance being too low but from the background lighting consisting of natural light being too strong;
  • The ventilation and heat dissipation measures of the installation are practically feasible. A 38% surface perforation rate + 30 cm heat dissipation cavity treatment was suitable for both the Shenzhen exhibition and the Chongqing exhibition, where the surface heat gain was higher (extreme weather is not under consideration here).
In terms of the recommended maximum luminance limitations for the screen inside the device during the day and at night: on bright backgrounds during the day, the maximum limit of the inner screen luminance can be 1000 cd/m2 without further increase, whereas the maximum limitation at night can be significantly reduced and controlled within 200 cd/m2.

5. Discussion

5.1. The Necessity of High Contrast and Strong Luminance Gradient in the AINMPAI Light Environment

One of the revolutions triggered by Internet technology is grassroots media empowerment. The subject of communication has evolved from elitism to popularization. Specifically, in the field of image production and communication, this evolution is characterized by the fact that anyone with a cell phone can produce images freely and in line with their values that can be distributed instantaneously on a large scale through the virtual space on the Internet [56]; accordingly, viewers can obtain a great sense of participation, identity, and satisfaction [57]. In such a context, the pursuit for simple, direct, shocking, and instantaneous communication effects has, to a certain extent, dissolved the need to probe for the content, depth, and meaning of the works. Viewers are more concerned about attractive images. Although low brightness and low contrast images are more visually comfortable, they are not good photography subjects due to the lack of visual tension.
In terms of immersion and media communication, the results of the post-construction evaluation and interviews further demonstrate that high tension and dramatic effects need to be based on high contrast and strong luminance gradients. From the evaluation results, the audience was satisfied with the design of the lighting environment of “Wormhole”. Unlike the method of viewing works on the “long-term gaze” shelf in art galleries, the audience’s experience of light installations is phased and transient. Therefore, considering the self-protection mechanism of the human eye and based on the principle of artistic effect and communication priority, it is suggested that the brightness of a few pictures in the immersive new media device in the daytime can be allowed to reach the upper limit of the E4 area in CIE 150: 2017 [48] and CIE234: 2019, that is 1000 cd/m2; however, the frequency and duration need to be controlled.

5.2. The Effects of Observation Position and Background Luminance on Psychophysical Quantity and Perception of True Brightness

As an art form that has only emerged in recent years, the research on the comfort and safety of architecturalized immersive new media public art installation (AINMPAI) light environments has yet to be completed. As mentioned above, the only lighting design standards available for reference are outdoor night signs, LED advertising screens, LED media wall luminance limit standards, etc. [25,26,46,47]. However, even in evaluating the glare and comfort of night outdoor advertising screens or LED media walls, these standards differ from observers’ subjective feelings [21,24]. Due to the diversity of observation points, it is difficult to cover the glare felt by observers in multiple directions. Therefore, researchers have been improving and revising the evaluation and measurement methods [58]. For example, Feng and Hao [24] believe that the average luminance and luminance contrast do not accurately represent the real perceptions of the human eye in the actual scene. He proposed that the evaluation method based on brightness [59] could more accurately describe the real feelings of the human eye on the vertical scene of non-uniform luminous media. Ma et al. [21] proposed a method to measure the average luminance value for the dynamic pictures of LED media screens. By testing multiple pictures, the average luminance value of the brightest area in the brightest picture is taken as the average luminance value of the screen surface, and each test area should contain at least 16 pixels. CIE and other international organizations also continuously optimize interference light measurement and evaluation methods, such as outdoor LED advertising screens and LED media walls at night [60].
Compared with the outdoor LED screen and LED video wall, the light environment of the AINMPAI is more complex: the artificial light in the daytime superimposes the dynamically changing natural light, the observer has a close viewing distance, the angle of view changes considerably, the LED screen shape is more diverse and complex, and the appropriate luminance difference between the daytime and nighttime screens is significant. All these factors mean that the measurement and evaluation of the AINMPAI light environment cannot simply apply the existing standards.
From the experimental results of this paper, the overall average luminance index of the screen used in the five standards listed in Table 1 is only partially applicable to the evaluation of the light environment of the AINMPAI. According to the inverse distance square law [50], when viewing the screen, the vertical eye illumination is inversely proportional to the viewing distance. The illuminance of the eye position is also positively correlated with the proportion of luminous objects in the observer’s field of vision [61]. Therefore, if only the illumination of the eye position is considered, the screen luminance should be reduced when viewing closely. However, in part of the day, strong natural light increases the luminance of the interior screen background and dramatically reduces the picture’s contrast. Suppose the picture’s luminance is reduced only by the illumination of the eye position. In that case, it will reduce the clarity of the picture, weaken the visual impact, and affect the artistic expression of the work. In addition, the same target luminance has different psychophysical quantities under different luminance backgrounds. According to Stevens’ law [62], the psychophysical magnitude ψ is a power function of the luminance L.
ψ = k ( L L 0 ) β
where ψ is the psychophysical magnitude perceived by the observer from the luminance stimulus L, provided under given viewing conditions, k and β are constants depending on viewing conditions, and L 0 is the threshold value.
When the ambient background luminance increases, the value of k decreases and ψ increases slightly, whereas the target threshold L 0 becomes very large. According to this principle, the screen luminance limit should not be reduced in the daytime. At night, there is no natural light interference, the background luminance is extremely low, and the picture’s contrast is increased. At this time, the distance factor and Stevens’ law should be fully considered and the screen luminance limit should be reduced based on the existing standards to improve the visual comfort of visitors while ensuring the artistic effect [63].

5.3. The Effect of Positive Spatial Impressions Brought by Geometric Light Spots on Improving Glare Tolerance

In addition, the improvement in the sense of pleasure and visual interest caused by the presence of natural light in the AINMPAI affecting the glare tolerance of visitors may, from another perspective, explain why the subjective satisfaction of subjects is still high under the conditions of high luminance background and noticeable glare.
Chamiothori et al. used virtual reality technology to study the impact of building facade geometry and daylight mode on people’s spatial impressions (sense of pleasure and visual interest) and physiological responses (skin conductance, heart rate, and heart rate variability) [64]. They also studied the impact of sky type, spatial environment, and latitude on participants’ responses [65]. The results show that the geometric solar spot generated by irregular windows and sunshade patterns can bring users a more positive spatial impression, enhance their sense of pleasure and visual interest [64,66], and even affect their physiological response, such as heart rate [64]. Among them, medium-high complexity patterns can better enhance visual interest and positively impact the subjective perception of spatial luminance [65]. In this paper, the skin of the “Wormhole” is an irregular opening, similar to the medium-high complexity irregular geometric pattern in the experiments of Chamilothori and others.
Regarding the correlation between the daylight opening size and the glare evaluation index, Boubekri et al. conducted a subjective evaluation of the glare generated by four windows with window–wall ratios of 10%, 20%, 40%, and 60% [67]. They compared the evaluation results with the values calculated by the glare formula. The results show that the calculated glare value for the four windows exceeded the glare tolerance zone. With the full exposure of the window to sunlight radiation and the very bright sky, the subjective evaluation value of glare only exceeds the glare tolerance zone when the window–wall ratio is between 40% and 55%. When the window–wall ratio is greater than 60%, the subjective evaluation value of glare will decrease. In other words, the user’s subjective evaluation value for glare is far lower than the calculated value using the glare formula. Hopkinson [68] and Lam W M C [69] think that visual discomfort and high gloss levels in the presence of sunlight may conflict with the cheerful and positive psychological effects of sunlight. However, these effects could offset, to a degree, glare discomfort. Boubekri also pointed out that the possible checking and simple effects caused by the presence of sunlight could also have increased glare tolerance. The glare formula is more suitable for glare calculation in an artificial light environment than in a natural light environment [67]. The “window-wall ratio” of the “Wormhole” is 38%, which explains why the audience’s subjective evaluation of glare in the “insight” light environment is within the tolerable range.
Through a comparison with the experimental results of the above documents, we believe that for “architectural” AINMPAIs, such as “Wormhole”, natural light is an essential footnote to its “localization” characteristic. Natural light penetrates the irregular openings on the device’s surface to create the background for the immersive picture and give the audience a richer space experience. Due to the excellent tolerance of the human eye, the sense of pleasure brought by sunlight may significantly enhance the audience’s tolerance to glare. Of course, there still needs to be more in-depth studies of the audience’s glare tolerance changes after the superposition of dynamic pictures and natural light. In the future, more rigorous and detailed research is needed to explore the mechanisms. The research of this paper is only the beginning.

5.4. Improvement Measures

  • Improvement measures. If the installation is to be redesigned for the Chongqing exhibition, the form should be further adjusted to block direct sunlight more effectively and improve the luminance contrast. The perforation rate and the diameter of the holes at the top can be reduced, especially at the entrance and the exit of the “Wormhole”, to reduce the background light entering the area and enhance the clarity of the visual gaze at the center of the picture. The perforation rate in the lower part of the installation should be increased to some extent or the diameter of the holes should be increased to make up for the negative impact on heat dissipation caused by the reduced perforation rate at the top;
  • Limitations in measurement methods. Since this installation was removed after the exhibition tour, the actual measurement and verification of the lighting, thermal, and acoustic environments on typical weather days throughout the year at the original site (Shenzhen) could not be carried out, which is a significant pity for this paper. In addition, due to the limited field test conditions, the intelligent control system failed to select three typical brightness pictures, namely bright, medium, and dark, to measure and calculate the internal screen light environment parameters under the static picture or to divide the brightest area under the dynamic picture state and measure the parameters [21]. Hence, the conclusions needed to be more rigorous. Given this, this paper does not provide a more in-depth description of the data obtained. It only provides a rough parameter range for designing such installations’ lighting and thermal environment;
  • Shortcomings in evaluation methods. Due to the limitations of time and experimental cost, this paper only completed the physical measurement, standard comparison, and subjective evaluation of glare and comfort of the “Wormhole” light environment and we have not carried out a quantitative analysis of the relationship between the psychological, physical quantity of the observer and the appropriate luminance under different background luminance and different colors of the picture or explored its threshold range. This work needs a series of experiments and more in-depth research to support it.

6. Conclusions

By January 2021, the number of social media users worldwide has reached 4.2 billion, an annual increase of more than 13%. The number of social media users is equivalent to more than 53% of the world’s total population; China currently has 931 million social media users [70]. Social media has significantly changed the way public art is presented and disseminated. The immersive experience provided by an AINMPAI satisfies people’s instinctive tendency for novel and complex feelings and experiences in the form of fresh content. It satisfies the audience’s instinctive tendency for novel and complex emotions and experiences in the form of new content [71,72]. The audience uses social media as a powerful tool to enhance self-esteem [73,74,75,76]; they display pictures and short videos of the art scene to obtain self-satisfaction and praise from others [76]. The AINMPAI has also become a mobile “temporary city icon” [77] that can be used as a tool to improve the city’s image and make the city space attractive in the context of intensified urban competition.
The new way of viewing and communicating puts forward higher requirements for designing an AINMPAI’s light environment. The designer should take into account the needs of the audience for taking photographs and viewing at the same time. Providing a high-quality background for taking photographs and good visual comfort is also essential.
Although direct sunlight is often regarded as the source of visual discomfort, more and more evidence shows that the sunlight mode is not only accepted but also expected by users [78,79]. The pleasure brought by sunlight and the improvement in the audience’s overall luminance and glare tolerance in the AINMPAI’s light environment is very worthy of study.
From the perspective of a measurement method, the measurement partition of the immersion LED screen should be further refined. According to the specific shape of the LED screen, the measuring area should be divided to measure and evaluate each part. This paper provides a partition and measurement method for the AINMPAI’s specially shaped curved screen, but the spatial combination and shape of the immersion LED screen are vibrant. What principles should be followed to partition and measure the layout of the points still needs more experimental data and research.
From the perspective of evaluation methods, under the immersive viewing mode, the particularity of the audience’s visual gaze behavior, as well as the adaptability of the human eye to brightness [80] and good tolerance [67,81] under the psychological anchoring effect [82], means that evaluating the AINMPAI’s light environment has an additional evaluation dimension compared with outdoor LED screens and LED media: the audience’s behavior mode and visual psychology will directly affect the evaluation of the physical evaluation index of the light environment [83,84]. The evaluations go beyond our previous experience in light environment assessment has become a new challenge, and the lack of experimental data makes this work progress slowly. For the evaluation of an AINMPAI’s light environment, it is not enough to only improve the physical evaluation method. It is also necessary to explore how behavioral psychology and visual psychology affect the physical indicators of the light environment, explore its mechanisms, and establish a corresponding comprehensive evaluation method.
Today, when the integration of contemporary art and technology has become a trend, art + technology should not merely remain at the level of “seeking technological novelty” but should, as curator Zhenqing Gu said in the Future Science Exhibition, “let scientists and artists cross the boundaries of their fields and come together on the underlying logic of creativity and aesthetic roots. Together, they can stimulate and collaborate and create a catalyst effect in cross-border discussions, thus giving rise to intellectual experiments and cognitive upgrades, generating a fusion effect in the higher dimension of knowledge production” [85].
In the context of new media art, the intricate interplay of disciplines poses constant learning challenges to the artists, as it requires a continuous acquisition and reconfiguration of knowledge [86]. Rapidly iterating and comprehensive social needs have made it difficult for traditional disciplines such as art, architecture, and communication to confront the complex cognitive and operational object of “public art in urban space” on their own. The integration of disciplinary resources and interdisciplinary cooperation has made “architectonics” a vital part of the composition of contemporary public art [87], and various new media installations with architectural features have gradually become a new form of public art. The subjective and objective evaluations of such works after their completion, in-depth exploration of the underlying logic of visual culture and consumer society, studies about the visual physiological and psychological mechanisms of how viewers filter and actively capture the visual information generated by these works, and exploration, as well as utilization of the adaptation of the human eye to light intensity and self-protection mechanisms, reflect the unique depth and breadth of architecture’s involvement in urban public art. Only through a comprehensive and multi-dimensional exploration can the cooperation between artists, architects, and technical experts generate outcomes that are greater than the sum of the parts.
This paper is not a paper on architectural lighting in the traditional sense. Although limited by conditions, this paper has only completed the partial improvement of the measurement method of the AINMPAI light environment and the preliminary suggestions for the screen luminance limit. However, through the work of this paper, we hope to arouse researchers’ attention to the AINMPAI light environment and promote the reference of multidisciplinary theories, such as visual optics, behavioral science, psychology, and communication science, and the comprehensive application of interdisciplinary research methods to meet the audience’s demand for the artistic appeal of the AINMPAI light environment according to the requirements of visitor’s health, safety, communication, and other aspects. The study provides a reference for the future development of AINMPAI lighting environment safety standards.

7. Patents

Yan, Y. Utility model patent: A kind of immersive media player. ZL 2018 2 1206428.1. China National Intellectual Property Administration. 25 January 2019.
Yan, Y.; Zhong, B. Design patent: Immersive media player. ZL 2018 3 0411751.1. China National Intellectual Property Administration. 9 August 2019.

Author Contributions

Conceptualization, Y.Y. and B.Z. (Biao Zhong); data curation, B.Z. (Bohan Zhang); formal analysis, B.Z. (Bohan Zhang); funding acquisition, Y.Y.; investigation, Y.Z. (Yi Zhong); methodology, Y.Y. and B.Z. (Bohan Zhang); project administration, Y.Y. and B.Z. (Biao Zhong); resources, S.N., Y.Z. (Yue Zeng), X.C. and Z.W.; supervision, Y.Y.; validation, Y.Y. and Y.Z. (Yi Zhong); visualization, Y.Z. (Yi Zhong), Y.Z. (Yue Zeng), S.N., X.C. and B.Z. (Bohan Zhang); writing—original draft, Y.Y., Y.Z. (Yi Zhong), B.Z. (Bohan Zhang) and Z.W.; writing—review and editing, Y.Y. and B.Z. (Bohan Zhang). All authors have read and agreed to the published version of the manuscript.

Funding

This research was funded by the Program for Innovation Team Building at Institutions of Higher Education in Chongqing, grant number CXTDX201601005.

Institutional Review Board Statement

Not applicable.

Informed Consent Statement

Not applicable.

Data Availability Statement

Not applicable.

Acknowledgments

Through the Wormhole” was supported by Shenzhen Golden Lighting Science & Technology Co., Ltd. (Shenzhen, China) and Shenzhen Minghao Science & Technology Co., Ltd. (Shenzhen, China). Wei Liu, Wei Lee, and Tao Hu participated in the experiment.

Conflicts of Interest

The authors declare no conflict of interest.

References

  1. Memarovic, N.; Gehring, S.; Fischer, P.T. ELSI Model: Bridging User Engagement around Interactive Public Displays and Media Facades in Urban Spaces. J. Urban Technol. 2015, 22, 113–131. [Google Scholar] [CrossRef]
  2. Lee, S. A Study on the Trends for Expression in Korean Contemporary Architectural Facade Design: Focusing on Large Buildings in the City Center. Buildings 2021, 11, 274. [Google Scholar] [CrossRef]
  3. Moloney, J.; Globa, A.; Wang, R.; Khoo, C.K.; Tokede, O. Hybrid environmental-media facades: Rationale and feasibility. Archit. Eng. Des. Manag. 2019, 15, 313–333. [Google Scholar] [CrossRef]
  4. Lv, S. Interpretation of Art Text on the Dimension of Media. J. Art Commun. 2021, 4, 35–42. [Google Scholar] [CrossRef]
  5. Kim, J. Analysis of Preference Survey for the Media Facade Cases according to the Sensibility Keywords. Korean Inst. Inter. Des. J. 2013, 22, 58–67. [Google Scholar] [CrossRef]
  6. Augmented Structures. Augmented Structures V1.0/Acoustic Formations. Available online: http://augmentedstructures.com (accessed on 16 January 2023).
  7. Cha, M.-H. A Study on Application Examples of Media Facade by Technology Case and Content Type. J. Digit. Art Eng. Multimed. 2018, 5, 175–184. [Google Scholar] [CrossRef]
  8. Gawad, I.O.; Bahgat, H.; Mohamed, R.O. Sustainable potentials and Limitations of Using Media Façades in Egypt. Acad. Res. Community Publ. 2019, 3, 99–110. [Google Scholar] [CrossRef]
  9. Leung, I.S. Artificial Landscape: In search of publicness through urban spectacle in Hong Kong. Archit. MPS 2021, 20. [Google Scholar] [CrossRef]
  10. Mcarthur, I. Mapping Chongqing’s Urban Media Ecology. In Proceedings of the 4th Media Architecture Biennale Conference, Beijing, China, 13 November 2018; pp. 1–10. [Google Scholar]
  11. Yan, Y.; Zhong, Y.; Zhong, B. From “Art on the Shelf” to Urban Public Space: The Immersive Light Art Installation through the Wornhole. New Archit. 2021, 199, 150–153. [Google Scholar] [CrossRef]
  12. Xie, J. The Construction of Spectacle in Urban Images: A Case of Shanghai Images under Media Construction. Southeast Commun. 2016, 141, 83–85. [Google Scholar] [CrossRef]
  13. Yan, Y.; Dong, X.; Xie, F. From Wanderer to media viewer: Ways of sightseeing in city. City Plan. Rev. 2014, 38, 79–84. [Google Scholar] [CrossRef]
  14. Li, Z. Spectacle and Popularization: Exploring the Creation Process of City Image Propaganda Film. China Telev. 2019, 399, 67–71. [Google Scholar]
  15. Zhang, Y.; Guo, H. Virtual and Reality: Architectural Expression in Science Fiction Film Images. New Archit. 2020, 190, 51–54. [Google Scholar] [CrossRef]
  16. Debord, G. The Society of the Spectacle; Zone Books: New York, NY, USA, 1994; pp. 6–7. ISBN 978-1-7369-6180-3. [Google Scholar]
  17. Lightingchina. “To focus on projecting the projection”—Reported by Dou Linping, Secretary General of China Illuminating Engineering Society. Available online: https://www.lightingchina.com.cn/news/55231.html (accessed on 19 January 2023).
  18. Shen, R. The Trends of Urban Nightscape Lighting Planning and Design in China. China Illum. Eng. J. 2019, 13, 31. [Google Scholar] [CrossRef]
  19. Artron. Artist Interviews—Zhong Biao and Yan Yonghong. Available online: https://news.artron.net/20180705/n1010536.html (accessed on 18 January 2023).
  20. Zhou, S. Urban Fascinance and Media Specter: The Urgent Task of Visual Culture Studies. Archit. Cult. 2011, 82, 12–13. [Google Scholar]
  21. Ma, Y.; Li, T.; Xu, H. Research on the Obtrusive Light Measurement Method about Advertisement Sign, LED Panels and Media Wall. China Illum. Eng. J. 2020, 31, 15–19. [Google Scholar] [CrossRef]
  22. Chen, K. Road traffic lighting and light pollution prevention. Light Light. 2005, 29, 22–24. [Google Scholar] [CrossRef]
  23. Katabaro, J.M.; Yan, Y.; Hu, T.; Yu, Q.; Cheng, X. A review of the effects of artificial light at night in urban areas on the ecosystem level and the remedial measures. Front. Public Health 2022, 10, 969945. [Google Scholar] [CrossRef]
  24. Feng, K.; Hao, L. Evaluation and Optimization of Luminance Related Indexes in Media Facade Lighting. China Illum. Eng. J. 2021, 32, 87–97. [Google Scholar] [CrossRef]
  25. GB/T 35626-2017General Administration of Quality Supervision, Inspection and Quarantine of the People’s Republic of China, Standardization Administration of China. Specification for Limitation to Obtrusive Light of Outdoor Lighting. Standards Press of China: Beijing, China, 2017; p. 5. Available online: https://openstd.samr.gov.cn/bzgk/gb/newGbInfo?hcno=276CE8E91E6B9964B8C4BBBF30CBF734 (accessed on 18 January 2023).
  26. JGJ/T 163-2008; Ministry of Housing and Urban-Rural Construction of the People’s Republic of China. Code for Lighting Design of Urban Nightscape. China Architecture & Building Press: Beijing, China, 2008; p. 18. Available online: http://www.ldhyw.com/zcfg/csyjzmsjgf.asp (accessed on 23 January 2023).
  27. Yan, Y.; Hu, Z. Lighting Environment Design of Chongqing Zhaomu Mountain Forest Park from the Ecological Perspective. Chin. Landsc. Archit. 2019, 35, 139–144. [Google Scholar] [CrossRef]
  28. Mitrache, G. Architecture, Art, Public Space. Procedia—Soc. Behav. Sci. 2012, 51, 562–566. [Google Scholar] [CrossRef]
  29. Chongqing Committee of Urban & Rural Construction. Guidelines for the Design of Night Lighting Construction on the Two Rivers and Four Riversides in the Central Urban Area of Chongqing (Tryout); ChongQing Architectural Design Institute, Chongqing University: Chongqing, China, 2008; p. 14. Available online: http://zfcxjw.cq.gov.cn/zwxx_166/gsgg/202112/t20211207_10096557.html (accessed on 22 January 2023).
  30. Quaranta, D. Beyond New Media Art; LINK Editions: Brescia, Italy, 2013; pp. 35–37. ISBN 1291861572. [Google Scholar]
  31. Paul, C. New media in the white cube and beyond: Curatorial models for digital art. Leonardo Rev. Q. 2008, 1, 33. [Google Scholar] [CrossRef]
  32. Csikszentmihalyi, M.; LeFevre, J. Optimal experience in work and leisure. J. Personal. Soc. Psychol. 1989, 56, 815–822. [Google Scholar] [CrossRef]
  33. Csikszentmihalyi, M.; Csikzentmihaly, M. Flow: The Psychology of Optimal Experience; Harper & Row: New York, NY, USA, 1990; Volume 1990, p. 1. [Google Scholar]
  34. Al-Ofisan, G.; Al-Wabil, A. Human Factors in the Design of Interactive Multimedia Art Installations (IMAIs). Procedia Manuf. 2015, 3, 4572–4577. [Google Scholar] [CrossRef]
  35. Zhang, J. Multiple fusion: New Media Turn of Public Art. J. Nanjing Arts Inst. Fine Arts Des. 2017, 169, 176–180. [Google Scholar] [CrossRef]
  36. Ouyang, S. Participatory Art: A Kind of Contemporary Art or A Way of Socio-cultural Practice. Public Art 2021, 72, 6–13. [Google Scholar]
  37. Zhang, P. A social intervention: The spatial turn of public art during COVID-19. Forum Arts 2021, 120, 17–20+24. [Google Scholar] [CrossRef]
  38. Tan, X. The Practice of Public Art in the Context of Contemporary Art. Contemp. Artist. 2019, 119, 16–19. [Google Scholar]
  39. Zhao, Z. A Guide to Contemporary Public Art; The Commercial Press: Beijing, China, 2015; pp. 1–5. ISBN 978-7-100-11472-1. [Google Scholar]
  40. Benjamin, A.E.; Brouwer, J.; Mulder, A.; Nigten, A. ARt & D: Research and Development in Art; NAi Publishers: Rotterdam, The Netherlands, 2005; pp. 5–9. ISBN 978-9-0566-2389-0. [Google Scholar]
  41. Wang, H. Pixelated Art in Public Space. Public Art 2019, 88, 71–73. [Google Scholar]
  42. Jiang, C. On the Disciplinary Boundary Between Public Art and Architecture: A Case Study of Beijing “Dashilar Project”. Public Art 2020, 65, 40–47. [Google Scholar]
  43. Yingzi, T. 8-meter ‘Wormhole’ Appears at 2018 Shenzhen Art Biennale. Available online: https://www.chinadaily.com.cn/a/201807/11/WS5b45f9cda310796df4df5d93.html (accessed on 16 January 2023).
  44. GB/T 3840-1991The State Bureau of Quality and Technical Supervision, State Administration of technology supervision, State Environmental Protection Administration Standardization Administration of China. Technical Methods for Making Local Emission Standards of Air Pollutants. Standards Press of China: Beijing, China, 1991; p. 14. Available online: https://www.mee.gov.cn/ywgz/fgbz/bz/bzwb/other/qt/199206/t19920601_67580.shtml (accessed on 28 January 2023).
  45. Zhang, T.; Stackhouse, P.W.; Macpherson, B.; Mikovitz, J.C. A solar azimuth formula that renders circumstantial treatment unnecessary without compromising mathematical rigor: Mathematical setup, application and extension of a formula based on the subsolar point and atan2 function. Renew. Energy 2021, 172, 1333–1340. [Google Scholar] [CrossRef]
  46. CIE 234:2019; A Guide to Urban Lighting Masterplanning. Commission Internationale de l´Eclairage: Vienna, Austria, 2019; p. 43. Available online: https://cie.co.at/publications/guide-urban-lighting-masterplanning (accessed on 28 January 2023).
  47. GB/T 36101-2018General Administration of Quality Supervision, Inspection and Quarantine of the People’s Republic of China, Standardization Administration of China. Evaluation Requirements for Obtrusive Light of Led Panels. Standards Press of China: Beijing, China, 2018; p. 2. Available online: https://openstd.samr.gov.cn/bzgk/gb/newGbInfo?hcno=BF6AE6ADB8D0092C8D09E8E2C755F08D (accessed on 26 January 2023).
  48. CIE 150:2017; Guide on the Limitation of the Effects of Obtrusive Light from Outdoor Lighting Installations, 2nd ed. Commission Internationale de l´Eclairage: Vienna, Austria, 2019; p. 11. Available online: https://cie.co.at/publications/guide-limitation-effects-obtrusive-light-outdoor-lighting-installations-2nd-edition (accessed on 30 January 2023).
  49. GB/T 38439-2019State Administration for Market Regulation, Standardization Administration of China. Measuring Specifications Form Ethods to Obtrusive Light of Outdoor Lighting. Standards Press of China: Beijing, China, 2019; p. 5. Available online: https://openstd.samr.gov.cn/bzgk/gb/newGbInfo?hcno=2B5CD4E544CD9EB430E9A34B23557E87 (accessed on 28 January 2023).
  50. Yang, L. Architecture and Urban; China Architecture & Building Press: Beijing, China, 2021; p. 231. ISBN 978-7-1122-5665-5. [Google Scholar]
  51. Dilaura, D.L.; Houser, K.W. The Lighting Handbook: Reference and Application (Illuminating Engineering Society of North America), 10th ed.; Illuminating Engineering: New York, NY, USA, 2011; ISBN 978-0-8799-5241-9. [Google Scholar]
  52. Boyce, P.; Raynham, P. The SLL Lighting Handbook, 1st ed.; Chartered Institution of Building Services Engineers: London, UK, 2009; ISBN 978-1-906846-02-2. [Google Scholar]
  53. CIE 094:1993; Guide for Floodlighting. Commission Internationale de l’Eclairage: Vienna, Austria, 2019; p. 24. Available online: https://cie.co.at/publications/guide-floodlighting (accessed on 30 January 2023).
  54. Osterhaus, W. Design guidelines for glare-free daylit work environments. In Proceedings of the 11th European Conference on Lighting-Lux Europe, Istanbul, Turkey, 9–11 September 2009. [Google Scholar]
  55. Rea, M.S. Proceedings of the 11th European Conference on Lighting-Lux Europe. In The IESNA Lighting Handbook: Reference & Application, 9th ed.; Illuminating Engineering Society of North America: New York, NY, USA, 2003. [Google Scholar]
  56. Wang, C.; Liu, R. Generation, Genre and Meaning of Internet Visual Spectacle. Mod. Commun. (J. Commun. Univ. China) 2018, 40, 86–91. [Google Scholar] [CrossRef]
  57. Yin, X. Context Construction of Immersive Short Video Communication. View Publ. 2020, 361, 74–76. [Google Scholar] [CrossRef]
  58. Yamin Garretón, J.A.; Colombo, E.M.; Pattini, A.E. A global evaluation of discomfort glare metrics in real office spaces with presence of direct sunlight. Energy Build. 2018, 166, 145–153. [Google Scholar] [CrossRef]
  59. Bodmann, H. Elements of photometry, brightness and visibility. Light. Res. Technol. 1992, 24, 29–42. [Google Scholar] [CrossRef]
  60. CIE. CIE Workshop on the Calculation and Measurement of Obtrusive Lighting. Available online: https://cie.co.at/news/cie-workshop-calculation-and-measurement-obtrusive-lighting (accessed on 20 January 2023).
  61. He, Y.; Li, Y.; Xing, L.; Qiu, Z.; Zhang, X. Influence of text luminance, text colour and background luminance of variable-message signs on legibility in urban areas at night. Light. Res. Technol. 2021, 53, 263–279. [Google Scholar] [CrossRef]
  62. Stevens, S.S. The surprising simplicity of sensory metrics. Am. Psychol. 1962, 17, 29. [Google Scholar] [CrossRef]
  63. Pigliautile, I.; Casaccia, S.; Morresi, N.; Arnesano, M.; Pisello, A.L.; Revel, G.M. Assessing occupants’ personal attributes in relation to human perception of environmental comfort: Measurement procedure and data analysis. Build. Environ. 2020, 177, 106901. [Google Scholar] [CrossRef]
  64. Chamilothori, K.; Chinazzo, G.; Rodrigues, J.; Dan-Glauser, E.; Wienold, J.; Andersen, M. Subjective and physiological responses to façade and sunlight pattern geometry in virtual reality. Build. Environ. 2019, 150, 144–155. [Google Scholar] [CrossRef]
  65. Chamilothori, K.; Wienold, J.; Moscoso, C.; Matusiak, B.; Andersen, M. Subjective and physiological responses towards daylit spaces with contemporary façade patterns in virtual reality: Influence of sky type, space function, and latitude. J. Environ. Psychol. 2022, 82, 101839. [Google Scholar] [CrossRef]
  66. Sawyer, A.; Niermann, M.; Groat, L.N. The use of environmental aesthetics in subjective evaluation of daylight quality in office buildings. In Proceedings of the IES Annual Conference, New York, NY, USA, 7–10 November 2015. [Google Scholar]
  67. Boubekri, M.; Boyer, L.L. Effect of window size and sunlight presence on glare. Light. Res. Technol. 1992, 24, 69–74. [Google Scholar] [CrossRef]
  68. Hopkinson, R. The psychophysics of sunlighting: Sunlighting in Buildings. In Proceedings of the CIE Intersessional Conference, Newcastle upon Tyne, UK, 5–9 April 1965; pp. 13–26. [Google Scholar]
  69. Lam, W.M.; Ripman, C.H. Perception and Lighting as Formgivers for Architecture; McGraw-Hill: New York, NY, USA, 1977; pp. 14–30. ISBN 978-0-0703-6094-5. [Google Scholar]
  70. KEMP, S. Digital Around the World in 2021. Available online: https://datareportal.com/reports/digital-2021-global-overview-report (accessed on 18 January 2023).
  71. Mikulas, W.L.; Vodanovich, S.J. The essence of boredom. Psychol. Rec. 1993, 43, 3–12. [Google Scholar] [CrossRef]
  72. Lu, L.H.; Liu, M.; Ge, B.C.; Bai, Z.J.; Liu, Z.Q. Adolescent Addiction to Short Video Applications in the Mobile Internet Era. Front. Psychol. 2022, 13, 13. [Google Scholar] [CrossRef]
  73. Widjajanta, B.; Senen, S.; Masharyono, M.; Lisnawati; Anggraeni, C. The impact of social media usage and self-esteem on conspicuous consumption: Instagram user of Hijabers Community Bandung member. Int. J. Ebusiness Egovernment Stud. 2018, 10, 1–13. [Google Scholar] [CrossRef]
  74. Steinfield, C.; Ellison, N.B.; Lampe, C. Social capital, self-esteem, and use of online social network sites: A longitudinal analysis. J. Appl. Dev. Psychol. 2008, 29, 434–445. [Google Scholar] [CrossRef]
  75. Gonzales, A.; Hancock, J. Mirror, Mirror on My Facebook Wall: Effects of Exposure to Facebook on Self-Esteem. Cyberpsychology Behav. Soc. Netw. 2010, 14, 79–83. [Google Scholar] [CrossRef]
  76. Burnasheva, R.; Suh, Y.G. The influence of social media usage, self-image congruity and self-esteem on conspicuous online consumption among millennials. Asia Pac. J. Market. Logist. 2021, 33, 1255–1269. [Google Scholar] [CrossRef]
  77. Guinard, P.; Margier, A. Art as a new urban norm: Between normalization of the City through art and normalization of art through the City in Montreal and Johannesburg. Cities 2018, 77, 13–20. [Google Scholar] [CrossRef]
  78. Leather, P.; Pyrgas, M.; Beale, D.; Lawrence, C. Windows in the workplace: Sunlight, view, and occupational stress. Environ. Behav. 1998, 30, 739–762. [Google Scholar] [CrossRef]
  79. Van Den Wymelenberg, K.; Inanici, M.; Johnson, P. The effect of luminance distribution patterns on occupant preference in a daylit office environment. Leukos 2010, 7, 103–122. [Google Scholar] [CrossRef]
  80. De Bakker, C.; Aarts, M.; Kort, H.; Rosemann, A. The feasibility of highly granular lighting control in open-plan offices: Exploring the comfort and energy saving potential. Build. Environ. 2018, 142, 427–438. [Google Scholar] [CrossRef]
  81. Despenic, M.; Chraibi, S.; Lashina, T.; Rosemann, A. Lighting preference profiles of users in an open office environment. Build. Environ. 2017, 116, 89–107. [Google Scholar] [CrossRef]
  82. Ran, R.; Li, C.; Ko, K.-C.; Yang, N.-T. State-dependent psychological anchors and momentum. Financ. Res. Lett. 2022, 46, 102436. [Google Scholar] [CrossRef]
  83. Gursoy, D.; McCleary, K.W.; Lepsito, L.R. Propensity to complain: Effects of personality and behavioral factors. J. Hosp. Tour. Res. 2007, 31, 358–386. [Google Scholar] [CrossRef]
  84. Papinutto, M.; Nembrini, J.; Lalanne, D. “Working in the dark?” investigation of physiological and psychological indices and prediction of back-lit screen users’ reactions to light dimming. Build. Environ. 2020, 186, 107356. [Google Scholar] [CrossRef]
  85. Lv, X. “Out of the Anthropocene” Future Science and Art Exhibition Press Briefing Held in Beijing. Available online: https://www.cet.com.cn/wzsy/ycxw/2983529.shtml (accessed on 16 January 2023).
  86. Anzures, F.A.S.; Marques, L. The LED Lamp metaphor: Knowledge and the creative process in new media art. Poetics 2022, 92, 101644. [Google Scholar] [CrossRef]
  87. Yang, X. Contemporary Public Art of Architecture; China Electric Power Press: Beijing, China, 2008; pp. 2–8. ISBN 978-7-5083-5457-6. [Google Scholar]
Figure 1.Wormhole” structure breakdown diagram [11].
Buildings 13 02122 g001
Figure 2. Collaboration between professions in the light environment design of “Wormhole”.
Buildings 13 02122 g002
Figure 3. Visitors passed through the installation at different exhibitions. (a) Photo of visitors taken at 15:00, 12 May 2018, in Shenzhen. (b) Photo of visitors taken at 15:00, 7 April 2019, in Chongqing.
Buildings 13 02122 g003
Figure 4.Wormhole” outer skin direct solar radiation intensities and shadow simulations. (a,b) The distribution of the “Wormhole” outer skin direct solar radiation intensities on 12 May 2018 in Shenzhen and 7 April 2019 in Chongqing. (c,d) The corresponding shadow simulations.
Buildings 13 02122 g004
Figure 5. Comparison diagram of thermal radiation simulation on the outer skin of the “Wormhole” in Shenzhen and Chongqing.
Buildings 13 02122 g005
Figure 6.Wormhole” measurement illustrations. (a,b) The relationship between the solar altitude angle and time on the day of evaluation. (c,d) The division of screen areas and the distribution of measuring points.
Buildings 13 02122 g006
Figure 7.Wormhole” Location Analysis.
Buildings 13 02122 g007
Figure 8. Temperature graph for inside and outside of the installation.
Buildings 13 02122 g008
Figure 9. Measurement data for average daytime luminance.
Buildings 13 02122 g009
Figure 10. Measurement data for zonal daytime luminance.
Buildings 13 02122 g010
Figure 11. Measurement data for partial daytime luminance at the entrance.
Buildings 13 02122 g011
Figure 12. Measurement data for partial daytime luminance at the middle section.
Buildings 13 02122 g012
Figure 13. Measurement data for partial daytime luminance at the exit.
Buildings 13 02122 g013
Figure 14. Histogram of visitor satisfaction.
Buildings 13 02122 g014
Figure 15. Histogram of preferred background brightness when taking photos.
Buildings 13 02122 g015
Table 1. Maximum permitted values of average surface luminance [25,26,46,47,48].
No.Standards and Guidelines/
Corresponding Terms
Application ConditionsEnvironmental Zones/
Sign or LED Display Screen Luminance (cd/m2)
Note
1CIE 234:2019
A Guide to Urban Lighting Masterplanning [46].
6.4.5 Table 6
Sign average luminanceE1E2E3E4CIE 234:2019 [46] 6.3 Table 4:
E1—Intrinsically dark; large parklands and natural spaces
E2—Low district brightness; center of large squares, small parks, some residential areas
E3—Medium district brightness; some residential and small business areas
E4—High district brightness; city centers and other busy commercial areas
504008001000
2GB/T 36101-2018 Evaluation requirements for obtrusive light of LED panels [47].
5.3 Table 2
Full-color or multi-color display screenE1E2E3E4E1–No lighting areas; forest parks, observatory surroundings, nature reserves
E2—Low district brightness; residential areas, hospitals, etc.
E3—General public areas
E4—City centers; business districts
50200400600
3CIE 150:2017 Guide on the Limitation of the Effects of Obtrusive Light from Outdoor Lighting Installation [48].
3.6.5.5 Table 7
Sign luminanceE0E1E2E3E4E0—Intrinsically dark; UNESCO Starlight Reserves, IDA Dark sky parks; major optical observatories
E1—Dark; relatively uninhabited rural areas
E2—Low district brightness; sparsely inhabited rural areas
E3—Medium district brightness; well-inhabited rural and urban settlements
E4—High district brightness; town and city centers and other commercial areas
<0.1504008001000
4GB/T 35626-2017 Specification for limitation to obtrusive light of outdoor lighting [25].
5.7.2 Table 8
Full-color LED display or media wall surfaceE1E2E3E4E1—Intrinsically dark; national parks, nature reserves
E2—Low district brightness; suburban residential areas
E3—Medium district brightness; urban residential areas, general public areas
E4—High district brightness; town and city centers, business districts
200400600
5JGJ/T 163-2008
Code for lighting design of urban nightscape [26].
5.6 Table 5.6.2
Advertising and Sign lighting areas,
S > 10 m2
E1E2E3E4E1—Intrinsically dark; national parks, nature reserves, observatory surroundings, etc.
E2—Low district brightness; industrial or residential places in rural areas, etc.
E3—Medium district brightness; well-inhabited rural and urban settlements
E4—High district brightness; town and city centers and other commercial areas
150300400
Disclaimer/Publisher’s Note: The statements, opinions and data contained in all publications are solely those of the individual author(s) and contributor(s) and not of MDPI and/or the editor(s). MDPI and/or the editor(s) disclaim responsibility for any injury to people or property resulting from any ideas, methods, instructions or products referred to in the content.

