Article

Research on Lateral Performance of Corrugated Steel Plate Shear Walls Connected with Beams Only under Horizontal Loads

1
College of Transportation Engineering, Tongji University, Shanghai 201804, China
2
College of Civil Engineering, Tongji University, Shanghai 200092, China
3
National Maglev Transportation Engineering R&D Center, Tongji University, Shanghai 201804, China
*
Author to whom correspondence should be addressed.
Buildings 2023, 13(8), 1996; https://doi.org/10.3390/buildings13081996
Submission received: 4 July 2023 / Revised: 19 July 2023 / Accepted: 31 July 2023 / Published: 5 August 2023
(This article belongs to the Section Building Structures)

Abstract

:
This paper investigates the lateral performance of corrugated steel plate shear walls with corrugation laid vertically connected with beams only (CboSPSW). A numerical model for the CboSPSW was developed, and verified by a laboratory test. Based on the verified numerical model, extensive parametric analyses were carried out to investigate the key parameters’ effects on the shear performance of CboSPSWs, including the height ratio, aspect ratio, opening rate, and surrounding frame stiffness. In these parametric analyses, strength and lateral stiffness losses of the corrugated steel plate (CSP), buckling, and failure modes of the shear walls were investigated. In addition to these, a simplified model for the CboSPSW was developed to predict the shear performance of the shear wall. The results show that the CboSPSWs exhibit large strength, initial stiffness, and good displacement ductility. Compared with the corrugated steel plate shear walls with vertical corrugated steel plates connected with beams and columns (CbcSPSW), the strength of the CSPs decreased 15–28% in the CboSPSWs. The free edges of the CSPs in the CboSPSWs should be strengthened by adding stiffeners on one side or two sides of the CSPs in practical projects. The aspect ratio and opening rate of the CSPs should be controlled for strength decreases of the CSPs. The modified strip model can be used to predict shear performance of the CboSPSW with a reasonable accuracy.

1. Introduction

In recent years, the corrugated steel plate (CSP) has been used widely in many structural elements and structure systems [1,2,3]. In the corrugated steel plate shear walls with vertical corrugated steel plates connected with beams only (CboSPSW), the CSPs are connected with adjacent beams, and have no connections with neighboring columns, shown in Figure 1a. The reduced constraints from columns decrease the strength, stiffness, and energy dissipation capacity of the CSPs [4]. However, it is the characteristic of the connections that reduces the adverse effects from infilled plates on the columns, improves the construction speed, and reduces the construction costs of shear walls. In addition to these, CboSPSWs make designs and layouts of the shear wall structures with more flexibility by adjusting the CSP widths and openings in infilled plates easier, compared with those of flat steel plate shear walls (FSPSWs) and corrugated steel plate shear walls with CSPs horizonal arrangements (ChSPSWs) [5,6], shown in Figure 1c. Due to these advantages, the CboSPSW is one of the lateral resisting systems with great potential. However, research on the structural performance of CboSPSWs is scarce. Thus, investigations on the mechanical performance of CboSPSWs are necessary for the applications of the shear walls.
Many studies on the static and seismic behavior of ChSPSWs have been conducted. The geometry parameters of CSPs’ effects on the structural performance of shear walls [7,8,9,10] have been discussed, and results showed that the ChSPSWs had large lateral stiffness, buckling and ultimate strength, good ductility, and energy dissipation capacity. The corrugation placements influenced the buckling modes of CSPs [11,12]. The results showed that the shear walls with CSP vertical arrangements showed local buckling and global buckling, the shear walls with CSP horizontal arrangements showed global buckling. The stiffnesses demands on the surrounding columns in ChSPSWs were less than those in FSPSWs [4,11]. The elastic and post-buckling strength of the sinusoidal ChSPSW were studied based on the minimum potential energy and Ritz method [13,14,15]. To improve the buckling strength of CSPs, the seismic performance of the corrugated steel plate shear walls with stiffeners were investigated [16,17]. In addition to adding the stiffeners on the CSPs, the other effective way to improve the bulking strength of the CSPs is adjusting the parameters of the CSPs [18,19,20]. The results showed that with proper design of its parameters of the CSPs, including thickness, subpanel width, corrugation depth, wavelength, and height and width of the CSPs, the CSPs could avoid buckling before yielding of the CSPs. The effect of the openings in filled plates on the performance of the shear wall was discussed [21]. In addition, the simplified models for ChSPSWs were studied. The PFI model [22,23] and equivalent cross brace model [24] were introduced to simplify the plastic and seismic analyses for ChSPSWs. Moreover, the shear and hysteretic behavior of composite corrugated steel plate shear walls were investigated, including the double-corrugated plate shear wall [25,26] and corrugated steel plate-concrete composite shear wall [27].
There were also some studies on the corrugated steel plate shear walls with CSPs vertical arrangements (CvSPSWs). The effects of the concerned geometry parameters on the static and seismic performance of the shear walls were investigated [28,29]. The elastic buckling strength of the CbcSPSW (Figure 1b) with stiffeners was investigated based on the minimum potential energy theory and Rayleigh–Ritz method [30]. Few preliminary studies on the geometry parameters effects on the structural performance of CboSPSWs have been carried out. The effects of the CSP thickness, aspect ratio, and wavelength on the shear performance of CbcSPSWs were discussed [31,32,33]. The results showed the CboSPSWs had large strength, lateral stiffness, and good ductility and energy dissipation capacity.
As presented above, there are a lot of studies on the static and seismic performance of ChSPSWs under lateral and vertical loads. However, studies on the shear performance of CboSPSWs are few, the failure modes and loading mechanisms are not described clearly. The purpose of this paper focused on the lateral performance of the CboSPSWs under horizontal loads. A numerical model for the CboSPSW was developed. The effects of the concerned parameters on the shear behavior of CboSPSWs were discussed, and ways of resisting lateral loads, formations of tension field of CSPs, and failure modes were investigated in the parametric analyses. Moreover, a simplified model was developed to simulate the elastoplastic analysis for CboSPSWs.

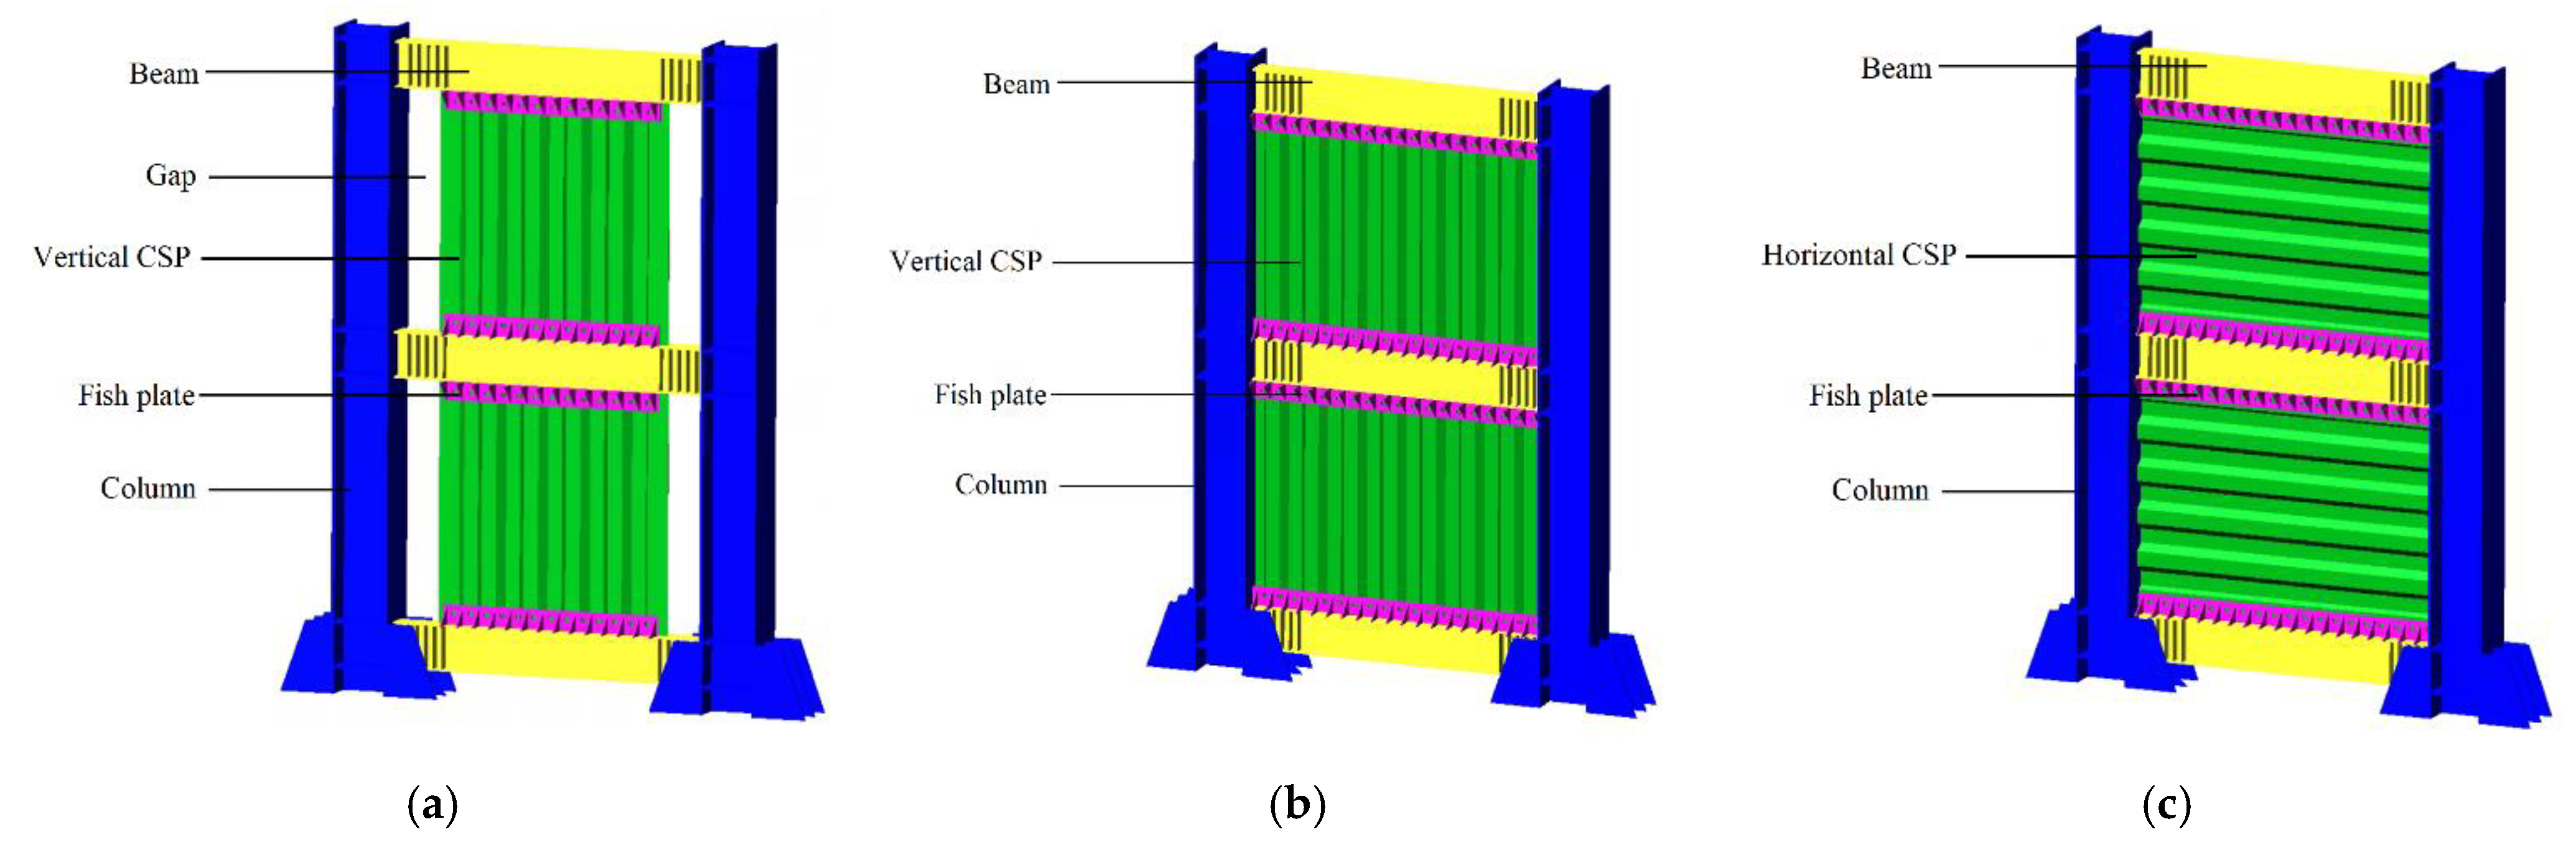
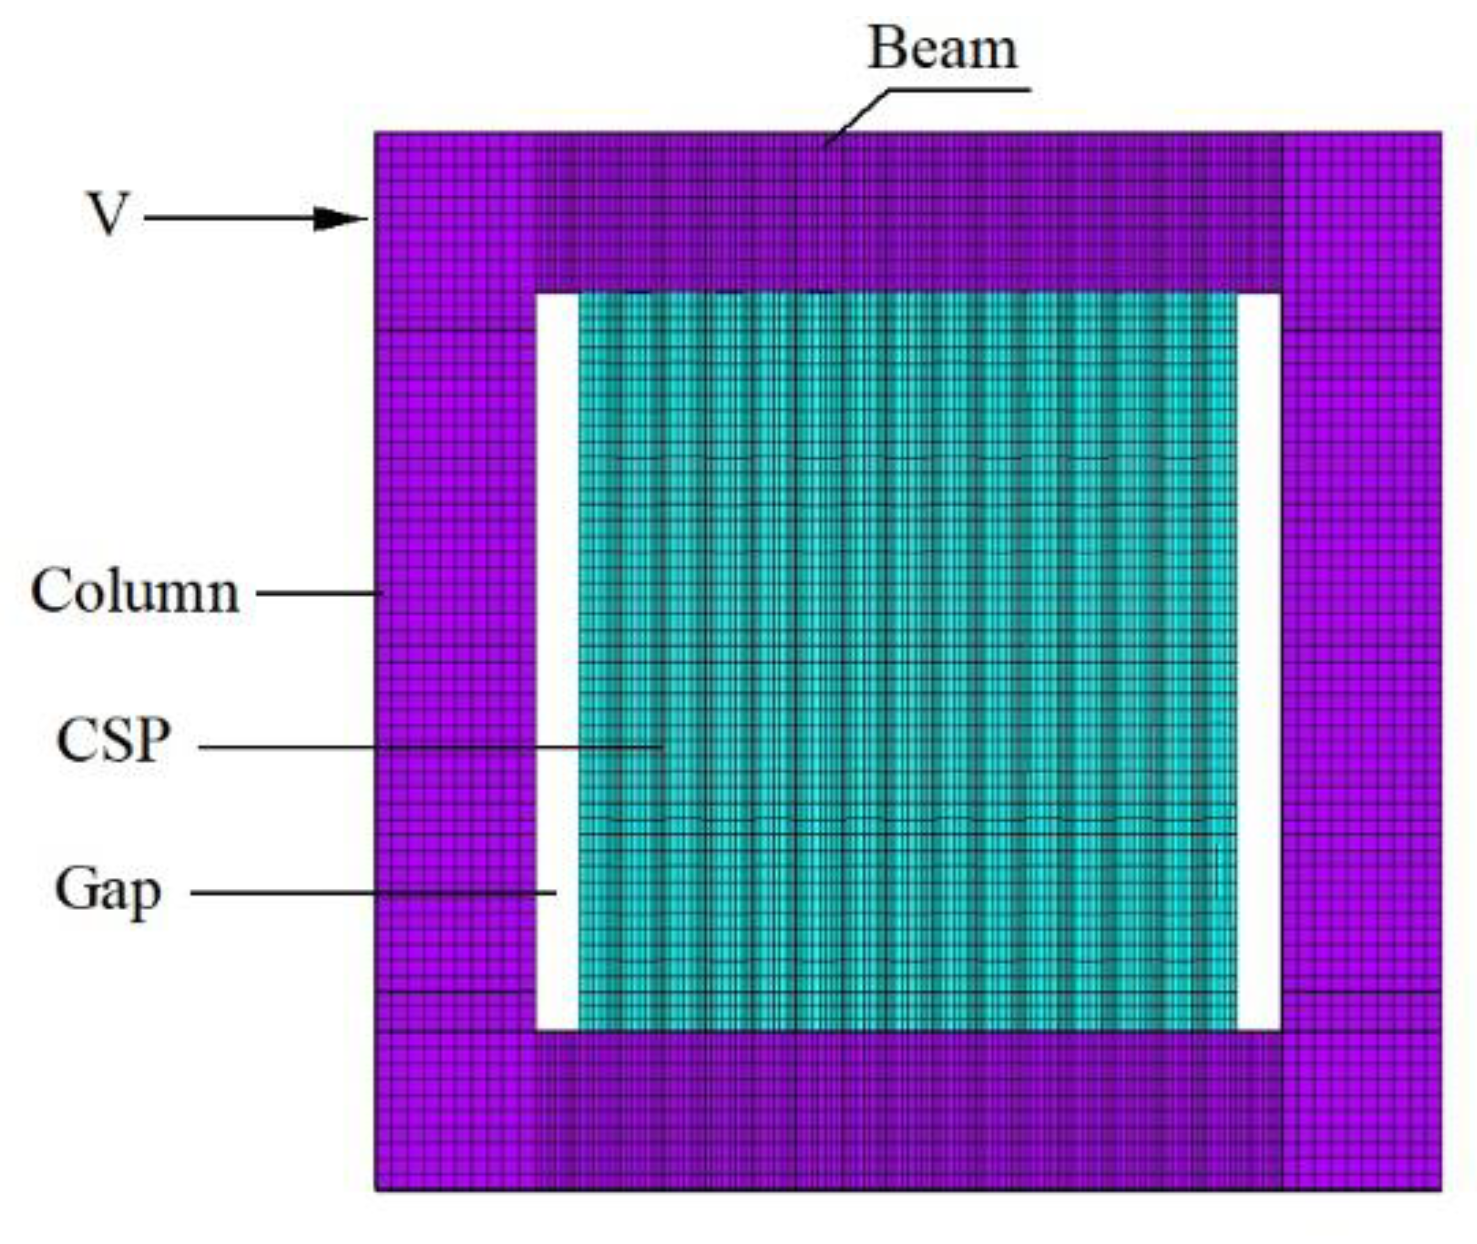
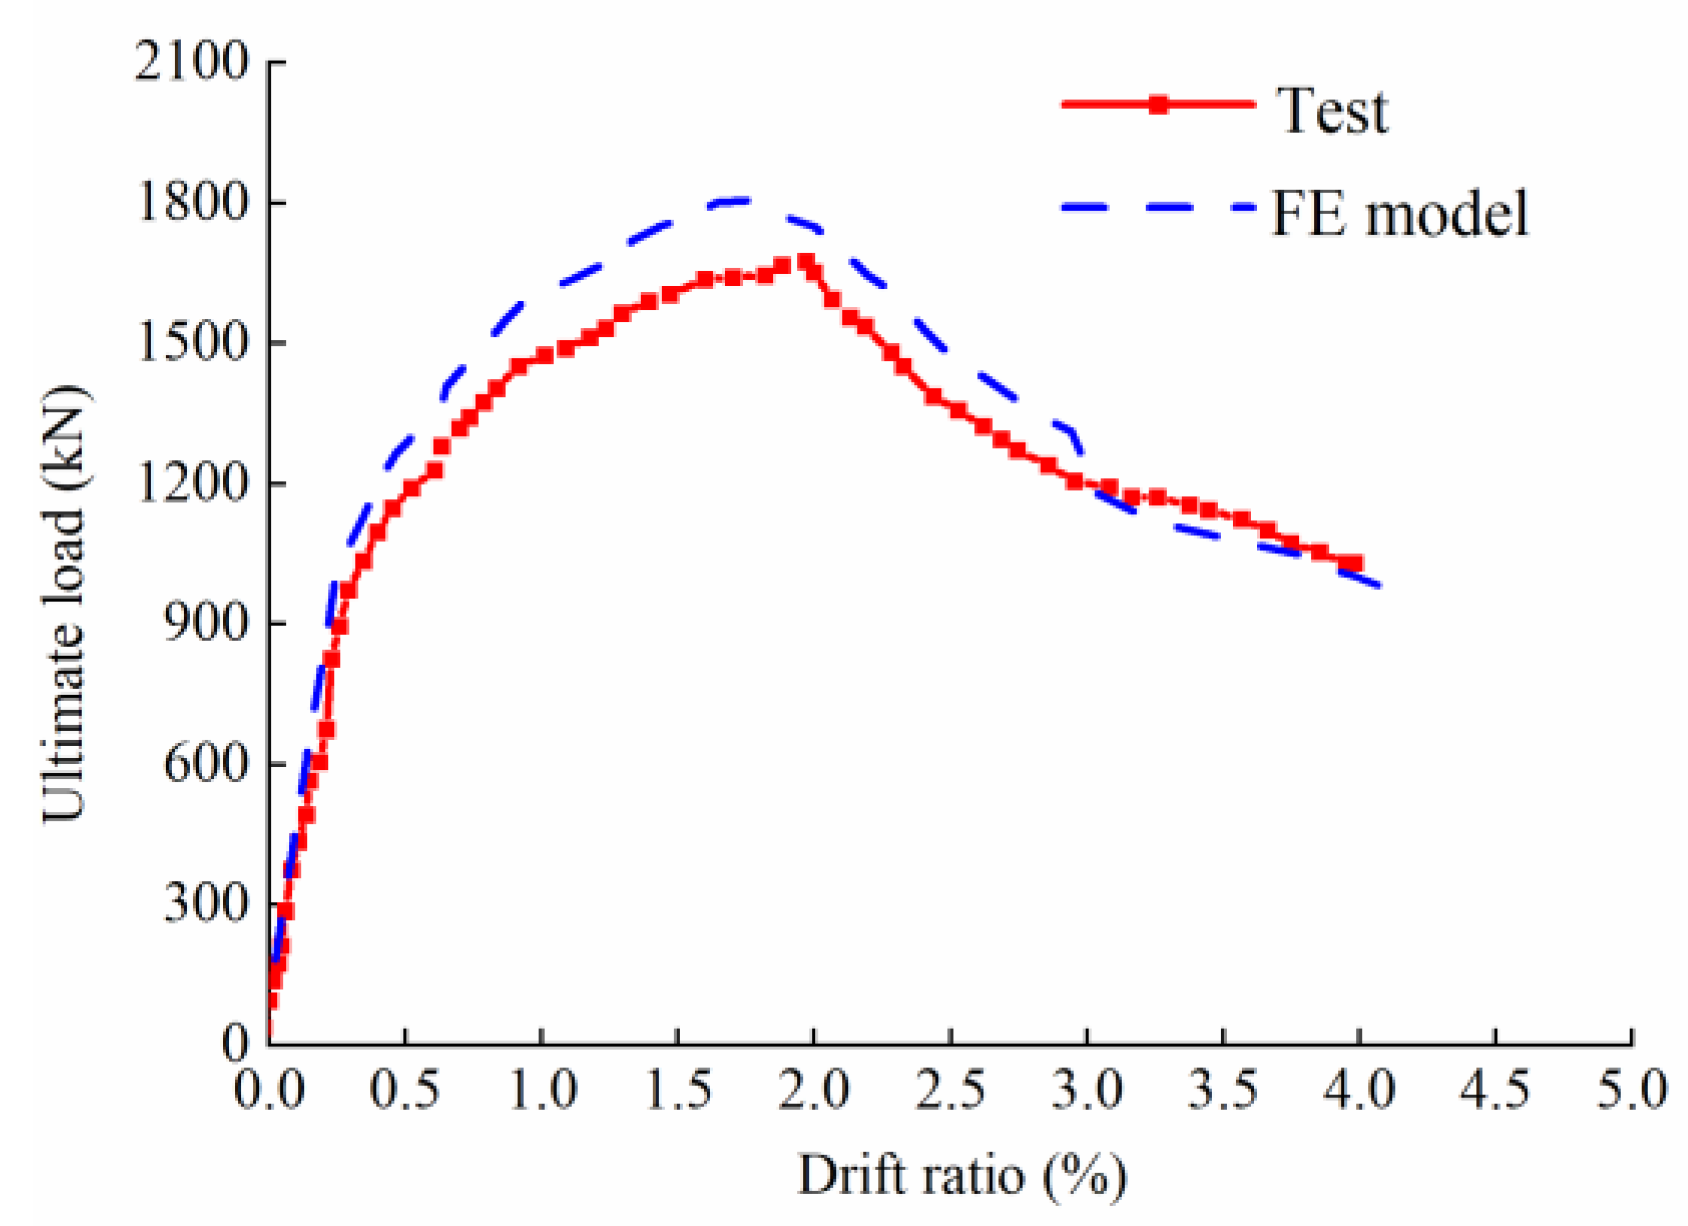
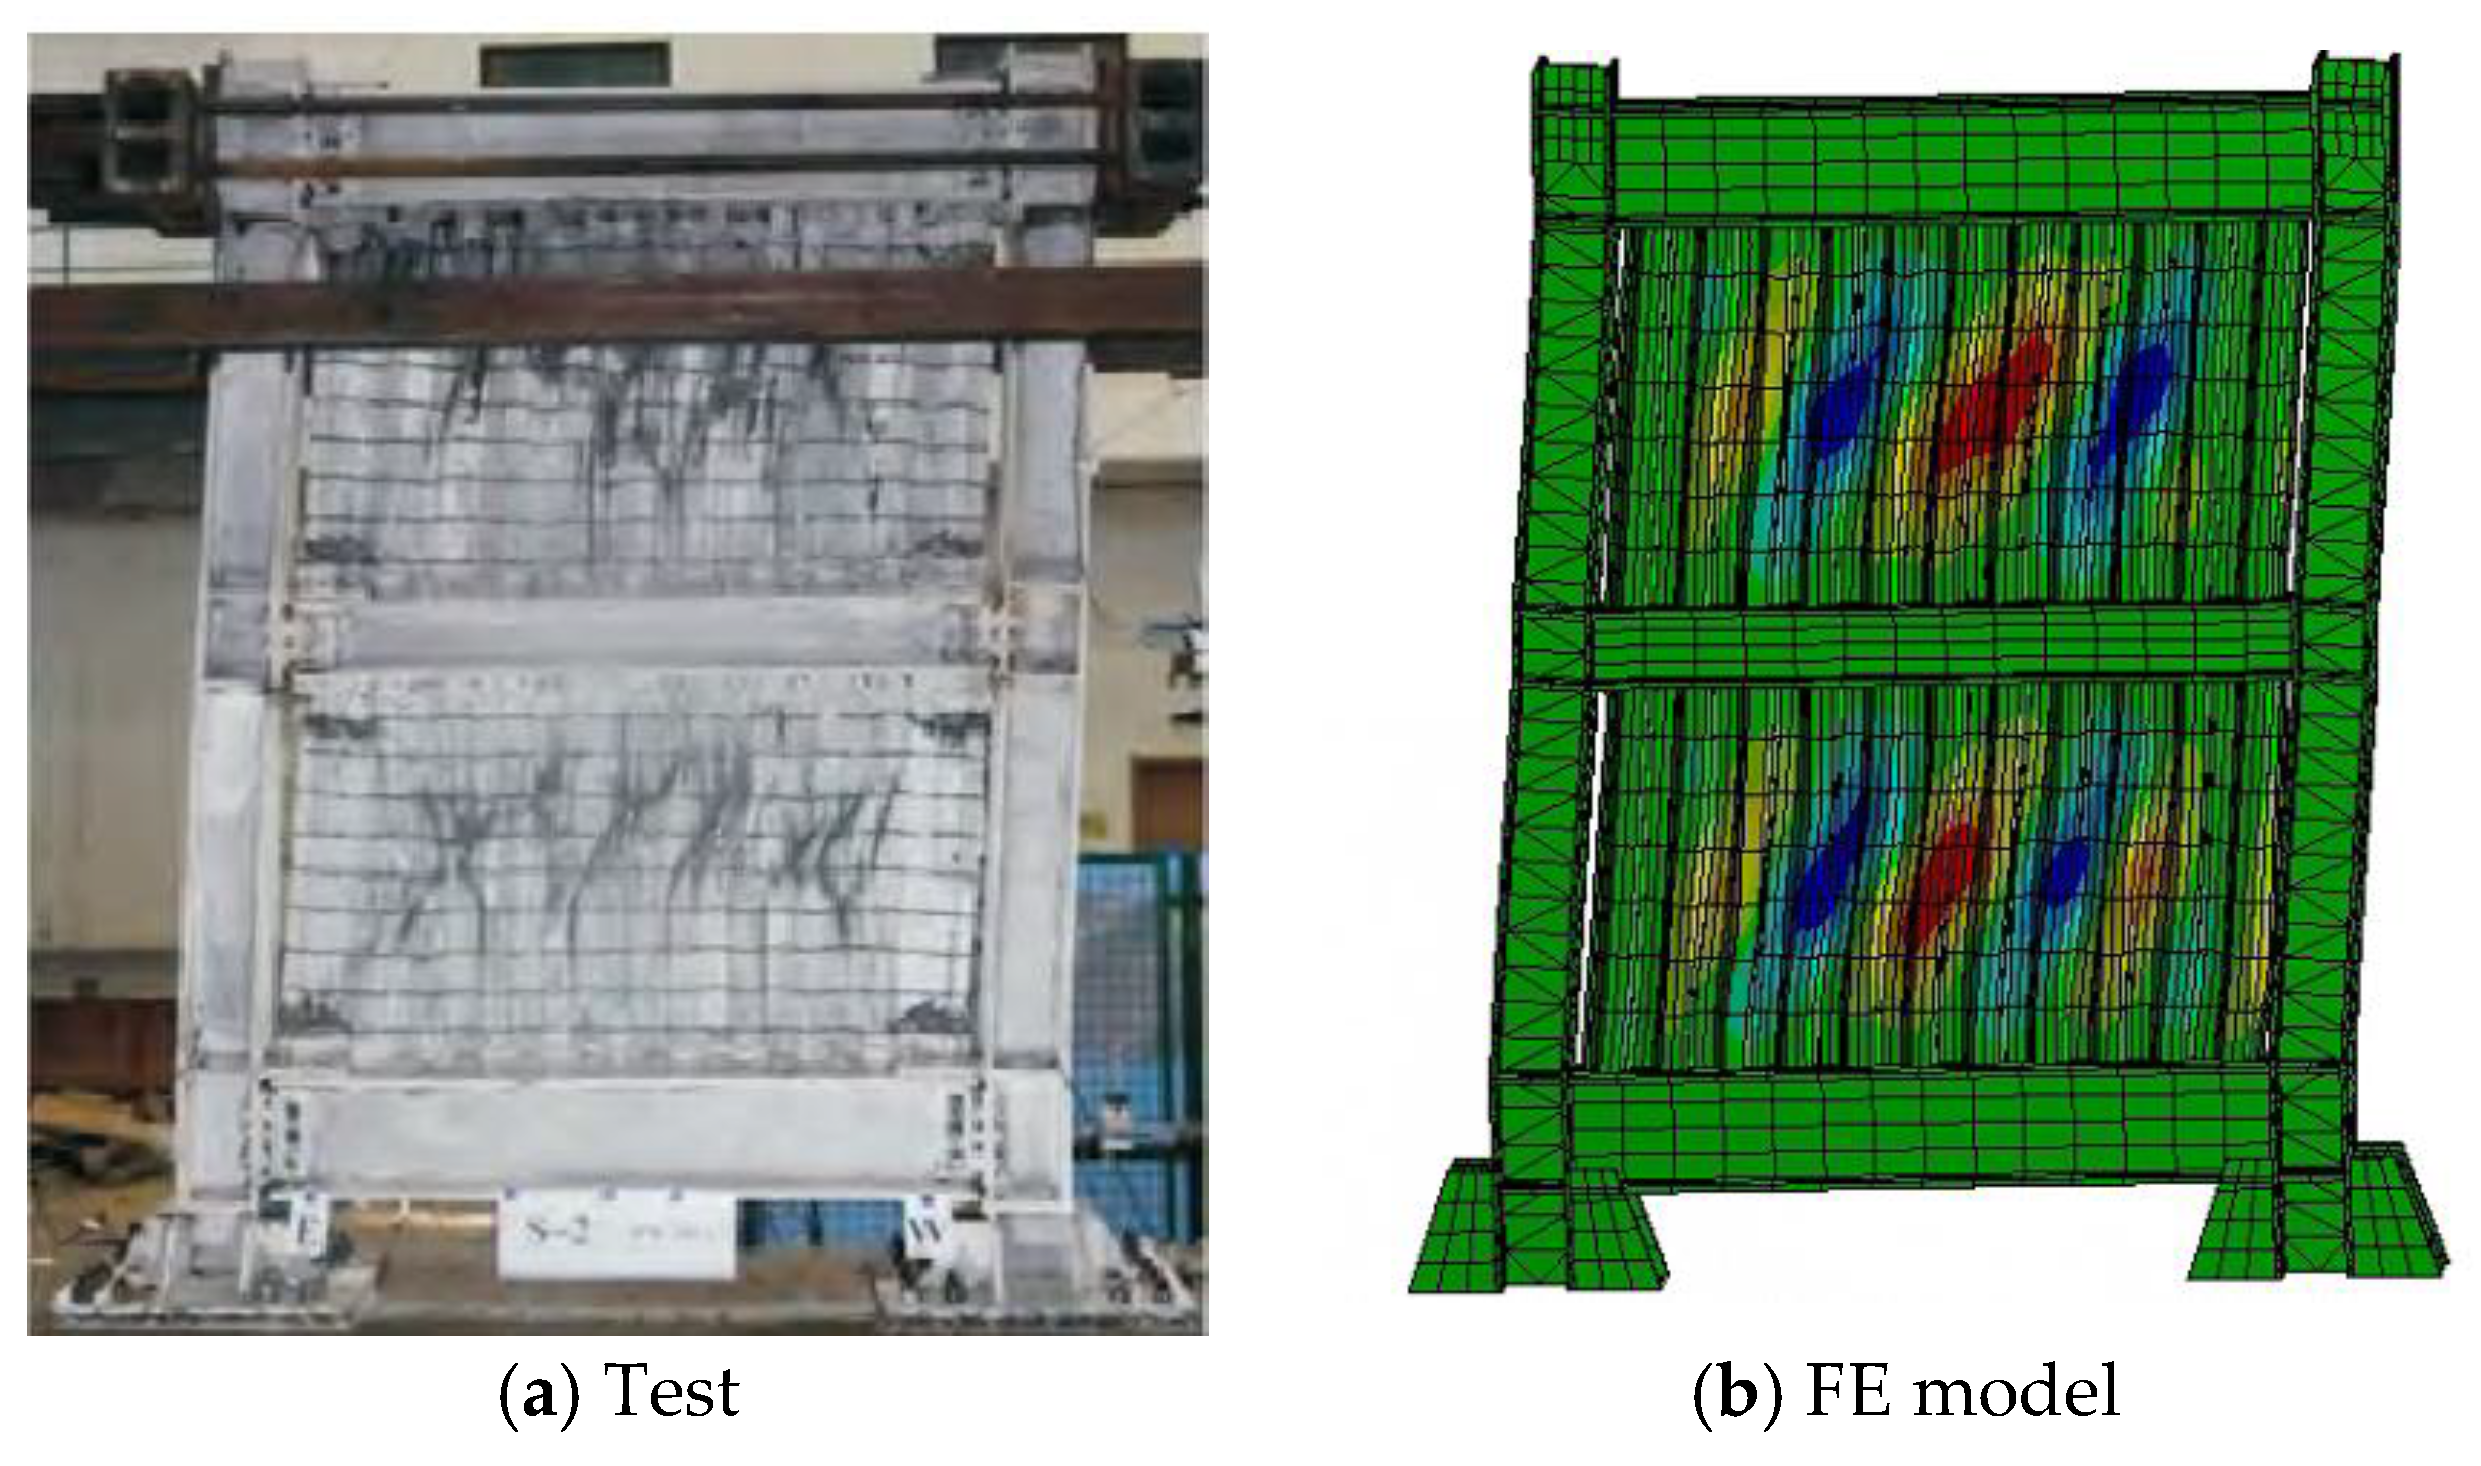
2. Finite Element (FE) Model and Verification

In this paper, the shear performance of the CboSPSW was studied based on the general FEM software ANSYS 19.0. A single-bay, one-story FE model for a CboSPSW was developed. In the model, the shell 181 element was used to simulate the structural performance of the columns, beams, and CSPs. The connections of the beams and columns were rigid, and the CSPs were connected to neighboring beams only and separated from the neighboring columns with 5 mm gaps. The bottoms of the columns were fixed and the lateral loads were applied at the ends of the columns. The materials of the CSP, columns, and beams were Q345 steel. The yield stress of the CSP was 370.0 Mpa and the elastic modulus of the CSP was 2.0 × 10⁵ Mpa. The yield stress of the columns and beams was 399.0 Mpa, and the elastic modulus of the columns and beams was 2.1 × 10⁵ Mpa. The Poisson’s ratios of the CSP, beams, and columns were 0.3. The ideal elastoplastic models were adopted to simulate the material properties; Von-mises yield criterion and the associated flow rule were adopted in the FE model. In order to avoid eccentric loading, the out-of-plane displacement of the surrounding frame was constrained. The initial imperfection of the CSP was applied to the geometry model before the elasto-plastic analysis, and the imperfection value was taken 1/750 of the height of the CSP. When the sizes of the shell elements were less than 30 mm × 30 mm, the results of the FE model tended to be stable. The meshed FE model for the CboSPSW is shown in Figure 2.
Before the elasto-plastic analyses, the above developed model for a CboSPSW was verified by a laboratory test. The two-story, one-bay CboSPSW specimen was conducted by Zhao [31]. In the test specimen, the section sizes of the surrounding columns were H-200 mm × 200 mm × 14 mm × 16 mm. The section sizes of the bottom and top beams were H-300 mm × 200 mm × 14 mm × 16 mm, and section size of the middle beam H-200 mm × 150 mm × 14 mm × 16 mm. The CSP thicknesses were 3.0 mm. The horizontal subpanel width was 50 mm, the corrugation depth 45 mm, the wavelength 160 mm.
In accordance with the test specimen, a FE model for the specimen was established, and the materials, boundary conditions, and loads were consistent with those of the test specimen. The load–displacement curves and failure modes obtained by the FE model and test are shown in Figure 3 and Figure 4.
Figure 3 shows that the ultimate strength ratio of the FE model to test the specimen is 0.93, and the displacement corresponding to ultimate strength ratio of the former to the latter is 0.89. Moreover, the failure modes obtained by the FE model were similar to that of the test in Figure 4. It is indicated that the developed FE model can predict the load–displacement curve of the CoSPSW with a reasonable accuracy.

3. Parametric Analyses and Discussions

Based on the above verified FE model, a series of parametric analyses were conducted to investigate the effects of the height–thickness ratio, aspect ratio, opening rate, and surrounding column stiffness on the shear performance of CboSPSWs, including ultimate strength, stiffness, failure modes, and formation of tension field. Figure 5 shows a diagram for the CboSPSW, including the CSP, H-shaped columns, and H-shaped beams. Table 1 shows the sizes of the concerned parameters in detail.

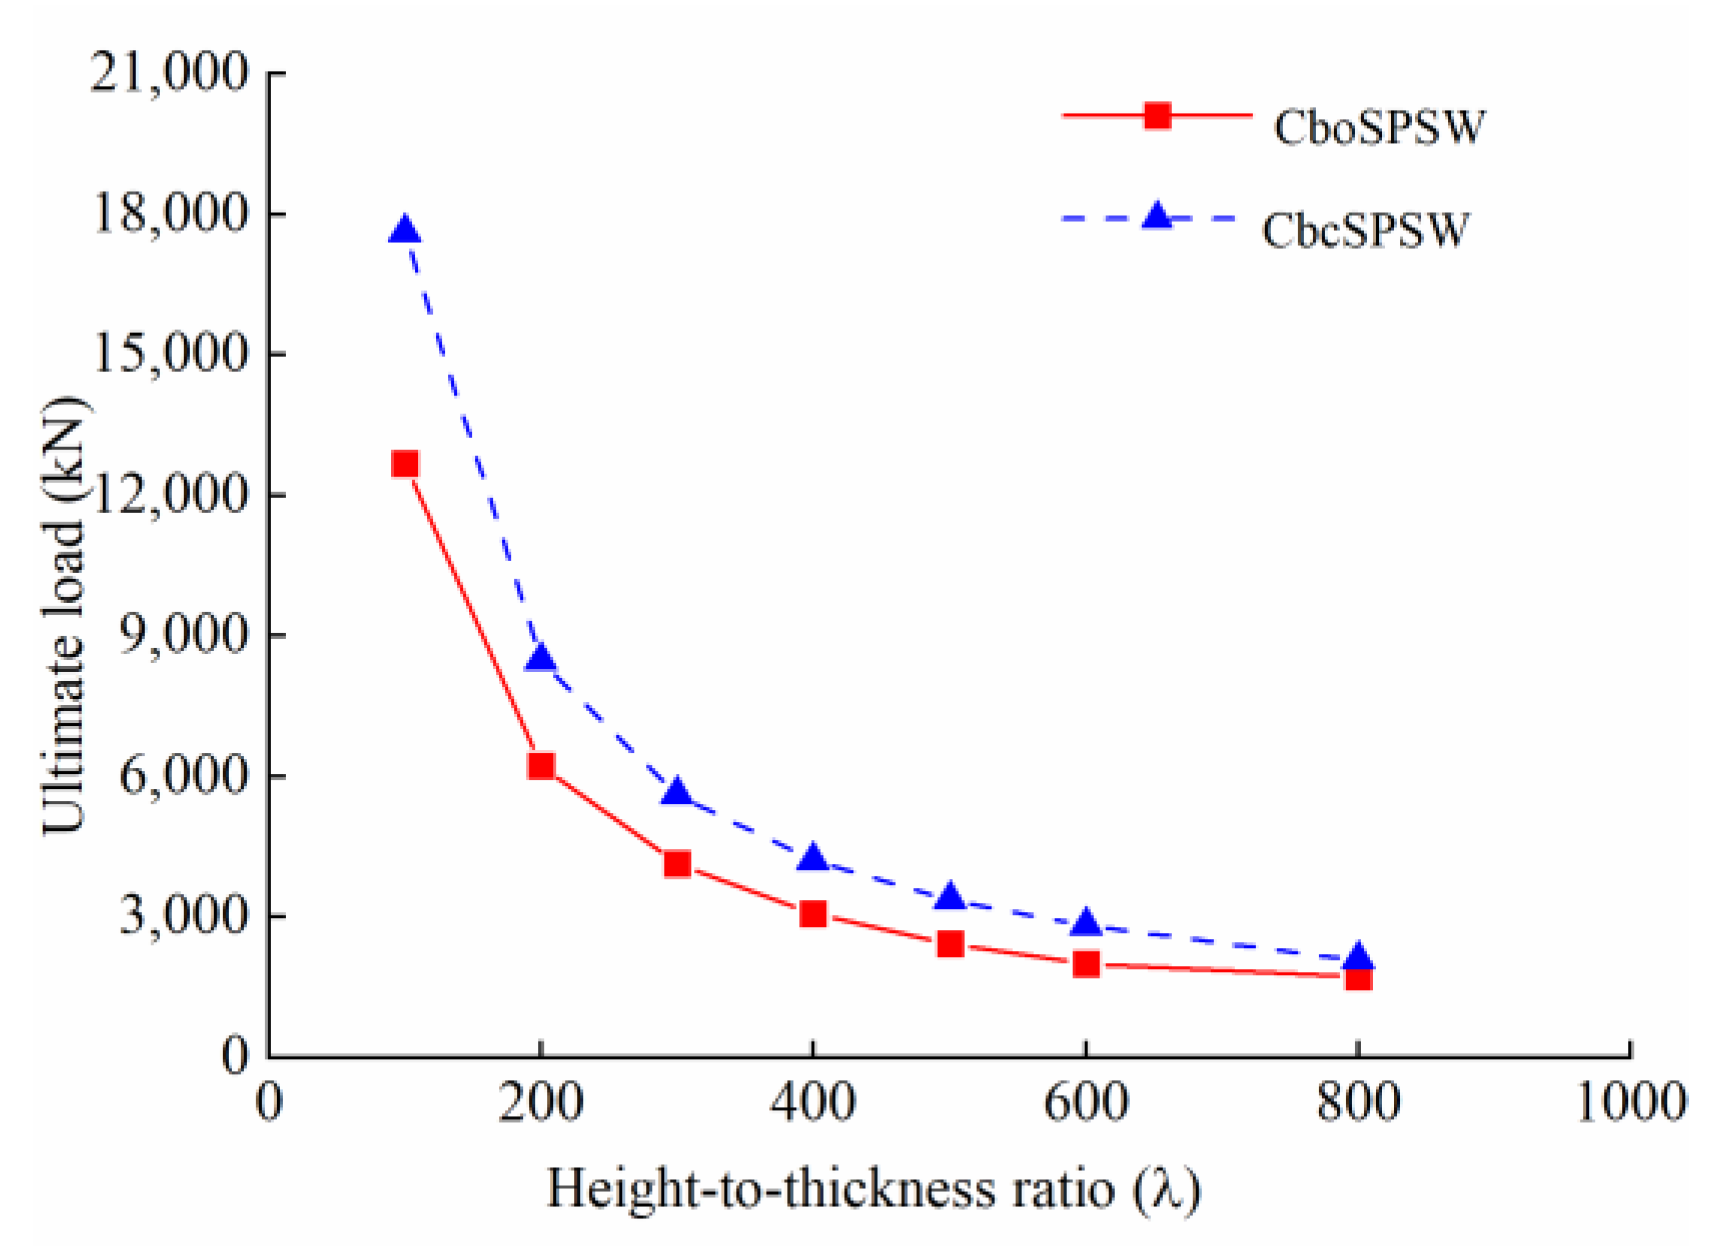
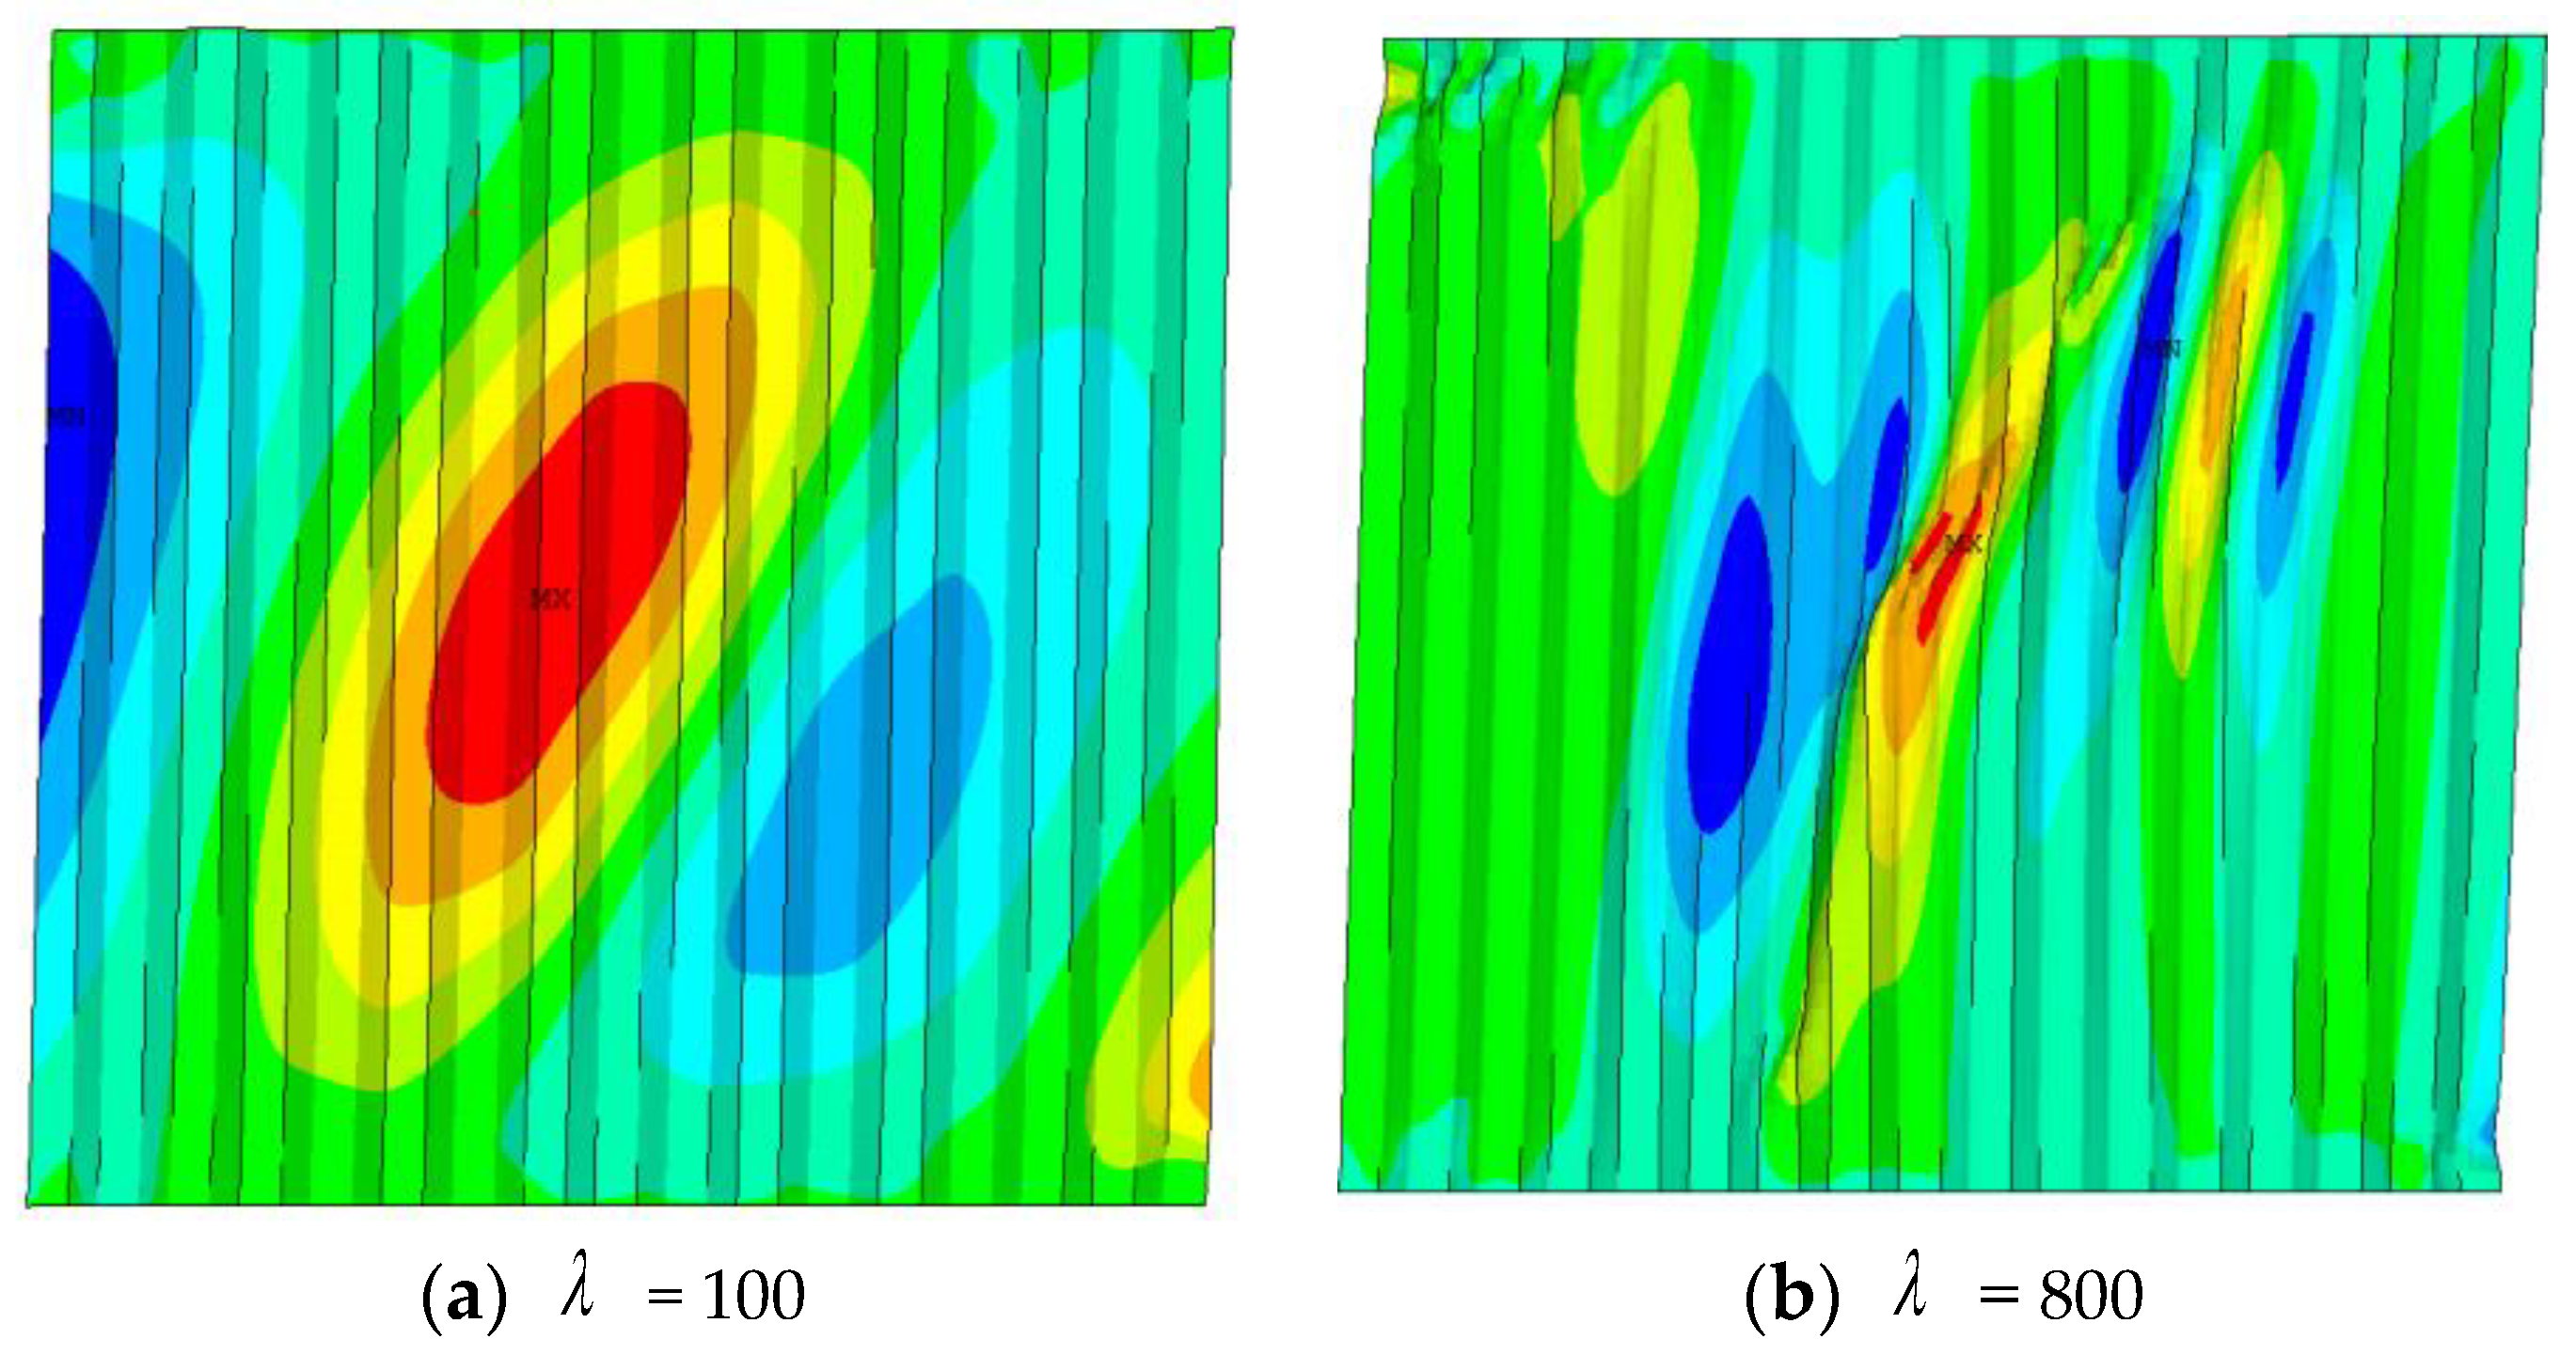
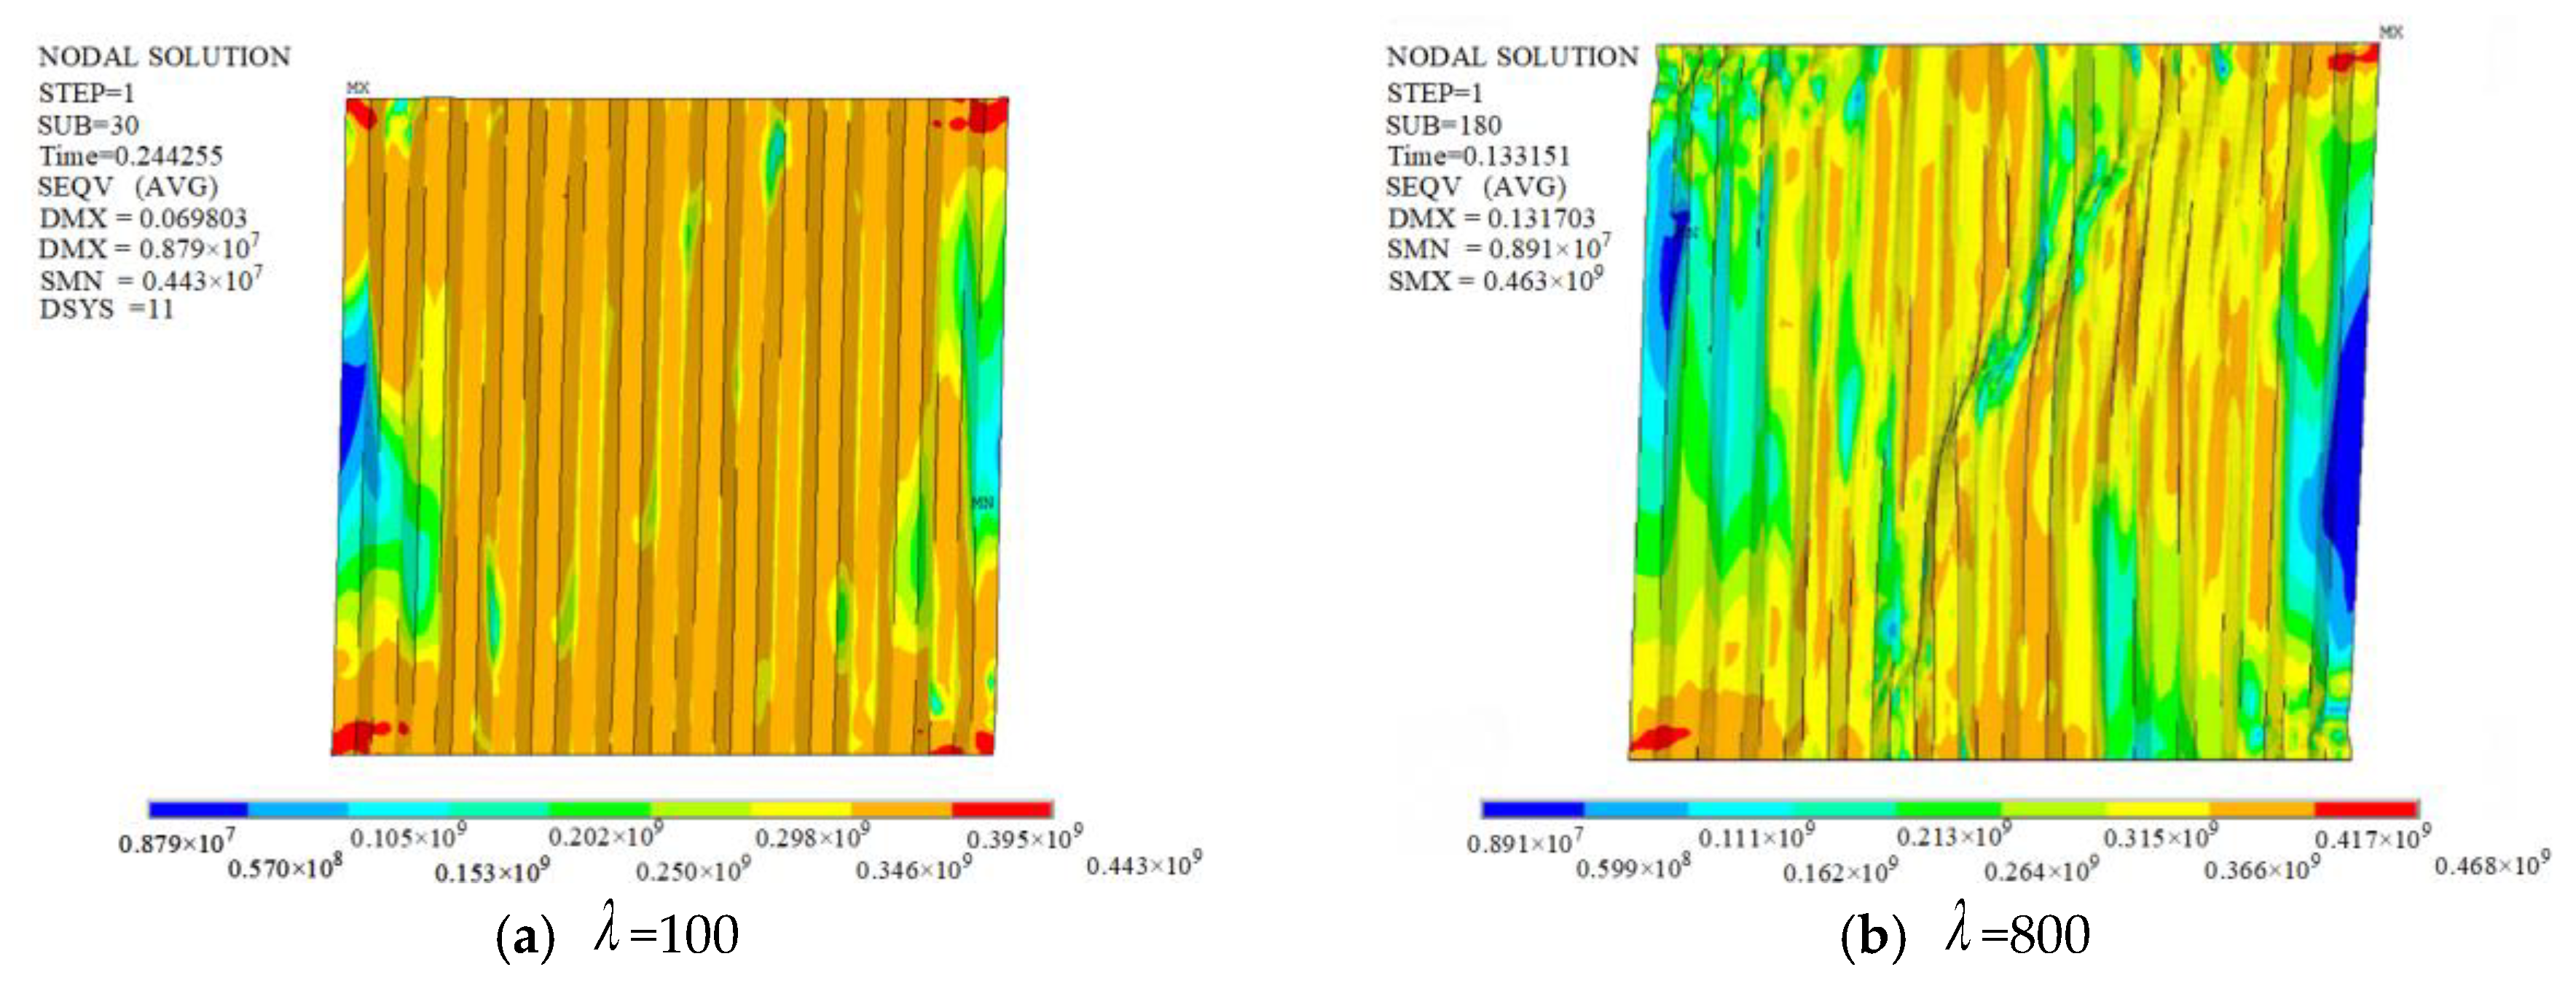
3.1. Height–Thickness Ratio Effect

In order to discuss the height–thickness ratio effect, the CboSPSW and CbcSPSW specimens with various CSP thicknesses, 28.0, 14.0, 9.3, 7.0, 5.6, 4.7, and 3.5 mm, under lateral loads were established, the corresponding height–thickness ratios λ were 100, 200, 300, 400, 500, 600, and 800. The other parameters stayed the same. The CbcSPSWs with the same geometry parameters of the CboSPSWs were also established to investigate the strength and lateral stiffness losses due to connections with beams only in CboSPSWs. The load–displacement curves of the CboSPSWs are shown in Figure 6, in which the lateral displacements belong to the top right-hand points of the CSPs (point A in Figure 5). The load versus out-of-plane displacement curves with different height–thickness ratios are shown in Figure 7, in which the out-of-plane displacement belongs to the points with the maximum out-of-plane displacements in the CSPs. The ultimate strength and initial stiffness of CboSPSWs and CbcSPSWs versus the height–thickness ratio curves are shown in Figure 8 and Figure 9.
From Figure 6 and Figure 7, the initial stiffness and strength have a negative relationship with the height–thickness ratio. The strength of the CSPs in the CboSPSW is smaller than that in the CbcSPSW with the same parameter because the constraints of CSPs from columns in the CboSPSWs are weaker than those in the CboSPSWs. In addition, the developed tension field in the CbcSPSW develops more fully than that in the CboSPSW. With the increase of the height–thickness ratio, the trend is more obvious. This is because the CboSPSWs with a smaller height–thickness ratio need much more constraints from columns for fuller development of the tension field. From Figure 8 and Figure 9, when the height–thickness ratio increases from 100 to 800, the ultimate loads of the CSPs decrease from 19% to 28% and the initial stiffnesses decrease from 26% to 33%. It is indicated that the mechanical properties of the CSPs in the CboSPSWs are not fully utilized due to two sides’ connections.
The out-of-plane displacement of the CboSPSWs with height–thickness ratio λ = 100 and 800 are shown in Figure 10. The buckling mode of the CboSPSW with height–thickness λ = 100 is global buckling of the CSP, while the CboSPSW with height–thickness ratio λ = 800 is local buckling.
The tension field of the CboSPSW with height–thickness ratio λ = 100 develops more fully than the one with height–thickness ratio λ = 800, shown in Figure 11. The former resists the lateral loads mainly relying on pure shear, while the latter relies on the tension field shown in Figure 11. Furthermore, the free edges of CSPs under compression are easy to buckle and deform, and tension field of the CSPs with the free edges cannot develop fully. This is the reason the mechanical properties of the CSPs in the CboSPSWs are not fully utilized. Moreover, the corners of the CSPs are the first parts to be destroyed. Therefore, it is suggested that the free edges of CSPs should be strengthened by adding stiffeners on one side or two sides of the CSPs in practical projects.

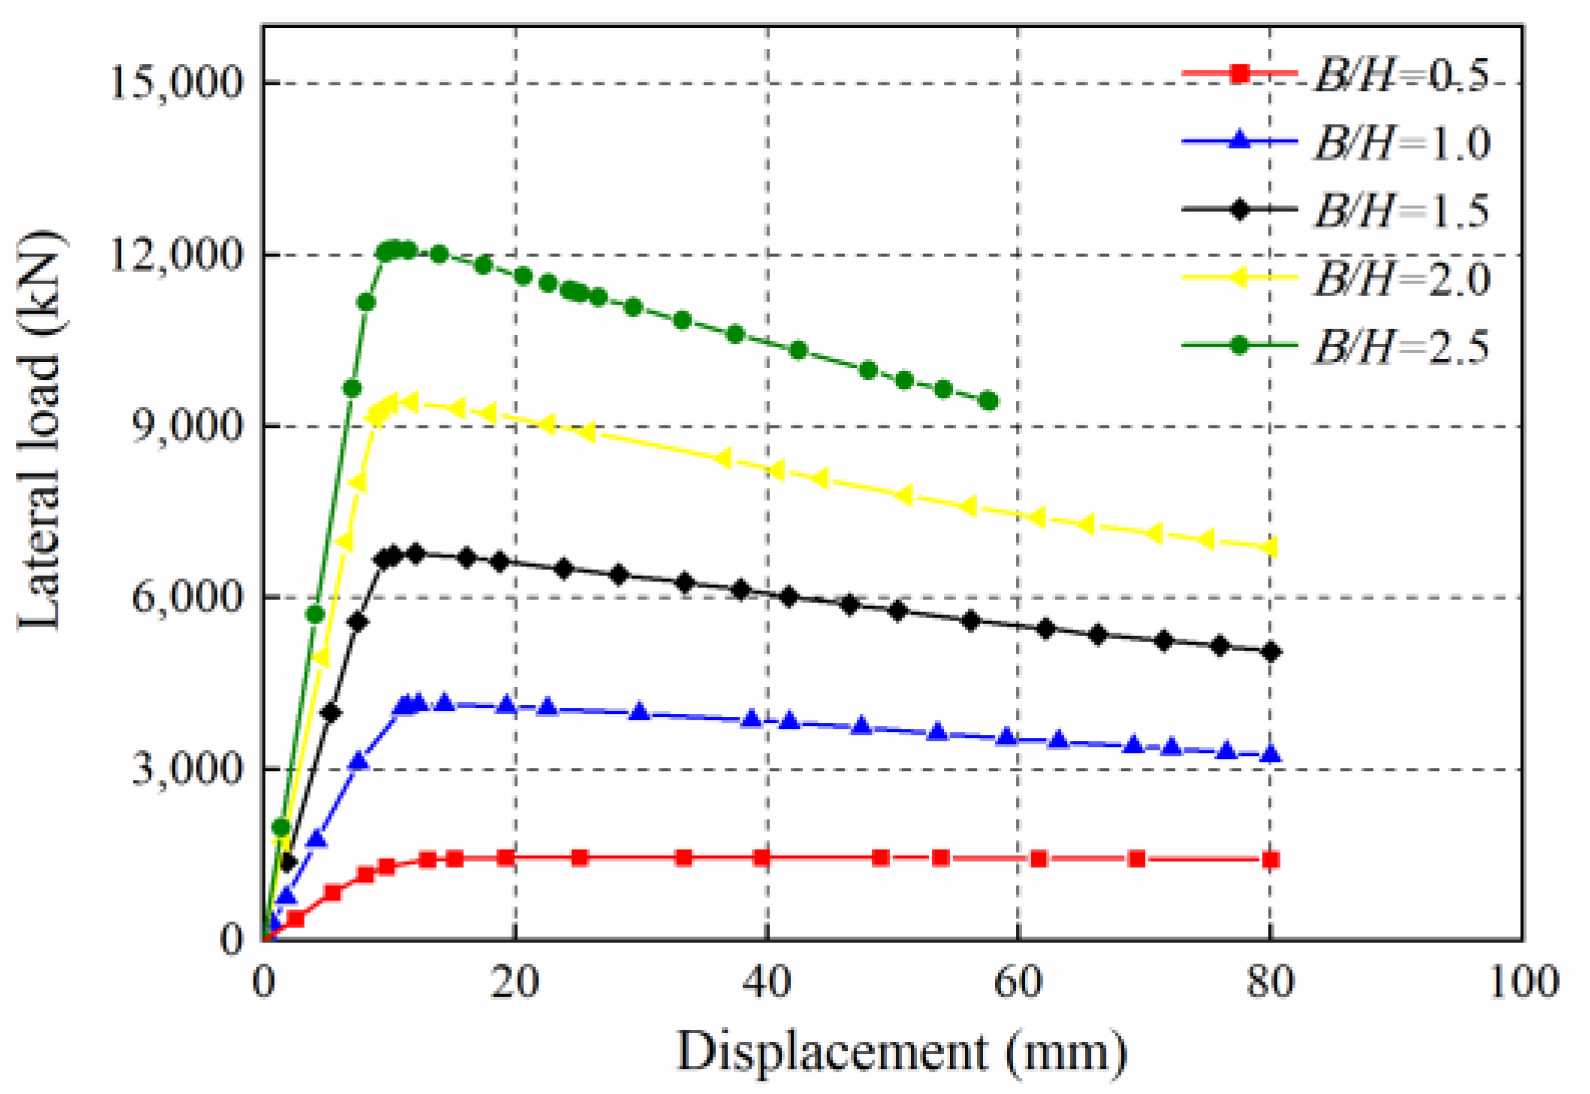
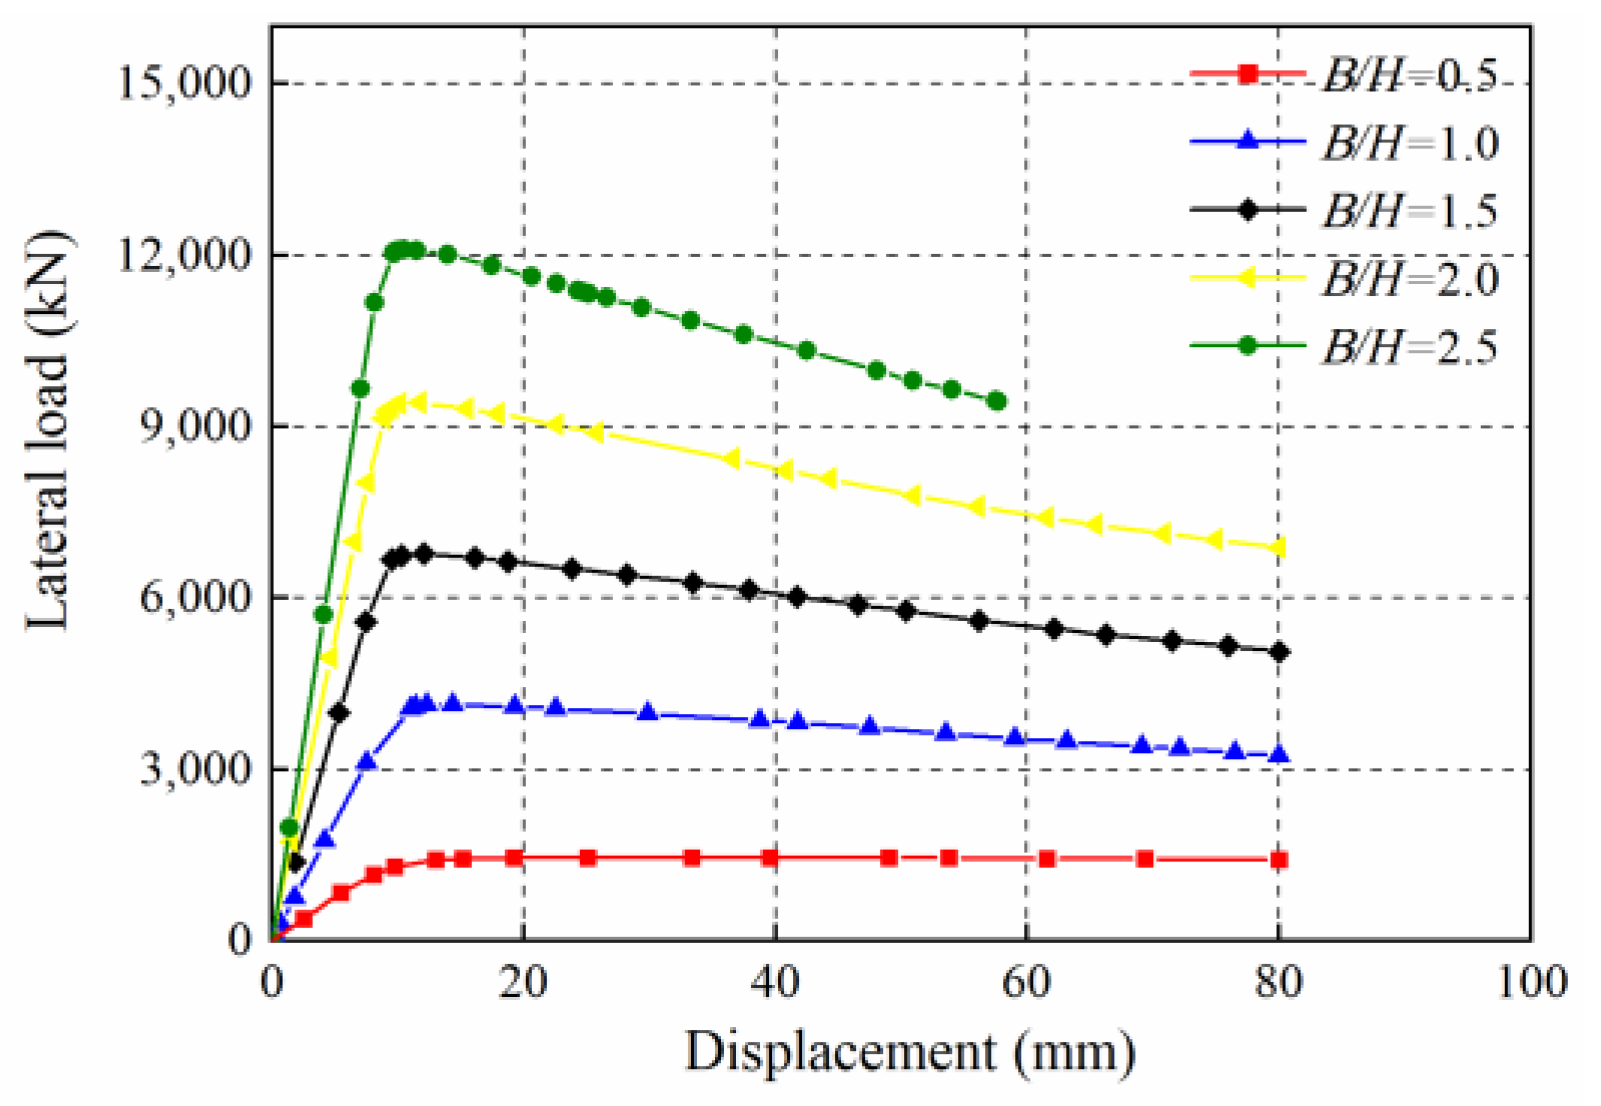
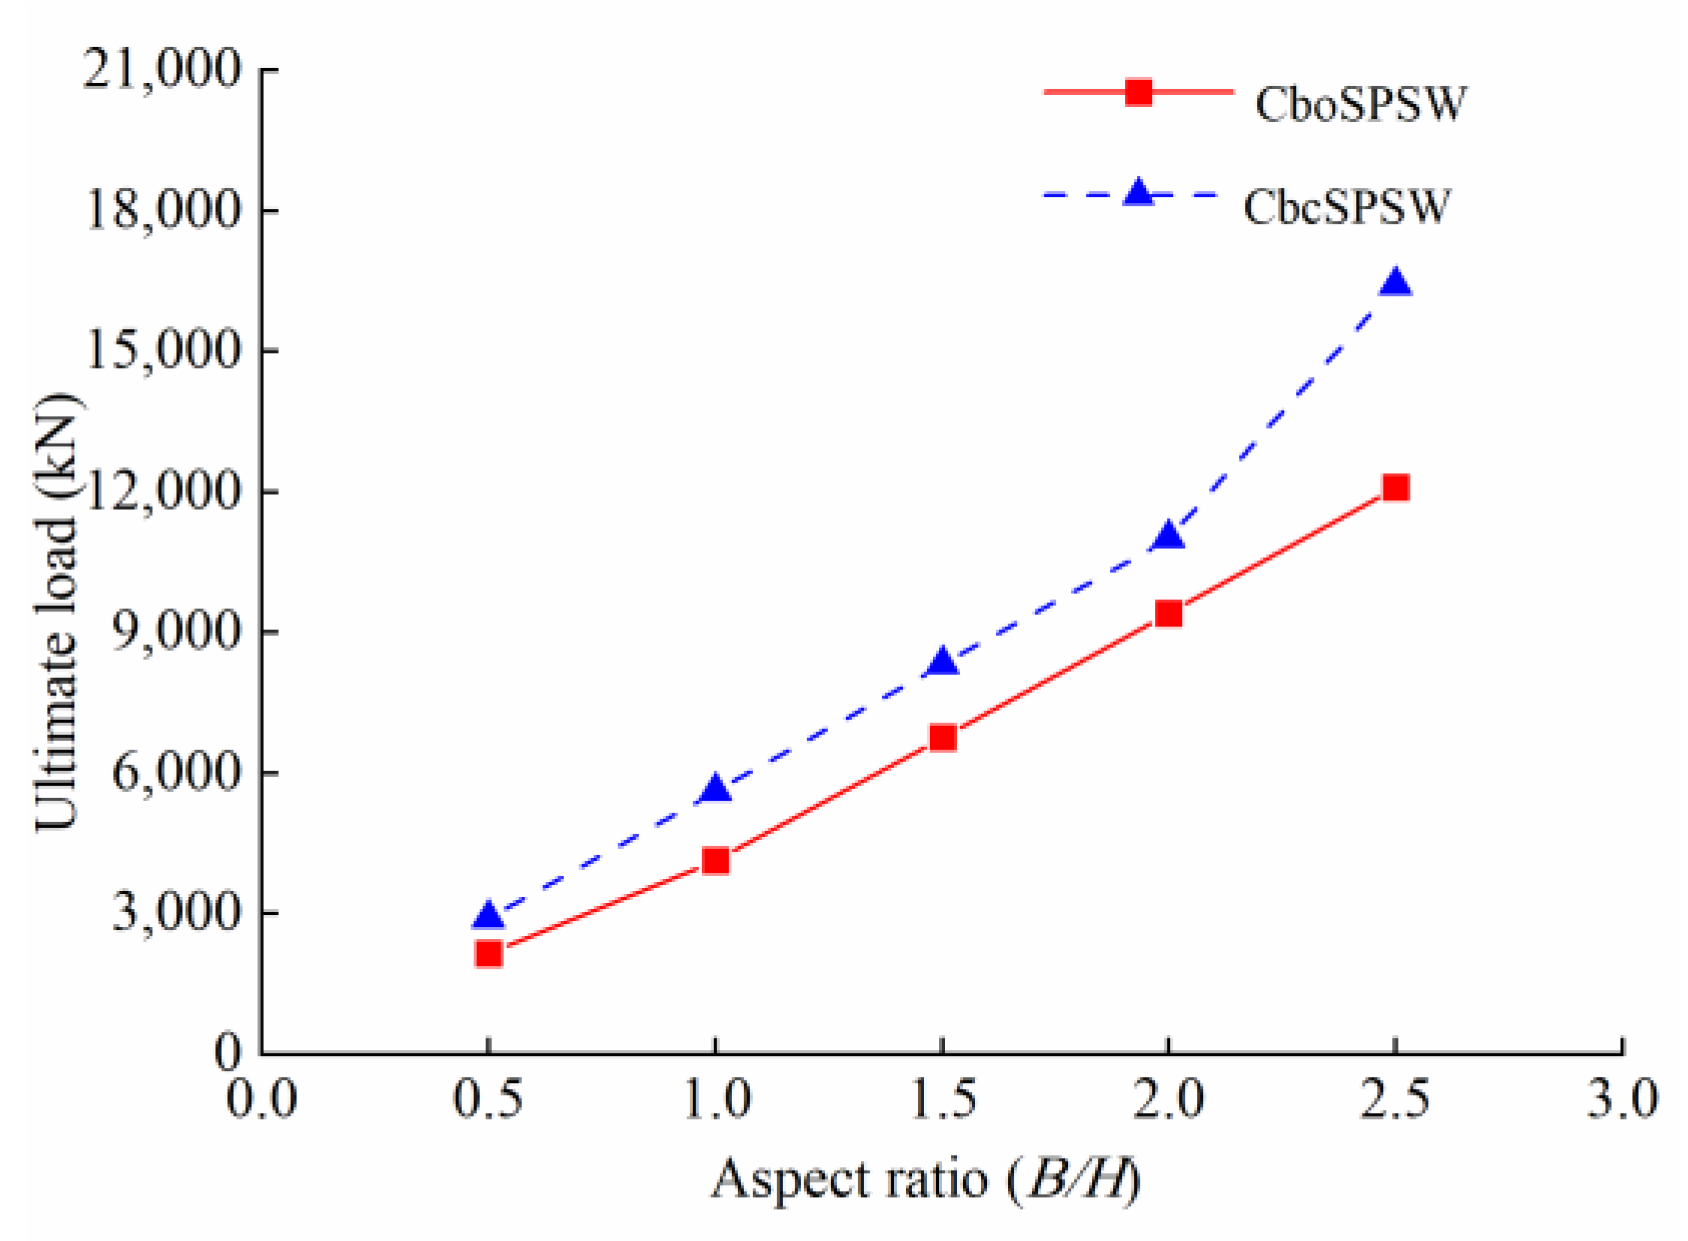
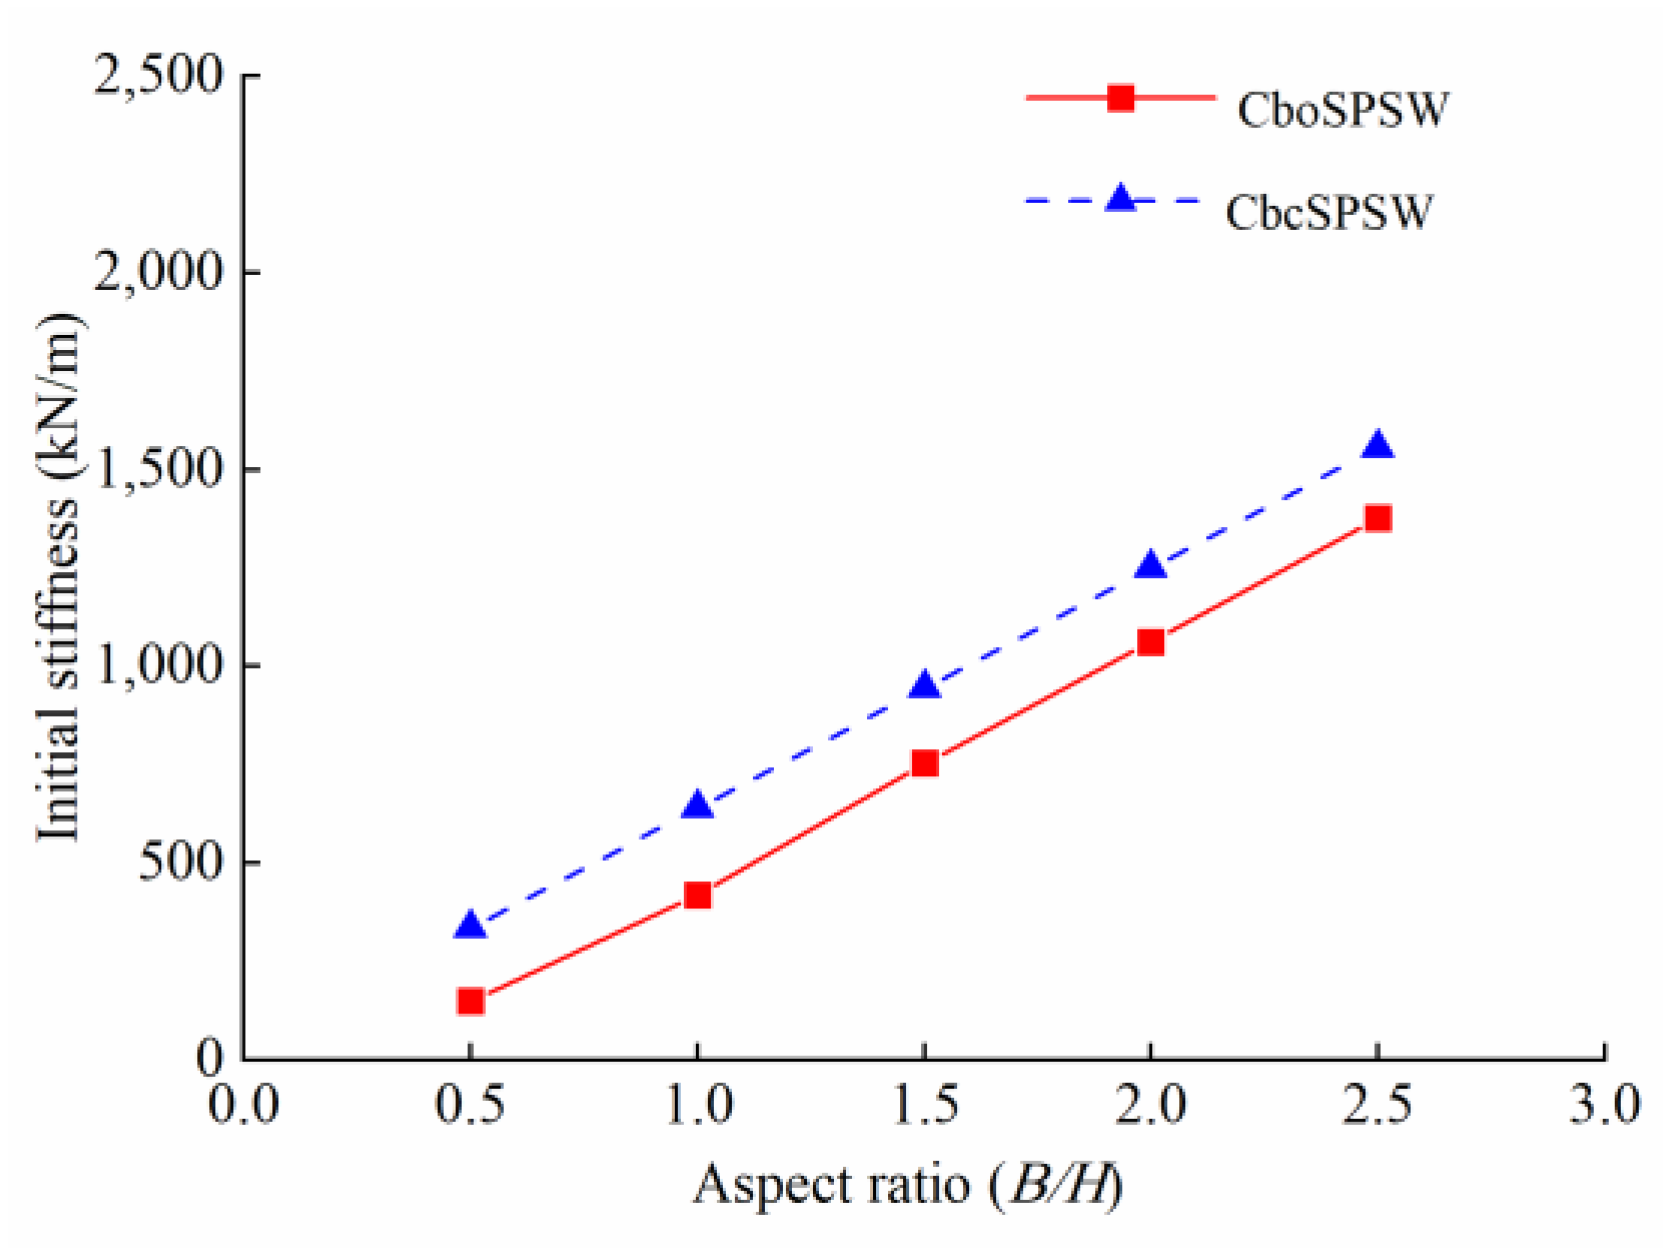
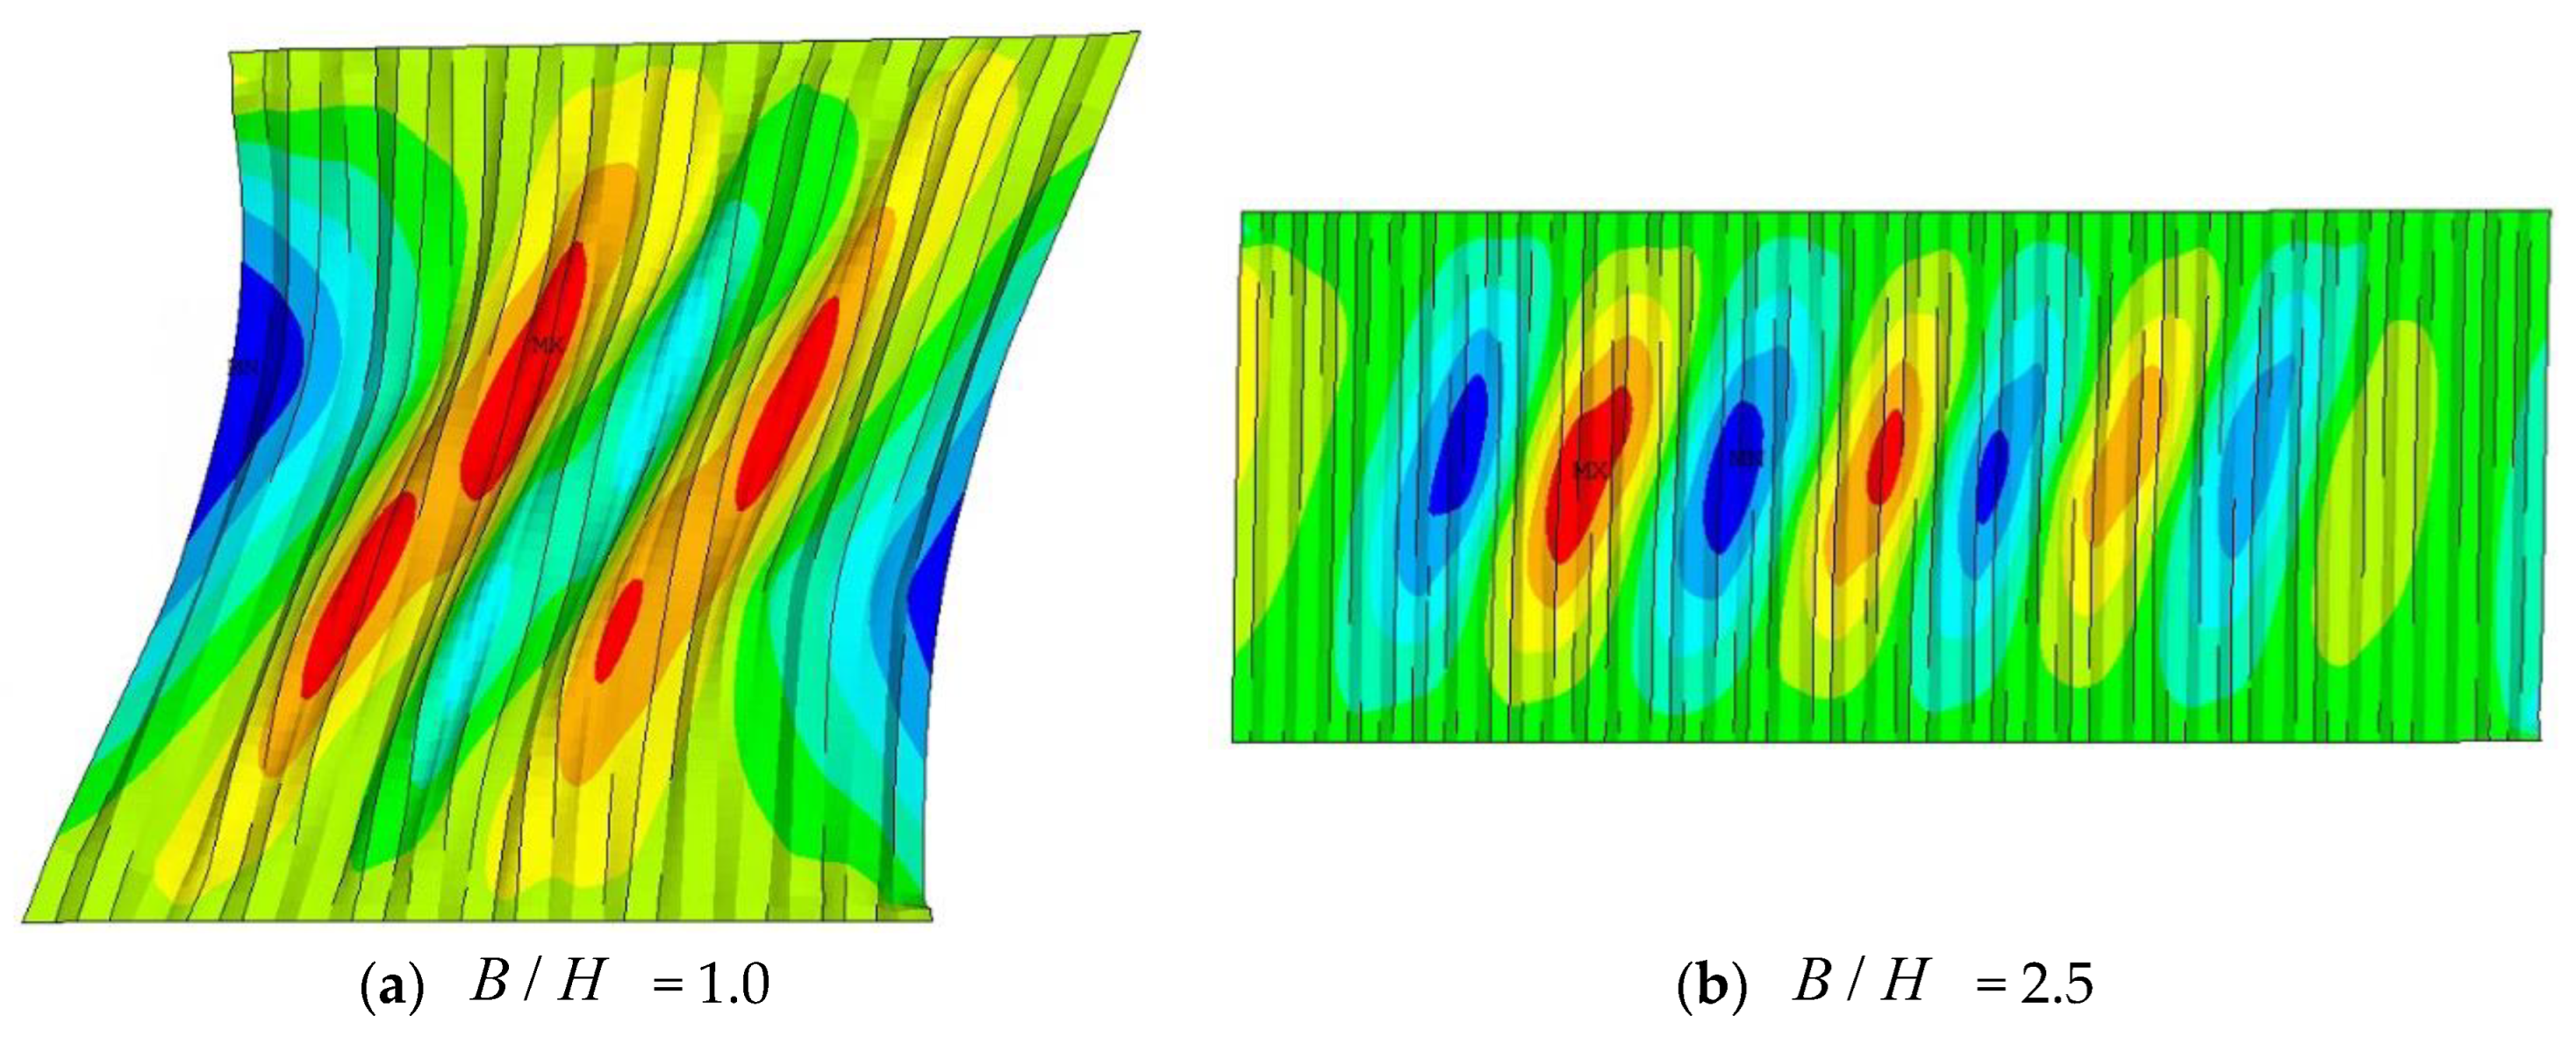
3.2. Aspect Ratio Effect

Five CboSPSW models with different aspect ratios, 0.5, 1.0, 1.5, 2.0, and 2.5 were developed to investigate the aspect ratio effect. In addition to these models, five CbcSPSWs specimens with same sizes of the CboSPSW models were also established to study the connections with beams only effect. The load–displacement curves and load versus out-of-plane displacement curves of the CboSPSWs are shown in Figure 12 and Figure 13, and the ultimate strength and initial stiffnesses of CboSPSWs and CbcSPSWs versus the height–thickness ratio curves are shown in Figure 14 and Figure 15.
From Figure 12 and Figure 13, the initial stiffnesses, ultimate loads of the CboSPSWs increase with the increase of the aspect ratio. In contrast with CbcSPSWs, the initial stiffnesses and ultimate loads of the CboSPSWs are lower than those of the CbcSPSWs. The more obvious the trend is, the larger the aspect ratio is. When the aspect ratio increases from 0.5 to 2.5, due to connections with beams only, the strength of the CSPs decreases in the range of 15–27% compared to those of the CbcSPSWs with the same parameters, shown in Figure 14. The initial stiffnesses of the CSPs decrease from 35% to 12% compared to those of the CbcSPSWs with the same parameters, shown in Figure 15. When the aspect ratio is greater than 2.0, the decrease rate of strength increases significantly, and it is suggested that the aspect ratio should be controlled less than 2.0.
The out-of-plane displacement of the CboSPSWs with aspect ratio B / H = 1.0 and 2.5 are shown in Figure 16. It shows that the tension field of the CSP in the CboSPSW with aspect ratio B / H = 1.0 develops more fully than that of the CboSPSW with aspect ratio B / H = 2.5. The inclination angles of the tension field of the CboSPSWs are about 60°.

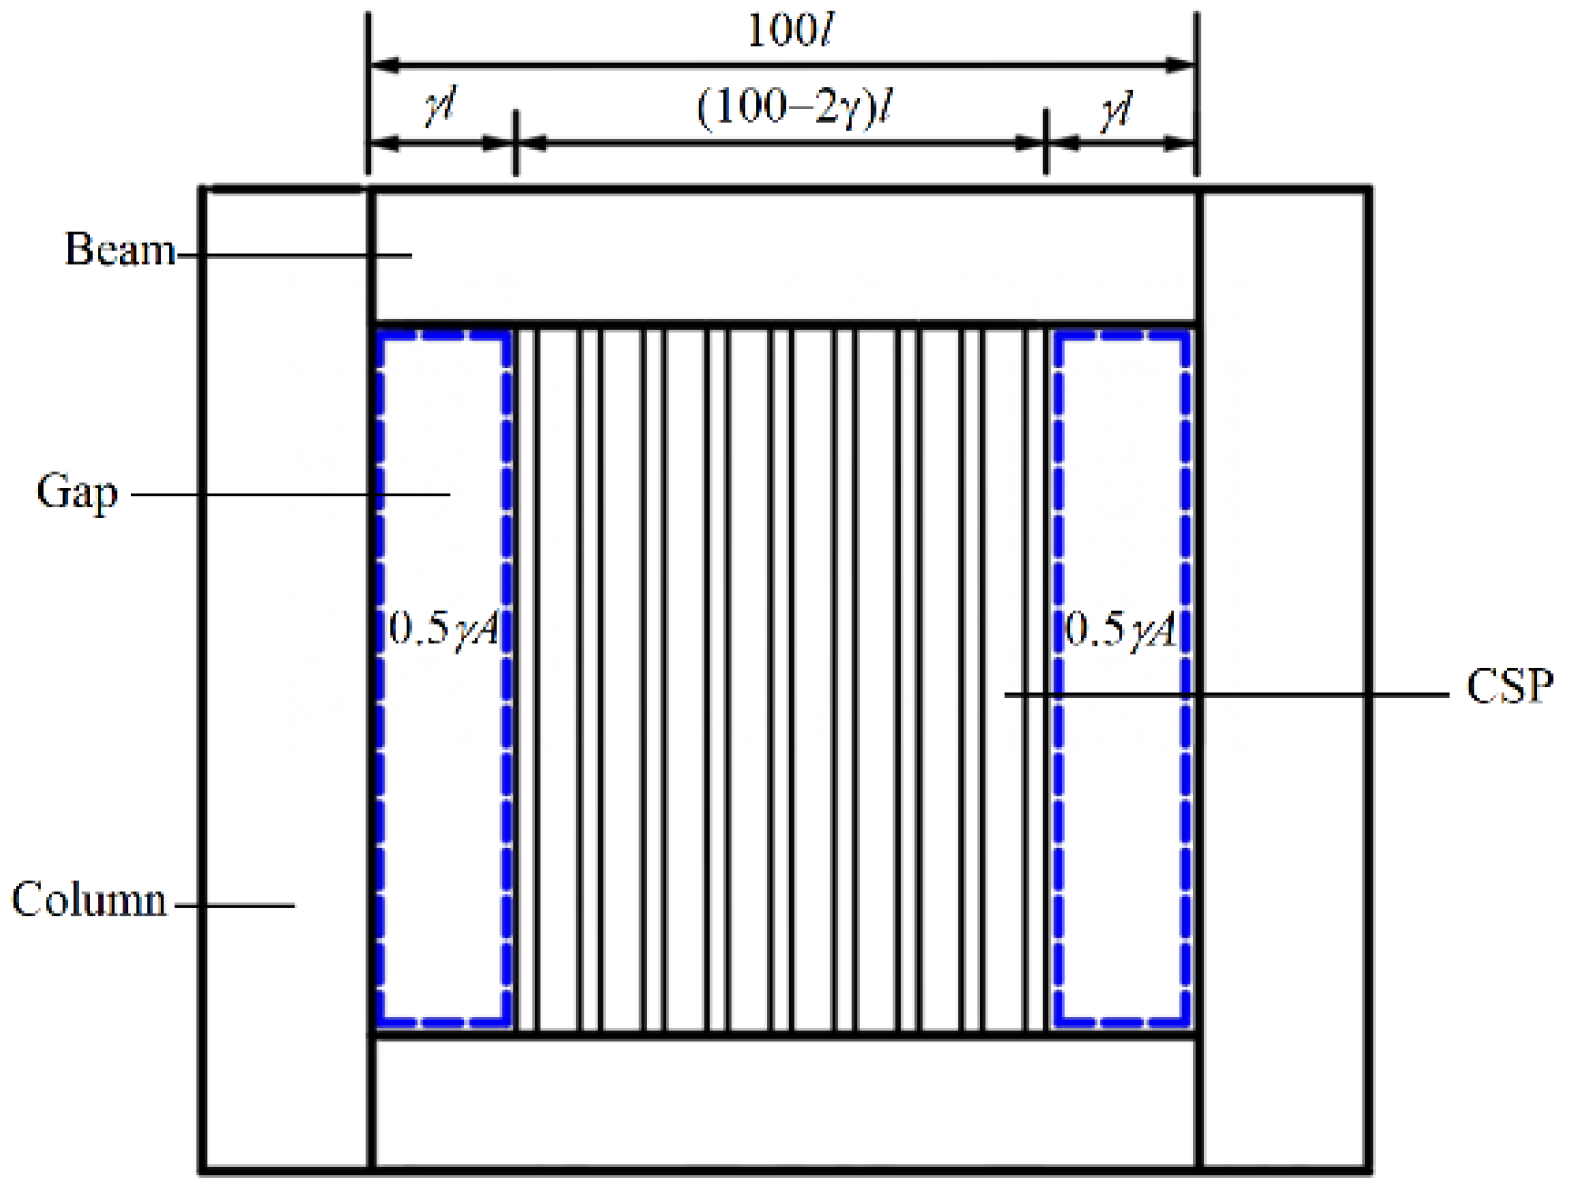
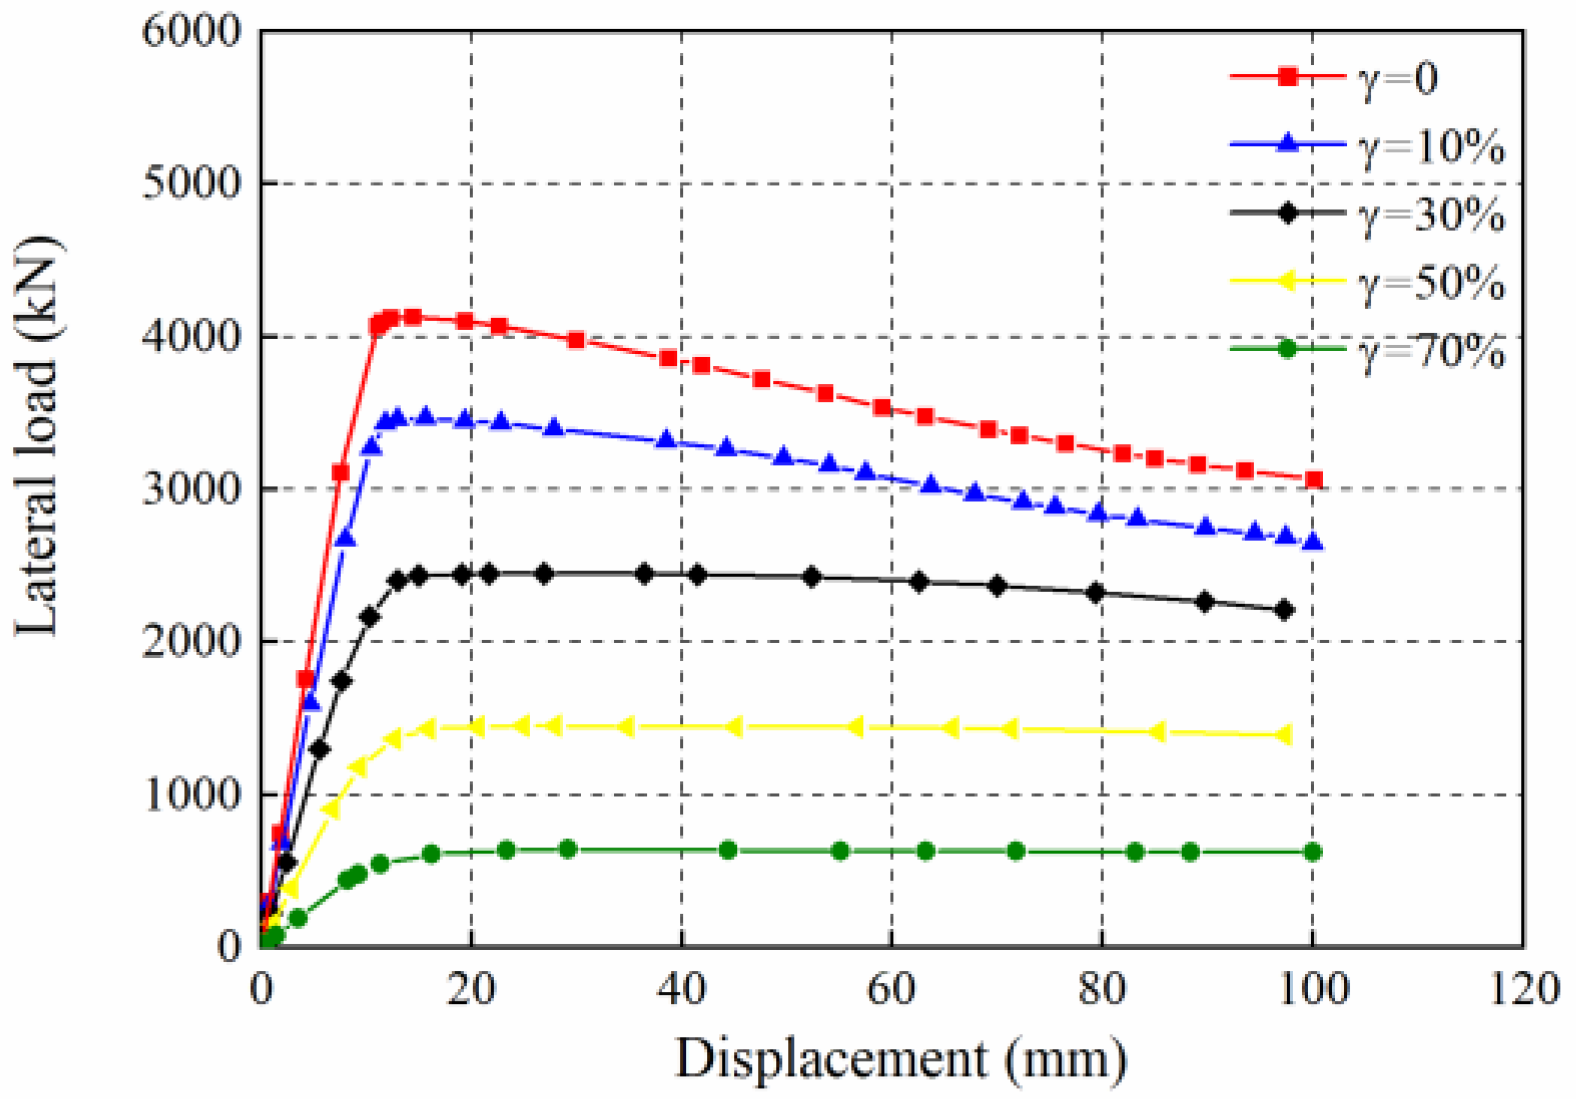
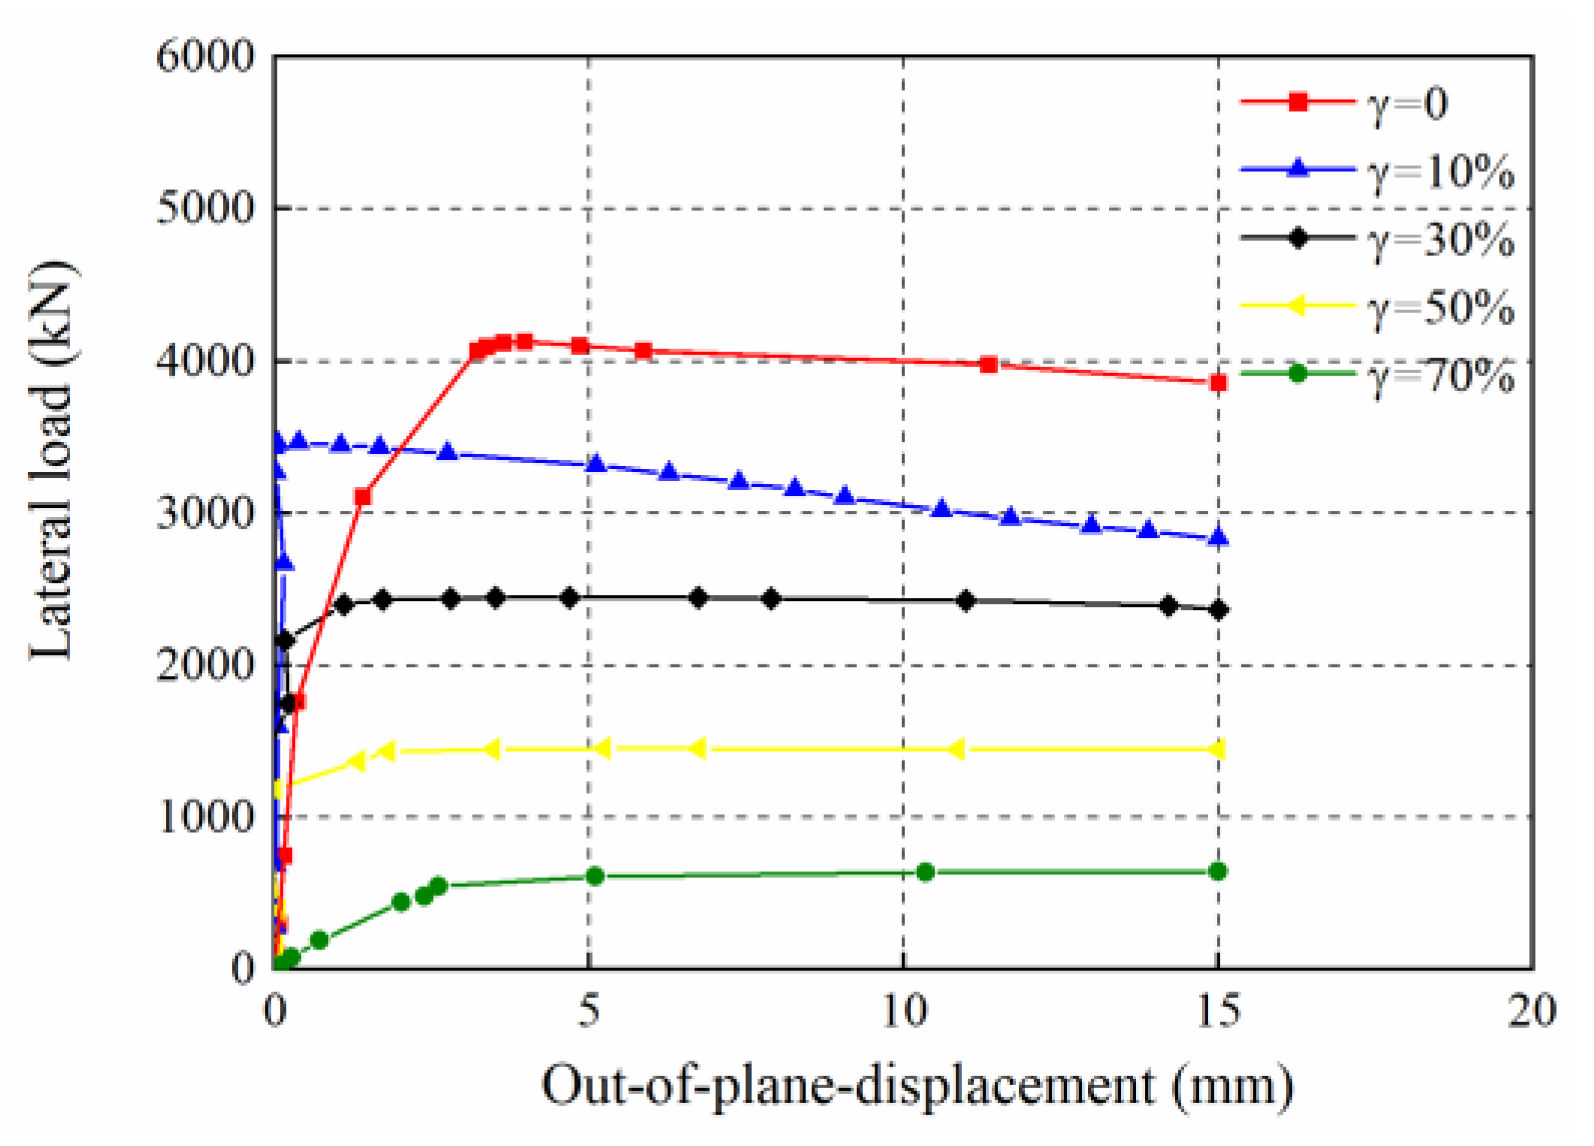
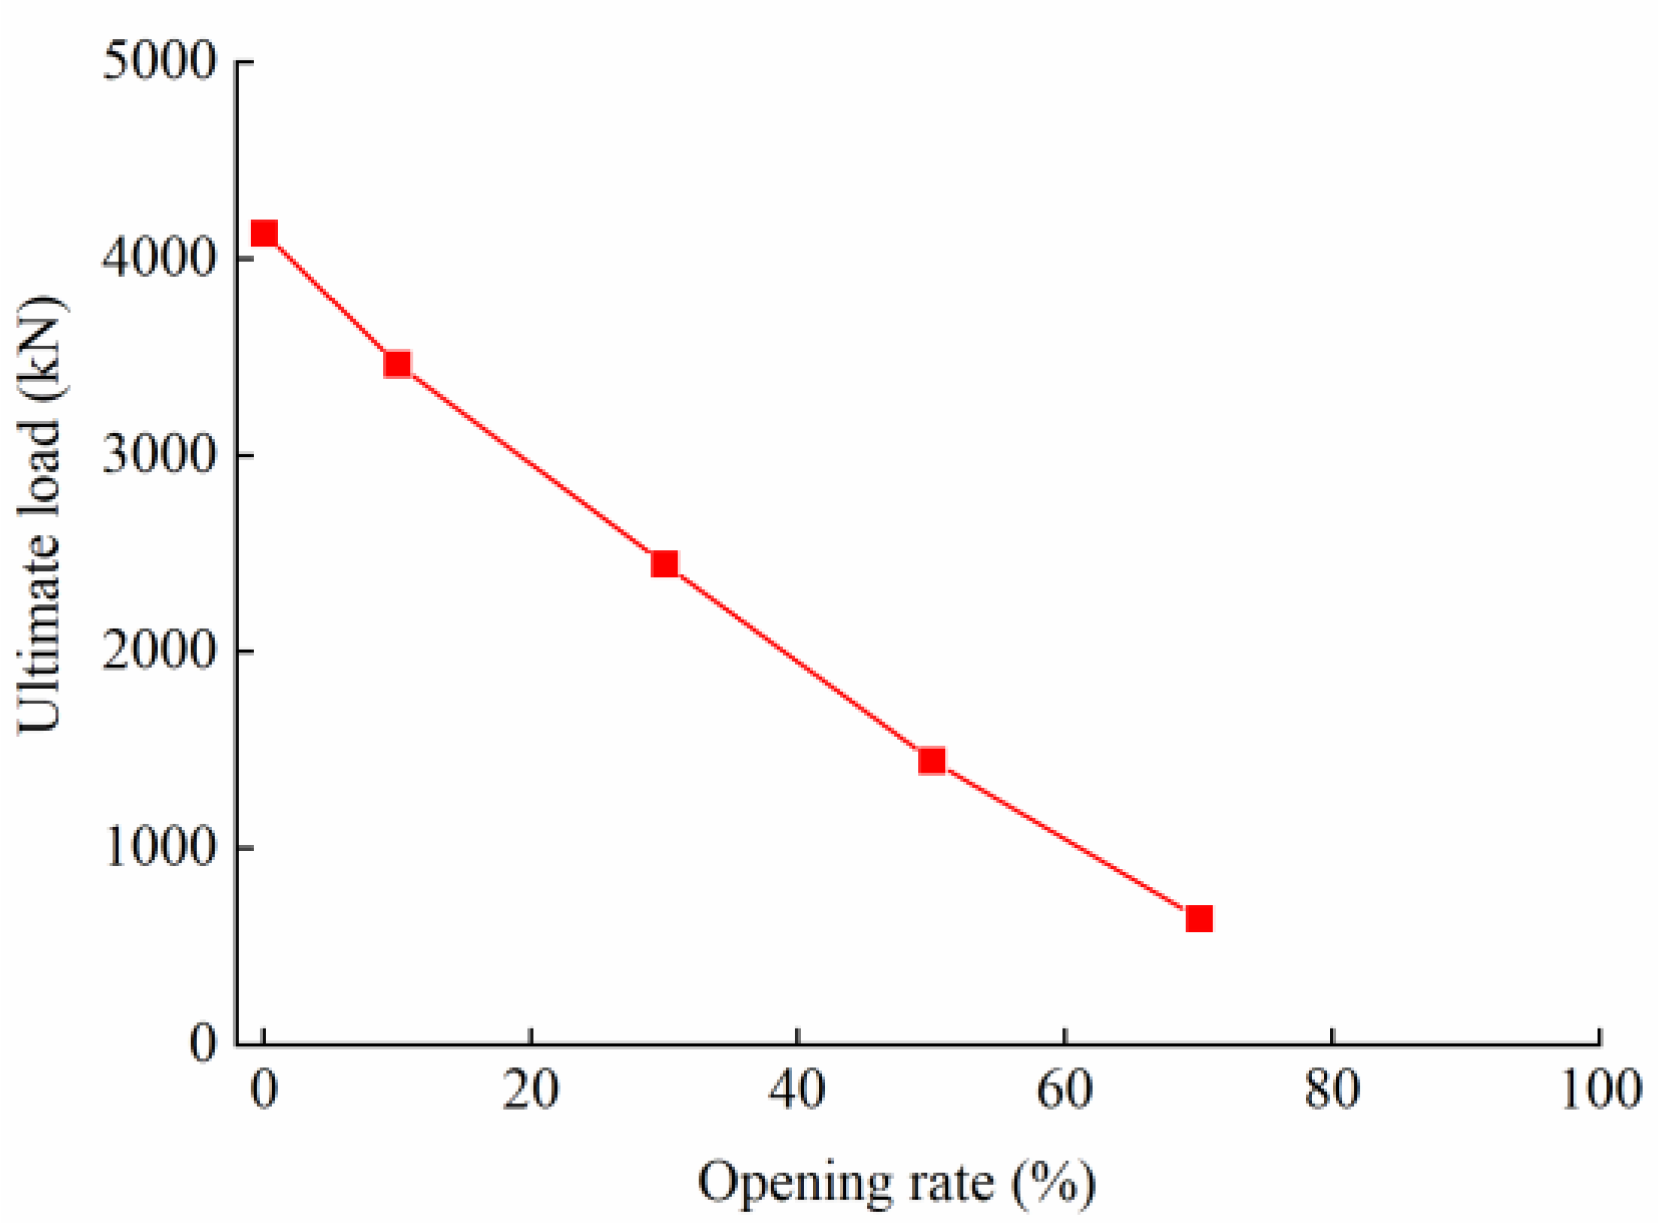
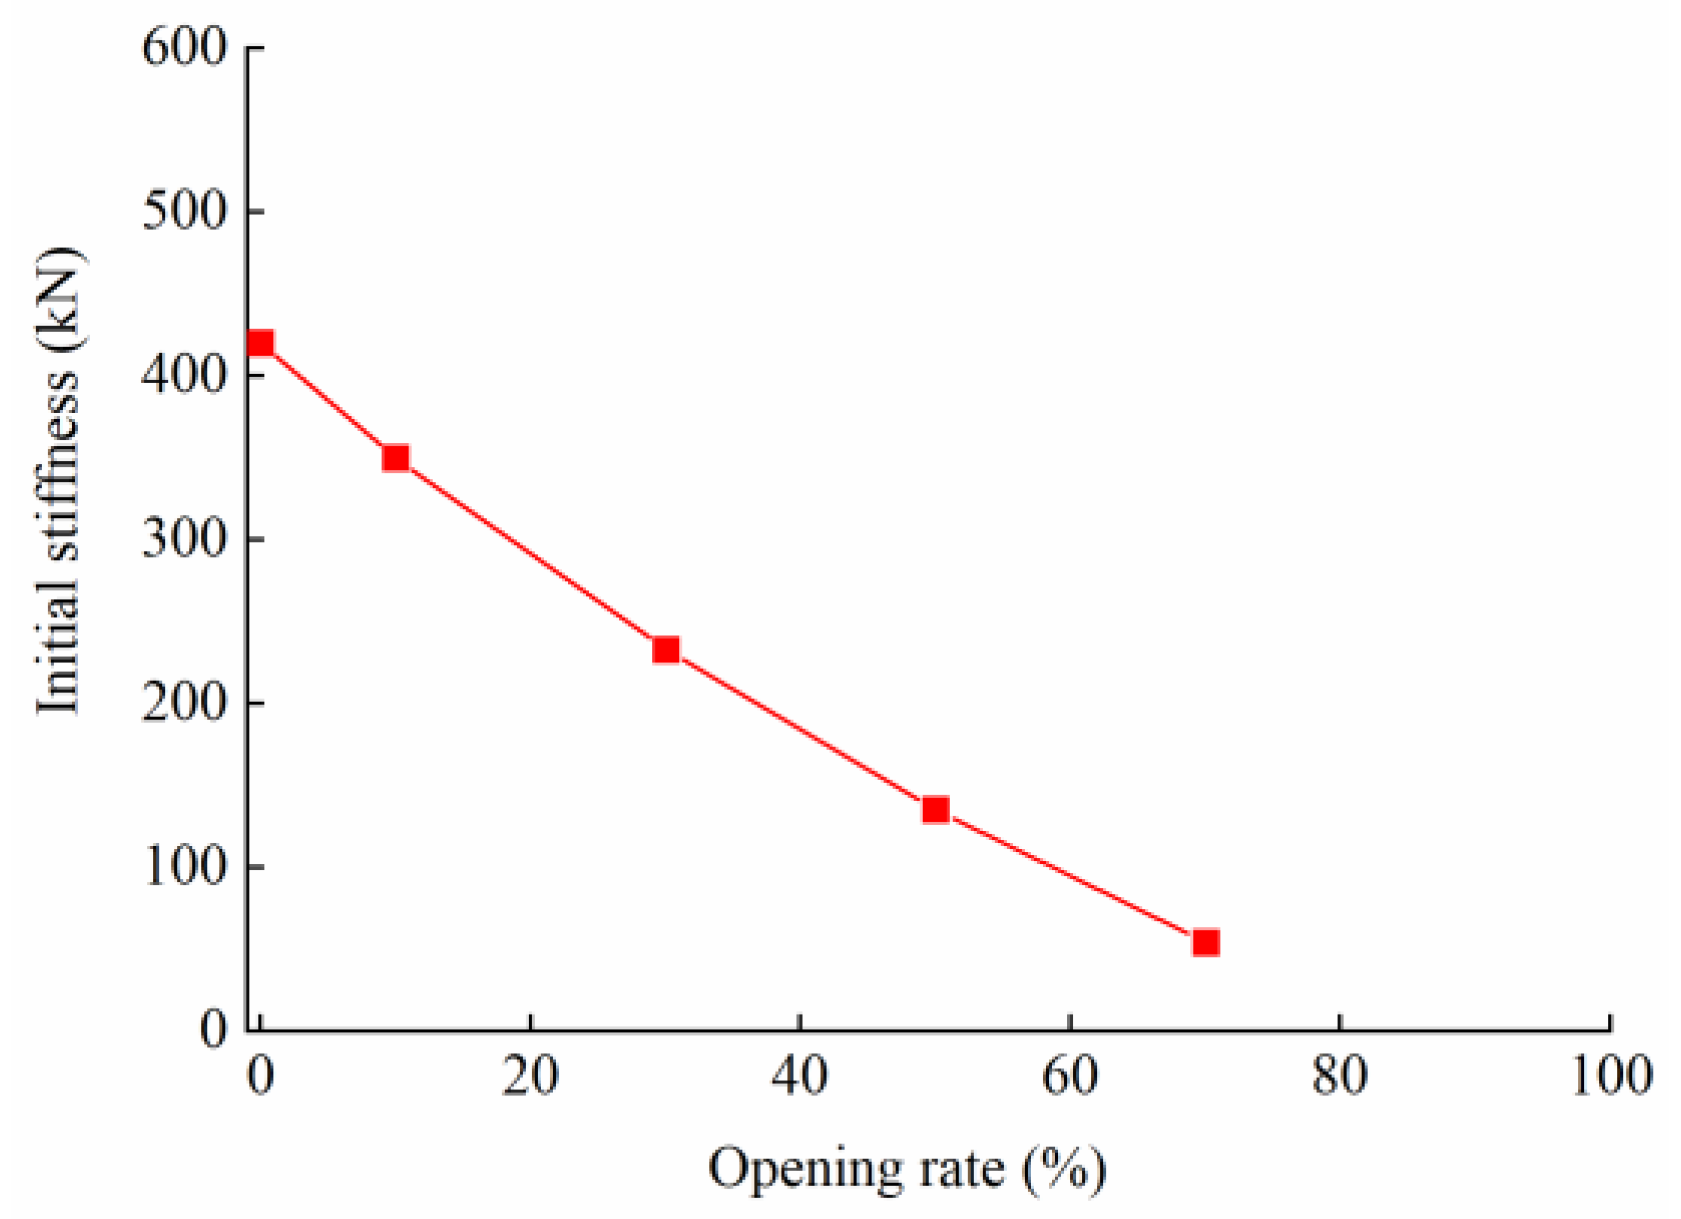
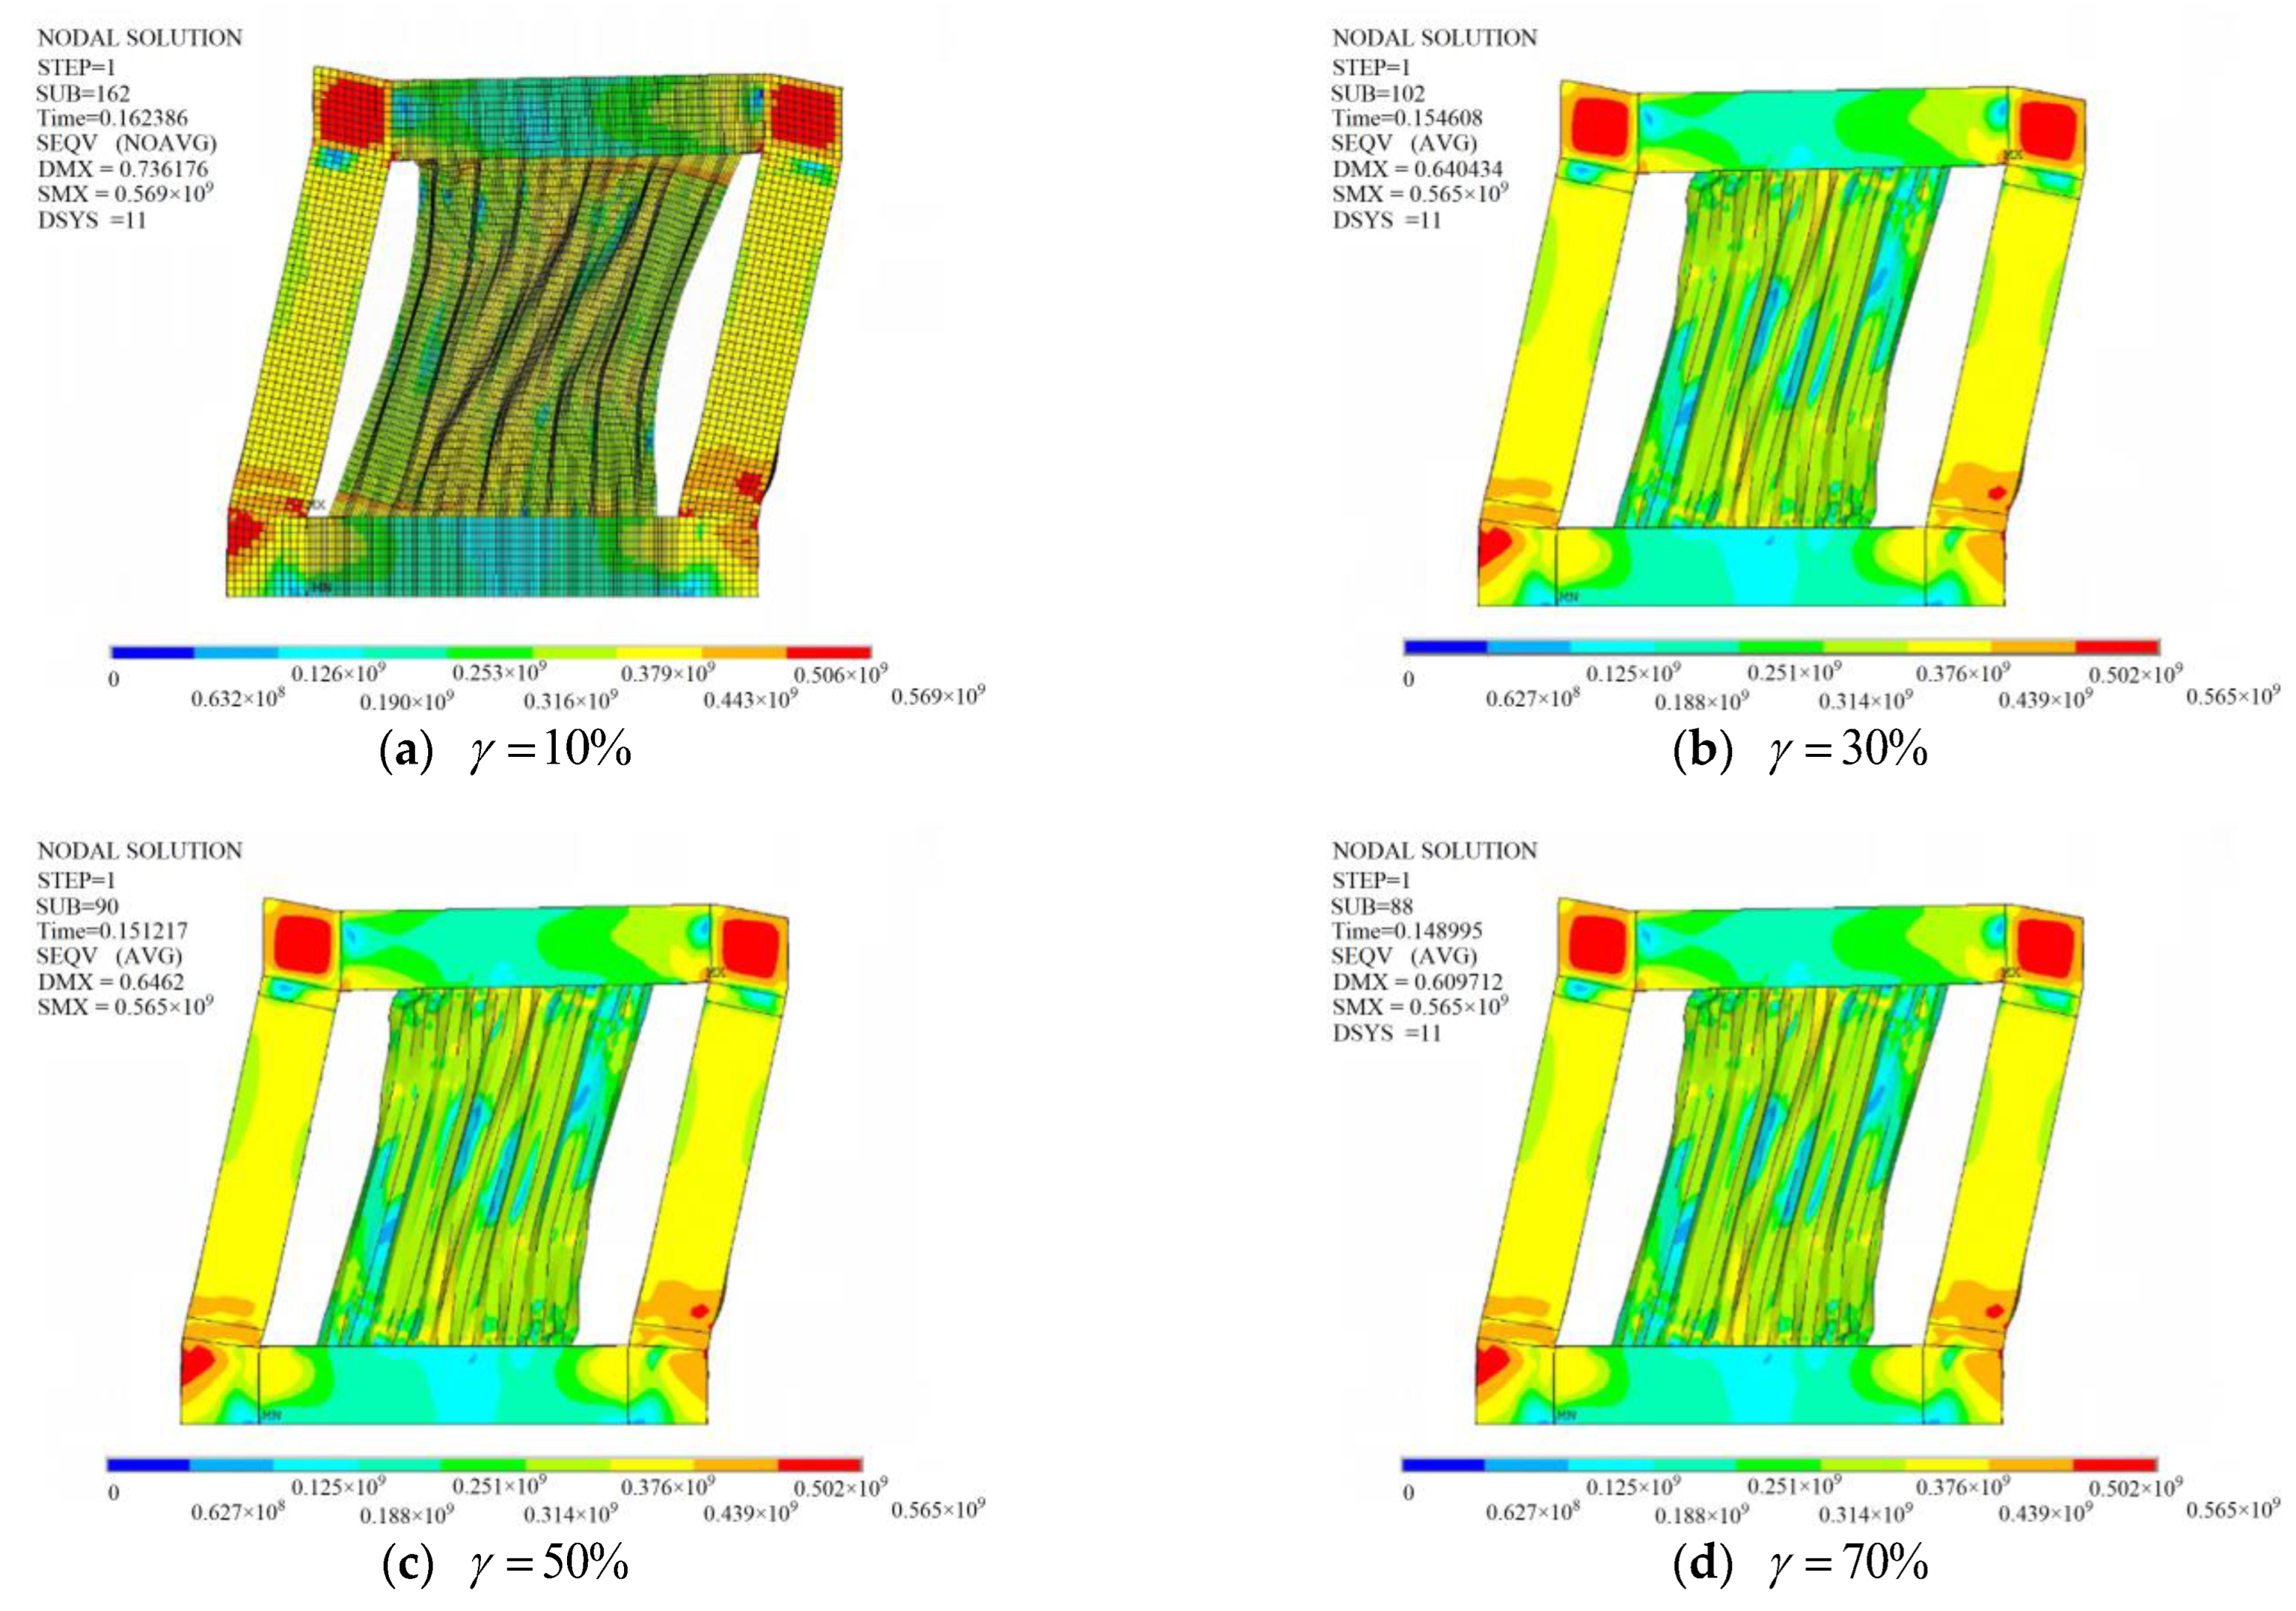
3.3. Opening Rate Effect

In order to investigate the opening rate effect, five CboSPSWs with different opening rates 0, 10%, 30%, 50%, and 70%, were developed. In these models, the areas of the CSPs remain unchanged. The shapes and positions of the openings of the CSPs in these CboSPSWs are shown in Figure 17. The detailed parameters of these models are shown in Table 2. The opening rate γ is the ratio of the opening area A o to the whole area of the CSP area A , which can be expressed as:
γ = A o A × 100 %
The load–displacement curves of the shear walls are shown in Figure 18, and the load versus out-of-plane displacement curves are shown in Figure 19. As it can be seen, the initial stiffnesses and ultimate loads of the CboSPSWs decrease with the increase of the opening rate.
From Figure 20 and Figure 21, the ultimate loads and initial stiffnesses of CSPs have a linear decreasing relationship with the opening rate. Therefore, the opening rate of CSPs should be controlled in the design of the CboSPSWs. The ultimate shear loads of the CSPs in the CboSPSWs V o with different opening rates can be obtained as:
V o = ( 1 γ ) V c b o
where the V c b o is the ultimate shear load, γ is the opening rate.
The failure modes of the CboSPSWs with different opening rates are shown in Figure 22. Figure 22 shows that with the decrease of the opening rate, the tension field develops more fully. When the opening rate is small, the CSP mainly shows the shear performance. However, when the opening rates are 50% and 70%, the CSPs show bending and compressive performance, which are similar to performance of the columns.

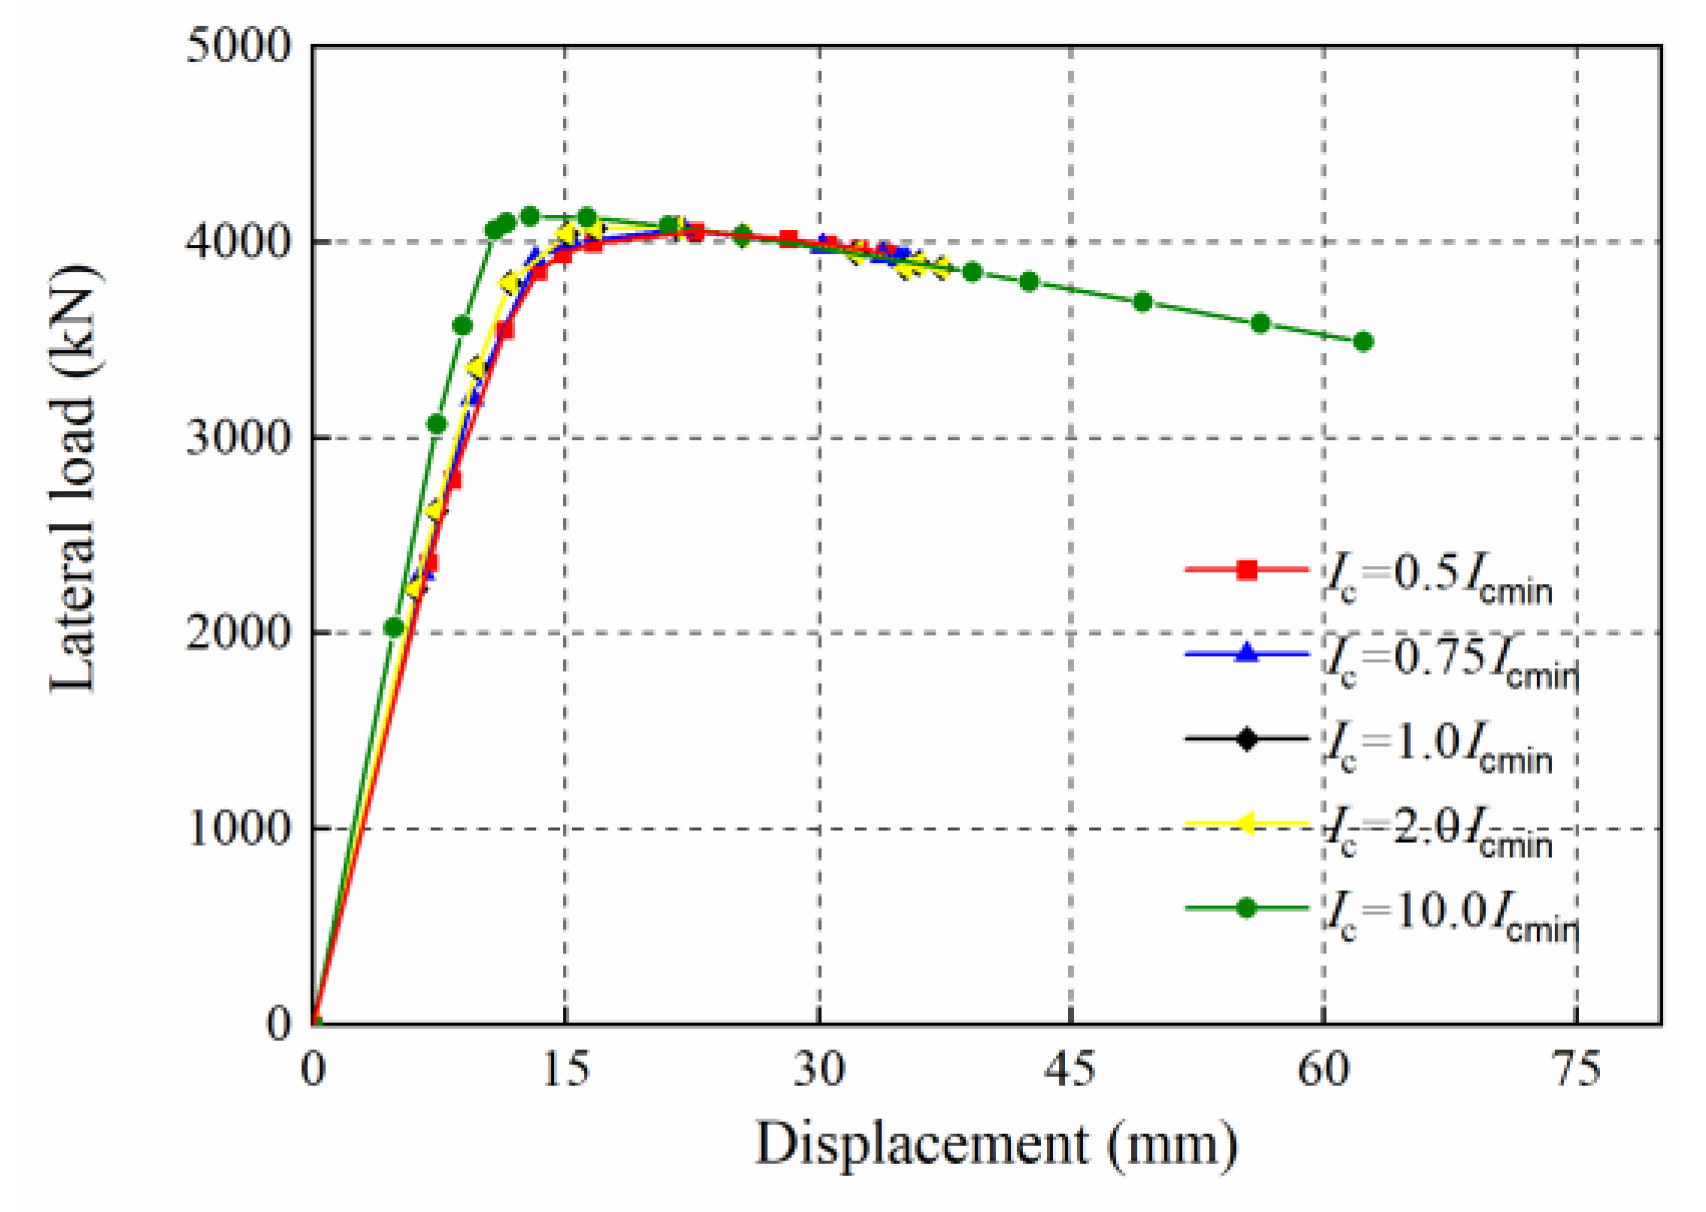
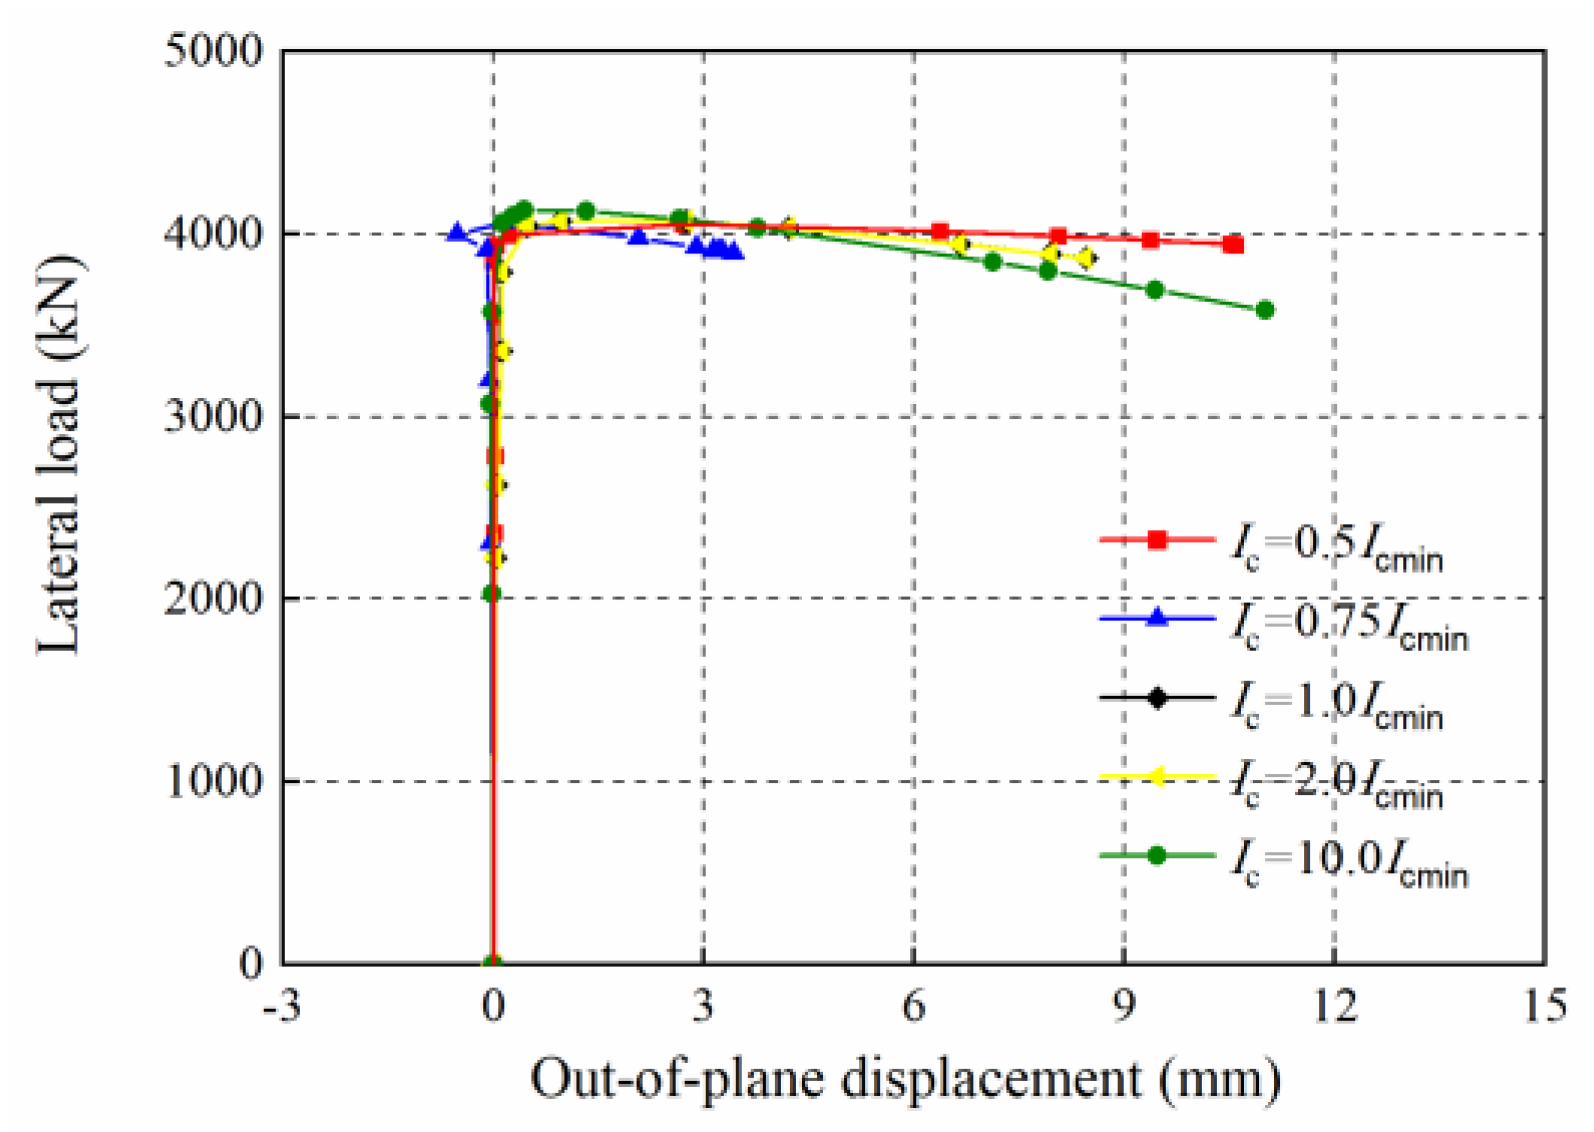
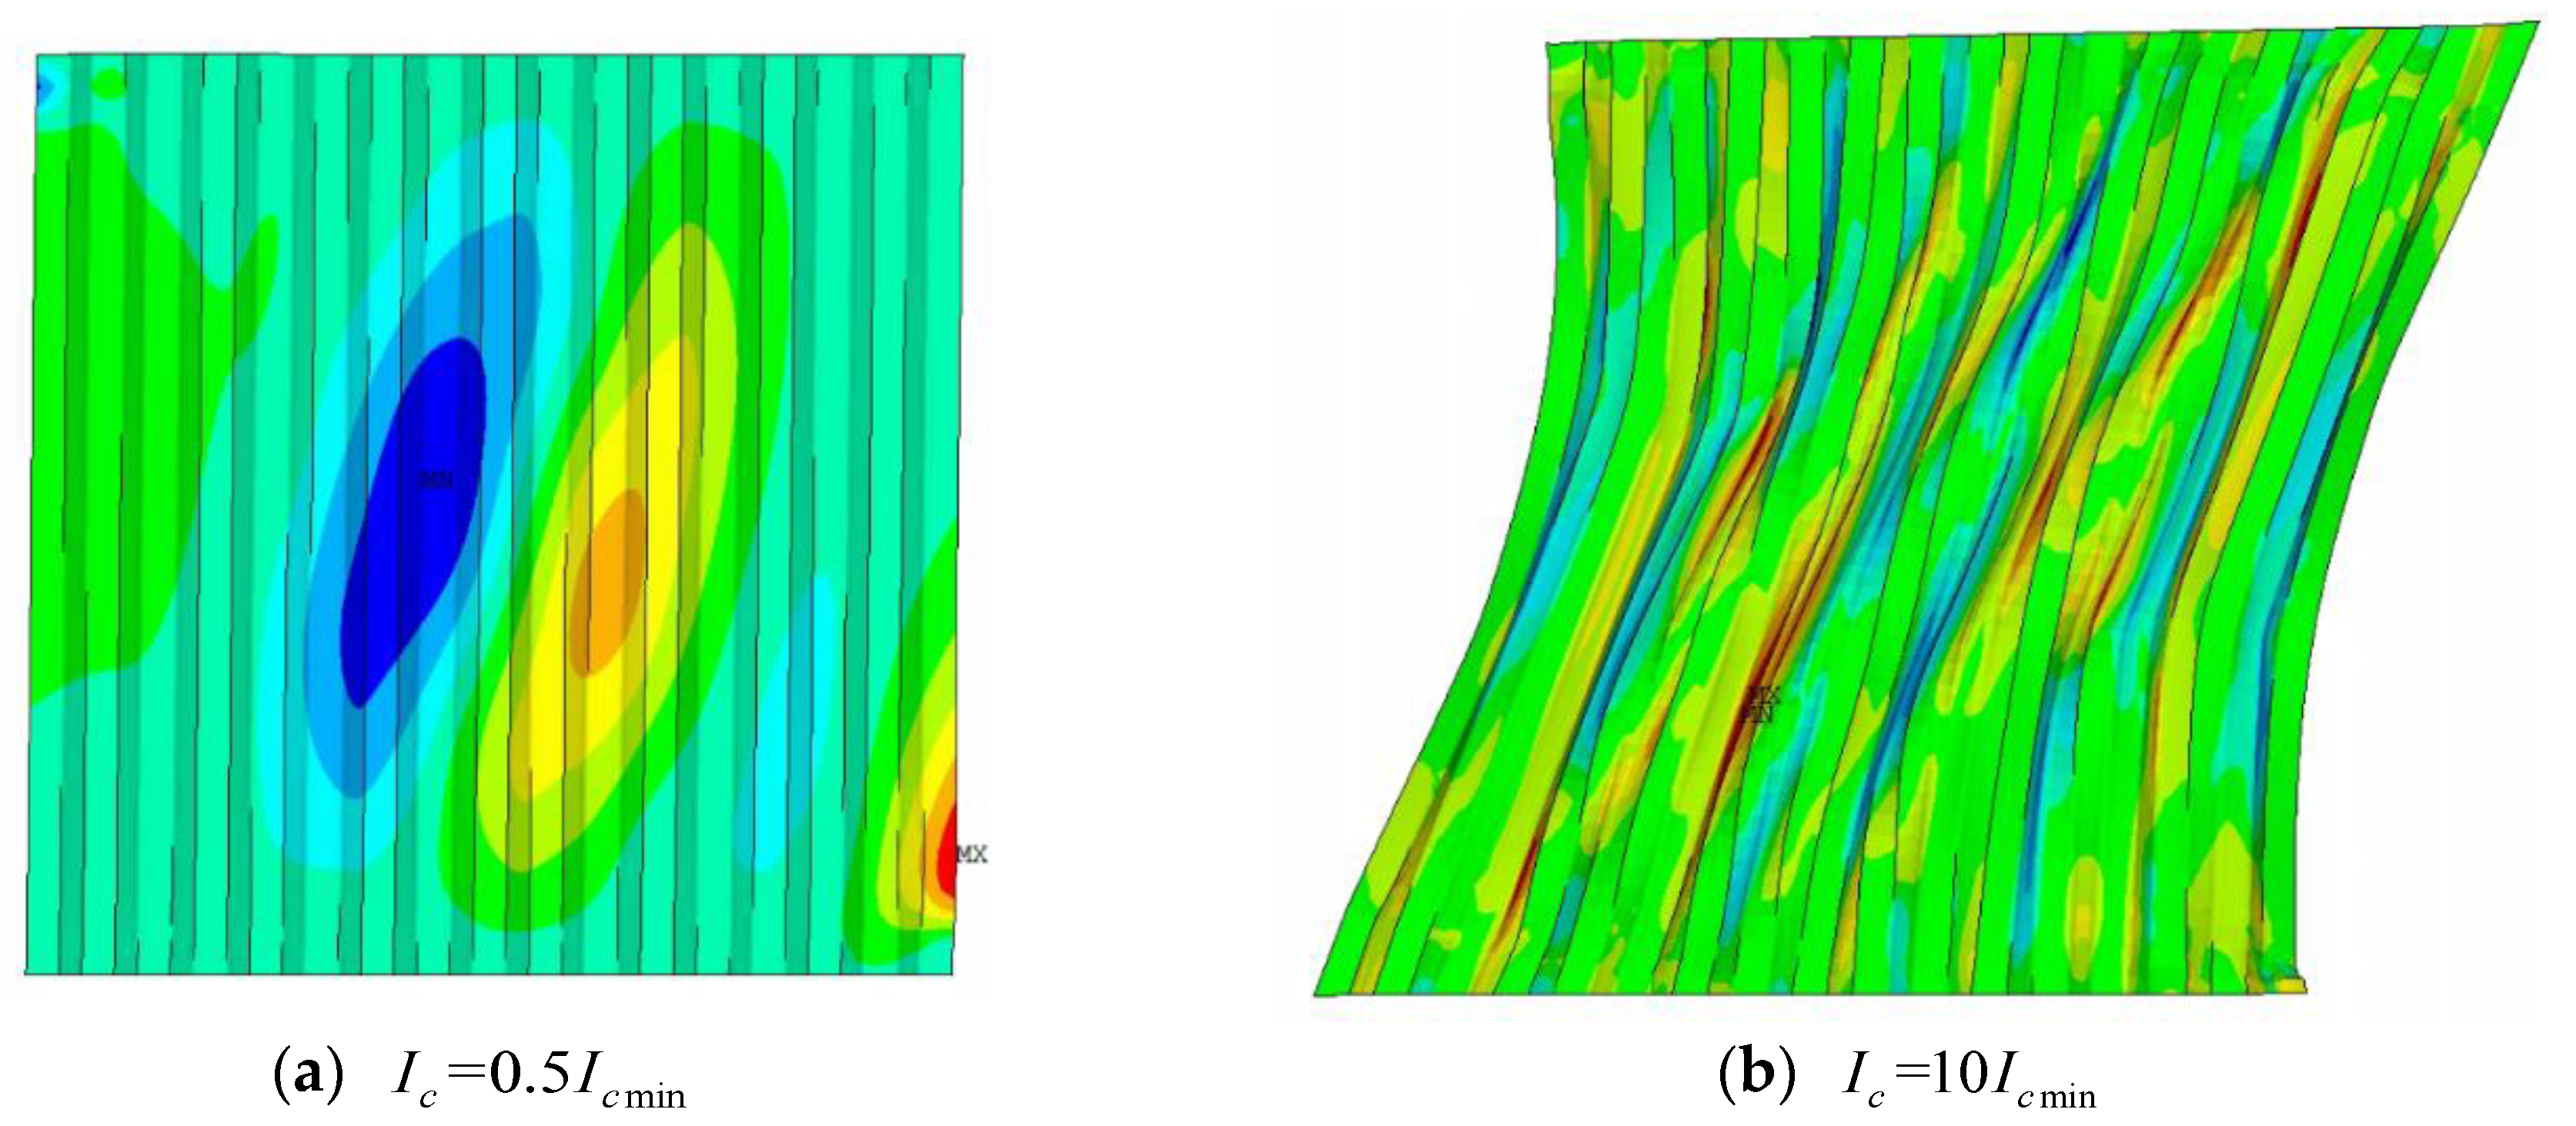
3.4. Surrounding Frame Stiffness Effect

The surrounding columns provide constraints for buckling strength and development of tension field of the infilled plates. In the FSPSWs, in order to provide enough constraints for the infilled plates, the minimum area moments of inertia for the surrounding columns I c min can be expressed [34,35,36]:
I c min 0.0031 t w d c 4 / d b
where t w is the thickness of infilled plates, d c is the center-to-center distance between adjacent columns, and d b is the center-to-center distance between adjacent beams.
The minimum area moment of inertia for the surrounding column, Equation (3), is obtained by the relationship between the area moment of inertia and the development of the shear stress of the CSP near the connected beams. With an increase of the stiffness of the surrounding column, the tension field tends to develop more fully. When the changes of the average shear stress of the CSP sections near the beams are less than 20% [34], the corresponding area moment of inertia is the minimum value, shown in Equation (3). However, the CboSPSWs have connections with beams only, which are different from those of the FSPSWs. Therefore, the surrounding column stiffness effect on the buckling strength and the tension field and of CSPs should be discussed.
In order to discuss the surrounding columns stiffness effect on the shear performance of the CboSPSWs, five CboSPSW specimens with different area moments of inertia, 0.5 I c min , 0.75 I c min , 1.0 I c min , 2.0 I c min , and 10 I c min were developed. The detailed parameters of the columns are shown in Table 1. The shear loads of the CSPs near the connected beams versus the lateral displacement curves of the CboSPSWs are shown in Figure 23, and the load versus out-of-plane displacement curves are shown in Figure 24.
From Figure 23 and Figure 24, the buckling and ultimate loads increase with the increase of the column stiffness. When the column stiffness reaches 0.5 I c min , the shear loads of the CSPs near the connected beams versus displacement curves and buckling load tend to be stable. The failure modes of the CboSPSWs with the column stiffness 0.5 I c min and 10.0 I c min are shown in Figure 25. The tension field of the latter develops more fully than that of the former one. The inclination angles of the tension field are approximately 60°.

4. Simplified Analytical Model

The plate–frame interaction (PFI) [37] and strip [38] models are the common elasto-plastic analysis methods for seismic or nonlinear analyses for shear walls. Due to the characteristics of connections, the equivalent strip model [39] can take two sides connections of infilled plates (CSPs connected with beams only) into consideration, shown in Figure 26. The gaps between the CSPs and columns could be simulated by the length l g in the equivalent strip model.
The stress–strain relationship of the tension member adopted the trilinear model, and the compression member adopted the bilinear model, shown in Figure 27.
The inclination angles of the tension and compression members are expressed as:
α = a r tan ( d b B )
where d b is the center-to-center distance between adjacent beams, B is the CSP width.
The initial stiffness of the CSP K c can be expressed as [40]:
K c = ψ K w
ψ = 0.014 ln ( B / H w ) 0.118 ln ( λ ) + 1.24
λ = H w t w f y 235
K w = G t w B ξ H w
where ψ presents the reduction coefficient of the lateral stiffness of CSP, f y is the yield stress of the CSP, λ is the height–thickness ratio, G is the shear modulus of the CSP, d is the height of the CSP, B is the CSP width, ξ is the shear uniformity coefficient along the width of the CSP, ξ = 1.2.
The section areas of the tension and compressive members in the model A l can be obtained as:
A l = K w 2 E c c o s 3 α
where E c is the elastic modulus of the CSP material.
The yield stress of the tension member σ y t can be expressed as:
σ y t = V y t w E w cos 2 α K w B
V y t w = τ y B t w
where V y t w presents the yield load of the CSP, τ y is the yield stress of the CSP.
The corresponding yield strain of the tension member ε y t can be calculated as:
ε y t = Δ y t w cos 2 α B
Δ y t w = V y t w K w
The yield stress of the compression member σ y c can be expressed as:
σ y c = V y c w E w cos 2 α K w B
V y c w = τ y c w B t w
where V y c w is the ultimate compressive load of the CSP, τ y c w is the compressive strength of the CSP.
Compared with CbcSPSWs, the compressive capacities of the CSPs decrease due to the two sides connections. In the model, the yielding load of the compressive member adopted the buckling load of the flat steel plate shear wall with two sides connections. The compressive shear strength of the CSP with two sides connections τ y c w can be obtained as [39]:
τ y c w = [ 0.2 ln ( B / H w ) 0.05 ln ( λ ) + 0.68 ] f v ]
where λ is height–thickness ratio of the CSP, f y is the shear yield strength of the CSP material, f v is the ultimate shear strength of the CSP material.
The corresponding yield strain of the tension member ε y c can be calculated as:
ε y c = Δ y c w cos 2 α E c B
Δ y c w = V y c w K w
The yield stress of the tension member σ y c can be expressed as:
σ u c = V u t w E w cos 2 α K w B
The displacement corresponding to the ultimate load of the CSP Δ u t w can be obtained as:
Δ u t w = Δ y t w + ( τ u τ y ) B t w 0.1 K w
The strain corresponding to the ultimate load of the tension member ε u t can be calculated as:
ε u t = Δ u t w cos 2 α B
The elastic modulus of the tension member E t can be obtained as:
E t = σ u t σ y t Δ u t Δ y t
The load–displacement curves obtained by the equivalent strip model and the CboSPSW FE model with test [31] are shown in Figure 28. The comparison of the curves shows that the modified equivalent strip model can simulate the shear behavior of the CboSPSW well.

5. Conclusions

This paper presents numerical investigations on the shear performance of CboSPSWs. A numerical model for the CboSPSW was developed, and parametric analysis was carried out to study the height ratio, aspect ratio, opening rate, and surrounding frame stiffness effect on the shear performance of the shear walls. In addition, a simplified model for the CboSPSW was developed to simplify the elasto-plastic analysis. The main conclusions are as follows:
(1)
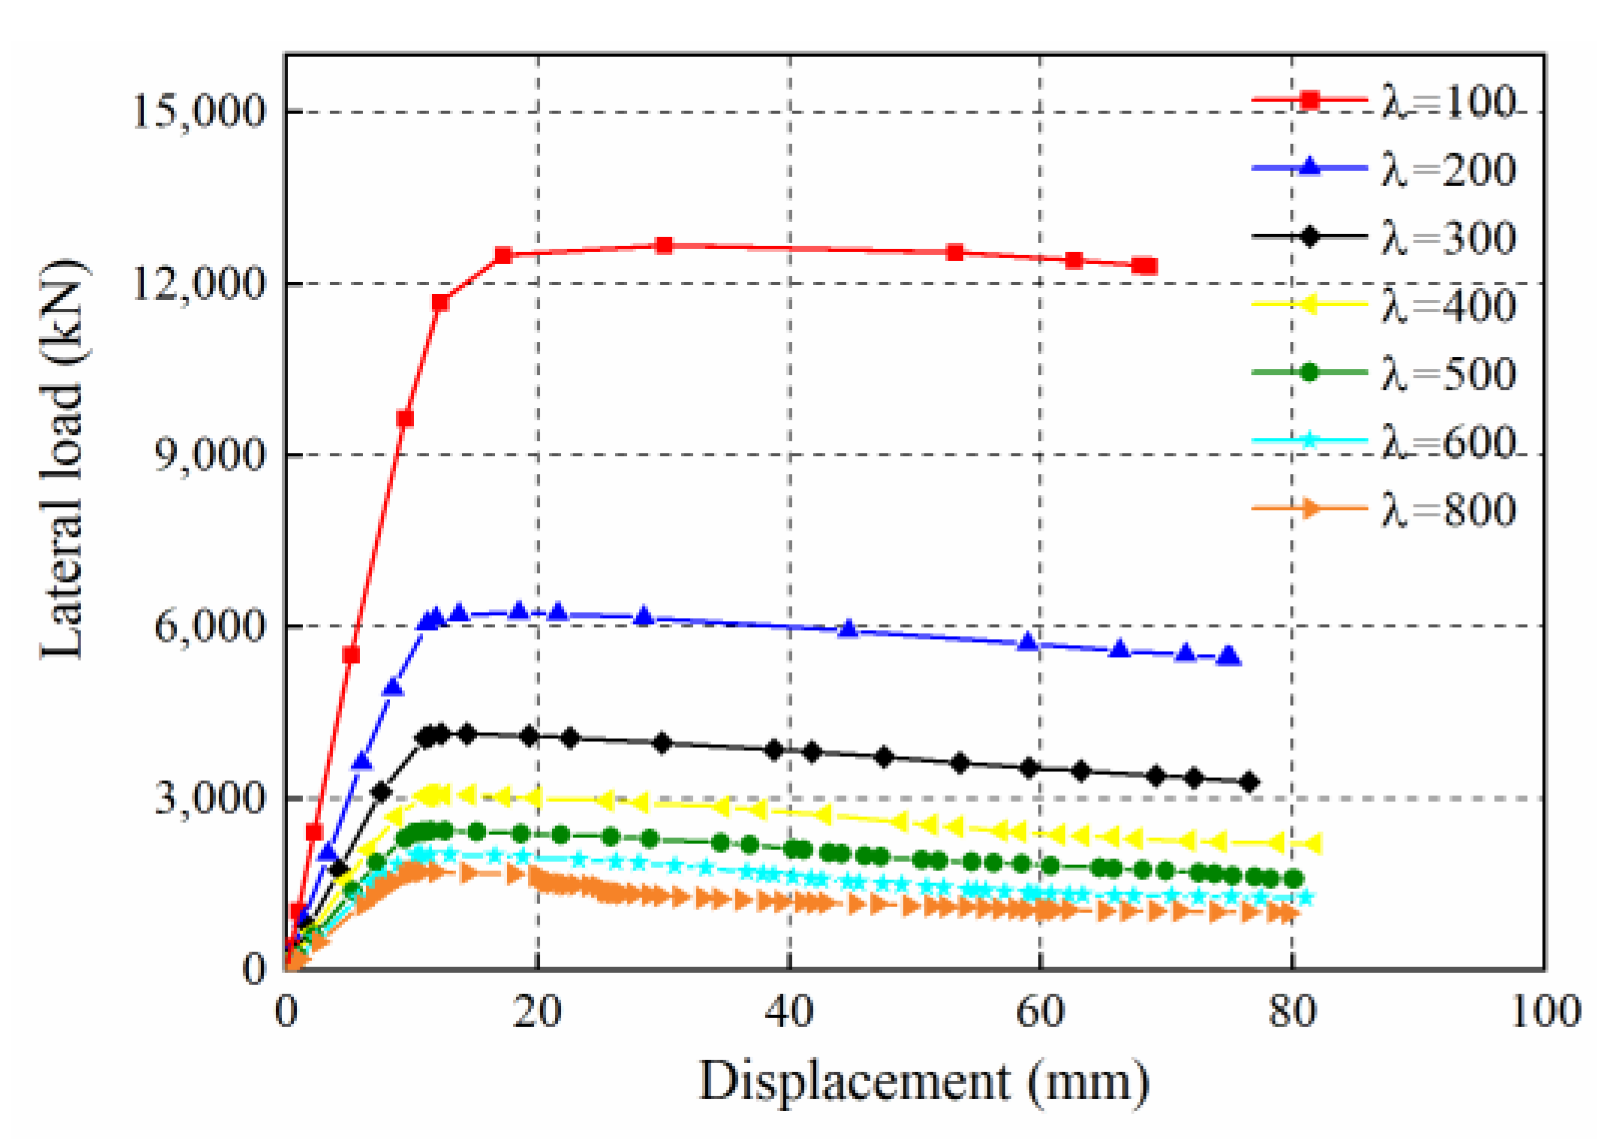
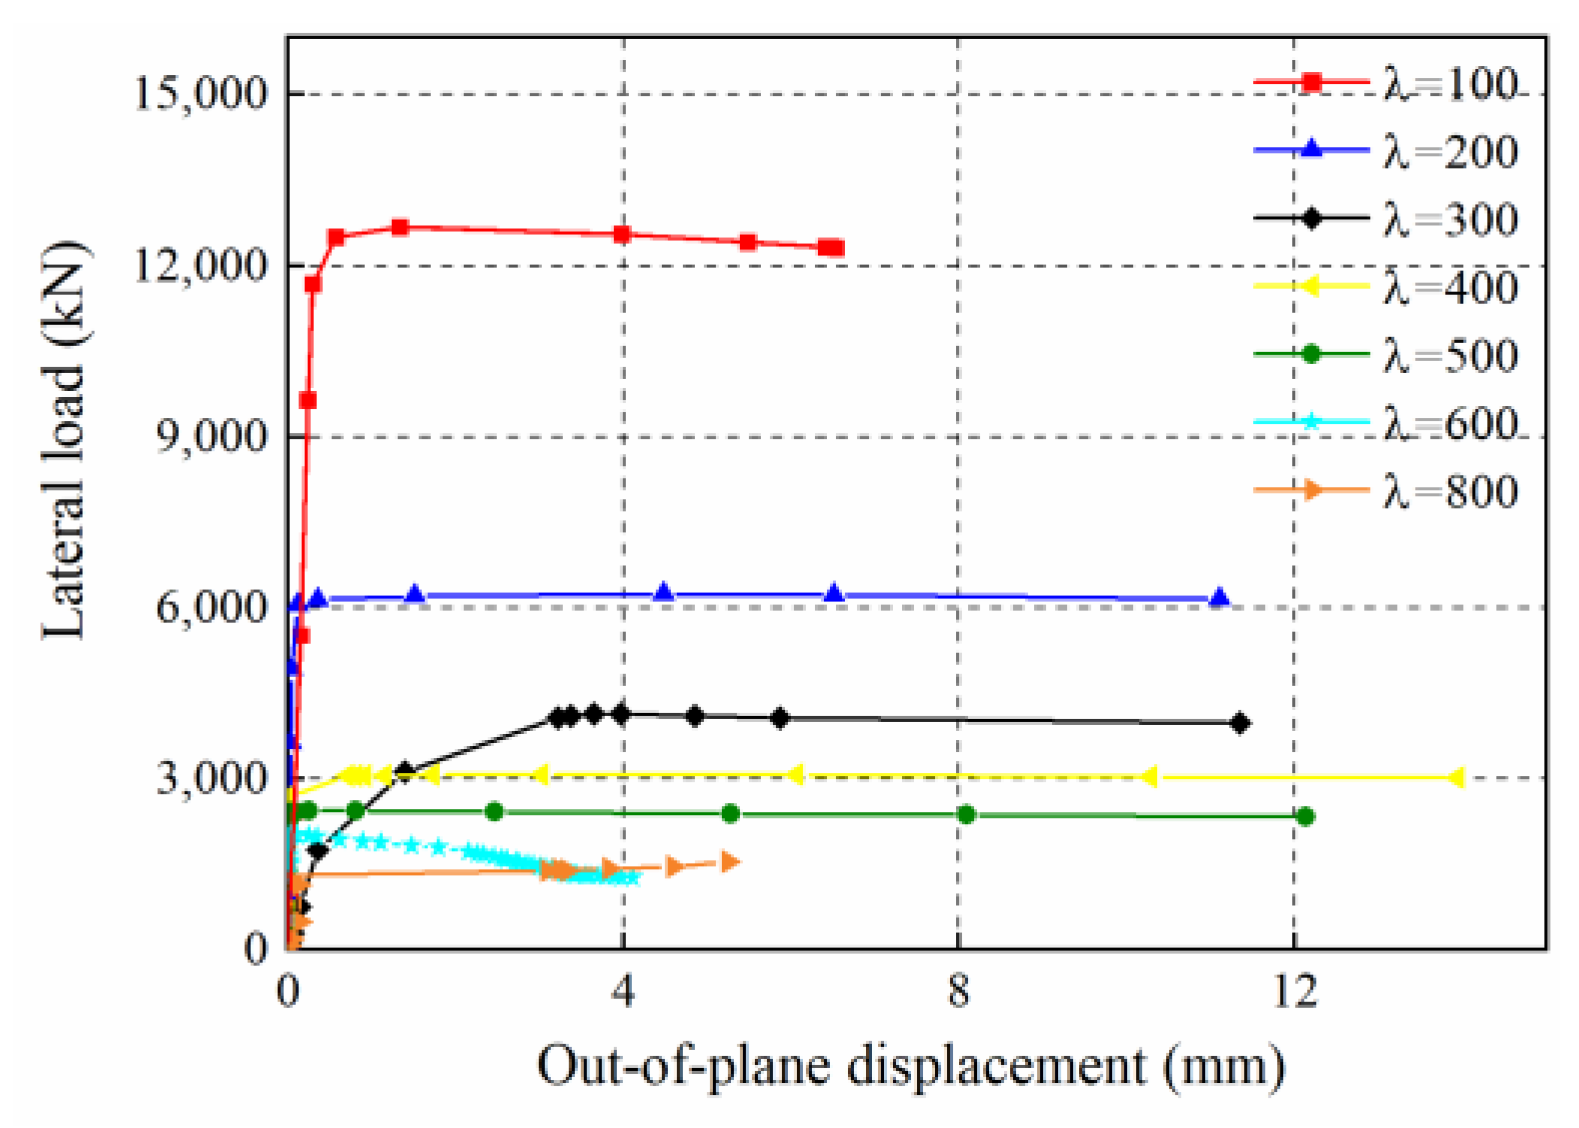
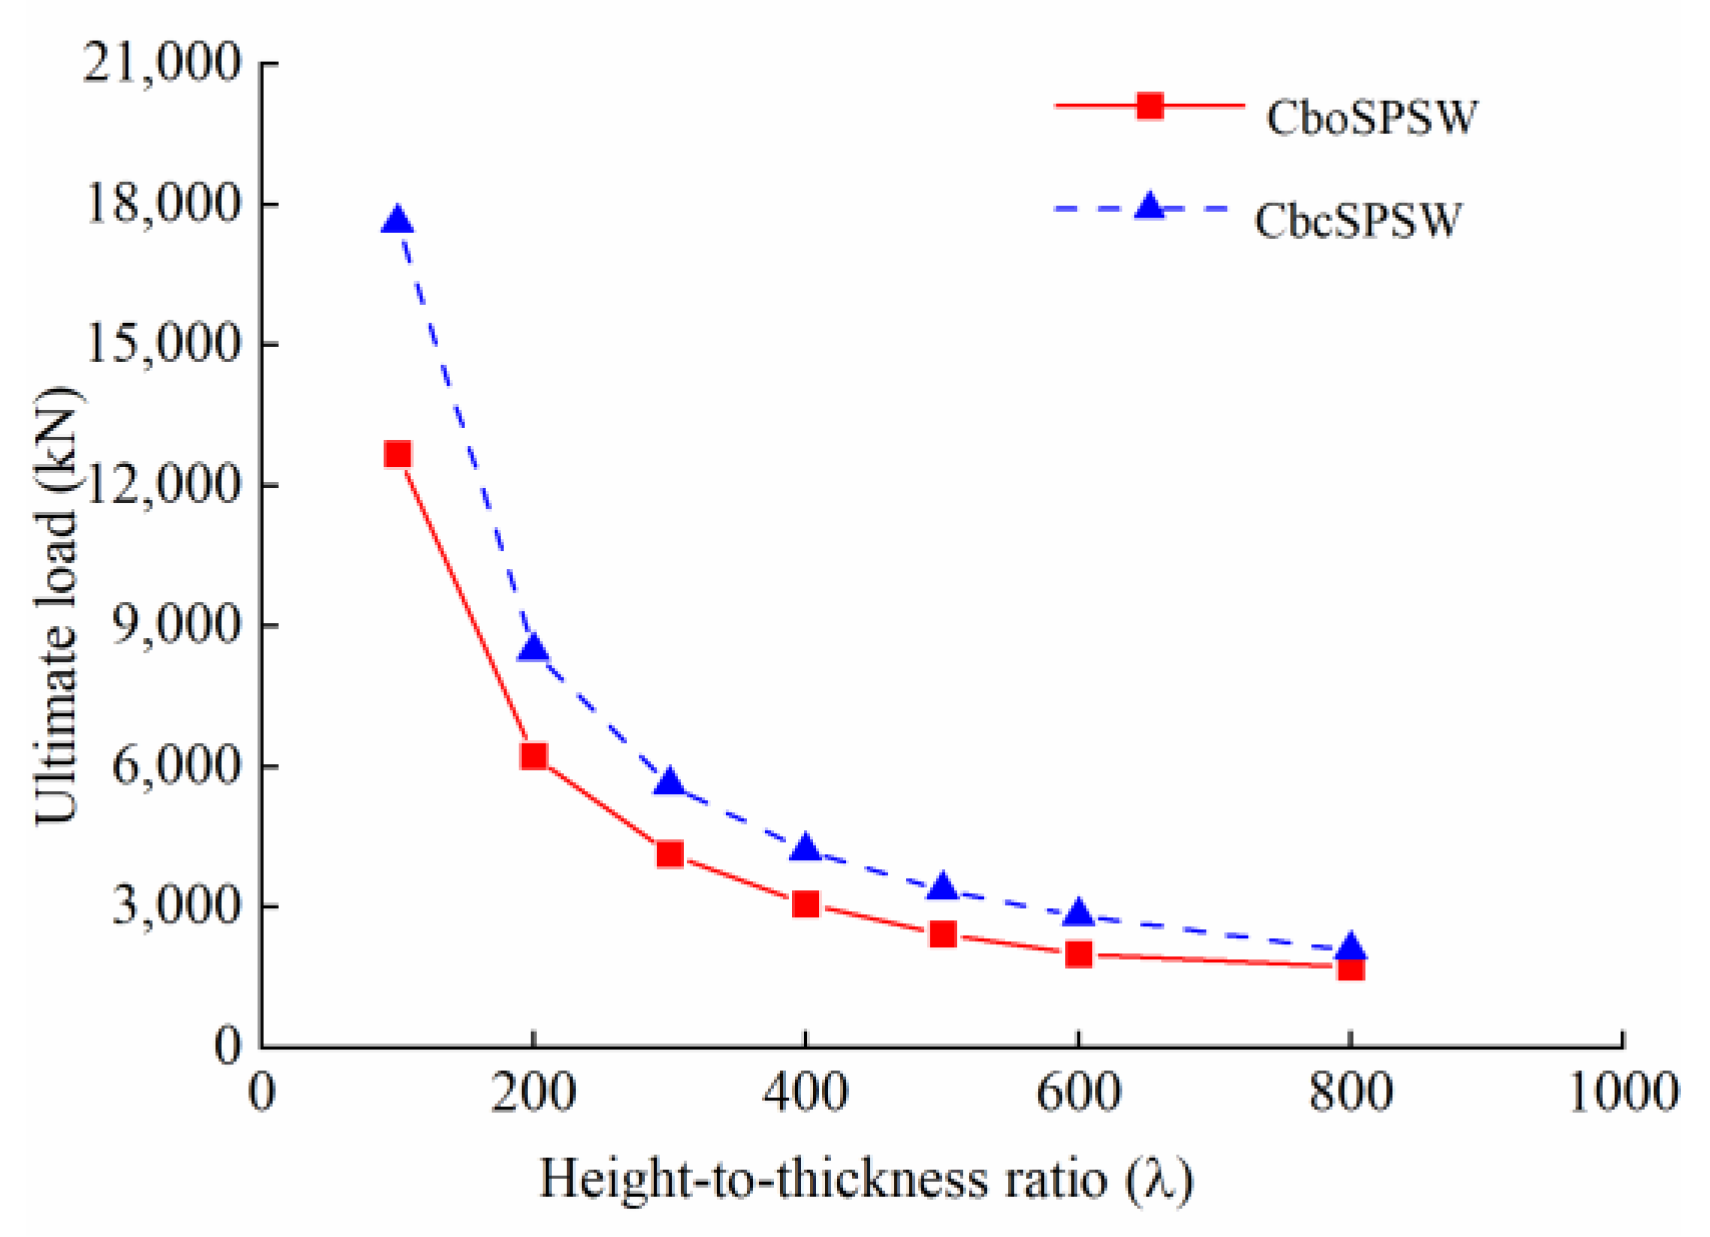
The initial stiffness and strength have a negative relationship with the height–thickness ratio. In contrast with the strength of the CSPs in CbcSPSWs, the strength of CSPs in CboSPSWs is lesser. When the height–thickness ratio increases from 100 to 800, the ultimate loads of the CSPs in the CboSPSWs decrease from 19% to 28% compared to those of the CbcSPSWs. The initial stiffnesses of the CboSPSWs decrease from 26% to 33% compared to those of the CbcSPSWs.
(2)
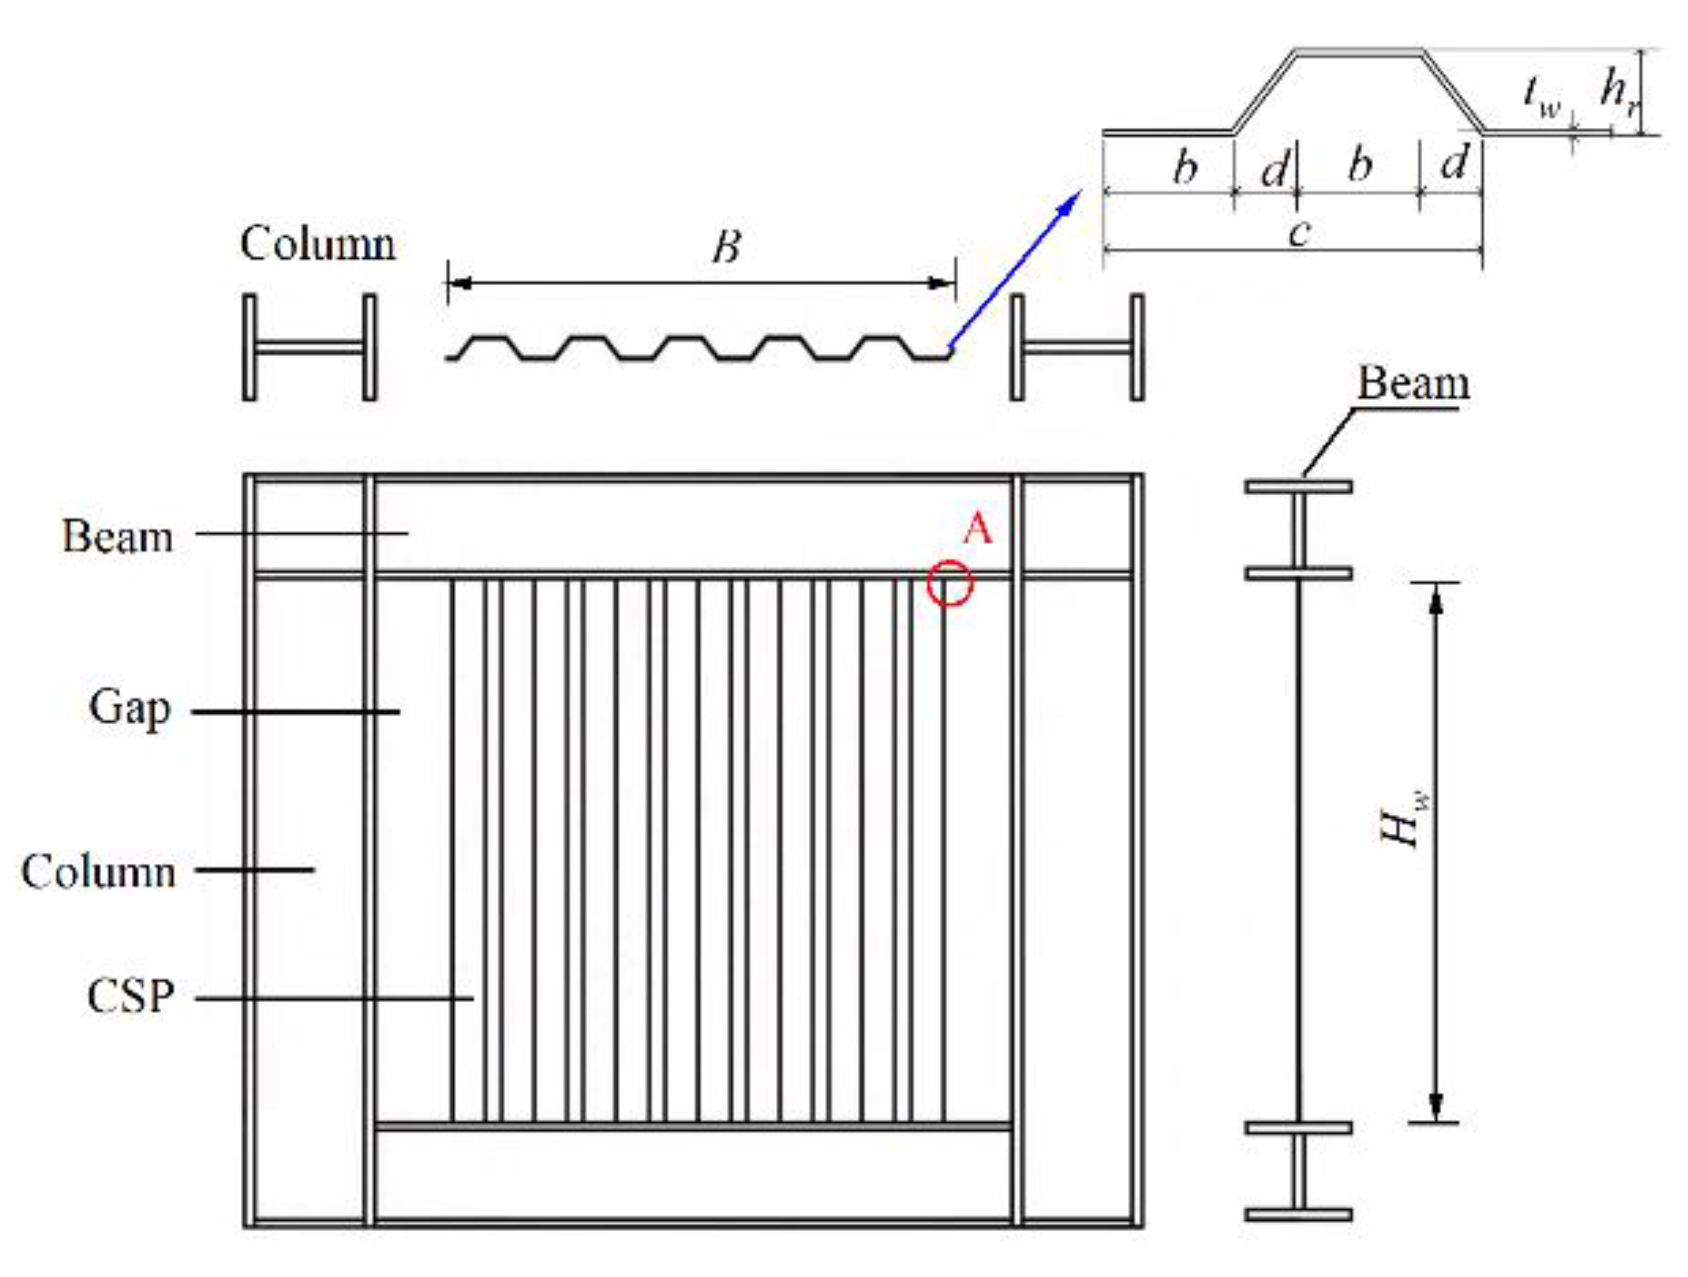
The free edges of CSPs under compression are easy to buckle and deform, and this is the reason the mechanical properties of the CSPs in the CboSPSWs are not fully utilized. Moreover, the corners of the CSPs are the first parts to be destroyed. It is suggested that the free edges of CSPs should be strengthened by adding stiffeners on one side or two sides of the CSPs in practical projects.
(3)
The initial stiffnesses and ultimate loads of the CboSPSWs increase with the increase of the aspect ratio. The initial stiffnesses and ultimate loads of the CboSPSWs are lower than those of the CbcSPSWs. When the aspect ratio increases from 0.5 to 2.5, due to the connections with beams only, the strengths of the CboSPSWs decrease 15–27% compared to those of the CbcSPSWs, and the initial stiffnesses of the CboSPSWs decrease from 15% to 27% compared to those of the CbcSPSWs. It is suggested that the aspect ratio should be controlled less than 2.0 for a strength decrease of the CSPs.
(4)
The ultimate capacities and initial stiffness have a linear decrease relationship with the opening rate. When the opening rates are 50% and 70%, the CSPs show bending and compressive performance, which is similar to performance of the columns. Therefore, the opening rate should be less than 50% in the design of CboSPSWs.
(5)
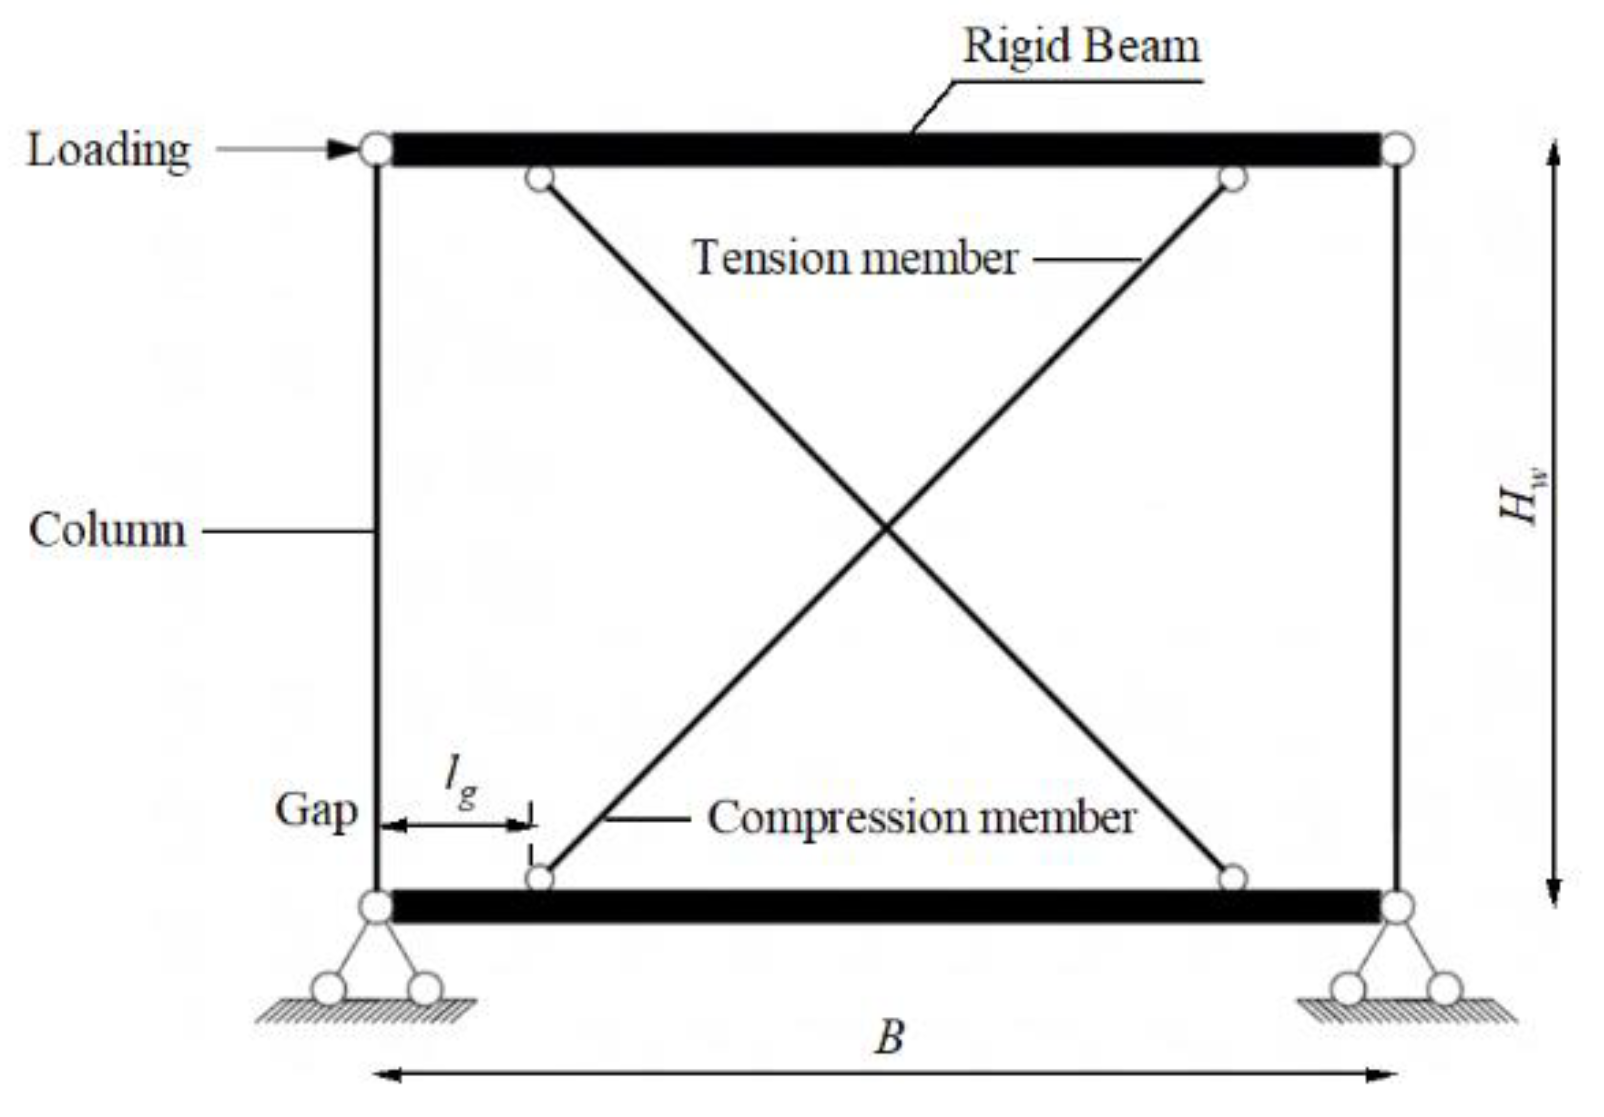
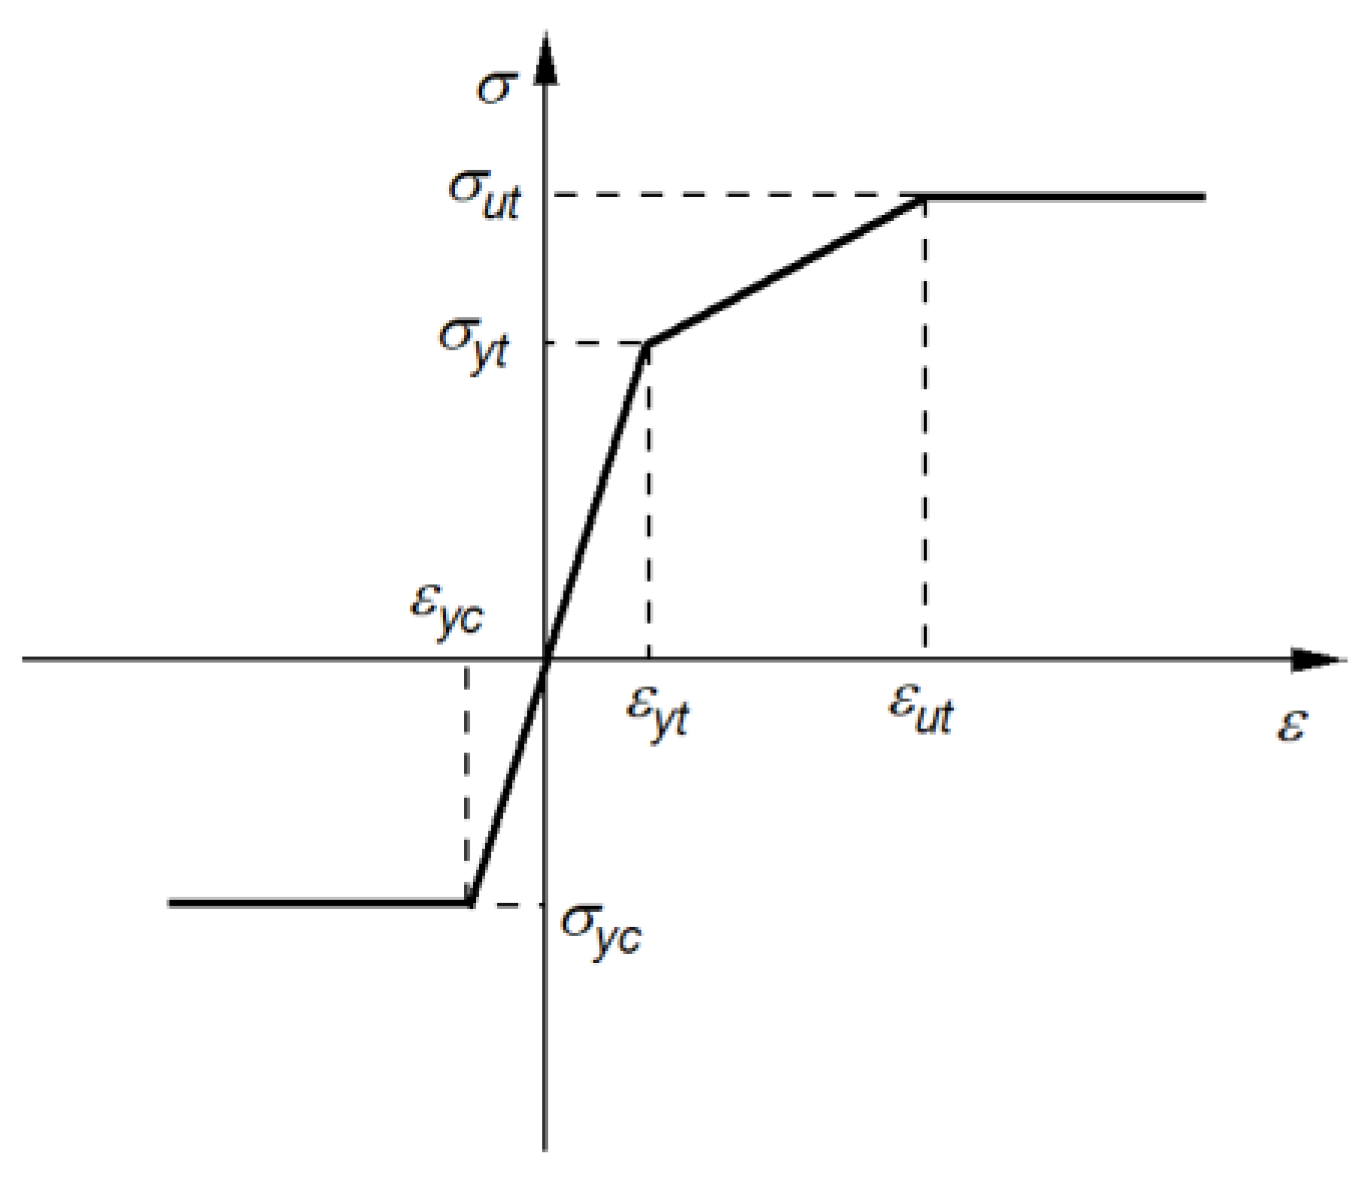
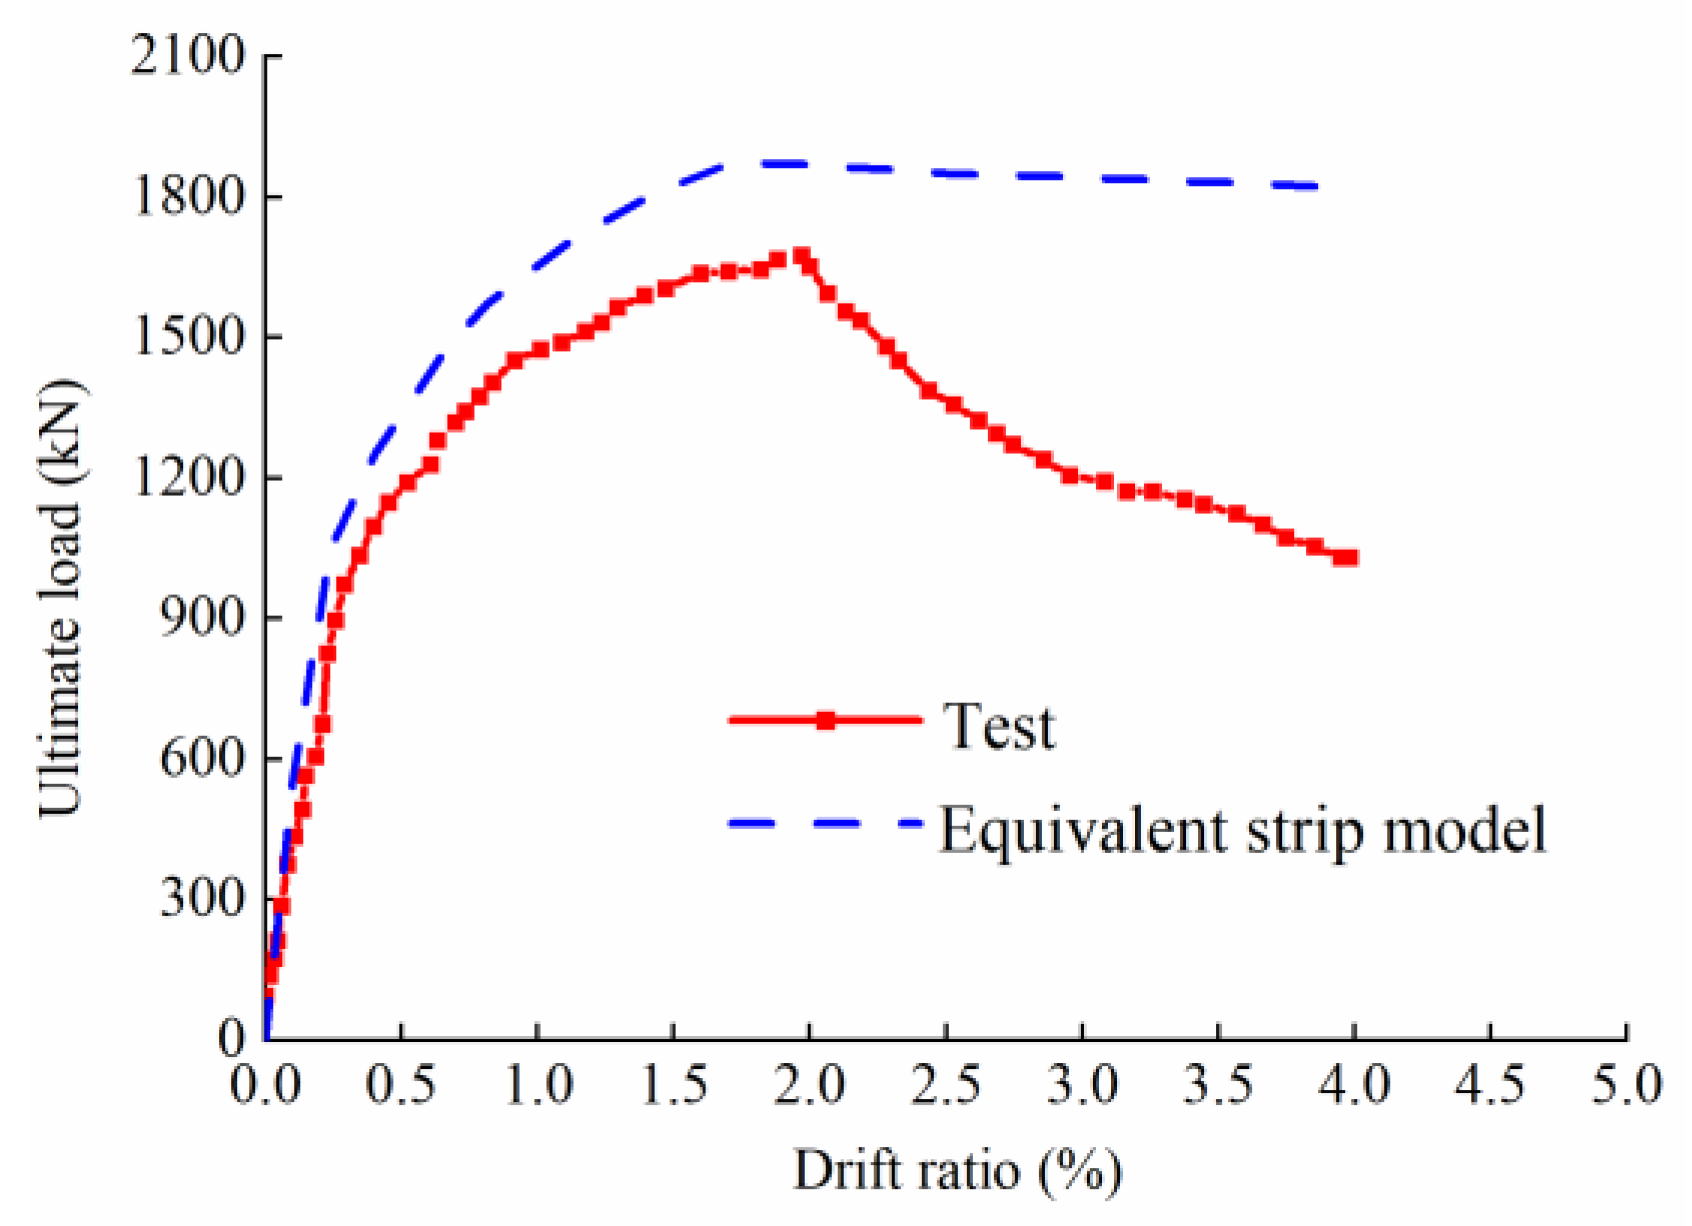
The modified equivalent strip model for the CboSPSW was developed to simplify the elasto-plastic analysis. The results show that the modified equivalent strip model can simulate the shear behavior of the CboSPSW well.

Author Contributions

Q.C., methodology and finite element analysis, writing—original draft preparation, writing—review and editing; J.H., resources, supervision, project administration, funding acquisition; B.G., supervision, software. All authors have read and agreed to the published version of the manuscript.

Funding

This work is supported by the National 13th Five-Year Science and Technology Support Program of China, grant No: 2016YFB1200602. Their support is acknowledged with thanks.

Data Availability Statement

Not applicable.

Conflicts of Interest

The authors declare no conflict of interest.

Abbreviations

A 0 Opening area
A Whole area of the CSP
A l Section areas of the tension and compressive members in the strip model
b Horizontal subpanel width of the corrugated steel plate
B Width of the corrugated plate
c Single wavelength of the corrugated plate
d Horizontal projection of the inclined panel width
d b Center-to-center distance of adjacent beams
d c Center-to-center distance between adjacent columns
E c Elastic modulus of the CSP material
E t Elastic modulus of the tension member
E w Elastic modulus of the CSP material
f y Yield stress of a corrugated steel plate
f v Shear yield stress of a corrugated steel plate
G Shear modulus of a corrugated steel plate
h r Corrugation depth of the corrugated plate
H w Height of corrugated steel plate
I c m i n Minimum area moment of inertia of a surrounding column
K c Initial stiffness of the CboSPSW
K w Initial stiffness of the corrugated steel plate
l g Length of the opening in equivalent strip model
t w Thickness of the corrugated steel plate
V Lateral force of the CSPSW
V 0 Ultimate shear load of a CboSPSW with an opening rate
V c b o Ultimate shear load of a CboSPSW with no opening
V y t w Yield load of a corrugated steel plate
V y c w Compressive load of a corrugated steel plate
Δ y c w Compressive displacement of a corrugated steel plate
Δ u t w Displacement corresponding to the ultimate load of a corrugated steel plate
μ Poisson’s ratio of steel
θ Corrugation angle
σ y t Yield stress of the tension member in the strip model
σ y c Yield stress of the compression member
σ u t Ultimate tensile stress of the compression member
ξ Uniformity coefficient of shear load along CSP width
α Inclination angle of the tension field in the corrugated steel plate
ψ Reduction coefficient of the lateral stiffness of a CSP
λ Height–thickness ratio
γ Opening rate
τ y Yield stress of a corrugated steel plate
τ y c w Compressive stress of a corrugated steel plate
ε y c Compressive strain of a tension member in the strip model
ε u t Ultimate tensile strain corresponding to the ultimate load of the tension member

References

  1. Wang, W.; Ren, Y.; Lu, Z.; Song, J.; Han, B.; Zhou, Y. Experimental study of the hysteretic behaviour of corrugated steel plate shear walls and steel plate reinforced concrete composite shear walls. J. Constr. Steel Res. 2019, 160, 136–152. [Google Scholar] [CrossRef]
  2. Kalali, H.; Hajsadeghi, M.; Zirakian, T.; Alaee, F.J. Hysteretic performance of SPSWs with trapezoidally horizontal corrugated web-plates. Steel Compos. Struct. 2015, 19, 277–292. [Google Scholar] [CrossRef]
  3. Fadhil, H.; Ibrahim, A.; Mahmood, M. Effect of corrugation angle and direction on the performance of corrugated steel plate shear walls. Civ. Eng. J. 2018, 4, 2667. [Google Scholar] [CrossRef]
  4. Berman, J.; Bruneau, M. Experimental investigation of self-centering steel plate shear wall. Struct Eng. 2005, 131, 259–267. [Google Scholar] [CrossRef] [Green Version]
  5. Dou, C.; Pi, Y.L.; Gao, W. Shear resistance and post-buckling behavior of corrugated panels in steel plate shear walls. Thin-Walled Struct. 2018, 131, 816–826. [Google Scholar] [CrossRef]
  6. Wang, W.; Quan, C.; Li, Y.; Zhen, G.K.; Zhao, H.T. Experimental study and numerical simulation analysis on seismic performance of corrugated steel-plate shear wall with replaceable bottom corner dampers. Soil Dyn. Earthq. Eng. 2022, 152, 107061. [Google Scholar] [CrossRef]
  7. Farzampour, A.; Hu, J. Mansouri. Seismic Behaviour Investigation of the Corrugated Steel Shear Walls Considering Variations of Corrugation Geometrical Characteristics. Int. J. Steel Struct. 2018, 18, 1297–1305. [Google Scholar] [CrossRef]
  8. Gholizadeh, M.; Yadollahi, Y. Comparing Steel Plate Shear Wall Behavior with Simple and Corrugated Plates. Appl. Mech. Mater. 2012, 1599, 80–85. [Google Scholar] [CrossRef]
  9. Emami, F.; Mofid, M.; Vafai, A. Experimental study on cyclic behaviour of trapezoidally corrugated steel shear walls. Eng. Struct. 2013, 48, 750–762. [Google Scholar] [CrossRef]
  10. Edalati, S.A.; Yadollahi, Y.; Pakar, I.; Emadi, A.; Bayat, M. Numerical study on the performance of corrugated steel shear walls. Wind. Struct. 2014, 19, 405–420. [Google Scholar] [CrossRef]
  11. Shon, S.; Yoo, M.; Lee, S. An experimental study on the shear hysteresis and energy dissipation of the steel frame with a trapezoidal-corrugated steel plate. Materials 2017, 10, 261. [Google Scholar] [CrossRef] [Green Version]
  12. Bahrebar, M.; Kabir, M.Z.; Hajsadeghi, M.; Zirakian, T.; Lim, J.B. Structural performance of steel plate shear walls with trapezoidal corrugations and centrally-placed square perforations. Int. J. Steel Struct. 2016, 16, 845–855. [Google Scholar] [CrossRef]
  13. Dou, C.; Jiang, Z.; Pi, Y.; Guo, Y. Elastic shear buckling of sinusoidally corrugated steel plate shear wall. Eng. Struct. 2016, 121, 146–156. [Google Scholar] [CrossRef]
  14. Tong, J.; Guo, Y. Shear resistance of stiffened steel corrugated shear walls. Thin-Walled Struct. 2018, 127, 76–79. [Google Scholar] [CrossRef]
  15. Zhang, W.; Mahdavian, M.; Li, Y.; Yu, C. Experiments and simulations of cold-formed steel wall assemblies using corrugated steel sheathing subjected to shear and gravity loads. Struct. Eng. 2017, 143, 04016193. [Google Scholar] [CrossRef]
  16. Tong, J.Z.; Guo, Y.L. Elastic buckling behavior of steel trapezoidal corrugated shear walls with vertical stiffeners. Thin-Walled Struct. 2015, 95, 31–39. [Google Scholar] [CrossRef]
  17. Feng, L.; Sun, T.; Ou, J. Elastic buckling analysis of steel-strip-stiffened trapezoidal corrugated steel plate shear walls. J. Constr. Steel Res. 2021, 184, 106833. [Google Scholar] [CrossRef]
  18. Zhao, Q.; Qiu, J.; Zhao, Y.; Cheng, Y. Performance-Based Seismic Design of Corrugated Steel Plate Shear Walls. KSCE J. Civ. Eng. 2022, 26, 3486–3503. [Google Scholar] [CrossRef]
  19. Zhao, Q.; Qiu, J.; Li, N.; Li, Z. Experimental study on seismic performance of trapezoidally corrugated steel plate shear walls. Jianzhu Jiegou Xuebao/J. Build. Struct. 2018, 39, 112–120. [Google Scholar]
  20. Cao, Q.; Huang, J.; Zhao, L.; Fang, Z.; Zhang, Z. Research on shear performance of corrugated steel plate shear walls with inelastic buckling of infilled plates under lateral loads. J. Build. Eng. 2022, 52, 104406. [Google Scholar] [CrossRef]
  21. Farzampour, A.; Laman, J. Behavior prediction of corrugated steel plate shear walls with openings. J. Constr. Steel Res. 2015, 114, 258–268. [Google Scholar] [CrossRef]
  22. Emami, F.; Mofid, M. On the hysteretic behavior of trapezoidally corrugated steel shear walls. Struct. Des. Tall Spec. Build. 2014, 23, 94–104. [Google Scholar] [CrossRef]
  23. Zhao, Q.; Qiu, J.; Li, Y.; Yu, C. Lateral behavior and PFI model of sinusoidal corrugated steel plate shear walls. J. Constr. Steel Res. 2023, 203, 107812. [Google Scholar] [CrossRef]
  24. Deng, E.F.; Zong, L.; Wang, H.P.; Shi, F.W.; Ding, Y. High efficiency analysis model for corrugated steel plate shear walls in modular steel construction. Thin-Walled Struct. 2020, 156, 106963. [Google Scholar] [CrossRef]
  25. Tong, J.-Z.; Guo, Y.-L.; Zuo, J.-Q. Elastic buckling and load-resistant behaviors of double-corrugated-plate shear walls under pure in-plane shear loads. Thin-Walled Struct. 2018, 130, 593–612. [Google Scholar] [CrossRef]
  26. Deng, R.; Yang, J.D.; Gao, Y.; Wang, Y.H.; Li, Q.Q. Behaviour of double-corrugated steel plates under cyclic in-plane shear loading: An experimental study. Eng. Struct. 2023, 276, 115327. [Google Scholar] [CrossRef]
  27. Wang, W.; Song, J.; Hou, M.; Liu, G.; Wang, W. Experimental study and numerical simulation of replaceable corrugated steel plate-concrete composite shear walls. Soil Dyn. Earthq. Eng. 2019, 127, 105827. [Google Scholar] [CrossRef]
  28. Huang, S. Experimental Study on Seismic Behavior of Corrugated Steel Shear Walls. Ph.D. Thesis, Xi’an University of Architecture and Technology, Xi’an, China, 2019. [Google Scholar]
  29. Wang, W.; Zhao, H.T.; Quan, C.C.; Song, H.L.; Li, Y.; Zhou, Y.X. Shear bearing capacity of vertical corrugated steel plate shear wall with replaceable toe. Zhejiang Daxue Xuebao (Gongxue Ban) 2021, 55, 1407–1418. [Google Scholar]
  30. Feng, L.; Sun, T.; Qu, J. Method of determining the minimum number of stiffeners for stiffened corrugated steel walls. Structures 2021, 34, 3487–3500. [Google Scholar] [CrossRef]
  31. Zhao, Q.; Qiu, J.; Hao, B. Lateral behaviour of vertically-corrugated Steel plate shear walls connected with beams only. J. Tianjin Univ. (Sci. Technol.) 2019, 2, 46–53. (In Chinese) [Google Scholar]
  32. Qiu, M. Seismic Performance Analysis of Corrugated Steel Plate Shear Wall Connected at Both Sides. Master’s Thesis, Dalian University of Technology, Dalian, China, 2020. (In Chinese). [Google Scholar]
  33. Kashan, S.M.G.; Maleki, S. Cyclic Performance of Corrugated Steel Plate Shear Walls with Beam-Only-Connected Infill Plates. Adv. Civ. Eng. 2021, 2021, 554623. [Google Scholar]
  34. Montgomery, C.J.; Medhekar, M.; Lubell, A.S.; Prion, H.G.; Ventura, C.E.; Rezai, M. Unstiffened steel plate shear wall performance under cyclic loading. Structure. Eng. 2001, 127, 973–975. [Google Scholar] [CrossRef]
  35. CAN/CSA-S1601; Limits States Design of Steel Structures. Canadian Standards Association: Mississauga, ON, Canada, 2001.
  36. ANSI/AISC 341-05; Seismic Provision for Structural Steel Buildings. American Institute of Steel Construction: Chicago, IL, USA, 2005.
  37. Berman, J.; Bruneau, M. Plastic Analysis and Design of Steel Plate Shear Walls. J. Struct. Eng. 2003, 129, 695–697. [Google Scholar] [CrossRef] [Green Version]
  38. Shishkin, J.; Ver, R.; Grondin, G. Analysis of Steel Plate Shear Walls Using the Modified Strip Model; Department of Civil and Environmental Engineering, University of Alberta: Edmonton, AB, Canada, 2005. [Google Scholar]
  39. Gb 50011; Code for Seismic Design of Buildings 2010. China Ministry of Construction: Beijing, China, 2010. (In Chinese)
  40. Qu, L.; Zhuang, Y.; Shao, H. Form factor for shear and its calculation Tables. J. Build. Struct. 1986, 8, 37–53. (In Chinese) [Google Scholar]
Figure 1. Profiles of the (a) CboSPSW, (b) CbcSPSW, and (c) ChSPSW.
Buildings 13 01996 g001
Figure 2. Meshed FE model for a CboSPSW.
Buildings 13 01996 g002
Figure 3. Comparison of load–displacement curves between FE model and test.
Buildings 13 01996 g003
Figure 4. Comparison of failure modes between FE model and test [31].
Buildings 13 01996 g004
Figure 5. A diagram for the CSP and frame.
Buildings 13 01996 g005
Figure 6. Load–displacement curves with different height–thickness ratios.
Buildings 13 01996 g006
Figure 7. Load–out-of-plane displacement curves with different height–thickness ratios.
Buildings 13 01996 g007
Figure 8. Ultimate load versus height-to-thickness ratio curves of CboSPSWs and CbcSPSWs.
Buildings 13 01996 g008
Figure 9. Initial stiffness versus height-to-thickness ratio curves of CboSPSWs and CbcSPSWs.
Buildings 13 01996 g009
Figure 10. Out-of-plane deformation of CboSPSWs with different height–thickness ratios.
Buildings 13 01996 g010
Figure 11. Stress distributions of CboSPSWs with different height–thickness ratios.
Buildings 13 01996 g011
Figure 12. Load–displacement curves with different aspect ratios.
Buildings 13 01996 g012
Figure 13. Load versus out-of-plane displacement curves with different aspect ratios.
Buildings 13 01996 g013
Figure 14. Ultimate loads versus aspect ratio curves of CboSPSWs and CbcSPSWs.
Buildings 13 01996 g014
Figure 15. Initial stiffness versus aspect ratio curves of CboSPSWs and CbcSPSWs.
Buildings 13 01996 g015
Figure 16. Out-of-plane deformation of CSPs with different aspect ratios.
Buildings 13 01996 g016
Figure 17. Shapes and positions of the openings of CSPs.
Buildings 13 01996 g017
Figure 18. Load–displacement curves of CvSPSWs with different opening rates.
Buildings 13 01996 g018
Figure 19. Load versus out-of-plane displacement curves with different opening rates.
Buildings 13 01996 g019
Figure 20. Ultimate load of CSPs versus opening rate curves.
Buildings 13 01996 g020
Figure 21. Initial stiffness of CSPs versus opening rate curves.
Buildings 13 01996 g021
Figure 22. Failure modes of the CboSPSWs with different opening rates.
Buildings 13 01996 g022
Figure 23. Load versus displacement curves of CboSPSWs with various column stiffnesses.
Buildings 13 01996 g023
Figure 24. Load versus out-of-plane displacement curves with various column stiffnesses.
Buildings 13 01996 g024
Figure 25. Out-of-plane deformation of CSPSWs with different column stiffness.
Buildings 13 01996 g025
Figure 26. Diagram of equivalent strip model for a CboSPSW.
Buildings 13 01996 g026
Figure 27. Stress–strain curves of tension and compression members.
Buildings 13 01996 g027
Figure 28. Comparisons of results obtained by strip model and test.
Buildings 13 01996 g028
Table 1. Key parameters.
MemberCSP SectionFrame Section
λ H  
(mm)
B  
(mm)
d  
(mm)
b  
(mm)
h r  
(mm)
Column
(mm)
Beam
(mm)
CboW1100280028007010070H-600 × 600 × 60 × 60H-600 × 600 × 60 × 60
CboW2200280028007010070H-600 × 600 × 60 × 60H-600 × 600 × 60 × 60
CboW3300280028007010070H-600 × 600 × 60 × 60H-600 × 600 × 60 × 60
CboW4400280028007010070H-600 × 600 × 60 × 60H-600 × 600 × 60 × 60
CboW5500280028007010070H-600 × 600 × 60 × 60H-600 × 600 × 60 × 60
CboW6600280028007010070H-600 × 600 × 60 × 60H-600 × 600 × 60 × 60
CboW7800280028007010070H-600 × 600 × 60 × 60H-600 × 600 × 60 × 60
CboW8300280014007010070H-970 × 970 × 97 × 97H-970 × 970 × 97 × 97
CboW9300280042007010070H-970 × 970 × 97 × 97H-970 × 970 × 97 × 97
CboW10300280056007010070H-970 × 970 × 97 × 97H-970 × 970 × 97 × 97
CboW11300280070007010070H-970 × 970 × 97 × 97H-970 × 970 × 97 × 97
CboW12300280028007010070H-300 × 300 × 30 × 30H-300 × 300 × 30 × 30
CboW13300280028007010070H-320 × 320 × 32 × 32H-320 × 320 × 32 × 32
CboW14300280028007010070H-350 × 350 × 35 × 35H-350 × 350 × 35 × 35
CboW15300280028007010070H-380 × 380 × 38 × 38H-380 × 380 × 38 × 38
CboW16300280028007010070H-620 × 620 × 62 × 62H-620 × 620 × 62 × 62
Table 2. Opening rate.
MemberCSP Section Frame Section
λ H  
(mm)
B  
(mm)
d  
(mm)
b  
(mm)
h r  
(mm)
Opening Rate γ Column
(mm)
Beam
(mm)
CboW173002800280070100700600 × 600 × 60 × 60600 × 600 × 60 × 60
CboW1830028002800701007010%600 × 600 × 60 × 60600 × 600 × 60 × 60
CboW1930028002800701007030%600 × 600 × 60 × 60600 × 600 × 60 × 60
CboW2030028002800701007050%600 × 600 × 60 × 60600 × 600 × 60 × 60
CboW2130028002800701007070%600 × 600 × 60 × 60600 × 600 × 60 × 60
Disclaimer/Publisher’s Note: The statements, opinions and data contained in all publications are solely those of the individual author(s) and contributor(s) and not of MDPI and/or the editor(s). MDPI and/or the editor(s) disclaim responsibility for any injury to people or property resulting from any ideas, methods, instructions or products referred to in the content.

