Abstract
Many buildings built before energy performance regulations are actually in a situation of thermal discomfort and energy inefficiency. The creation of intelligent environments is moving towards new opportunities, based on real-time monitoring and on the development of sensors and technologies. Furthermore, building automation and electronic systems standards enable interoperability and interconnection between control devices and systems. The application of soft computing has significantly improved the energy efficiency; however, it requires prior assessment to design the automation functions. Temperature, humidity, air quality and energy consumption are the most commonly measured parameters, but their relationships with other operational variables such as occupancy or some building states remain as a research challenge. This article presents a methodology to develop the automation of a large existing public building. This methodology consists of two stages: 1. Assessment and diagnosis to set appropriate functions, using EN ISO 52120-1 and EN 50090 for open communication networks, and EN ISO 52120-1 to assign the technical building management. 2. System control deployment of low-cost and low-consumption input and output devices. It has been proven that it is possible to effectively automate an obsolete building with a low-cost, open-source system that can be easily applied to other buildings.
Keywords:
prototype; automation and control; monitoring; devices; energy efficiency; thermal comfort; IEQ 1. Introduction
The Global Alliance for Buildings and Construction [1] aims to mobilise all stakeholders to move towards a net-zero emissions scenario by 2050. Together with the above organisation, the International Energy Agency has developed a global roadmap for 2020−2050 to enable the transition to low-emission, efficient, and resilient buildings and construction, including building retrofits and systems. According to its estimation, in 2021, energy use in buildings accounted for 30% of global final energy consumption and 27% of total energy sector emissions [2]. The fact is that, although the scope of building energy performance standards is increasing, there are a large number of buildings that were built before the first global EPB regulations in 2002 [3] and are in a situation of thermal discomfort and energy inefficiency.
In order to face these challenges, the use of digitisation tools is paramount. New paradigms promote the creation of smart built environments that can adapt to different needs [4]. In this regard, the International Energy Agency has launched a cross-agency initiative to explore digital technologies for energy efficiency that will enable greater energy efficiency gains, including data-driven consumer engagement platforms and new performance-based revenue models [5]. In this respect, the European standards used for HBES (EN 50090) enable interoperability and connection to automation and control devices and systems through open communication networks [6].
In recent years, adequate implementations founded on real-time monitoring of construction projects have been developed, with a primary focus on the advancement of sensor technologies and the monitoring of both the static and dynamic building environments [7]. Additionally, the concept of “smartness in the built environment” is emerging in the retrofitting of buildings, seeking to attain greater sustainability, efficiency, automation, and adaptability through “real-time interaction” [8]. Within this context, specific research areas that pose contemporary challenges include environmental and structural performance assessment [9], real-time plug load identification [10], energy efficiency [11], indoor thermal comfort [12] and, in connection with this, the IAQ monitoring systems [13]. Moreover, the application of IoT-enabled optimal control for HVAC systems is being implemented [14], incorporating design considerations such as occupant behaviour, building typology, and cost functions in relation to modelling approaches and optimisation algorithms [15].
Concerning data processing, artificial intelligence techniques are emerging for building control. Several energy-related control systems can be cited as examples. These include energy-efficiency lighting on occupancy patterns [16], plug load management [17], data-driven approaches for intelligent HVAC operations [18], and the identification of an optimal balance between HVAC energy consumption and maintaining suitable indoor comfort levels for occupants [19]. In [20], prediction is proposed for HVAC systems through learning algorithms based on the outdoor ambient temperature and the electricity prices, and in [21] lighting is also included. Additionally, extensive research concerning machine learning algorithms has been used to predict and assess the energy efficiency of buildings; in [22], the building model is scaled to the parameters that have some thermal impact on the application of the prediction, and in [23] model training is used for the air conditioner.
The variable field in real-time monitoring data varies according to the scope of the case studies, e.g., accuracy and uniformity of temperature and humidity in museums [24], the energy savings in homes [25], balancing between thermal comfort and energy efficiency in workspaces [23], energy conservation and savings measures in commercial or institutional buildings [26], or electrical energy management in the tertiary public sector [27].
When talking about EPB, automation and control systems should also be introduced, and in this way the EMS becomes a global solution, in which energy data are collected and used in an automated way. In this respect, EN ISO 52120-1:2022 [28] and the previous, recently repealed, EN-15232-1 [29] have introduced a specific methodology for energy savings through the concept of TBM functions [30]. Many studies demonstrate this process improvement, such as [25], which calculates the discounted payback period; [31], which includes a BAC audit tool; [32], which calculates the lighting systems; and [11], which evaluates the savings of the heating systems. Nevertheless, some research has concluded that this method does not provide a reliable estimate of achievable energy savings because it does not take into account other factors, such as building and installation design parameters (e.g., type, dimensions, envelope, air exchanges, settings) and contextual factors (e.g., occupant behaviour, climate zone, latitude, and orientation) [33].
The aim of this article is to develop a methodology to address the automation process of a large building in operation, which improves its thermal comfort and HVAC efficiency. Progress has been achieved with the construction of a prototype, as part of the INNOINVEST project [34], whose design requirements were as follows: to be innovative and fully functional, to improve energy savings and efficiency, to use innovative energy technologies for the building, to cover the technological needs of companies, industries and/or end users, and to be implemented in a public building. In addition, the research team added other requirements, which they considered to be essential, such as non-proprietary systems (open data), scalability, low cost, low consumption, and replicability. It should also use the iterative optimisation system architecture methodology developed by the team in [35].
Implementing automated and controlled systems to improve the thermal performance of buildings is becoming increasingly important. However, the lack of comprehensive stages in an existing method makes success difficult. In this paper, the design process was followed from the automation requirements, through the selection of the suitable devices, to the control system’s operation in a large building in operation, using existing standards. The layout of a building automation system is a complex process in which the different functions are interconnected and functional models have been accurately designed, using current standards. Each operation is implemented with all of the variables that can affect energy performance. The prevalent parameters that are typically measured—namely, temperature, humidity, air quality, and energy consumption—need to be expanded to include a wider range of considerations. These should encompass, on the one hand, the real occupancy of individual spaces, as well as established behaviours, daily routines, and planned events; and on the other hand, the building status, such as shading and opening/closing of windows and blinds. Finally, the information is guaranteed by a robust information system: data distribution, microservices and controllers, connectivity, and persistence. Control intelligence has not been developed, nor have savings assessments, which are issues that are sufficiently developed in the abovementioned scientific literature.
2. Materials and Methods
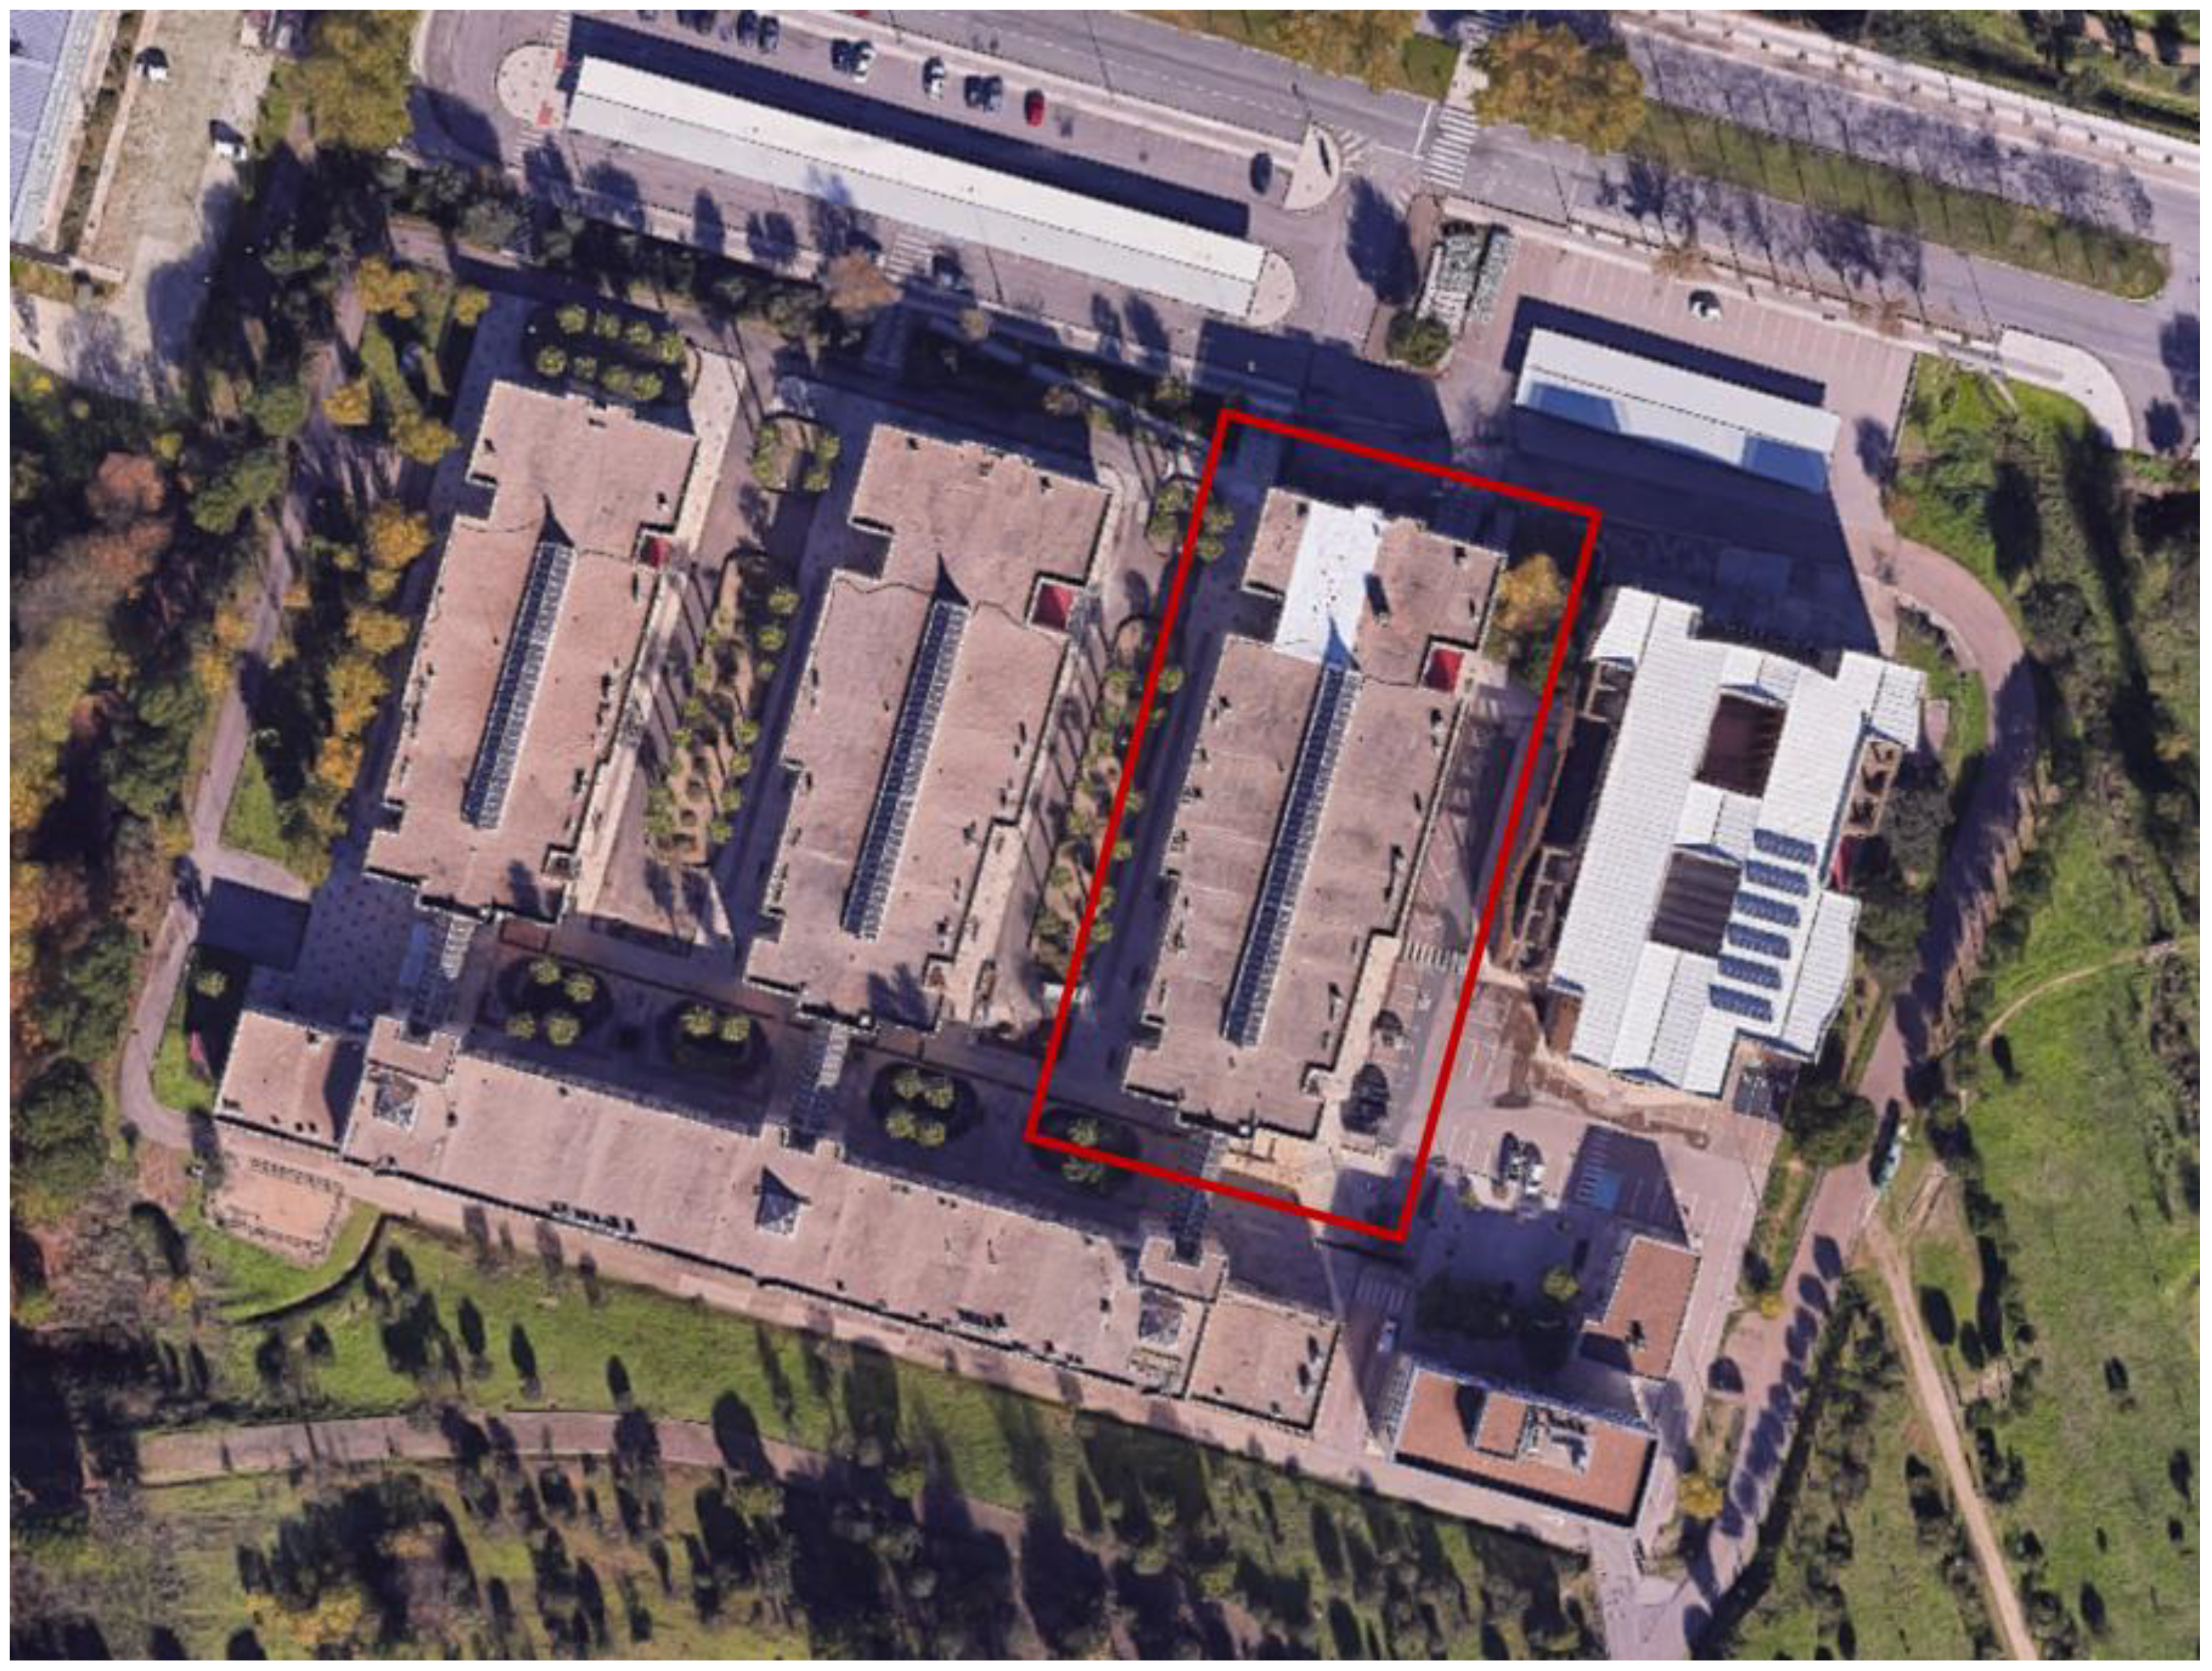
The prototype building is one of the EPCC’s busiest and highest-occupancy buildings (Figure 1). It was built in 1990, with a usable area of about 3600 m2. With a rectangular morphology, its longitudinal façades face east and west. It has three entrances and two levels above ground, where there are classrooms, laboratories, offices, a concierge, toilets, and common and communication areas. There is also a basement that is used for storage, building services, and machine rooms.
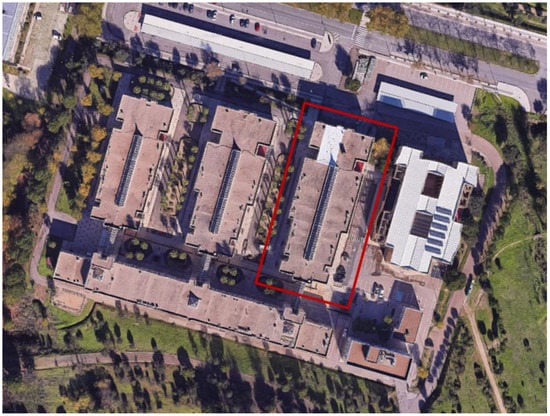
Figure 1.
Location of the prototype building at the EPCC.
The model characterisation is described in [35] but, even so, two aspects must be highlighted: 1. There is a centralised heating system in place for the entire EPCC site. Only some spaces have air-conditioned cooling systems. The building is ventilated naturally and manually through doors and windows. 2. There is a pre-existing information system in place, based on data collection of operating variables through sensorisation, storage, and visualisation. This data management is carried out through a company-service single bus that creates a data monitoring system that allows the information to be analysed and compared, and which was used to carry out the previous analysis (the information system design is described in [35]). The period under review covers the academic years 2016/17 to 2019/20, with data from March 2020 having been discarded for being unusual, as the regular operation of the building was modified because of the SARS-CoV-2 global pandemic.
The proposed methodology consists of 2 stages: In stage 1 (Section 3), the building assessment focuses on the subsequent design of the automation and control by means of a diagnosis in two fundamental areas (IEQ and HVAC systems operation). This double diagnosis will subsequently allow both to obtain strategies and to propose appropriate actions to solve any problems that may arise. To this purpose, in the first case, the psychrometric comfort chart of the climate in question was used; afterwards, a physical model was created to simulate the indoor environment, taking into account building and installation design parameters and contextual factors. In the second case, the EN ISO 52120-1 standard on Automation, Controls, and Building Management was used, with reference to the Energy Performance of Buildings [27], which offers different existing possibilities of intervention with an impact on the energy performance of the building.
In stage 2 (Section 4), the automation system is deployed. Firstly, the previous results guide the setup of sensors for collecting real-time data for the automation system, with the requirements of being open-source and low-cost. Secondly, European standards are taken into account for automation and information system design: EN 50090 [6] on standardisation systems for the HBES Open Communication System, so that it can be replicable and scalable, and, again, EN ISO 50120-1 in its section on TBM, so that the operation can be easily adapted to the user’s needs. Finally, the different control algorithms are planned to work in real time (Figure 2).
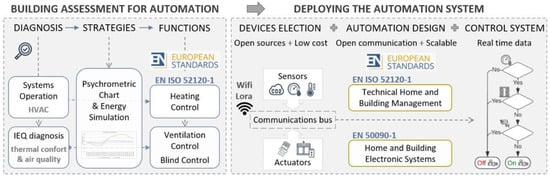
Figure 2.
Flowchart of the methodology.
3. Building Assessment for Automation
This building assessment is focused on the subsequent design of the automation system. It is carried out in three successive stages:
3.1. Diagnosis
The IEQ parameters evaluated were air quality and thermal comfort, as both are priorities for the activities carried out in the building (no other indoor living parameters were evaluated regarding acoustics, lighting and views, or relative humidity). Existing data sensors [36], energy service bills, and user surveys were used to make the diagnosis. The period studied covered the academic years 2016/17 to 2019/20. It should be pointed out that data from March 2020 onwards were discarded for being unusual, as the regular operation of the building was modified due to the global SARS-CoV-2 pandemic. The following issues are then highlighted:
- (a)
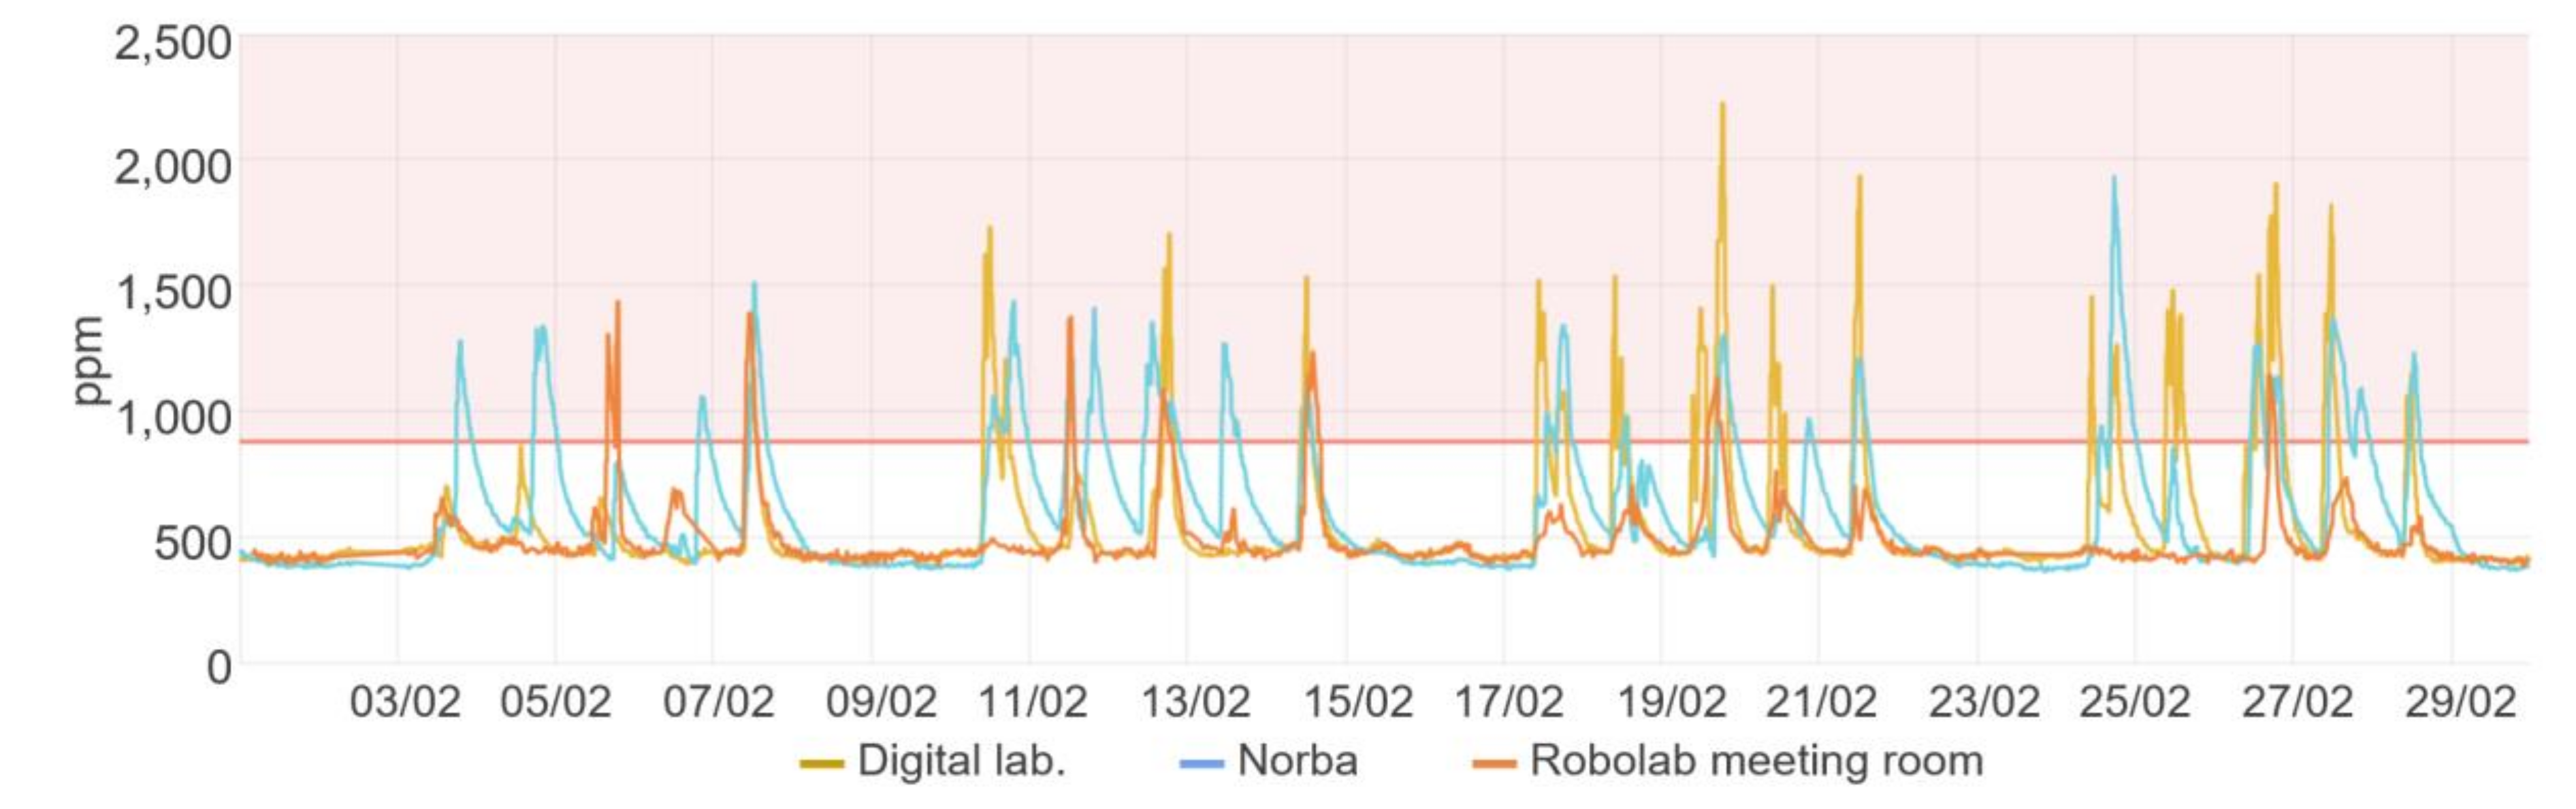
- Sensors installed in two classrooms and a meeting room measured high levels of CO2. According to the regulations [37], a good air quality level in classrooms corresponds to 880 ppm (500 ppm above the outdoor concentration, which is 380 ppm). However, during the school years analysed (from November 2016 to March 2020), an average of 9.6% of the occupied hours exceeded this value. Moreover, in February 2020, for example, peaks of up to 1964 ppm were reached in the digital lab classroom at 7 p.m. (Figure 3).
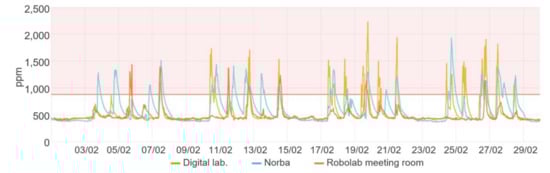 Figure 3. CO₂ concentration in the case study building in February 2020.
 - (b)
- It can be observed that rooms’ indoor temperature does not continuously reach the operative temperatures defined by the Spanish buildings regulations [37], nor the latest measures for energy savings (from 23 °C to 25 °C in the warm period, and from 21 °C to 23 °C in the cold period). In summer, indoor temperatures rise up to 30 °C. In winter, 20 °C is only reached in some rooms and at certain times around midday, even if the heating system has been on since November. The spaces with the highest occupancy (Norba, Novell, I.5. and n1 classrooms) have the highest temperatures (Figure 4).
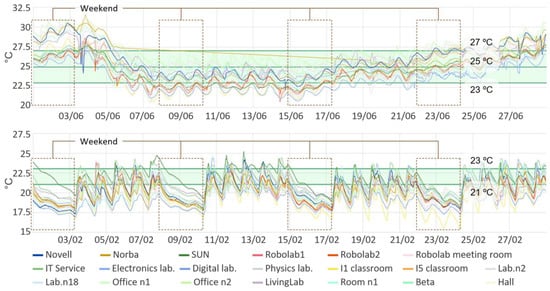 Figure 4. Examples of the indoor thermal behaviour of the building during the warm period (June 2019) and the cold period (February 2020).
 - (c)
- Users do not perceive thermal comfort. This perception was analysed by means of surveys (according to ASHRAE 55-2017 [38]), where 247 responses received between 21/02/19 and 03/05/19 were compared with the comfort range defined by the regulations mentioned in the previous section. It was found that 53% of the respondents felt a neutral sensation, 20% felt slightly cold, and 13% felt slightly hot (Figure 5).
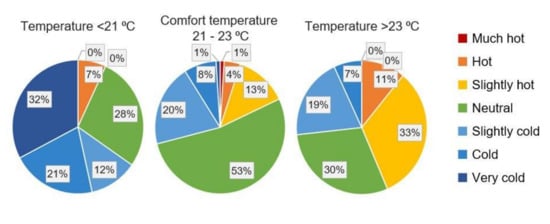 Figure 5. Temperature sensations collected in surveys, 21 February 2019–03 May 2019.
 - (d)
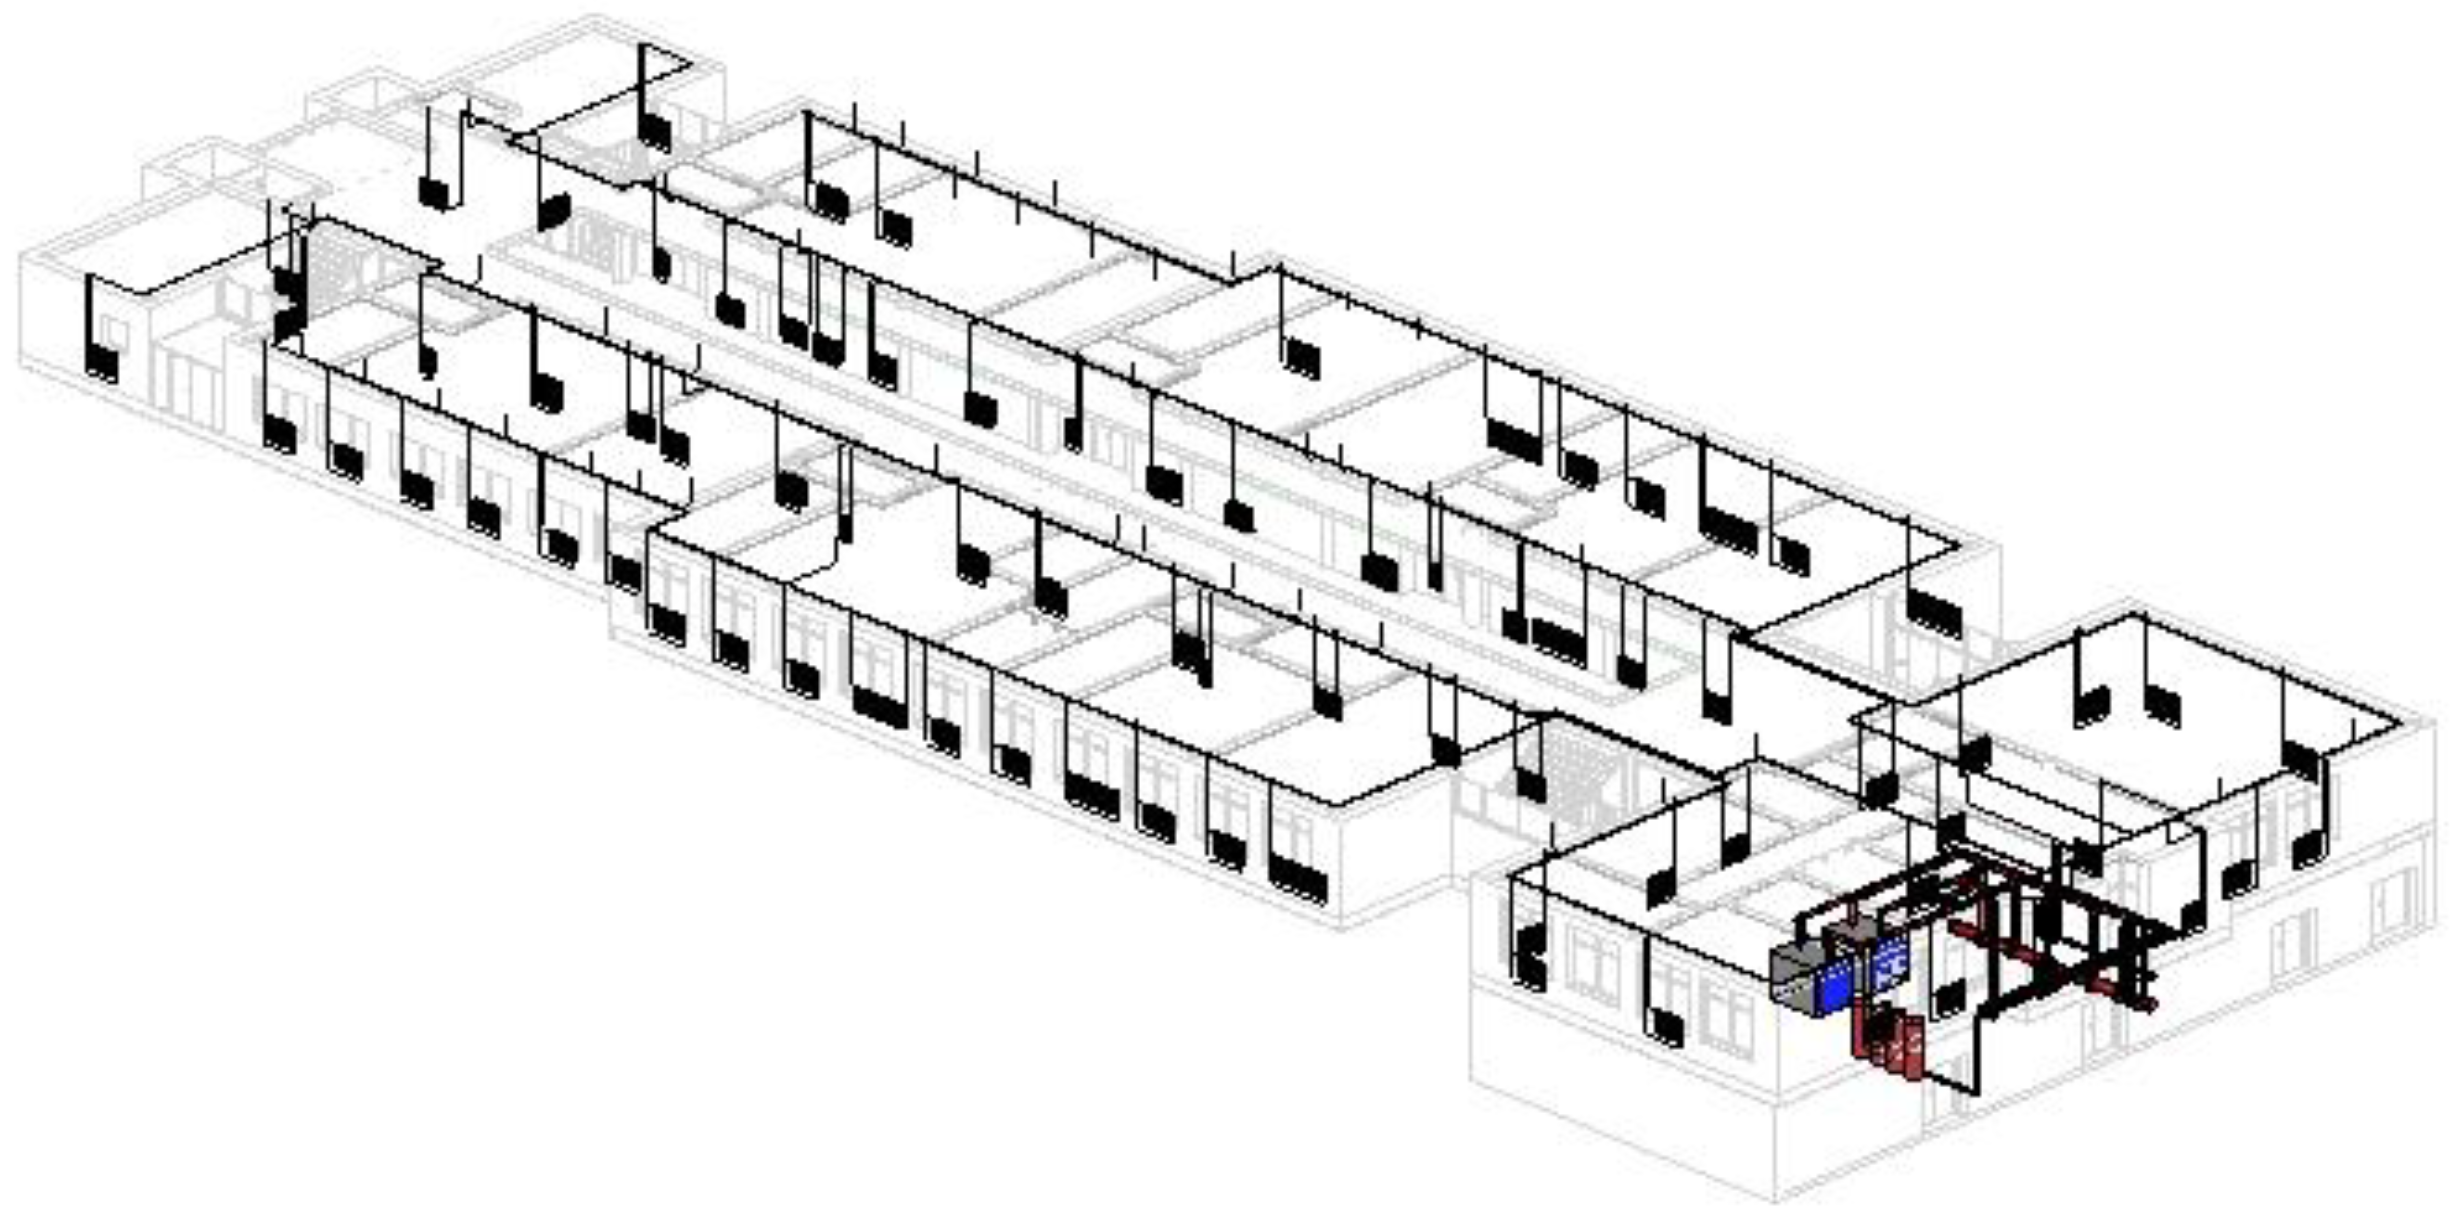
- There is no zoning allowing individual control of the heating system. There are two centralised natural gas boilers (main and backup) installed in the semi-basement of the building, which also serve three other buildings via independent underground branches. From these main branches, internal risers run above the suspending ceiling of the ground floor and parallel to the main façades. The connections to the risers for each radiator on the ground and first floors branch directly from these (Figure 6).
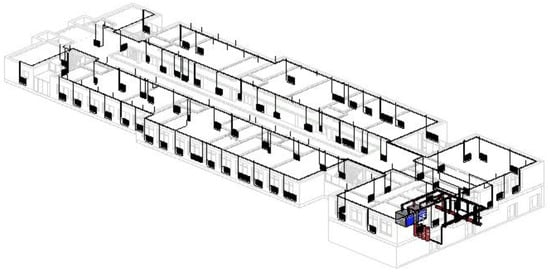 Figure 6. Three-dimensional (3D) modelling of the existing heating system in the target building.
 - (e)
- It should be noted that the system is not automated, and that the heating is manually controlled by the centre’s concierge during cold periods. The switch-on/switch-off schedule varies according to the decisions and subjective thermal sensations of the centre´s administration and management between 6.30 a.m. and 9 p.m., from Monday to Friday. There is also a long closure at Christmas (Figure 7).
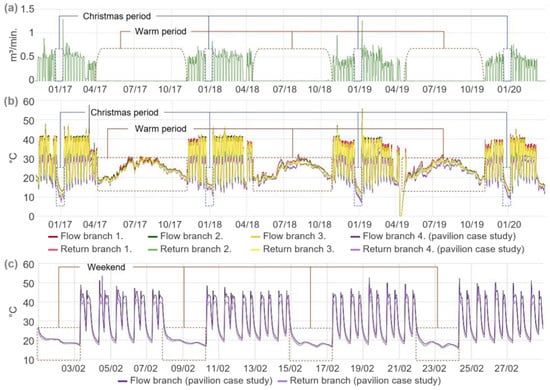 Figure 7. Boiler operation: (a) Gas consumption. (b) Temperature of the supply and return branch of each building, from November 2016 to March 2020. (c) Example of the thermal behaviour of the supply and return branch of the case study, February 2020.
 - (f)
- The system is monitored by means of fluid temperature sensors placed in the different branches of the buildings, which show that the main branch temperature usually oscillates between 50 °C and 70 °C, while the branches of each building oscillate between 37 °C and 50 °C, in both the supply and return circuits. The latter circuits are very close to their common collector, which produces a water mixture that makes it difficult to identify the heat losses produced during distribution. The same temperature difference between flow and return is also observed in the daily pattern of the branches of the case study. In addition, there are gas consumption sensors in the boiler, which make it possible to observe how maximum values of 0.5 m 3/min are reached on average (Figure 7).
- (g)
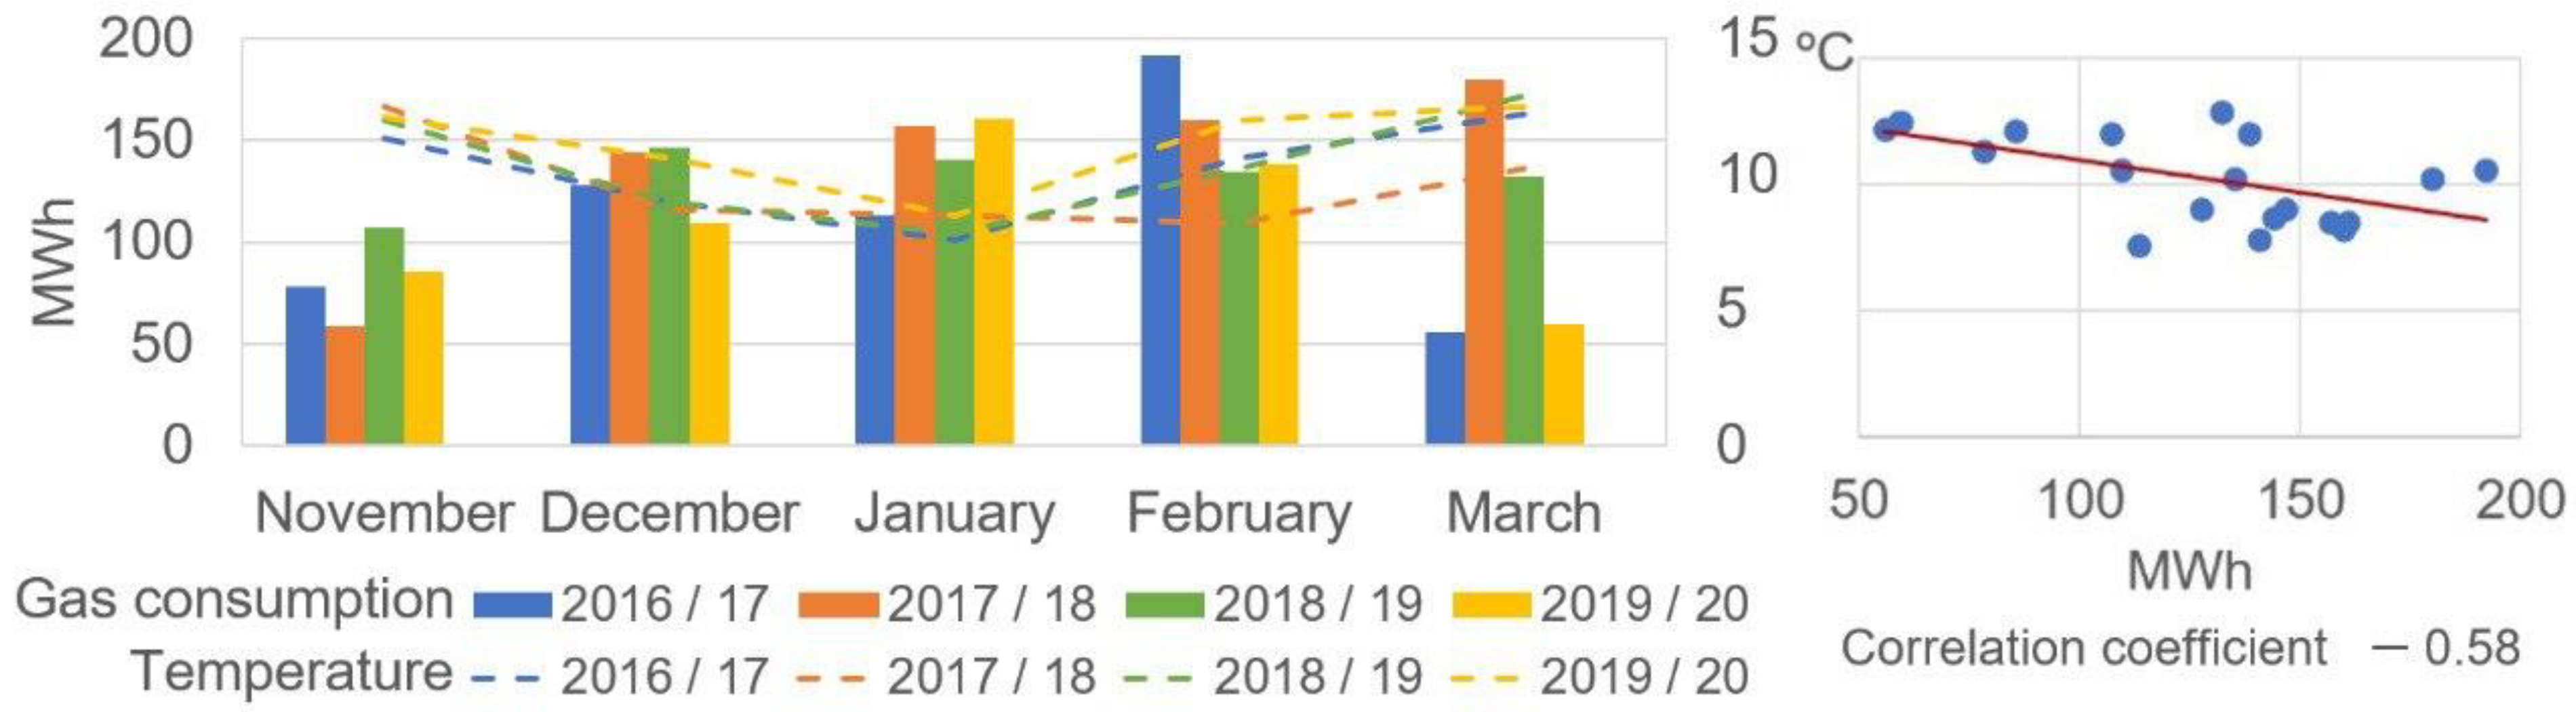
- It is not possible to establish a relationship between consumption and comfort or occupancy conditions, or to adapt the supply to the specific circumstances of the case study. Historical and habitual consumption is known. On the one hand, the gas consumption sensors in the boiler show peaks of 0.5 m3/min on average (Figure 4), but it is impossible to discern which part belongs to the building under study, as there are no flow meters for each branch. On the other hand, only general monthly invoices are available for the entire EPCC site. Furthermore, natural gas consumption shows an upward trend on the invoices up to January 2019, when it starts to decrease. The maximum monthly record was 17,086 m3 in February 2017. Higher consumption is observed in January and February, with consumption being zero from May to September (both included). In October and April there is only consumption for a few days. The monthly average from November to March is 10,899 m3, with a wide dispersion of results (Figure 8).
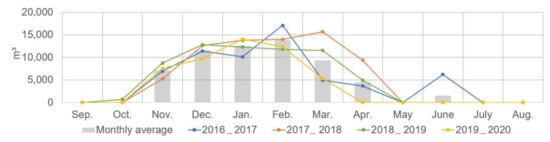 Figure 8. Evolution of monthly gas consumption by heated volume, academic years 2016/17 to 2019/20.
 - (h)
- There is a moderate-to-low correlation between winter consumption and outdoor temperatures, with a coefficient of −0.58. This implies that both variables exhibit an inverse relationship, meaning that higher temperatures are associated with lower consumption, and vice versa. However, some exceptions should be mentioned: January 2020 was the warmest January in the series, but also the one with the highest consumption; January 2017 was the coldest, but also the one with the lowest consumption. The scheduling is currently based on a fixed timetable of working days, without taking into account outdoor temperature variations, forecasts, or actual indoor temperatures (Figure 9).
 Figure 9. Comparison and correlation of total monthly gas consumption and average monthly temperatures in Cáceres in the winter months, from November to March, from 2016/17 to 2019/20; data from invoices and the national climate service [39].
3.2. Identification of Strategies
On the one hand, regarding comfort in terms of air quality and maximum CO2 concentrations, the only appropriate strategy is controlled air renewal in buildings (later sections of this paper will address this issue). On the other hand, in terms of thermal comfort, it is necessary to know in advance the situation in the different climatic periods, in order to define strategies for improvement. Once this has been determined, it is possible to analyse the behaviour of the building when these strategies are applied. Therefore, a model is used as the basis for energy simulations.
3.2.1. Approach to Thermal Situation
A climograph on a psychrometric chart [40] was drawn up to check the monthly hygrothermal conditions of the climate in question and to identify indoor strategies, both passive and active, to be adopted to improve them. The data (maximum and minimum temperature and relative humidity) were collected from the weather station located in the municipality of Cáceres (historical records dating from 1981 to 2010) [41]. Each monthly value was represented by a coloured line positioned in different areas of the chart.
Therefore, according to the chart, EPCC is in thermal comfort for a specific period in the summer, spring, and autumn months (including the area corresponding to internal gains when the building is occupied). In these months, the hottest midday hours must be excluded, when the chart suggests ventilation or nighttime convective cooling. In addition, the coolest night hours in spring and autumn are uncomfortable; the chart then suggests passive solar heating. In December and January, conventional heating is required. Likewise, the appropriate passive strategy for temperatures above 20 °C may be solar protection. In summary, the best strategies are solar protection and nighttime natural ventilation in the warm period, and passive solar heating and conventional heating in the cold period (all passive strategies except for the last one, which is active) (Figure 10).
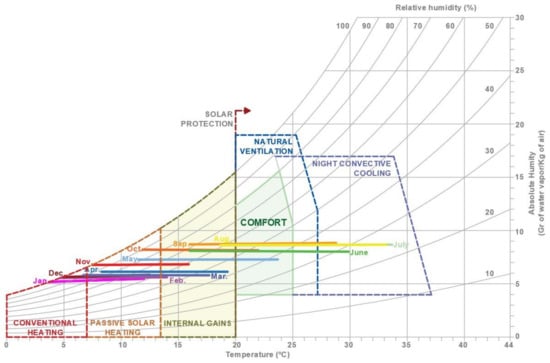
Figure 10.
Givoni psychrometric graph of the climate of Cáceres.
3.2.2. Energy Simulation
Energy model simulation (Design Builder v.7.0.2.004) [42] was used to come up with findings that could validate previous strategies obtained in the psychrometric chart. The methodology used was based on comparing the results of the energy exchanges and indoor temperatures obtained between the simulation of the base case model (representing the initial situation) and others, in which some key parameters had been modified [43]. The simulated modifications consisted of adding shading in the cold months and removing it in the warm months, as well as replacing daytime ventilation with nighttime ventilation in the warm months.
To carry out the comparison, an energy model was defined. To that end, site data were introduced (mainly location, altitude, wind exposure level, orientation, and hourly weather data from the EnergyPlus database, 2007–2021, including day–night behaviour). The activity template was “Universities and Colleges”, to which the daily timetable was assigned (from 8 a.m. to 10 p.m. during the school period, excluding weekends and August, when the building is closed; and from 8 a.m. to 3 p.m. during the non-teaching period in June and July). An occupancy density of 0.23 persons per m2 was established (weighted average by use and type of activity according to the building design of the evacuation spaces [44]), and a metabolic rate of 133 W/person was taken into account (weighted average according to the activity spaces developed in Section 4.3.1). Clothing and equipment were also adjusted: 0.5 clo in warm periods, 1 clo in the cold periods, and 30.81 W/m2 for computers and other equipment.
Additionally, architectural and constructive features were defined. The building envelope consists of a 1-foot brick wall, 5 cm of insulation, and a 7 cm brick camera wall. The roof is flat and inaccessible, with 5 cm of insulation. The openings are made up of aluminium without a thermal break, and with double glazing and obsolete shutter boxes with a high thermal break. This building also has large roof skylights made of thin polycarbonate without shading. To complete the characterisation of the building envelope, thermographic, thermal transmittance, and air tightness tests were carried out. These tests identified thermal breaks and infiltrations (0.70 ren/h). The presence and effectiveness of thermal insulation was also confirmed, both in the walls and in the roof.
Data for open windows were estimated according to space uses. In summer, a ventilation and shading opening area of 20% was programmed according to the occupancy schedule. Natural ventilation, corresponding to the manual operation of windows and doors, was set at 5 ren/h [37], according to the above schedule (1 ren/h during school hours and 0 ren/h during non-teaching hours). Finally, no additional energy supply was introduced into the model, as the building has no facilities of its own.
In order to simplify the analysis of the results, the rooms that are adjacent to one another and have a similar use were grouped together. In this way, four large zones were defined, differentiated by floor and orientation (excluding bathrooms and communication cores, located at the end of the building under study) (Figure 11). In this paper, only the data for the ground floor of the eastern zone are presented, as similar behaviour was observed in the upper floor and the western zone.
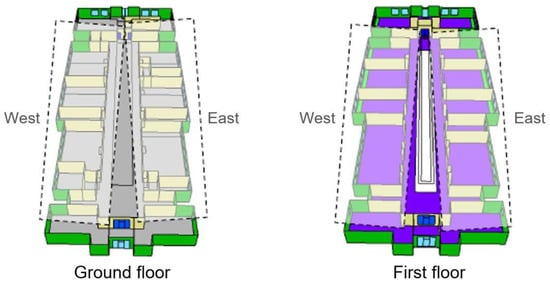
Figure 11.
Analysis zones according to the floor plan and orientation of the model.
- (a)
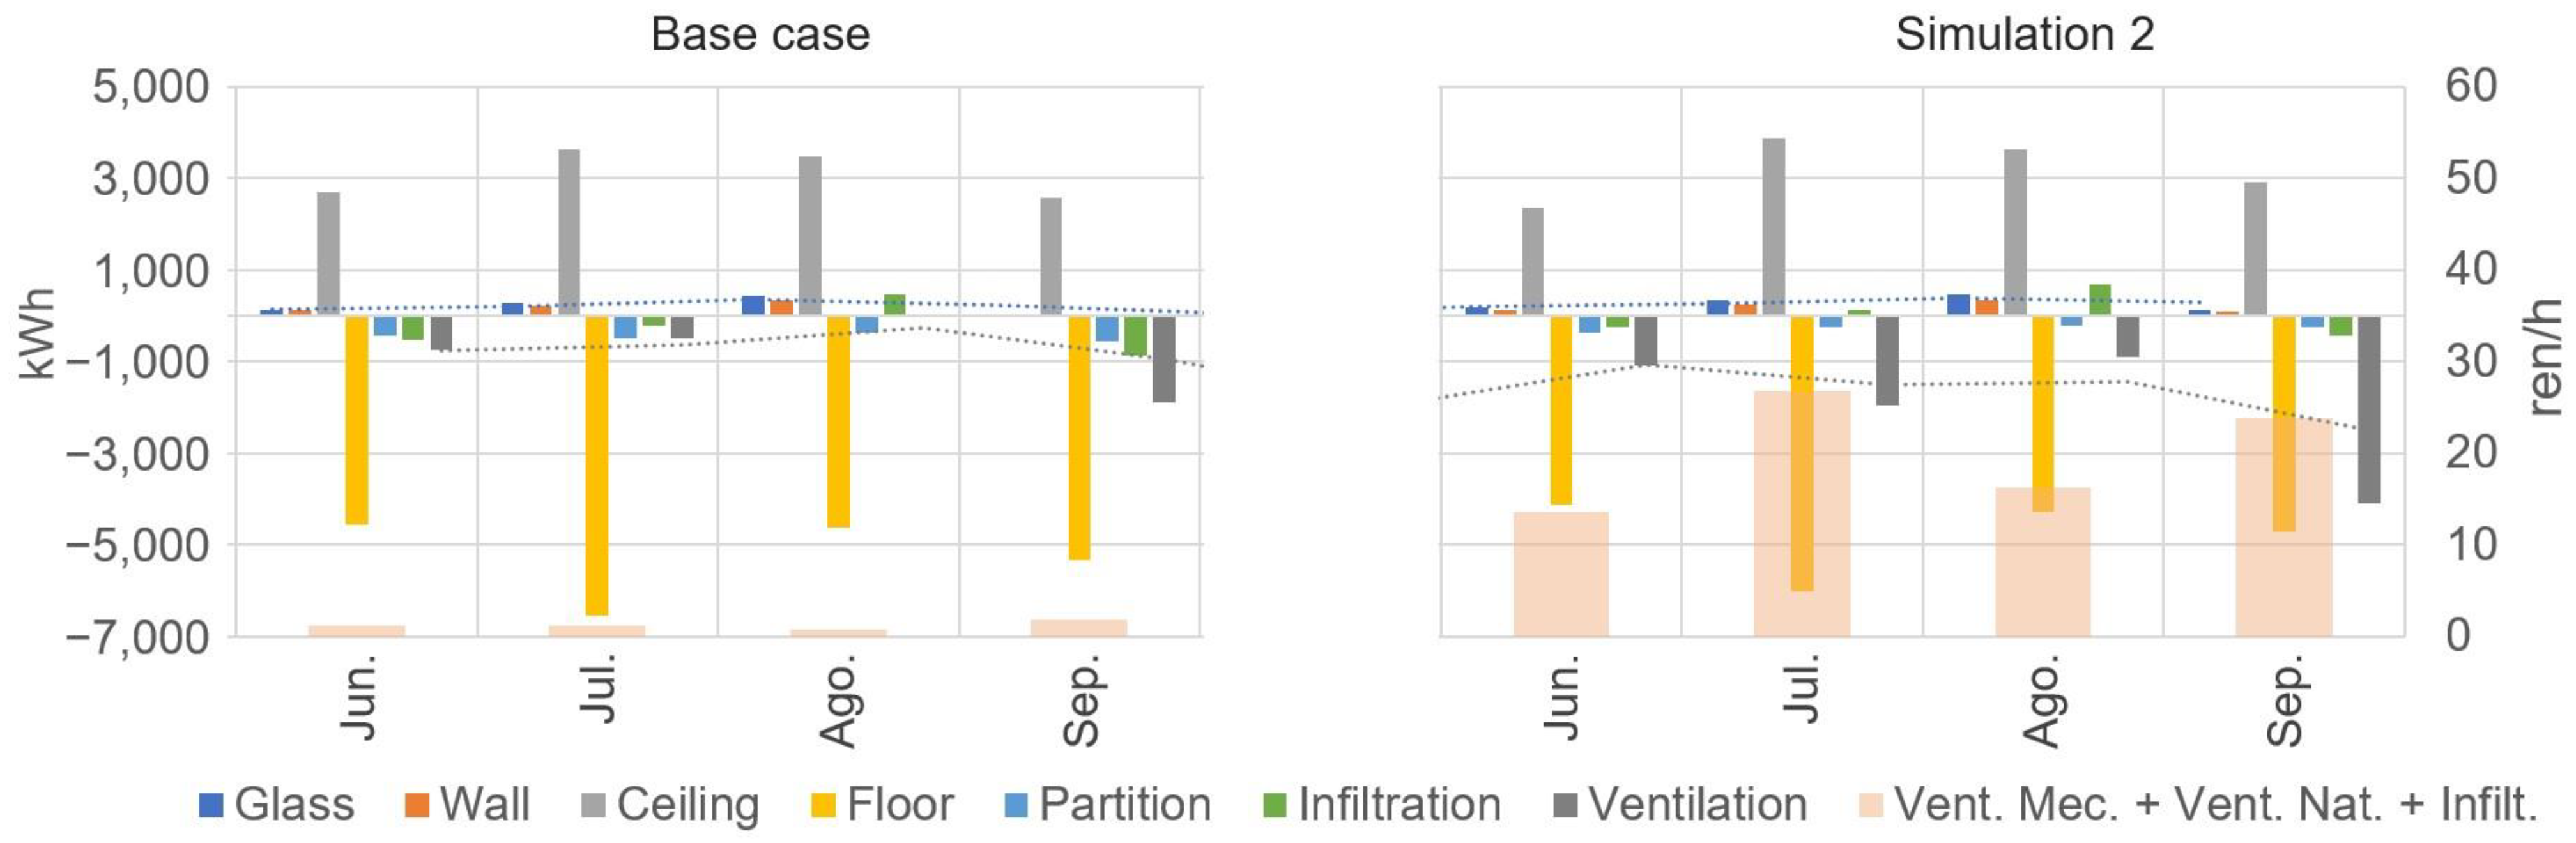
- Simulation n° 1: Solar shading in the openings during the cold period and solar gain during the warm period. These unfavourable situations occur very often when the blinds in the classrooms and offices are not raised (which also forces the lighting to be switched on when it is not necessary), or when the Sun´s rays overheat the spaces during the hottest season. The year was divided into two periods: cold, from 1 October to 31 March, and warm, from 1 April to 30 September. Simulation 1 thus removed the shading from the model in summer and introduced it in winter, and then it compared the new distribution of heat flow with the base case simulation. This shows that the gains from lighting, occupancy, and computers remain the same, and that there are quite similar annual exchanges (<±25% difference between the two flows and <3000 kWh): losses through floors, air infiltration, and external ventilation, and gains through ceilings. There is a greater difference (>±25% and <3000 kWh) through partitions (losses) and external walls (gains), which increases (>700% and <3000 kWh) through glazing, which is the weakest part of the enclosure (almost always losses). However, the most significant exchanges are those through solar gains (around 1000% more), which represent 23,386 kWh more thermal gains in summer and 15,854 kWh more losses in winter (2.948% and 5.012% of the total exchanges taking place in the building, respectively) (Figure 12).
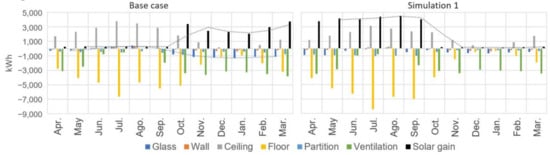 Figure 12. Comparison of heat exchanges in the area corresponding to the east-facing ground floor, between the base case and simulation nº 1 (with solar shading in the cold period and without it in the warm period).
On the other hand, comparing the temperatures between the base case and simulation n° 1, it can be seen that when the solar radiation hits the east façade, there is a significant change in the indoor operating temperature of up to 3 °C between the two, both in the warm period (increasing) and in the cold period (decreasing). Figure 13 shows two extreme weeks (one from each period) in which the air conditioning is not activated: the increase rises from 8 h and reaches its maximum at 12 h in the case of solar protection not being activated during the warm period (corresponding to the month of August) and being activated during the cold period (corresponding to the month of March). In both cases, the damage is maintained during the day, with higher temperatures of 1.5 °C in summer and 1 °C in winter. The differences between the two models with respect to indoor relative humidity were not significant.
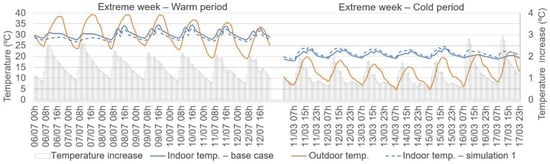
Figure 13.
Comparison of the thermal behaviour in the east-facing zone between the base case and simulation n° 1 with solar shading in winter and without it in summer.
- (b)
- Simulation n° 2: Activation of natural ventilation through windows at night during the warm period. This favourable situation does not usually occur in most public buildings, where there are no ventilation instructions when the buildings are closed (sometimes due to security concerns). In addition, it is common to open windows during the day, even though the outdoor temperature is much higher. For the simulation, windows’ natural ventilation was activated only at night, from 0 to 8 a.m., every day from June to September (when the outdoor temperature was lower than the indoor temperature, and the latter was above the comfort temperature), and the hourly air exchange rates were increased to the maximum (which means going from 12 ren/h in June to 25 ren/h in July, depending on the weather conditions). This compares the new distribution of heat flows with the base case simulation, showing that almost all exchanges remain similar (0%) in terms of lighting, solar, computer, and occupant gains (<±20% and <2000 kWh), and through walls, ceilings, floors, and partitions; (<−30% and <300 kWh) in glazing. However, the most significant difference in exchanges is through natural ventilation, which increases by 155%, representing an additional 4817 kWh of thermal reduction (Figure 14).
 Figure 14. Comparison of heat exchanges in the east-facing zone between the base case and simulation n° 2, with activation of natural nighttime ventilation in the warm months.
With regard to the analysis of temperatures, it can be observed that there is a constant decrease—in this case of up to 2.5 °C—in the month of July, which occurs mainly at night and is maintained until 11 a.m., at which point the temperature begins to increase progressively until 10 p.m., when a reduction of 1 °C is still maintained. In the month of August, when there is no gain due to occupancy, the decrease reaches 3 °C. The differences between the two models with respect to indoor relative humidity are not significant (Figure 15).
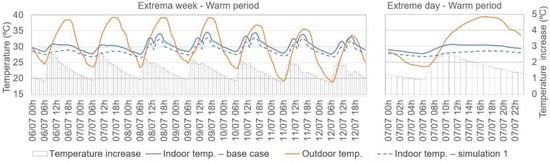
Figure 15.
Comparison of temperature in the east-facing zone between the base case and simulation nº 2, with natural nighttime ventilation activated in a typical week and day of a warm month.
3.3. Action Proposal
The standard EN ISO 52120-1 [28] was used to select the different proposed actions that were feasible in the case study. This standard specifies a structured list of control, automation, and technical management functions that contribute to the building’s energy performance. Those BAC and TBM functions with an impact on the building energy performance were selected (in addition, the targeted action types for each case are specified in Table 1):

Table 1.
Proposed actions for building heating operations according to EN ISO 52120−1 [28].
- (a)
- Ventilation control that brings air into the building. The functions that can be implemented in this case are supply airflow control related to occupancy (VENT_RMFLOW_CTRL), room air temperature control by the ventilation system (VENT_RTEMP_CTRL), ventilation systems that allow the OA ratio or airflow to vary (VENT_OAFLOW_CTRL), and free mechanical cooling (VEN_FREECOOL_CTRL).
- (b)
- Blind control to prevent overheating (BLIND_CTRL). An automatically controlled motorised operating function was selected to allow solar gain at the required times.
- (c)
- Heating Control. The following function was selected: heating automatic control on emission units (HEAT_EMIS_CTRL_DEF), as this allows for free modification of the spaces and programming of control of rooms, sectors, floors, façades, halls, etc., covering all of the other possibilities and allowing each space to be adapted to its heating needs at a much lower cost. Functions that act on the distribution network are discarded, since they would require the installation of regulation keys in each branch or by means of new branches (by floor, by room, by sector, by the location of the radiators (windows/corridors)). The following were also discarded: those that act on the pumps, or with control on the general boiler panel.
Finally, on the basis of the above, the following actions (outputs) were proposed: 1. Installation of air exchangers with heat recovery based on time schedule, occupancy, air temperature, heating/cooling loads, number of people, or indoor air parameters and nighttime air temperature. 2. Installation of automated motorised blinds. 3. Installation of thermostatic valves (Table 1).
4. Deployment of the Automation System
At this stage, an automation assessment was carried out on the building requirements, whereupon the subsequent implementation of the automated system began. To this end, European standards were applied. On the one hand, the design, focusing on the proposed actions, considered the TBM according to EN-52120-1. The functions to be integrated in the case study were as follows: setback and adaptation of BAC setpoints according to room/zone operating modes (BMS_SP), runtime management (BMS_RT), detection of faults in technical building systems and support for diagnosis of these faults (BMS_FD), and reporting of information on energy consumption and indoor conditions (BMS_RPR) (Table 1 and Section 4.1). On the other hand, the EN 50090-1 series focuses on the HBES Open Communication System and provides specifications for a communication network with an automated, decentralised, and distributed process control, independent of any specific microprocessor platform or architecture. All devices in the designed network form distributed applications that are able to interact with one another, creating a comprehensive and multi-domain communication system with unified service and integration solutions for IP-enabled media (Section 4.2).
4.1. Devices
A set of devices was selected to fulfil the designed actions, with the requirements of being low cost and subsequently connectable. Table 2 shows these devices, relating the measured parameters (sensors or inputs) to the controlled actions (actuators or outputs).
Table 2.
Devices from inputs and outputs of the model.
Based on this framework, input and output devices were selected based on the following characteristics (specific technical characteristics in Table 3 and Table 4):
Table 3.
Technical characteristics of the input devices and thermostatic valves.
Table 4.
Technical characteristics of the air exchangers.
- -
- Compact, lightweight, low-cost, and easy to install.
- -
- Low consumption: Low-power batteries (<3.6 W) lasting between 1 and 10 years. Data transmission is achieved through a LoRa network (readings were configured to occur every 20 min to reduce battery consumption). In the case of camera data, the energy power is <4.5 W for wired networks and a maximum of 35 Wh and 310 Wh in air exchangers.
- -
- Accurate measurements: Temperature range varies from −40 or −20 to 60 or 80 °C, with a typical accuracy of ±0.3 to ±0.6 °C. Humidity range spans from 0 to 100%. The accuracy is ±3/±5%, respectively. CO2 concentration measurements range from 400 to 10,000 ppm, with an accuracy of ±3–10 ppm.
4.1.1. Input Devices
This section lists the input devices whose function is to collect information on the different parameters and deliver it to the control system. The number of units installed is also specified. In addition, other data sources are used that do not require a physical device.
- (a)
- Indoor hygrothermal and CO2 concentration sensors (10 units) [45]: located in spaces with higher occupancy, affixed to vertical walls at an approximate height of 1.5 m and centrally located within each space.
- (b)
- Window open/closed status sensors (94 units) [46]: deployed on each window of the building. These units collect temperature and humidity data. The communication device is screwed to a vertical wall near the window, and the sensor itself, connected by a cable, is attached to the window frame at the same height.
- (c)
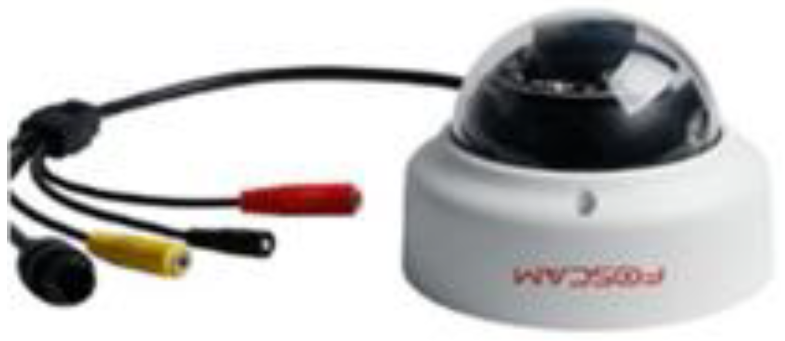
- Presence cameras (19 units) [47]: installed in the most frequently used classrooms, they record the occupancy fusing image analysis software developed for this purpose using deep convolutional neural networks. The cameras are installed on the ceiling or on the wall next to the teacher’s desk. The average time to capture, decode, and process each image is 2 s, so each instance of this program can process 30 cameras per minute given sufficient hardware resources.
- (d)
- Other data sources currently used include time schedules provided by the institutional room reservation software, and meteorological data acquired from the national climate service [41].
4.1.2. Output Devices
This section lists the output devices responsible for executing actions within the system:
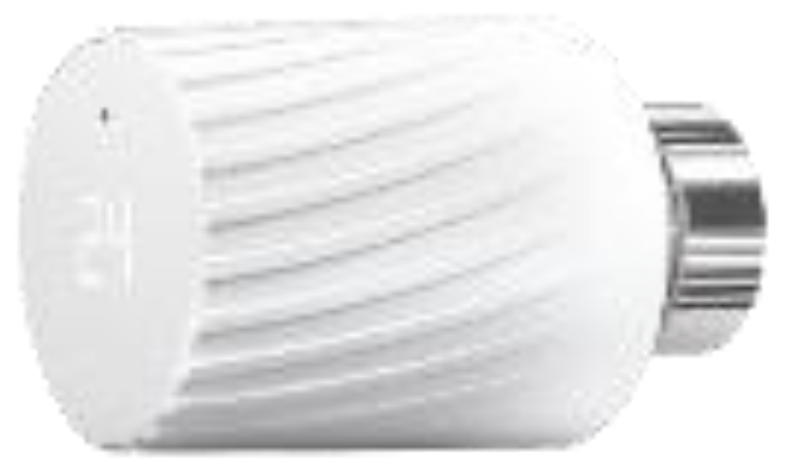
- (a)
- Thermostatic valves (185 units) [48]: Flow control at the emitters is required based on the operating conditions of the indoor and outdoor environment. Additionally, they monitor indoor temperature and humidity data, geographical position, battery level, and open window warning.
- (b)
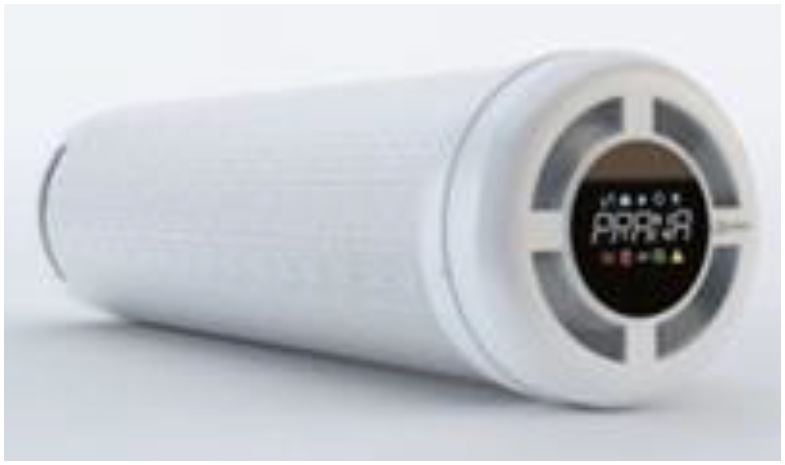
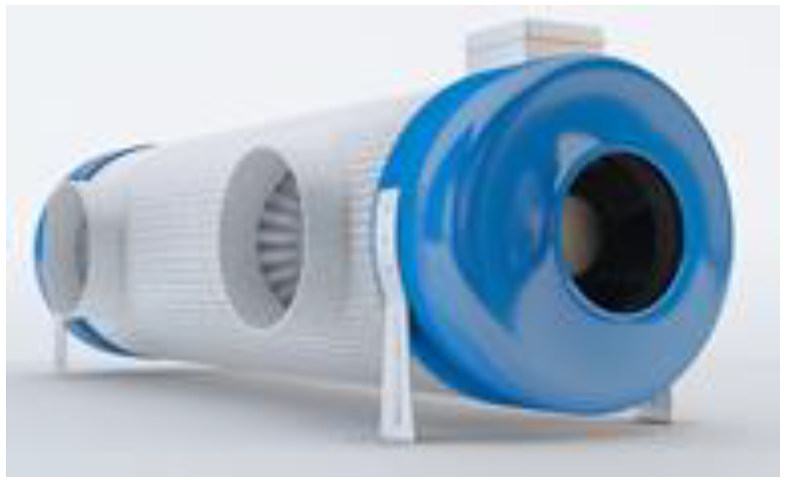
- Air exchanger with heat recovery (4 units): The requirements of the system are to supply properly filtered outdoor air to the building and to extract indoor air, while exchanging heat as required. In addition, it facilitates nighttime operation in bypass mode. In calculating the equipment, the minimum ventilation flow rate for educational buildings of 12.5 dm3/s per person was used (indoor air quality level IDA 2, guaranteeing acceptable pollutant-free air by the extraction and discharge of stale air [37]), and an occupant density of 0.23 persons/m2 was determined (Section 3.2.2). The outdoor air quality is considered to be ODA 1, i.e., pure air, which may contain temporary solid particles such as pollen. The extract air is class AE 1, i.e., low pollution level, which requires a minimum extract airflow rate of 2 dm3/s per m2.
Two types of very low consumption systems were tested: a “domestic” system [49] in low-occupancy rooms (a laboratory (Robolab) and a classroom (Sun)) and an “industrial” system [50] in two large classrooms (Novell and Norba). These allowed the air temperature to be maintained by means of a superconducting, antibacterial, and antiseptic copper heat exchanger inside the unit’s casing. When the counterflows operate simultaneously, the extract air transfers part of its temperature to the supply air as they both pass through the heat exchanger, but without creating multidirectional mixing of the airflows.
With regard to installation, the domestic system does not require ducts, and the recuperator is installed embedded above the false ceiling. The industrial unit, on the other hand, is installed under the ceiling together with the supply and extract ducts, which are connected to the outside through two boreholes in the wall.
- (c)
- Automated motorised blinds (91 units): The requirements of the system are to prevent solar gain in hot weather and to provide protection in cold weather. It is installed on all existing manual roller shutters by replacing the drum shaft with a new one incorporating a tubular motor.
4.2. IoT Architecture
A complete monitoring and control system was designed and deployed for the prototype building, meeting the following criteria:
- -
- Open-source or software with a permissive licence software.
- -
- Multi-protocol, admitting any kind of IoT device to publish or take requests.
- -
- Scalable, easily extended and replicated in other facilities.
- -
- Modular, with containerised services and databases to facilitate maintenance and improvement.
- -
- Self-monitoring and self-diagnosing, with a parallel monitoring infrastructure that holds local models of each service and supervises their correct functioning.
- -
- User-friendly, to facilitate the controller’s development and tuning.
- -
- External access via microservices for connecting visualisation software and dashboards.
- -
- Flexible software development kit access for custom coded data analysis.
Figure 16 shows a schema of the architecture. It is divided vertically into five layers, which are explained from bottom to top.
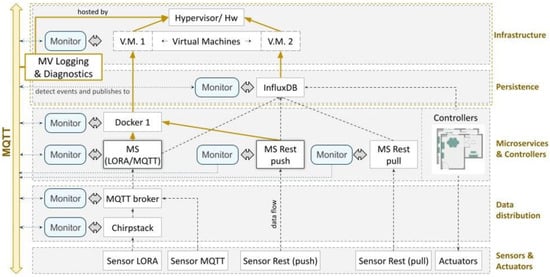
Figure 16.
IoT architecture.
The first two layers comprise the data transport and distribution prior to the ingestion by the microservices layer. This takes advantage of the existing infrastructure, cable, and local WiFi network but also extends it with the deployment of LoRa routers and antennas. Several protocols are supported, including MQTT, REST, and Modbus over IP.
- -
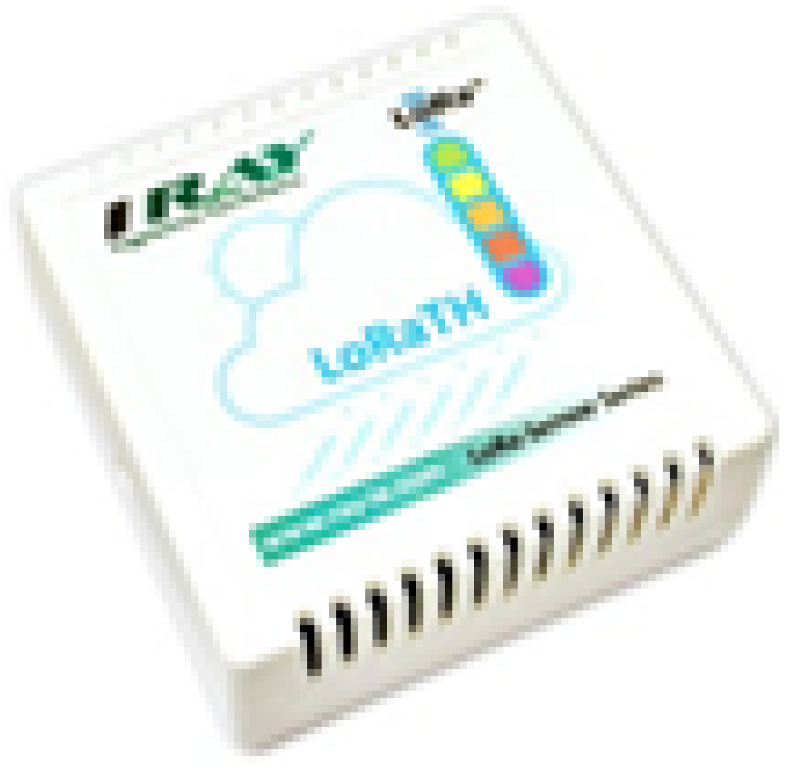
- LoRA communication is supported by routers connected to the local Ethernet and configured to send all received packets to an instance of Chirpstack [51], which transforms them into JSON strings and publishes them via MQTT. Thermostatic valves, window open/close switches, and environmental sensors use LoRa.
- -
- Devices that support MQTT can publish their data directly. Motorised blind controllers connect to the local network using WiFi (with ESP32) and send and receive data using MQTT.
- -
- Environmental sensors send data using REST over a WiFi connection.
- -
- Several external sources are periodically queried to obtain meteorological data, air quality data, and other variables that may be of interest for future analysis of the building’s behaviour.
The third layer comprises the set of microservices that receive or query the data sources, validation, filtering, and storage in the databases. The Python language is used to code the services, which are grouped according to the nature and precedence of the data. Each group runs inside a container, which, in turn, runs inside a virtual machine with a public IP. Given the variety of the data sources and the fact that many are commercial devices with their own predefined format or external websites that tend to use custom CSV or JSON structures, the possibility of a common data format was ruled out. Instead, the flexibility of the microservices was used to quickly code specific solutions for each case. Once the data have been received, they are validated against the internal data model and stored in a database that is kept on a separate private subnetwork.
The fourth layer describes how data persistence is achieved using a time-series-oriented database, InfluxDB, which stores the incoming data managed by the microservices. An important feature of this architecture is its self-monitoring capability, since incidents and failures steadily increase as more devices and controllers are installed. The creation of a parallel architecture to control the nominal one has been proposed (these scripts are shown in blue boxes in Figure 16). Thus, all processes are monitored by tracking their external state in terms of operating system variables (i.e., aliveness, memory, CPU usage). The microservices that receive or request data from external devices are extended with additional code that learns and keeps track of the identity and interacting frequency of all devices reaching that service. These anomalies are published to a dedicated virtual machine using a separate MQTT broker. A process in this machine receives all notifications from the monitoring scripts and runs diagnostic algorithms. Those events that are considered abnormal and the results of their evaluation are reported to the technicians for further intervention. In their current state, diagnostic algorithms are limited to simple model comparisons, mostly based on predefined thresholds, but the gathered data can be used in machine learning algorithms to induce more complex classifiers.
In the fifth layer, inner virtual machines run on a cloud or local infrastructure.
4.3. Control System Design
Finally, the different logical processes were designed with respect to the previous actions and devices. First, the setpoint temperatures had to be adjusted.
4.3.1. Adjustment of the Setpoint Temperatures
Before starting to design the operation of the control system, it is necessary to establish the setpoint temperatures for the operation for each type of activity. To this purpose, the metabolism was taken into account by adding the issue of adaptive comfort. Then, the regulated comfort temperature was corrected: the lower limit of 21 °C for the cold period and the upper limit of 25 °C for the warm period (in both cases, the lowest consumption limits were chosen). In addition, two types of activity were defined: 1. sitting in offices and classrooms, and 2. laboratory work and walking in common areas. The results indicate that although it is not necessary to correct the operative temperature of the spaces where activity 1 takes place, the temperature of activity 2 spaces has to be reduced by 3.12 °C to achieve comfort. In the warm period, the air exchanger will always be activated at night to avoid accumulated overheating, since the equipment is low-consumption. If it is a non-working period, there will be no setpoint temperature (Table 5).
Table 5.
Setpoint temperatures according to activity.
4.3.2. Logical Processes
Flow diagrams were used to design the logical processes of the output devices (automated motorised blinds, thermostatic valves, and air exchangers), for which the Unified Modelling Language was applied. Using inputs, decisions, and terminals, the execution flow is expressed by arrows connecting the start and end points of the algorithm process. These flows can be iteratively optimised to any modification as a result of the installation monitoring operation for greater adaptability and efficiency (Figure 17). The programming is detailed below:
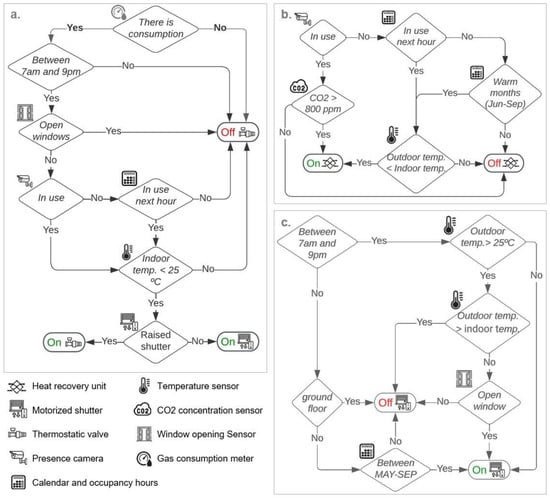
Figure 17.
Automation and control flowchart: (a) heating control, (b) ventilation control, and (c) shield control, for occupation in the working period in activity 1.
- (a)
- Heating control: The terminals—in this case, thermostatic valves—are activated according to decisions made on the basis of inputs such as time, window status, occupancy, schedule, indoor temperature, and shutter status. In addition, following the flow lines indicated in the diagram, the valves cut off the hot water supply to the terminals when they reach the setpoint temperatures defined for each space. Cutting off this supply means reducing the flow of hot water to the radiators and, in certain situations, reducing gas consumption. This also reduces the thermal gap that the boiler has to overcome, as the temperature of the return water flow drops less because it does not flow through the radiators.
- (b)
- Ventilation control: The system terminals are activated according to decisions based on the following inputs: occupancy, schedules, temperature, and CO2 concentration of each space. According to this programming, the recovery unit can operate in two different situations:
- -
- For cooling in the summer months, when the nighttime outdoor temperature is lower than the indoor temperature, the air exchanger is activated with its bypass function.
- -
- To improve the indoor air quality, when the rooms are occupied and the CO2 concentration level exceeds the limits, without the need to open the windows manually.
- (c)
- Blind control: The terminals are shutter motors that operate according to decisions made on the basis of the following inputs: date and time, indoor and outdoor temperature, window status, and room location within the building. The terminals can be used for solar shading in winter and protection in summer. The actuators have manual switches that allow the blinds to be raised or lowered as required while the command remains on the system. In this way, glare can be avoided, or situations of total darkness can be achieved when the use requires it.
5. Conclusions
After proposing a methodology for the design of an automated system to improve thermal performance, this article addresses the current research gaps for the resolution of several stages: the choices of equipment and its adjustment to the system, the assessment of the automation requirements, and the design of the control system in a large building in operation.
Data on hygrothermal comfort, air quality, and operational heating systems were evaluated. Afterwards, the psychrometric chart and the energy simulation showed the most effective strategies, while also taking advantage of the strategies of passive architecture. Based on the diagnosis of the building, strategies were proposed according to European standards on automation, control, and open communication systems. These strategies converged in the selection of the input and output devices using open sources and low cost, allowing for the development of replicable and scalable systems. The final design of the algorithms allowed us to close the system design process.
The main theoretical and practical implications of this paper are as follows:
- -
- Without investment in the envelope and systems, large buildings in operation can improve thermal performance.
- -
- Prior knowledge plays a crucial role in identifying key issues (such as timetables or facilities, operations, actual occupancy of spaces, comfort and consumption deficiencies, climate adaptations, etc.) and designing proper strategies before initiating the automation design process.
- -
- Energy simulations facilitate decision-making by effectively targeting actions.
- -
- Standards provide a useful framework for focusing action, although their slow updating makes it difficult to track progress in implementation.
- -
- Different variables such as occupancy, air quality, or building states should be taken into account to optimise energy efficiency and user comfort during the building’s operation.
- -
- Mandatory features for competitive automation systems in building savings include real-time monitoring, low cost, low consumption, open-source compatibility, and scalability.
- -
- Given the complexity of the processes involved in this type of development, incorporating self-monitoring capability is appropriate. The proposed system has low cost and low power consumption but, like any automation system, it requires preventive and corrective maintenance and continuous inspection.
In conclusion, the proposed methodology successfully accomplishes the research objectives. Through its implementation, the hypothesis of achieving automated control for improved energy performance and user comfort in operational buildings was validated. Furthermore, the methodology exhibits adaptability, making it easily transferrable for application in other building contexts.
It is important to acknowledge the following limitations in this research:
- -
- Strategic placement of certain sensors during the initial stages of implementation is vital to enable an accurate initial diagnosis.
- -
- Certain variables in buildings may remain uncontrollable or pose challenges in measurement, necessitating the design of control architectures that are capable of effectively coping with and compensating for disturbances.
- -
- The real-time data collection and analysis carried out initially prove satisfactory for the current methodology. However, repetition of these processes in the future will confirm or disconfirm any concerns. Consequently, continuous review is essential, given that buildings continually adapt to their dynamic needs and circumstances.
Furthermore, several recommendations for future work are suggested:
- -
- Research focusing on predicting personal thermal comfort assessment models holds crucial significance for informed decision-making in designing and controlling buildings to achieve optimal HVAC. While this article employs operating temperatures defined by Spanish regulations for the automation system’s operation, future research could consider integrating temperatures related to other setpoints, closer to individual thermal comfort preferences, within the system flow.
- -
- The proposed methodology for building automation to enhance thermal performance could be extended to control other functionalities. First and foremost, a specific assessment of each functionality should be conducted, followed by the design of appropriate strategies and functions. EN ISO 52120-1 provides a list of other control, building automation, and technical building management functions contributing to the energy performance of buildings, such as domestic hot water supply, cooling, and lighting. Additionally, emergency and security control services may be incorporated. The selection of suitable devices is imperative to ultimately design an efficient control system.
Author Contributions
Conceptualization, B.M.P.; methodology, B.M.P. and M.L.B.; software, P.B.G.d.C.; validation, B.M.P. and M.L.B.; formal analysis, B.M.P. and M.L.B.; investigation B.M.P. and P.B.G.d.C.; resources, B.M.P.; data curation, M.L.B.; writing—original draft preparation, B.M.P.; writing—review and editing, B.M.P., M.L.B., F.S.C., and P.B.G.d.C.; visualization, M.L.B.; supervision, B.M.P. and P.B.G.d.C.; project administration, B.M.P.; funding acquisition, B.M.P. and P.B.G.d.C. All authors have read and agreed to the published version of the manuscript.
Funding
This publication was translated with help from funding granted by the Ministry of Economy, Science, and Digital Agenda from the Regional Government of Extremadura and by the European Regional Development Fund of the EU through the reference grant GR18032.
Data Availability Statement
Not applicable.
Acknowledgments
This research was made possible thanks to the project INNOINVEST 0605_INNOINVEST_4_E (Promotion of business investment in innovation of energy products for buildings) of the Operational Programme EP-INTERREG V A Spain Portugal (POCTEP) (2019–2023).
Conflicts of Interest
The authors declare no conflict of interest.
Abbreviations
| Specific abbreviations used: | |
| BAC | Building automation and control |
| BACS | Building automation and control system |
| EMS | Energy management system |
| EPB | Energy performance of buildings |
| EPCC | School of Technology of Cáceres |
| HBES | Home and building electronic systems |
| HVAC | Heating, ventilation, and air conditioning |
| IAQ | Indoor air quality |
| IEQ | Indoor environmental quality |
| PPD | Percentage of persons dissatisfied |
| TBM | Technical building management |
References
- United Nations Environment Programme, Global Alliance for Buildings and Construction. 2022. Available online: https://globalabc.org/ (accessed on 18 June 2023).
- International Energy Agency, Buildings. Sectorial Overview. 2022. Available online: https://www.iea.org/reports/buildings (accessed on 5 November 2022).
- The European Parliament and the Council, Directive 2002/91/CE, Relative to the Energy Efficience in Buildings. 2002. Available online: https://eur-lex.europa.eu/legal-content/EN/TXT/?uri=celex%3A32002L0091 (accessed on 18 June 2023).
- European Climate Infrastructure and Environment Executive Agency, Digitalization in Urban Energy Systems Outlook 2025, 2030 and 2040. 2022. Available online: https://cinea.ec.europa.eu/publications/digitalization-urban-energy-systems_en (accessed on 29 July 2023).
- International Energy Agency. Energy Efficiency and Digitalisation. Available online: https://www.iea.org/areas-of-work/promoting-energy-efficiency/energy-efficiency-and-digitalisation (accessed on 9 January 2023).
- EN 50090; Home and Building Electronic Systems HBES. European Standardization Committee: Bruxelles, Belgium, 2020.
- Rao, A.S.; Radanovic, M.; Liu, Y.; Hu, S.; Fang, Y.; Khoshelham, K.; Palaniswami, M.; Ngo, T. Real-time monitoring of construction sites: Sensors, methods, and applications. Autom. Constr. 2022, 136, 104099. [Google Scholar] [CrossRef]
- Al Dakheel, J.; Del Pero, C.; Aste, N.; Leonforte, F. Smart buildings features and key performance indicators: A review. Sustain. Cities Soc. 2020, 61, 102328. [Google Scholar] [CrossRef]
- Hajdukiewicz, M.; Byrne, D.; Keane, M.M.; Goggins, J. Real-time monitoring framework to investigate the environmental and structural performance of buildings. Build. Environ. 2015, 86, 1–16. [Google Scholar] [CrossRef]
- Tekler, Z.D.; Low, R.; Zhou, Y.; Yuen, C.; Blessing, L.; Spanos, C. Near-real-time plug load identification using low-frequency power data in office spaces: Experiments and applications. Appl. Energy 2020, 275, 115391. [Google Scholar] [CrossRef]
- Morkunaite, L.; Pupeikis, D.; Jurelionis, A.; Fokaides, P.A.; Papadopoulos, A. An Analytical Model for the Impact of Building Control and Automation Upgrade on Space Heating Energy Efficiency. Buildings 2022, 12, 1074. [Google Scholar] [CrossRef]
- Grassi, B.; Piana, E.A.; Lezzi, A.M.; Pilotelli, M. A Review of Recent Literature on Systems and Methods for the Control of Thermal Comfort in Buildings. Appl. Sci. 2022, 12, 5473. [Google Scholar] [CrossRef]
- Baqer, N.S.; Mohammed, H.A.; Albahri, A.; Zaidan, A.; Al-Qaysi, Z. Development of the Internet of Things sensory technology for ensuring proper indoor air quality in hospital facilities: Taxonomy analysis, challenges, motivations, open issues and recommended solution. Measurement 2022, 192, 110920. [Google Scholar] [CrossRef]
- Li, W.; Li, H.; Wang, S. An event-driven multi-agent based distributed optimal control strategy for HVAC systems in IoT-enabled smart buildings. Autom. Constr. 2021, 132, 103919. [Google Scholar] [CrossRef]
- Taheri, S.; Hosseini, P.; Razban, A. Model predictive control of heating, ventilation, and air conditioning (HVAC) systems: A state-of-the-art review. J. Build. Eng. 2022, 60, 105067. [Google Scholar] [CrossRef]
- Zou, H.; Zhou, Y.; Jiang, H.; Chien, S.-C.; Xie, L.; Spanos, C.J. WinLight: A WiFi-based occupancy-driven lighting control system for smart building. Energy Build. 2018, 158, 924–938. [Google Scholar] [CrossRef]
- Tekler, Z.D.; Low, R.; Yuen, C.; Blessing, L. Plug-Mate: An IoT-based occupancy-driven plug load management system in smart buildings. Build. Environ. 2022, 223, 109472. [Google Scholar] [CrossRef]
- Zhuang, D.; Gan, V.J.; Tekler, Z.D.; Chong, A.; Tian, S.; Shi, X. Data-driven predictive control for smart HVAC system in IoT-integrated buildings with time-series forecasting and reinforcement learning. Appl. Energy 2023, 338, 120936. [Google Scholar] [CrossRef]
- Merabet, G.H.; Essaaidi, M.; Ben Haddou, M.; Qolomany, B.; Qadir, J.; Anan, M.; Al-Fuqaha, A.; Abid, M.R.; Benhaddou, D. Intelligent building control systems for thermal comfort and energy-efficiency: A systematic review of artificial intelligence-assisted techniques. Renew. Sustain. Energy Rev. 2021, 144, 110969. [Google Scholar] [CrossRef]
- Liu, X.; Ren, M.; Yang, Z.; Yan, G.; Guo, Y.; Cheng, L.; Wu, C. A multi-step predictive deep reinforcement learning algorithm for HVAC control systems in smart buildings. Energy 2022, 259, 124857. [Google Scholar] [CrossRef]
- Alanne, K. A novel performance indicator for the assessment of the learning ability of smart buildings. Sustain. Cities Soc. 2021, 72, 103054. [Google Scholar] [CrossRef]
- Benavente-Peces, C.; Ibadah, N. Buildings Energy Efficiency Analysis and Classification Using Various Machine Learning Technique Classifiers. Energies 2020, 13, 3497. [Google Scholar] [CrossRef]
- Qin, H.; Wang, X. A multi-discipline predictive intelligent control method for maintaining the thermal comfort on indoor environment. Appl. Soft Comput. 2022, 116, 108299. [Google Scholar] [CrossRef]
- Sun, Y.; Zhang, Y.; Guo, D.; Zhang, X.; Lai, Y.; Luo, D. Intelligent Distributed Temperature and Humidity Control Mechanism for Uniformity and Precision in the Indoor Environment. IEEE Internet Things J. 2022, 9, 19101–19115. Available online: https://ieeexplore.ieee.org/document/9745524 (accessed on 18 June 2023). [CrossRef]
- Felius, L.C.; Hamdy, M.; Hrynyszyn, B.D.; Dessen, F. The impact of building automation control systems as retrofitting measures on the energy efficiency of a typical Norwegian single-family house. IOP Conf. Ser. Earth Environ. Sci. 2020, 410, 012054. [Google Scholar] [CrossRef]
- Ceballos-Fuentealba, I.; Álvarez-Miranda, E.; Torres-Fuchslocher, C.; del Campo-Hitschfeld, M.L.; Díaz-Guerrero, J. A simulation and optimisation methodology for choosing energy efficiency measures in non-residential buildings. Appl. Energy 2019, 256, 113953. [Google Scholar] [CrossRef]
- Ferrari, S.; Beccali, M.; Caputo, P.; Zizzo, G. Electricity Consumption Analysis of Tertiary Buildings: An Empirical Approach for Two University Campuses. J. Arch. Eng. 2020, 26, 05020005. [Google Scholar] [CrossRef]
- EN ISO 52120-1:2022; Energy Performance of Buildings—Contribution of Building Automation, Controls and Building Management—Part 1: General Framework and Procedures. European Standardization Committee: Bruxelles, Belgium, 2022.
- EN 15232-1; Energy Performance of Buildings. Impact of Building Automation, Controls and Building Management. European Standardization Committee: Bruxelles, Belgium, 2018.
- Ożadowicz, A. A New Concept of Active Demand Side Management for Energy Efficient Prosumer Microgrids with Smart Building Technologies. Energies 2017, 10, 1771. [Google Scholar] [CrossRef]
- Engelsgaard, S.; Alexandersen, E.K.; Dallaire, J.; Jradi, M. IBACSA: An interactive tool for building automation and control systems auditing and smartness evaluation. Build. Environ. 2020, 184, 107240. [Google Scholar] [CrossRef]
- Bonomolo, M.; Zizzo, G.; Ferrari, S.; Beccali, M.; Guarino, S. Empirical BAC factors method application to two real case studies in South Italy. Energy 2021, 236, 121498. [Google Scholar] [CrossRef]
- Van Thillo, L.; Verbeke, S.; Audenaert, A. The potential of building automation and control systems to lower the energy demand in residential buildings: A review of their performance and influencing parameters. Renew. Sustain. Energy Rev. 2022, 158, 112099. [Google Scholar] [CrossRef]
- INNOINVEST Project. Promotion of Business Investment in Innovation of Energy Products for Buildings. 2022. Available online: http://innoinvestproject.eu/ (accessed on 17 December 2022).
- Pozas, B.M.; Holgado, B.M.; Bonilla, M.L.; Ramírez, S.B.; de Castro, P.B.G. Iterative Optimization of a Social Inmotics-Based Method in Order to Make Buildings Smart and Resilient. Sustain. Cities Soc. 2022, 82, 103876. [Google Scholar] [CrossRef]
- Pozas, B.M.; de Castro, P.B.G.; García, M.B.; Domínguez, A.S.; Rodríguez, P.G.; Del Río Pérez, M. Improving energy efficiency in public buildings through social inmotics. In Construction Pathology, Rehabilitation Technology and Heritage Management; Rehabend 18; University of Cantabria: Cáceres, Spain, 2018. [Google Scholar]
- Reglamento Instalaciones Térmicas en los Edificios, RITE, BOE-A-2007-15820. 2022. Available online: https://www.boe.es/eli/es/rd/2007/07/20/1027 (accessed on 18 June 2023).
- ANSI/ASHRAE Standard 55-2020; Thermal Environmental Conditions for Human Occupancy. American National Standards Institute: Washington, DC, USA, 2020.
- Agencia Estatal de Meteorología. Weather Data. Available online: https://www.aemet.es/es/serviciosclimaticos/datosclimatologicos/valoresclimatologicos?l=3469A&k=undefined (accessed on 15 January 2023).
- Givoni, B. Comfort, climate analysis and building design guidelines. Energy Build. 1992, 18, 11–23. [Google Scholar] [CrossRef]
- Ministry of Ecological Transition and Demographic Challenge, Agencia Estatal de Meteorología. 2022. Available online: https://www.aemet.es/es/portada (accessed on 18 November 2022).
- DesignBuilder Software Ltd. DESIGN BUILDER. 2022. Available online: https://designbuilder.co.uk/ (accessed on 18 November 2022).
- Montalbán-Pozas, B.; Serrano-Candela, F. Simulating specific bioclimatic strategies to recover valuable designs in vernacular architecture. Case study: Thermal inertia in El Valle, Simulación de estrategias bioclimáticas concretas con el objetivo de poner en valor los diseños de la arquitectura t. Inf. Constr. 2022, 74, e443. [Google Scholar] [CrossRef]
- Ministerio de Transporte Movilidad y Agenda Urbana, DB SI, Minist. Transp. Movil. y Agenda Urbana. 2019. Available online: https://www.codigotecnico.org/pdf/Documentos/SI/DBSI.pdf (accessed on 20 December 2019).
- Ray Ingenieria Electronica. Wireless STHR Sensors. 2015. Available online: http://www.ray-ie.com/ (accessed on 2 January 2020).
- Milesight/IoT. Magnetic Contact Switch. Available online: https://www.milesight-iot.com/lorawan/sensor/em300-mcs/ (accessed on 1 December 2022).
- Foscam. DIY Security, Foscam D2EP. Available online: https://foscam.es/es/camaras-ip-exterior/d2ep.html (accessed on 3 December 2022).
- Climate, M. Vicky LoRaWAN. Available online: https://mclimate.eu/products/vicki-lorawan (accessed on 3 December 2022).
- Recuperators Prana. Prana 200c ErP. Available online: https://es.prana-smart.com/recuperador-prana-200c-erp/ (accessed on 8 December 2022).
- Recuperators Prana. Prana 340s. Available online: https://es.prana-smart.com/recuperador-prana-340s-ventilacao/ (accessed on 28 November 2022).
- Brocaar. ChirpStack. Available online: https://www.chirpstack.io/ (accessed on 13 February 2023).


Disclaimer/Publisher’s Note: The statements, opinions and data contained in all publications are solely those of the individual author(s) and contributor(s) and not of MDPI and/or the editor(s). MDPI and/or the editor(s) disclaim responsibility for any injury to people or property resulting from any ideas, methods, instructions or products referred to in the content. |
© 2023 by the authors. Licensee MDPI, Basel, Switzerland. This article is an open access article distributed under the terms and conditions of the Creative Commons Attribution (CC BY) license (https://creativecommons.org/licenses/by/4.0/).