Abstract
Studying the urban heat island effect and actively exploring effective measures for its mitigation and alleviation can provide important parameters for urban ecological environment monitoring and propose rational strategies to address environmental degradation. This article, with the background of urban renewal projects in Beijing, focuses on the central area of Beijing as the research object. Landsat ETM+/OLI_ TIRS data from 2000 to 2020 are used as the main remote sensing imagery source, combined with functional information data and spatial attribute data of open spaces in the central area. Based on the mono-window (MW) algorithm, this study first quantitatively retrieves and categorizes the summer land surface temperature in Beijing’s central area and analyzes its spatiotemporal characteristics using the direction distribution method, revealing regular patterns in the temporal and spatial dimensions. The results show a gradual decrease in the size of the persistent high-temperature concentration area over time. Subsequently, the seasonal autoregressive integrated moving average (SARIMA) model is employed to predict the changing trends of the urban heat island and the occurrence time of the strongest and weakest heat islands. Higher land surface temperature (LST) years are projected for 2025 and 2035, with the lowest year being 2030. Lastly, the correlation coefficient and Moran’s index are used to analyze the correlation between the urban heat island and its corresponding influencing factors in different years. The results indicate that population density, nighttime light, and gross domestic product (GDP) have significant positive effects on the heat island intensity from a temporal perspective. Normalized difference vegetation index (NDVI) shows a significant negative relationship with the heat island intensity when analyzed over time. The research findings provide important reference for rational urban planning, layout, and construction, and hold significance for advancing urban renewal efforts.
1. Introduction
With the acceleration of the urbanization process, there have been significant changes in surface structure, biological environment, and hydrological systems at the local scale of cities [1]. A series of regional ecosystem- and global climate-related issues need to be addressed. Among them, the urban heat island problem is an important aspect of urban ecological environment issues [2] and has substantial research significance and value. The “urban heat island” (UHI) refers to the phenomenon where the temperature in the central area of a city is significantly higher than the temperature in the surrounding suburbs [3,4]. The heat island effect not only exacerbates the deterioration of the urban climate and environment [5] but also seriously affects the quality and livability of urban habitats [6]. In the 1970s, the rapid development of satellite remote sensing technology provided technical support for the macroscopic and dynamic monitoring of UHI issues [7]. It also provided rich, intuitive, multitemporal, and wide-ranging data for studying and analyzing UHI problems [8]. Therefore, utilizing urban satellite remote sensing monitoring data to study and analyze UHI issues is of great importance for providing important parameters for urban ecological environment monitoring, proposing rational strategies to address environmental degradation, and gaining in-depth understanding of urban climate and development.
Currently, research on urban heat islands primarily utilizes land surface temperature (LST) data as an important indicator [9]. LST directly reflects the physical parameters of dynamic changes in the Earth’s resource environment. Changes in LST directly impact the regional environment, climate, air quality, surface structure, biotic distribution, and other urban ecological processes, leading to a series of issues such as environmental degradation [10]. To distinguish it from the commonly known air temperature heat island [11], a UHI determined through inversion based on LST is referred to as a surface urban heat island (SUHI) [12]. Currently, scholars have proposed three inversion algorithms, namely, the split-window algorithm [13], the single-window algorithm [14], and the single-channel algorithm [15,16]. The split-window algorithm significantly improves accuracy by analyzing various options and their sensitivities based on input parameters such as atmospheric transmittance and surface emissivity. Experimental verification has shown that the split-window algorithm is suitable for scenarios with high water vapor content [17]. After improvements by researchers, the single-window algorithm has become simple, feasible, and accurate [18,19]. Studies have found that this algorithm has high accuracy and small errors in urban areas [20]. The single-channel algorithm has a wide range of applications [21,22] and exhibits high accuracy in scenes with a certain level of water vapor content. Landsat 8 satellite remote sensing data are often used as a data source for heat island inversion [23], but current inversion algorithms have certain limitations. The applicability and accuracy issues of various inversion algorithms have long been a concern due to the calibration uncertainty of Landsat 8 TIRS Band 11.
Building upon heat island inversion, it is important to predict the heat island effect, including the impact of human activities on its variations. Predicting the UHI and its changes is a prerequisite for proactive adaptation and mitigation of heat island risks. Currently, common meteorological data prediction models include radial basis function (RBF) network models [24], long short-term memory (LSTM) models [25,26], autoregressive integrated moving average (ARIMA) models, or seasonal autoregressive integrated moving average (SARIMA) models [27]. The SARIMA model is a timeseries prediction and analysis method derived from the ARIMA model, which guarantees prediction accuracy and has extensive application in various fields of timeseries analysis [28]. Typically, each of these time prediction models for forecasting observed data at meteorological stations has its own advantages and limitations. As LST sequences are unique timeseries data in meteorological observations, they exhibit distinct periodic and seasonal variations, encompassing important information such as diurnal variations, seasonal changes, and solar radiation. Therefore, research on simulation and prediction models for LST data is currently lacking.
Understanding the spatial pattern of urban surface thermal environment and its influencing factors is a critical prerequisite for optimizing urban ecosystems. Studies have shown that factors such as vegetation coverage, urban–rural precipitation differences, urban air pollution, and nighttime lights are correlated with UHI formation [29,30]. The impact of these factors on the UHI varies structurally with spatial locations. For example, in the urban area of Beijing, nighttime lights have the highest correlation with street-scale surface temperature [31]. This indicates a close relationship between the study of urban heat islands and the selection of geographical location, diurnal variations, and indicators of influencing factors.
As the core area of Beijing, the central area of Beijing exhibits a pronounced and concentrated heat island effect. Monitoring the dynamic changes of the UHI in the central area of Beijing, revealing its temporal and seasonal characteristics and formation mechanisms, and exploring strategies for heat island mitigation and adaptation are key issues to promoting people-centered urbanization and establishing high-quality urban living spaces [32].
This study aims to quantitatively invert and classify the summer surface temperature in the core area of Beijing, analyze its spatial and temporal distribution characteristics and change patterns, train and utilize the SARIMA model to predict the trend of the urban heat island, determine the occurrence time of the strongest and weakest heat islands, and conduct related analyses.
Above all, three problems are proposed and resolved in this study: What are the temporal and spatial characteristics of the UHI effect in the core area of Beijing? What is the change trend of the heat island in the core area of Beijing and the occurrence time of the heat island with different intensities in the future? What are the characteristics and laws of the influencing factors and correlations of UHI in Beijing in different years? To solve these problems, this study attempts (i) quantitative inversion and classification of summer surface temperature in the core area of Beijing and analysis of its temporal and spatial characteristics; (ii) to predict trends in urban heat islands and when the strongest and weakest heat islands will occur; (iii) analysis of the correlation between the UHI and the corresponding time influencing factors in different years.
This paper is organized as follows: the second part introduces the research area and data sources, as well as the methods employed for heat island inversion, analysis, prediction, and correlation research with influencing factors. The third part focuses on the analysis of heat island spatiotemporal characteristics, prediction, and correlation analysis.
2. Materials and Methods
2.1. Research Data
Beijing is located in the northern region of China, with longitude ranging from 115.7° E to 117.4° E and latitude ranging from 39.4° N to 41.6° N. The total land area of the city is 16,410.54 square kilometers. According to data, as of the end of 2021, the permanent population of Beijing reached 21.886 million. The high population density and rapid economic growth have led to changes in the urban spatial structure, which not only affects the urban climate but also gives rise to urban environmental issues such as the UHI effect. The area of Beijing, known as the Beijing core area, encompasses over 80% of the permanent population of Beijing and serves as the functional core area and urban expansion area of Beijing (Figure 1). This area is also characterized by a significant UHI effect and urban agglomeration.
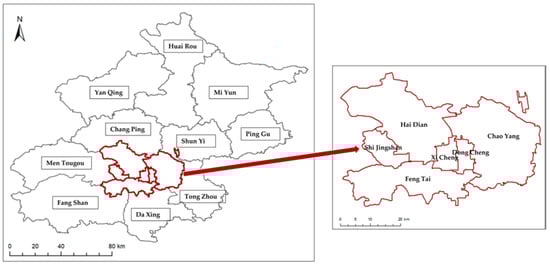
Figure 1.
The study area in Beijing.
This study primarily utilizes Landsat 7 ETM+ and Landsat 8 OLI_TIRS series of remote sensing images. The data used in this study are open data and were downloaded from the Geospatial Data Cloud Platform (http://www.gscloud.cn, accessed on 1 October 2022). The selected images have minimal cloud cover and are of good quality. The Landsat data have undergone preliminary radiometric and geometric corrections. During the temperature inversion process, atmospheric correction was performed on the remote sensing data. This not only improves the accuracy of the inversion but also enhances the reliability of the resulting data. The specific dates and seasonal information of the downloaded remote sensing images are summarized in Table 1. Landsat 7 ETM+ satellite digital products were used for the month of June in 2000, 2005, and 2010, while Landsat 8 OLI_TIRS satellite digital products were used for the years 2015–2020.

Table 1.
Image acquisition time statistics.
In addition to the remote sensing image data, other data used in this study include population density data (POP), gross domestic product data (GDP), night light data (NL), and normalized difference vegetation index data (NDVI) for the years 2000–2020, obtained from the Resource and Environment Science Data Center (https://www.resdc.cn, accessed on 1 October 2022). The building density (BD), floor area ratio (FAR), bus station density (BSD), building area (BA), road network density (RND), and point of interest (POI) data for Beijing core area in 2020 were downloaded from the Water Conservancy Information Center website (http://www.rivermap.cn, accessed on 1 October 2022). The POI data include 14 categories, namely catering, leisure and entertainment, tourism, transportation facilities, large shopping malls, shopping centers, park theaters, universities and colleges, financial services, office buildings, community service centers, research and educational institutions, government agencies, accommodation, and lottery shops, totaling 221,152 points. Detailed information on the POI data is presented in Table 2.
Table 2.
POI data statistics.
2.2. Research Methods
2.2.1. MW Algorithm for Land Surface Temperature Retrieval
The retrieval of land surface temperature (LST) using the mono-window (MW) algorithm involves two steps: first, radiometric calibration of the thermal infrared data, and second, radiometric calibration of the multispectral data [33]. The calculation of radiance temperature is given in Equation (1), where represents the radiance temperature value (brightness temperature) and is the radiometrically calibrated radiance.
Surface emissivity is an important parameter for calculating LST. The MW algorithm derives LST using thermal infrared band 10 and multispectral bands based on the surface thermal radiation transfer equation, as shown in Equations (2)–(4).
Here, is the retrieved temperature, is the surface emissivity, is the atmospheric transmissivity, which can be obtained by inputting the imaging time and central latitude and longitude into the NASA official website (https://atmcorr.gsfc.nasa.gov, accessed on 1 October 2022). represents the brightness temperature corresponding to the radiance observed by the satellite, and is the average atmospheric temperature. The coefficients a and b are obtained based on the actual temperature range [34,35].
2.2.2. Directional Distribution Method—Centroid Model
The standard deviational ellipse (SDE) is one of the spatial statistical methods [36]. This method can calculate the center point of the ellipse (Equations (5) and (6)), the orientation of the ellipse (Equation (7)), and the semiaxis lengths (Equations (8) and (9)). From the perspective of the centroid, it can comprehensively reveal the spatial distribution characteristics and spatiotemporal evolution process of urban heat islands in terms of dispersion range, compactness, direction, and shape. This method is used to measure the directional distribution of urban heat islands and express spatial characteristics such as dispersion and directional trends [37]. The equations for computation are as follows, where and are the latitude and longitude coordinates of the data, and are the arithmetic mean centers, and , , , and represent the mean center and the differences in their coordinates:
2.2.3. SARIMA Temperature Prediction Model
Seasonal autoregressive integrated moving average (SARIMA) is a timeseries forecasting analysis method that is derived from the ARIMA model [38,39]. It has the advantages of real-time prediction and high accuracy. The general form of the SARIMA model is shown in Equation (10).
In the equation, S and D represent the lengths of seasonal cycle and the order of seasonal differencing, respectively. represents the seasonal backward shift operator, and ; . P is the order of seasonal autoregression, and Q is the order of seasonal moving average.
2.2.4. Correlation Analysis
Correlation analysis is used to analyze the degree of association between two spatial features [40]. The correlation coefficient is a statistical measure that reflects the degree of closeness of the relationship between variables. The correlation coefficient ranges from 1 to −1 (Equation (11)). Here, represents the degree of correlation between two spatial features. and are the sample means of X and Y, respectively, and n is the sample size.
The global Moran’s I index is used to evaluate the spatial autocorrelation of local regions (Equation (12)) [41]. Here, I represents the global Moran’s I index; n represents the number of neighborhoods; and represent the heat island intensities of grid cells and , respectively; and . W is the spatial weight matrix.
3. Results
3.1. Surface Temperature Inversion Results and Classification
The summer land surface temperature (LST) of the core area of Beijing city was inverted based on Landsat images from 2000 to 2020, as shown in Figure 2a–e. The color gradient from green to red indicates the gradual increase in LST. It is evident from the figure that there are distinct areas of continuous high temperatures in the core area of Beijing city. Figure 2a shows that the summer temperatures in the core area exhibited a continuous high-temperature trend in 2000. Figure 2b reveals the presence of a significant area of continuous high temperatures in the Fengtai district in 2005, while other high-temperature aggregation areas have dispersed. Figure 2c demonstrates the existence of a distinct area of continuous high temperatures in the Chaoyang district in 2010. Figure 2d indicates the overall presence of a continuous high-temperature aggregation area east of the Yongding River in the core area of Beijing city in 2015. Figure 2e clearly shows that the continuous high-temperature area in the core area of Beijing city in 2020 is being replaced by small, scattered high-temperature areas, with the distribution range of high-temperature aggregation areas gradually narrowing down and mainly concentrated in small areas of Dongcheng District, Xicheng District, and Fengtai District. Overall, the continuous high-temperature aggregation areas in the core area of Beijing city have been gradually reducing and improving over the past 20 years, reaching their minimum extent by 2020.
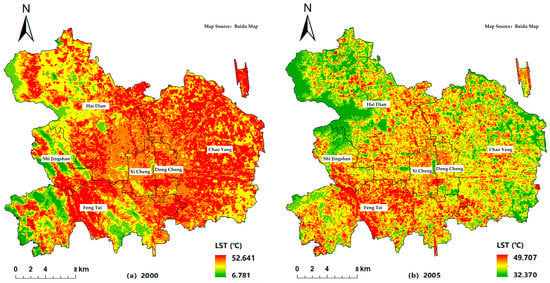
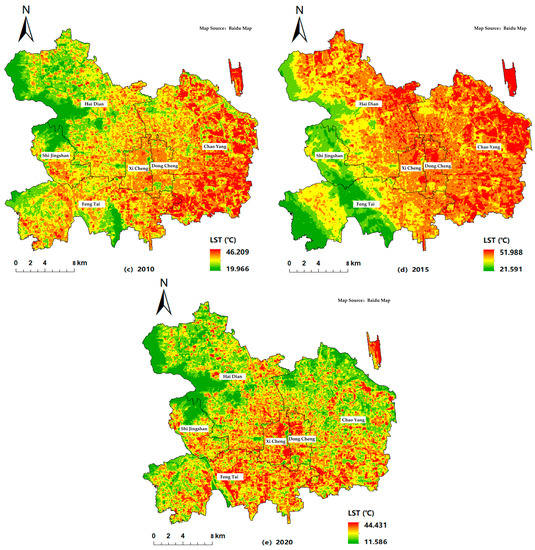
Figure 2.
LST inversion results in summer of 2000–2020: (a) year 2000; (b) year 2005; (c) year 2010; (d) year 2015; (e) year 2020.
Figure 3 presents the statistical values of summer LST from 2000 to 2020. It can be observed that in 2000, the highest temperature was 52.64 °C, the average temperature was 36.84 °C, the lowest temperature was 6.78 °C, and the standard deviation was 4.79. In 2005, the highest temperature was 49.71 °C, which decreased by 2.935 °C compared to 2000. The average temperature was 39.3 °C, the lowest temperature was 32.37 °C, showing an increase of 25.59 °C compared to 2000. The standard deviation was 1.85, lower than that of 2000 by 2.94, indicating a higher degree of aggregation in LST and average temperature values in 2005 compared to 2000. In 2010, there was a significant decrease in temperatures compared to 2005, with the highest temperature at 46.21 °C, the average temperature at 35.11 °C, the lowest temperature at 19.97 °C, a decrease of 12.4 °C compared to 2005. The standard deviation was 2.47. This significant temperature decrease during these 5 years can be attributed to the successful hosting of the 2008 Olympic Games and the implementation of a series of environmental improvement measures in Beijing. In 2015, there was a relatively significant increase, with the highest temperature reaching its peak in the past 20 years (excluding 2000) in the core area of Beijing city, reaching 51.99 °C. Compared to 2010, the temperature increased by 5.78 °C; the average temperature was 38.3 °C, an increase of 3.19 °C compared to 2010; and the lowest temperature was 21.59 °C, an increase of 1.63 °C compared to 2010. The standard deviation was 4.49. By consulting historical weather data for Beijing, it was found that in 2015, the number of days with a maximum temperature of 30 °C or above (94 days) was 10 days higher than in 2010, resulting in the highest temperature increase in 2015. In 2020, there was a relatively significant decrease in temperatures, with the highest temperature recorded at 44.43 °C, a decrease of 7.56 °C compared to 2015. The average temperature was 27.14 °C, a decrease of 10.76 °C compared to 2015, and the lowest temperature was 11.59 °C, a decrease of 10.01 °C compared to 2015. The minimum standard deviation was 2.46, indicating a more aggregated distribution of LST values in 2020, with most values being closer to the average. Overall, the highest temperature in 2020 decreased by 8.21 °C compared to 2000, the average temperature decreased by 9.3 °C, and the lowest temperature increased by 4.81 °C. The trendline of average temperature indicates a gradual decline in LST in the core area of Beijing city from 2000 to 2020, with the highest value reached in 2015. The standard deviation values over the past 20 years have not exceeded 5, indicating a relatively concentrated distribution of values in the study area, providing a foundation for further studying the aggregation of urban thermal environments (UTE).
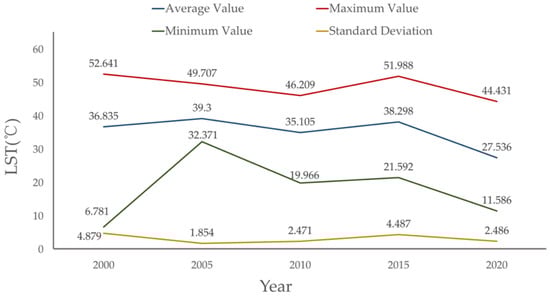
Figure 3.
Summer LST statistics from 2000 to 2020.
3.2. Temporal and Spatial Variation Analysis of UHI
To eliminate the spatial distribution differences of land surface temperature (LST) at different time periods and facilitate statistical analysis of the UHI, a normalization process was applied to the inverted LST. This process aimed to reduce errors caused by variations in LST inversion under different time periods. The mean–standard deviation method [42] was employed to classify the surface thermal field into six levels, as shown in Table 3. The very high-temperature zone, high-temperature zone, and moderate-temperature zone were defined as UHI areas for calculating the UHI area.
Table 3.
LST thermal grade table.
Figure 4 presents the proportions of different LST levels during the summer from 2000 to 2020. Overall, the proportions of the very high-temperature zone and high-temperature zone gradually decreased over time. From 2000 to the summer of 2020, the proportion of the very high-temperature zone decreased from 18.407% to 3.944%, representing a reduction of 14.463%. Similarly, the proportion of the high-temperature zone decreased from 33.516% to 14.571%, a reduction of 18.945%.
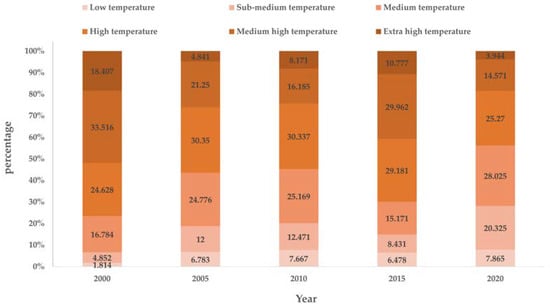
Figure 4.
Summer LST grade proportion map.
Figure 5 illustrates the proportions of UHI areas during the summer from 2000 to 2020. In 2000, the UHI area in the core area of Beijing city reached 76.550%. It decreased to 56.442% in 2005 and remained relatively stable at 54.693% between 2005 and 2010. During the period between 2010 and 2015, the UHI area in the core area of Beijing city experienced the largest increase, reaching 69.920%. However, the UHI area decreased significantly between 2015 and 2020, reaching 43.785% in the summer of 2020. The improved UHI conditions in the core area of Beijing city from 2000 to 2010 can be attributed to the successful hosting of the 2008 Olympic Games in Beijing. Beijing made extensive preparations for the Olympic Games, implementing numerous measures such as the closure of factories with excessive heat emissions and the expansion of green areas. These efforts aimed to improve the issue of high temperatures within the core area of Beijing. During the period of 2015–2020, the significant decrease in the UHI area was a result of Beijing’s strict implementation of the “dual control” and “two lines, three zones” requirements. This implementation achieved the goal of reducing the permanent population of the core area by 15% compared to 2014, a reduction of approximately 110 square kilometers in urban and rural construction land, and the development of the Xiong’an New Area as an urban subcenter. As a result, the overall livability and environmental quality of the core area of Beijing city were comprehensively improved. In summary, the UHI area in the core area of Beijing city exhibited a decreasing trend from 2000 to 2020. By 2020, the UHI area had decreased from 76.550% to 43.785%, representing a reduction of 32.765% over a period of 20 years.
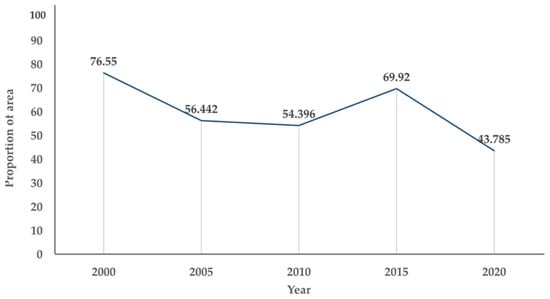
Figure 5.
The proportion of summer heat island area.
The orientation of the ellipse reflects the main trend direction of element distribution, while the standard distances of the major and minor axes indicate the dispersion degree of geographic features in different trend directions. Table 4 provides statistical data on the morphological parameters of UHI ellipses during the summer from 2000 to 2020. The analysis reveals that the orientation of UHI ellipses in the study area ranged from 96 °C to 102 °C, indicating a general southeast–northwest distribution trend. Comparing 2005 to 2000, the centroid of the UHI ellipse shifted southwest by 686.99 m. Between 2010 and 2005, the centroid shifted southeast by 461.74 m. In the period from 2015 to 2020, the centroid shifted northeast by 694.46 m. Finally, between 2020 and 2015, the centroid showed a significant southwest shift of 1002.46 m. Overall, from 2000 to 2020, the centroid of the UHI in the core area of Beijing city consistently moved towards the southwest direction by 646.3 m in the Haidian district.
Table 4.
Morphological parameters of heat island ellipses in summer 2000–2020.
3.3. Analysis of Future UHI Variation
Based on the historical land surface temperature (LST) data obtained through the MW algorithm inversion, the SARIMA forecasting model was employed along with the inherent regularities within the LST data to predict the future changes in the UHI of the core area of Beijing city. The model order selection criterion utilized the minimum information criterion to determine the optimal model order. By analyzing the highest, average, and lowest values of the summer LST from 2000 to 2020 on an annual basis, denoted as {}, the SARIMA model was used to forecast these three indicators. The observed and fitted values are presented in Table 5. The SARIMA model effectively captured the changing trend of summer LST and exhibited a small discrepancy between the fitted and observed values, with an overall relative error of only 0.018. This indicates the model’s suitability for timeseries prediction of LST data. It can be observed that the highest, average, and lowest values of summer LST from 2000 to 2020 exhibited relatively large fluctuations. In particular, the lowest values experienced the greatest fluctuation between 2000 and 2005, followed by 2010. The period from 2000 to 2010 demonstrated a higher degree of fitting. Overall, there was no clear increasing or decreasing trend in the summer LST of the core area of Beijing city from 2000 to 2020. Instead, it exhibited a relatively regular cyclic fluctuation on an annual basis, with a close relationship between the highest, average, and lowest values of LST. The highest values of summer LST remained within a relatively high temperature range.
Table 5.
The highest, mean, and lowest values of LST in summer 2000–2020.
Figure 6 displays the predictive performance of the summer LST from 2000 to 2020. The gray line represents the training data, while the black line represents the forecasted future values. The red lines represent the upper and lower limits of the 95% confidence interval, indicating that there is a 95% probability for the future true values to fall within this range. From the figure, it can be clearly observed that the predicted LST values are within the boundary range. Considering the accuracy of the predictive model and the characteristics of the data, the LST for the next 20 years during the summer season was forecasted. The results indicate that there will be two periods of severe UHI in the next 20 years. The highest LST is projected to occur in 2025, reaching 63.511 °C, followed by 62.588 °C in 2035. The lowest LST is expected to appear in 2030, with a predicted value of 16.002 °C.
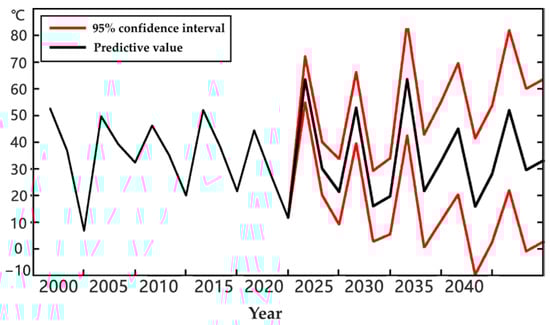
Figure 6.
LST prediction map.
3.4. Analysis of UHI Correlation
Based on correlation analysis and Moran’s index calculation, the spatiotemporal correlation between UHI indices in the summers of 2000, 2005, 2010, 2015, and 2020, and corresponding year’s population density, GDP, nighttime lights (NL), and NDVI was analyzed. The changing trends of correlation between UHI indices and various influencing factors are shown in Figure 7.
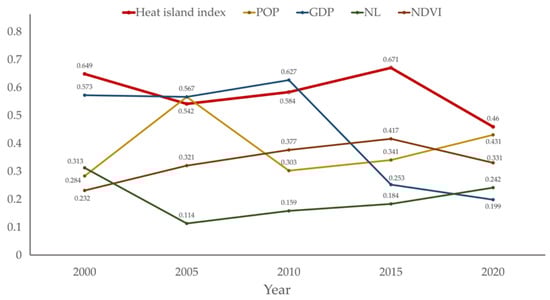
Figure 7.
Trend chart of heat island index and influencing factors.
Table 6 displays population density analysis indicates a general correlation between UHI indices and population density in the core area of Beijing city. From 2000 to 2005 and from 2015 to 2020, as the UHI indices decreased, population density showed an increasing trend. The population density reached its maximum in 2005, while the UHI index peaked in 2015 and decreased to its lowest value by 2020. The period from 2015 to 2020 exhibited the greatest variation in UHI indices, with a decrease of 0.211. From 2005 to 2010, as the UHI indices increased, population density showed a decreasing trend. From 2010 to 2015, as the UHI indices rose, population density gradually increased, showing an overall negative correlation. The research results indicate that the relationship between UHI indices and population density is not a simple linear one. The correlation coefficients range from 0.056 to 0.461, and except for the years 2000 and 2010, all other years show significant correlation at the 1% significance level. This suggests that the heat released by human activities has a certain warming effect on the UHI.
Table 6.
Heat island index correlation coefficient statistics.
GDP analysis results show that from 2000 to 2005, as the UHI indices decreased, GDP exhibited an increasing trend. From 2005 to 2010, as the UHI indices increased, GDP showed an upward trend, reaching its highest value in 2010. From 2010 to 2015, as the UHI indices increased, GDP showed a declining trend. From 2015 to 2020, as the UHI indices decreased, GDP gradually decreased, reaching its lowest point in 2020. The trendlines of UHI indices and GDP indicate that as UHI indices decrease, GDP shows a downward trend. The correlation coefficient results indicate significant correlation at the 1% significance level for all years except 2010. The impact direction is positive from 2000 to 2015, and negative in 2020. This indicates that the impact of GDP on UHI indices undergoes structural changes over time.
Nighttime light (NL) analysis results show that from 2000 to 2005, as the UHI indices decreased, NL exhibited a decreasing trend, reaching its lowest point in 2005. From 2005 to 2015, as the UHI indices increased, NL showed an increasing trend. From 2015 to 2020, as the UHI indices decreased, NL exhibited an upward trend. The overall trendline from 2000 to 2020 indicates that as UHI indices decrease, NL shows a decreasing trend. As UHI indices increase, NL shows an upward trend, indicating that more frequent human socioeconomic activities contribute to the UHI effect. The correlation coefficient results indicate that there is a negative correlation in 2015, and for all other years, there is a certain degree of correlation, with significant correlation at the 1% significance level in 2020. From 2000 to 2010 and in 2020, there is a positive correlation, while in 2015, there is a negative correlation. This indicates that the impact of NL on the UHI varies significantly over time, showing a close relationship between human socioeconomic development and the UHI issue.
NDVI analysis results show a gradual increase in the NDVI index from 2000 to 2015, with the highest value reached in 2015. This increase can be attributed to environmental improvement measures implemented to ensure the success of the 2008 Beijing Olympics, resulting in relatively lower UHI indices in the core area of Beijing city from 2005 to 2010. The trendlines of UHI indices and NDVI indicate that as the NDVI index increases, it has a restraining effect on the UHI. The correlation coefficient results indicate a significant negative correlation between UHI indices and NDVI in the core area of Beijing city over the past 20 years, with correlation coefficients ranging from −0.336 to −0.700. In 2020, the correlation coefficient reached −0.7, indicating that NDVI plays a crucial role in alleviating and inhibiting the UHI. NDVI is the main mediating factor for improving the UHI in the core area of Beijing city, showing significant correlation at the 1% significance level for all years. The correlation coefficient for NDVI and UHI indices in 2020 is approximately twice that of 2015, indicating that significant progress has been made in greening and improving the environment in the core area of Beijing city since 2015. This demonstrates the significant role of vegetation in regulating temperature and improving the climate at the regional level.
4. Discussion and Conclusions
This study focuses on the quantitative inversion and classification of surface temperatures in the core area of Beijing city based on Landsat ETM+/OLI remote sensing image data from 2000 to 2020. The temporal and spatial characteristics of UHI in the study area were analyzed. Additionally, a SARIMA temperature forecasting model was used to predict the trends of UHI changes. Furthermore, the correlation between UHI and various influencing factors in different years was analyzed. The main conclusions of this study are as follows:
(i) The quantitative inversion and classification results of summer surface temperatures reveal clear regularities and development trends of UHI in the core area of Beijing city. The area of continuous high-temperature aggregation decreased gradually from 76.550% to 43.785% between 2000 and 2020, reaching its lowest point in 2020. The spatial distribution of summer UHI exhibits a general “southeast–northwest” trend, with the center of gravity located in the Haidian district and gradually shifting southwestward by 646.302 m. (ii) The results of UHI trend prediction show that the seasonal timeseries forecasting model has a fitting error of 0.018 for simulating summer temperatures. In the next 20 years, there will be two periods with severe UHI, with the highest land surface temperature (LST) of 63.511 °C projected to occur in 2025, followed by 62.588 °C in 2035. The lowest LST is predicted to occur in 2030, with an estimated value of 16.002 °C. (iii) The correlation analysis between UHI and corresponding influencing factors indicates that population density, nighttime light, and GDP have significant positive effects on UHI intensity over time [43,44]. On the other hand, NDVI shows a significant negative relationship with UHI intensity over time. The research results suggest that the heat released by human activities contributes to the warming effect of the urban heat island [45]. The impact of GDP on UHI indices undergoes structural changes over time [46]. There is a close relationship between human socioeconomic development and the urban heat island issue [47]. Vegetation plays a significant role in temperature regulation and climate improvement at the regional level [48].
This study provides important parameters for urban ecological environment monitoring and proposes reasonable strategies to address environmental degradation [49,50]. It is of great significance for gaining in-depth understanding of urban climate and development. The research area focuses on the core area of Beijing city, which directly influences the level of urban development and citizens’ quality of life in Beijing. Improving the thermal environment in the core area is essential for enhancing the quality of urban development, protecting the natural ecology, improving the living environment, and enhancing the quality of residents’ lives and residential spaces. The study of the spatial-temporal characteristics of UHI and the prediction of future temperature changes serve as important references for urban planning, layout, and construction. Lastly, investigating the internal mechanisms of UHI and its influencing factors contribute to understanding its inherent characteristics and play a positive role in natural regulation, disaster prevention, and mitigating other negative environmental effects [51].
However, this research has two limitations. First, the workload required for the remote sensing-based LST inversion algorithm is relatively high, and future research should focus on optimizing and innovating the inversion algorithm. Second, the evaluation index system for influencing factors may not be directly applicable to other cities due to the geographical location, climate environment, spatial morphology, economic development, and resource allocation differences between the core area of Beijing city and other cities. To further support the findings of this study, more research on conditional and influencing factors is needed.
Author Contributions
Conceptualization, Z.W., D.T. and Y.Z.; data curation, Z.W. and Y.Z.; formal analysis, D.T. and Z.W.; funding acquisition, D.T.; investigation, Y.Z.; methodology, Z.W. and Y.Z.; project administration, D.T.; resources, D.T. and Y.Z.; software, Z.W.; supervision, Y.Z.; writing—original draft, D.T. All authors have read and agreed to the published version of the manuscript.
Funding
This work was supported by the Beijing Key Laboratory of Urban Spatial Information Engineering (20230110), the BUCEA Doctor Graduate Scientific Research Ability Improvement Project (DG2023001), and the Open Fund of Key Laboratory of Urban Spatial Information, Ministry of Natural Resources (Grant No. 2023PT002).
Institutional Review Board Statement
Not applicable.
Informed Consent Statement
Not applicable.
Data Availability Statement
Not applicable.
Acknowledgments
The authors would like to thank all of the reviewers for their valuable contributions to this work.
Conflicts of Interest
The authors declare no conflict of interest.
References
- Singh, R.B. Urban Development Challenges, Risks and Resilience in Asian Mega Cities; Springer: Berlin/Heidelberg, Germany, 2015. [Google Scholar]
- Schwerdtle, P.; Bowen, K.; McMichael, C. The Health Impacts of Climate-Related Migration. BMC Med. 2018, 16, 1. [Google Scholar] [CrossRef]
- Arnfield, A.J. Two Decades of Urban Climate Research: A Review of Turbulence, Exchanges of Energy and Water, and the Urban Heat Island. Int. J. Climatol. 2003, 23, 1–26. [Google Scholar] [CrossRef]
- Clinton, N.; Gong, P. MODIS Detected Surface Urban Heat Islands and Sinks: Global Locations and Controls. Remote Sens. Environ. 2013, 134, 294–304. [Google Scholar] [CrossRef]
- Santamouris, M.; Papanikolaou, N.; Livada, I.; Koronakis, I.; Georgakis, C.; Argiriou, A.; Assimakopoulos, D.N. On the Impact of Urban Climate on the Energy Consumption of Buildings. Sol. Energy 2001, 70, 201–216. [Google Scholar] [CrossRef]
- Salvati, A.; Roura, H.C.; Cecere, C. Assessing the Urban Heat Island and Its Energy Impact on Residential Buildings in Mediterranean Climate: Barcelona Case Study. Energy Build. 2017, 146, 38–54. [Google Scholar] [CrossRef]
- Li, X.; Zhou, Y.; Asrar, G.R.; Imhoff, M.; Li, X. The Surface Urban Heat Island Response to Urban Expansion: A Panel Analysis for the Conterminous United States. Sci. Total Environ. 2017, 605–606, 426–435. [Google Scholar] [CrossRef]
- Chen, X.; Yang, J.; Zhu, R.; Wong, M.S.; Ren, C. Spatiotemporal Impact of Vehicle Heat on Urban Thermal Environment: A Case Study in Hong Kong. Build. Environ. 2021, 205, 108224. [Google Scholar] [CrossRef]
- Liu, L.; Zhang, Y. Urban Heat Island Analysis Using the Landsat TM Data and ASTER Data: A Case Study in Hong Kong. Remote Sens. 2011, 3, 1535–1552. [Google Scholar] [CrossRef]
- Bokaie, M.; Zarkesh, M.K.; Arasteh, P.D.; Hosseini, A. Assessment of Urban Heat Island Based on the Relationship between Land Surface Temperature and Land Use/Land Cover in Tehran. Sustain. Cities Soc. 2016, 23, 94–104. [Google Scholar] [CrossRef]
- Mirzaei, P.A. Recent Challenges in Modeling of Urban Heat Island. Sustain. Cities Soc. 2015, 19, 200–206. [Google Scholar] [CrossRef]
- Streutker, D.R. A Remote Sensing Study of the Urban Heat Island of Houston, Texas. Int. J. Remote Sens. 2002, 23, 2595–2608. [Google Scholar] [CrossRef]
- Dwivedi, A.; Khire, M.V. Application of Split- Window Algorithm to Study Urban Heat Island Effect in Mumbai through Land Surface Temperature Approach. Sustain. Cities Soc. 2018, 41, 865–877. [Google Scholar] [CrossRef]
- Qin, Z.; Karnieli, A.; Berliner, P. A Mono-Window Algorithm for Retrieving Land Surface Temperature from Landsat TM Data and Its Application to the Israel-Egypt Border Region. Int. J. Remote Sens. 2001, 22, 3719–3746. [Google Scholar] [CrossRef]
- Tsou, J.; Zhuang, J.; Li, Y.; Zhang, Y. Urban Heat Island Assessment Using the Landsat 8 Data: A Case Study in Shenzhen and Hong Kong. Urban Sci. 2017, 1, 10. [Google Scholar] [CrossRef]
- Fu, P.; Weng, Q. Consistent Land Surface Temperature Data Generation from Irregularly Spaced Landsat Imagery. Remote Sens. Environ. 2016, 184, 175–187. [Google Scholar] [CrossRef]
- Haashemi, S.; Weng, Q.; Darvishi, A.; Alavipanah, S.K. Seasonal Variations of the Surface Urban Heat Island in a Semi-Arid City. Remote Sens. 2016, 8, 352. [Google Scholar] [CrossRef]
- Jiménez-Muñoz, J.C.; Sobrino, J.A. A Generalized Single-Channel Method for Retrieving Land Surface Temperature from Remote Sensing Data. J. Geophys. Res. Atmos. 2003, 108, D22, Erratum in J. Geophys. Res. 2004, 109, D08112. [Google Scholar] [CrossRef]
- Chen, L.; Jiang, R.; Xiang, W.-N. Surface Heat Island in Shanghai and Its Relationship with Urban Development from 1989 to 2013. Adv. Meteorol. 2016, 2016, 9782686. [Google Scholar] [CrossRef]
- Wang, F.; Qin, Z.; Song, C.; Tu, L.; Karnieli, A.; Zhao, S. An Improved Mono-Window Algorithm for Land Surface Temperature Retrieval from Landsat 8 Thermal Infrared Sensor Data. Remote Sens. 2015, 7, 4268–4289. [Google Scholar] [CrossRef]
- Jiménez-Muñoz, J.C.; Sobrino, J.A.; Skoković, D.; Mattar, C.; Cristobal, J. Land Surface Temperature Retrieval Methods from Landsat-8 Thermal Infrared Sensor Data. IEEE Geosci. Remote Sens. Lett. 2014, 11, 1840–1843. [Google Scholar] [CrossRef]
- Stathopoulou, M.; Cartalis, C. Downscaling AVHRR Land Surface Temperatures for Improved Surface Urban Heat Island Intensity Estimation. Remote Sens. Environ. 2009, 113, 2592–2605. [Google Scholar] [CrossRef]
- Firozjaei, M.K.; Weng, Q.; Zhao, C.; Kiavarz, M.; Lu, L.; Alavipanah, S.K. Surface Anthropogenic Heat Islands in Six Megacities: An Assessment Based on a Triple-Source Surface Energy Balance Model. Remote Sens. Environ. 2020, 242, 111751. [Google Scholar] [CrossRef]
- Liu, K.; Su, H.; Zhang, L.; Yang, H.; Zhang, R.; Li, X. Analysis of the Urban Heat Island Effect in Shijiazhuang, China Using Satellite and Airborne Data. Remote Sens. 2015, 7, 4804–4833. [Google Scholar] [CrossRef]
- El Kenawy, A.M.; Lopez-Moreno, J.I.; McCabe, M.F.; Domínguez-Castro, F.; Peña-Angulo, D.; Gaber, I.M.; Alqasemi, A.S.; Al Kindi, K.M.; Al-Awadhi, T.; Hereher, M.E. The Impact of COVID-19 Lockdowns on Surface Urban Heat Island Changes and Air-Quality Improvements across 21 Major Cities in the Middle East. Environ. Pollut. 2021, 288, 117802. [Google Scholar] [CrossRef] [PubMed]
- Aslam, B.; Maqsoom, A.; Khalid, N.; Ullah, F.; Sepasgozar, S. Urban Overheating Assessment through Prediction of Surface Temperatures: A Case Study of Karachi, Pakistan. ISPRS Int. J. Geo-Inf. 2021, 10, 539. [Google Scholar] [CrossRef]
- Mehmood, M.S.; Zafar, Z.; Sajjad, M.; Hussain, S.; Zhai, S.; Qin, Y. Time Series Analyses and Forecasting of Surface Urban Heat Island Intensity Using Arima Model in Punjab, Pakistan. Land 2022, 12, 142. [Google Scholar] [CrossRef]
- Bartesaghi-Koc, C.; Osmond, P.; Peters, A. Spatio-Temporal Patterns in Green Infrastructure as Driver of Land Surface Temperature Variability: The Case of Sydney. Int. J. Appl. Earth Obs. Geoinf. 2019, 83, 101903. [Google Scholar] [CrossRef]
- Ulpiani, G. On the Linkage between Urban Heat Island and Urban Pollution Island: Three-Decade Literature Review towards a Conceptual Framework. Sci. Total Environ. 2021, 751, 141727. [Google Scholar] [CrossRef]
- Piracha, A.; Chaudhary, M.T. Urban Air Pollution, Urban Heat Island and Human Health: A Review of the Literature. Sustainability 2022, 14, 9234. [Google Scholar] [CrossRef]
- Zhang, Q.; Schaaf, C.; Seto, K.C. The Vegetation Adjusted NTL Urban Index: A New Approach to Reduce Saturation and Increase Variation in Nighttime Luminosity. Remote Sens. Environ. 2013, 129, 32–41. [Google Scholar] [CrossRef]
- Yang, P.; Ren, G.; Liu, W. Spatial and Temporal Characteristics of Beijing Urban Heat Island Intensity. J. Appl. Meteorol. Climatol. 2013, 52, 1803–1816. [Google Scholar] [CrossRef]
- Xie, M.; Wang, Y.; Chang, Q.; Fu, M.; Ye, M. Assessment of Landscape Patterns Affecting Land Surface Temperature in Different Biophysical Gradients in Shenzhen, China. Urban Ecosyst. 2013, 16, 871–886. [Google Scholar] [CrossRef]
- Choi, Y.-Y.; Suh, M.-S.; Park, K.-H. Assessment of Surface Urban Heat Islands over Three Megacities in East Asia Using Land Surface Temperature Data Retrieved from COMS. Remote Sens. 2014, 6, 5852–5867. [Google Scholar] [CrossRef]
- Zhang, Z.; He, G.; Wang, M.; Long, T.; Wang, G.; Zhang, X.; Jiao, W. Towards an Operational Method for Land Surface Temperature Retrieval from Landsat 8 Data. Remote Sens. Lett. 2016, 7, 279–288. [Google Scholar] [CrossRef]
- Lefever, D.W. Measuring Geographic Concentration by Means of the Standard Deviational Ellipse. Am. J. Sociol. 1926, 32, 88–94. [Google Scholar] [CrossRef]
- Huang, J.; Song, L.; Yu, M.; Zhang, C.; Li, S.; Li, Z.; Geng, J.; Zhang, C. Quantitative Spatial Analysis of Thermal Infrared Radiation Temperature Fields by the Standard Deviational Ellipse Method for the Uniaxial Loading of Sandstone. Infrared Phys. Technol. 2022, 123, 104150. [Google Scholar] [CrossRef]
- Mao, Q.; Zhang, K.; Yan, W.; Cheng, C. Forecasting the Incidence of Tuberculosis in China Using the Seasonal Auto-Regressive Integrated Moving Average (SARIMA) Model. J. Infect. Public Health 2018, 11, 707–712. [Google Scholar] [CrossRef]
- Zhang, J.; Li, S. Air Quality Index Forecast in Beijing Based on CNN-LSTM Multi-Model. Chemosphere 2022, 308, 136180. [Google Scholar] [CrossRef] [PubMed]
- Xiang, M.; Li, Y.; Yang, J.; Lei, K.; Li, Y.; Li, F.; Zheng, D.; Fang, X.; Cao, Y. Heavy Metal Contamination Risk Assessment and Correlation Analysis of Heavy Metal Contents in Soil and Crops. Environ. Pollut. 2021, 278, 116911. [Google Scholar] [CrossRef]
- Lanorte, A.; Danese, M.; Lasaponara, R.; Murgante, B. Multiscale Mapping of Burn Area and Severity Using Multisensor Satellite Data and Spatial Autocorrelation Analysis. Int. J. Appl. Earth Obs. Geoinf. 2013, 20, 42–51. [Google Scholar] [CrossRef]
- Maussang, F.; Chanussot, J.; Hétet, A.; Amate, M. Mean–Standard Deviation Representation of Sonar Images for Echo Detection: Application to SAS Images. IEEE J. Ocean. Eng. 2007, 32, 956–970. [Google Scholar] [CrossRef]
- Ullah, N.; Siddique, M.A.; Ding, M.; Grigoryan, S.; Zhang, T.; Hu, Y. Spatiotemporal Impact of Urbanization on Urban Heat Island and Urban Thermal Field Variance Index of Tianjin City, China. Buildings 2022, 12, 399. [Google Scholar] [CrossRef]
- Zhang, Q.; Su, S. Determinants of Urban Expansion and Their Relative Importance: A Comparative Analysis of 30 Major Metropolitans in China. Habitat Int. 2016, 58, 89–107. [Google Scholar] [CrossRef]
- Elliott, H.; Eon, C.; Breadsell, J.K. Improving City Vitality through Urban Heat Reduction with Green Infrastructure and Design Solutions: A Systematic Literature Review. Buildings 2020, 10, 219. [Google Scholar] [CrossRef]
- Zhang, X.; Wang, D.; Hao, H.; Zhang, F.; Hu, Y. Effects of Land Use/Cover Changes and Urban Forest Configuration on Urban Heat Islands in a Loess Hilly Region: Case Study Based on Yan’an City, China. Int. J. Environ. Res. Public. Health 2017, 14, 840. [Google Scholar] [CrossRef] [PubMed]
- Sannigrahi, S.; Bhatt, S.; Paul, S.K.; Sen, S.; Rahmat, S.; Uniyal, B. The Spatial Variations and Hotspots of Ecosystem Service Values in India During 1985–2005. In AGU Fall Meeting Abstracts; American Geophysical Union: Washington, DC, USA, 2017; Volume 2017, p. GC31E-1041. [Google Scholar]
- Yu, Z.; Xu, S.; Zhang, Y.; Jørgensen, G.; Vejre, H. Strong Contributions of Local Background Climate to the Cooling Effect of Urban Green Vegetation. Sci. Rep. 2018, 8, 6798. [Google Scholar] [CrossRef] [PubMed]
- Kjellstrom, T.; McMichael, A.J. Climate Change Threats to Population Health and Well-Being: The Imperative of Protective Solutions That Will Last. Glob. Health Action 2013, 6, 20816. [Google Scholar] [CrossRef]
- Earl, N.; Simmonds, I. Variability, Trends, and Drivers of Regional Fluctuations in Australian Fire Activity. J. Geophys. Res. Atmos. 2017, 122, 7445–7460. [Google Scholar] [CrossRef]
- Jain, S.; Sannigrahi, S.; Sen, S.; Bhatt, S.; Chakraborti, S.; Rahmat, S. Urban Heat Island Intensity and Its Mitigation Strategies in the Fast-Growing Urban Area. J. Urban Manag. 2020, 9, 54–66. [Google Scholar] [CrossRef]
Disclaimer/Publisher’s Note: The statements, opinions and data contained in all publications are solely those of the individual author(s) and contributor(s) and not of MDPI and/or the editor(s). MDPI and/or the editor(s) disclaim responsibility for any injury to people or property resulting from any ideas, methods, instructions or products referred to in the content. |
© 2023 by the authors. Licensee MDPI, Basel, Switzerland. This article is an open access article distributed under the terms and conditions of the Creative Commons Attribution (CC BY) license (https://creativecommons.org/licenses/by/4.0/).