Abstract
This paper presents a dynamic analysis of a long-span double-deck suspension bridge subjected to random traffic loading using a Finite Element (FE) model. During this study, the influence of various traffic parameters, such as vehicle speed, traffic volume, traffic weight, and the location of the passing girder, on the longitudinal movement of the girders was investigated. The results reveal that schemes with double girders passing can lead to greater longitudinal displacement of the girder as compared to a long-span bridge with a single passing girder. However, the incorporation of fluid-viscous dampers at the ends of the girders significantly reduces the displacement range of each node. For instance, at the left end of the bridge, the original model (without dampers) exhibits a displacement range of approximately 0.01–0.056 m, whereas the constrained model (with dampers) shows a range of 0.025–0.033 m. A quantitative analysis demonstrates that higher damping coefficients (or smaller damping exponents) can further mitigate the girder’s movement.
1. Introduction
The suspension bridge has emerged as one of the most prominent long-span bridge types globally due to its inherent advantages, such as lightweight construction, simple force transmission, and easy formation of long-span bridges [1,2,3]. However, long-span suspension bridges exhibit low vibration frequencies and small structural damping, leading to significant vibration amplitudes that pose a threat to the safety and performance of the bridge structures [2,4,5,6,7,8].
In long-span bridges, the significant longitudinal movement of the main girder can detrimentally impact the structural health and performance of the bridge. Relevant studies have highlighted that frequent and uneven longitudinal movement of the bridge is the primary contributor to the early damage or destruction of the expansion joints [9,10,11], with vehicle loads representing one of the most frequently encountered external loads [3,12,13,14].
To investigate the dynamic response of bridges under different loads, several research studies have been conducted. For instance, Xu et al. (2003) developed a framework for predicting the dynamic response of long suspension bridges to running loads using the Finite Element (FE) method, highlighting that the extent of the dynamic response was influenced by the speed of moving loads [15]. Malm and Andersson (2006) utilized field testing and simulation to evaluate the dynamic effects on a tied-arch railway bridge during train passages [16]. However, as there exists a disparity between the loading of FE and the actual load, the model results may differ significantly from monitoring results, emphasizing the importance of simulating actual loading. Kwon et al. (2008) presented a dynamic interaction analysis of urban vehicle and guideway suspension bridges, demonstrating that vehicle speed represented an important parameter for the vibration of a vehicle running on the bridge due to the strong interaction between the vehicle and the bridge [17]. Kaliyaperumal et al. (2011) performed dynamic analyses of an actual bridge in Sweden and compared them with field tests, suggesting that using a combination of beam and shell elements was an adequate way to capture the dynamic behavior of a bridge [18]. Madrazo-Aguirre et al. (2015) conducted a dynamic analysis of steel-concrete composite under-deck cable-stayed bridges under the action of moving loads, revealing that relatively high accelerations occur, which could be amplified by large load eccentricities [19].
These corresponding dynamic analyses have provided methods to study the dynamic response of the bridges, and several conclusions have been reported. However, the dynamic study of traffic loads under actual loads (especially the random traffic flow that is closer to real conditions) is relatively rare.
In this paper, a randomized traffic analysis procedure is proposed, and numerical simulations are utilized to investigate the dynamic responses of a long-span double-deck suspension bridge under random traffic loadings. The impact of various traffic parameters, such as vehicle speed, traffic volume, traffic weight, and passing girder location, on the longitudinal movement of the girders is thoroughly examined. Additionally, the efficacy of incorporating fluid viscous dampers through the Combin37 element in ANSYS to mitigate the longitudinal movement of the girders is explored, shedding light on their effectiveness.
2. FE Modeling and Verification
2.1. Long-Span Double-Deck Suspension Bridge and Its FE Model
The long-span double-deck suspension bridge (LDSB) was designed and opened for construction in 2021 and is located in Guangdong Province, China. According to the designed plan, the LDSB is a double-layer steel truss suspension bridge with a main span of 2180 m and a suspension height of 242.22 m, as shown in Figure 1. The upper and lower girders are connected by I-beam members. The width of the upper and lower girders is 43.60 m, and each girder has eight lanes. The vertical distance between the upper and lower girders is 13.50 m. A streamlined, closed, flat steel box girder is adopted for each layer of the bridge girders. The deck plates of the steel box girders adopt an orthotropic anisotropic steel deck panel structure, i.e., the top plate of the bridge deck is a combination plate with U ribs as strengthening members, and this main girder structure is well suited to the lightweight and high strength requirements of oversized span bridges. The vertical height of the box girders is 2.48 m. The thickness of the bridge deck is divided into two types: 16 mm and 18 mm. The thickness of the deck for the fast lane is designed at 16 mm, while the thickness of the outer lane (heavy lane) is 18 mm.
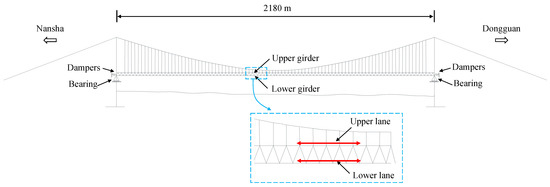
Figure 1.
Profile of the LDSB (dimensions in meters).
In order to comprehensively investigate the impact of traffic flows and dampers on the motion response of double-layer suspension bridges featuring large spans, a highly detailed three-dimensional (3D) finite element model of the bridge was formulated utilizing ANSYS software. The model incorporated 3D isoperimetric beam elements (Beam 4 element in ANSYS) to simulate the towers, whereby each node was assigned six degrees of freedom (DOFs). Additionally, 3D linear-elastic link elements (Link10 element), with three DOFs per node, were utilized to model the suspension cables and suspenders. This element was configured as a tension-only device. The model also considered cable stresses in the equilibrium configuration, calculated from a standard Midas model, and incorporated initial strains. The box girders were simulated utilizing a traditional spine-rib model, with Beam 188 elements employed to connect the girders (spines) and hangers through rigid and mass-free ribs, placed perpendicular to the girders. A comparable box section was assigned for the main beam cross-section, with material and cross-sectional properties (including the thickness of the box section) estimated and assigned to the corresponding elements. The model further involved Mass 21 elements to depict concrete and steel blocks. The modeling methodology is illustrated in Figure 2. The connecting truss rods between the two layers of the main girder were constructed using Beam 188 elements, with their sizes and shapes defined according to the actual parameters. Additionally, the coefficients of thermal expansion for concrete and steel were estimated to be 1.0 × 10⁻⁵/°C and 1.2 × 10⁻⁵/°C, respectively.
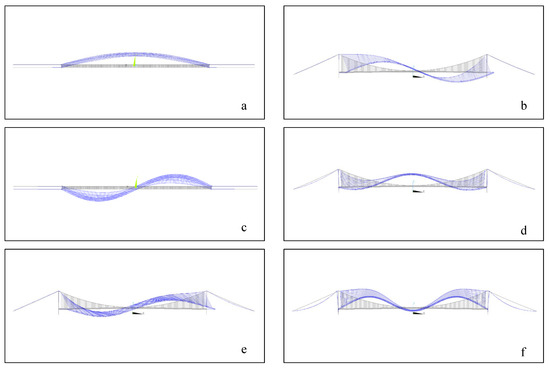
Figure 2.
First six orders of vibration patterns of the LDSB; (a–f): first to sixth order vibration types.
2.2. Validation of the FE Model
Considering that the LDSB was not built and its actual bridge dynamic characteristics could not be obtained, the accuracy of the bridge model was verified by the dynamic characteristics of the bridge-designed information. Table 1 shows the first 6 orders of modal vibration patterns of the bridge model in Midas (for the designed model) and ANSYS software (for the FE model built in this study). The first six orders of vibration patterns of the LDSB are: (a) symmetric transverse vibration of the main beam; (b) first-order longitudinal drift of the main beam; (c) antisymmetric transverse vibration of the main beam; (d) vertical symmetric vibration of the main beam; (e) second-order longitudinal drift of the main beam; and (f) second-order symmetric vertical vibration of the main beam. The vibration patterns are shown in Figure 2. According to the modal analysis results of the designed model and FE model, the modal results of the bridge for the first 6 orders of the finite element model were quite similar to those of the design model (maximum relative error of 1.5%); therefore, it can be believed that the established FE model can accurately characterize the dynamic properties of the bridge.

Table 1.
Modal frequency calibration information.
3. Dynamic Analysis of Random Traffic Flow
3.1. Generation of Random Traffic Flow
In order to quantitatively analyze the dynamic response of the LDSB under actual random traffic loads, the traffic flow information of Nansha Bridge (located in Guangdong Province, China, adjacent to the LDSB) over a period of 14 days was used as the basis. Firstly, 230,371 vehicles for the Nansha Bridge over 14 days (7–21 March 2020) were adopted, which were collected by the monitoring platform of the abutment on the south side of Nansha Bridge, and hence 686 (230,371 ÷ 14 ÷ 24 = 686) vehicles entered the bridge from one end within one hour could be calculated. The vehicle weight distribution is shown in Figure 3. From the vehicle weight histogram, it can be seen that the maximum traffic flow weight is obtained when the vehicle weight is between 0 and 3 tons (the number of passing vehicles in this weight range for 14 days is 63,164), and the average vehicle weight for this range is 2.3 tons.
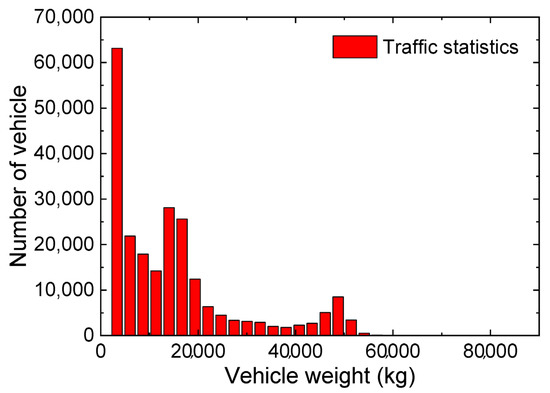
Figure 3.
The vehicle weight distribution of the Nansha Bridge within 14 days.
Secondly, according to the weight of each vehicle weight range, the vehicle weight of each range within 1 h is generated proportionally (the higher the frequency, the greater the vehicle weight is generated). Then, the generated sampling data were dispersed randomly by MATLAB software, and the final random sampling data (which is named “SUM.txt”) was generated accordingly. In order to realize the random flow loading of the FE model, the final sampling data in “SUM.txt” were randomly distributed (via MATLAB software) according to the number of main beam nodes in the model, and the final random traffic load for the upper girder and bottom girder, i.e., “loads-top.txt” and “loads-bottom.txt”, were generated. It is worth noting that, during this procedure, the traffic loading data for different speed ranges (i.e., 60–80 km/h, 80–100 km/h, and 100–120 km/h) could be obtained by parameter setting. During this study, the original traffic flow with a speed range of 60–80 km/h was defined as the “reference traffic flow”. Finally, the loading analysis command was read in the ANSYS platform to realize the dynamic analysis of the LDSB under random traffic loading, and the analysis results could be extracted.
3.2. The Effect of Vehicle Speed Range
In order to analyze the girder longitudinal dynamic response of the initial (without dampers) large-span double-layered suspension bridge, the transient analysis of one hour of random traffic flow for 60–80 km/h (i.e., the reference traffic flow), 80–100 km/h, and 100–120 km/h speed ranges was conducted. During this analysis, 686 vehicles passed through each end (including the left end of the upper girder, the right end of the upper girder, the left end of the bottom girder, and the right end of the bottom girder) of the bridge, and the displacement time history of six nodes (i.e., 912, 1213, 769, 911, 1212, and 768 in Figure 4) at the left end of the girders was extracted as shown in Figure 5. Taking into account the symmetry of the model and the direction of traffic, the same conclusion can be drawn for the right-end nodes.
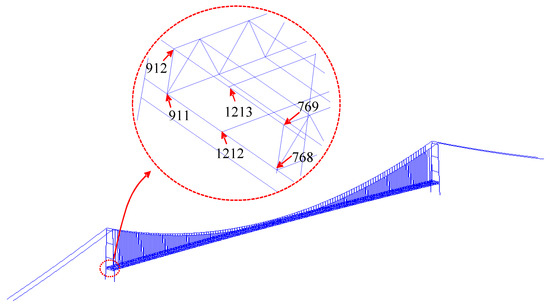
Figure 4.
Bridge end node location diagram.
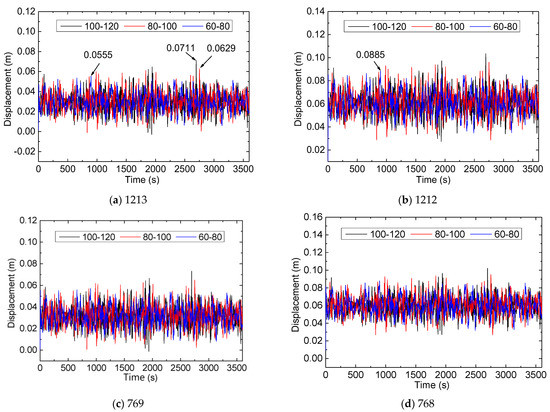
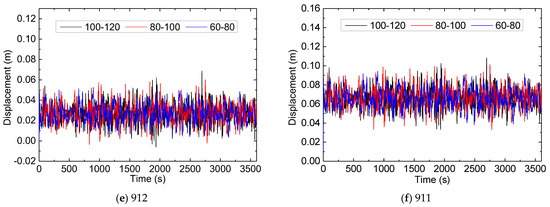
Figure 5.
Displacement time history of the six nodes.
From Figure 5, it is observed that the displacement of each node can be influenced by the traffic speed range, and the extreme value of node displacement under the loading of a higher vehicle speed (i.e., 100–120 km/h) will be significantly higher than that of a lower vehicle speed. For instance, the extreme value of node 1213 was 0.0711 m (for 100–120 km/h), whereas the ones for 60–80 km/h and 80–100 km/h were 0.0629 m and 0.0555 m, respectively.
Figure 6 plots the one hour cumulative displacement of the girder end nodes of the LDSB under the traffic flow for different speed ranges. Based on the cumulative displacements in Figure 6, it is observed that the cumulative displacement of the end nodes of the girder can be affected by the passing traffic speed, and higher traffic speeds tend to result in more cumulative displacement of the end nodes of the girders. For example, the cumulative displacement of nodes 1213 in the speed ranges 100–120 km/h, 80–100 km/h, and 60–80 km/h was 9.75, 8.27, and 5.36 m, respectively. In addition, by comparing the cumulative displacement of nodes 1213 and 1212 under the same vehicle speed range, the cumulative displacement at node 1212 was always slightly higher than that of node 1213, indicating that the dynamic response of the bottom girder was more severe than that of the upper girder. For instance, under the vehicle speed range of 100–120 km/h, the cumulative displacements of 1213 and 1212 were 9.75 and 9.88 m, respectively.
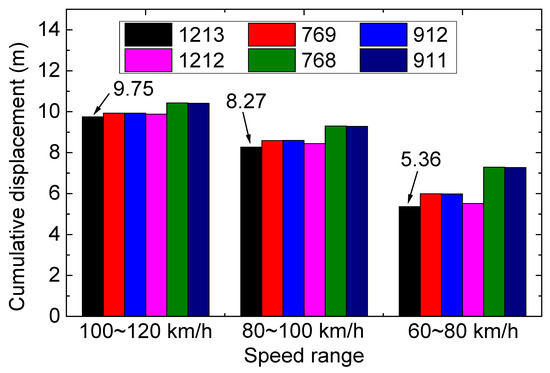
Figure 6.
Cumulative displacement of the girder end nodes for different speed ranges.
Figure 7 shows the velocity time history curves of the six nodes at different speed ranges. Based on the real-time comparison of the velocity time histories of the six nodes, it can be seen that the velocity of the end of the girders will be significantly affected by the vehicle speed range. Similar to the change law of the displacement time history curve, a higher vehicle speed range will often lead to a larger node velocity. For example, for node 1213, the maximum velocity under the three speed ranges was 0.0183 (for 100–120 km/h), 0.0107 (for 80–100 km/h), and 0.0076 (for 60–80 km/h), respectively, and the change characteristics of other nodes (i.e., 1212, 769, 768, 912, and 911) were similar to 1213.
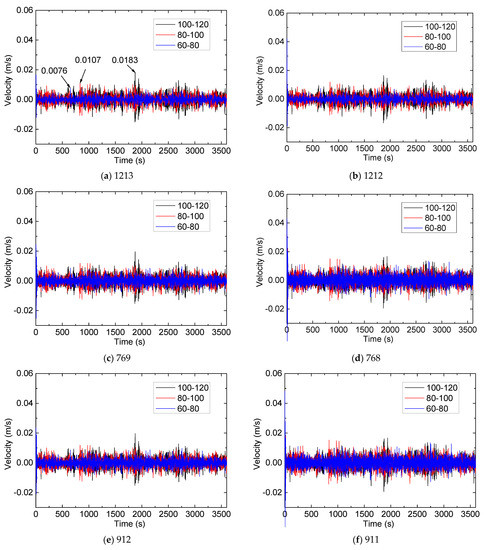
Figure 7.
Velocity time history curves of the six nodes under different speed ranges.
3.3. The Effect of Traffic Volume
In order to analyze the influence of traffic volume on the motion response of the LDSB, longitudinal dynamic analysis of the girder under different traffic volumes (1 time, 1.2 times, and 1.4 times vehicle volumes) based on the reference traffic flow was conducted, and the analyzed results of the one hour displacement time-history curves of the six nodes were plotted as Figure 8. Similar shapes could be found in Figure 9, and a greater magnitude of time-history data was obtained from calculation scenarios of 1.4 times the vehicle volume. The cumulative displacement of 1213 for the 1.4 times traffic volume was 6.53 m, whereas the cumulative displacements of 5.36 and 6.21 m were calculated by the 1 time and the 2 times traffic volumes, respectively. This phenomenon indicated that a larger traffic volume would cause the amplitude of the displacement curve to increase.
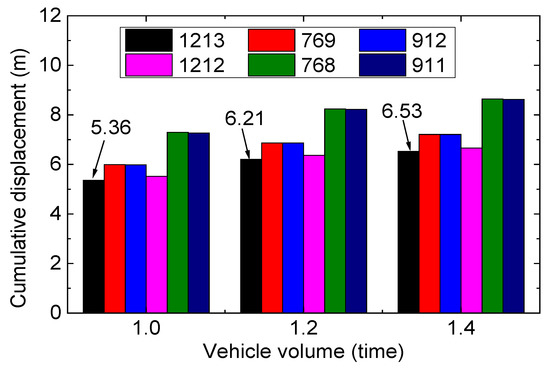
Figure 8.
Cumulative displacement of the girder end nodes for different vehicle volumes.
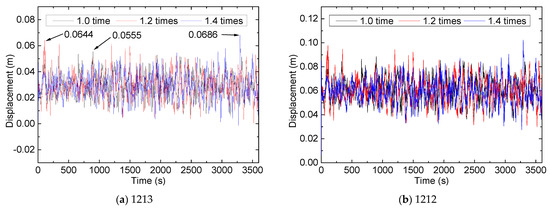
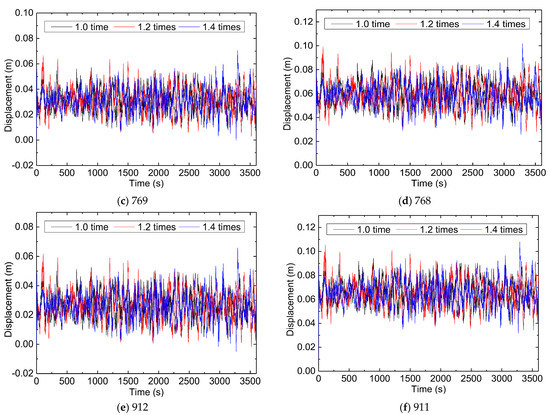
Figure 9.
The displacement time history of the six nodes for different vehicle volumes.
Figure 9 plots the one hour cumulative displacement of the girder end nodes of the LDSB under different vehicle volumes. Based on the cumulative displacements in Figure 10, it is observed that the cumulative displacement of the end nodes of the girder can be affected by the passing vehicle volume, and bigger vehicle volumes tend to result in more cumulative displacement of the end nodes of the girders. For example, the cumulative displacement of the nodes 1213 of the 1 time, 1.2 times, and 1.4 times vehicle volumes was 5.36, 6.21, and 6.53 m, respectively.
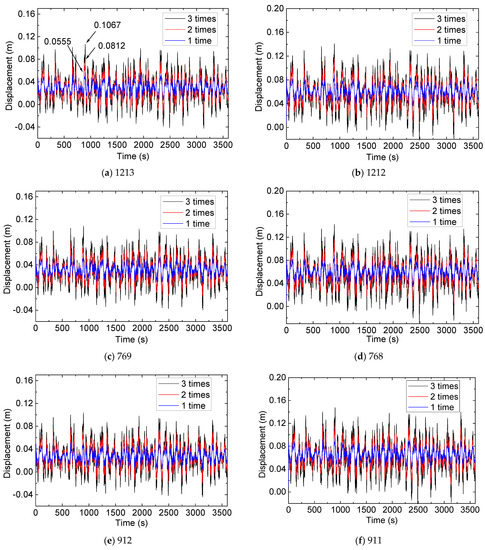
Figure 10.
The displacement time history of the six nodes for different vehicle weights.
3.4. The Effect of Traffic Weight
In order to analyze the influence of traffic volume on the motion response of the LDSB, longitudinal dynamic analysis of three traffic weights (i.e., 1 time, 2 times, and 3 times weights of the reference traffic flow) was conducted in this section. The analyzed results of the one hour displacement time-history curves and cumulative displacement of the six nodes are plotted in Figure 10 and Figure 11. Based on Figure 11, it is observed that the displacement of each node can be remarkably affected by the traffic weight. For instance, for node 1213, the maximum displacement of the 1 time traffic weight (i.e., the reference traffic flow) was 0.555 m, whereas the ones of 2 times and 3 times traffic weights were 0.0812 and 0.1067 m (as Figure 10a shows), respectively. Furthermore, by comparing the cumulative displacements of each node in Figure 12, it is found that traffic flow with greater vehicle weight can induce a bigger cumulative displacement of the nodes. The cumulative displacement of 1213 for the 3 times traffic flow was 15.89 m, whereas the cumulative displacements of 5.36 and 10.63 m were calculated for the 1 time and the 2 times traffic flows, respectively. Therefore, it is suggested that in order to maintain the health of the bridge, it is advisable to monitor the weight of the vehicles passing on the bridge in time.
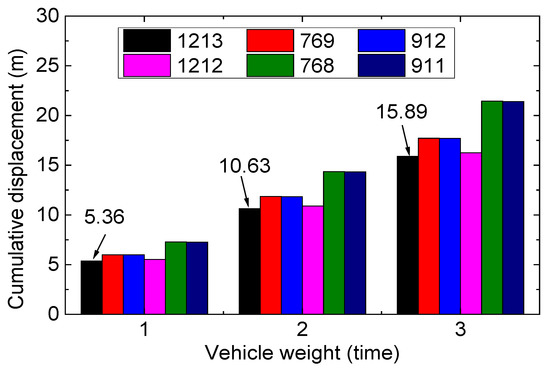
Figure 11.
Cumulative displacement of the girder end nodes for different vehicle weights.
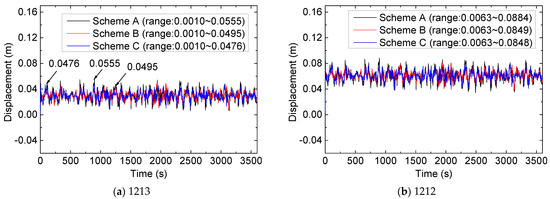
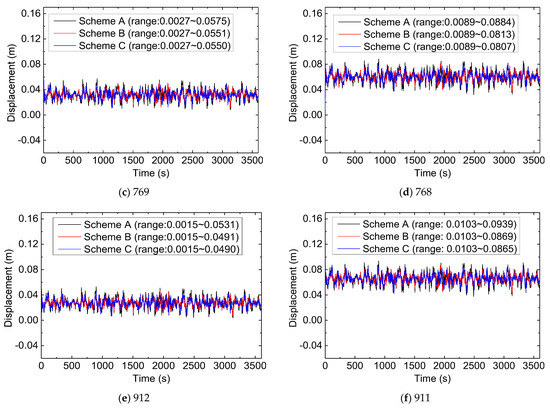
Figure 12.
Displacement time-history curves of the six nodes.
3.5. The Effect of the Location of the Passing Girder
In order to analyze the influence of the location of the passing girder on the motion response of the LDSB, a longitudinal dynamic analysis of three passing schemes was conducted in this section, which included that: (A) the upper and lower girders were imposed by the reference traffic flow at the same time; (B) the upper girder was imposed by the reference traffic flow, whereas the bottom girder was not open to traffic; and (C) the bottom girder was imposed by the reference traffic flow, whereas the upper girder was not open to traffic. The analyzed results of the one hour displacement time-history curves and cumulative displacement of the six nodes were plotted in Figure 12 and Figure 13. Through time-history analysis, it is found that the range of motion of the end nodes of the three conditions is roughly similar.
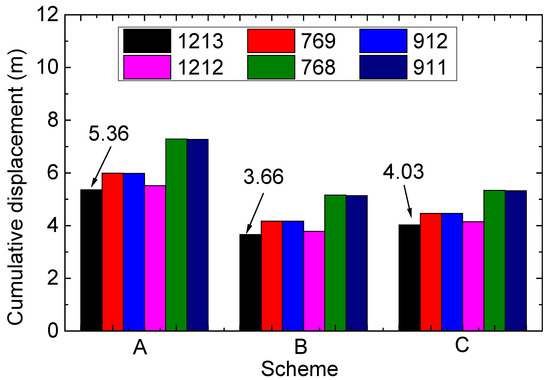
Figure 13.
Cumulative displacement of the six nodes.
Due to the difference in the passing girder compared to scheme A, a significant difference in cumulative displacement was found in schemes B and C. For scheme A, the cumulative displacements of nodes 1213 and 1212 were 5.36 and 5.52 m, respectively (see Figure 7); however, for scheme B, the cumulative displacements of 1213 and 1212 were 3.66 and 3.78, respectively. It shows that under the single girder loading method of scheme B, the movement range of the girder end was gentler than that of scheme A. This phenomenon indicated that, compared with a long-span bridge with a single main girder, the passing schemes of the double girders can remarkably increase the longitudinal dynamic response of the girder. Similar results could be found with the displacement of scheme C.
4. Displacement Control Based on Fluid-Viscous Dampers
4.1. Establishment of the Damping Model
Considering that vibration can significantly affect the behavior and safety of long-span bridges, the installation of dampers has become one of the most important methods for vibration reduction (Chen et al., 2022; Shi and Cai, 2008). In order to control the longitudinal movement of the long-span double-deck suspension bridge, the viscous damper (modeled by Combin37) was adopted in this study. The installation positions of the dampers are shown in Figure 14. One damper was installed at each of the four end nodes of the main girders of the bridge. Taking the left girder as an example, the connecting nodes of the dampers were 769, 768, 912, and 911, respectively. It should be noted that the viscous damper constraint effect adopted in this study was based on the ideal nonlinear force-velocity damping constraint model, and the problems in practical application caused by oil leakage and damping degradation failure at low speed are left for further study.
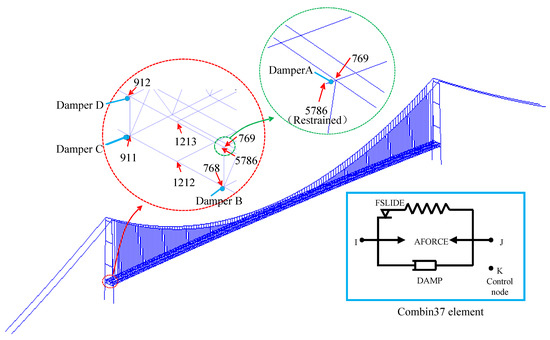
Figure 14.
Locations of the dampers in the FE model.
In order to investigate the restraining effect of dampers on the longitudinal movement of the LDSB, eight viscous dampers were installed at each end of the girders (including the left end and right end) of this 3D FE, and two dampers were installed at each end of the upper and lower main girders. According to the definition of the Combin37 element, the damping force is stimulated by the movement status of the control node. Therefore, for each damper, the control node was set at each girder end, that is, 769, 768, 912, and 911 of the left ends. In ANSYS, the combin37 element is a unidirectional element with the capability of turning on and off during an analysis, through which the damping can be controlled as a function of velocity, as depicted by Equation (1).
where c is the damping coefficient; is the damping exponent; and is the relative displacement velocity between the two ends of the damper. Other interacting nonlinear effects, such as the P-d effect and large displacements, were all considered in the calculation.
4.2. The Movement of the Girder Ends Is Constrained by Dampers
Eight fluid viscous dampers were installed on the LDSB model, and the reference traffic flow was applied to both of the girders bilaterally. The damping coefficient and constant exponent were defined as 2500 kN and 0.3, respectively, and based on the transient analysis, the longitudinal displacement timing data of the end nodes can be calculated. Taking into account the symmetry of the model and traffic loads, the nodes of the left end (i.e., 1213, 1212, 769, 768, 912, and 911) were discussed.
Figure 15 plots the displacement time-history curves of the six nodes before and after the installation of the dampers under the reference random traffic loading. From Figure 15, it is found that after installing the fluid viscous dampers, the displacement range of each node has been significantly reduced. For node 1213 as the instance, the displacement range for the original model (i.e., without damper) was approximately 0.010–0.056 m, whereas the displacement range of the constrained model (i.e., installed dampers) was about 0.025–0.033 m. This phenomenon shows the reduction of the dynamic response of the installed dampers.
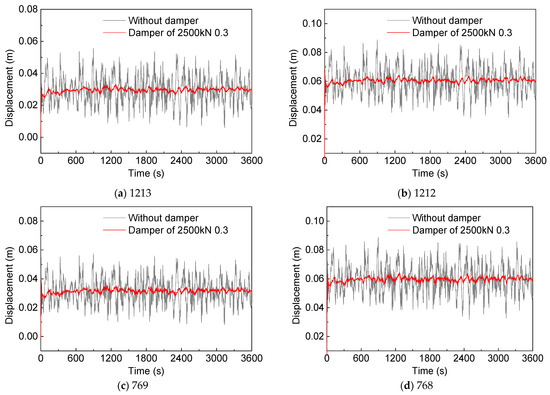
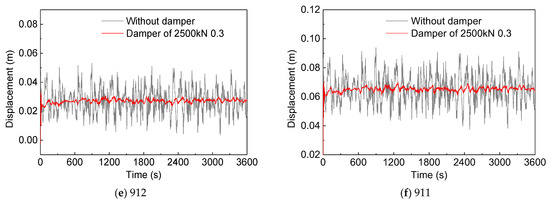
Figure 15.
Displacement time-history curves before and after the installation of the dampers.
Table 2 lists the one hour cumulative displacement of the six nodes before and after the installation of the dampers. Compared with the original model, a significant reduction in cumulative displacement could be found in the constrained model. For the constrained model, the cumulative displacement range of the end nodes was between 0.75 and 1.40 m, and the minimum value of the cumulative displacement of 0.75 m was adopted for node 1213. By the calculation of the reduction ratio of the end node cumulative displacement before and after the installation of damping devices, it can be concluded that the most remarkable reduction was obtained by node 1213, with a reduced rate of 86%, indicating the effects of the fluid viscous damping device on reducing the longitudinal displacement of the long-span bridge.
Table 2.
Cumulative displacement of the six nodes before and after installation of the dampers.
4.3. Influence of the Damping Coefficient
In order to study the effects of the damping coefficient on the dynamic response of the girder under the constraints of the fluid viscous dampers, the girder response of the 1500 kN (constant exponent of 0.3) and 3500 kN (constant exponent of 0.3) configurations of dampers was analyzed and discussed. Table 3 lists the one hour accumulation of the six nodes for three types of damping coefficients (1500, 2500, and 3500 kN) under the reference random traffic loading. The smallest cumulative displacement (calculated as 0.62 m) was adopted by node 1213 under the configuration of 3500 kN dampers. By comparison of the cumulative displacement for the three damping configurations, it is found that the change of the damping coefficient can influence the cumulative displacement of the girders significantly, and the larger damping coefficients (e.g., 3500 kN) were defined, the smaller displacements could be induced.
Table 3.
Cumulation displacement for three types of damping coefficients.
Figure 16 plots the time-history curves of the damping force of the fluid viscous dampers A and B for each model under the reference random traffic loading. From Figure 16, different damping forces could be adopted by the three damping configurations. The ranges of the damping force for damper A were (−345 kN, 314 kN), (−535 kN, 503 kN), and (−693 kN, 631 kN), which were calculated by the damping configuration of 1500 kN (0.3), 2500 kN (0.3), and 3500 kN (0.3), respectively. The difference in damping force range reflected the effect of the damping coefficient; therefore, in order to reduce the displacement of the girder end, it is recommended to increase the damping coefficient of dampers appropriately.
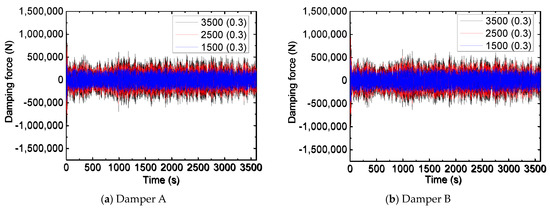
Figure 16.
Time-history curves of the damping force of the fluid viscous dampers A and B.
4.4. Influence of the Damping Exponent
Based on Equation (1), the damping exponent is the other parameter that can influence the damping force. In order to investigate the effect of the damping exponent on the dynamic response of the girder end under the viscous damper constraint, the bridge model with four dampers at each end under the reference traffic vehicle loading was analyzed. This session extracted the girder end response under fluid viscous damper constraints for 2500 kN (0.1) and 2500 kN (0.5) configurations and compared it to the fluid viscous damper constraints for 2500 kN (0.3).
Table 4 shows the one hour cumulative displacements of the six nodes at the girder ends for the three damping exponents (0.1, 0.3, and 0.5). From the comparison of the nodal cumulative displacements, it can be seen that the cumulative displacements at the beam ends can be changed by the damping exponent. The minimum value (0.08 m) of the cumulative displacement was adopted by node 769 under the damping configuration of 2500 kN (0.1), and the maximum value of the constrained model was 3.70 m, which was calculated by the model of 2500 kN (0.5). For the same node, the cumulative displacement value of the model of 2500 kN (0.1) was much smaller than the others, indicating the remarkable effect of the damping exponent, and the lower damping exponent was more conducive to reducing the displacement of the girders.
Table 4.
Cumulation displacement for three types of damping exponents.
Figure 17 plots the comparison of the damping forces of dampers A and B under the three damping exponent configurations. From Figure 17, different damping forces could be obtained by the three damping configurations. The ranges of the damping force for damper A were (−729 kN–916 kN), (−535 kN–503 kN), and (−184 kN–190 kN), which were calculated by the damping configuration of 2500 kN (0.1), 2500 kN (0.3), and 2500 kN (0.5), respectively. The difference in damping force range showed the effect of the damping exponent; therefore, in order to reduce the displacement of the girder end, it is recommended to decrease the damping exponent of dampers appropriately.
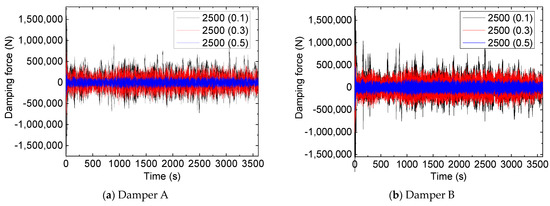
Figure 17.
Comparison of the damping force under the three damping exponent configurations.
5. Conclusions
Unlike long-span bridges with single-story girders, super-long-span suspension bridges with double-layer channels warrant specific attention due to their unique structural characteristics. Consequently, the present study carries significant research value in uncovering the dynamic response and assessing the shock-absorbing efficiency of such bridges. The present study presents novel insights into the dynamic response of a long-span double-deck suspension bridge subjected to random traffic loading and investigates the efficacy of fluid viscous dampers in mitigating vibration in this context. The results unequivocally establish the superior performance of the proposed fluid-viscous damper. In light of these findings, the following conclusions can be drawn:
- The displacement of girder nodes is strongly correlated with the speed range of traffic, with higher speed ranges resulting in greater movement speeds of the girders. Furthermore, empirical analysis of the one hour cumulative displacement of the girder provides evidence to support the positive correlation between higher traffic speeds and greater cumulative displacement. Additionally, the cumulative displacement of the girder is found to increase with higher traffic volume and weight;
- The study found significant differences in cumulative displacement between scheme A (where girders on the upper and bottom layers were loaded with traffic flow simultaneously) and schemes B and C (where the upper and bottom girders were subjected to traffic flow separately). This phenomenon highlighted that, comparably, the double-girder passing schemes increase the longitudinal dynamic response of the girder significantly in contrast to the long-span bridge with a single main girder;
- Installing fluid-viscous dampers resulted in a significant reduction in the displacement range of each node. For example, node 1213 exhibited a displacement range of approximately 0.01–0.056 m for the original model (without dampers), while the constrained model (with dampers) observed a range of 0.025–0.033 m. The introduction of fluid-viscous dampers contributed to a noticeable reduction in cumulative displacement;
- Comparing the end nodes of the girders under different damping coefficients and damping exponents revealed the significant influence of these parameters on damping force. Quantitative analysis showed that the adoption of a higher damping coefficient (or a smaller damping exponent) led to a more noteworthy reduction in the girder’s movement.
Author Contributions
Conceptualization, J.X. and J.L.; writing—original draft preparation, J.X.; validation, J.X. and J.L.; investigation, J.X. and Y.Y.; formal analysis, Y.Y. and Y.X.; project administration, Y.X.; resources, Y.X.; software, C.L.; methodology, C.L.; writing—review and editing, C.L. All authors have read and agreed to the published version of the manuscript.
Funding
Guangdong Provincial Transportation Group Co., Ltd., Guangzhou 510699, China. Research on technical standard, structural system and key structure of double-layer steel truss suspension bridge over 2000 m (JT2023ZD01-01).
Data Availability Statement
Not applicable.
Acknowledgments
The authors gratefully acknowledge Guangdong Provincial Transportation Group Co., Ltd., Guangzhou 510699, China. Research on technical standard, structural system and key structure of double-layer steel truss suspension bridge over 2000 m (JT2023ZD01-01).
Conflicts of Interest
The authors declare no conflict of interest.
References
- Zhao, H.-W.; Ding, Y.L.; Li, A.Q.; Liu, X.W.; Chen, B.; Lu, J. Evaluation and early warning of vortex-induced vibration of existed long-span suspension bridge using multisource monitoring data. J. Perform. Constr. Facil. 2021, 35, 04021007. [Google Scholar] [CrossRef]
- Gao, Q.; Wu, B.; Wang, R.; Zhang, J.; Guo, B.; Li, J. Investigation of the Dynamic Performance of a Large-Span Suspension Bridge Influenced by Scouring Based on Vehicle-Bridge Coupled Vibration. Shock. Vib. 2020, 2020, 13666. [Google Scholar] [CrossRef]
- Guo, T.; Liu, Z.; Pan, S.; Pan, Z. Cracking of longitudinal diaphragms in long-span cable-stayed bridges. J. Bridge Eng. 2015, 20, 04015011. [Google Scholar] [CrossRef]
- Chen, L.; Liu, Z.; Nagarajaiah, S.; Sun, L.; Zhao, L.; Cui, W. Vibration mitigation of long-span bridges with damped outriggers. Eng. Struct. 2022, 271, 114873. [Google Scholar] [CrossRef]
- Fujino, Y.; Siringoringo, D. Vibration mechanisms and controls of long-span bridges: A review. Struct. Eng. Int. 2013, 23, 248–268. [Google Scholar] [CrossRef]
- Xu, K.; Bi, K.; Han, Q.; Li, X.; Du, X. Using tuned mass damper inerter to mitigate vortex-induced vibration of long-span bridges: Analytical study. Eng. Struct. 2019, 182, 101–111. [Google Scholar] [CrossRef]
- Xu, K.; Dai, Q.; Bi, K.; Fang, G.; Zhao, L. Multi-mode vortex-induced vibration control of long-span bridges by using distributed tuned mass damper inerters (DTMDIs). J. Wind. Eng. Ind. Aerodyn. 2022, 224, 104970. [Google Scholar] [CrossRef]
- Zengwei, G.; Lin, S.; Ni, Q. Advances in active control of wind-induced vibration of long-span suspension bridges. Int. J. Struct. Stab. Dyn. 2022, 22, 2230002. [Google Scholar]
- Guo, T.; Liu, J.; Zhang, Y.; Pan, S. Displacement monitoring and analysis of expansion joints of long-span steel bridges with viscous dampers. J. Bridge Eng. 2015, 20, 04014099. [Google Scholar] [CrossRef]
- Guo, T.; Liu, J.; Huang, L. Investigation and control of excessive cumulative girder movements of long-span steel suspension bridges. Eng. Struct. 2016, 125, 217–226. [Google Scholar] [CrossRef]
- Gao, D.; Deng, Z.; Yang, W.; Chen, W. Review of the excitation mechanism and aerodynamic flow control of vortex-induced vibration of the main girder for long-span bridges: A vortex-dynamics approach. J. Fluids Struct. 2021, 105, 103348. [Google Scholar] [CrossRef]
- Sun, Z.; Ye, X.W. Incorporating site-specific weigh-in-motion data into fatigue life assessment of expansion joints under dynamic vehicle load. Eng. Struct. 2022, 255, 113941. [Google Scholar] [CrossRef]
- Chen, S.R.; Chang, C.C.; Cai, C.S. Study on stability improvement of suspension bridge with high-sided vehicles under wind using tuned-liquid-damper. J. Vib. Control 2008, 14, 711–730. [Google Scholar] [CrossRef]
- Shi, X.; Cai, C.S. Suppression of vehicle-induced bridge vibration using tuned mass damper. J. Vib. Control 2008, 14, 1037–1054. [Google Scholar]
- Xu, Y.L.; Xia, H.; Yan, Q.S. Dynamic response of suspension bridge to high wind and running train. J. Bridge Eng. 2003, 8, 46–55. [Google Scholar] [CrossRef]
- Malm, R.; Andersson, A. Field testing and simulation of dynamic properties of a tied arch railway bridge. Eng. Struct. 2006, 28, 143–152. [Google Scholar] [CrossRef]
- Kwon, S.D.; Lee, J.S.; Moon, J.W.; Kim, M.Y. Dynamic interaction analysis of urban transit maglev vehicle and guideway suspension bridge subjected to gusty wind. Eng. Struct. 2008, 30, 3445–3456. [Google Scholar] [CrossRef]
- Kaliyaperumal, G.; Imam, B.; Righiniotis, T. Advanced dynamic finite element analysis of a skew steel railway bridge. Eng. Struct. 2011, 33, 181–190. [Google Scholar] [CrossRef]
- Madrazo-Aguirre, F.; Ruiz-Teran, A.M.; Wadee, M.A. Dynamic behaviour of steel–concrete composite under-deck cable-stayed bridges under the action of moving loads. Eng. Struct. 2015, 103, 260–274. [Google Scholar] [CrossRef]


Disclaimer/Publisher’s Note: The statements, opinions and data contained in all publications are solely those of the individual author(s) and contributor(s) and not of MDPI and/or the editor(s). MDPI and/or the editor(s) disclaim responsibility for any injury to people or property resulting from any ideas, methods, instructions or products referred to in the content. |
© 2023 by the authors. Licensee MDPI, Basel, Switzerland. This article is an open access article distributed under the terms and conditions of the Creative Commons Attribution (CC BY) license (https://creativecommons.org/licenses/by/4.0/).