A Study of the Mechanical Behavior of a Steel–Concrete Hybrid Beam Bridge during Construction

Abstract
1. Introduction
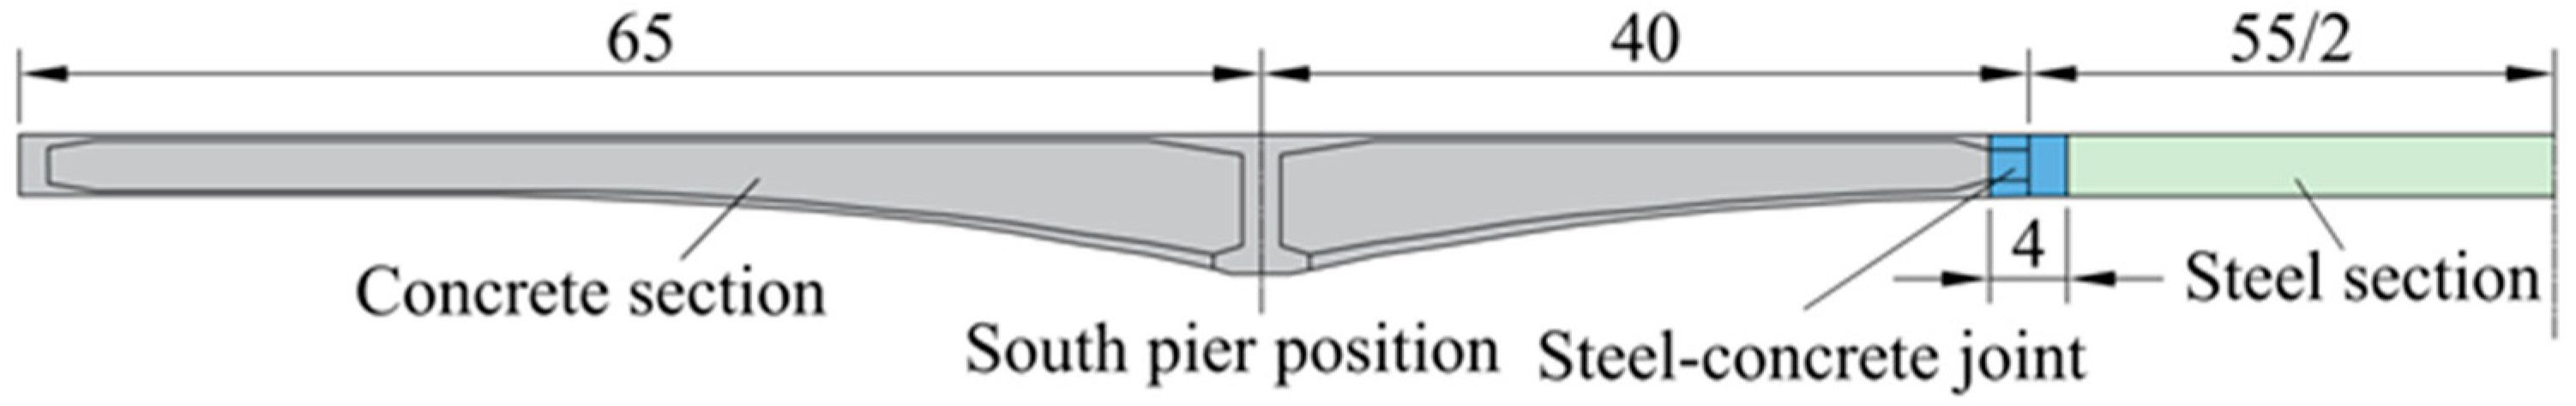
2. Background
3. Monitoring Program
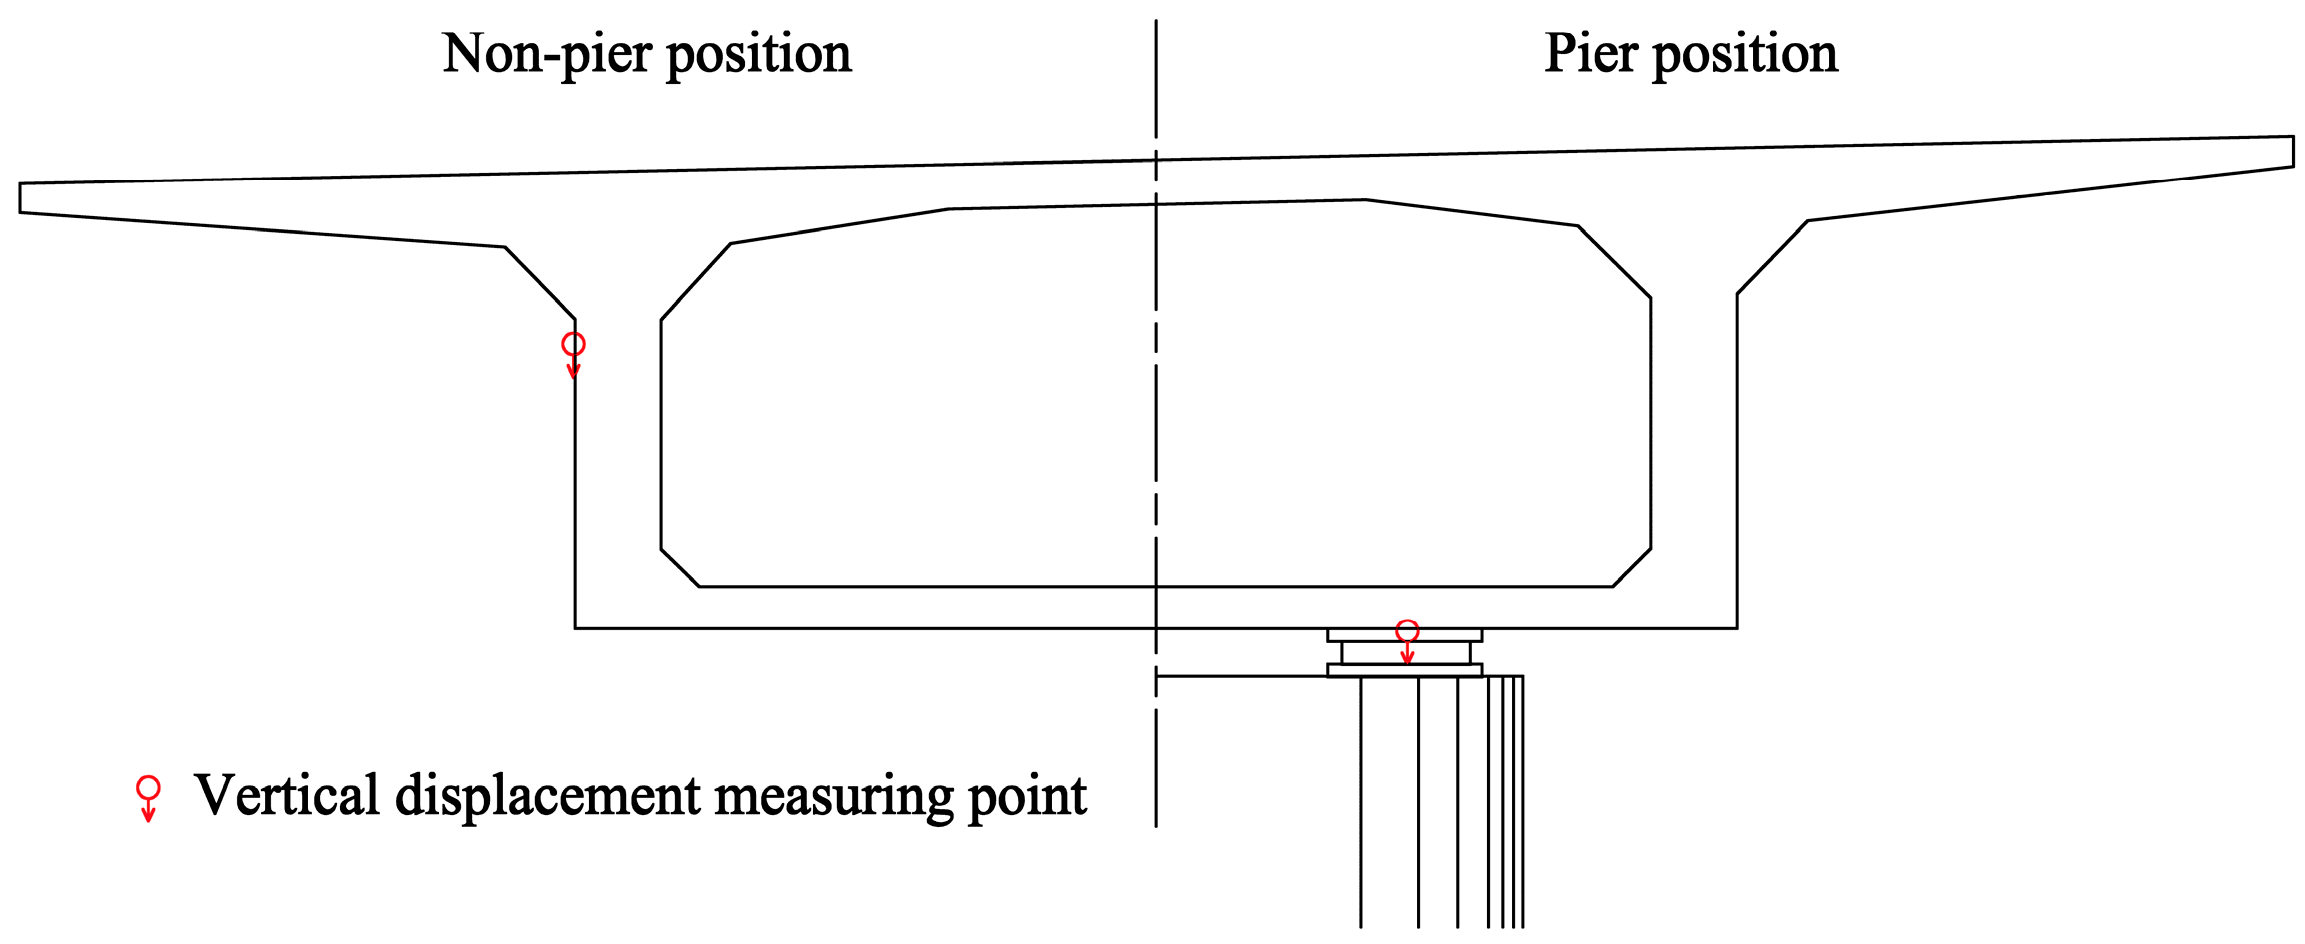
3.1. Vertical Displacement Measuring Point Location
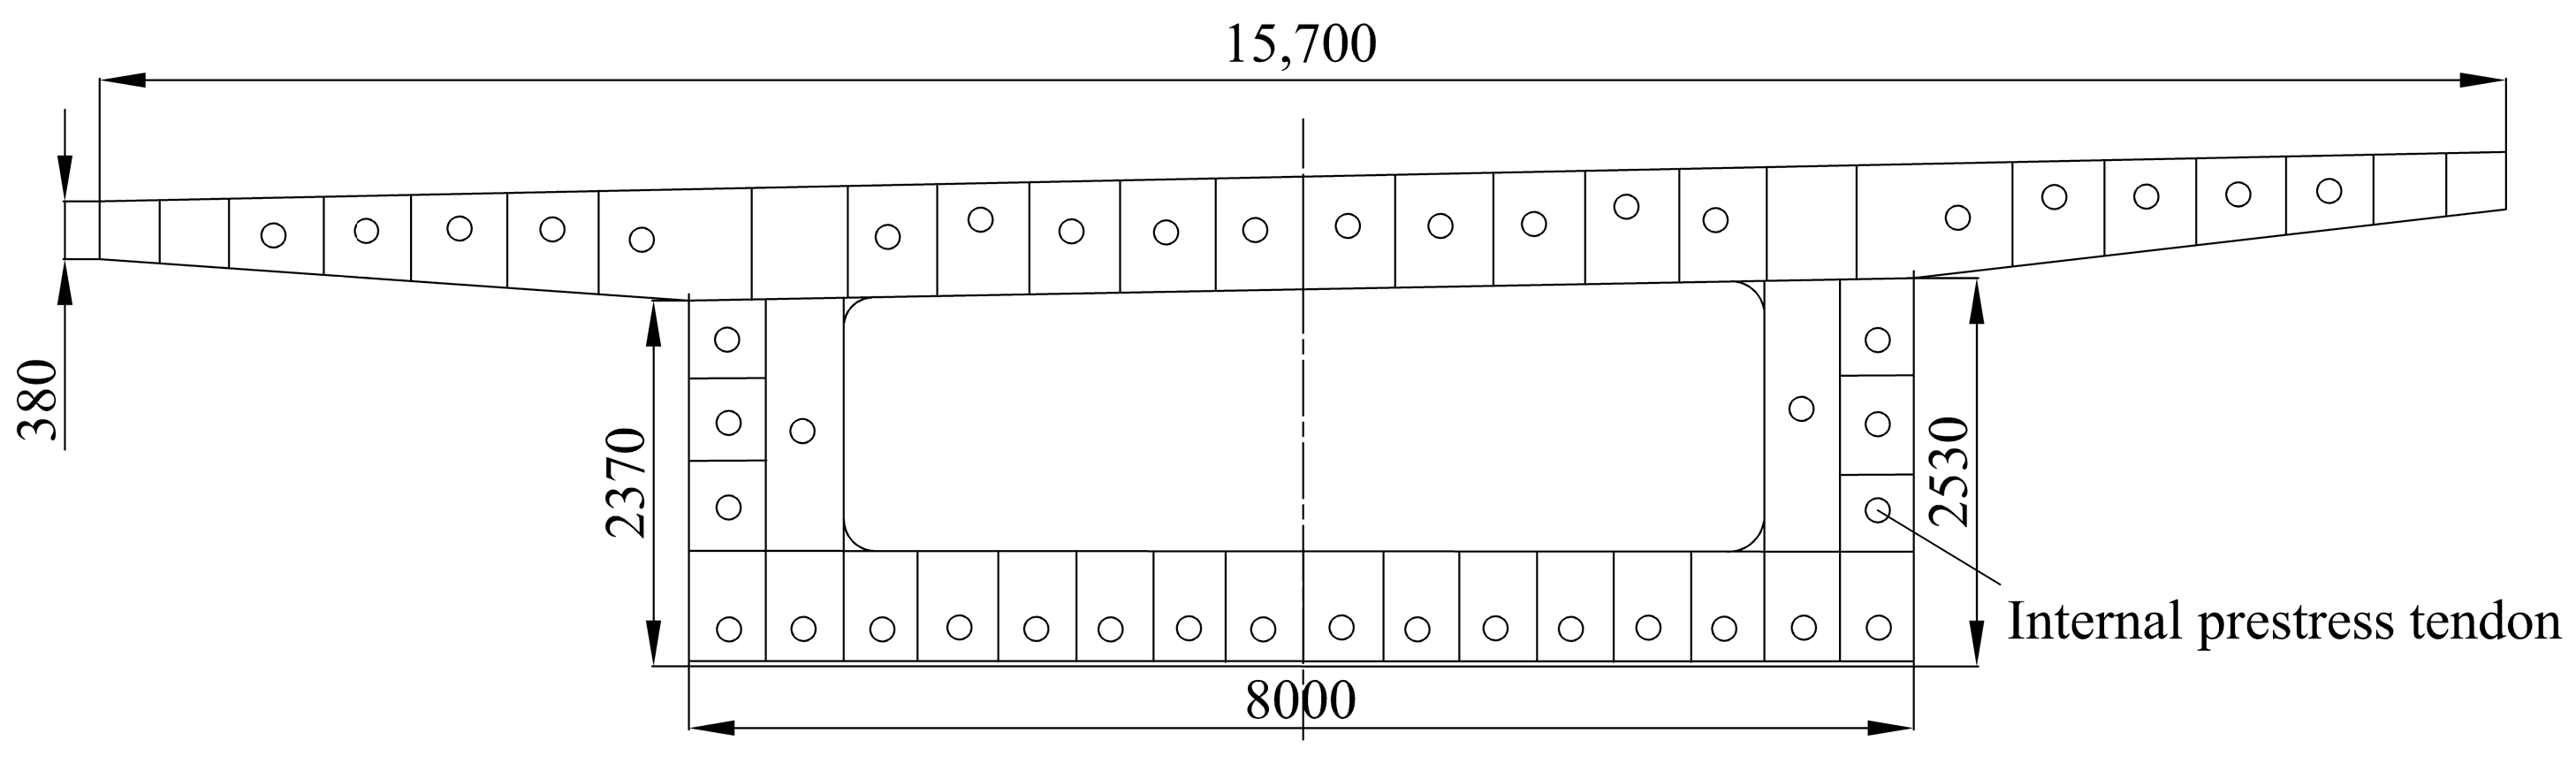
3.2. Longitudinal Stress Measuring Point Location
3.3. Measurement of Construction Conditions
4. Analysis of the Mechanical Behavior of the Main Beam
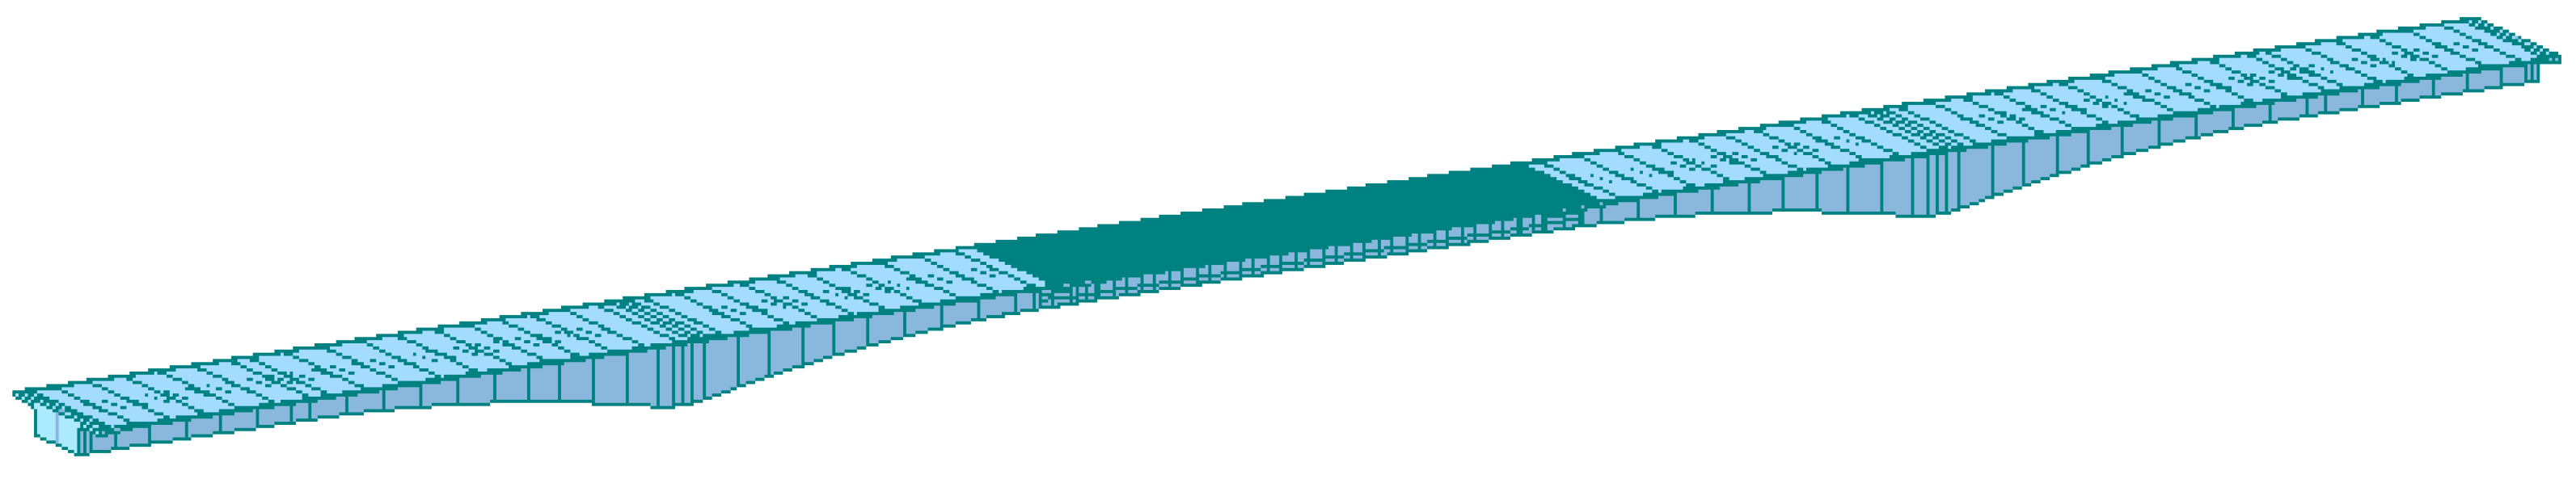
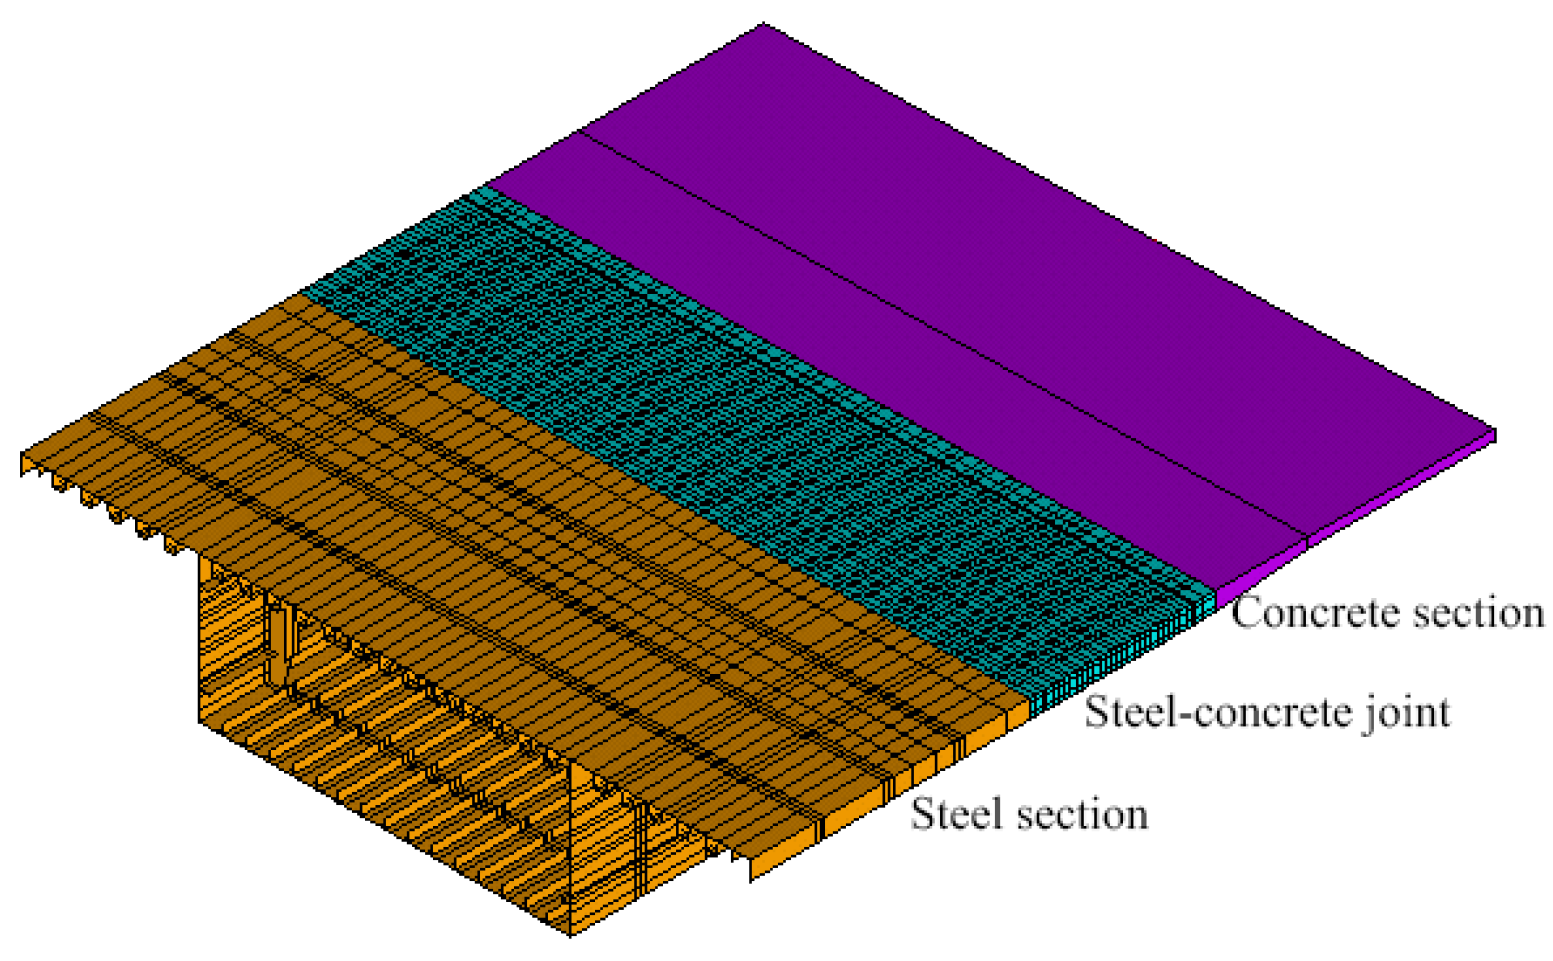
4.1. Finite Element Model of the Hybrid Beam Bridge
4.2. Deformation Analysis of the Hybrid Beam in Each Construction Process
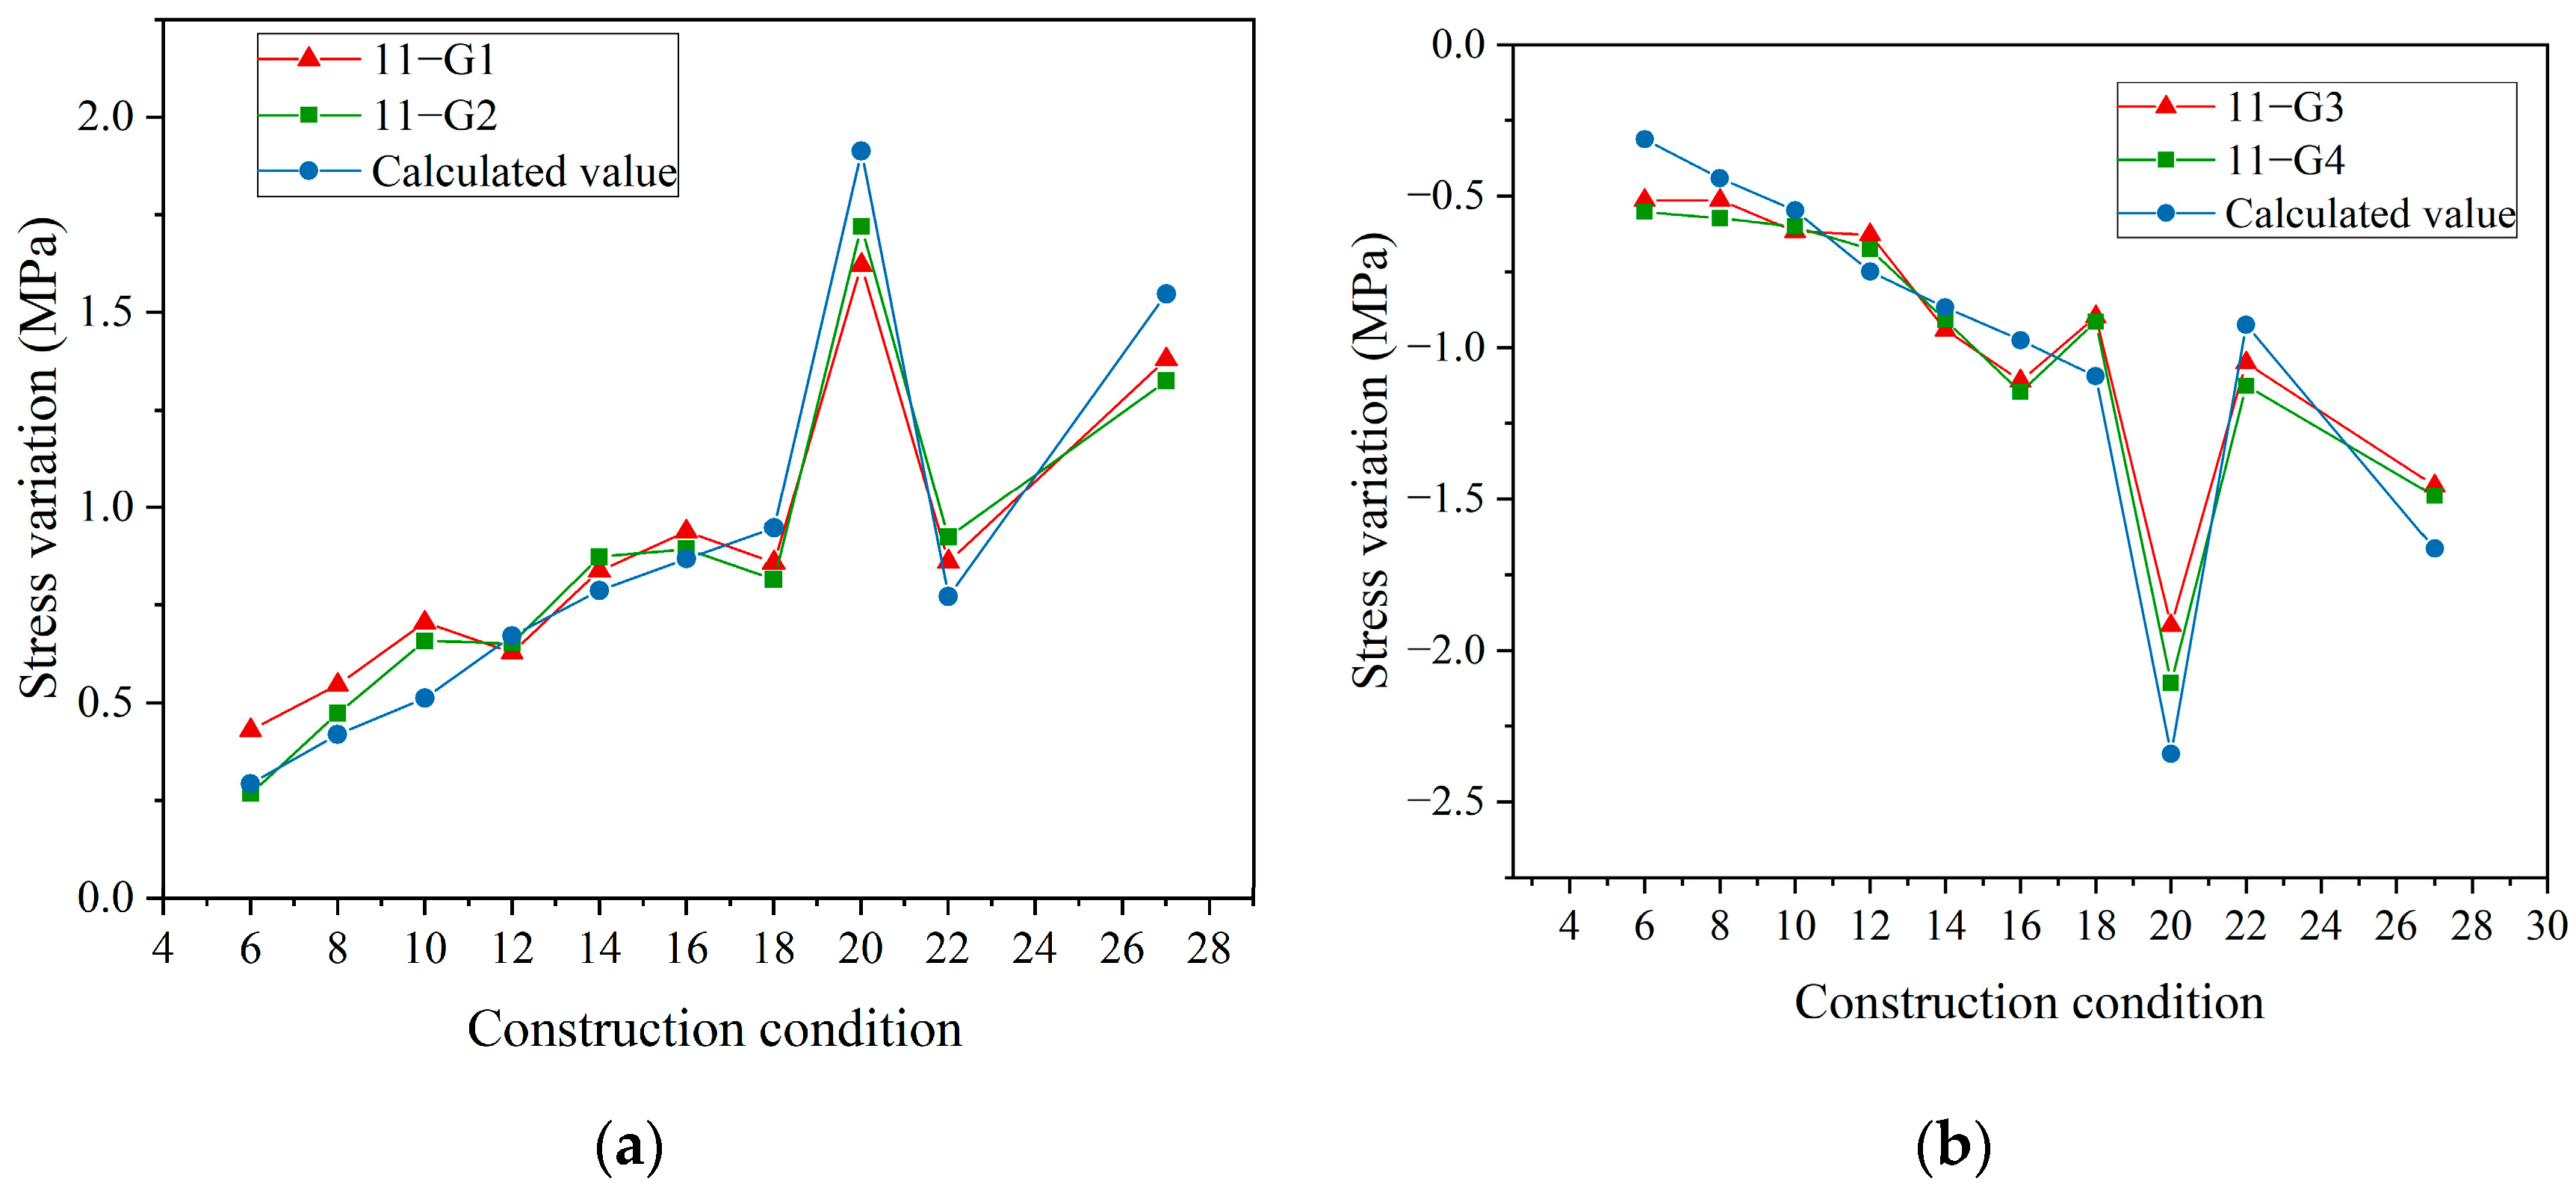
4.3. Stress Analysis of the Hybrid Beam in Each Construction Process
5. Analysis of the Mechanical Properties of the Steel–Concrete Joint
5.1. Finite Element Model of the Joint
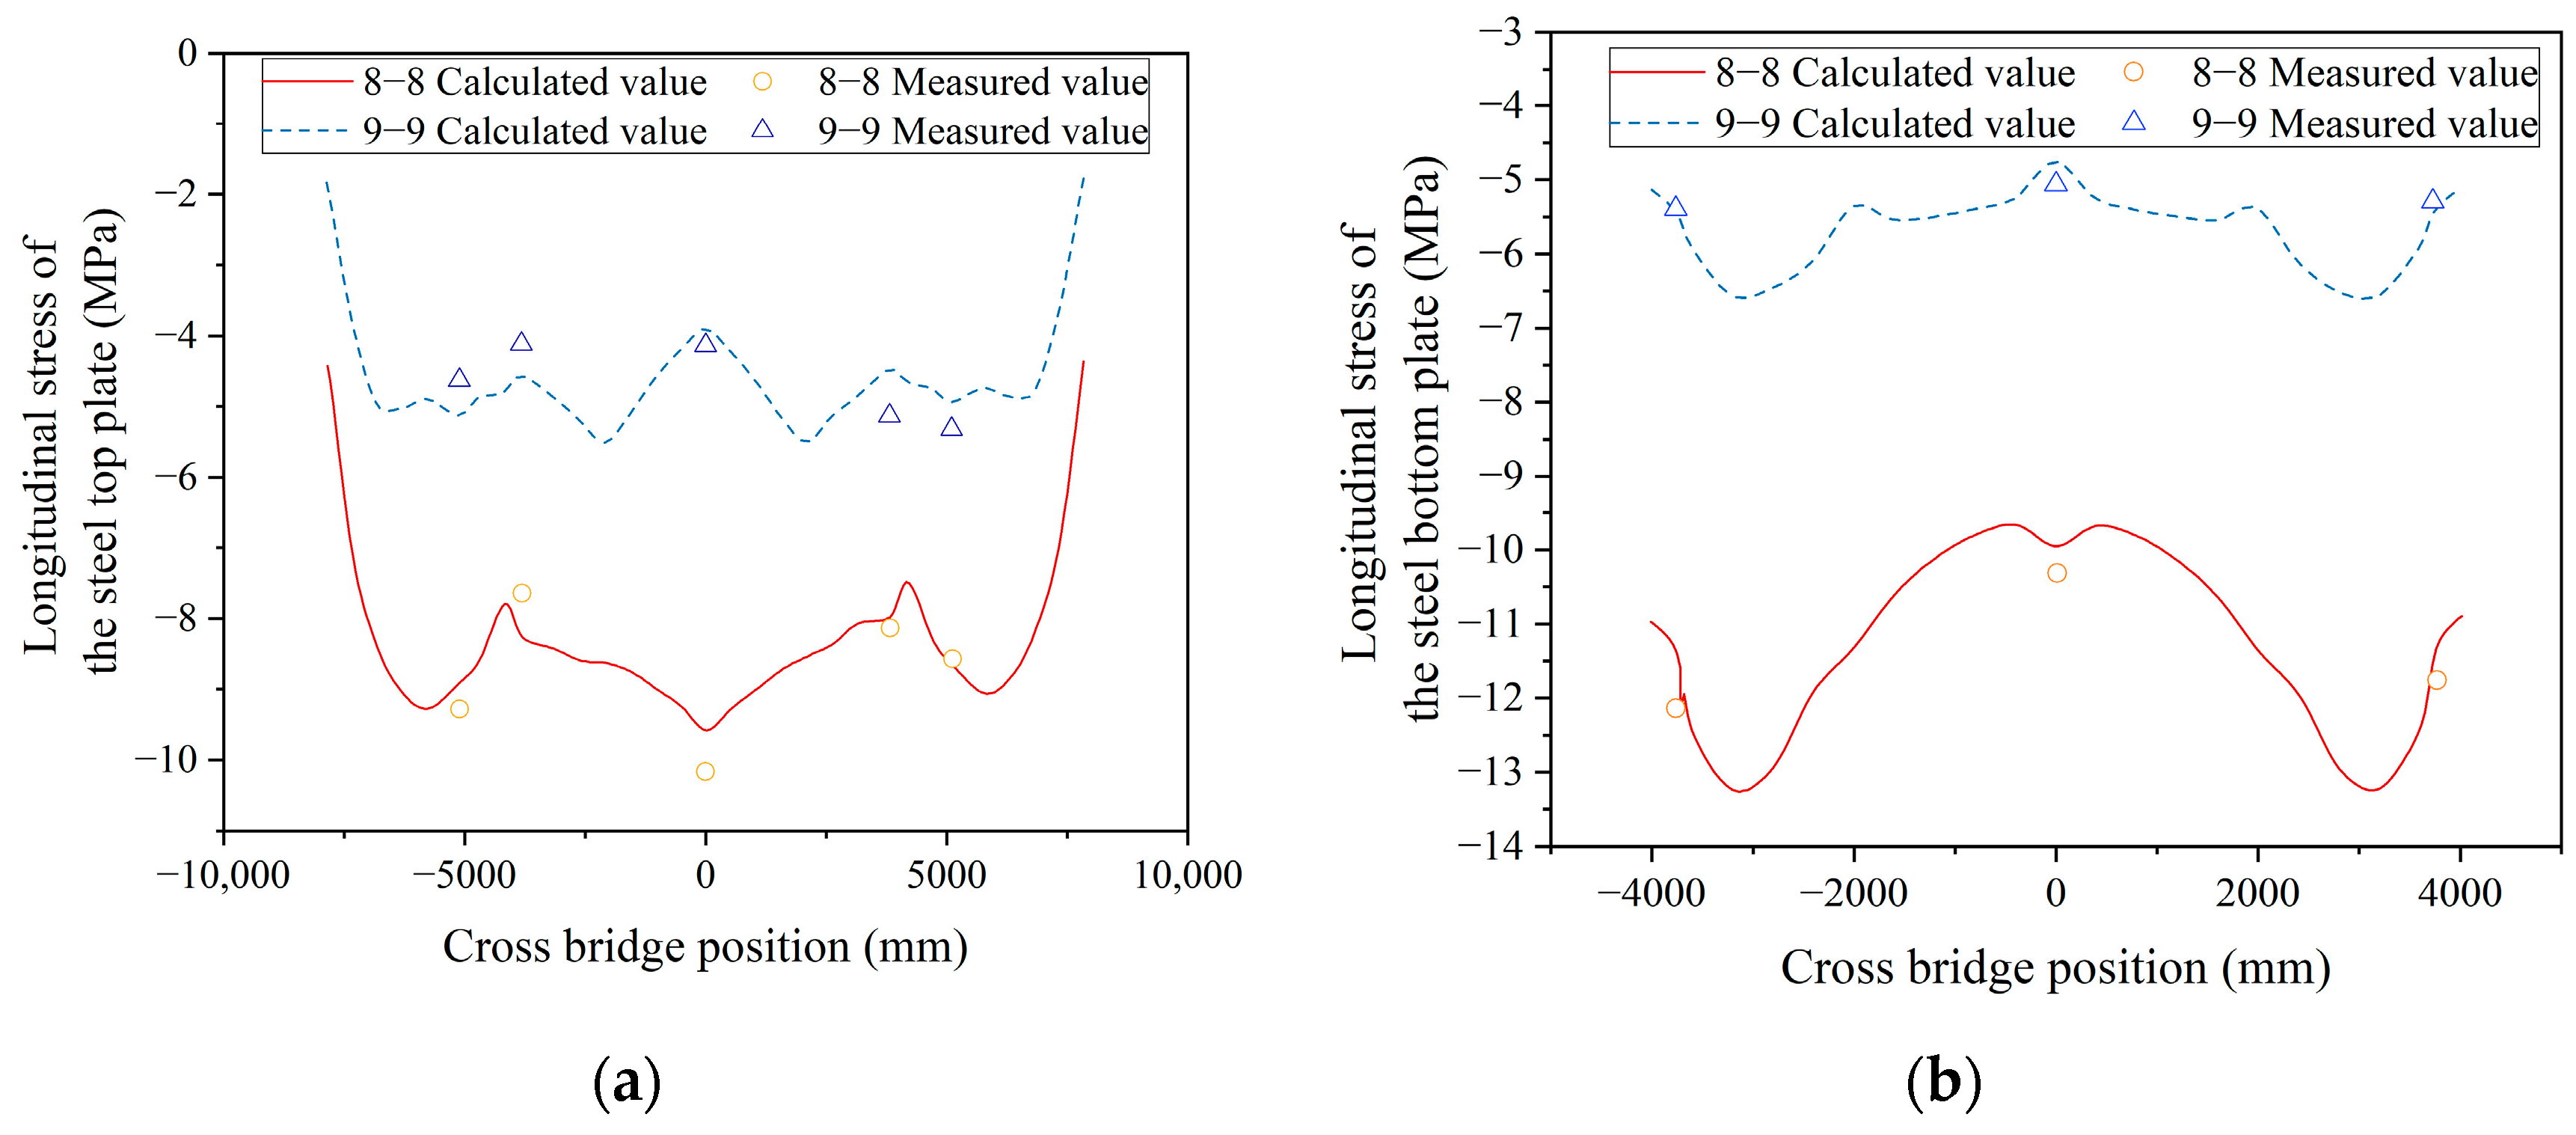
5.2. Steel Stress Analysis of the Joint
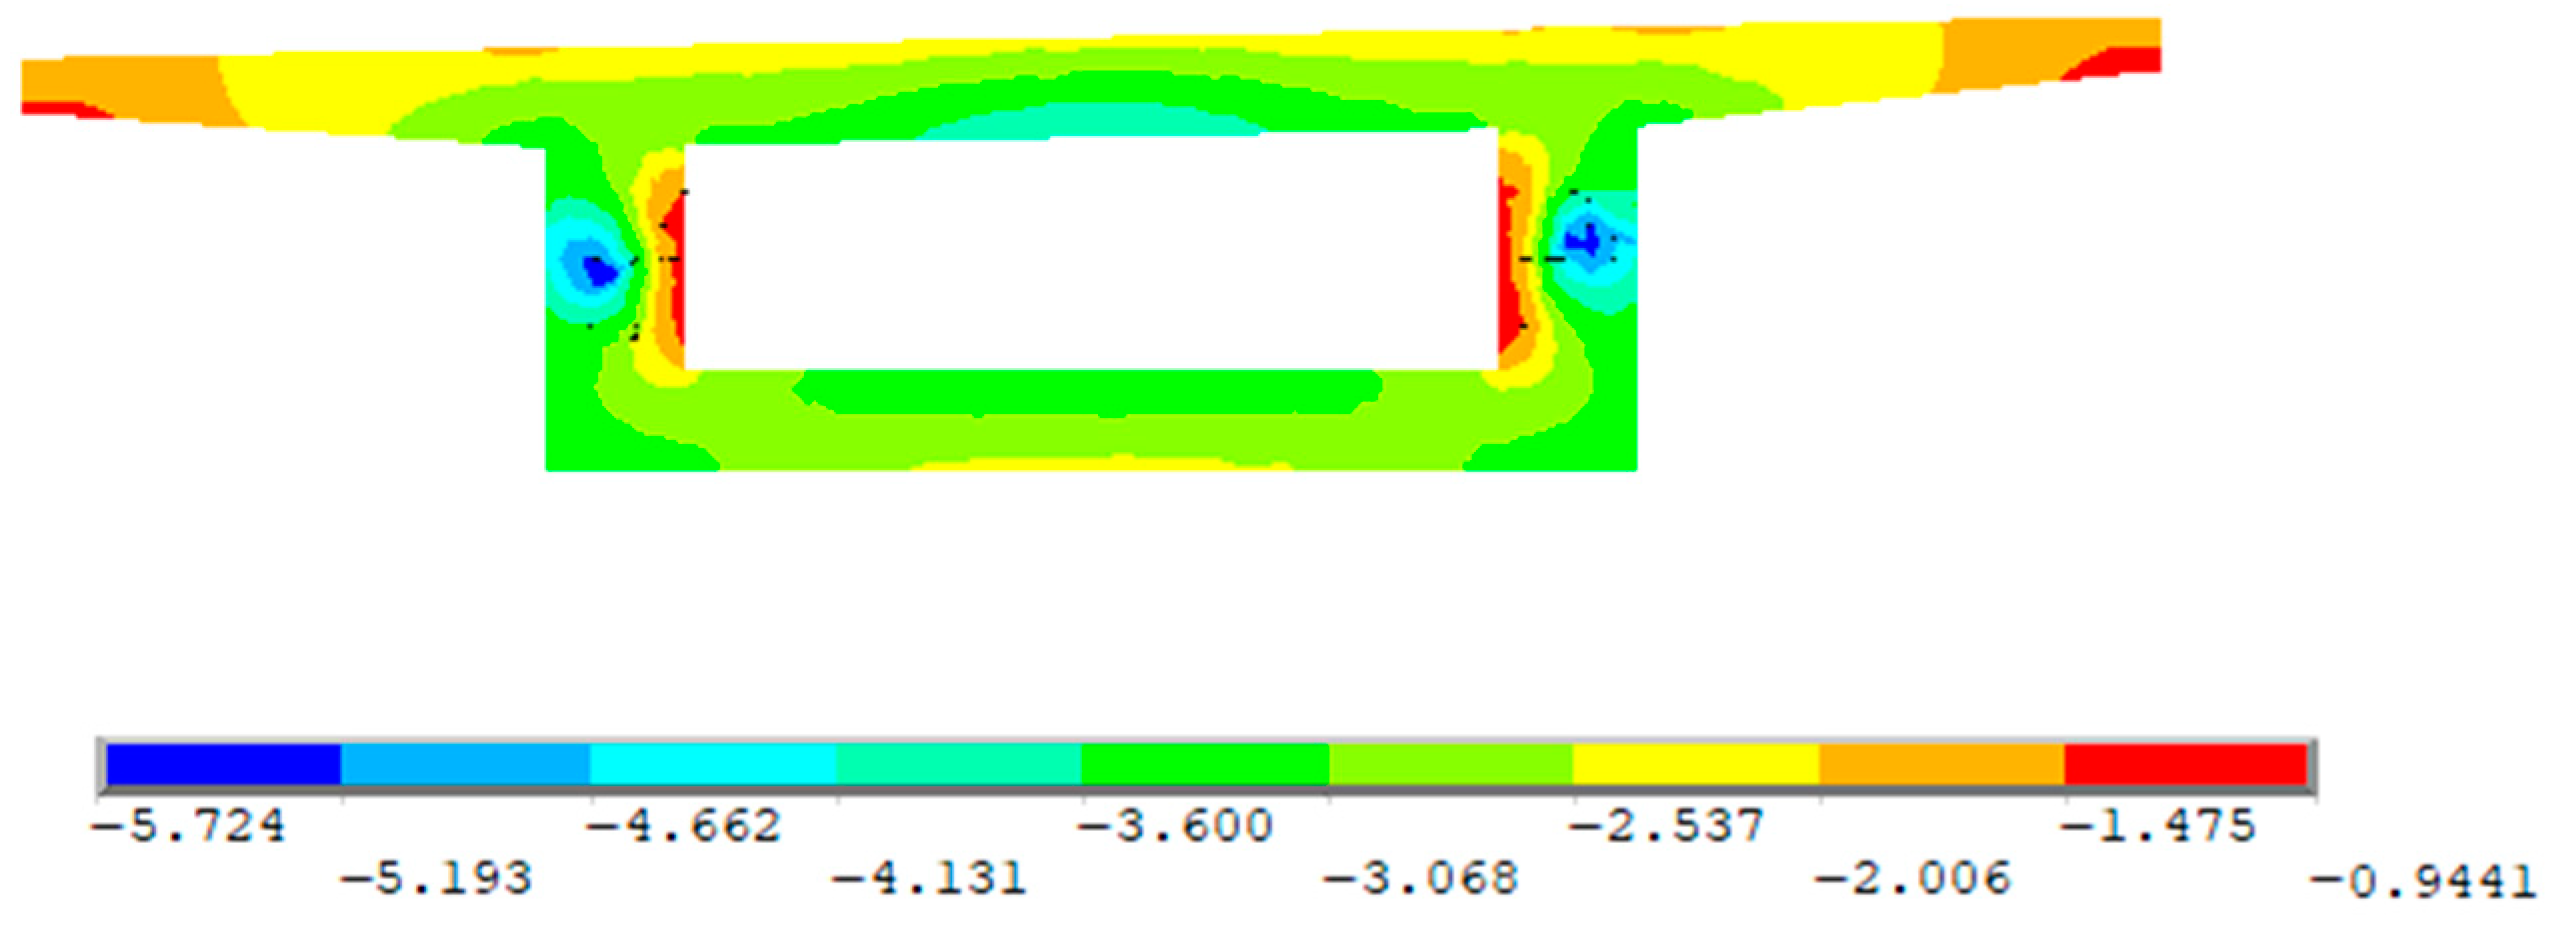
5.3. Concrete Stress Analysis of the Joint
6. Conclusions
Author Contributions
Funding
Data Availability Statement
Acknowledgments
Conflicts of Interest
References
- He, Z.-Q.; Chen, J.; Liu, Z.; Ma, Z.J. An Explicit Approach for Determining the Rational Length of Steel Portion in Steel-Concrete Hybrid Girder Bridges. J. Bridge Eng. 2023, 28, 5022011. [Google Scholar] [CrossRef]
- Liu, R.; Yu, J.; Liu, Y.; Wu, D. Mechanical Analysis of Joint Sections of Hybrid Girder of Edong Changjiang River Bridge. Bridge Constr. 2010, 33–35, 62. [Google Scholar]
- Shen, Q.; Shao, J.; Xu, J.; Yu, L.; He, X. Study of Force Transmitting Behavior of Joint Section of a Three-Span Steel and Concrete Continuous Hybrid Girder Bridge. Bridge Constr. 2012, 42, 70–74. [Google Scholar]
- He, W.; Liu, Y.; Wang, R. Analysis of Joint Section Structure of Hybrid Girder of Jiujiang Changjiang River Highway Bridge. Bridge Constr. 2012, 42, 30–35. [Google Scholar]
- Chen, K.; Wang, J.; An, Q. Model tests on steel-concrete joining section of main girder of a cable-stayed bridge. China Civ. Eng. J. 2006, 39, 86–90. [Google Scholar]
- Huang, C.; Zhang, Z.; Chen, K. Model Test and Transfer Mechanism of Steel-Concrete Composite Structure for Hybrid Girder Cable-Stayed Bridges. J. Huazhong Univ. Sci. Technol. Nat. Sci. 2012, 40, 67–71. [Google Scholar]
- Qin, F.; Di, J.; Dai, J.; Lu, W.; Zhao, M. Study on Rational Position of Joint Section of Steel-Concrete Hybrid Girder Bridge. In Proceedings of the Construction and Urban Planning, Pts 1–4; Huang, Y., Bao, T., Wang, H., Eds.; Trans Tech Publications Ltd.: Stafa-Zurich, Switzerland, 2013; Volume 671–674, pp. 1007–1011. [Google Scholar]
- Qin, F.; Zhou, X.; Liang, B.; Di, J.; Tu, X.; Xu, L.; Zou, Y. Experiment on Steel-Concrete Joint of Hybrid Girder of a Long-Span Self-Anchored Suspension Bridge. China J. Highw. Transp. 2018, 31, 52–64. [Google Scholar]
- Yao, Y.; Yang, Y.; Liu, Z.; Shi, Z.; Pu, Q. Model Tests on the Steel-Concrete Joint Section of Hybrid Cable-Stayed Railway Bridge with Long-Span Steel Box Girder. J. China Railw. Soc. 2015, 37, 079–084. [Google Scholar]
- Cheng, X.; Nie, X.; Fan, J. Structural Performance and Strength Prediction of Steel-to-Concrete Box Girder Deck Transition Zone of Hybrid Steel-Concrete Cable-Stayed Bridges. J. Bridge Eng. 2016, 21, 4016083. [Google Scholar] [CrossRef]
- Wei, F.; Luo, H.; Liang, L.; Xiao, Y.; Su, C. Mechanical Performance Analysis of Steel-Concrete Joint Section of a Long-Span Hybrid Girder Cable-Stayed Bridge Based on Field Test. J. Chang. Univ. Nat. Sci. Ed. 2021, 41, 54–65. [Google Scholar]
- Kulkarni, S.A.; Li, B.; Yip, W.K. Finite Element Analysis of Precast Hybrid-Steel Concrete Connections under Cyclic Loading. J. Constr. Steel Res. 2008, 64, 190–201. [Google Scholar] [CrossRef]
- Zhang, G.; Chen, C.; Liu, Y. Load Transfer Mechanism Between Cells and Bearing-Plate in Hybrid Girder Joint. J. Tongji Univ. Nat. Sci. 2017, 45, 658–663. [Google Scholar]
- Kim, S.-H.; Lee, C.-G.; Ahn, J.-H.; Won, J.-H. Experimental Study on Joint of Spliced Steel–PSC Hybrid Girder, Part I: Proposed Parallel-Perfobond-Rib-Type Joint. Eng. Struct. 2011, 33, 2382–2397. [Google Scholar] [CrossRef]
- Kim, S.-H.; Lee, C.-G.; Kim, S.-J.; Won, J.-H. Experimental Study on Joint of Spliced Steel–PSC Hybrid Girder, Part II: Full-Scale Test of Spliced Hybrid I-Girder. Eng. Struct. 2011, 33, 2668–2682. [Google Scholar] [CrossRef]
- Xin, H.; Liu, Y.; He, J.; Zhang, Y. Experimental and Analytical Study on Stiffened Steel Segment of Hybrid Structure. J. Constr. Steel Res. 2014, 100, 237–258. [Google Scholar] [CrossRef]
- Liu, R.; Liu, Y. Analysis of Auxiliary Ribs in Steel–Concrete Joint of Hybrid Girder. J. Constr. Steel Res. 2015, 112, 363–372. [Google Scholar] [CrossRef]
- He, J.; Liu, Y.; Pei, B. Experimental Study of the Steel-Concrete Connection in Hybrid Cable-Stayed Bridges. J. Perform. Constr. Facil. 2014, 28, 559–570. [Google Scholar] [CrossRef]
- He, S.; Fang, Z.; Fang, Y.; Liu, M.; Liu, L.; Mosallam, A.S. Experimental Study on Perfobond Strip Connector in Steel-Concrete Joints of Hybrid Bridges. J. Constr. Steel Res. 2016, 118, 169–179. [Google Scholar] [CrossRef]
- He, S.; Fang, Z.; Mosallam, A.S. Push-out Tests for Perfobond Strip Connectors with UHPC Grout in the Joints of Steel-Concrete Hybrid Bridge Girders. Eng. Struct. 2017, 135, 177–190. [Google Scholar] [CrossRef]
- He, S.; Mosallam, A.S.; Fang, Z.; Liu, L. Structural Evaluation of Steel-Concrete Joint with UHPC Grout in Single Cable-Plane Hybrid Cable-Stayed Bridges. J. Bridge Eng. 2019, 24, 4019022. [Google Scholar] [CrossRef]
- Liu, Q.; Li, X.; Zhang, X.; Zhang, Z.; Li, Y. Stiffness Transition Analysis of a Steel-Concrete Joint Section Based on Vehicle-Bridge Interaction. J. Southwest Jiaotong Univ. 2013, 48, 810–817. [Google Scholar]
- Li, C.; Lu, B.; Wang, C.; Peng, W. Dynamic Performance Assessment of a Novel Hybrid Bridge System with Spread Steel Box Girders. J. Bridge Eng. 2022, 27, 4021097. [Google Scholar] [CrossRef]
- Zhang, X.; Zhang, S.; Niu, S. Experimental Studies on Seismic Behavior of Precast Hybrid Steel-Concrete Beam. Adv. Struct. Eng. 2019, 22, 670–686. [Google Scholar] [CrossRef]
- Lu, B.; Zhai, C.; Li, S.; Wen, W. Predicting Ultimate Shear Capacities of Shear Connectors under Monotonic and Cyclic Loadings. Thin-Walled Struct. 2019, 141, 47–61. [Google Scholar] [CrossRef]


| Construction Condition | Content | Construction Condition | Content | Construction Condition | Content |
|---|---|---|---|---|---|
| 1 | Main pier construction | 12 | Block 5# pouring | 23 | T10/Z1~Z3/ZH1~ZH5 tension |
| 2 | Block 0# pouring | 13 | F10/T6/T11 tension | 24 | Side span straight section cast-in-place |
| 3 | F1/F2/T1 tension | 14 | Block 6# pouring | 25 | Side span closing section cast-in-place |
| 4 | Block 1# pouring | 15 | F11/T7/T12 tension | 26 | B1~B4/BH1/BH2 tension |
| 5 | F3/F4/T2 tension | 16 | Block 7# pouring | 27 | Hoisting of mid-span steel beam |
| 6 | Block 2# pouring | 17 | F12/T8 tension | 28 | Y1/Y2 tension |
| 7 | F5/F6/T3 tension | 18 | Block 8# pouring | 29 | Bridge deck pavement |
| 8 | Block 3# pouring | 19 | F13/T9 tension | ||
| 9 | F7/F8/T4 tension | 20 | Block 9# pouring | ||
| 10 | Block 4# pouring | 21 | F14 tension | ||
| 11 | F9/T5 tension | 22 | Site joint section pouring |
Disclaimer/Publisher’s Note: The statements, opinions and data contained in all publications are solely those of the individual author(s) and contributor(s) and not of MDPI and/or the editor(s). MDPI and/or the editor(s) disclaim responsibility for any injury to people or property resulting from any ideas, methods, instructions or products referred to in the content. |
© 2023 by the authors. Licensee MDPI, Basel, Switzerland. This article is an open access article distributed under the terms and conditions of the Creative Commons Attribution (CC BY) license (https://creativecommons.org/licenses/by/4.0/).
Share and Cite
Pei, H.; Jia, L.; Li, J.; Li, K.; Xia, R. A Study of the Mechanical Behavior of a Steel–Concrete Hybrid Beam Bridge during Construction. Buildings 2023, 13, 1781. https://doi.org/10.3390/buildings13071781
Pei H, Jia L, Li J, Li K, Xia R. A Study of the Mechanical Behavior of a Steel–Concrete Hybrid Beam Bridge during Construction. Buildings. 2023; 13(7):1781. https://doi.org/10.3390/buildings13071781
Chicago/Turabian StylePei, Huiteng, Lijun Jia, Jiawei Li, Kewei Li, and Ruijie Xia. 2023. "A Study of the Mechanical Behavior of a Steel–Concrete Hybrid Beam Bridge during Construction" Buildings 13, no. 7: 1781. https://doi.org/10.3390/buildings13071781
APA StylePei, H., Jia, L., Li, J., Li, K., & Xia, R. (2023). A Study of the Mechanical Behavior of a Steel–Concrete Hybrid Beam Bridge during Construction. Buildings, 13(7), 1781. https://doi.org/10.3390/buildings13071781