Abstract
It is widely accepted that permeability is a key attribute for sustainable development, but two puzzles remain unsolved. First, there is no consensus on its measurement. Second, there are still many new urban developments that lack this quality; regardless, it is a well-known urban design principle. This paper reviews different permeability measurements and proposes to categorize them into four quadrants, then compares eleven of them with four sets of abstract forms and four real cases from Southeast China. The two measures rooted in space syntax theory demonstrate their robustness in the abstract forms. In contrast, the area-based measures cannot quantify the differences between places with similar content. In the actual case studies, by comparing the differences between original plans and the real built forms, we suggest that three traps impair their permeability and therefore deviate greatly from the initial design visions, resulting in automobile-oriented travel patterns. The two new measures were used to quantify the different levels of permeability in these four cases. It is concluded that the qualitative urban design principles may fail to be delivered without a quantitative and precise description of urban form. Consistent measures and more empirical cases are needed to reveal the contribution of spatial networks to sustainable development.
1. Introduction
1.1. Urban Form and Sustainability
Various aspects of sustainability have been discussed since the 1990s. In September 2015, 17 sustainability goals were proposed at the UN Sustainable Development Summit [1]. Four of them are relevant to urban studies: Goal #3 (good health and well-being), Goal #5 (gender equality), Goal #7 (affordable and green energy), and Goal #11 (to make cities and human settlements inclusive, safe, resilient, and sustainable).
There has been a lot of discussion around the relationship between the urban form and sustainability, and it is widely recognized by the normative theories of urban design. Besides the physical aspects of built environments, such as sustainable building materials, recycling processes, and sustainable ways of heating or cooling buildings, spatial parameters are also crucial for generating walkable neighborhoods and compact, well-functioning, vital local urban centers [2]. Carmona draws from a wide body of literature to establish ten universal principles of sustainable urban design and then claims that fundamentally good urban design is sustainable, but this implies much more than simply reducing energy use and carbon emissions [3]. He highlights the notions of “permeable block structure”, “fine grained street and space network”, “mix uses”, “compactness”, etc. as key components of sustainable design principles. The compactness of urban form not only benefits the environment, promoting walking and therefore reducing carbon emissions [4], but also contributes to urban vitality [5,6].
However, while the study of urban form discusses urban elements and their interrelationship comprehensively, determining the effect of a single urban element on different aspects of sustainability is rarely attempted. For example, a recent study developed a framework of spatial indicators of urban design and transport features that support health and sustainability based on 25 diverse cities in 19 countries. The spatial permeability is not addressed by itself but mixed with facility supplements [7]. It is probably the reason why van Nes claims that the spatial parameters (including the spaces shaped by physical objects such as buildings) are not always taken into account for the sustainable agenda [2]. This is a reasonable concern. We found that there was a popular discussion of the “compact city fallacy”, which began in 2005 [8]. It holds that the compact city is neither a necessary nor sufficient condition for a city to be sustainable and that the attempt to make cities more sustainable by using urban form strategies only is counterproductive. This proposition took the new urbanist towns as examples, and we will return to it later in this article.
Moudon identifies three principles on which urban morphological analysis is based [9]. First, urban form is defined by three fundamental physical elements: buildings and their related open spaces, plots or lots, and streets. Second, urban form can be understood at different levels of resolution. Third, urban form can only be understood historically. This is a well-accepted classification framework which can help us separate the influences of different urban form elements on sustainability. In this paper, we will focus on the street networks’ effect on sustainability. Therefore, the first step is to verify the measures for the concept of permeability.
1.2. Two Sub-Branches of Space Morphology and the Measures for Permeability
Great inconsistency can currently be found in the way urban forms are quantified. Defined as the capacity for flows to permeate an urban fabric, permeability has long been a mainstream criterion for urban design practice, while its measurement is still under discussion. Dovey and Pafka claimed any reduction to a singular index of morphological properties can bring misrecognition of how cities work [10]. Starting from the most obvious measures of permeability based on average block-size (length, area, perimeter), they proposed a new measure, AwaP, which is the ”area-weighted average perimeter” where each block perimeter is multiplied by its area and then averaged across a study area, and claimed it is the most accurate measurement for permeability [11]. The equation is simply shown below.
P is the total perimeter of blocks, and N is the number of blocks.
A is the total area of blocks, and N is the number of blocks.
where n is the number of blocks; Pi and Ai are the perimeter and area of each block i, respectively; and AT is the total area of all blocks. Low AwaP scores indicate high permeability within the measured area, while high scores indicate low permeability.
Their paper in 2018 discusses the space syntax centrality measurement [12]. By testing space syntax centrality measures in both real and abstract morphology, the authors argued that axial analyses can produce distorted mapping at walkable scales. They found that within six measures of centrality (integration/choice), only one measure (closeness in a walkable radius) approximates a mapping of permeability that analyzes block-size alone. However, this measurement still has its problem: a regular continuous grid will always show equal permeability across the grid, while measures of centrality always peak at the center (Figure 1).

Figure 1.
Measures of centrality (integration radius 400 m) [12].
The integration (I) of an axial line (i) is a function of its depth related to all other axes, where n is the number of segments and dij is the shortest distance (least number of direction changes) between two segments i and j. The greater the number of steps (dij) between street axes, the lower the integration values become. The choice of a street axis shows how likely one is to pass through that axis when moving around in a built environment. The formula of choice (C) of a street axis (i) is as follows, where gjk (i) is the number of shortest paths between segment j and k containing i, and gjk is the number of all shortest paths between j and k [13].
This paper will explain that there are two merits of the space syntax centrality measures which are not perceived by Dovey and Pafka. And this lack of understanding could be the reason why good urban design principles cannot be implemented in real practice. Before detailed explanations, the theoretical background of these two algorithms needs to be reviewed.
Calculation for spatial permeability involves space morphology, which is a new branch in urban morphology. Compared to the normative–prescriptive studies, this branch focuses on analytical, descriptive studies. It is aimed at ”uncovering the fundamental characteristics of urban geometries” and ”enriching the description of built form in ways that express aspects of performance and function” [14,15]. This branch has a good connection with current practice, as it could offer new possibilities for efficiency and easier adoption of research tools in practice, and has been empirically tested in the context of the local neighborhood plan for Radlett, Hertfordshire, in the United Kingdom [16].
Moudon [15] pointed out that there are two origins for this branch. They are the Centre of Land Use and Built Form Studies (LUBFS) at Cambridge University directed by Leslie Martin and Lionel March and known for their seminal work ”the grid as generator” [17] and the other center at University College London (UCL) directed by Bill Hillier that developed what we today know as space syntax [18]. What the two directions have in common is that they are both mathematical.
The two permeability measurements described above are rooted in these two sub-branches. Although the most apparent difference between them is the description unit, namely block and street network, there is a deeper difference, which is omitted by the 2018 paper of Pafka: the contrast between “area-based measures” and “location-based measures”.
Area-based and location-based measures differ especially in their way of defining the area boundaries. The former is often based on administrative boundaries or projected boundaries, which traditionally also dominate geographic descriptions; the latter defines the boundaries via the position of a location in the city and what is possible to ”reach” from there at a certain radius [19].
These two types of measurements have distinct features. The shortcoming of area-based measures, “the scale effect”, is related to the well-known modifiable areal unit problem (MAUP) in physical geography [20]. The location-based measures solve this problem by replacing the fixed boundary by a non-fixed boundary calculated from the exact position of each spatial unit at a given radius, therefore obtaining a user’s perspective. However, the area-based measures are more accessible for decision-makers as they are easy to understand. For a real project, the area-based measures can give people straightforward statistical figures that indicate its scale, function, or density.
A four-quadrant diagram was developed to categorize the different measurements used by research groups in the branch of space morphology (Figure 2). The classification system for street morphologies developed by Marshall [21], the well-known method “Walk Score” for measuring walkability [22], “interface catchment” proposed by Dovey and Pafka [11], the integrated density approach ”Spacemate” developed by Berghauser Pont and Haupt [23], and the new generation of Typo-Morphological proposed by Berghauser Pont, etc. [24] can all be put in this diagram. We found the permeability measurement of AwaP is opposite that of the space syntax centrality measurement [25], and it is understandable that its authors did not appreciate the virtues of an opposite type of approach.

Figure 2.
Four-quadrant to map the measurements in space morphology [11,21,22,23,24,25].
L is the total length of the street, and A is the area of the study area.
I is the number of intersections, and A is the area of the study area.
T is the number of forks, and X is the number of intersections.
Berghauser Pont [14] provides another underlying reason why Dovey and other traditional morphologists prefer measures based on blocks instead of street networks. Urban morphology defines urban elements from a “conceived” rather than “perceived” point of view: for instance, the urban block, which typically is easy to identify on a map but is actually very difficult to perceive in urban space. On the other hand, the morphological representation developed within space syntax, typically has its ”rationale” in human perception and cognition. The energy effort and the informational effort for a moving subject in an urban area, which can be called a cognitive geometry [26], is the reason why a simple axial model can capture the distribution of pedestrian movement. Table 1 provides a summary for the comparison of two types of space-morphology measures. The advantage of location-based measures is more sensitive to users’ feelings, and it can overcome the zoning effects.

Table 1.
Summary for the two types of measures: area vs. location.
1.3. The Notion of Spatial Sustainability and the Space Syntax Measurements
Compared to the comprehensive approach to urban form, the space syntax approach only studies the centrality properties of street network [27,28] and does not consider other morphological aspects, such as built-mass density [29]. A notion of spatial sustainability is proposed by Hillier [30], focusing on the structure of the primary spatial structure of the city—the street network. He believed space syntax has now brought to light key underlying structures in the city, which have a direct bearing on sustainability in that they seem to show that the spatial form of the self-organized city, as a foreground network of linked centers at all scales set into a background network of mainly residential space, is already a reflection of the relationships between environmental, economic, and sociocultural forces, i.e., between the three domains of sustainability.
Two aspects of background knowledge should be noted here. First, ”integration” and ”choice” in space syntax literature are essentially synonyms of ”closeness centrality” and ”betweenness centrality” in network theory. These variables are always used to measure street network “accessibility”, which is not quite the same as permeability. However, as this paper’s main purpose is to discuss the relationship between physical form and sustainability, these two concepts could be interchangeable. Second, the syntactic measurement is always defined by a certain radius. Normally, a local radius corresponds to a walking distance. A global radius corresponds to bicycle or vehicle travel distance.
However, the space syntax measurements are not easy to be understand as the formulas are different from generality urban network analysis. In its model, “angular distance” is used to replace the “metric distance” in the formula [25,31] as the former can incorporate human perception in the model. And many empirical studies across the world proved its theory of “movement economy”. To make things more complex, Hillier et al. also suggested that configurational properties of urban networks are dualistic: metric at a ”local” scale and topo-geometric at a ”global” scale [32]. This begs the question of what such a limit might be; walking distances are elastic, and it is difficult to establish any such limit that is not arbitrary [12]. This ambiguity leads to a major problem for the space syntax application in practice. Those issues are related to the selection of metric distance radius and betweenness or closeness centrality, producing a significant level of opacity, misunderstandings, and even misuse of the model.
To cope with this problem, Peponis and Feng [33,34] created a new syntactic measure “reach” to retain the merit of cognition sensitivity and make the measure easier to understand. Haofeng Wang developed a toolkit, UrConnect, which can conduct network reach analysis [35]. Metric reach (MR) is a measure that gives the answer to a simple question: how much street length can be reached as we walk in all possible directions from a given origin up to a certain distance threshold? Therefore, this measure is easy to understand, just like “street density”. Moreover, it is not a description of an area with a fixed boundary; thus, the “modifiable areal unit problem” can the solved. MR is now a common matrix, which can be calculated in a GIS by network analysis.
Peponis’s effort to create a syntactic reach measure does not only assess the total street length up to a certain distance threshold but also to a certain directional change. For example, MR-2DC means metric reach in two directional changes. To cope with the situation of minor sinuosity, changes in direction below a threshold angle can be considered as insignificant [36]. So, the directional distance of a street network from a point is measured according to the minimum number of direction changes required to reach any part of the network from that point, consistent with typical measures used in space syntax [33]. This new syntactic measure includes people’s perception in an easy-to-comprehend manner. As this compound measurement gives us an idea of the total length of streets we can approach from a location in two directional changes within a metric threshold, it is the best measurement we have by far which can overcome all the weaknesses and reflect the theoretical endeavors of space syntax studies. We tested its effectiveness in both the abstract forms and real case studies.
The theoretical explanation of the importance of the global syntactic variable was given in an early paper [37]. Hillier argued that nonlocal property of the street network is essential for cities. The “line graph” internalizes them into its structure of the graph and in doing so allows the graph analysis to pick up the extrinsic properties of spaces that are critical to the movement dynamics through which a city evolves its essential structures. The notion of interface and intelligibility were calculated by the correlation between local and global integration values [38]. Empirical evidence of the relationship between multi-scale spatial accessibilities and movement economies, as dependent on spatial configuration, is well charted in the space syntax literature [39]. However, none of the above measurements can represent these qualities.
Different combinations of multi-scale centrality measures have been tested in different case studies. To make things simpler, this study took the combination which has been tested by Vaughan’s work for the suburban town centers of Greater London, namely local closeness centrality (integration) and global betweenness centrality (choice) [40]. Following Hillier’s argument about spatial sustainability in 2009 [30], this paper suggests that the relationship between the local and global structure of street networks, and their ability to contribute to environmental, economic, and social sustainability, should be the focus of an intensified research effort. It proposes the concept of “spatial signature”, that there is correspondence between accessibility (integration) and path overlap (choice) at different ranges of radius in the 26 cases selected to exemplify the ”typical” older London suburb. It is this correspondence that enlivened these centers with activities occurring at overlapping scales and the outcome of journeys of different lengths that have evidently managed to adjust to the considerable changes that the UK economy and society have undergone over the past 150 years. So, it is a promising measurement which can provide clues on the long-term vitality of a certain urban quarter.
is the mean of all choice values, is the individual value of choice, is the mean of all integration values, and is the individual value of integration.
As this measurement is based on a fixed boundary (the study area), it could be a bold but effective index for decision-makers to understand the level of spatial sustainability of their project. The higher the value, the better this study area can gain a good spatial structure, which can not only create a good interface for local people and visitors but also be a legible area encourage visitors who do not familiar with this urban quarter to explore and use the urban amenities, therefore benefitting both social and economic sustainability.
1.4. Lack of Permeability in China’s Contemporary Urban Developments
The street network structure, which the space syntax group focuses on, is the essential quality discussed in urban design theories but referred to by different terminologies, such as “permeable block structure”, “fine grained street”, and “compactness”. We would like to present a puzzling phenomenon concerning China’s recent urban developments. On the one hand, sustainability is a widely accepted global issue, and Jacobs’ small/short blocks principle is well recognized by urban designers; on the other hand, some newly built urban areas still have apparent deficiencies in compactness and walkability.
A study aiming at profiling ghost cities of China analyzes the nationwide road junctions, points of interest, and location-based service records from 2014 to 2015 to measure the morphological, functional, and social vitality of each residential project [41]. It uses road junction density as one of the three indicators for evaluating vitality. The lack of permeability in the new developments in China is so obvious that an annual report on road network density and traffic operation in major Chinese cities was commissioned by Ministry of Housing and Urban-rural Development of the PR China in 2020/2021 [42] to promote the “narrow street, dense network” principle which was stated in a national guideline [43].
1.5. Assessing the Chinese Projects with the Improved Permeability Measurements
Many of the new urban developments in China were designed with good intentions and adopted the prevalent urban design principles, but their promises were not always fulfilled. Is the physical form of urban area responsible for this failure? Or is this lack of vitality totally owing to economic or administration or design quality factors?
The speculation made by this paper is that the physical form of urban areas does play an important role. We will show that the permeable principle is not so easy to implement in the urban construction process even if the blueprint looks like a compact design. As we explained, the inconsistency of measurement and the shortcomings of popularly used permeability measures reinforce the problematic situation.
In the following sections, we will first reveal the weaknesses of the “area-based” permeability measures with a series of tests on abstract cases. Eleven measurements were selected to perform a thorough comparison, including the two new variables proposed by the authors as effective measurements with great potential. After determining the features of these measurements through these tests, we then applied them to four real urban cases. All of them are high-profile projects. Through this application of real cases, the virtue of the two new measurements is explained. And these new valid tools are proposed by the authors for an explicit study of urban form and sustainability.
2. Materials and Methods
2.1. Four Sets of Abstract Forms
The two sets of measures for permeability, the area-based and location-based measures, were tested in both abstract forms and real cases. As the real permeability for the abstract forms is easy to determine via visual inspection, these models can help us to evaluate the reliability of these measures. The abstract forms below are designed to echo the real cases’ scenarios.
2.1.1. Putting a Compact Orthogonal Grid into Different Contexts
The first set of abstract forms is inspired by the criticism of the new urbanist “enclaves” [8]. Besides the demographics of inhabitants, their urban forms are even more “enclave”-like; in order to appear idyllic, this type of project is usually located in suburbs, and the road density of suburbs is usually quite low. If we only focus on the projects themselves (the darker gray blocks), they appear graphically compact. But if the surrounding areas are shown along with the projects, the situation appears completely different.
In Figure 3, a 1 km × 1 km core area composed of a homogeneous grid is inserted into four different settings. The dashed square is 2 km × 2 km. The inner block is 800 m × 800 m, connected by streets in 50 m width. From abstract form a to d, their surrounding settings become less compact. It is clear that the permeability for the inner parts and the whole will be different because of the different settings.
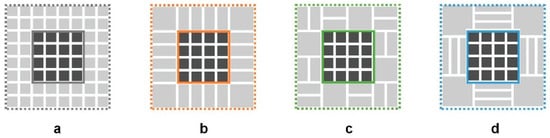
Figure 3.
Four homogeneous grids surrounded by four different contexts (a–d).
2.1.2. A Homogeneous Super-Grid with a Different Number of Bridges
The second set of abstract forms is also inspired by multiple real-world projects. When examining the accessibility of the walking network, we discovered that rivers caused severe impairment to walkability. Many locations that should have bridges are not connected. In Figure 4, urban blocks with the size of 175 m * 175 m are arrayed within a superblock. The peripheral arterial road is 50 m wide, and all other streets are 25 m wide. Across the middle of the block, an L-shaped river divides the super-block into 2 parts. Consecutively, case a/b/c/d is designed with the following scenarios: a. The river completely severs connection between the two parts; b. There is one bridge on the river; c. There are two bridges on the river; d. There are four bridges on the river. It is important to stress that, graphically speaking, these forms look identical to each other except for the bridges, but empirical knowledge tells us that their walkability would increase consecutively.
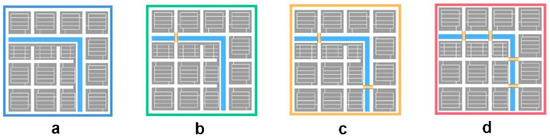
Figure 4.
Four homogeneous super-grids with different number of bridges inside them. a has no bridge. b contains one bridge. c contains two bridges. d contains four bridges.
2.1.3. Placement of Large Blocks
The design of the third set of abstract forms addresses the principle from urban design theory that, in order to achieve highly efficient urban forms and improve the vitality of the central area, large blocks should be arranged in the peripheral area. The “a” and “c” abstract forms in Figure 5 are taken from Dovey’s paper [11]. In abstract form “a”, the large block of the center region is 300 m * 300 m, and the small block of the edge region is 170 m * 170 m. In abstract form “c”, the large block of the center region is 200 m * 200 m, and the small block of the edge region is 80 m * 80 m. By rearranging the large blocks from edge to center, we have two contract forms “b” and “d” to be tested.
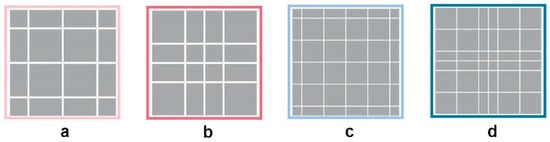
Figure 5.
Two scenarios of swapping the large blocks from center to edge. a and b is a pair, c and d is another pair. The composition of blocks of each pair are the same but the locations of the blocks are rearranged.
2.1.4. Placement of 25 Pieces of Blocks
To test the quality of legibility, we designed a group of three cases in the form of jigsaw puzzles. The puzzle pieces in these three cases are identical, 25 pieces in total (Figure 6). All of them constituted a superblock 940 m by 940 m. The smallest block is a 100 m * 100 m square, the medium piece is a 100 m * 220 m rectangle, the largest piece is an L-shaped 220 m * 220 m block, and the street width is 20 m. The three scenarios are different in terms of the continuity of streets. Type “a” has no straight line across the whole superblock. Type “b” has one vertical line across the whole superblock. Type “c” has four long streets across the whole superblock. Accordingly, their permeability increases one by one.
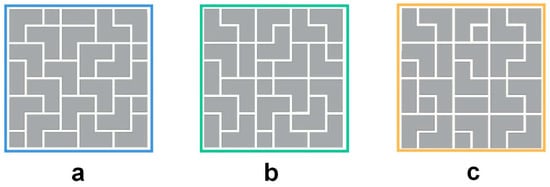
Figure 6.
Three types of composition for 25 pieces of blocks.
2.2. Four Real Case Studies
Four cases designed by renowned designers in two large cities in China, Shanghai and Hangzhou, were selected as the four real case studies (Figure 7). Three considerations led to the choice of these cases. First, all of them are high-profile projects, and projects 1/2 in Table 2 are commonly considered new developments that do not achieve the inceptive vision.
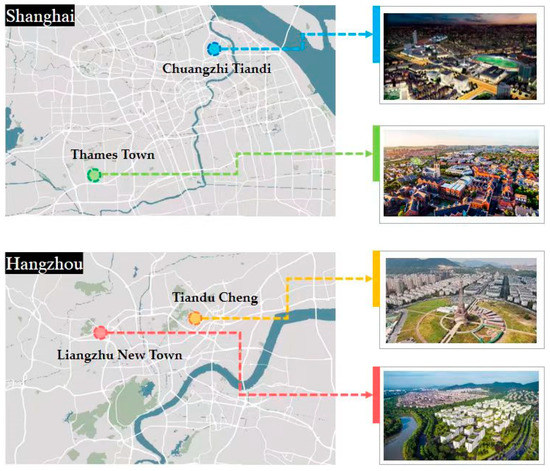
Figure 7.
Location maps and photographs of the towns.
Table 2.
Basic information of four cases.
We aimed to examine whether the urban form quality plays a key role in their failure. Second, all of the areas are located in Yangtze Delta region, which the authors are familiar with. This familiarity could help the authors to not neglect other key issues accounting for the failure of these new developments. Thirdly, the original masterplans of these cases are available online, and as a result we can compare the current urban form and that of the drawing to solve the puzzle of why good urban design principles cannot be implemented in construction.
Despite the difference in scale, all of them are urban developments in the suburbs of an emerging Chinese metropolis starting from the 2000s (Table 2). And they are the prototypes of the above abstract forms.
The first and second cases are both controversial Western-style replica towns initiated in the 2000s and are both regarded as ghost cities [44]. The first one is Tianducheng in Hangzhou. The developer planned to construct a new French-style city for around 10,000 inhabitants, and this town was envisioned as the ”greatest satellite city” in China with a sufficient provision of amenities [45]. However, due to a variety of factors, this ”plan to make a new city” failed; the population in Tianducheng in 2015 was estimated to be only around 2000. The developer was only able to complete half of the originally planned project due to the discontinuation of funding. The lack of services has also lowered the quality of life for residents there.
The second case is the ”English”-style “Thames Town” in the new town of Songjiang. It is part of the ”One City and Nine Towns” initiative in Shanghai and was also reported as a ghost city as of summer 2016. Thames Town has attracted substantial investment as well as the attention of property buyers but has failed to persuade many people to live there [46]. The current state of this town has improved to “tranquility” because it gradually gained a reputation for wedding photography for newlyweds [47]. The difference between the Thames Town and the first case is that it is designed by Atkins Consultants, a well-known design group. Unlike the large-block form in the first case, the masterplan of this town has utilized the compactness principle. Hence, the question we need to answer is: does the physical form play a role in the failure of these new towns? If the design itself is acceptable, then did the mistake happen during implementation?
The third case is also a new suburban town in Hangzhou, Liangzhu New Town. The masterplan proposed by a Canadian design studio CIVITAS envisioned a series of walkable villages linked by a major parkway boulevard in 2000. This project is regarded as the first multifunctional outskirt town constructed in China with an archeological museum, a hotel, commercial quarters, parks, hospitals, schools, and other amenities integrated into the masterplan [48]. A recent conference reviewed the 20 years of intensive development of this new town and concluded that this 8 sq.km development is now one of the six outskirts of Hangzhou, which realized the initial “garden city” concept [49]. However, another travel mode study of the Hangzhou Metropolitan Area showed that, although Liangzhu can be regarded as a third-order center that also influences traffic, the proportion of trips by bicycle and on foot was quite low compared to the places close to the center of Hangzhou [50].
The last case is the Knowledge and Innovation Community (KIC) in Shanghai originally designed by SOM starting from 2003. It is a project commissioned by Shiu On Properties Limited to catalyze the transformation of Shanghai’s Yang Pu district from a dilapidated industrial zone to a thriving, knowledge-based economy. Known also as “Chuangzhi Tiandi” by local people, KIC was conceived to be a multi-functional community where people can live, study, work, and relax. It led to apparent success, and the masterplan won gold in the Best Mixed-Use Development category at the 2016 MIPIM Asia Awards. However, the design goal—weaving “together the isolated campuses with a walkable, connected community”—was not fully realized. We will discuss this issue in detail later in Section 4.
2.3. Eleven Measurements to Be Tested in Four Sets of Abstract Forms
We determined the inconsistency of permeability measurement and ascertained the four quadrants of measurement. The value could be calculated by blocks or street networks, and both can be measured in a certain location or within an appointed boundary.
Table 3 lists the eleven measurements tested by both the abstract forms and the real cases. The first three measurements are based on block calculation. “Block perimeter” and “block size” are the mainstream measurements for permeability. Area-weighted average perimeter (AwaP) is a new measure proposed by Pafka and Dovey [11].
Table 3.
Eleven metrics to be compared.
Item numbers 4–11 are all based on street network calculation. Items No. 4–6 are area-based measures. “Street density” and “intersection density” are both common in walkability research [51]. T ratio and X ratio proposed by Marshall are also listed here as they provide a finer description of the effect of different intersection types [21]. T ratio is defined as the ratio of T-junctions to the total number of junctions and the X ratio as the ratio of X-junctions to the total number of junctions. We took the X ratio value in the comparison.
Items number 7–8 are the location sensitive matric. No. 7, local radius integration is the only syntactic measurement approximate block-size measures to Pafka etc. [12]. In this study, in order to fit the scale of abstract forms, the local and global radii were defined as 500 m and 1200 m, respectively. Item number 9 is a common matrix which can be calculated in GIS by network analysis. Item number 10 is its counterpart, the improved syntactic measure, which incorporates directional changes when calculating the total length of street segments. In this study, a threshold angle of 20° was used to verify whether there is a directional change. The last measure proposed in this paper is the correlation between a local integration and a global choice, which is related to the theoretical thinking on interface and intelligibility [38]. We chose the integration R500m as the local measure and choice R1200m as the global measure. A distance of 1200 m is a small radius compared to typical space syntax research. The first reason is to relieve the effort for making the calculation. The second reason is that for studies focusing on walkability, a buffer of 1200 m (approximately 15 min walking distance) is an acceptable radius. So, this R2-INTR 500-CHO1200 (correlation between integration R500 and choice R1200) was the last measure tested.
These eleven measurements were tested in four sets of abstract forms, as outlined in Section 3. Measurements of Items No. 2–11 measurements were used to assess four real cases, as described in Section 4. Items No. 2/4/5 are common measures used by current urban practice, and item No. 3 is proposed by Pafka and Dovey. Items No. 7/8 are standard space syntax measures. Items No. 10/11 are the measurements the authors proposed. And item No. 9 is a regular GIS measure to contrast with measure No. 10 and demonstrate its virtue. The syntactic values were calculated by depthmap software and UrConnect toolkit, and the remaining values are calculated on a GIS platform.
3. Eleven Measurements Tested in Four Sets of Abstract Forms
Inspired by the real problematic urban forms, we designed four sets of abstract forms to test the eleven measurements of permeability. These results will be displayed in the following graphs. Different colors are used as indicators for different cases. The vertical axes of the graphs are all normalized from the highest permeability to the lowest. As for the first three measures (block perimeter, block size, and AwaP), a low score indicates high permeability, and high scores indicate low permeability, and we used their reciprocal value to make the chart. Because the permeability of these abstract forms can be ascertained by simple visual inspection and common sense, it is easy to determine which measurement is accurate and which variable is misleading. It should be noted that all values are defined as the mean value for the study area.
3.1. Putting a Compact Orthogonal Grid into Different Contexts
Although the form within the solid-line square is identical, its actual permeability declines as the context changes. The correct value for four cases should be gray > orange > green > blue.
As shown in Figure 8, the solid lines represent the measurements of the study areas themselves. The location-based measures can reveal this tendency, but the first four area-based measures cannot. Therefore, we calculated the value for the area within the dashed lines, which means including the surrounding buffer areas. Then, the difference of the forms then can be picked up by the dashed lines in the chart to reveal the impact of urban context on an enclave.
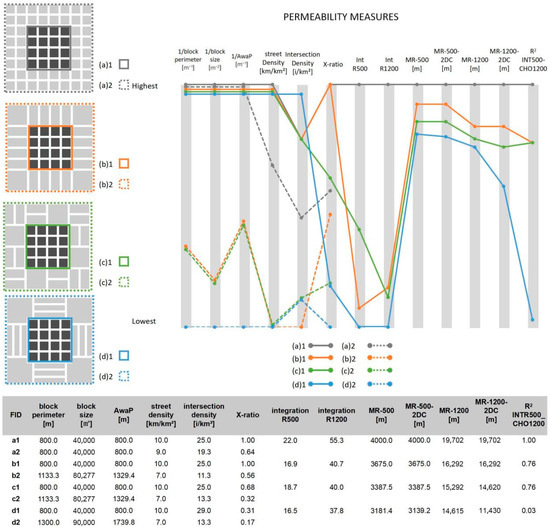
Figure 8.
Permeability measures comparison for abstract form set one.
The above change of value by enlarging the study area can be explained by the MAUP problem [51]. Nevertheless, these experiments have pointed out a severe problem. A design drawing without the surrounding urban fabric will mislead people into believing that the new urban area is compact. The residents would only realize how difficult it is to travel around after moving in. And this is why many good designs failed. We will provide further explanation for this opinion in Section 4. Lastly, the value of intersection density is completely off in its representation of form d. The X ratio complements this value; when the total area and total street length remain the same, the lower the X junction ratio, the lower permeability value.
For the location-based measures 7–10, as the condition of buffer is embedded in the formula, we can focus on the value for the core areas. Except for integration R500, the measures give a consistent sequence of the evaluation, which reflects the common sense for permeability. Measurements MR and MR-2DC do not show a large difference in this set of forms. The value of R2-INT500-CHO1200 is very persuasive; it is the only measurement that rates the “d” form as least permeable. As the street in the core does not grow continuously into the buffer area, plan “d” achieves a 0.03 correlation for local integration and global choice. This means that the spatial cores (the lines in red and orange) for the local accessibility and the popular paths for long distance travel are separated from each other as shown in Figure 9.
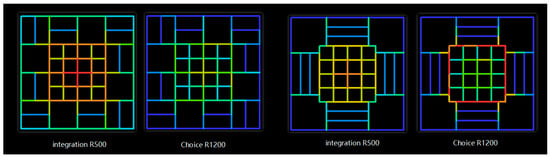
Figure 9.
Integration R500m and choice R1200m for c/d plans.
3.2. The Effect of Omitting Key Connections
Common sense tells us that the correct rating sequence for four plans in set two abstract forms should be a < b < c < d. Since the block structure of the four cases is the same, we are only comparing measurement items 4–11 that are based on the linear network (Figure 10).
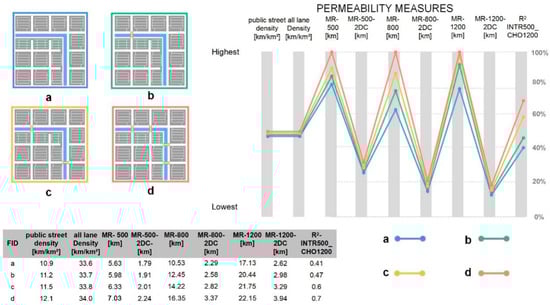
Figure 10.
Permeability measurements comparison for abstract form set two.
All these measurements are from calculations of the “all lane model”, i.e., they include the internal lanes within the blocks. From Figure 10, we can see that both values MR and MR-2DC can reflect the differences among the four maps accurately. However, the value of MR-2DC is much lower than the value of metric reach. In fact, for visitors of a neighborhood, some of the deeply hidden alleys are hard to find even when they are accessible within walking distance. According to this logic, the measurement MD-2DT that incorporates cognitive elements can better reflect the accessibility of streets that possess certain specific geometric characteristics.
The calculation results of R2 are also as expected, increasing consecutively. In the meantime, the visualization of measurements “integration R500m” and choice R1200m” can tell us more about the spatial structural information (Figure 11 and Figure 12). The higher the value, the warmer the color. In plan “a”, the pass-through travels are mostly distributed among the peripheral arterial roads, separated from the localized circulation within the block, while in case d, the cores of the two coincide, with traffic of different scales converging in the same streets, which is beneficial to both vitality development and social interaction.

Figure 11.
Visualization for integration R500m.
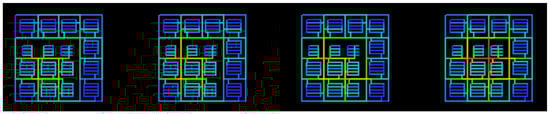
Figure 12.
Visualization for choice R1200m.
3.3. Placing the Large Block in the Center or the Edge
Common sense tells us that the correct rating sequence for four plans in set two abstract forms should be a < b < c < d. As the area-based measures do not reflect the placement of different blocks within the study area, items 1–6 can only determine the difference between a and c but not the subtle difference between a and b, and c and d (Figure 13). The urban design law “place smaller blocks in the center to improve vitality” cannot be quantified by area-based simple measures. On the other hand, the location-based measure integration R500 and metric reach R500 both can outline the difference for these four plans. In Section 4.3 below, we outline permeability problems resulting from centrally placed large blocks which echo this experiment.
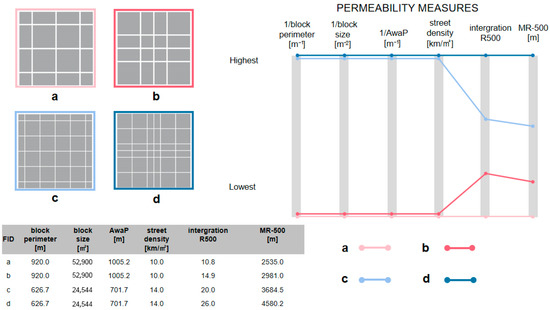
Figure 13.
Permeability measures compared for experiment 3.
3.4. Testing the Notion of Intelligibility
In the second set of abstract forms, we realized the problem of legibility. The measurement R2-INTR500-CHO1200 is very effective in representing this quality. To further examine this quality, the fourth set of plans were designed to test the notion of intelligibility. In Figure 14, we colored the axial maps for the three plans by line length. It is clear that the first plan is zigzagged and impermeable, while the last plan is well connected from inside to outside. So, the correct rating sequence for three plans should be a < b < c.
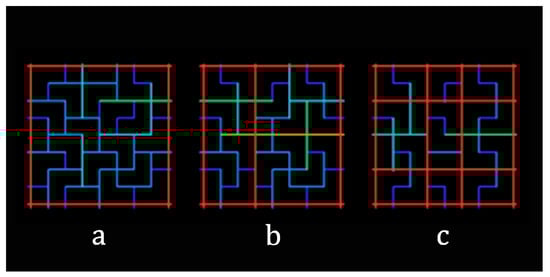
Figure 14.
Axial maps colored by line length.
Since the basic blocks for the three plans are identical, their area-based measures are the same (Figure 15). The intersection density shows a small difference, while the X Ratio can better reflect the variations in the three plans. The performance of the location-based measurements is not consistent.
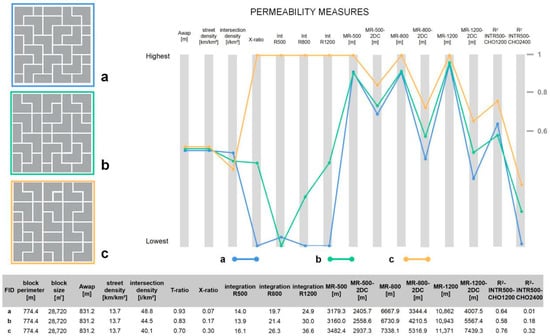
Figure 15.
Permeability measures compared for experiment 3.
The Radius 500 m integration cannot determine that plan C is better than plan B, but when the radius is enlarged to 800 m and 1200 m, the rating sequence becomes correct. When we compare metric reach and metric reach in two directional changes, we can see that the latter recognizes the superiority of plan C much better. Here we borrow concepts from the subject of water supply and drainage. When calculating the flow velocity, the “resistance coefficient” is determined by the diameter and shape of the pipe elbows [52]. In the definition of AwaP, only the distance is considered, not the turning resistance. Therefore, its description of the capacity for flows to permeate an urban fabric is deficient.
The R2 measurement examined in this study can reveal the differences between the three plans, but it is not consistent. The combination of integration 500 m and choice 2400 m matches more closely with visual judgement.
3.5. Short Summary of Findings
As explained in Section 1.2, the area-based measures cannot verify the different qualities for almost four sets of abstract forms. Even the improved measure AwaP cannot determine the difference when the placement of blocks within a certain boundary changed. Although Dovey and Pafka [11] claimed ”area-weighted average perimeter” is the most accurate measure for permeability, it is clear that it has vulnerabilities. Just as Peponis has suggested, the approach represented by Martin and March is good at quantifying and classifying places but is not able to quantify the differences between places with similar content but variation in terms of ”location” [53].
This test on the four sets of abstract forms also demonstrated that the two new measurements, item No. 10 and 11, display obvious advantages. As the upgraded version of metric reach, MR-2DC contains cognitive elements, just like integration. Its value has units and is easier for people to understand and therefore could be an effective measure for permeability. The second new measurement “R2 values of local integration and global choice” is between 0 and 1 and is capable of evaluating the intelligibility of the plans. Moreover, the visual representation of these two values can help us better understand the specific characteristics of the spatial layouts and provide new perspectives on how the pedestrian street network and the locations of the service facilities can be improved. We tested their validity in four real cases, as demonstrated in the following sections.
4. Four Real Urban Cases and Three Types of Traps
After establishing the meaning of the eleven variables through four sets of abstract forms, their effectiveness was assessed by four real-world cases. As described in Section 2.2, the four cases are all newly built-up areas starting from the 2000s. Many of them are facing the problem of urban vitality deficiency, just like their counterparts in European countries [54]. By analyzing their original design and current urban form, the following questions will be answered: does the lack of vitality problem have anything to do with the permeability issue? If the answer is yes, at which stage of implementation does the impermeability problem occur?
We first examined the cases using a simple block size analysis. This analysis was conducted not only for the project itself but also for its surrounding areas. Then, we found the first trap “the effect of cut-off context”. By comparing the original masterplan and the current map, we found many alterations. After generalizing similar alterations of the original drawings, we obtained the second and third traps explained in Section 4.2 and Section 4.3. The impermeability problem occurs in all four cases, not only the ghost towns. The last section will compare the four cases numerically and review the two new measurements proposed by the authors.
4.1. The Effect of Cut-Off Context
Although permeability is a property that is largely readable on a map, the masterplan of the developing area itself could be deceptive. As construction of new towns always takes place in suburban areas, the cut-off context always contains serious blockages in the network. As shown in Figure 16, we colored the blocks in both the core development area and its surrounding area by the value of block size. There is a huge contrast between the value of the core area and its surroundings. Take the AwaP value as example; the values of surrounding areas are all at least twice as much as the core area. There are many dark blue blocks in the contexts that function as significant barriers to movement. However, this feature is not shown in the masterplan that is cut off from its context.
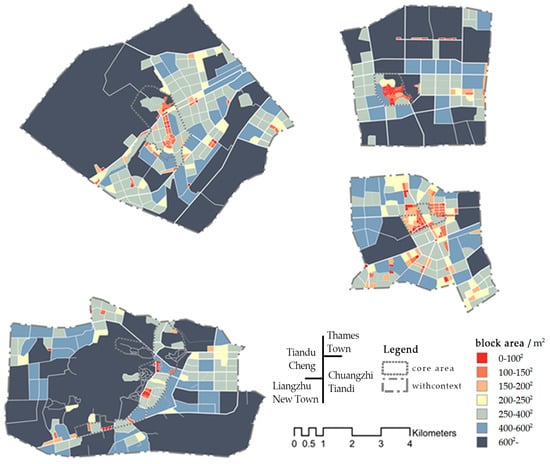
Figure 16.
Blocks colored by area.
4.2. The Missing Critical Links
By comparing the original masterplan with the current urban form, an astonishing result was found. In each case, there are critical links that have not been built, which is detrimental to local walkability. Most of them are foot bridges such as the one in Thames Town (Figure 17).
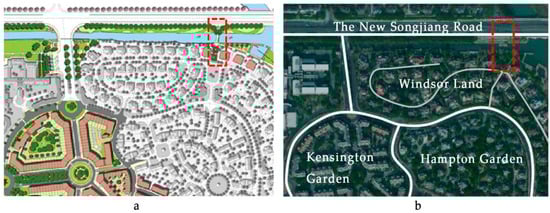
Figure 17.
A foot bridge in the Thames Town Master Plan and the scenario if the bridge had been built.
Even the applauded Liangzhu New Town has this problem (Figure 18). The original main route along the eastern creek was cut into pieces, which made the original ringlike plan into a tree-structure. This “missing critical links” problem is probably due to the nature of private development construction. The new urban parts were built in sub-areas. The buildings which bring direct profit are the key concern of the developer, while the infrastructure, such as a pedestrian bridge in the edge of the sub-area plan, may be omitted unconsciously. Figure 18b,c shows the visualization of the 1200 m metric reach for the current situation and the one with added four footpaths. The accessibility of the latter increases significantly if the construction follows the original design.
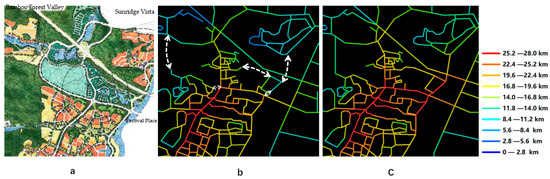
Figure 18.
Missing routes in Liangzhu New Town. a is a part of the original plan, b use white doted line to note the missing links. Both b&c are colored according to the value of radius 1200meter’s metric reach. The warmer the color, the high the value.
In Chuangzhi Tiandi, there are also critical missing routes, though with different causes (Figure 19). These missing routes are located in its surrounding area, which was built before the urban regeneration project. To add a route means relocation of certain buildings or demolition of some fences, which is difficult without requisite economic motivation.
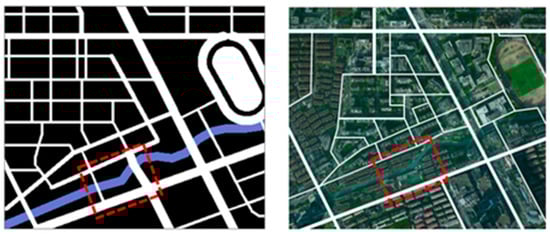
Figure 19.
A missing link in the south of Chuangzhi Tiandi (left: SOM [55]).
4.3. Gated Community and the Privatization of Public Streets
The third cause accounting for the impermeability problem is the privatization of public streets. Take Thames Town as an example; although it adopted the “meticulous English-style layout” [56], the foreign architects did not anticipate that the “gated community” management style of Chinese housing will harm the vitality of the project. In Figure 20, the additional fence wall of Kensington Garden is colored by yellow lines. It cuts off the most important street in the new town (red line in the left figure) and therefore undermine the liveliness of the whole neighborhood.
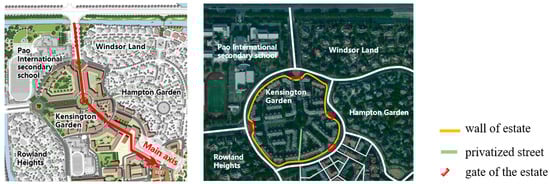
Figure 20.
Kensington Garden and the privatized street.
A similar problem was also observed in Chuangzhi Tiandi. There is an expensive residential compound “Han-mo Xiang-lin” at the heart of the development (Figure 21). To maintain the relative quietness of this housing estate, its northern and western gates are always closed except for fire emergency, which turns the small blocks on the masterplan into large blocks.
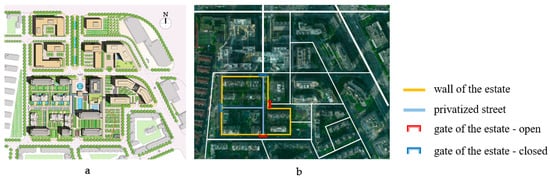
Figure 21.
The fence and gates of Han-mo Xiang-lin in Chuangzhi Tiandi. a is the second phase plan by Tianhua Architects. It was conceived as an open community, while its two gates are closed in the reality [57]. b is a drawing made by the authors.
4.4. Numerical Comparison of the Four Cases
In the above sections, we proposed three situations in which the permeability characteristic might be impacted in the implementation process of the project. We tested the proposed two new measurements for permeability here in these four cases, namely the MR-2DC and the R2 of local integration and global choice.
As the MR-2DC is an upgrade of metric reach, we listed both of them by box plot in Figure 22. Chuangzhi Tiandi as the “good” case performs much better than the other three cases in terms of spatial connection. And the MR-2DC measure is much more accurate than the metric reach measure. The box plots show that the Thames Town and the Liangzhu New Town have severe accessibility problems. The mean total lengths of reachable streets within a 1200 m’s catchment and two directional changes are less than one third of the Chuangzhi Tiandi.
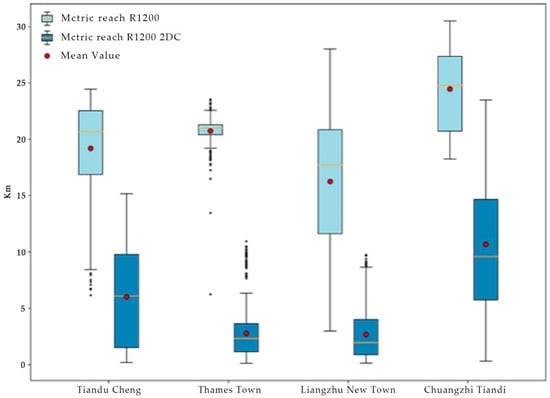
Figure 22.
The box plots MR and MR-2DC.
As the four cases are much larger than the abstract form, we tested three combinations of R2 of local integration and global choice as shown in Table 4. The results are consistent with the impression of the field survey. The spatial structure of Chuangzhi Tiandi and Liangzhu New Town is legible. But Thames Town and Tiandu Cheng may have intelligibility problems.
Table 4.
Measurements for four cases.
In Table 4, we can also find that some widely accepted measures for permeability do not explain the situation for Thames Town. It has a high street density, a significant value of intersection density, and an AwaP value larger than Chuangzhi Tiandi. However, its real performance is disappointing. The interface concept provides a reason for its failure. As the local and global movements in this town are separated because of its unique spatial structure (Figure 23), it is much more difficult for the community services to survive, which in turn discourages new residents from moving into this new town and then degrades the urban vitality.
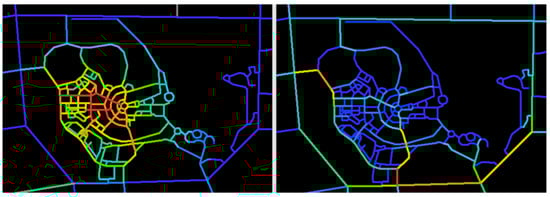
Figure 23.
Integration R500m and choice R3600m of Thames Town.
5. Conclusions and Discussion
5.1. Permeability and Its Measurements
This paper proposes that the street network is the underestimated element when discussing the contribution of urban form to sustainability. In this study, different measurements of permeability were reviewed, and their categorization into four quadrants is proposed. These measurements were compared with four sets of abstract forms and applied to four real case studies.
It was found that there is an inconsistency for permeability measures. A set of forms show a different sequence of rating with different measurements. Area-based measures produce misleading results for both abstract forms and real cases. Although AwaP can deal with the “averaged out” problem of serious blockages, it is still invalid on many occasions. Location-based measures are more reliable than area-based ones, although some are not stable with different radius choices.
The two measures proposed by this paper, namely “metric reach in two directional changes” (MR-2DC) and “correlation between local integration and global choice” (R2-INTR-CHO), both perform well with the abstract forms. MR-2DC can be regarded as an updated measure for angular integration for two reasons. First, as a measure calculated by a space syntax model, it includes people’s perception of directional changes. Secondly, it is much easier for designers to comprehend, as it is a measurement with a base unit (meters). The case studies suggested that it is the most effective measure and always aligns with the common-sense sequence for the abstract forms.
The R2-INTR-CHO is a measure that emphasizes the structural quality of the street network. As shown by the abstract form experiences, it can reveal the attributes of certain forms which are impossible to uncover by any other measures based on block calculation. As an area-based index calculated upon two location-based variables, it could be a useful indicator for decision-makers. Moreover, visualization for local integration and global choice measures is enlightening for designers. The location of the local syntactic core and the global one, whether identical, overlapping, or separate, could give clues for creating social and economic sustainability. It also helps to correctly sort functions. Further research is needed to explore this indicator.
5.2. Hypothesis on the Deficiency of Vitality in Chinese New Towns
Leading by the concept of spatial sustainability, this study suggests that besides density and function, the quality of the street network itself is influential not only in walkability but also urban vitality. Four newly built urban areas in Southeast China were analyzed, among which Tiandu Cheng and Thames Town were regarded as ghost towns in literature, and they have obvious permeability problems judged from many variables tested in this study.
As renowned urban designers designed the masterplans of three cases, the original design should be correct regarding spatial compactness. Considering this doubt, we compared the original masterplan with the current corresponding built urban form. Then, we found that a good design may fail in the delivery process owing to the three traps shown in Figure 24.
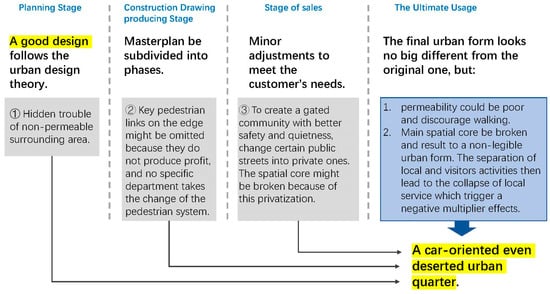
Figure 24.
Three traps accounting for the failed delivery of a good design.
First, if a new project is located in a city’s suburban area, the existing urban fabric around it will most likely be sparse. Therefore, although the design advocates the compact form principle, it has no right or intention to change its surrounding area. Moreover, the masterplan is deceitful as it cuts the surrounding area from the map. So, we obtain trap No. 1, “hidden trouble of non-permeable surrounding area”, in the planning stage.
During the construction drawing stage, the overall masterplan is subdivided into sub-areas for facilitating construction organization. As rivers, hills, and expressways are natural boundaries, the footbridges located on the edge of these subdivisions are highly likely to be omitted. As these infrastructures do not produce profit and no specific department is responsible for the pedestrian system, a key pedestrian bridge might be left out with no one protesting the omission. Liangzhu New Town provides a typical example of this trap. Although the combined effects of high density and mixed functions made it a good case for new town development, it could be more successful, as shown in Figure 18 and Figure 22. It exhibits the lowest mean value of MR-2DC among four cases. The consequence of a missing key connection for pedestrians will only be recognized after the residents move into this new neighborhood.
The last trap often occurs in the sales stage. The market department may ask for some “minor” adjustments to change certain public streets into private ones, creating a quiet, safe, and gated community. This change might break the main axis of the original design as shown in Figure 20. Sadly, the developer is unaware of this change’s destructive effect on the urban quarter’s overall living conditions. As the figure of the new plan looks just like the old one, and the residential market is the key to ensuring the economic success of the whole project, this privatization of main public access is likely to occur.
Because of these three traps, adverse outcomes gradually emerged decades after certain developments were completed and occupied. We achieved a car-oriented, even deserted urban quarter, not the originally promised pedestrian-friendly vibrant community. Yes, the final urban form looks similar to the original one. However, this urban part’s permeability could be better, discouraging walking behavior. The main spatial core was privatized, and the spatial structure was changed. This unrecognizable urban form resulted in the separation of the locals’ and visitors’ activities. Then, it led to the collapse of local services, triggering negative “feedback and multiplier effects” [27]—fewer movements, less service, and consequently, less urban vitality.
5.3. Contribution of This Paper and Discussion
The methodological contribution of this paper illustrates the shortcomings of the “block and area”-based permeability measures. Two “street and location”-based measures are proposed and were tested, and their potential was proven in the study. Further studies are required to test the radius effect on the stableness of the MR-2DC and R2-INTR-CHO measures.
Besides the proposal of better variables to describe permeability, this paper also summarizes three types of traps that may occur in the new town development implementation process. A hypothesis on the deficiency of vitality in Chinese new towns is also provided. The “urbanism by number” idea [9] cannot be overstated. Without a quantitative and consistent description of urban form, the qualitative urban design principles may fail in the implementation process. The design intention could be out of control and eventually produce an urban form that does not encourage walking.
5.4. Why Spatial Structure Is the Key Element for the Sustainable Urban Form
Lastly, we explain why spatial structure is the key element for the sustainable urban form. The diagram (Figure 25) is adopted from Netto’s conceptual framework for the convergence/dissonance in urban systems as cities grow and change over time [58]. Many recent studies have been carried out to test this idea. The interdependence of street-network accessibility, density, land-use mixture, and movement in the urban transformation process is described in these cases. Sayed and Turner [59] indicated two processes governing city growth: a generative process that contributes to structural differentiation and a process of self-organization that is seen to resemble reaction–diffusion systems well known in chemistry and biology. Empirical studies of the morphogenesis process in newly built-up areas in both European countries and China shows that street accessibility is the most fundamental element attribute for urban vitality, and the building density and functional mixture seems to follow the street accessibility, therefore creating a convergence over time [54,60,61].
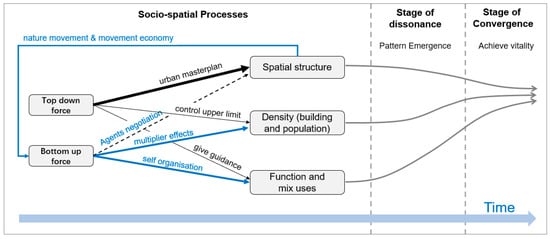
Figure 25.
The convergency of three elements of urban form.
The space syntax community focus on the configurational properties of the street network, for it is the most durable urban element compared to block, plot, and building forms. The ”multiplier effects” of the street network will create an alignment among the spatial structure, density, and function [58]. The authors emphasize another fact. The spatial network is the main urban element where local governments have influence. In the complex urban transformation processes, the developers, architects, builders, planners, and politicians are all responsible for the city-building processes [62]. Take an urban renewal project as an example. Although the planning bureau can control the upper limit of the density and give suggestions for functions and activities in a particular urban quarter, it is the numerous agents who will shape it in the long run. While the local government provides the infrastructure of a particular urban district, the street network is the only definite physical urban element that will be implemented without alteration.
Many studies worldwide discuss how to prioritize pedestrian mobility to achieve sustainability [63,64], while most discuss the complex walkability index but not spatial permeability. If the density and function follow the spatial structure in the long run, the local governments should concentrate on ensuring the quality of the invisible spatial structure. Then, the agents will follow to foster a lively and sustained urban quarter.
Therefore, a better measure and visualization for urban permeability can help the designers and decision-makers to see measures not as numbers but as important qualities of urban form. If a case library can be established with precise and commonly agreed measures, we can accumulate more empirical cases on space sustainability and obtain more knowledge. Besides “function, density, and building typology”, the importance of spatial structure networks for sustainability can be verified by solid evidence.
Thus, we can make better scientific design decisions and advance urban sustainability. Bear in mind that spatial form is the physical urban element that the government has the most influence on and also an element that has a long-term effect on density and functionality in the process of self-organization.
Author Contributions
Conceptualization, methodology, X.D. and Q.D.; formal analysis, J.J.; software, H.W.; visualization, J.J. and X.F.; funding acquisition, Q.D.; writing—original draft preparation, X.D. and Q.D.; writing—review and editing, X.D. All authors have read and agreed to the published version of the manuscript.
Funding
This research was funded by the National Natural Science Foundation of China (No. 51878612).
Data Availability Statement
The data presented in this study are available on request from the corresponding author.
Acknowledgments
Jia Li provided valuable support in data collection and analysis. Hua Jia helped in English proofreading.
Conflicts of Interest
The authors declare no conflict of interest.
References
- Resolution Adopted by the General Assembly on 25 September 2015. Available online: https://www.un.org/ga/search/view_doc.asp?symbol=A/RES/70/1&Lang=E (accessed on 14 February 2022).
- Van Nes, A. Centrality and economic development in the rijnland region: Social and spatial concepts of centrality: Social and spatial concepts of centrality. In Proceedings of the 6th International Space Syntax Symposium, İstanbul, Turkey, 12–15 June 2007. [Google Scholar]
- Matthew, C. Sustainable urban design: Principles to practice. Int. J. Sustain. Dev. 2009, 12, 48–77. [Google Scholar]
- Makido, Y.; Dhakal, S.; Yamagata, Y. Relationship between urban form and CO2 emissions: Evidence from fifty Japanese cities. Urban Clim. 2012, 2, 55–67. [Google Scholar] [CrossRef]
- Jacobs, J. The Death and Life of Great American Cities; Random House: New York, NY, USA, 1961. [Google Scholar]
- Lynch, K. Good City Form; MIT: Cambridge, MA, USA, 1984. [Google Scholar]
- Boeing, G.; Higgs, C.; Liu, S.; Giles-Corti, B.; Sallis, J.F.; Cerin, E.; Lowe, M.; Adlakha, D.; Hinckson, E.; Moudon, A.V.; et al. Using open data and open-source software to develop spatial indicators of urban design and transport features for achieving healthy and sustainable cities. Lancet Glob. Health 2022, 10, E907–E918. [Google Scholar] [CrossRef]
- Neuman, M. The Compact City Fallacy. J. Plan. Educ. Res. 2005, 25, 11–26. [Google Scholar] [CrossRef]
- Anne, V.M. Urban morphology as an emerging interdisciplinary field. Urban Morphol. 1997, 1, 3–10. [Google Scholar]
- Dovey, K.; Pafka, E. What is walkability? The urban DMA. Urban Stud. 2019, 57, 93–108. [Google Scholar] [CrossRef]
- Pafka, E.; Dovey, K. Permeability and interface catchment: Measuring and mapping walkable access. J. Urban Int. Res. Placemaking Urban Sustain. 2017, 10, 150–162. [Google Scholar] [CrossRef]
- Pafka, E.; Dovey, K.; Aschwanden, G.D.P.A. Limits of space syntax for urban design: Axiality, scale and sinuosity. Environ. Plan. B Urban Anal. City Sci. 2018, 47, 508–522. [Google Scholar] [CrossRef]
- van Nes, A.; Yamu, C. Analysing Linear Spatial Relationships: The Measures of Connectivity, Integration, and Choice. In Introduction to Space Syntax in Urban Studies; Springer International Publishing: Cham, Switzerland, 2021; pp. 35–86. [Google Scholar]
- Pont, M.B. An Analytical Approach to Urban Form. In Teaching Urban Morphology; Oliveira, V., Ed.; Springer International Publishing: Cham, Switzerland, 2018; pp. 101–123. [Google Scholar]
- Moudon, V. Getting to know the built landscape: Typomorphology. In Ordering Space: Types in Architecture and Design; Franck, K., Schneekloth, L., Eds.; Van Nostrand Reinhold: New York, NY, USA, 1994; pp. 289–311. [Google Scholar]
- Palaiologou, G.; Larimian, T.; Vaughan, L. The use of morphological description in neighbourhood planning: Form-based assessment of physical character and design rules. J. Urban. Int. Res. Placemaking Urban Sustain. 2020, 14, 490–514. [Google Scholar] [CrossRef]
- March, L. Urban Space and Structures, 1st ed.; Martin, L., Ed.; Cambridge University Press: Cambridge, UK, 1975. [Google Scholar]
- Hillier, B.; Hanson, J. The Social Logic of Space; Cambridge University Press: Cambridge, UK, 1984. [Google Scholar]
- Pont, M.B.; Marcus, L. Innovations in measuring density: From area and location density to accessible and perceived density. In Proceedings of the IGU Conference 2013: Applied GIS and Spatial Modelling, Leeds, UK, 29 May–2 June 2013. [Google Scholar]
- Openshaw, S.; Taylor, P.J. A million or So Correlation Coefficients: Three Experiments on the Modifiable Areal Unit Problem. In Statistical Applications in the Spatial Sciences; Wrigley, N., Ed.; Pion: London, UK, 1979; pp. 127–144. [Google Scholar]
- Marshall, S. Streets and Patterns; Routledge: Abingdon, UK, 2004. [Google Scholar]
- Walk Score Methodology. Available online: https://www.walkscore.com/methodology.s.html (accessed on 14 February 2021).
- Berghauser Pont, M.; Haupt, P.A. Spacematrix: Space, Density, and Urban Form; CiNii Books: Rotterdam, The Netherlands, 2010. [Google Scholar]
- Berghauser Pont, M.; Stavroulaki, G.; Gil, J.; Marcus, L.; Serra, M.; Hausleitner, B.; Olsson, J.; Abshirini, E.; Dhanani, A. Quantitative comparison of cities: Distribution of street and building types based on density and centrality measures. In Proceedings of the 11th International Space Syntax Symposium, Lisbon, Portugal, 16 June 2017; pp. 44.18–44.41. [Google Scholar]
- Hillier, B.; Iida, S. Network and Psychological Effects in Urban Movement. In Proceedings of the Spatial Information Theory: International Conference, Ellicottville, NY, USA, 14–18 September 2005; Springer: Berlin/Heidelberg, Germany, 2005; pp. 475–490. [Google Scholar]
- Marcus, L. Ecological space and cognitive geometry—Linking humans to the environment in space syntax theory. In Proceedings of the 10th International Space Syntax Symposium, London, UK, 13–17 July 2015. [Google Scholar]
- Hillier, B. Space is the Machine: A Configurational Theory of Architecture; Cambridge University Press: Cambridge, UK, 2007. [Google Scholar]
- Turner, A. From Axial to Road-Centre Lines: A New Representation for Space Syntax and a New Model of Route Choice for Transport Network Analysis. Environ. Plan. B Plan. Des. 2007, 34, 539–555. [Google Scholar] [CrossRef]
- Ratti, C. Space syntax:some inconsistencies. Environ. Plan. B Plan. Des. 2004, 31, 487–499. [Google Scholar] [CrossRef]
- Hillier, B. Spatial sustainability in cities: Organic patterns and sustainable forms. In Proceedings of the 7th International Space Syntax Symposium, Stockholm, Sweden, 8–11 June 2009; pp. K01:01–K01:20. [Google Scholar]
- Serra, M.; Hillier, B. Angular and Metric Distance in Road Network Analysis: A nationwide correlation study. Comput. Environ. Urban Syst. 2019, 74, 194–207. [Google Scholar] [CrossRef]
- Hillier, B.; Vaughan, L. The city as one thing. Prog. Plan. 2007, 67, 205–230. [Google Scholar]
- Peponis, J.; Bafna, S.; Zhang, Z. The connectivity of streets: Reach and directional distance. Environ. Plan. B Plan. Des. 2008, 35, 881–901. [Google Scholar] [CrossRef]
- Feng, C.; Zhang, W. Algorithms for the parametric analysis of metric, directional, and intersection reach. Environ. Plan. B Urban Anal. City Sci. 2019, 46, 1422–1438. [Google Scholar] [CrossRef]
- Haofeng, W. UrConnect: UrbanConnectivity—A Toolkits for Quantifying Urban Morphometics based on Spatial Cognition. In Proceedings of the Computational Design Symposium and the Annual Conference of the Computational Design Academic Committee of the Architectural Society of China, Beijing, China, 11 December 2021. [Google Scholar]
- Figueiredo, L.M.; Amorim, L. Continuity lines in the axial system. In Proceedings of the 5th International Space Syntax Symposium, Delft University of Technology, Delft, The Netherlands, 13–17 June 2005; pp. 161–174. [Google Scholar]
- Hillier, B. The hidden geometry of deformed grids: Or, why space syntax works, when it looks as though it shouldn’t. Environ. Plan. B Plan. Des. 1999, 26, 169–191. [Google Scholar] [CrossRef]
- Peponis, J. Intelligence, intent and data in design—Reflections from the point of view of space syntax. In Proceedings of the Computational Design Symposium and the Annual Conference of the Computational Design Academic Committee of the Architectural Society of China, Beijing, China, 11 December 2021. [Google Scholar]
- Chiaradia, A.; Hillier, B.; Schwander, C. Spatial Centrality, Economic Vitality/Viability. In Proceedings of the 7th International Space Syntax Symposium, Stockholm, Sweden, 8–11 June 2009; pp. 21–42. [Google Scholar]
- Vaughan, L.; Jones, C.E.; Griffiths, S.; Haklay, M.M. The Spatial Signature of Suburban Town Centres. J. Space Syntax 2010, 1, 77–91. [Google Scholar]
- Weisman, J. Evaluating architectural legibility: Way-finding in the built environment. Environ. Behav. 1981, 13, 189–204. [Google Scholar] [CrossRef]
- China Academy of Urban Planning and Design. Annual Report on Road Network Density and Traffic Operation in Major Chinese Cityes (2021); China Academy of Urban Planning and Design: Beijing, China, 2021. [Google Scholar]
- Opinions of the Central Committee of the Communist Party of China and the State Council on Further Strengthening the Management of Urban Planning and Construction. Available online: http://www.gov.cn/zhengce/2016-02/21/content_5044367.htm (accessed on 15 February 2023).
- Sui, D.; Zhao, B.; Kong, H. The Development of Copycat Towns in China: An Analysis of Their Economic. Available online: https://www.jstor.org/stable/pdf/resrep18610.5.pdf (accessed on 14 February 2022).
- Fan, Q. The Study on the Large Composite Residential Districts Development Strategies in Metropolitan Outskirts. Master’s Thesis, Zhejiang University, Zhejiang, China, 2015. [Google Scholar]
- Shen, J.; Wu, F. The Development of Master-Planned Communities in Chinese Suburbs: A Case Study of Shanghai’s Thames Town. Urban Geogr. 2012, 33, 183–203. [Google Scholar] [CrossRef]
- The Controversial Copycat ‘English’ Town in the Heart of China. Available online: https://www.msn.com/en-us/money/realestate/the-controversial-copycat-english-town-in-the-heart-of-china/ss-BB1gFFxC (accessed on 14 February 2022).
- Fan, Q.; Hu, X.M.; Zhao, Y. The Research on New Town Development Strategy in Metropolitan Outskirts: A Case Study of Liangzhu New Town. In Proceedings of the REAL CORP 2014 Tagungsband, Vienna, Austria, 21–23 May 2014. [Google Scholar]
- Zhi, W.; Zhang, Y.; Dai, C. Future Prospect of Garden City and Ideal Residential Area—Twenty Years of Exploration and Thinking on the Liangzhu New Town. Time Archit. 2021, 2, 114–119. [Google Scholar]
- Naess, P. Residential location, travel, and energy use in the Hangzhou Metropolitan Area. J. Transp. Land Use 2010, 3, 27–59. [Google Scholar] [CrossRef]
- Knight, P.L.; Marshall, W.E. The metrics of street network connectivity: Their inconsistencies. J. Urban. Int. Res. Placemaking Urban Sustain. 2015, 8, 241–259. [Google Scholar] [CrossRef]
- Pipe Flow Calculatios. Available online: https://www.pipeflowcalculations.com/index.xhtml (accessed on 15 February 2022).
- Peponis, J.; Allen, D.A.; French, S.P.; Scoppa, M.; Brown, J.S. Street connectivity and urban density: Spatial measures and their correlation. In Proceedings of the 6th International Space Syntax Symposium, Istanbul, Turkey, 12–15 June 2007. [Google Scholar]
- Yu, Y.; Yu, Z. A Hypothesis of Urban Morphogenesis and Urban Vitality in Newly Built-up Areas: Analyses Based on Street Accessibility, Building Density and Functional Mixture. Urban Plan. Int. 2017, 32, 43–49. [Google Scholar]
- SOM. Yangpu University City Central area Control Specific Plan; SOM: Shanghai, China, 2003. [Google Scholar]
- Henriot, C.; Minost, M. Thames Town, an English Cliché: The Urban Production and Social Construction of a District Featuring Western-style Architecture in Shanghai. Urban Plan. China 2017, 1, 79–86. [Google Scholar] [CrossRef]
- News of Tianhua Architects. Available online: https://www.thape.com/news/245 (accessed on 15 February 2023).
- Netto, V.; Saboya, R.; Vargas, J.; Figueiredo, L.; Freitas, C.; Pinheiro, M. The convergence of patterns in the city: (Isolating) the effects of architectural morphology on movement and activity. In Proceedings of the 8th International Space Syntax Symposium, Santiago, Chile, 13 August 2012. [Google Scholar]
- Turner, S. Emergence and self-organization in urban structures. In Proceedings of the AGILE’2012 International Conference on Geographic Information Science, Avignon, France, 24–27 April 2012. [Google Scholar]
- Ye, Y.; Nes, A. Quantitative tools in urban morphology: Combining space syntax, spacematrix and mixed-use index in a GIS framework. Urban Morphol. 2014, 18, 97–118. [Google Scholar] [CrossRef]
- Ye, Y.; Li, D.; Liu, X. How block density and typology affect urban vitality: An exploratory analysis in Shenzhen, China. Urban Geogr. 2018, 39, 631–652. [Google Scholar] [CrossRef]
- Oliveira, V.; Abaee, M. Urban Morphology: An Introduction to the Study of the Physical Form of Cities (Persian Translation), 1st ed.; Springer: Cham, Switzerland, 2016. [Google Scholar]
- Mezoued, A.M.; Letesson, Q.; Kaufmann, V. Making the slow metropolis by designing walkability: A methodology for the evaluation of public space design and prioritizing pedestrian mobility. Urban Res. Pract. 2022, 15, 584–603. [Google Scholar] [CrossRef]
- Baobeid, A.; Koç, M.; Al-Ghamdi, S.G. Walkability and Its Relationships with Health, Sustainability, and Livability: Elements of Physical Environment and Evaluation Frameworks. Front. Built Environ. 2021, 7, 721218. [Google Scholar] [CrossRef]


Disclaimer/Publisher’s Note: The statements, opinions and data contained in all publications are solely those of the individual author(s) and contributor(s) and not of MDPI and/or the editor(s). MDPI and/or the editor(s) disclaim responsibility for any injury to people or property resulting from any ideas, methods, instructions or products referred to in the content. |
© 2023 by the authors. Licensee MDPI, Basel, Switzerland. This article is an open access article distributed under the terms and conditions of the Creative Commons Attribution (CC BY) license (https://creativecommons.org/licenses/by/4.0/).