1. Introduction
As an important part of the built environment of colleges and universities, the laboratory is the most widely distributed public space in colleges and universities, and it is also one of the public places where people have the most frequent activities. In the wake of the COVID-19 outbreak in 2019, air pollution has worsened, with poorly ventilated laboratories posing a serious threat to students’ and teachers’ physical and mental health. At present, the natural ventilation design of many buildings has shortcomings and cannot fully meet the current needs [
1]. This paper optimizes indoor natural ventilation by simulating the wind speed of the indoor model and uses the visualization analysis of CFD to carry out relevant research and optimization. CFD fluid dynamics software has the powerful function of simulating complex flow phenomena, which can simulate buildings’ indoor natural ventilation effect. Taking the Engineering Training Center of the Civil Engineering Museum of Chengdu Normal University as an example, this paper studies the use of CFD software to establish a natural ventilation visualization model. It creates an indoor wind environment simulation based on computational fluid technology, thus providing a reference basis for improving the laboratory’s ventilation environment and air quality.
In the past two decades, computational fluid dynamics (CFD) has become an effective tool for domestic and foreign scholars to study natural ventilation, improve indoor and outdoor air organization, and reduce energy consumption in buildings. Duan, Z used CFD simulation to predict the indoor temperature and speed distribution of Beijing office buildings and found that cross-ventilation can provide thermal comfort for occupants, while improving the availability of fresh air, bringing better energy-saving effects [
2]. For example, Indra Permana used CFD-assisted simulation to determine better pollution control designs, arrange air supply layouts with less expenditure, improve ventilation, and identify best practice strategies in the design phase to reduce operating costs at full load [
3]. You, J analyzed the relationship between the diffusion of cooking pollutants in the middle kitchen and the flow field of the inner courtyard through measurement and CFD simulation and discussed the influence of different forms of the inner courtyard of high-rise residential buildings on the diffusion and distribution of cooking pollutants under natural ventilation conditions [
4]. Zhenlei Chen developed theoretical formulas through experimental calibration and built an improved CFD model, which accurately reflected changes in smoke concentration and assessed kitchen air pollution, thereby improving the thermal environment. It could even improve human health by optimizing the indoor airflow organization environment [
5]. Aurora Monge-Barrio optimized indoor natural ventilation by looking at changes in CO
2 and temperature throughout the school before and during COVID-19 [
6]. While the occupants’ living environment was improved, the energy consumption of the building was also reduced accordingly. Zakia Afroz proposed the finding that a dynamic ventilation strategy, which is used to ensure the efficient operation of the ventilation system and adjust the ventilation according to different operating conditions, is superior to a constant volume ventilation system [
7]. Guo Weihong comprehensively considered the influence of wind pressure and thermal buoyancy on natural ventilation efficiency, combined with the building energy model (BEM) and CFD, and evaluated the influence of climatic conditions and architectural forms in subtropical regions on natural ventilation of medium-sized gymnasiums [
8].
At present, ISO7730 and ASHRAE55-1992, which are internationally recognized standards for evaluating and predicting thermal comfort in indoor thermal environments, are aimed at college students in developed countries such as in Europe and the United States [
9]. Research on the relationship between natural ventilation and human comfort in the Chinese mainland and their learning environments on a global scale and its improvement is not deep enough. In particular, the statistical and analytical techniques of the system are used to find out the variation rules of various indicators that affect the natural ventilation volume, such as wind speed and air age, with different scheme designs. The aim is to find the most economical and feasible optimization strategies to improve the wind environment and human comfort. The review of the existing literature also reveals the international gap in the field of natural ventilation in university laboratories, as well as the lack of improvement effects of various air indicators. Therefore, we think it is necessary to innovate the research objective and improve effective evaluation based on our predecessors.
2. Method and Simulation Model
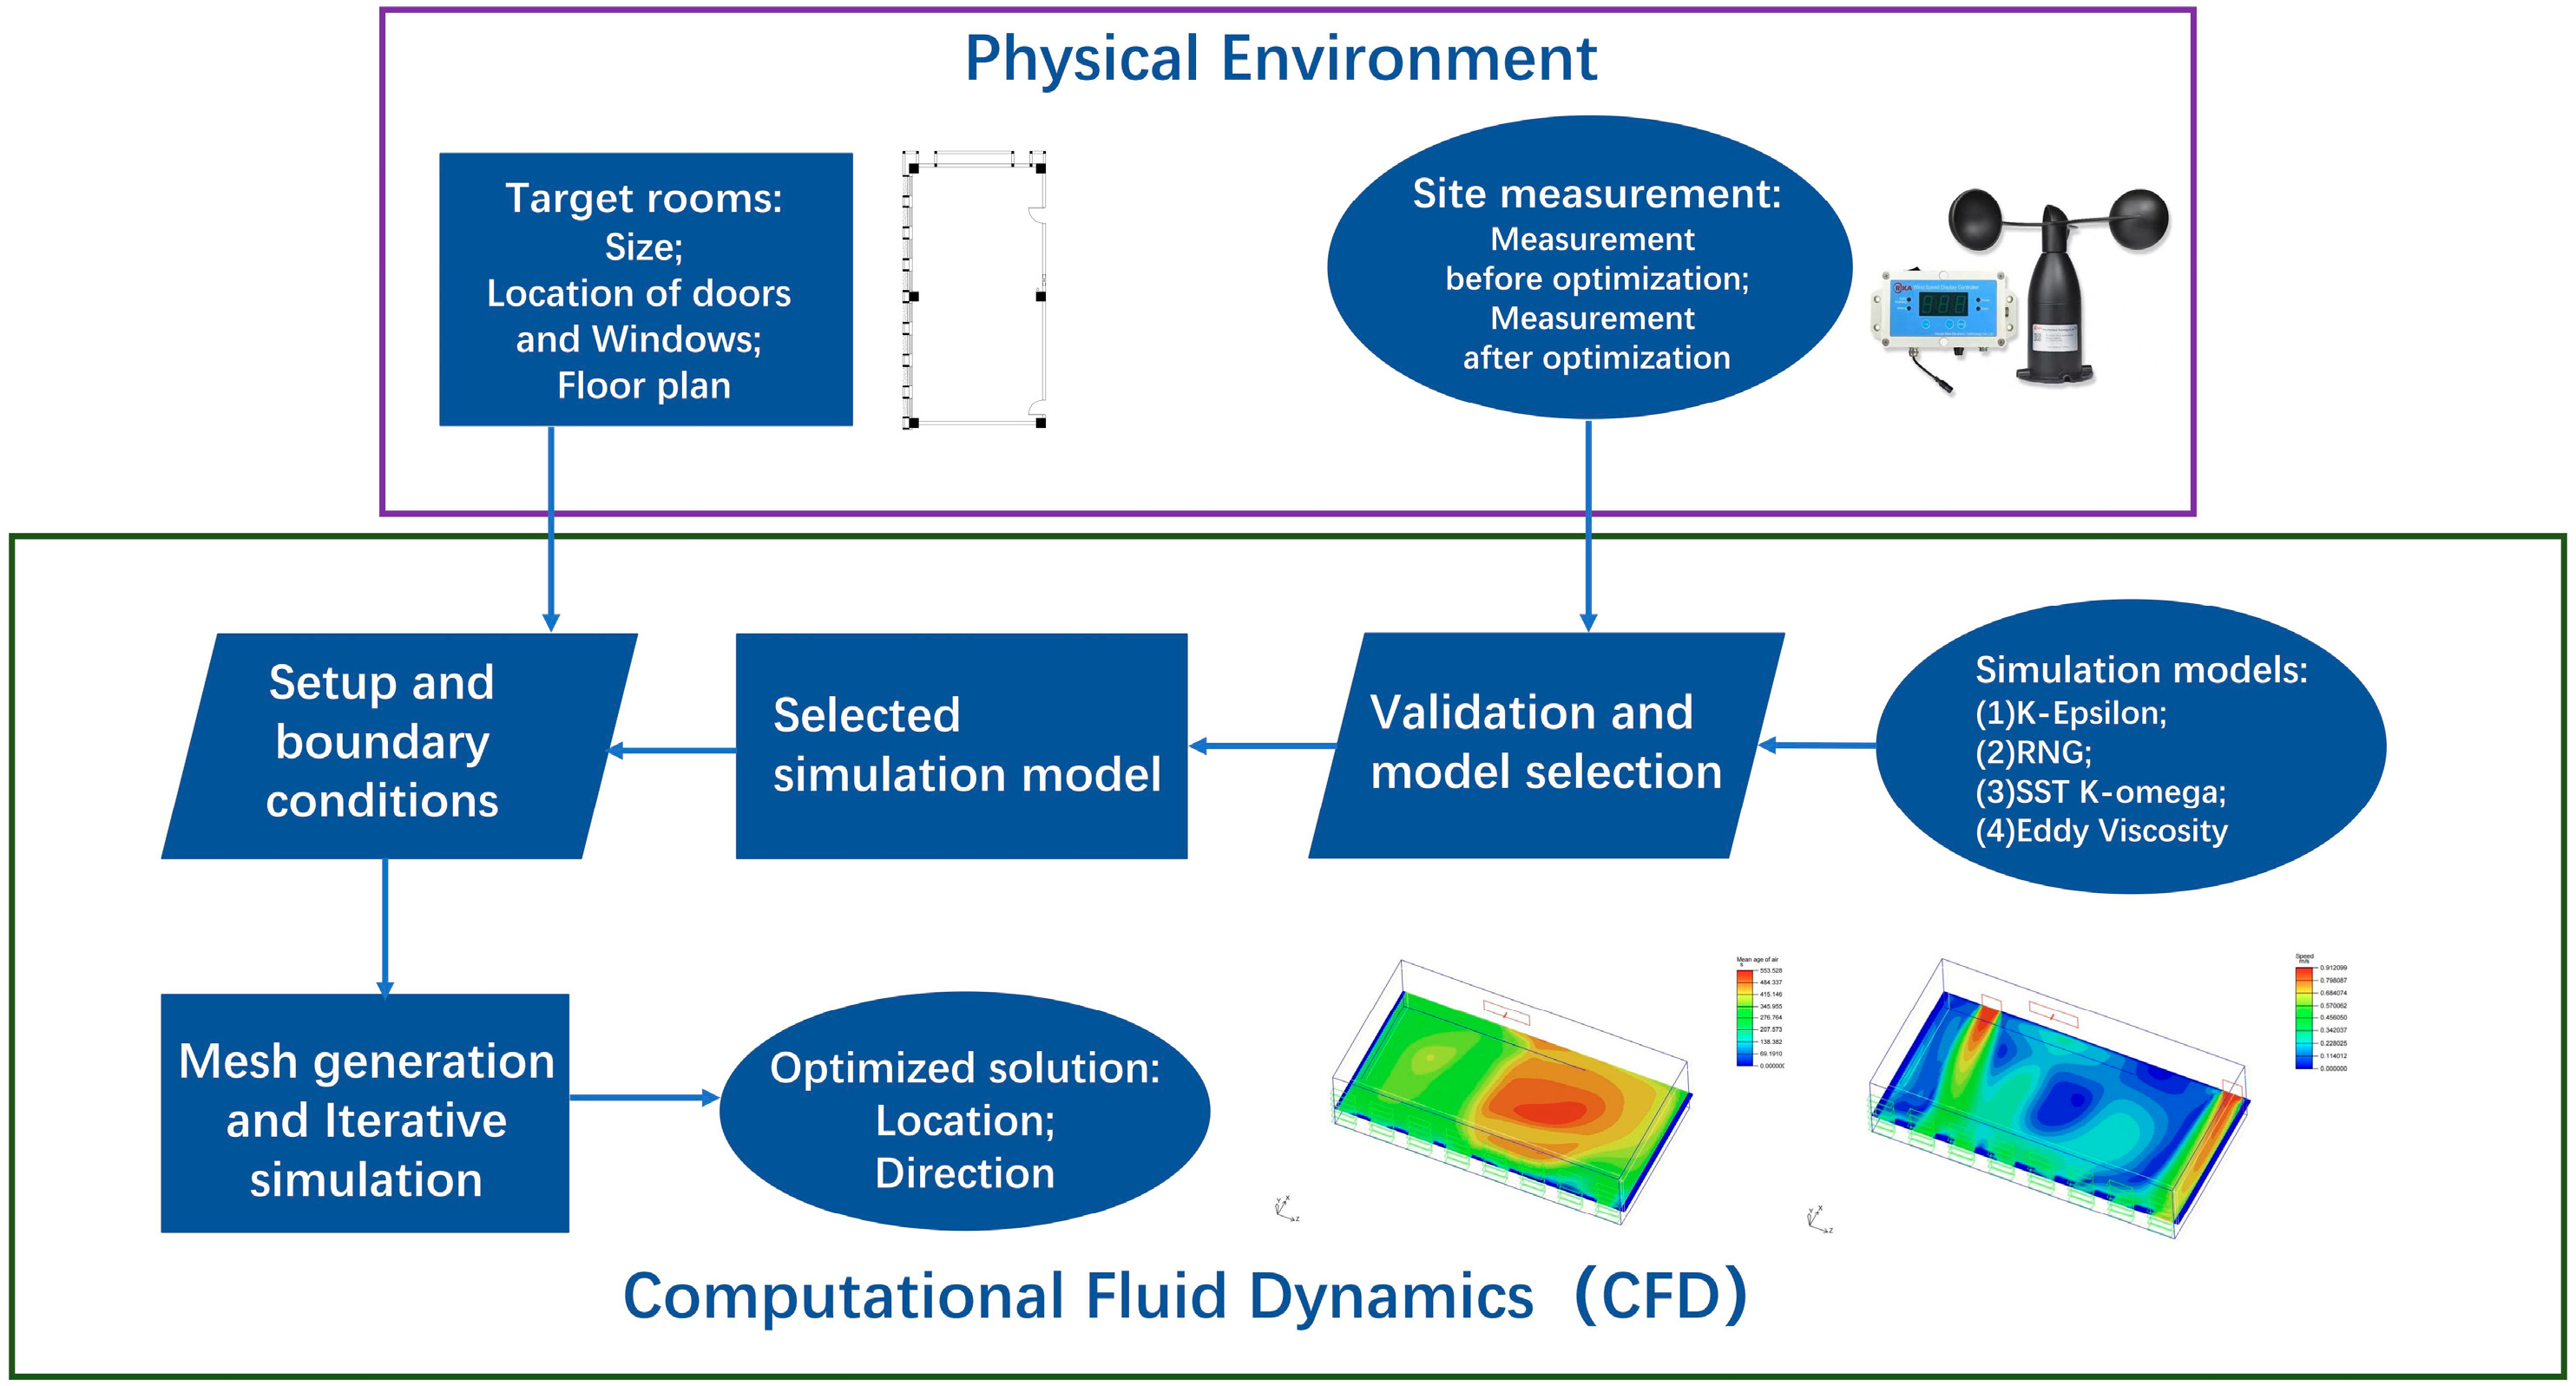
Taking the Laboratory of Chengdu Normal University as an example, this paper studies the use of commercial CFD software Fluent Airpak 3.0 to establish a natural ventilation visualization model and creates an indoor wind environment simulation based on computational fluid technology to provide a reference basis for improving the ventilation environment and air quality of the laboratory, and then proposes a design scheme to compare with the existing environment. The following is the flow chart of this study, as shown in
Figure 1.
2.1. Physical Model and Boundary Condition Setting
The Civil Engineering Training Center laboratory of Chengdu Normal University in Chengdu, Sichuan Province was selected as the research object, and the model was simplified to facilitate the calculation and research. We conducted field data collection on-site for the research subjects. The laboratory is located in Chengdu, Sichuan Province, and the test was conducted in classroom 203, School of Physics and Engineering Technology, Chengdu Normal University, which has a hot summer and cold winter, with an average daytime temperature of 21 °C. The experimental index is wind speed units (m/s). Twelve sampling points, including the central points of windows and doors, were selected for actual measurements, and the weather was stable and clear during the observation period. The measured wind speed was between 0.8~1.0 m/s, so the average value is 0.9 m/s.
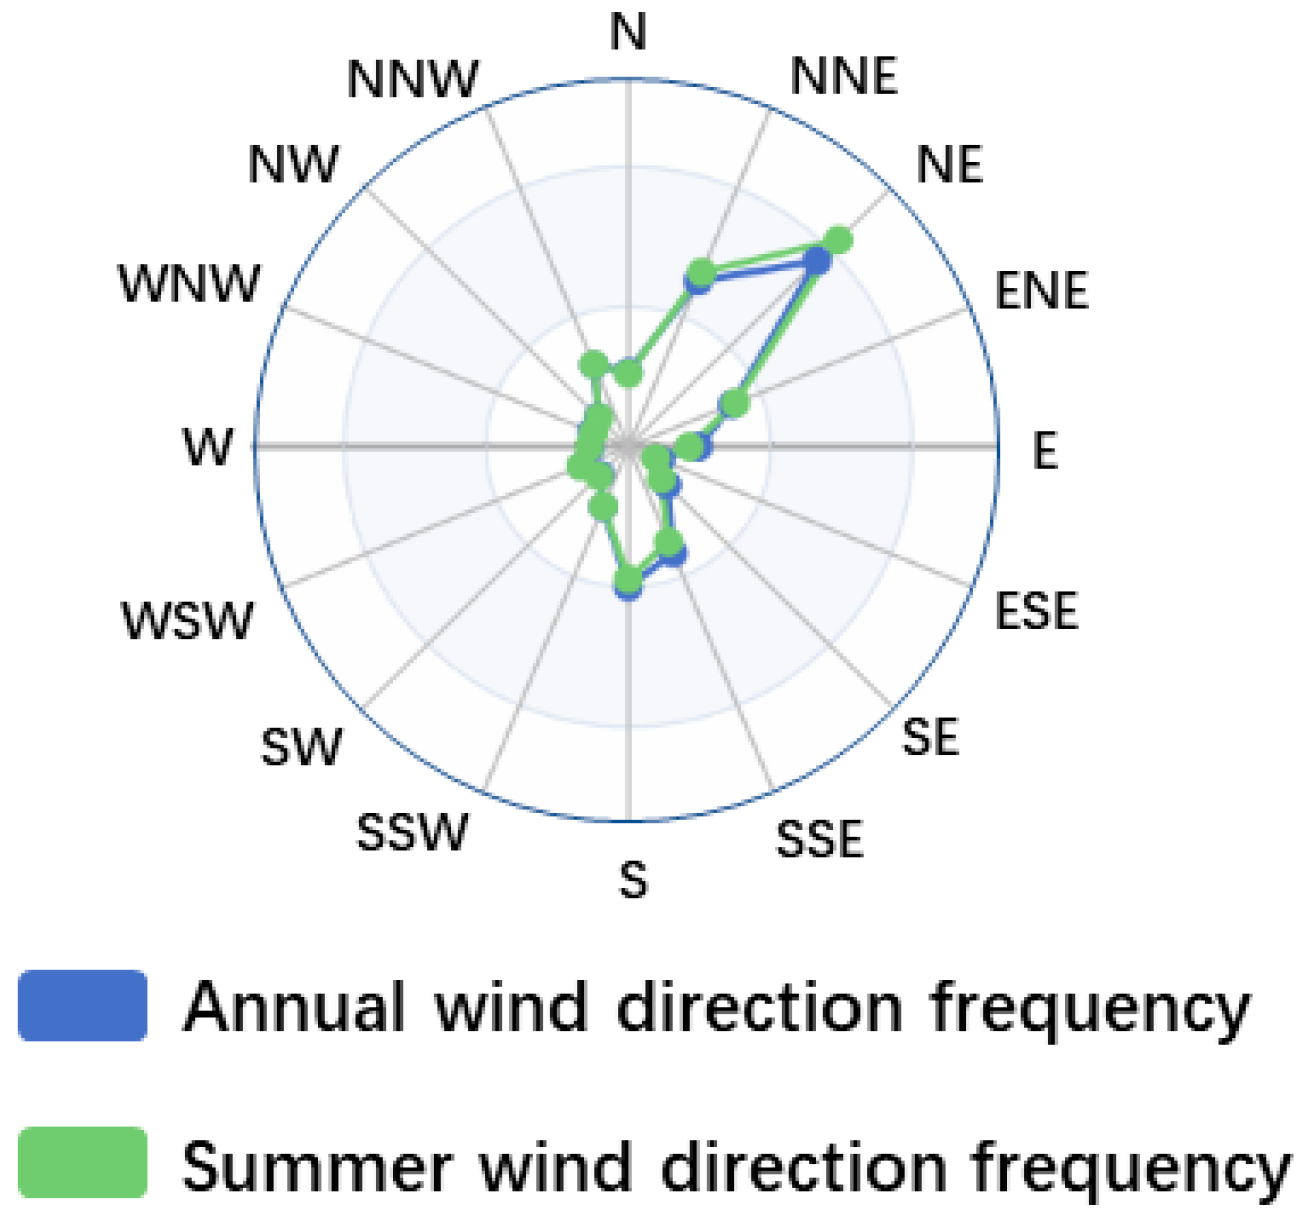
It is found from
Figure 2 that the wind direction in Chengdu is generally north and north-northeast. In field tests, we found that the wind direction was generally northeasterly, and most of the rest of the tests were conducted with northerly winds.
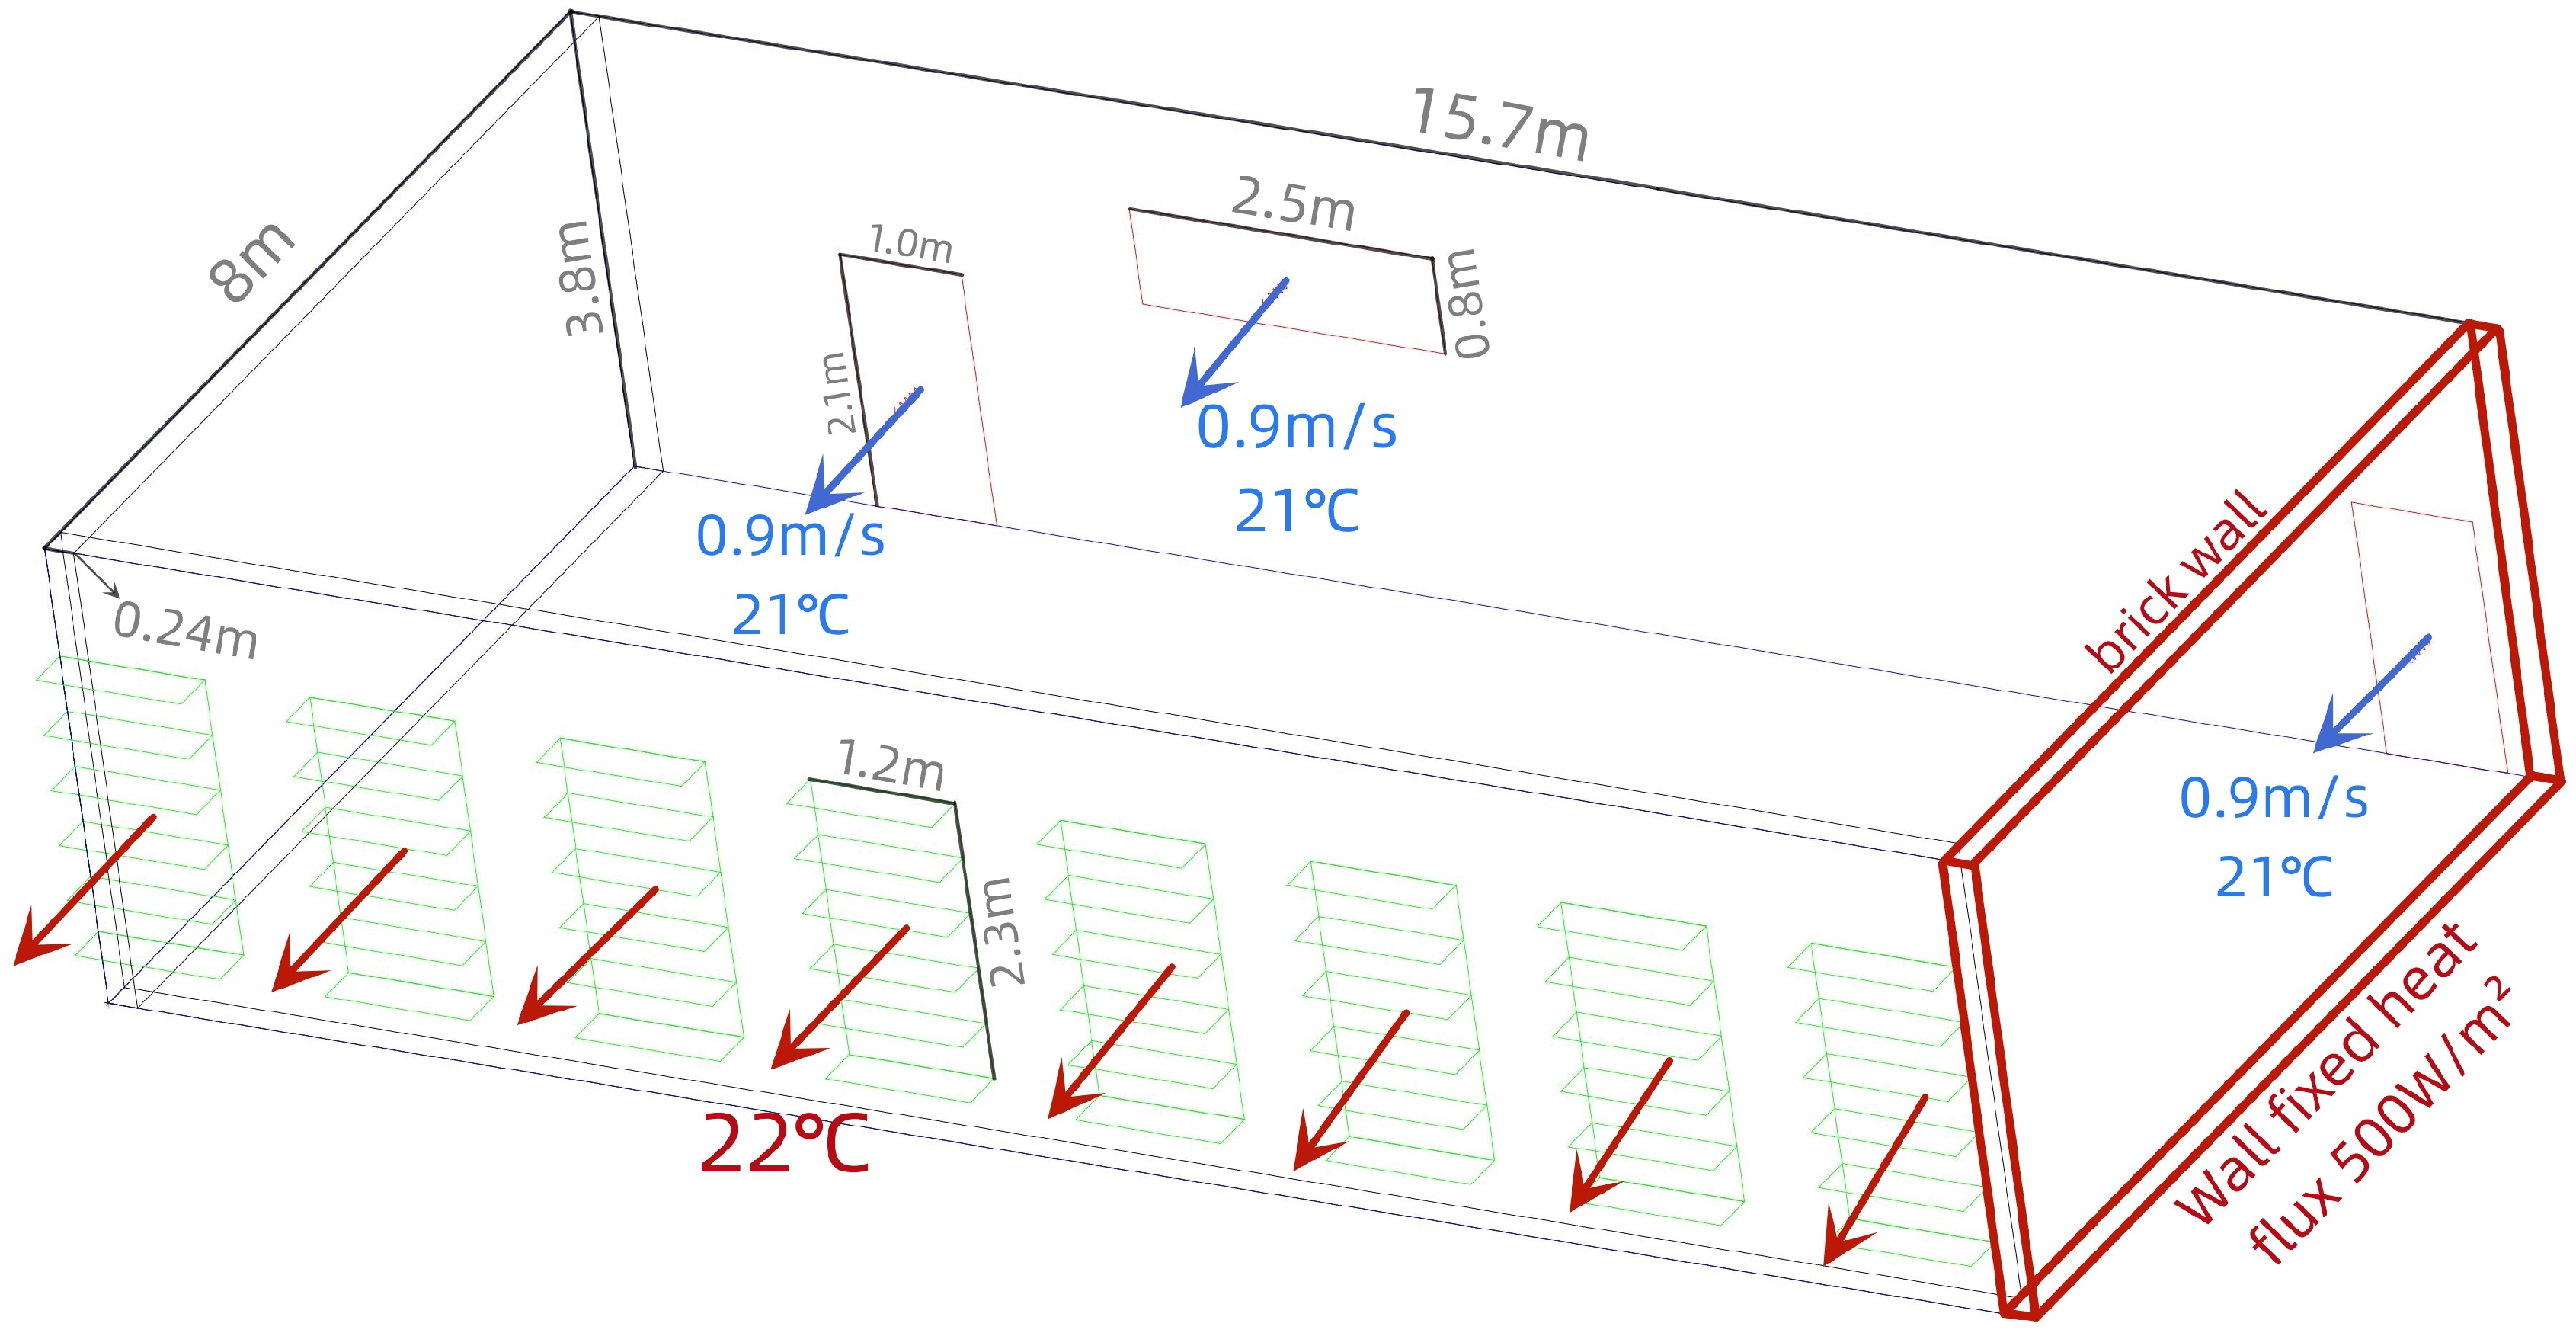
The south wall of the room has eight windows, the north wall has one window, and the north wall has a door connecting the corridor at the front and back. The basic information of the room is shown in
Figure 3.
Since the wind direction in Chengdu is generally north-northeast, we set the three openings in the north wall as air intake (Openings) and the eight windows in the south wall as free exits (Vents). The natural ventilation method of this room model is to use the heat pressure caused by the difference between the temperature of the indoor and outdoor air, and considering that there is no need to set the temperature of other objects, we chose not to solve the energy equation, but to set the temperature of the air inlet and outlet after field measurement. The comparison found that this reduced the amount of calculation and made the experimental results more accurate. The relevant boundary conditions are set as shown in
Table 1.
In reality, the wind environment problem is very complicated, and in many cases, it is impossible to estimate the critical time of the steady state. Therefore, in this study, we analyze the model as an unsteady state. Because we are only interested in the steady state that the unsteady state problem eventually achieves, and do not care about the instantaneous details in the process, the initial conditions can be very arbitrary (because the final stable solution has nothing to do with how the initial conditions are given), so we can use the unsteady-state method to solve the steady-state problem, thereby saving calculation time or ensuring that the calculation does not diverge.
Several calculation parameters are often involved in transient calculations: number of time steps, time step, simulation time, and number of substep iterations. The number of substep iterations refers to the number of iterations in a substep, which is the same concept as the steady-state iterations. Therefore, we can think of each substep as a steady-state iterative process, and the convergence criterion is the same as the steady-state calculation, and convergence is required to be achieved within each time step.
Transient calculations require a time step, which requires consideration of time points. Here we want to make sure that we can output the data at the time point of interest, i.e., 600 s, so therefore the input time step is 300 s.
2.2. Grid Division
In the process of practical modeling and numerical simulation, the mesh division in this experiment is divided into a tetrahedral mesh and hexahedral mesh, and according to the study of Wang Wei et al. on the accuracy of polyhedral working conditions, it is concluded that the accuracy of the polyhedral working condition is close to that of the hexahedral working condition and better than that of the tetrahedral working condition [
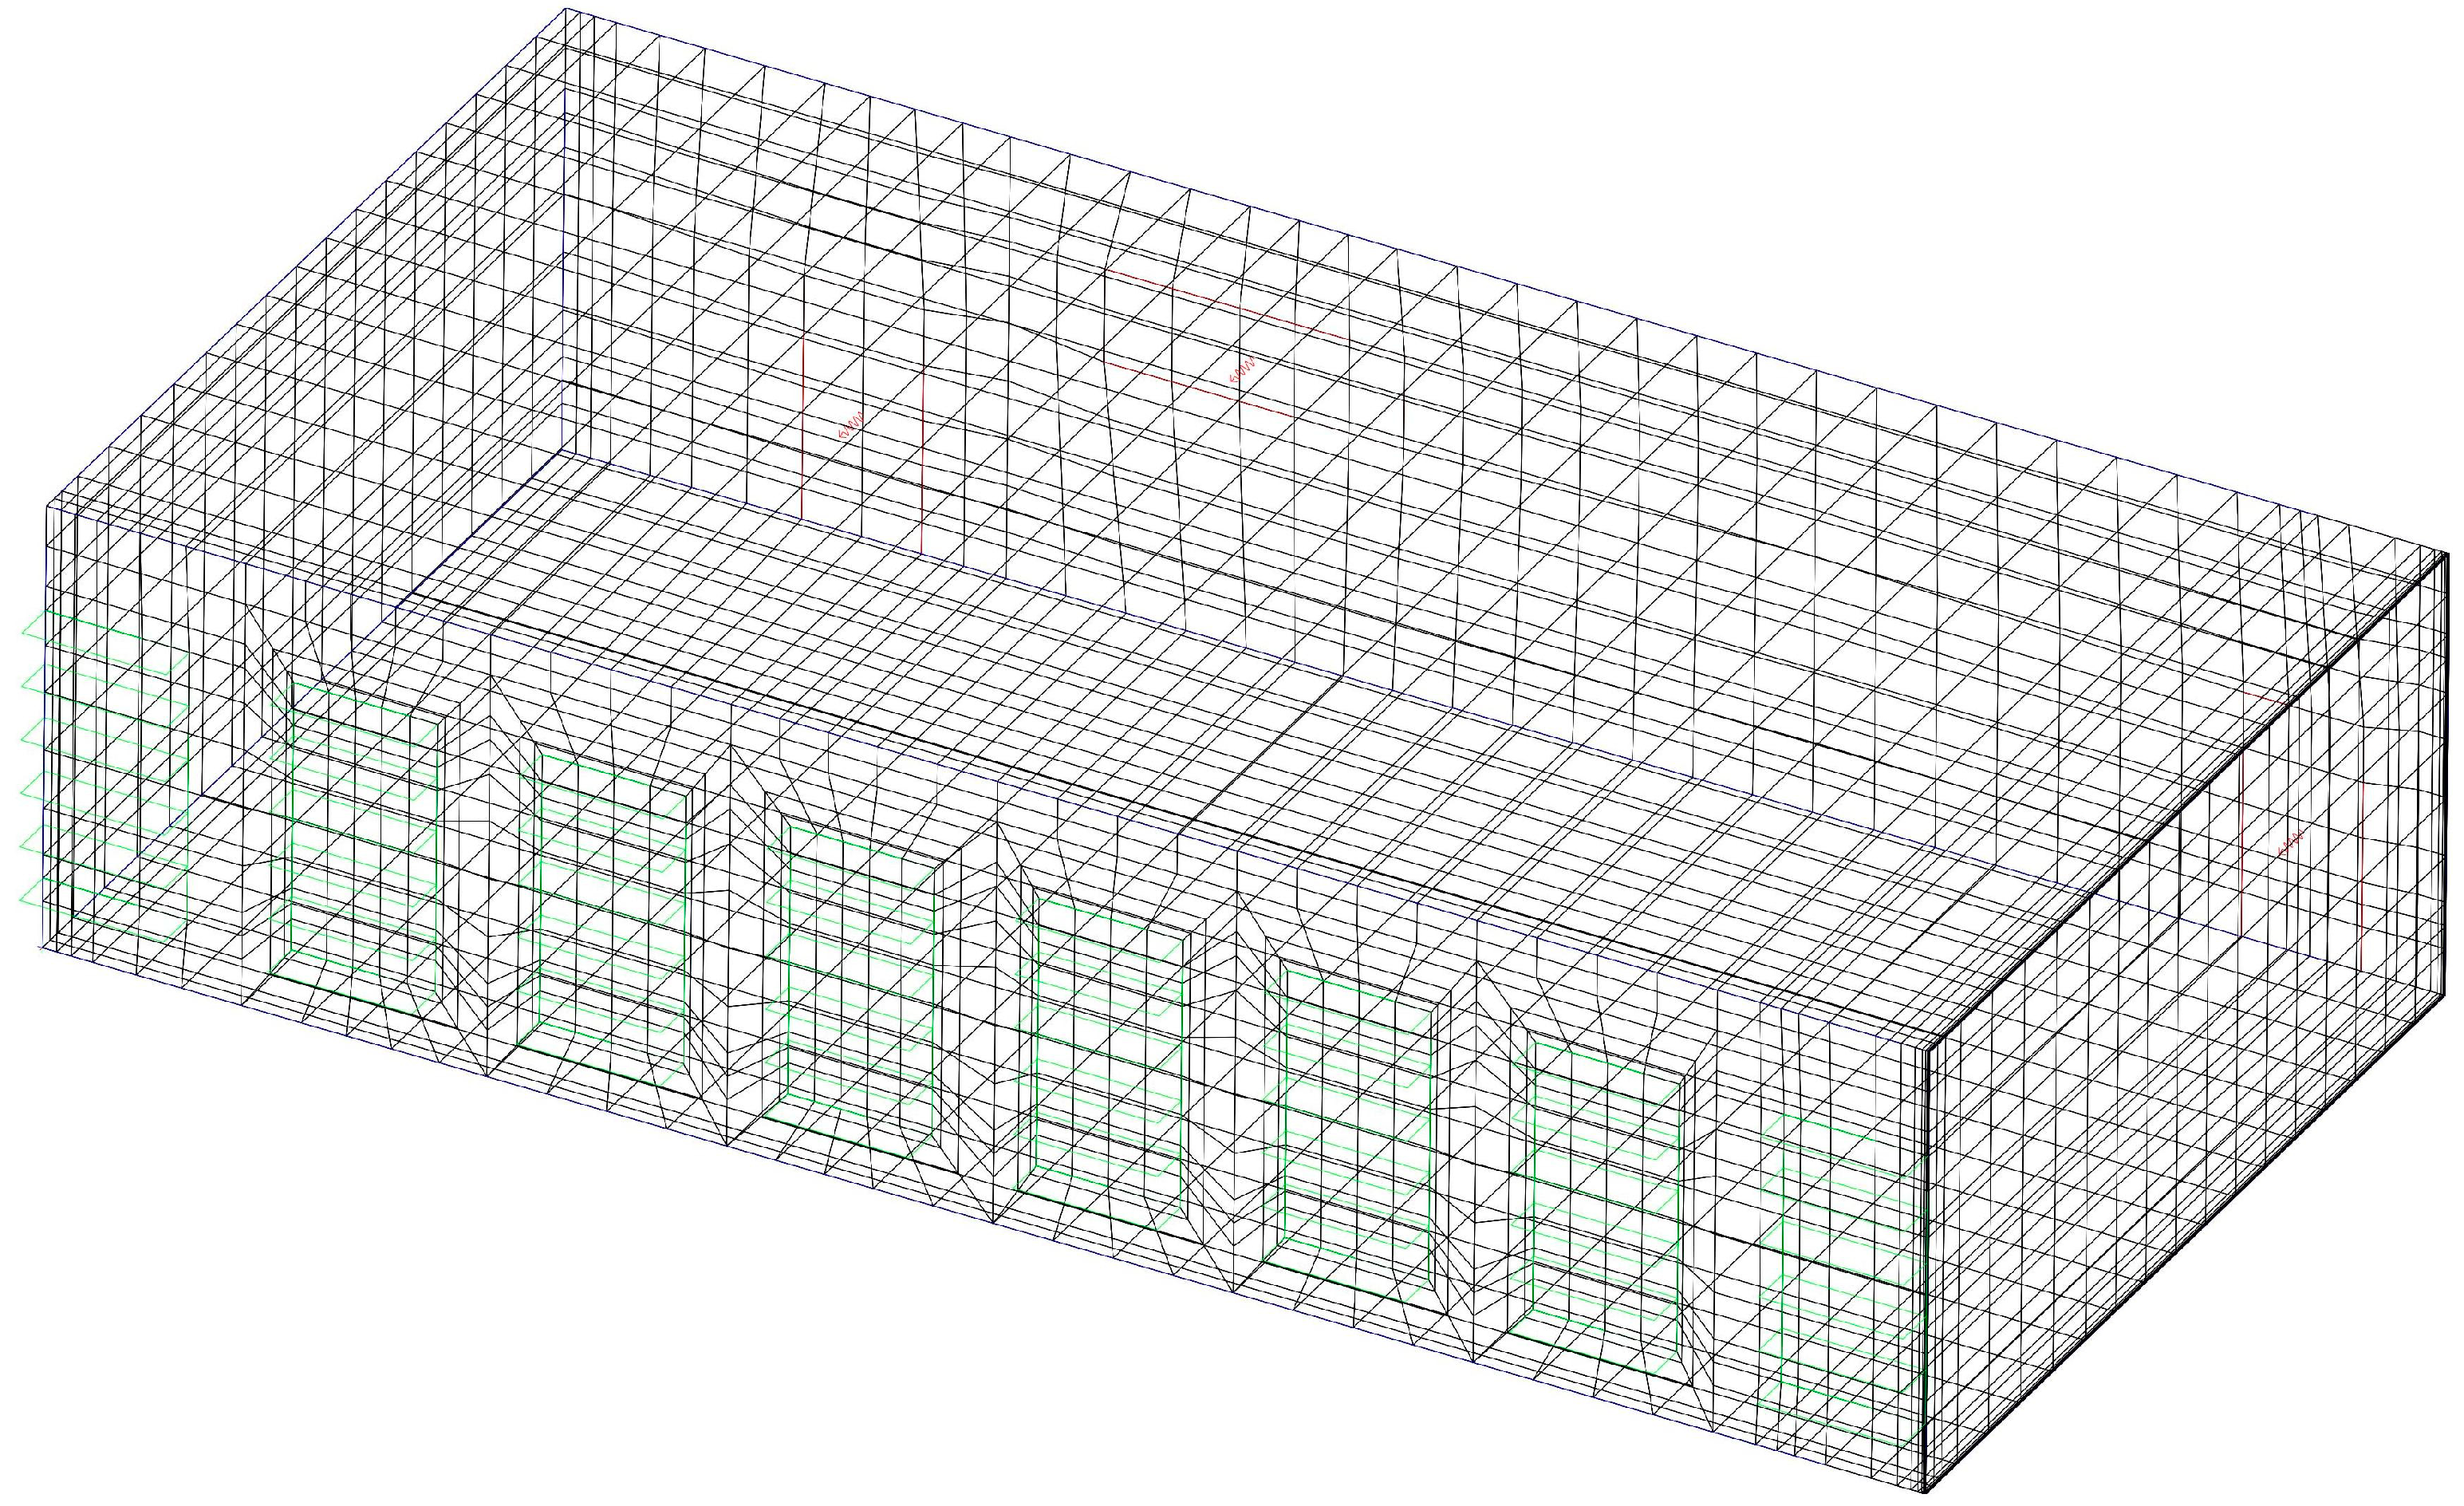
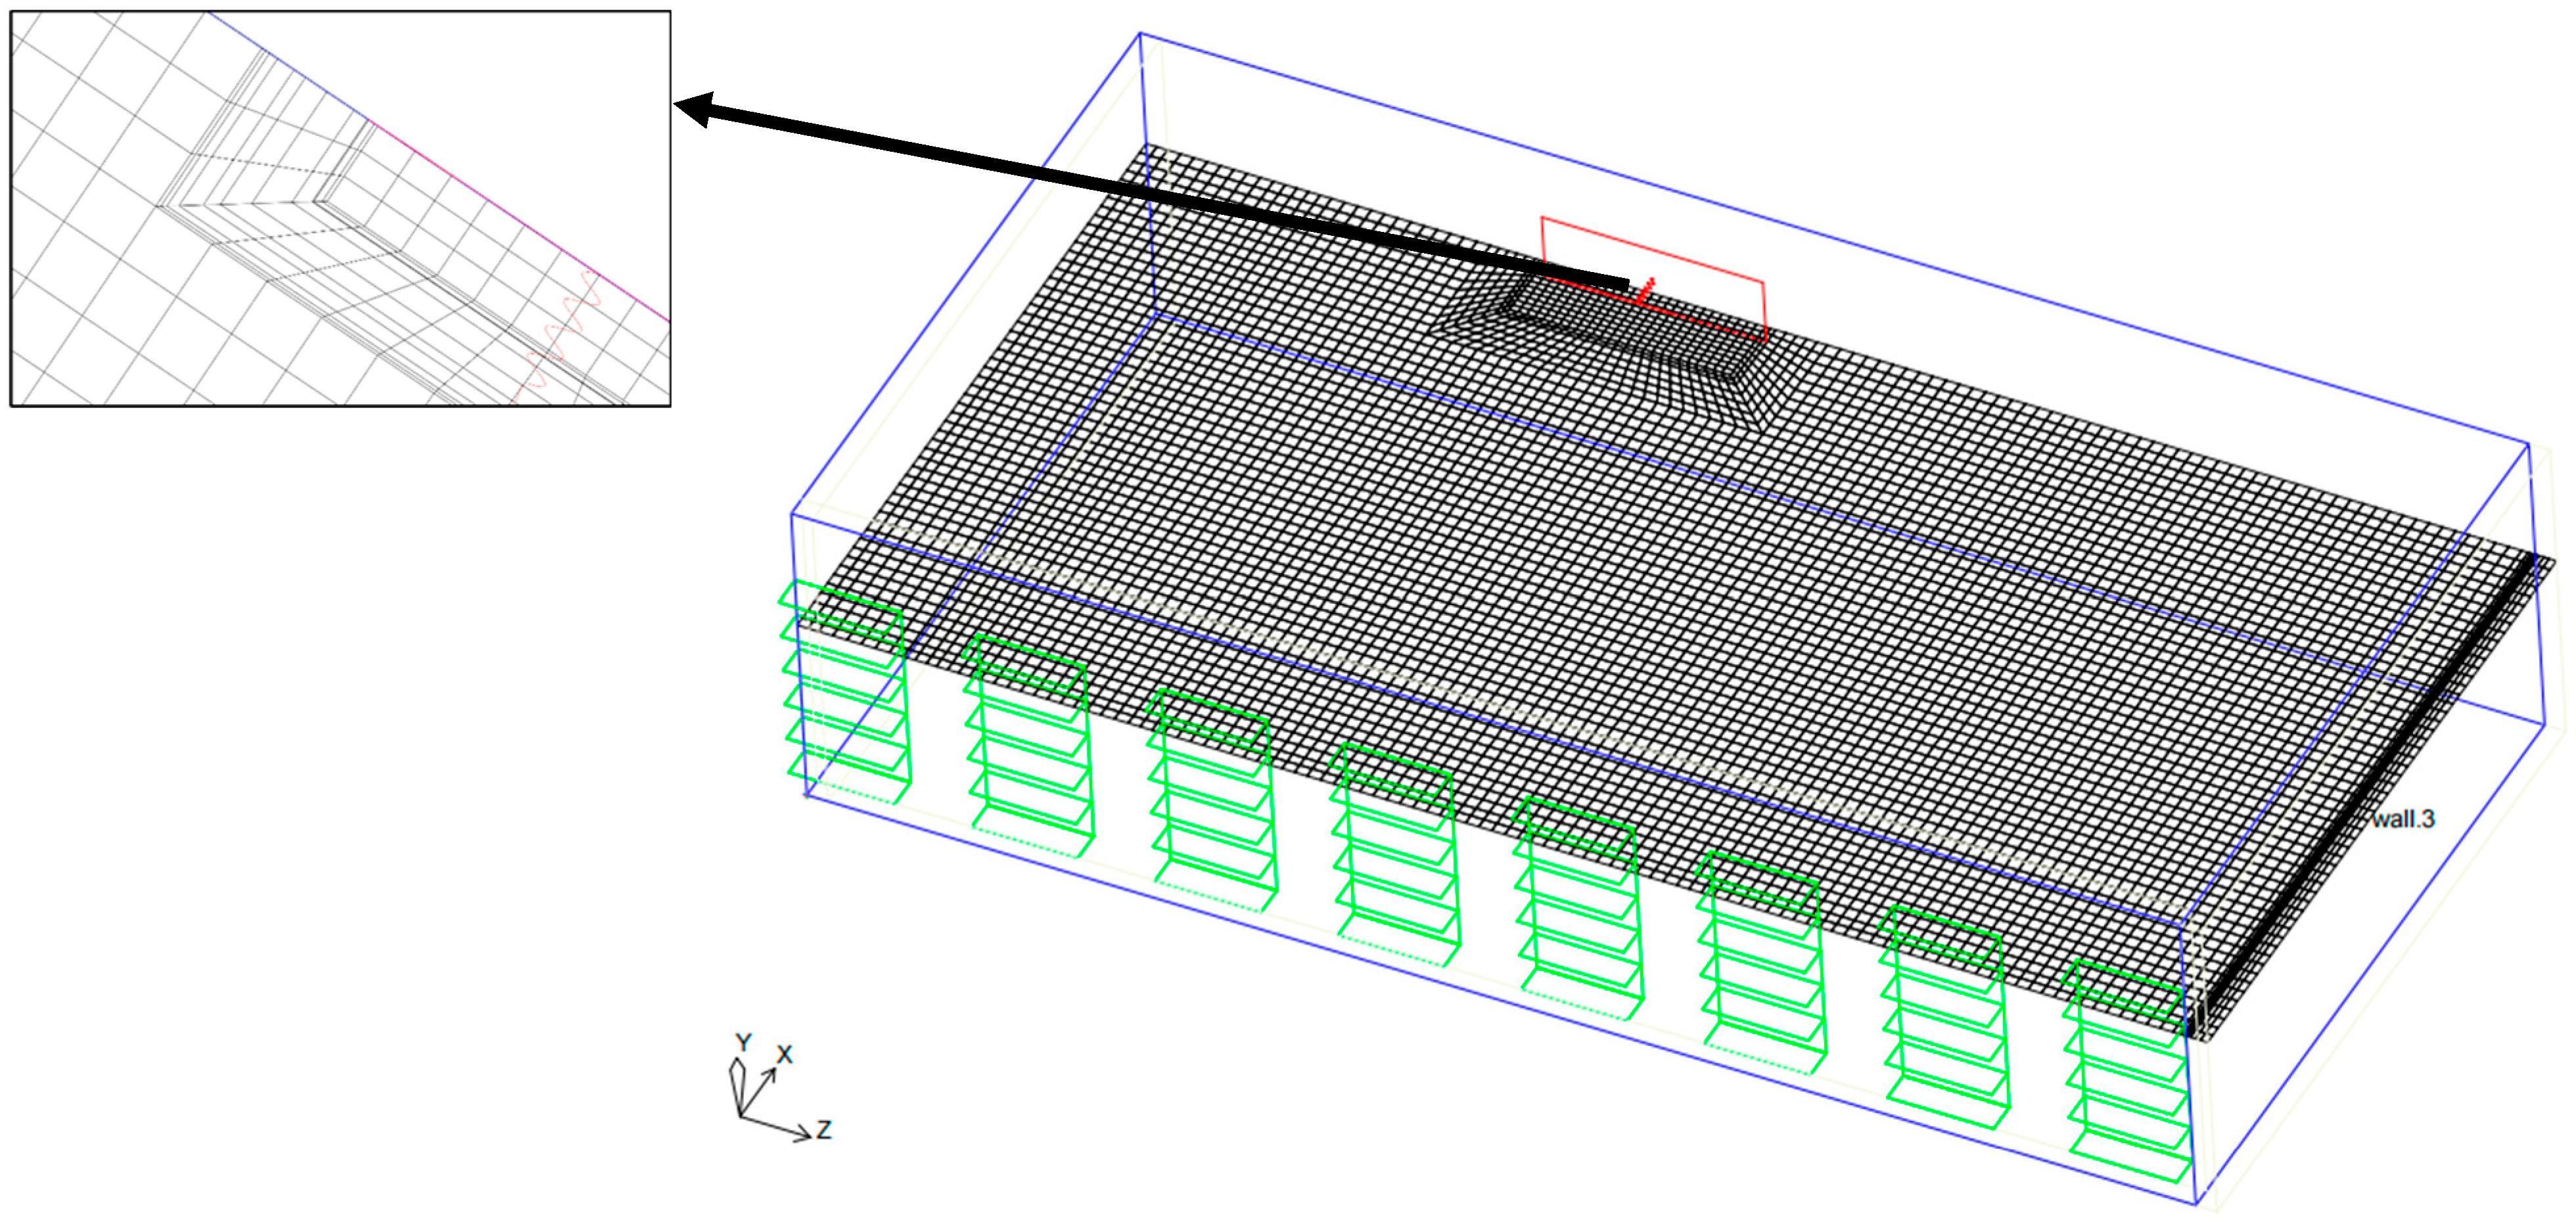
10]. In this paper, the deformation characteristics, the number of divided meshes, the degree of anti-distortion, and the amount of re-division of hexahedral meshes have obvious advantages over 3D tetrahedral meshes (
Figure 4) in the practical operation of natural ventilation in the laboratory. The hexagonal meshes can better cater for the airflow direction and are more consistent with the ventilation environment of the model studied in this paper. In this paper, the hexahedral model uses a grid cell with an X-maximum of 0.15 m, Y-maximum of 0.15 m, and Z-maximum of 0.15 m. The grid is locally refined in places with large temperature gradients and velocity gradients, such as air inlets and air outlets, so the number of grids in each direction is greater than or equal to 4. The quality of the grid and the accuracy of the calculation depend on the number of grids, which affects the scale of the calculation. The quality of the grid and the accuracy of the calculation depend on the number of grids, and the number of grids affects the size of the computation, which is considered when the corresponding model simulation is performed, weighing two factors and the model itself. After the grid irrelevance and quality check, a total of 185,954 grids were divided and of good quality, and they were locally refined at the doors and windows, respectively, which were suitable for the computational simulation as shown in
Figure 5. When meshing, there is no need to refine the mesh of the wall area, only meshing and data convergence in the area that the indoor airflow organization can reach, so that the results are closest to the actual indoor airflow situation.
2.3. Grid-Sensitivity Analysis
The verification of mesh independence is based on the influence of the density of the grid on the accuracy of the calculation, and the results of the numerical simulation are meaningful only when the density of the grid has little effect on the calculation results. The verification of grid independence in this paper is through the process of continuous refinement of the mesh; each increase on the grid is about 25–50%, with the speed distribution as the basis for comparison, the grid is refined successively, and the control boundary conditions do not change the comparison of the speed value change. As the numerical result between the density of adjacent grids is about 3%, and not more than 5%, at present it can be considered that the calculated results are not sensitive to the number of meshes, to complete the verification of grid independence [
11].
2.4. CFD Modeling
The software selected in this paper provides several models, such as forced convection, natural convection, mixed convection models, heat conduction, fluid-structure coupling heat transfer, heat radiation, and turbulence models. The turbulence model is a two-equation model, the
k—
ε model, which is most commonly used in the engineering field at present [
12]. Both the representative length of turbulence and the eddy viscosity coefficient can be expressed as a series of coefficient combinations, forming different two-equation models. Equations (1)–(5) were used for this purpose.
In the standard k-epsilon model, five coefficients need to be determined: , .
Where is the coefficient related to buoyancy in compressible flow calculation.
When the main flow is parallel to the direction of gravity, When the mainstream is perpendicular to the direction of gravity, .
Typical values of the other four empirical constants are: .
It is important to note that these defaults are determined in experiments on fundamental turbulence, including frequently encountered shear flows such as boundary layers, mixed layers, and jets, as well as attenuated isotropic grid turbulence. It is found that these default empirical constants can obtain good results in a wide range of wall constraints and free shear flow.
2.5. Distribution Equation for Air Age
Air age refers to the amount of time that air has been trapped in the room at a certain point. The age of the air at the observation point does not refer to the time that an air molecule located at the point stays indoors, but the average residence time of the group of air molecules near the point. This molecular group is infinitely small in macroscopic terms, so it has physical properties such as uniform temperature and humidity. It is infinitely large at the microscopic level, reflecting the statistical properties of continuous fluids, that is, an infinite number of microscopic particles, rather than the random motion of individual particles [
13].
As mentioned earlier, the group of air molecules near the observation point is composed of molecules of various ages, and there is a frequency distribution function
and a cumulative distribution function
for the number of air molecules of various ages. The so-called frequency distribution function
refers to the ratio of the number of air molecules aged
to the total number of molecules to
; The cumulative distribution function
refers to the proportion of the number of air molecules aged less than
to the total number of molecules. There is the following relationship between the cumulative distribution function and the frequency distribution function:
Since the air age at a certain point is the average of the group of air molecules at that point, when the frequency distribution function is known, the air age
at any point can be calculated by:
Combining the
N-S Equation (8) and the mass diffusion Equation (9):
The equation for air age distribution in the steady-state case can be expressed as:
In air conditioning ventilation, the density of air is generally considered constant, taking into account the mass conservation equation:
The form of the air age distribution Equation (10) is the same as the mass diffusion equation with source term 1. The solution of the mass diffusion equation is widely implemented in a large number of computational fluid dynamics software programs. This makes it easy to solve the air age distribution in a single room using existing numerical calculation software.
2.6. Reliability Verification of Numerical Simulation
The standard two-equation model is a computational model for high Reynolds number turbulence (above 2000 is a high Reynolds number). By comparing the zero-equation, one-equation, and two-equation models, we found that the simulation results of the two-equation model were more accurate, the calculation amount did not increase much, and the process was smoother. After comprehensive consideration, we still decided to use the two-sided process model with more outstanding advantages [
14,
15].
3. Numerical Simulation Results and Analysis
The model in this paper is based on GB/T18883-2022 Indoor Air Quality Standard. A laboratory is a place for students to study, and students can be regarded as sitting in silence. Therefore, the velocity field and air age at the vertical height of Y = 1.25 m (face height of the human body during sitting in silence) are selected to analyze the comfort of students and evaluate the indoor air quality. Through the indoor wind environment simulation by CFD software, the indoor wind speed program and air age program are obtained to evaluate the human comfort and natural ventilation effect.
The effect of airflow tissue on human comfort in this paper is based on the early research results of our predecessors. Numerous field surveys and experimental studies have shown that people in the thermal comfort zone still crave greater wind speeds. We can understand that wind speed is one of the important indicators for evaluating human comfort. The relationship between indoor wind speed and human comfort is shown in
Table 2 [
16,
17,
18].
Air age is an important indicator of air freshness (air age refers to the time when air enters the room. The smaller the air age at a point, the better the air quality at that point).
We controlled the position, switched the state of the air intake, and set four different classroom states to ensure the accuracy of the experiment and facilitate the optimization design of the plan. On this basis, we developed the vertical (90°) and 45° air inlet directions (respectively, referred to as a and b) and analyzed the wind speed and air age at the heights of 1.25 m and 1.7 m. Finally, we extracted 32 sets of data from 32 cloud maps obtained. To facilitate data processing and analysis, we divided the four classroom states into case 1, case 2, case 3, and case 4 (where case 1 is the original state of the classroom, and case 2, case 3, and case 4 are all hypothetical, optimal states, so they are discussed separately), and analyzed their wind speed and air age on this basis.
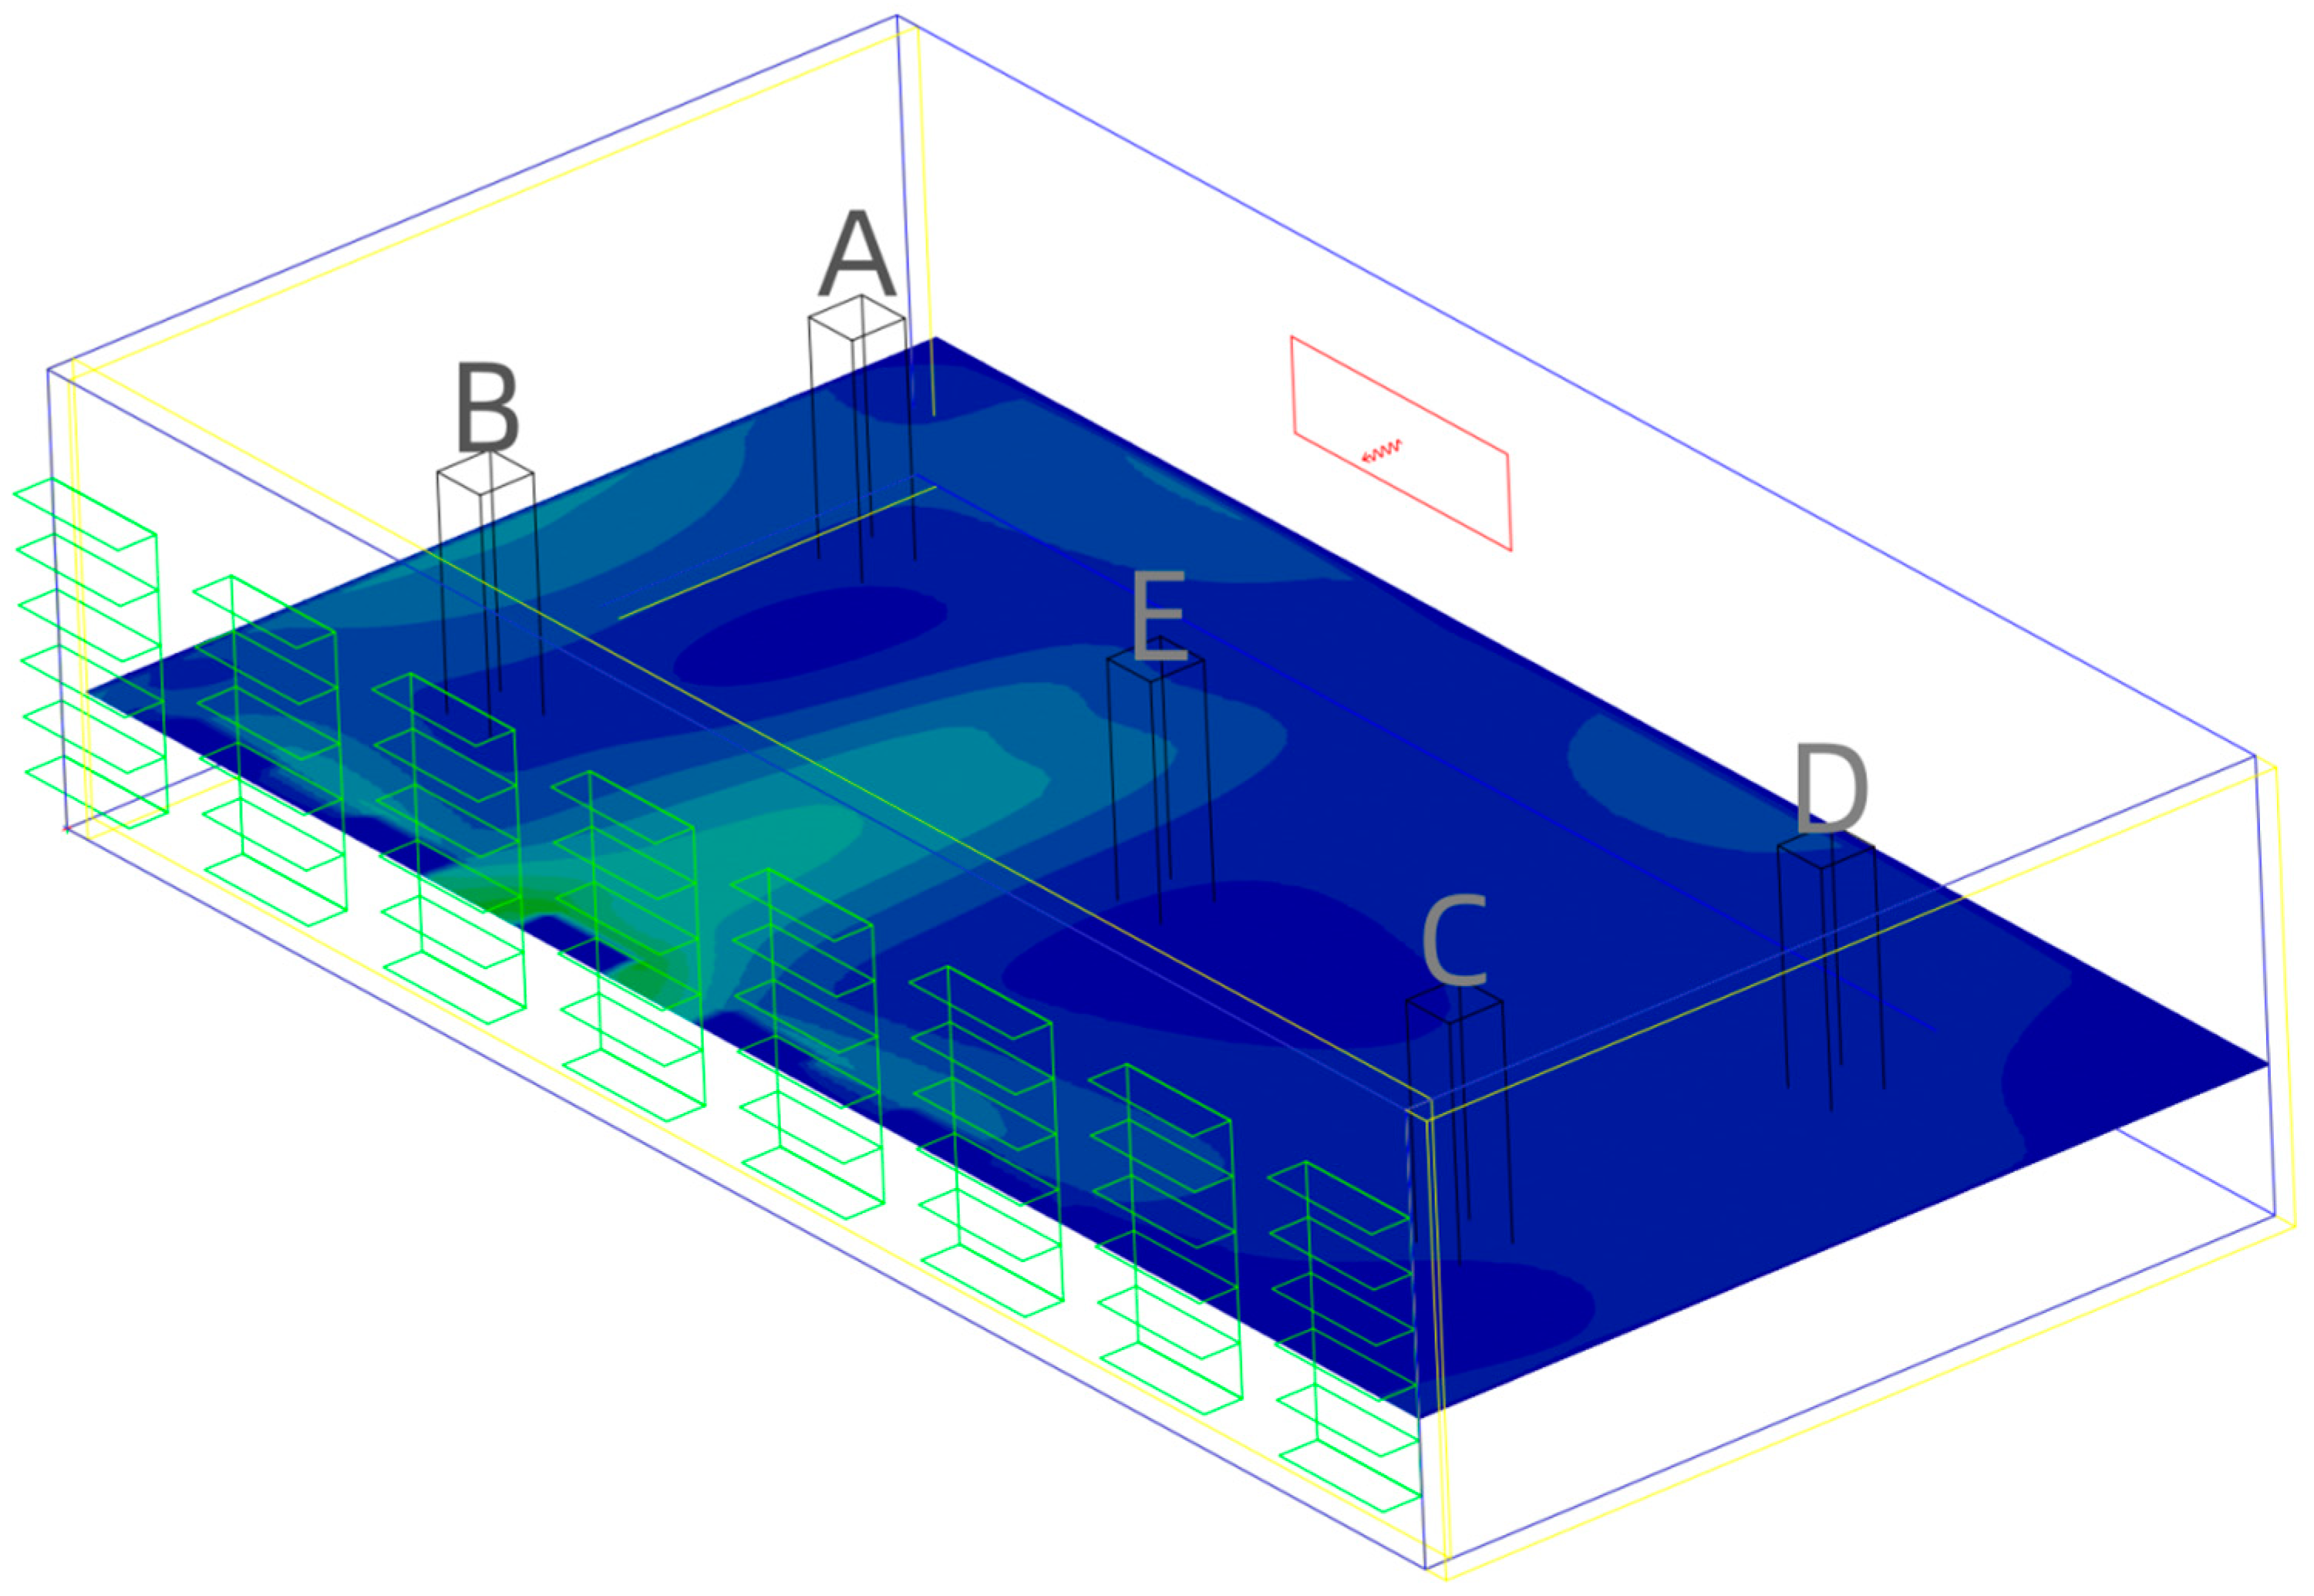
To make the collected data more accurate, five sampling points
A (6,2),
B (2,2),
C (2,13.7),
D (6,13.7), and
E (4,7.85) in the room were finally selected (as shown in
Figure 6) and recorded in the following data table (as shown in
Table 3). The 3D flow structure vector field in a fixed y-plan is shown in
Figure 7.
(1) The first case, that is, the initial state, is obtained under the condition that the position of doors and windows remains unchanged, one high window is opened, and two doors are closed (the original state of the classroom, referred to as Case 1).
(2) The second case is based on the initial state control variable, taking the number of windows as a variable and then opening a high window, which is obtained by translating the first window (as shown in
Figure 2 and
Figure 3) to the right by 4.6 m, under the condition that both the door opening and closing status and the number remain unchanged (referred to as Case 2).
(3) The third case is the condition that the number of doors and the number and position of windows remain unchanged when two doors are opened based on the initial state control variable and the opening and closing state of the door as a variable (Case 3 for short).
(4) The fourth case is based on the initial state control variable, the position of the window is taken as a variable, the position of the window is adjusted (move down and move right to the middle of the laboratory), and the door opening and closing status, number of doors and number of windows are unchanged (case 4 for short).
To display the cloud image more intuitively, the following pictures will not show the data sampling points.
3.1. Case 1 Analysis
3.1.1. Wind Speed Analysis
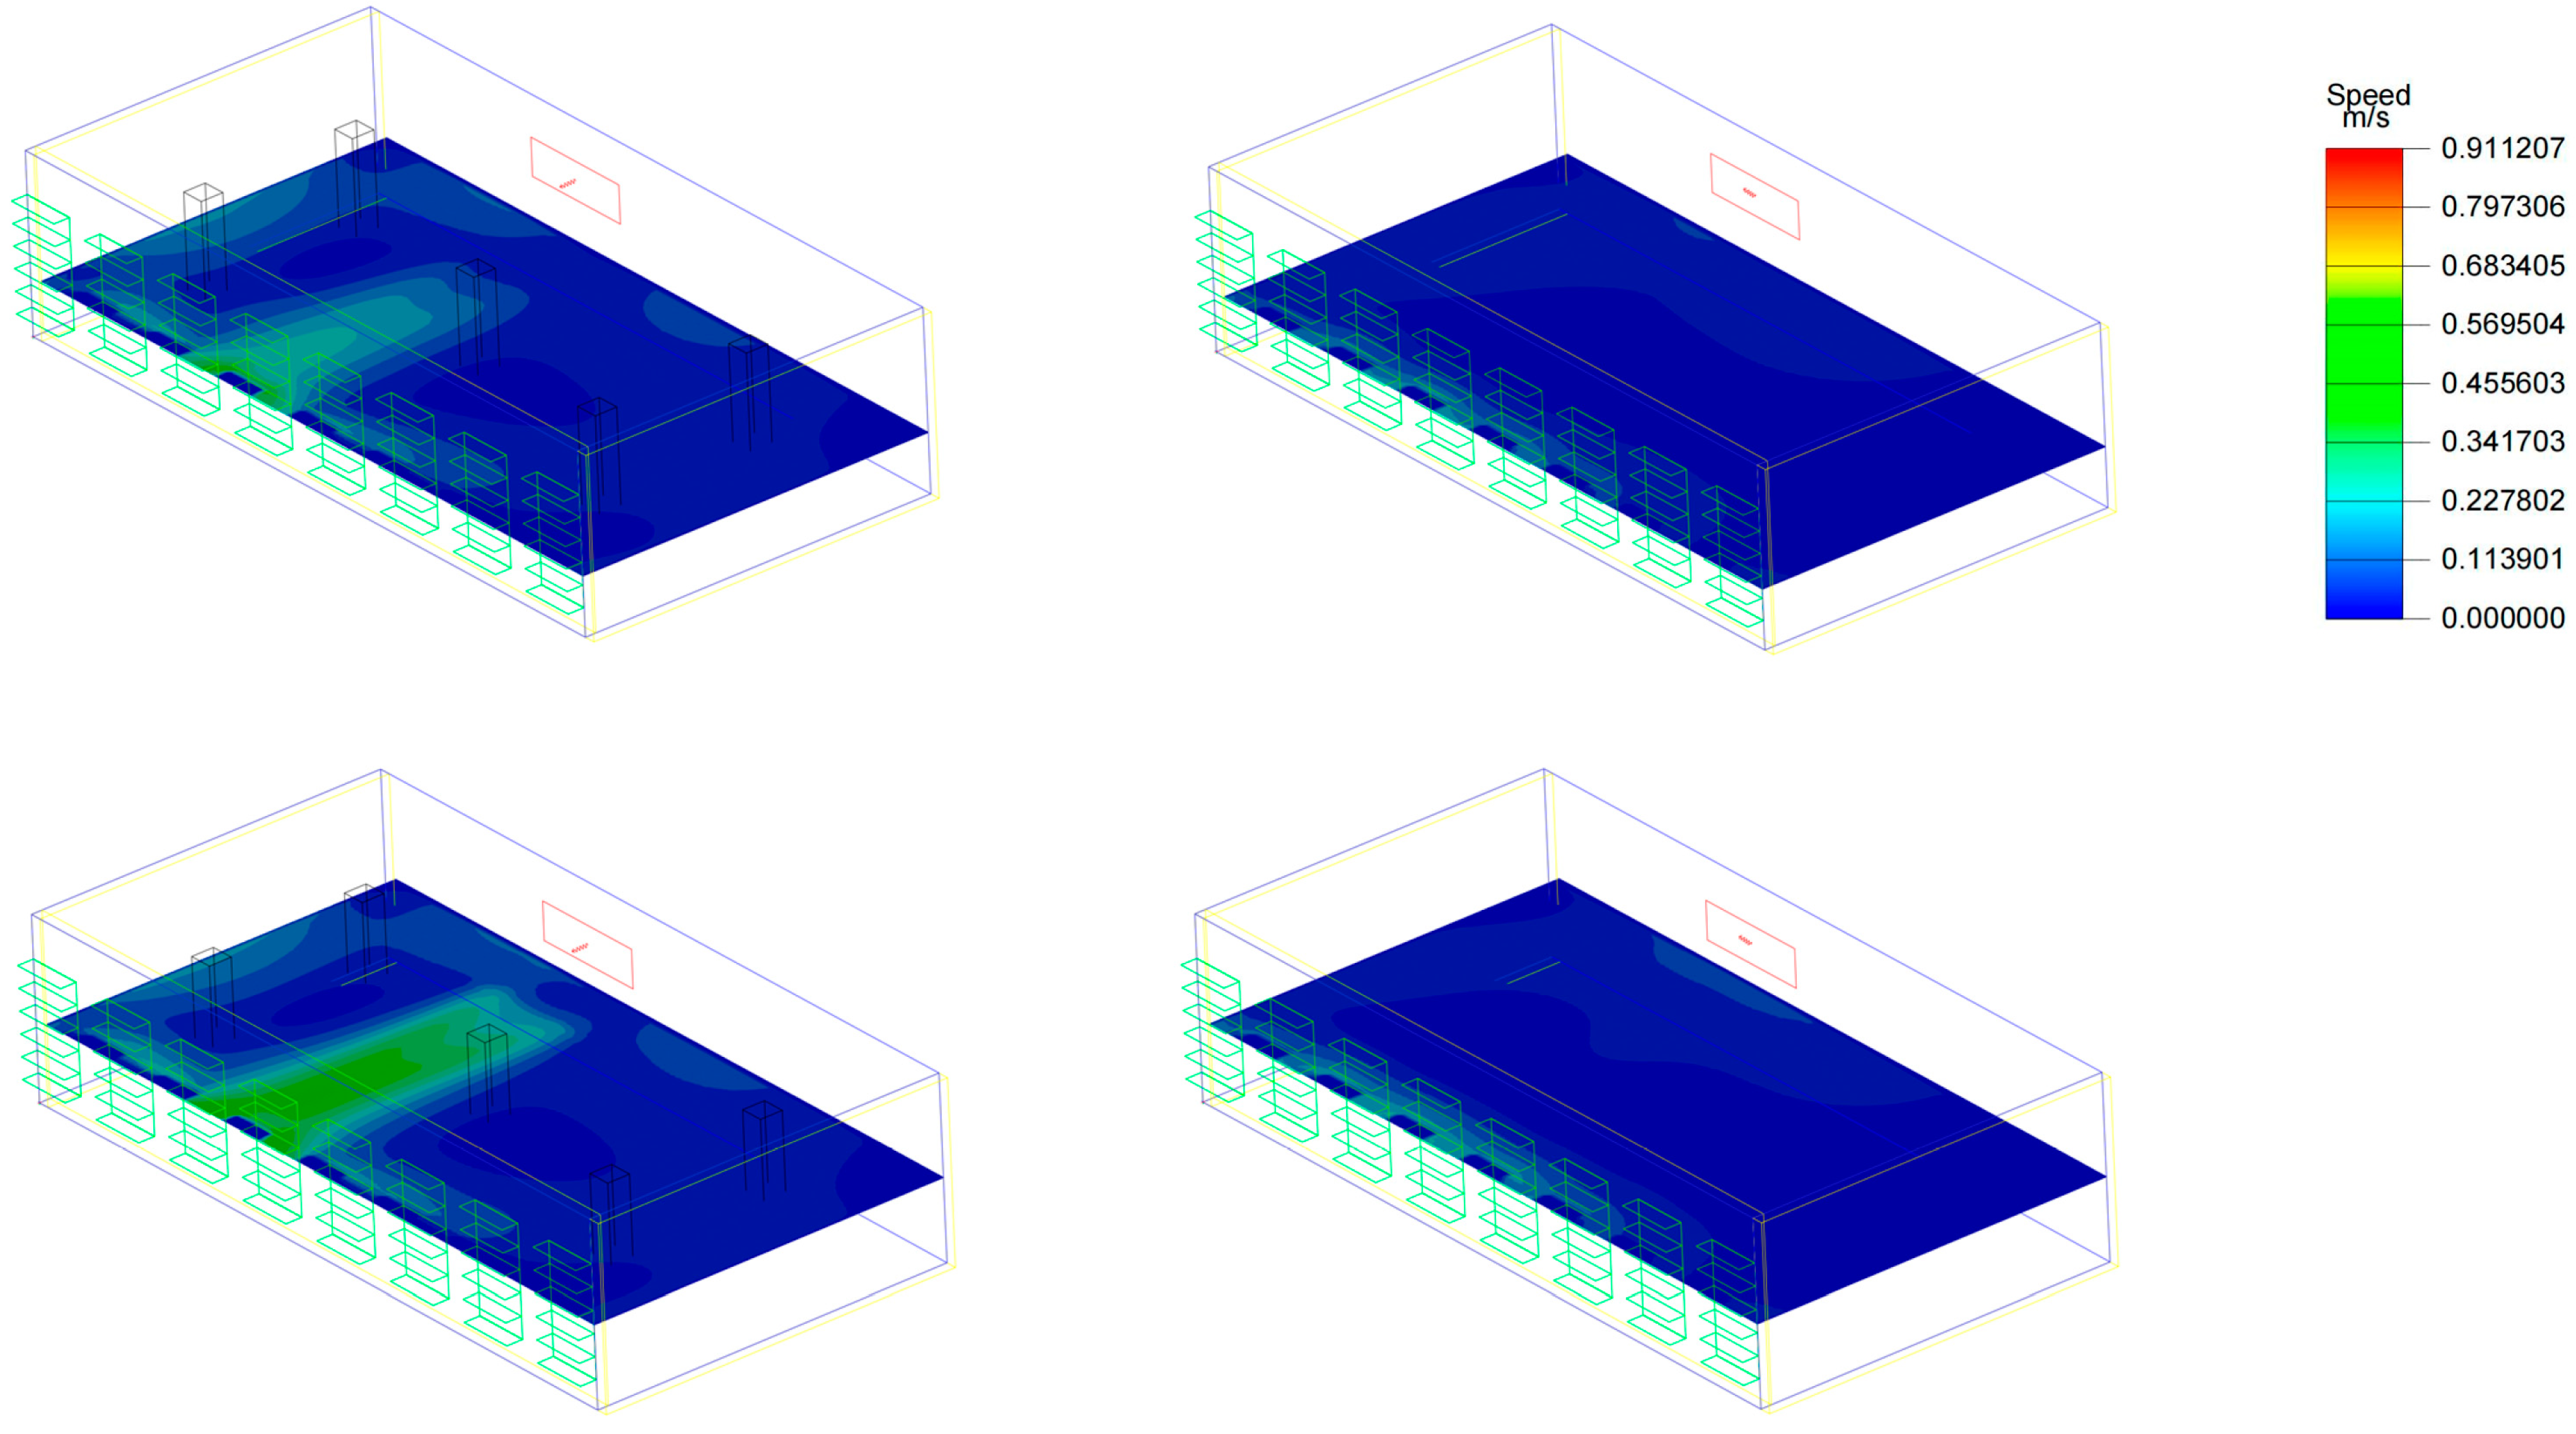
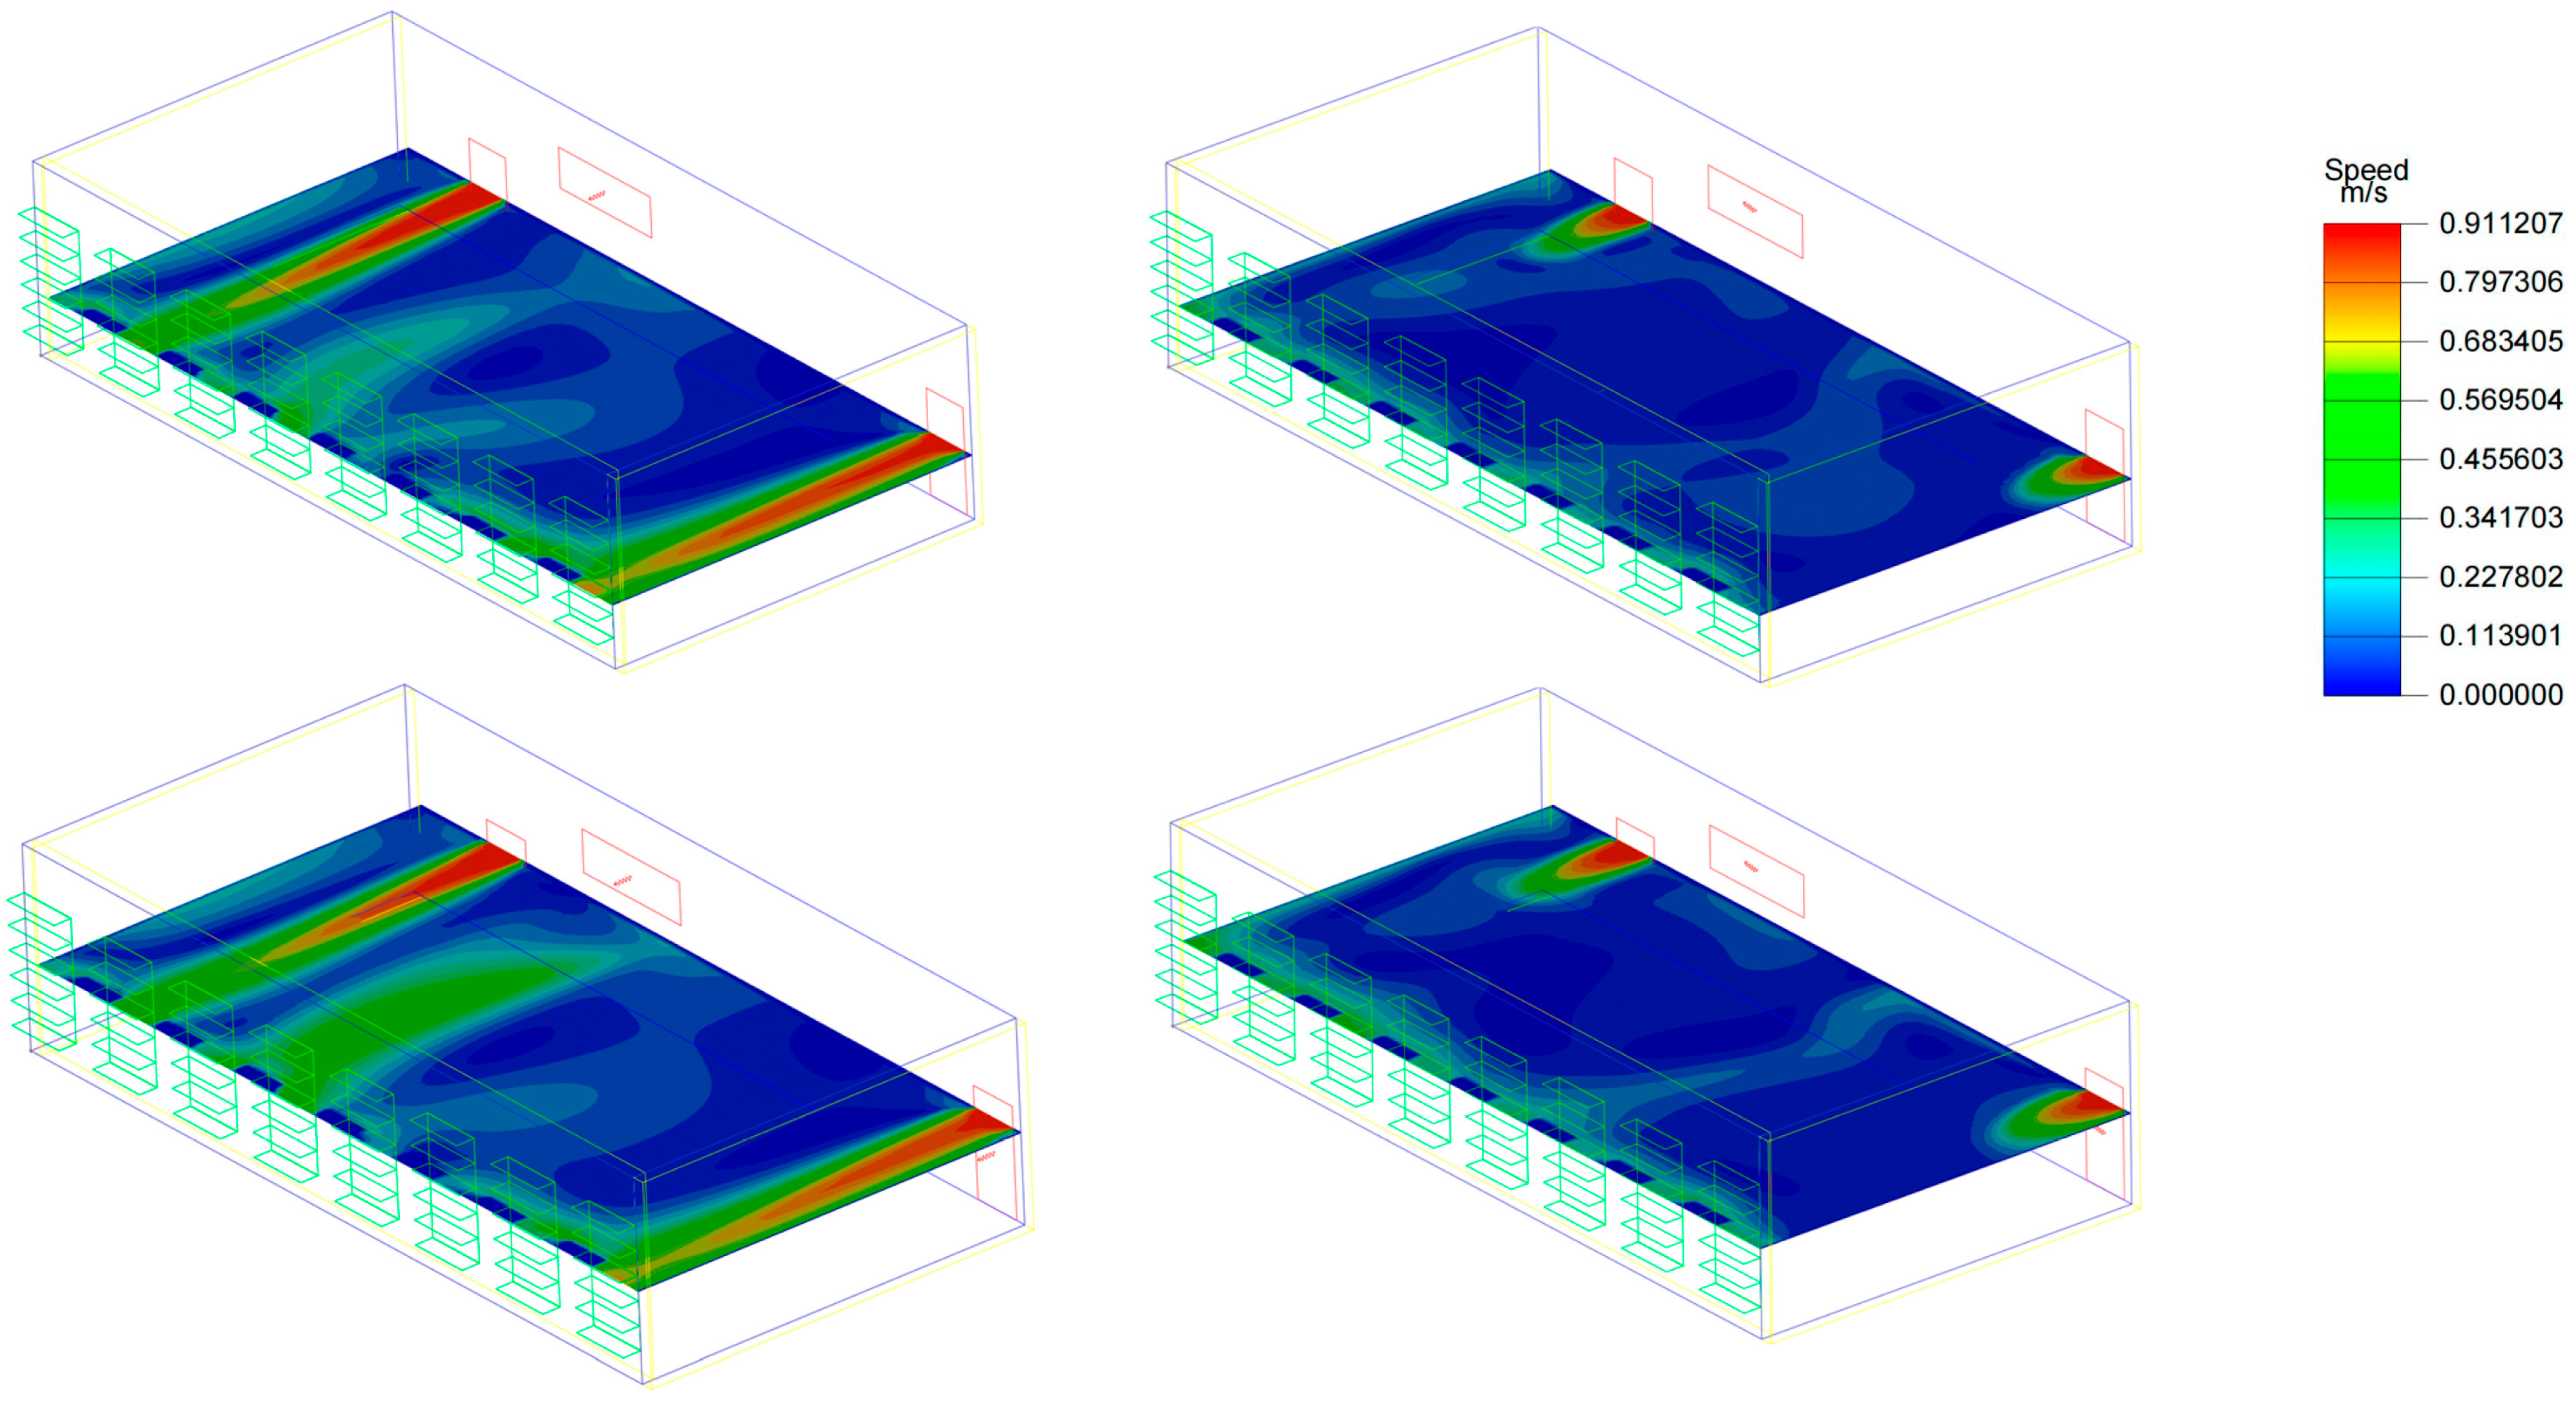
The following
Figure 8 is the wind speed nephogram under various conditions in the original state (Case 1). From the upper left figure, it can be seen that the overall indoor air velocity in the laboratory presents a trend of gradual decrease from north to south and is evenly distributed near the window in the north. The wind speed is mainly distributed in the range of 0.1~0.2 m/s. The wind speed in most areas is below 0.33 m/s. The wind speed in the room does not attenuate from the central axis to both sides. The wind speed in the middle activity area is above 0.09 m/s. The space on the east and west sides is more frequently used in daily life. The wind speed is around 0.1 m/s. The lower left is slightly better, and the upper right and lower right are poor. It can be seen that the wind speed in Case 1 is inferior.
3.1.2. Air Age Analysis
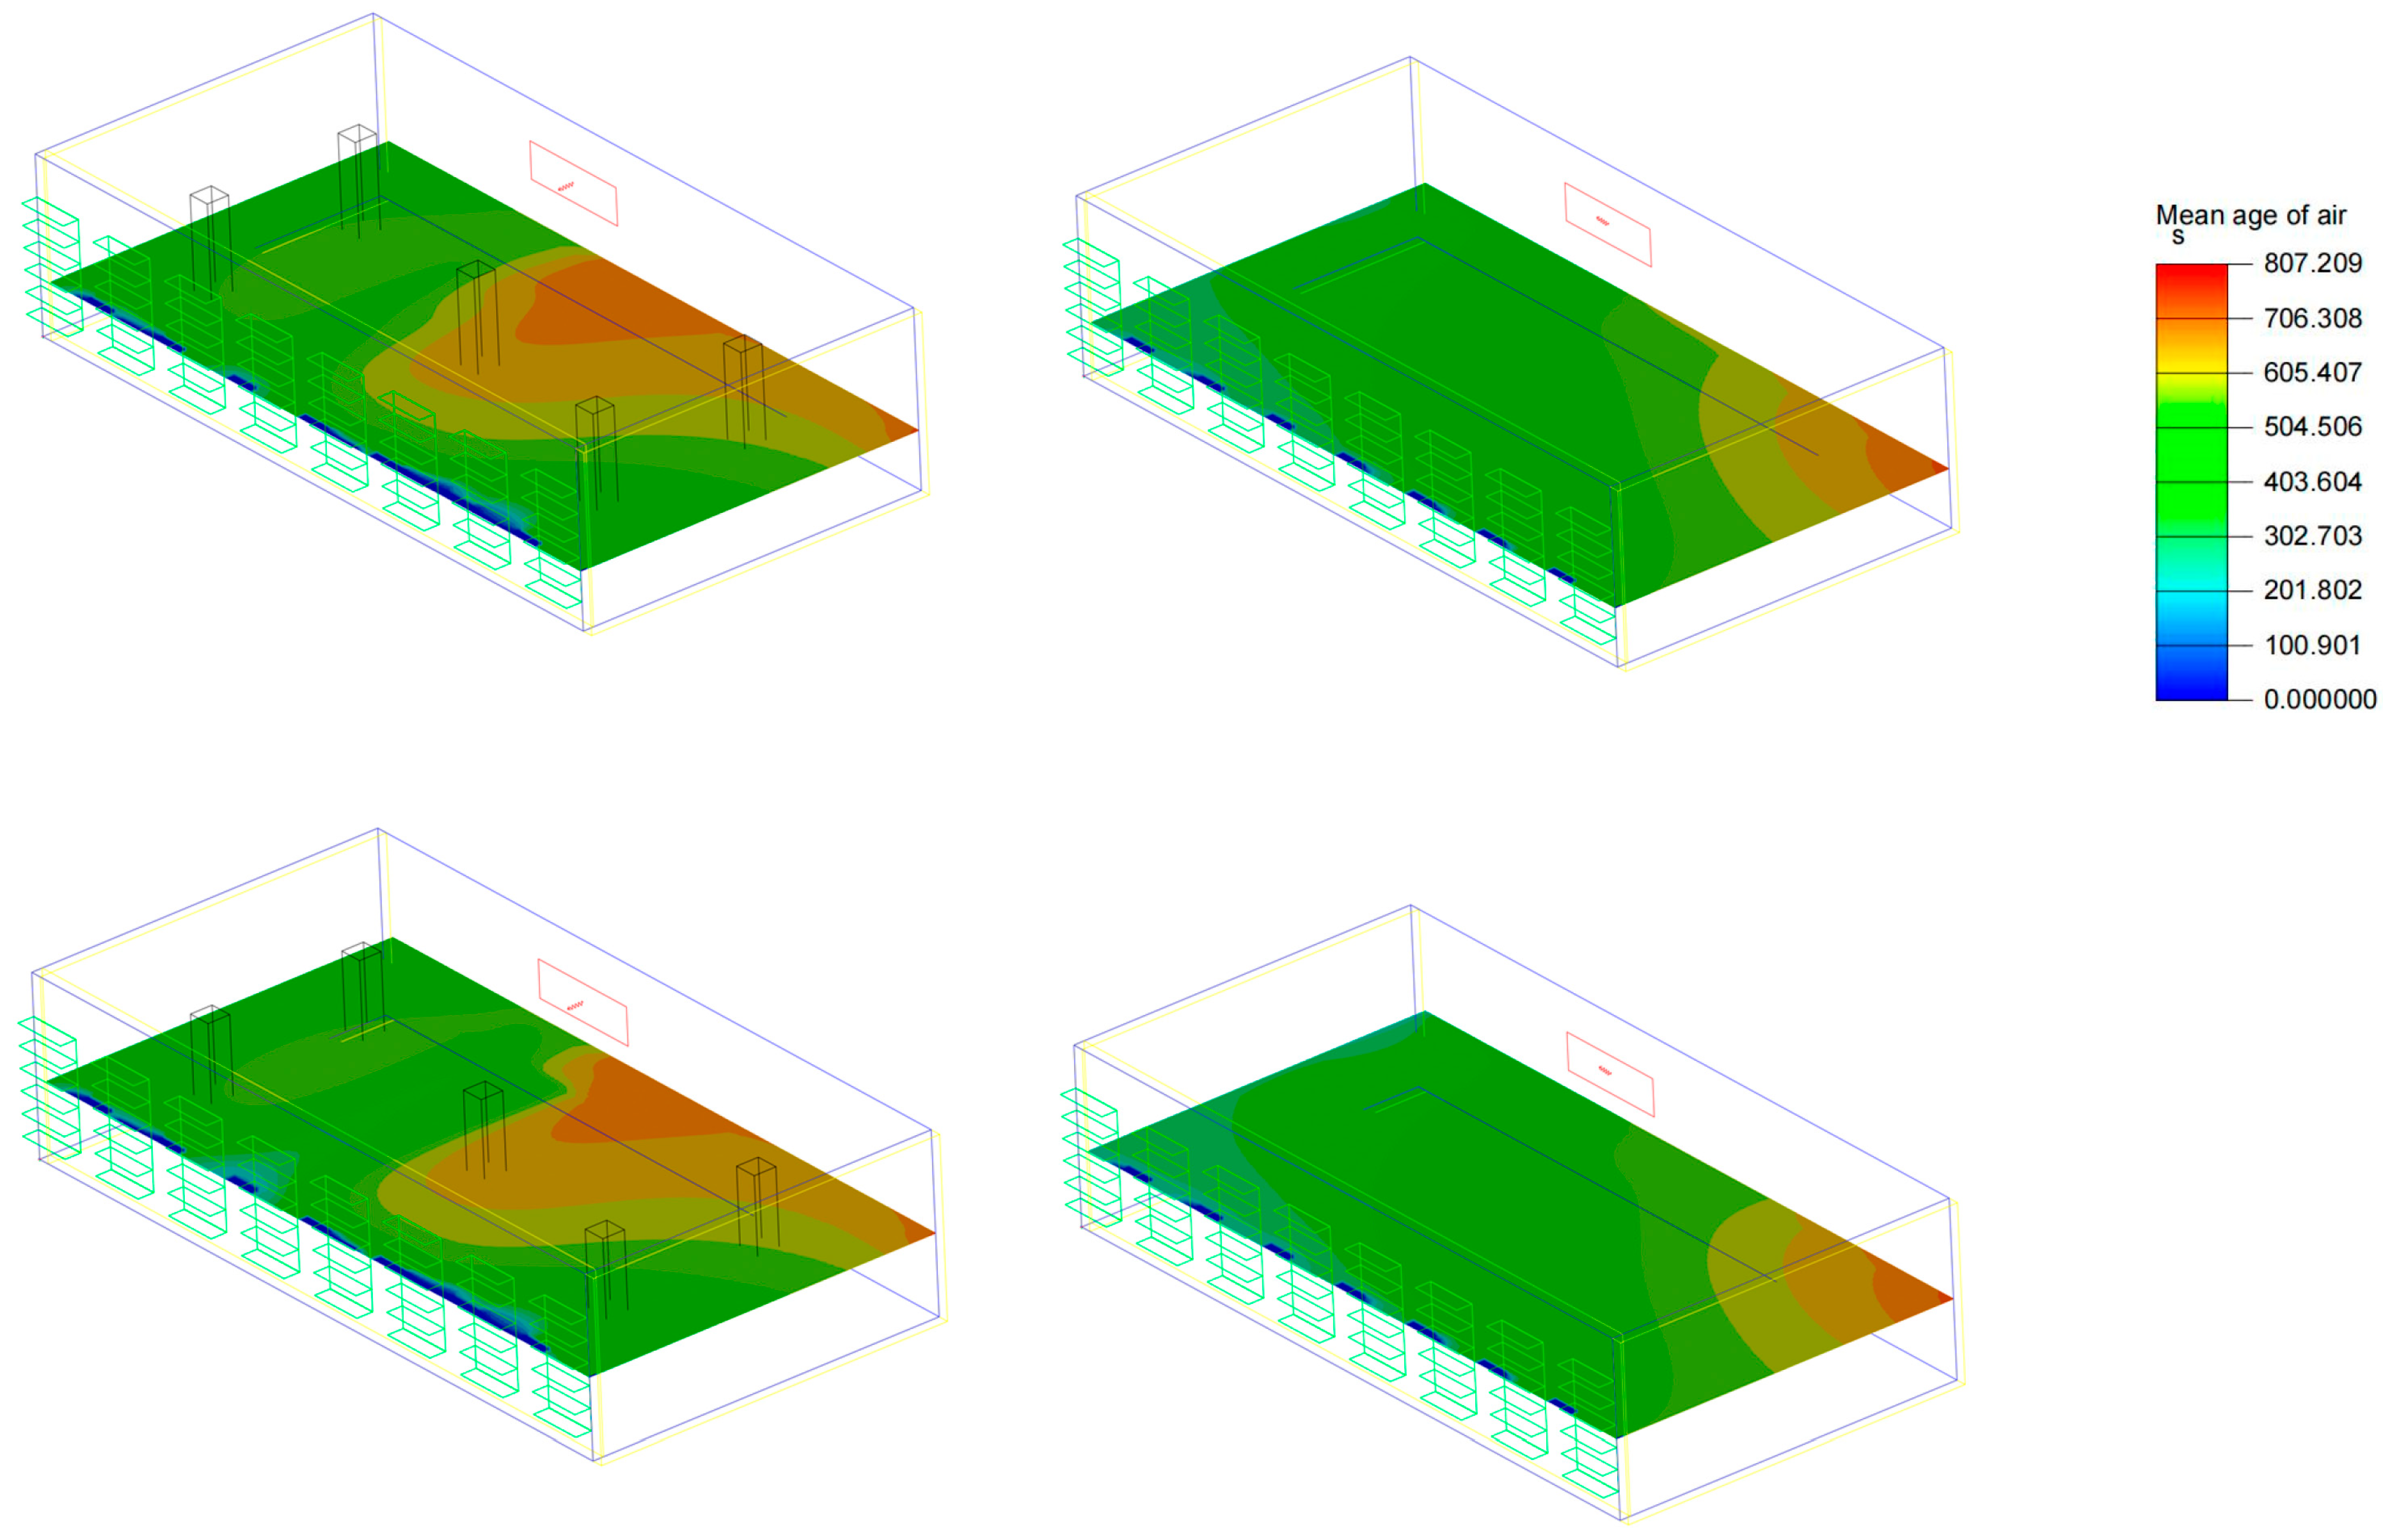
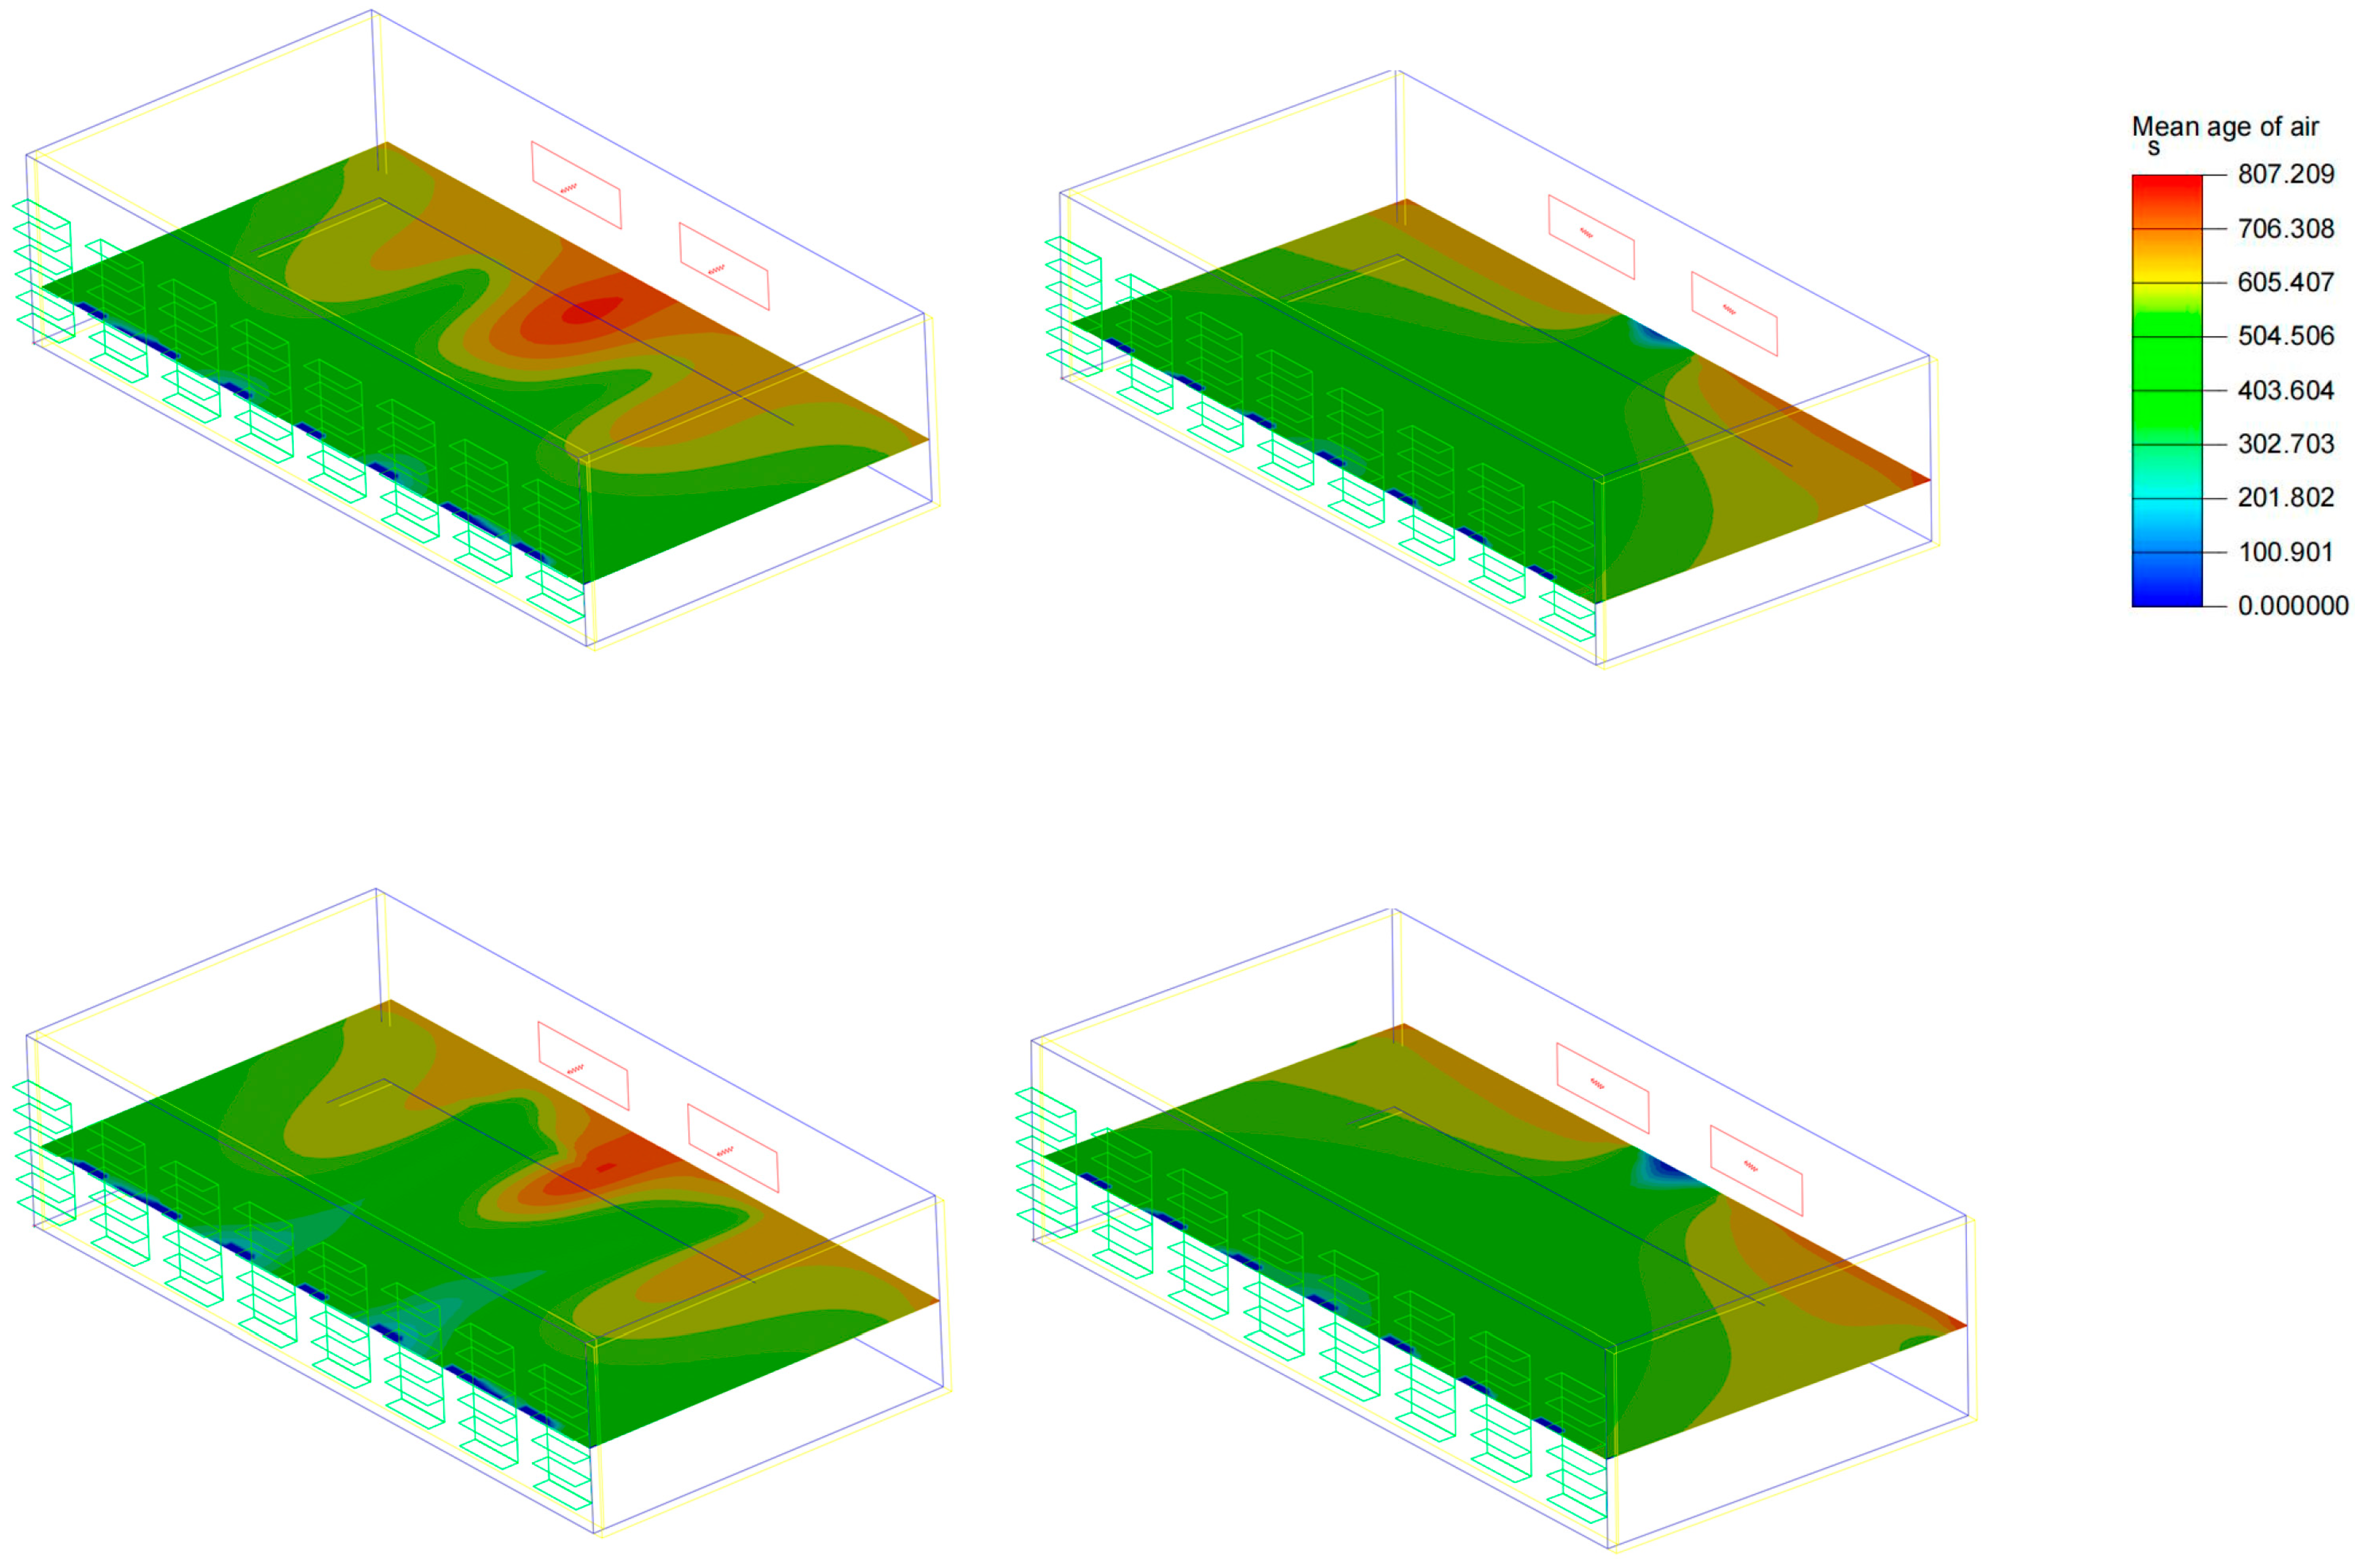
The following
Figure 9 shows the air age nephogram under various conditions in the original state (Case 1). It can be seen from the upper left figure that the air age in most areas is around 345 s, which means that the air retention time here is long, the air freshness is low, and the ventilation effect is poor. The air age in the middle of the laboratory is even as high as 530 s, indicating that the air exchange rate here is low, the air retention time is long, and the efficiency of discharging pollutants is low, leading to an increase in the probability of infection. The air age distribution in the room’s middle, east, and west sides is uneven. The air age of most areas in the west is more than 530 s, and more air flows out from the east side of the room, resulting in long air-retention time and low air quality in this part of the area. The situation in the lower left is roughly the same, while the situation in the upper right and lower right is poor. It can be seen that the air age of Case 1 is very poor.
Relying on the current natural ventilation means in the laboratory cannot meet the ventilation needs of the epidemic era, and is not conducive to the health of students.
4. Scheme Optimization Design and Comprehensive Analysis
4.1. Case 2 Analysis
4.1.1. Wind Speed Analysis
The following
Figure 10 shows the wind speed program under various conditions in Case 2. It can be seen from the upper left figure that after adding a high window, the overall indoor air velocity of the laboratory has improved to some extent, but the area is limited to the south wall opposite the high window. The improved laboratory wind speed ranges from 0.25 m/s to 0.35 m/s. The improvement is better in the lower left and worse in the upper right and lower right. To sum up, the Case 2 wind speed optimization scheme has achieved certain results, and human comfort has been improved to a certain extent.
4.1.2. Air Age Analysis
The following
Figure 11 shows the air age nephogram under various conditions in Case 2. It can be seen from the upper left figure that after adding a high window, the air age value decreases significantly, while the air flow rate below the high window is lower, and the air quality is poor. The hollow air age range in the figure is about 115–275 s, the improvement in the lower left is flat, and the upper right and lower right are poor. To sum up, the Case 2 air age optimization scheme has achieved relatively obvious results, and the air quality in the middle of the laboratory has been greatly improved.
4.2. Case 3 Analysis
4.2.1. Wind Speed Analysis
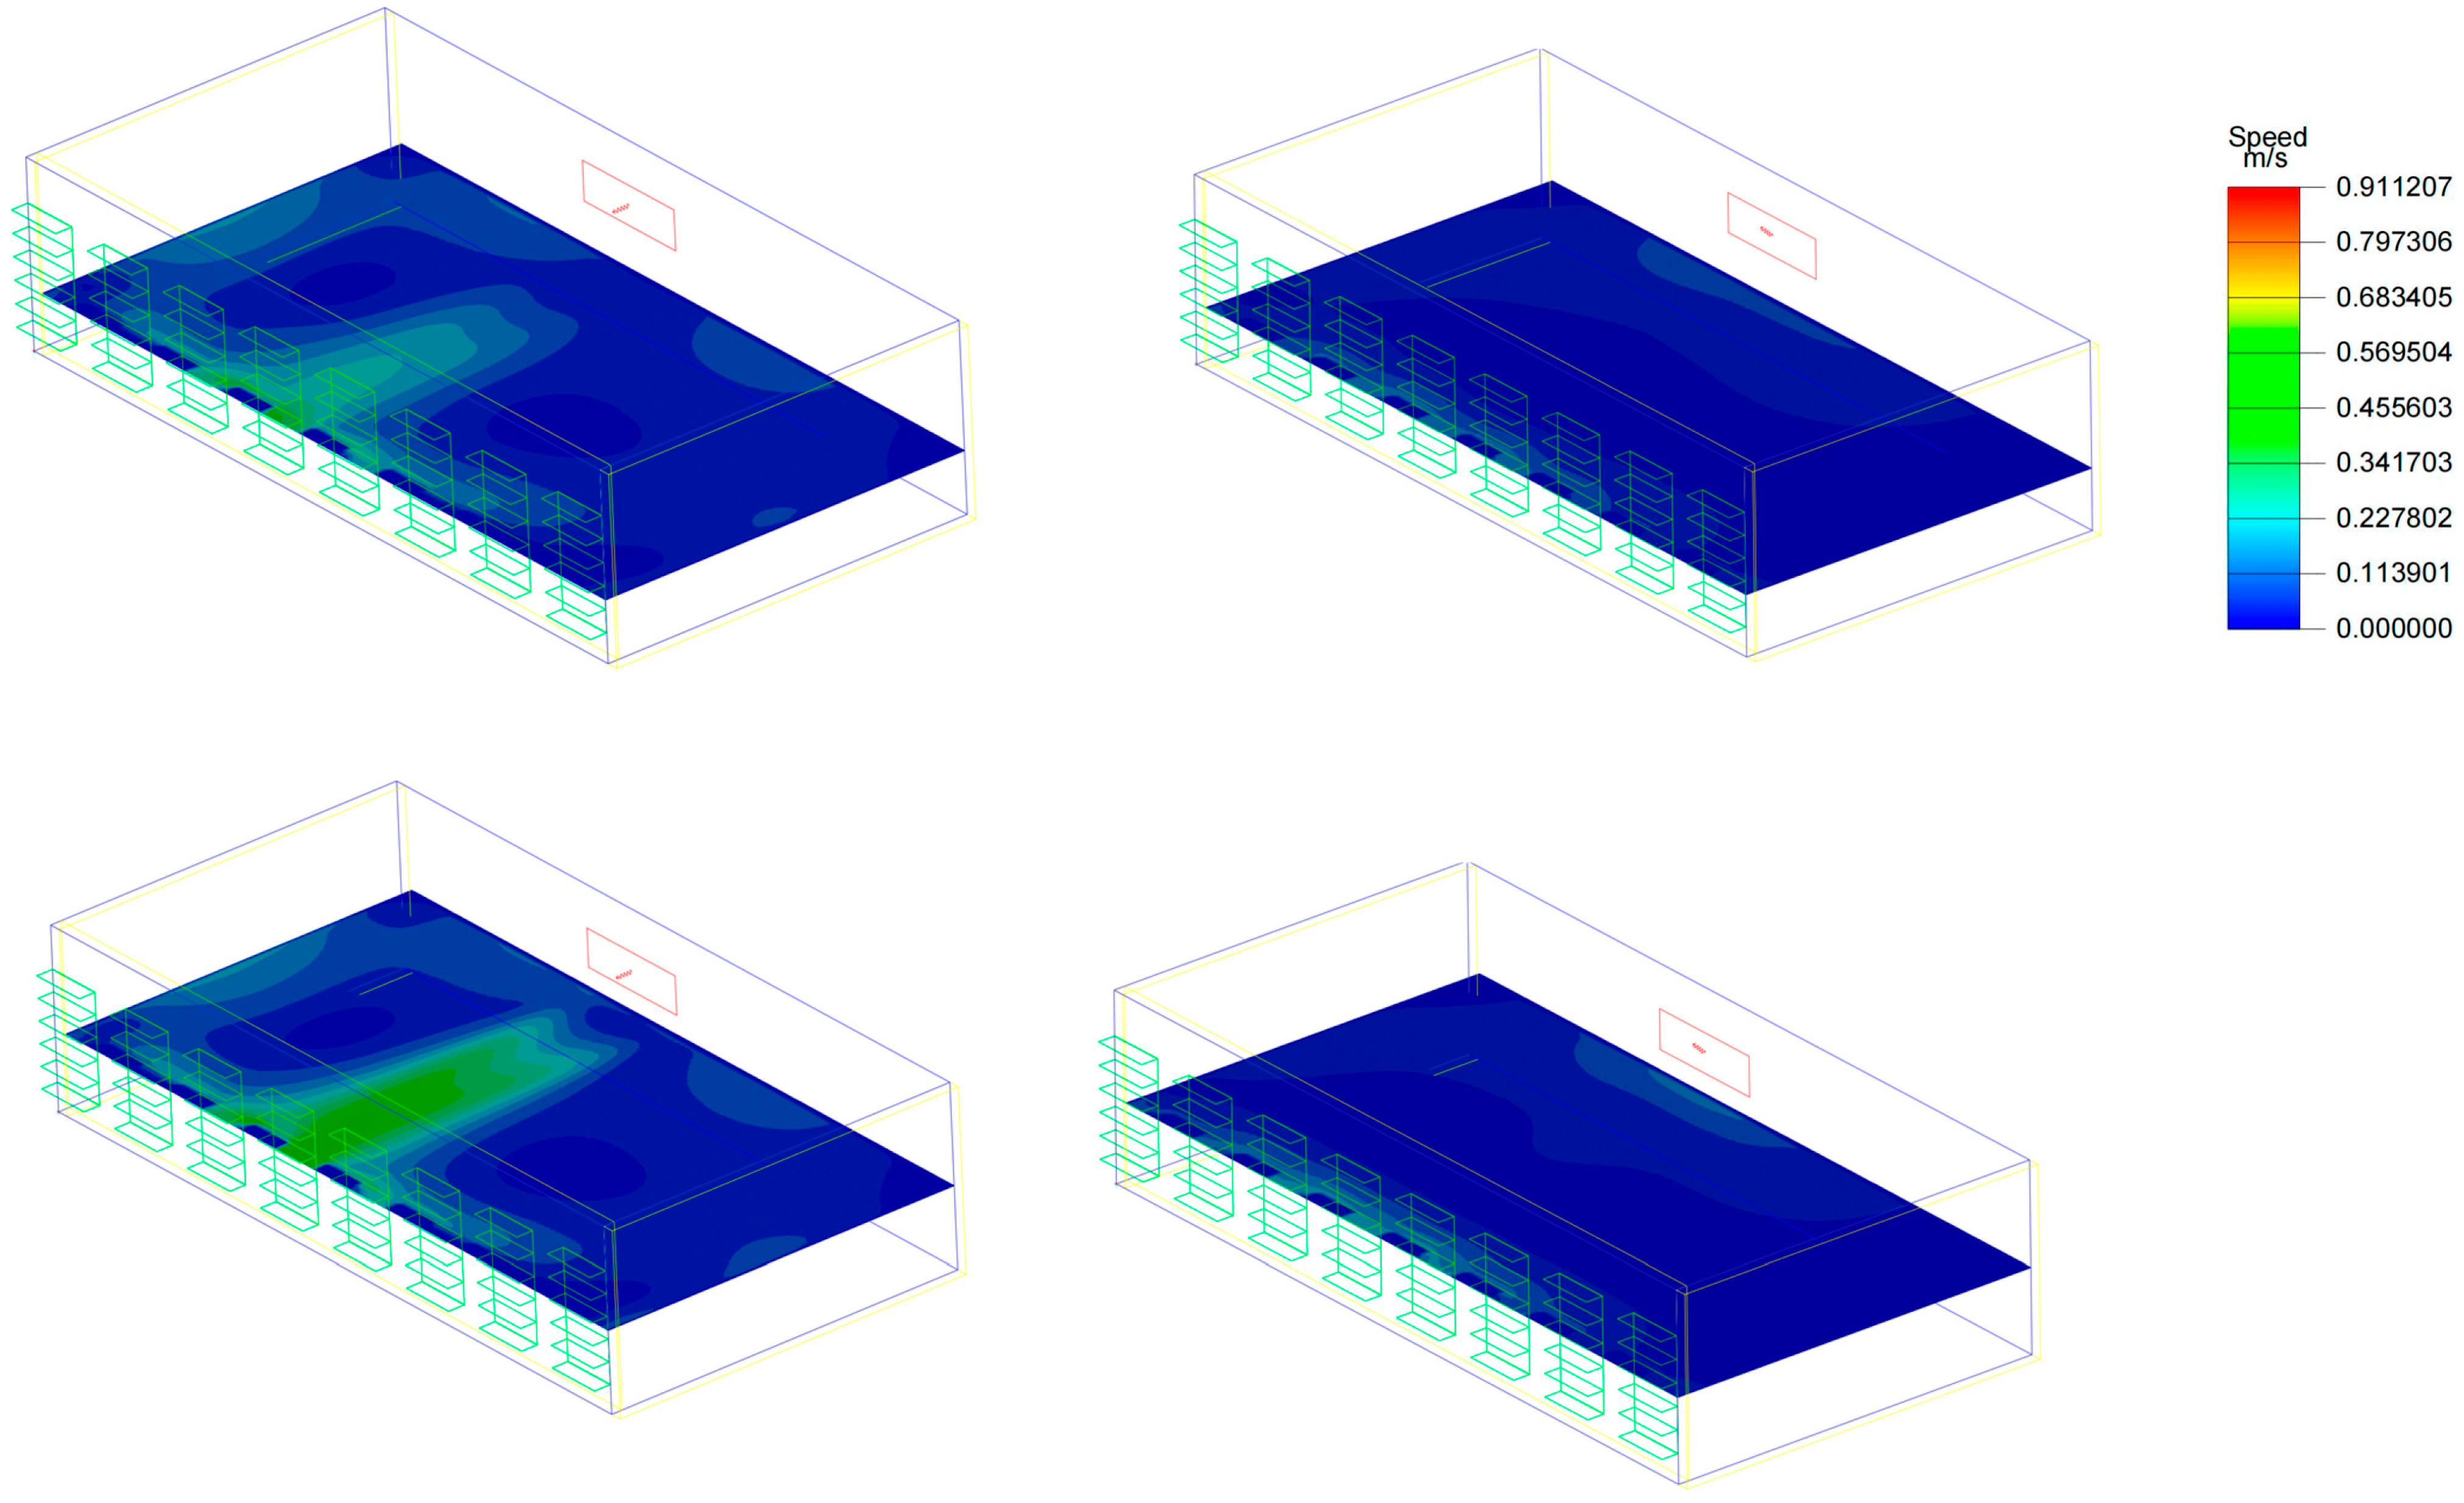
The following
Figure 12 shows the wind speed nephogram under various conditions in Case 3. It can be seen from the upper left figure that after opening the two doors, the overall indoor air velocity of the laboratory has been greatly improved. Although the wind velocity at the two doors is as high as 0.9 m/s, the wind velocity distribution inside the laboratory is relatively uniform, with a basic distribution of 0.15–0.3 m/s. The improvement in the lower left figure is flat, while the upper right and lower right figures are poor. To sum up, the Case 3 wind speed optimization scheme has achieved certain results, and only the students at the two doors can feel a certain sense of wind blowing, while the rest feel more comfortable. The human comfort has been greatly improved.
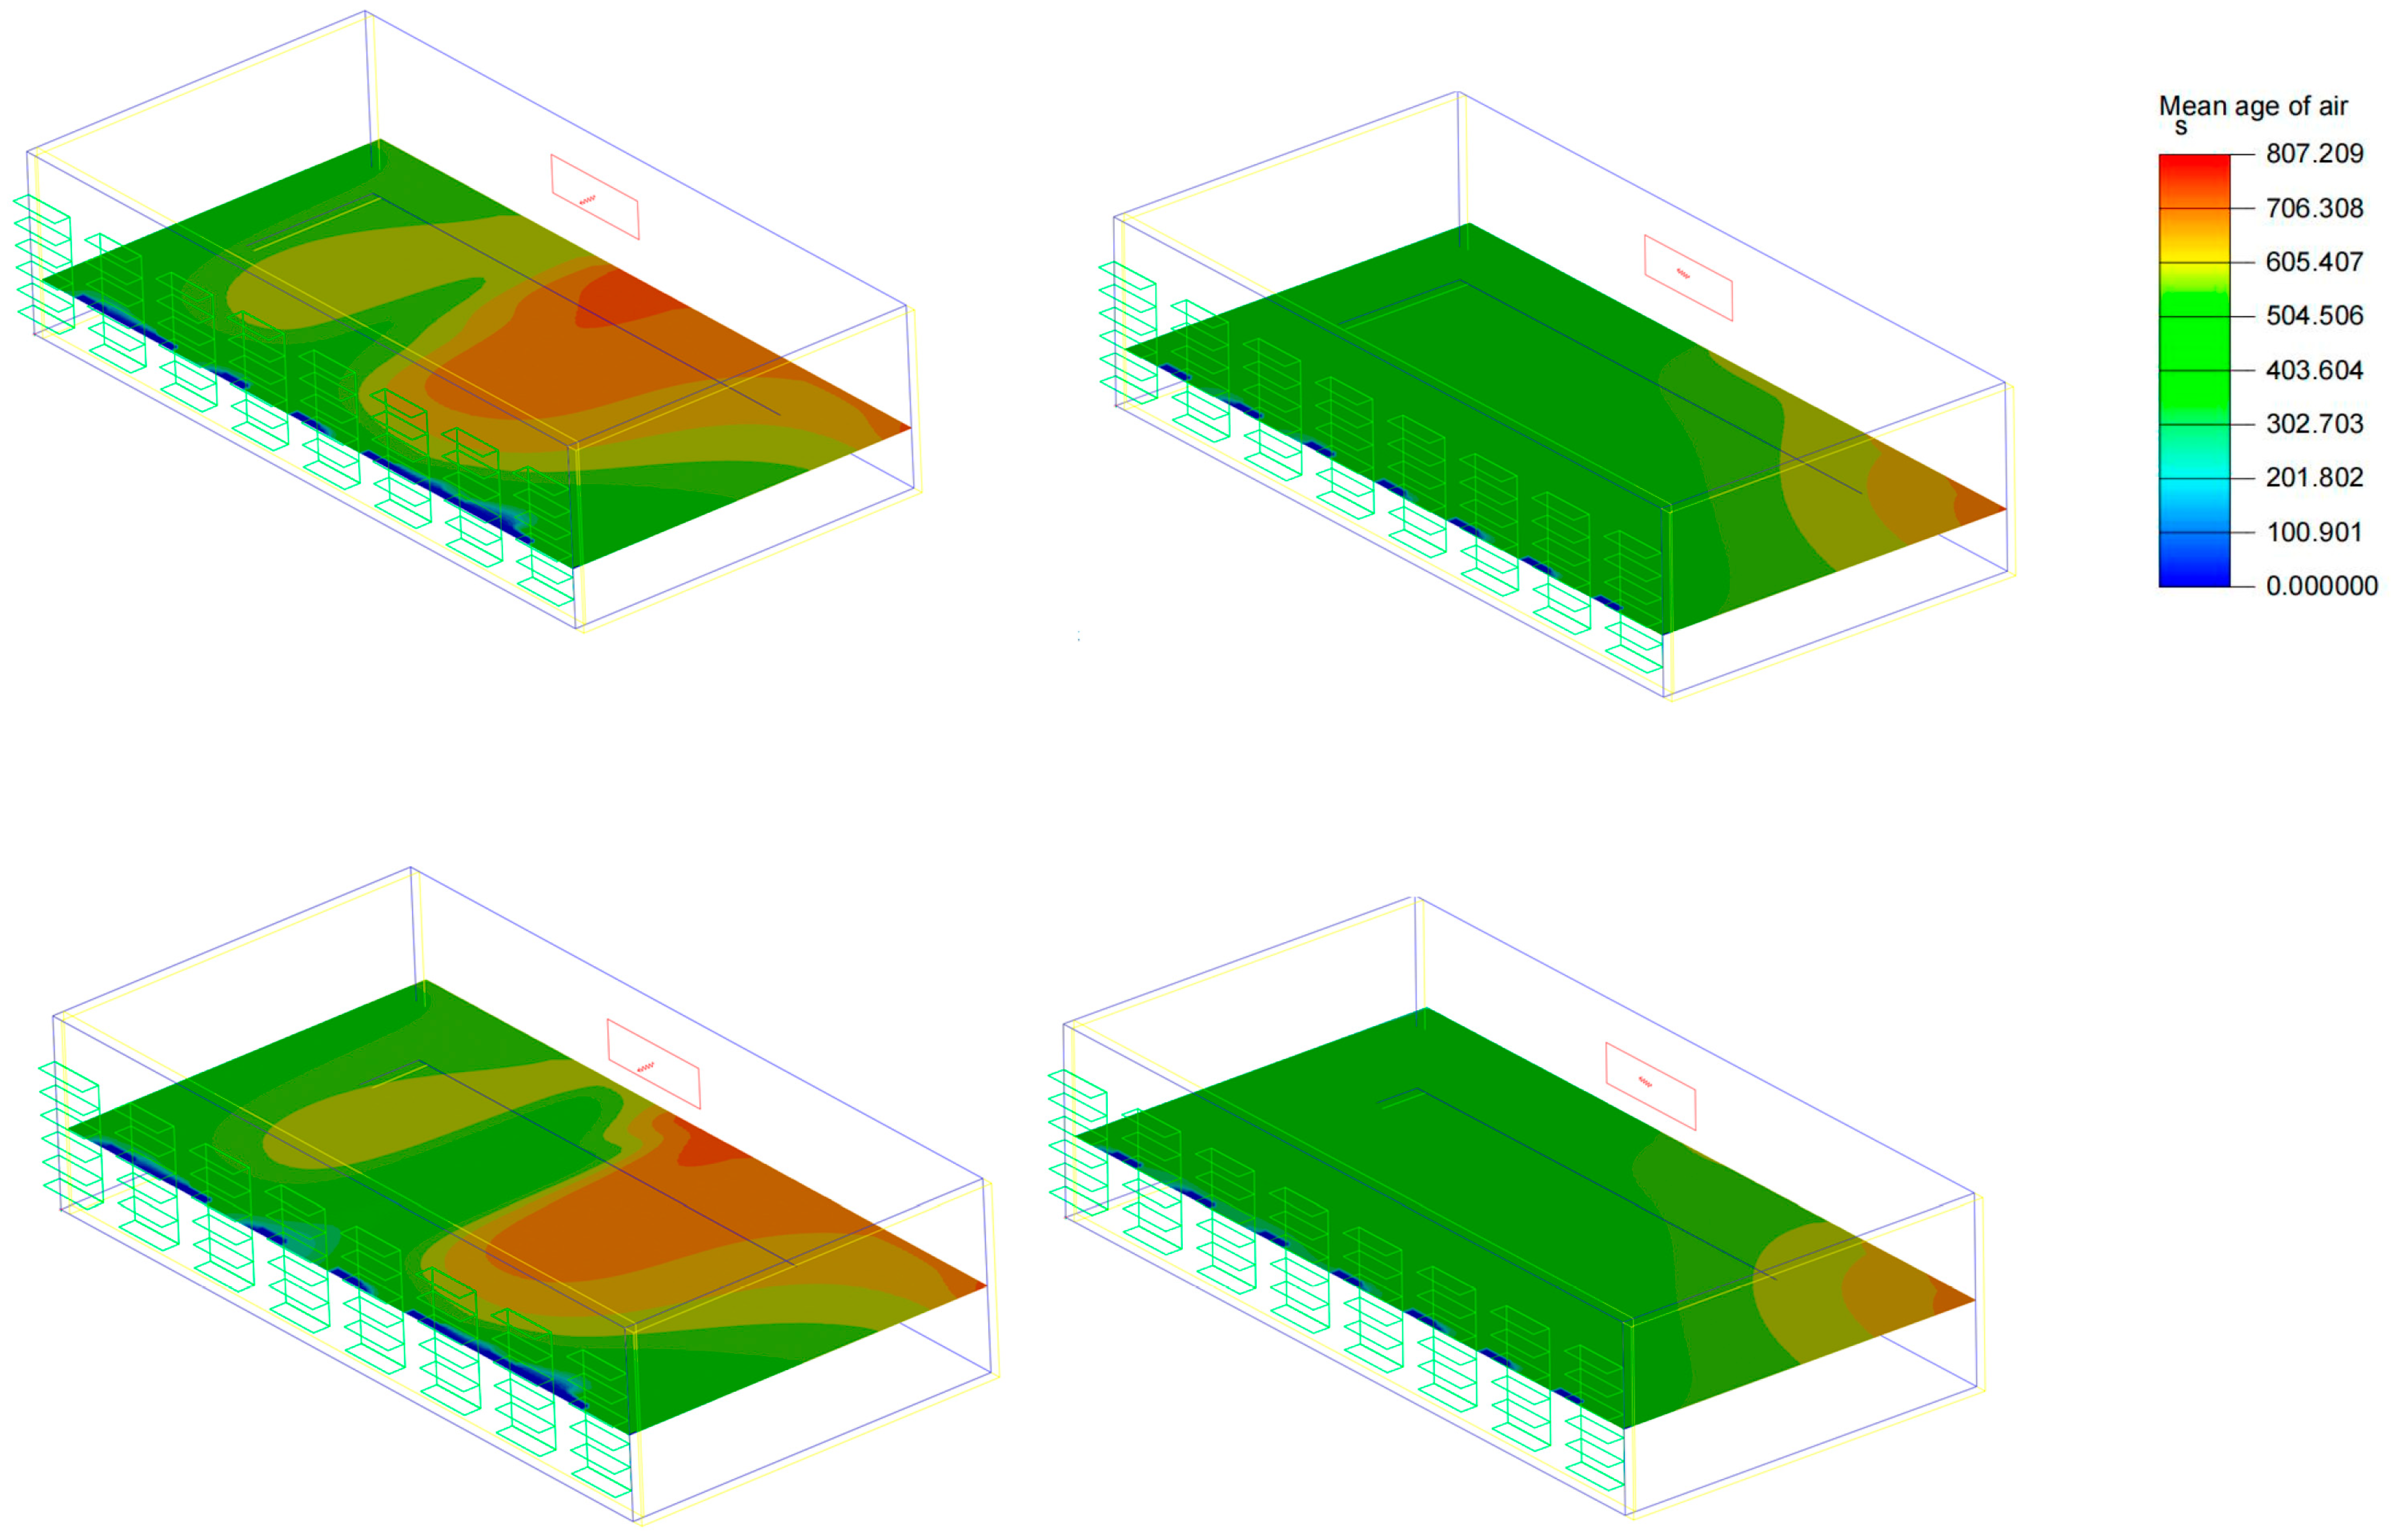
4.2.2. Air Age Analysis
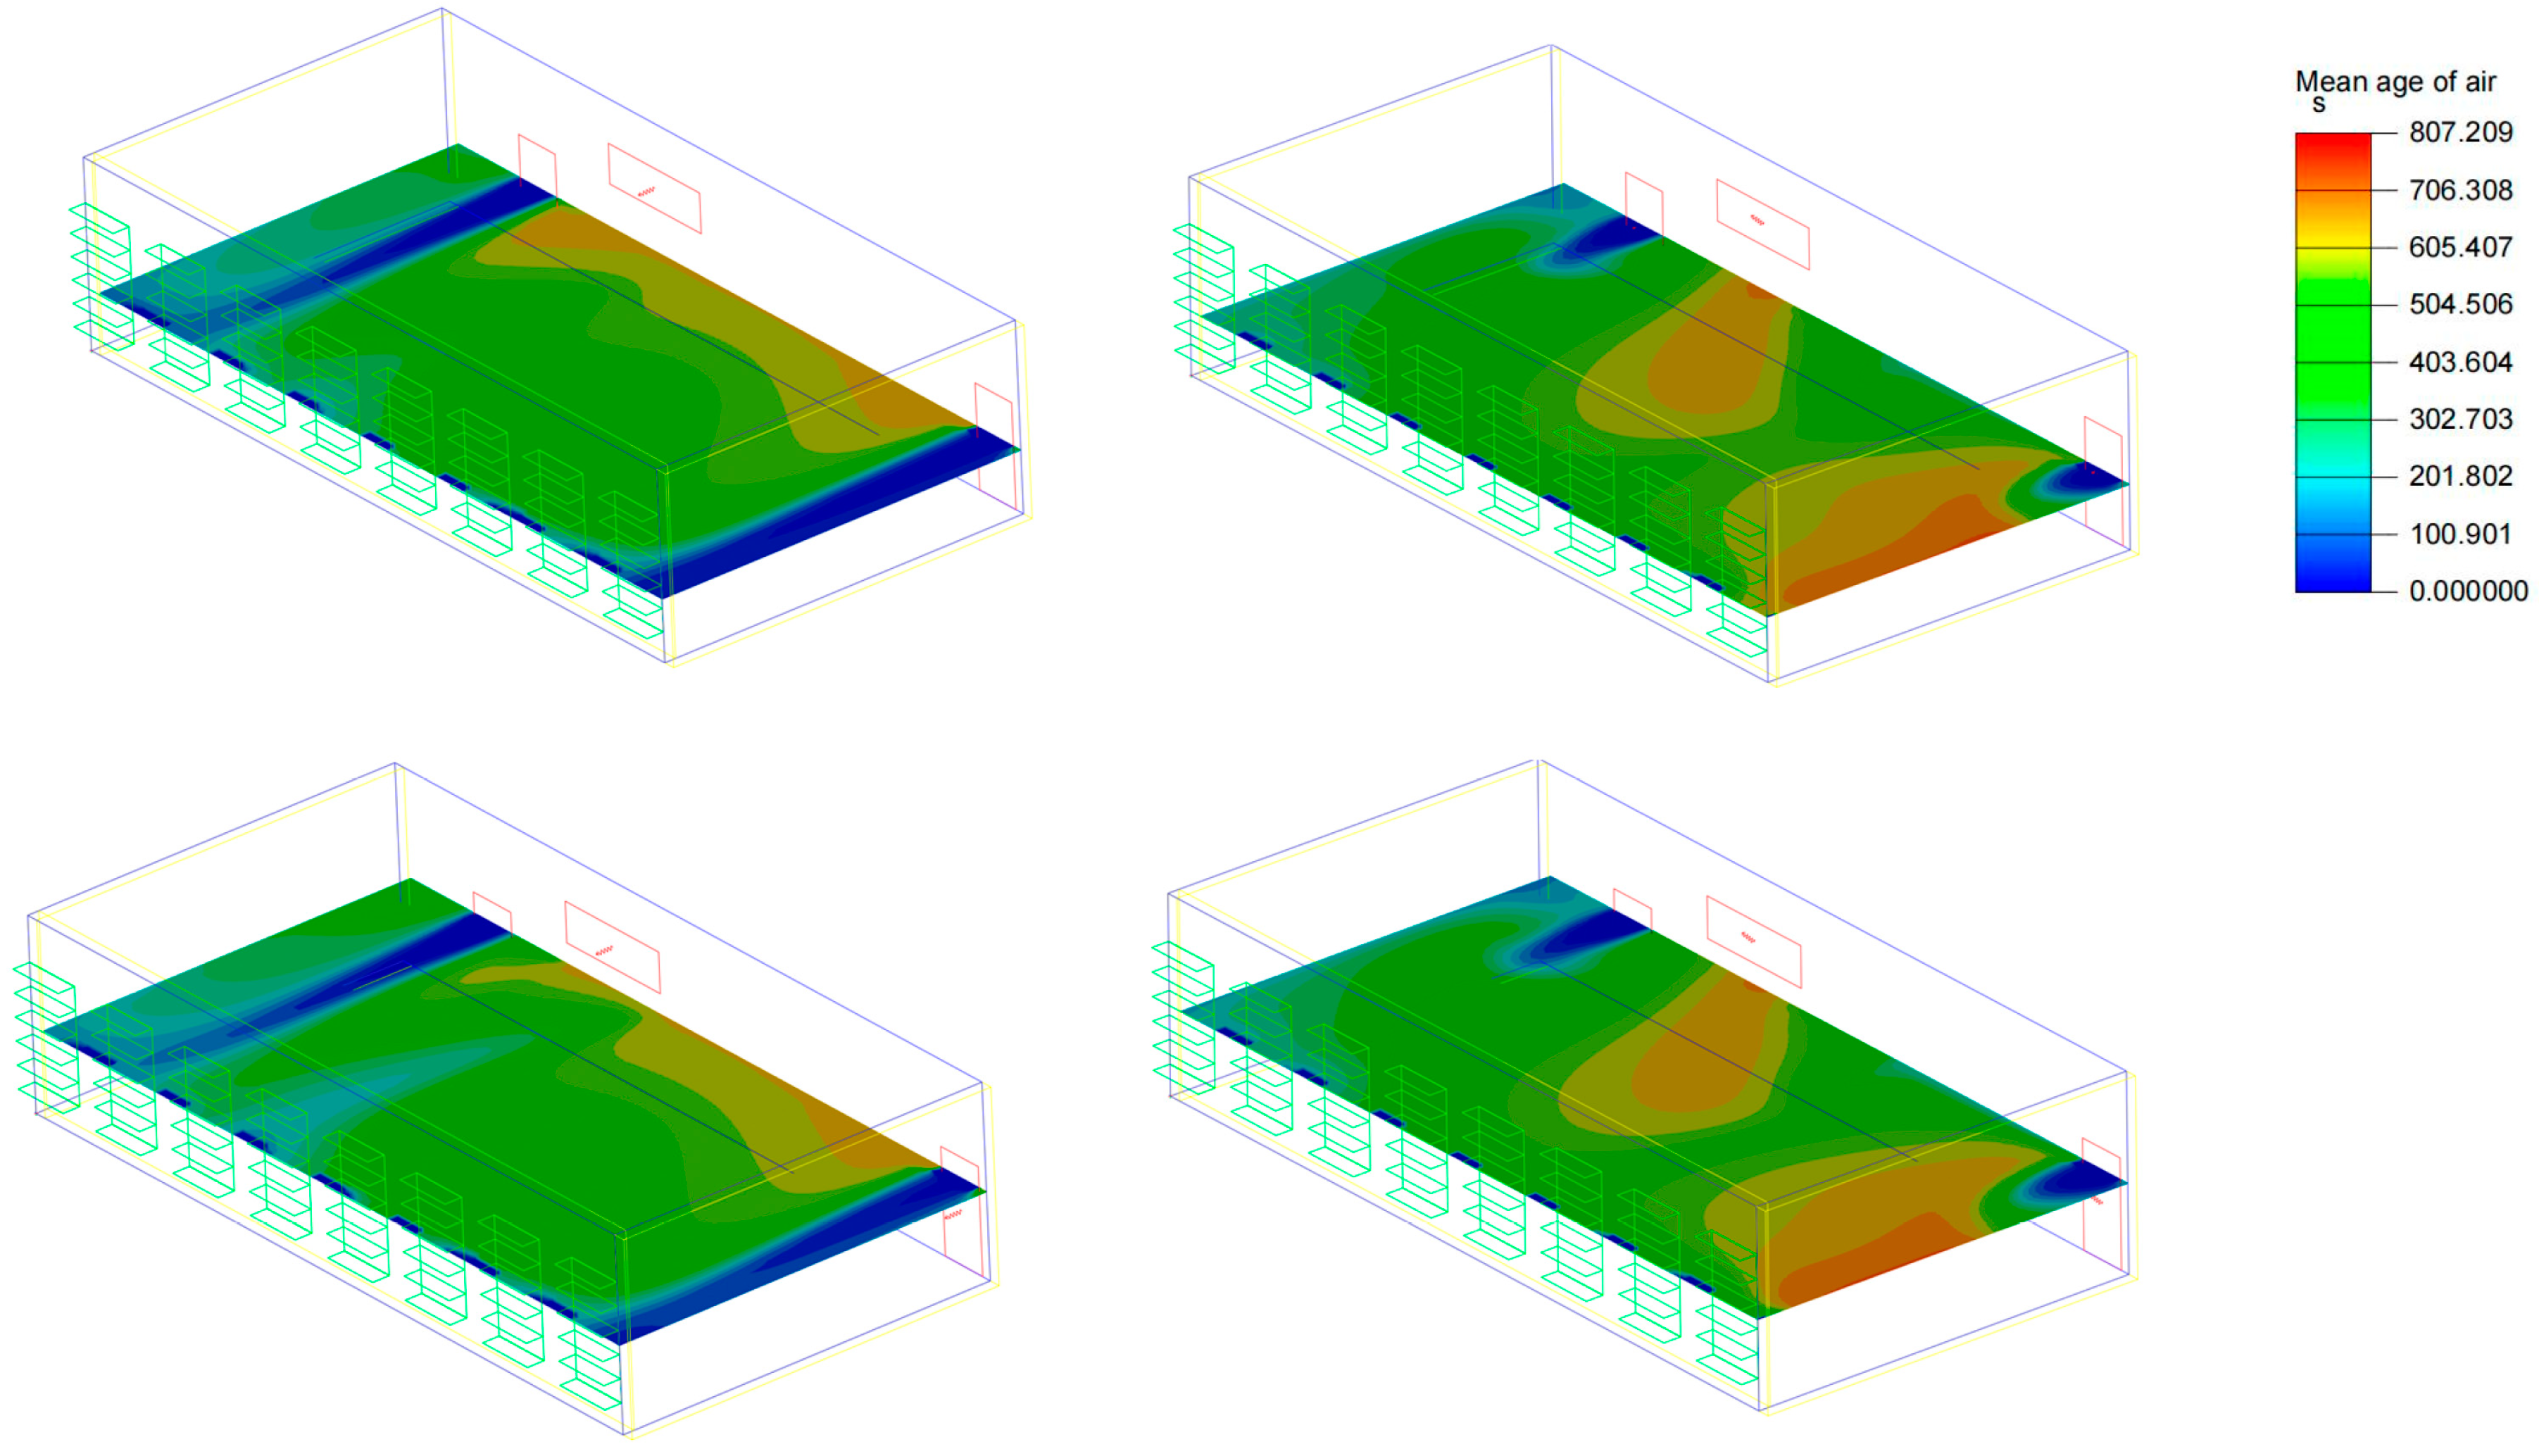
The following
Figure 13 shows the air age nephogram under various conditions in Case 3. It can be seen from the upper left figure that after opening the two doors, the overall gas exchange rate of the laboratory has been greatly improved. The air age at the two doors is as low as 5 s, and the air age distribution inside the laboratory is relatively uniform, distributed between 100 s and 180 s. The improvement in the lower left figure is flat, while the improvement in the upper right and lower right figure is poor. To sum up, the Case 3 air age optimization scheme has achieved relatively obvious results. After improvement, the laboratory air retention time is short, the air freshness is high, the ventilation effect is good, the efficiency of discharging pollutants is high, and the probability of infection is reduced, which meets the ventilation needs of the epidemic era and is beneficial to the health of students.
4.3. Case 4 Analysis
4.3.1. Wind Speed Analysis
The following
Figure 14 shows the wind speed nephogram under various conditions in Case 4. It can be seen from the upper left figure that the wind speed in some areas of the laboratory has been improved to some extent after the high window is moved to the middle and lower parts. Because the high window is moved down, the wind speed in the middle of the laboratory is increased, and the wind speed on both sides of the laboratory is symmetrical, but there is a certain decrease. The basic distribution is 0.05–0.1 m/s. The improvement in the lower left figure is better, while the improvement in the upper right and lower right figure is worse. To sum up, the Case 4 wind speed optimization scheme has achieved some results, but only students in the middle of the laboratory feel comfortable.
4.3.2. Air Age Analysis
The following
Figure 15 shows the air age nephogram of various conditions in Case 4. It can be seen from the upper left figure that after moving the high window to the middle and lower part, the local air exchange rate of the laboratory has slightly improved, while the overall gas exchange rate has not significantly improved. The improvement in the lower left figure is the same, while the improvement in the upper right and lower right figures is poor. To sum up, the case 4 air age optimization scheme has not achieved significant results.
4.4. Verify the Test Results
4.4.1. Theoretical Verification of Wind Environment
To test the proposed wind environment model, in situ, measurements were used as a comparative prototype. The in situ measurements were carried out in 1997 in Chengdu, China, by two institutions, the Chengdu Institute of Meteorology and the Institute of Atmospheric Physics of the Chinese Academy of Sciences [
19]. The same measurements were also used to verify the accuracy of the wind environment model in previous studies.
4.4.2. Measured Verification
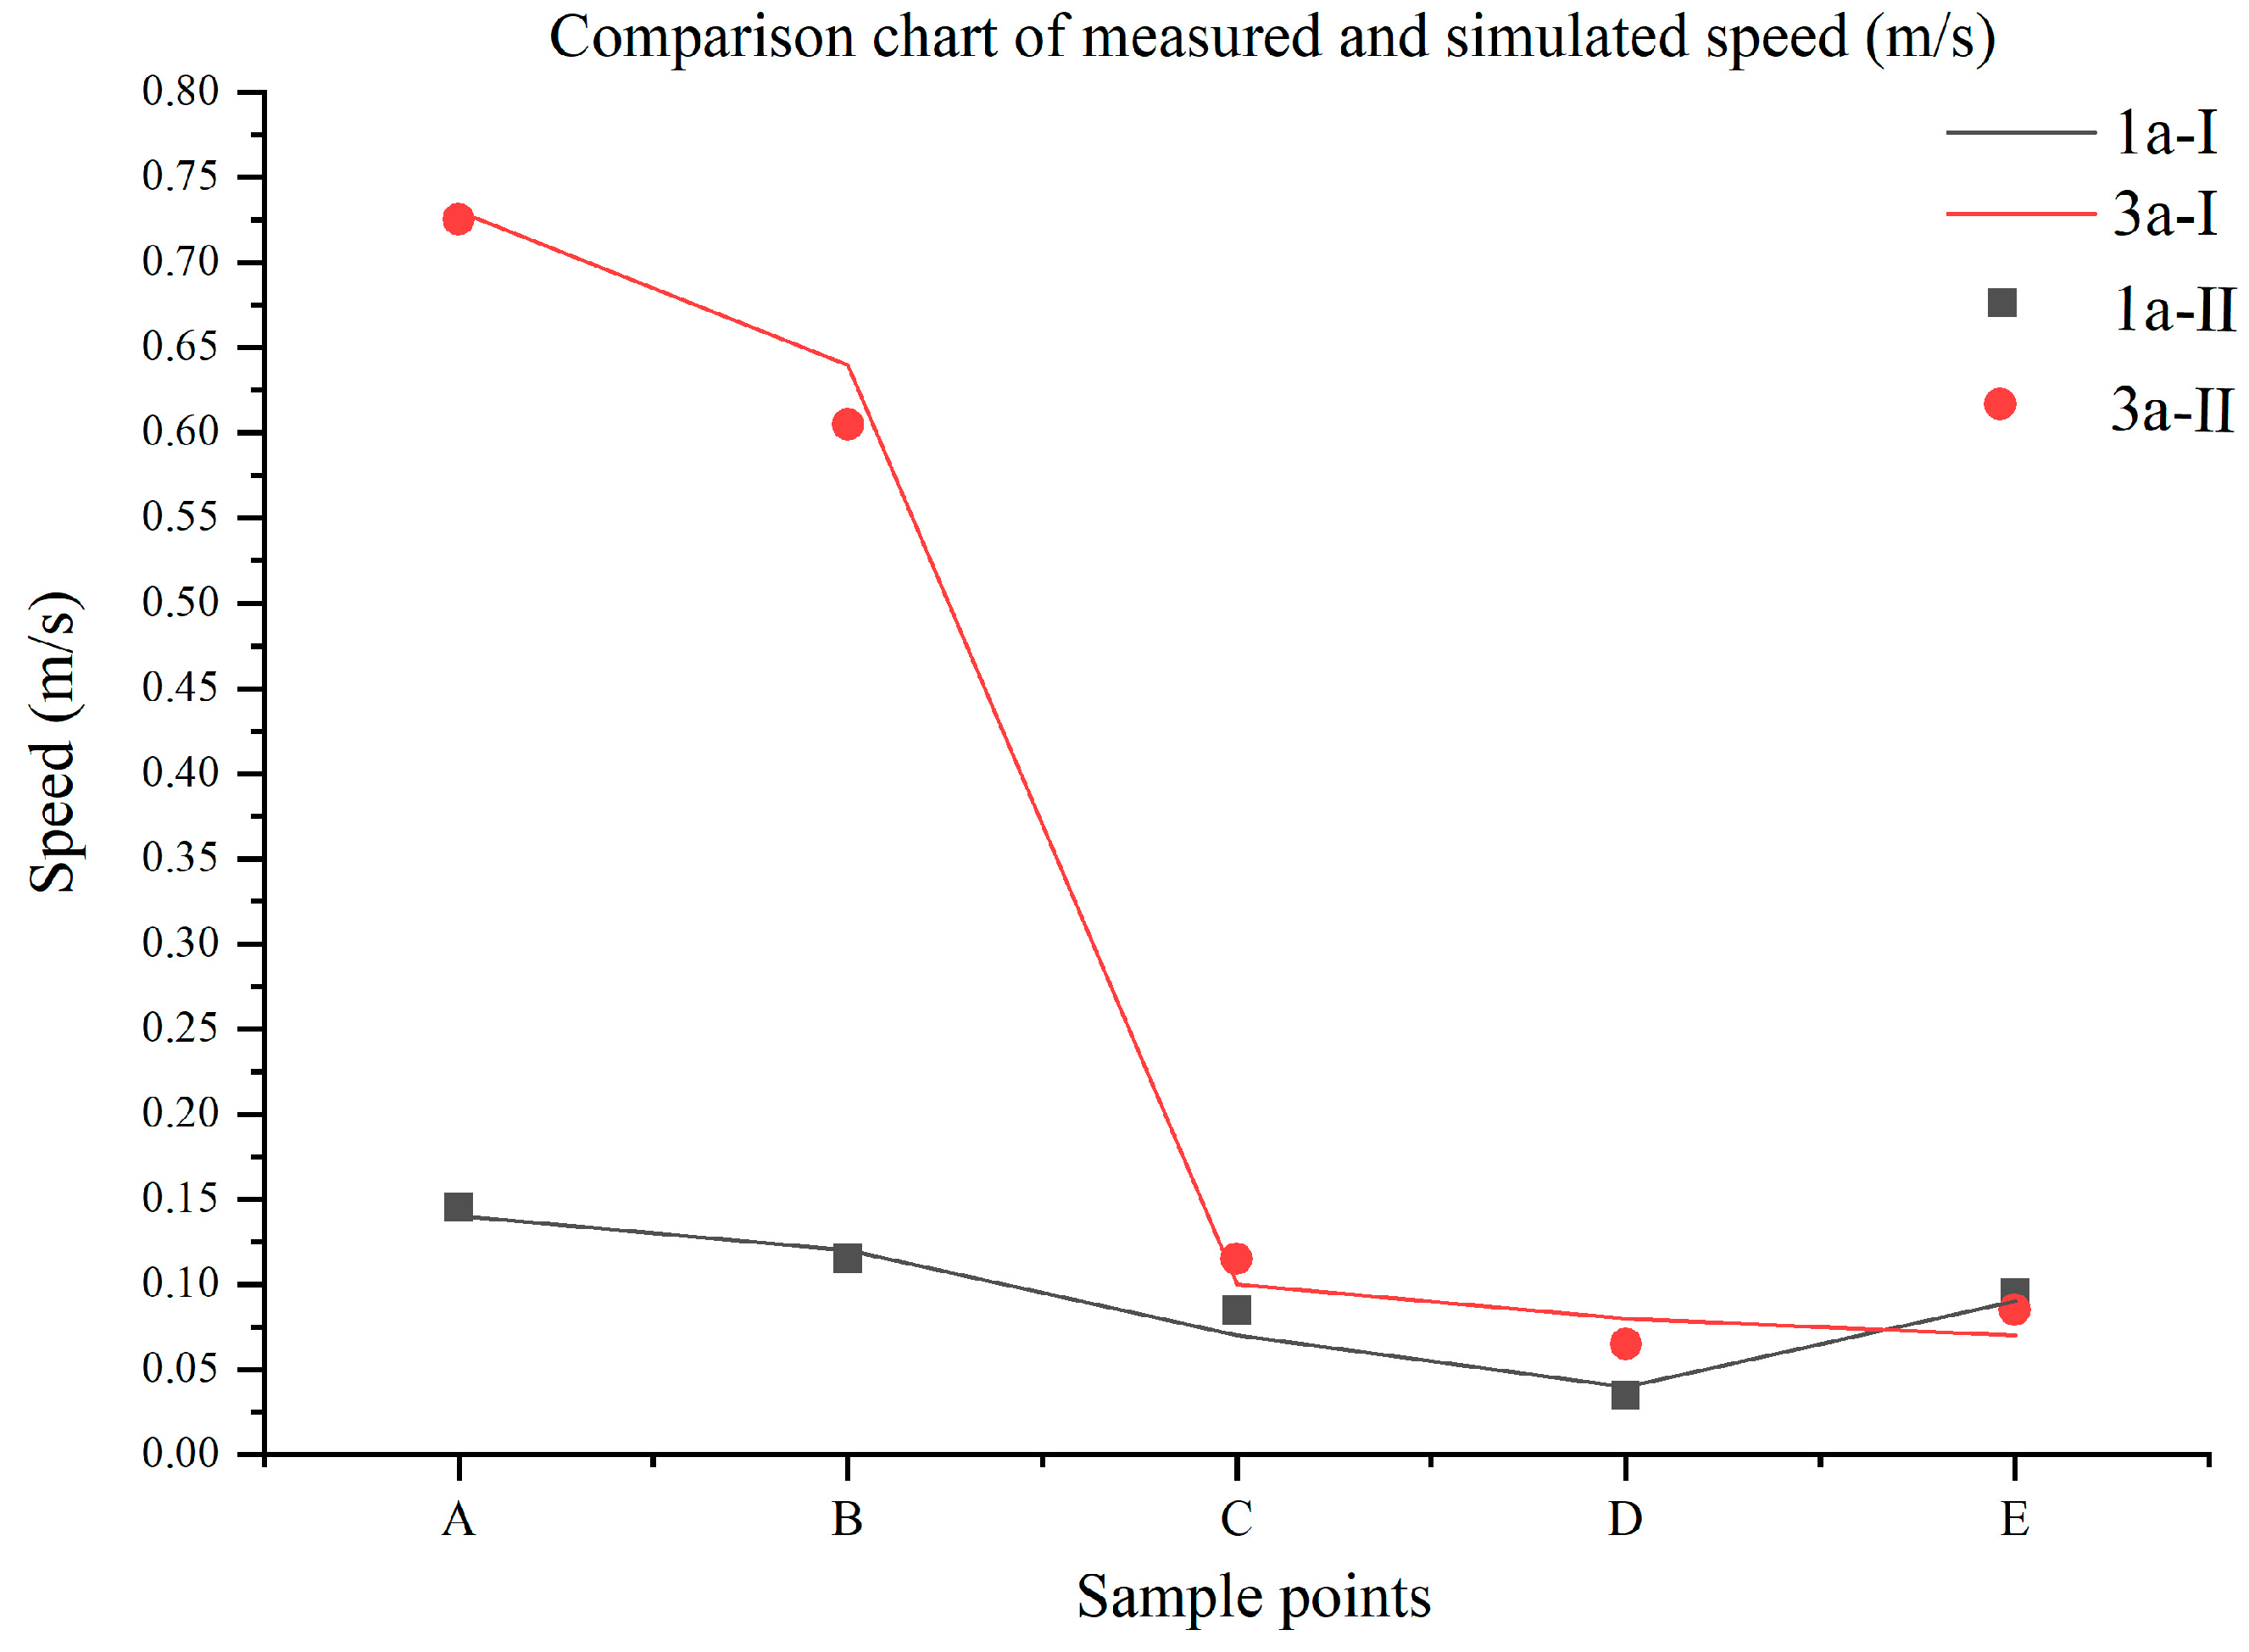
After the simulation and theoretical verification of the above situation, we used the measurement method of the second part to measure the five sampling points A, B, C, D, and E, and the comparison between the measured value and the experimental value is shown in the
Figure 16 below.
As can be seen from the above figure, the difference between the measured situation and the numerical simulation results is small. Therefore, we can generally confirm the accuracy and scientific validity of the experiment.
4.5. Comprehensive Analysis of Data
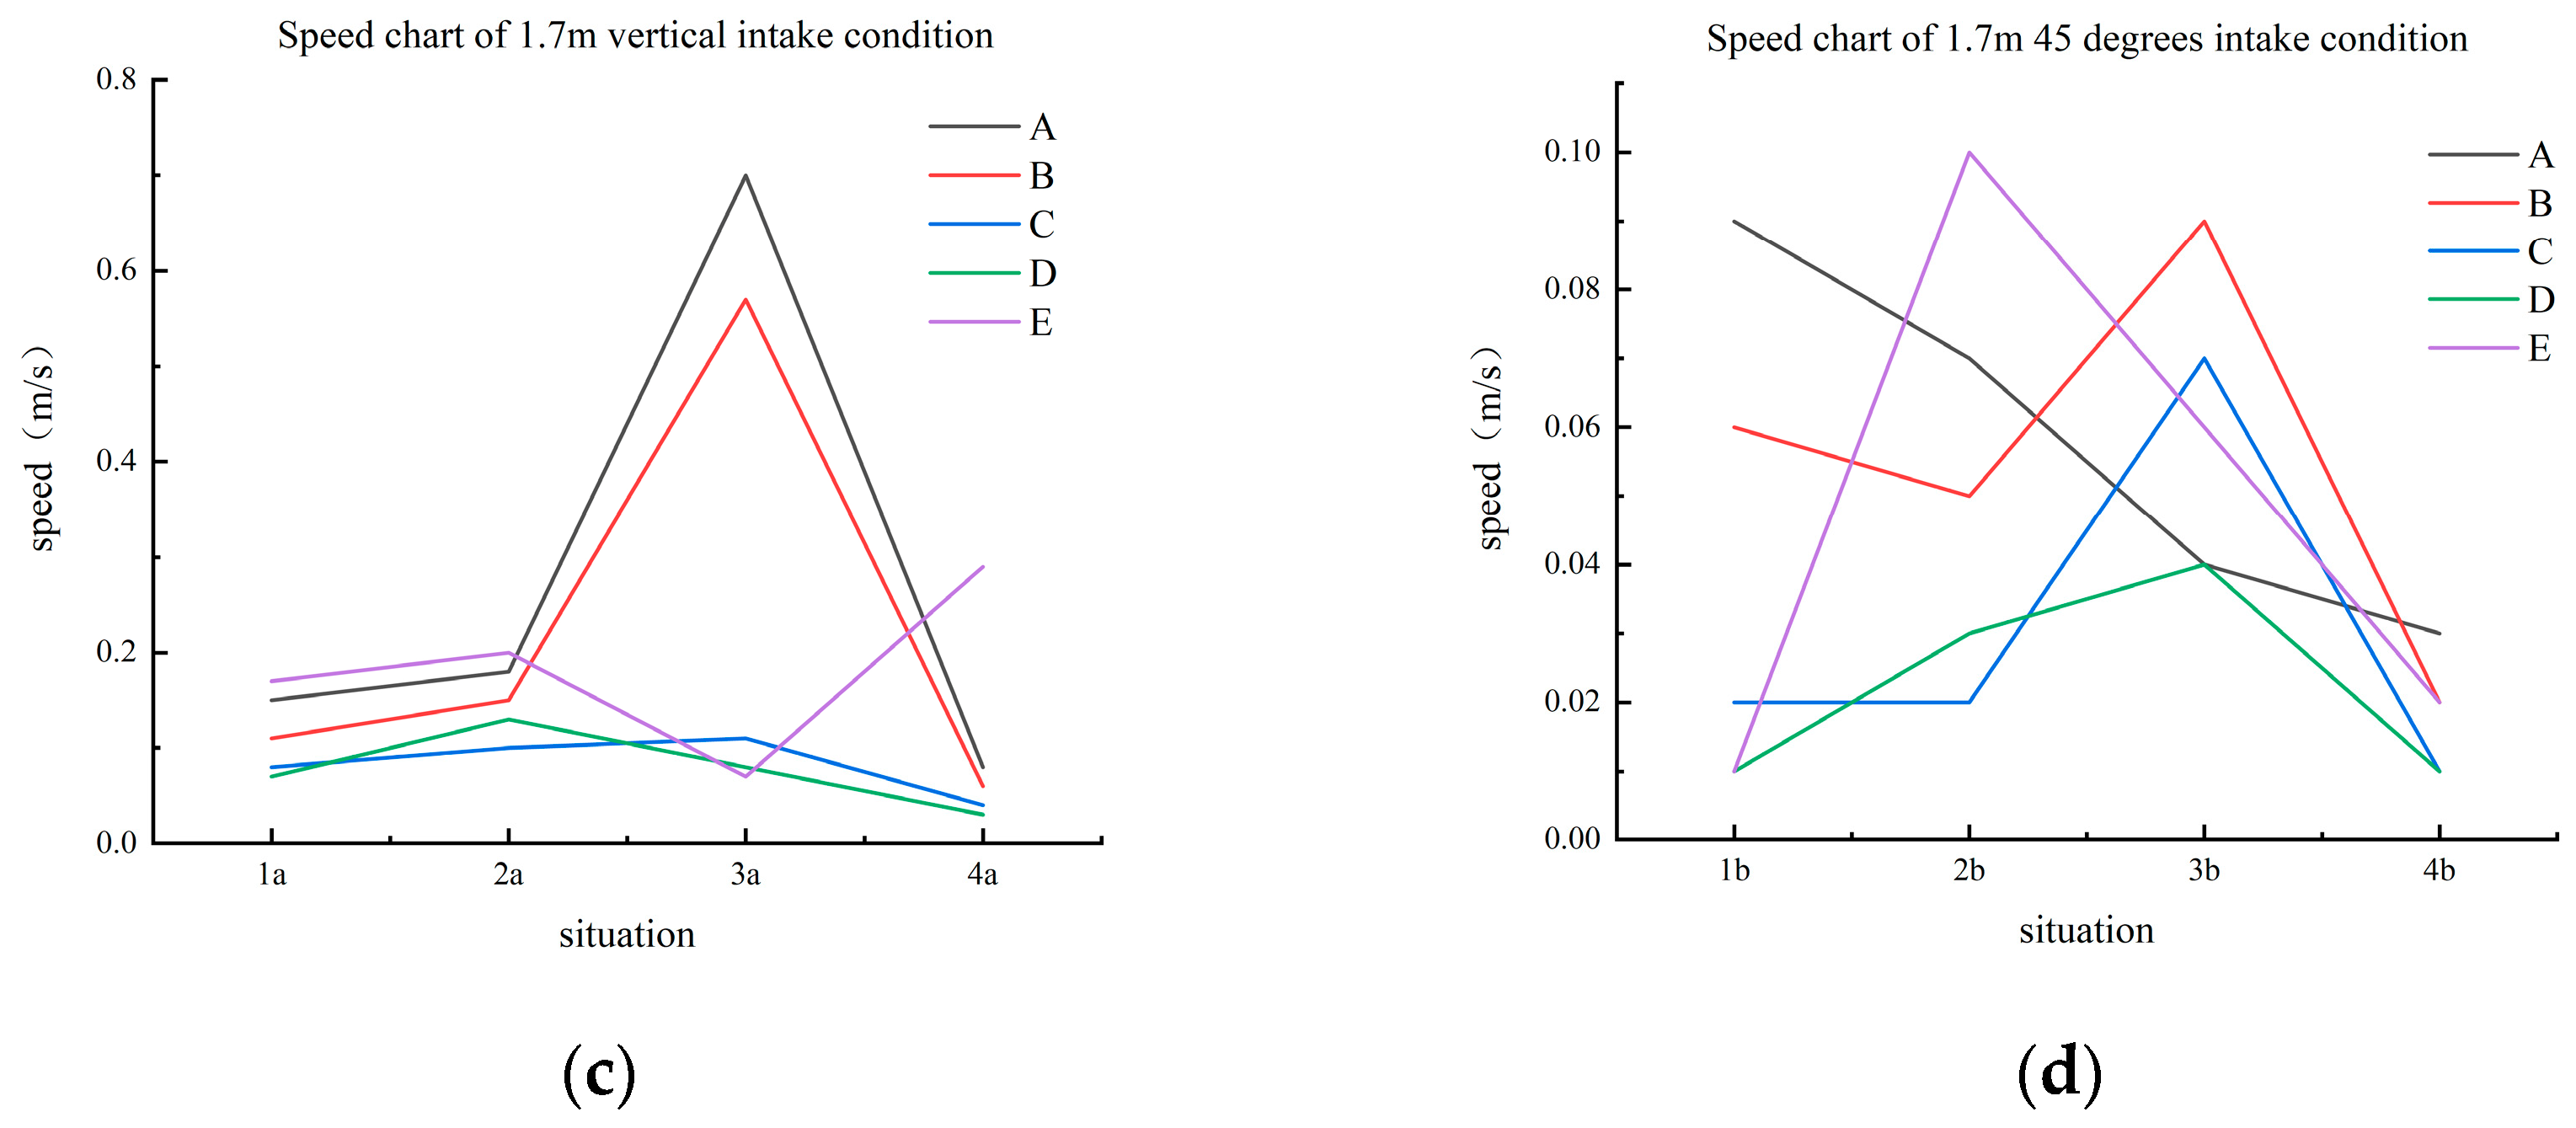
4.5.1. Wind Speed
The following graphs show the 1.25 m vertical inlet wind speed (
Figure 17a), the 1.25 m 45° inlet wind speed (
Figure 17b), the 1.7 m vertical inlet wind speed (
Figure 17c), and the 1.7 m 45° inlet wind speed (
Figure 17d), respectively. These four graphs visually depict the various values of sampling points
A,
B,
C,
D,
E, and it can be seen that 3a and 3b (the case of open door and window) are the comprehensive wind speed conditions most consistent with human comfort.
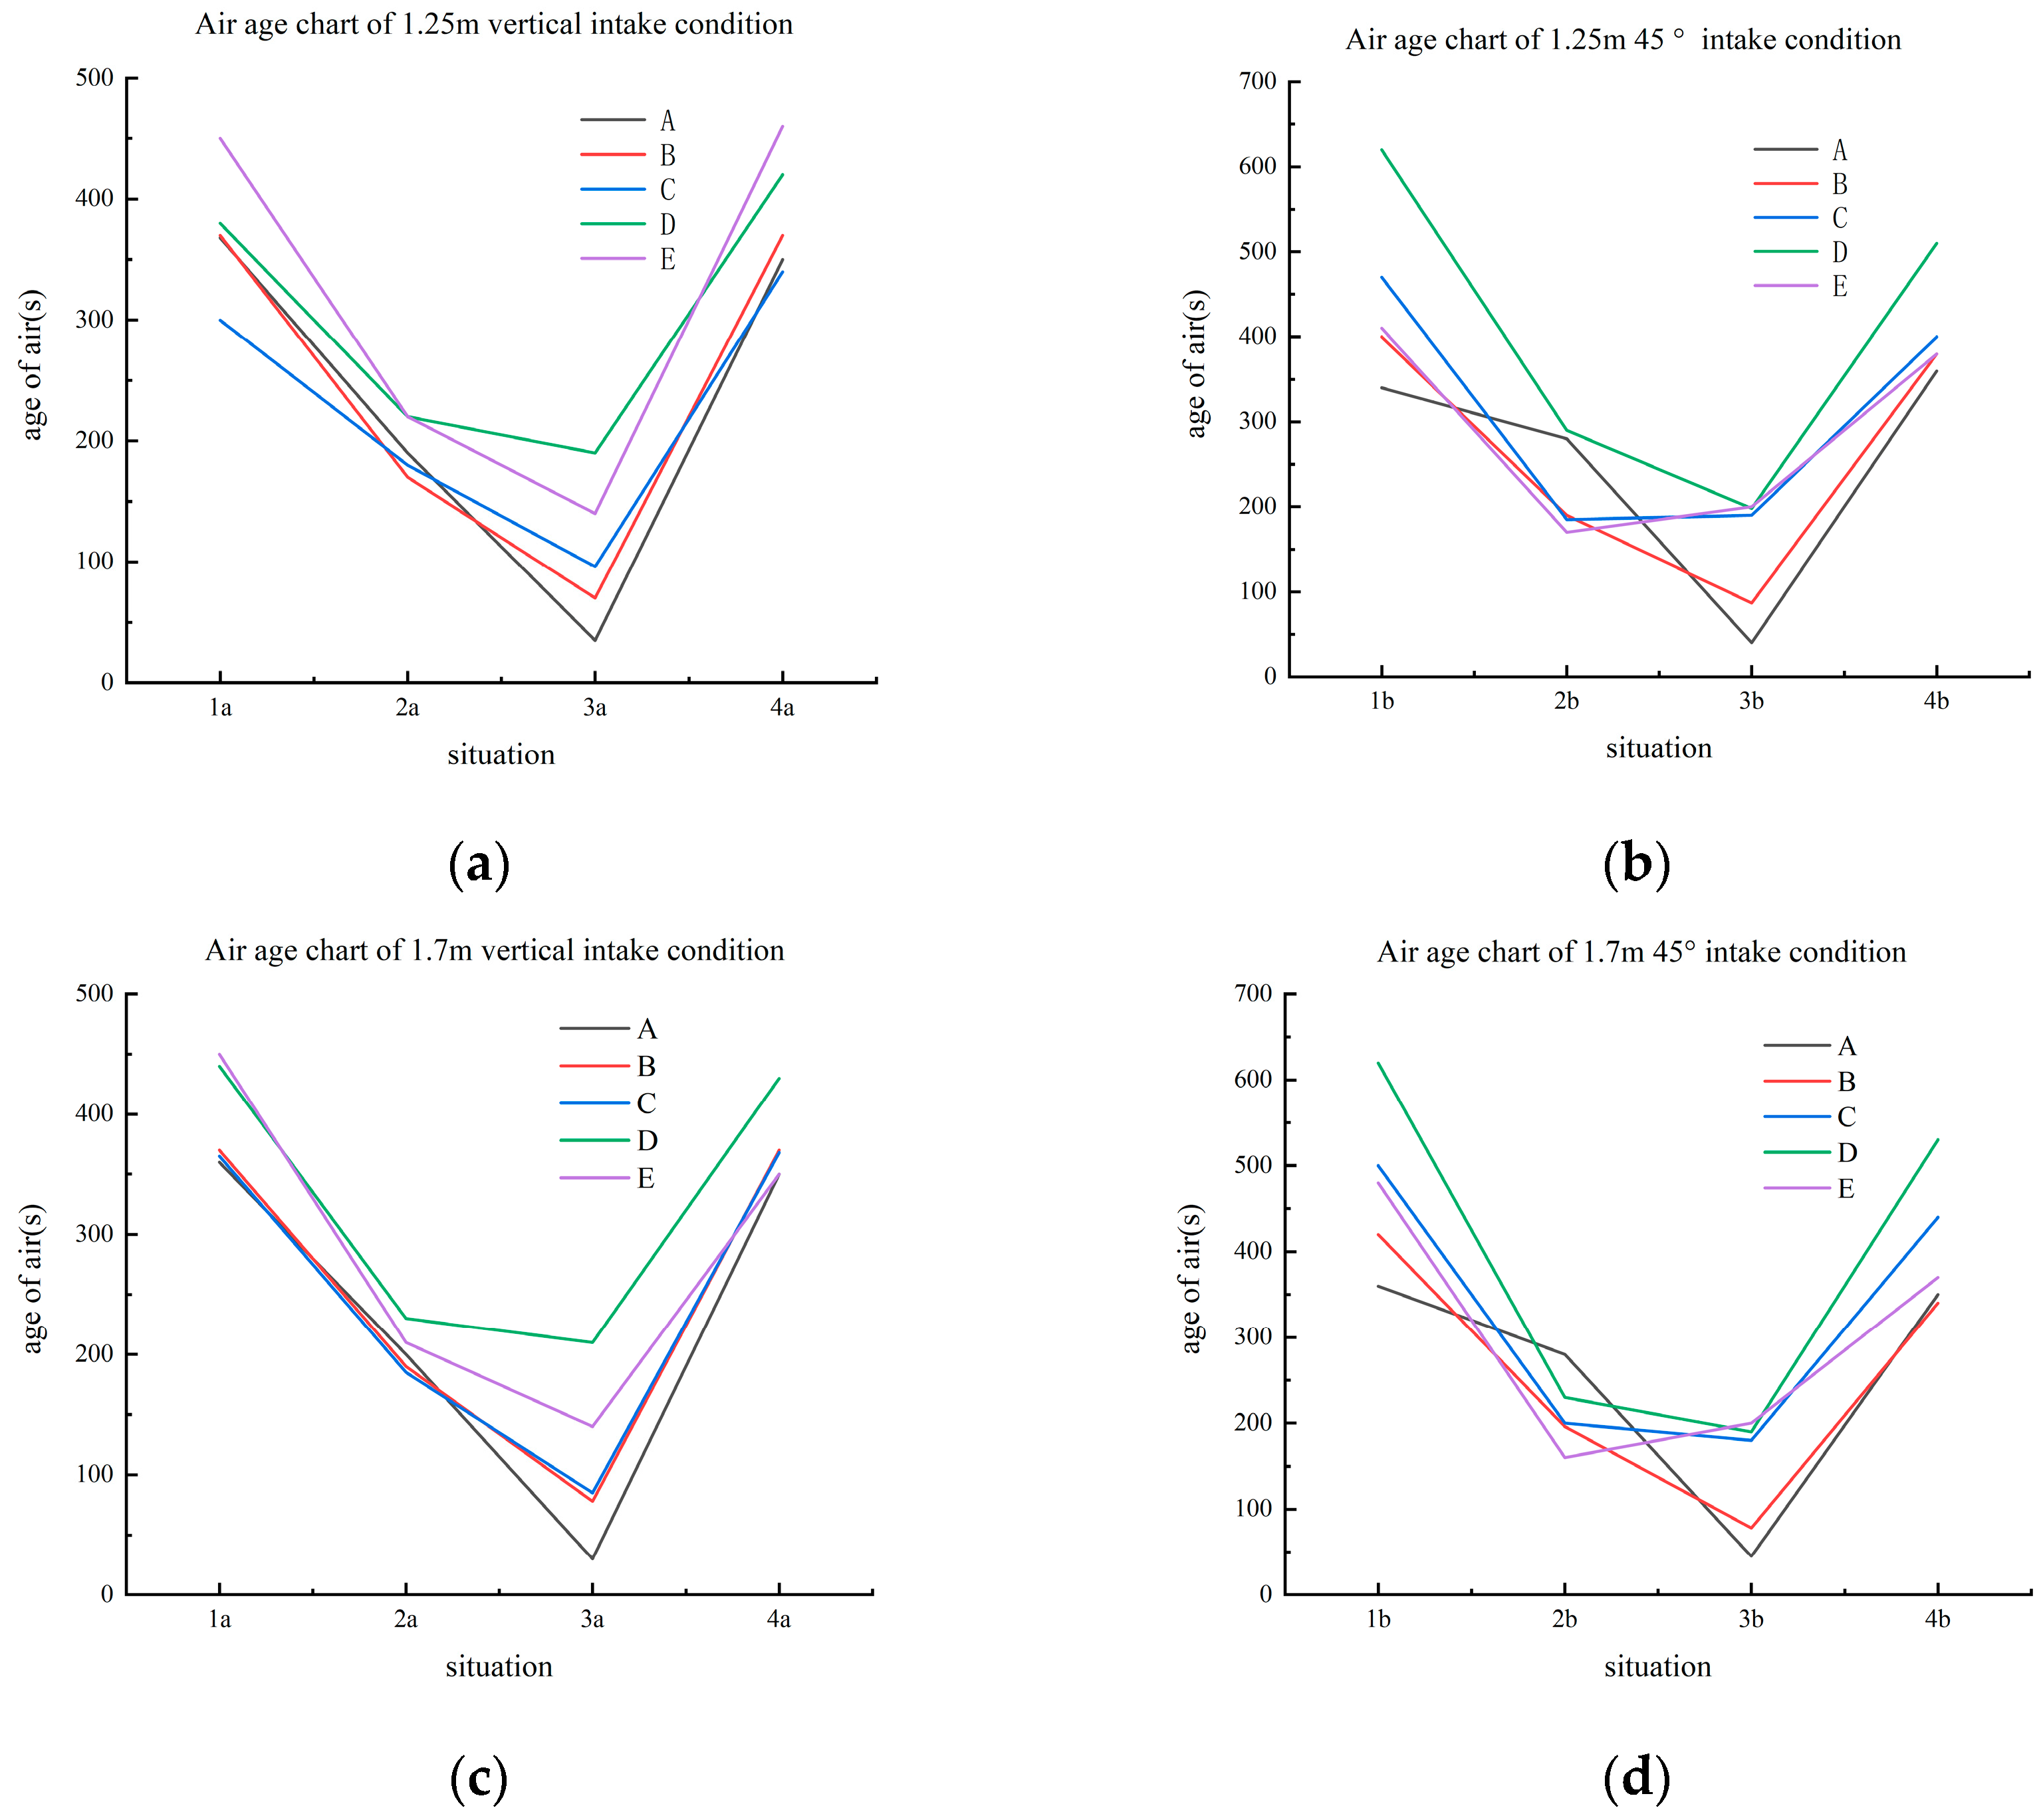
4.5.2. Air Age
The following figures show the 1.25 m vertical air intake air-age diagram (
Figure 18a), 1.25 m 45° air intake air-age diagram (
Figure 18b), 1.7 m vertical air intake air-age diagram (
Figure 18c), and 1.7 m 45° air intake air-age diagram (
Figure 18d), respectively. In general, the air ages at 3a and 3b are relatively low, indicating that the air circulation is faster with open doors and windows, which can meet people’s demand for air age quality after the epidemic.
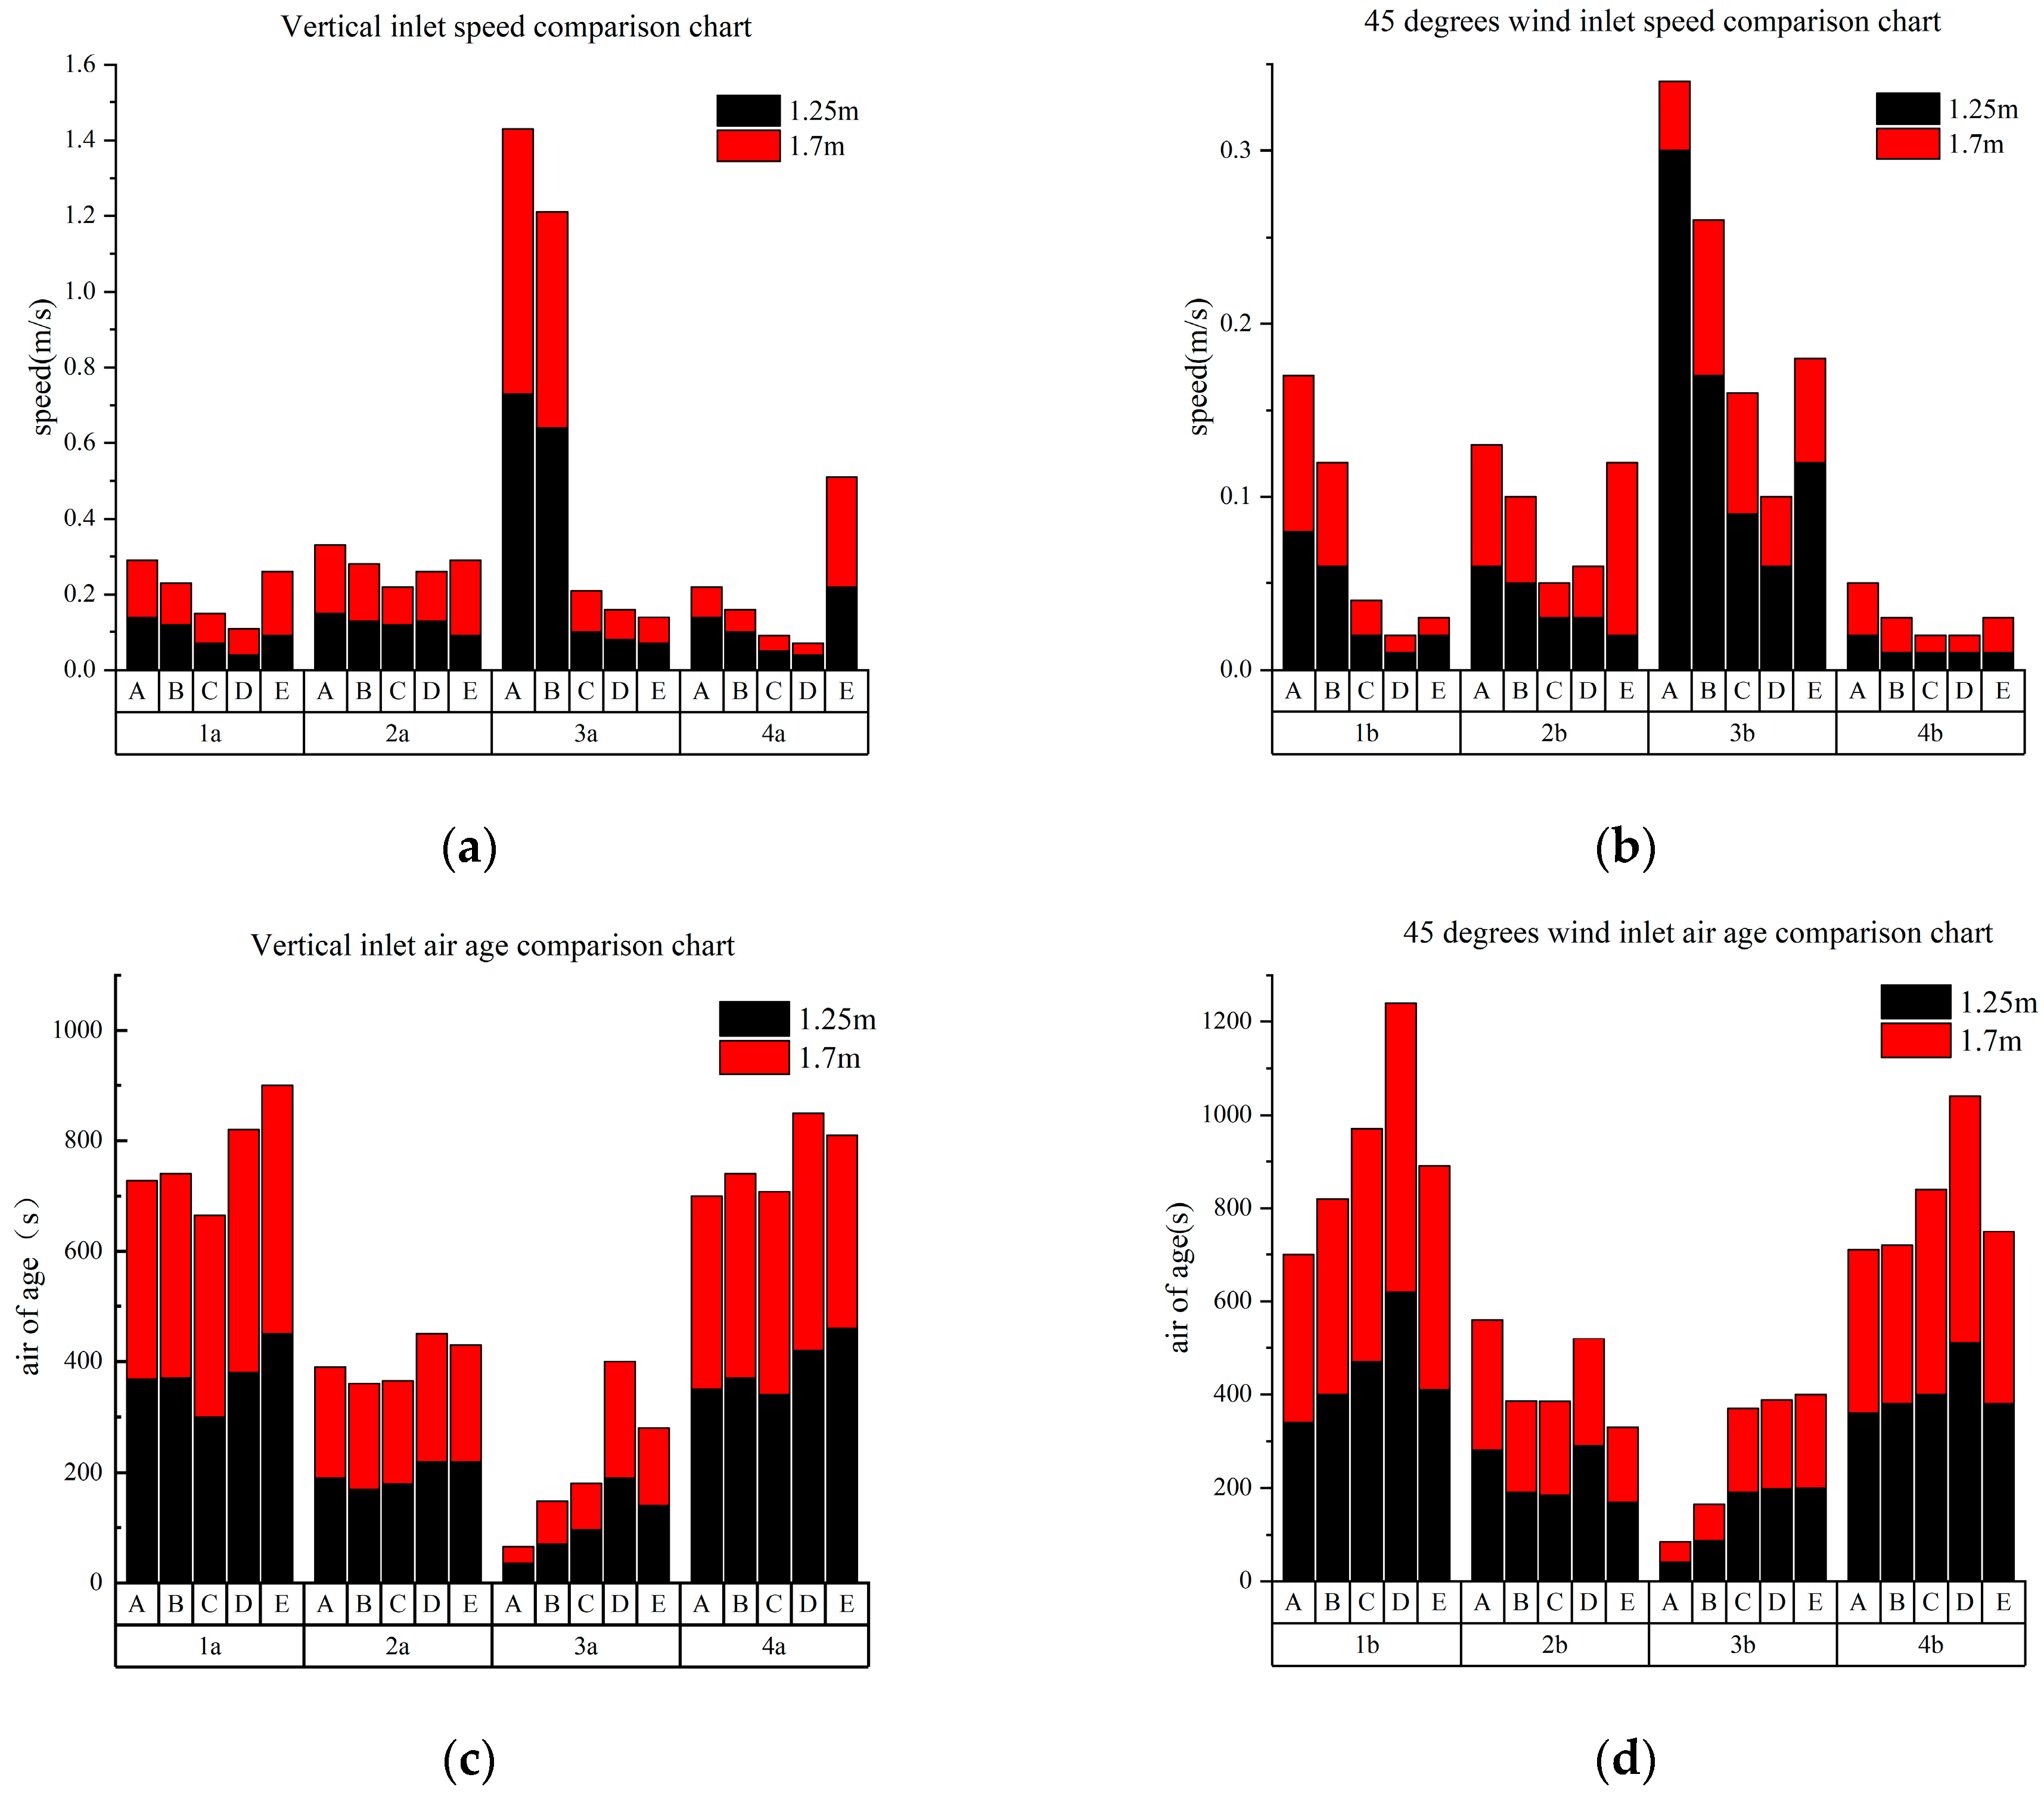
4.5.3. Discussion
The graphs below show the vertical incoming wind speed (
Figure 19a), the 45° incoming wind speed (
Figure 19b), the vertical incoming air age (
Figure 19c), and the 45° incoming air age (
Figure 19d), respectively. The stacked histograms show the cumulative data for several cases, which are more conducive to the overall comparative analysis, where the faster wind speed and lower air age values are still concentrated at 3a and 3b, which, in a comprehensive view, requires the opening of windows in this laboratory after the epidemic to ensure the flow of indoor air and maintain a well-ventilated environment. The results show that, compared with the wind environment situation in the base case, opening the door and windows increases the wind speed zone suitable for the human body by about 14.3% and reduces the minimum air age by about 53.3% (for convenience of the study, the air age is taken as the change value at point A). Wind speed in the case of open doors and windows can increase the area suitable for human comfort by about 14.3%, and the area suitable for wind speed in the original case accounted for 7.2% of the total laboratory area, which rose to 19.9% after opening doors and windows.
With the line chart and the air age cloud chart, it is easy to know that in the third case, the air organization of the room improved most significantly. However, we want to quantify the improvement situation with specific numerical values, so we propose the following formula to calculate it. One of the five data collection points was selected and the air age values of the point under scenarios 1 and 3 were recorded. Taking point A as an example, take the air age (wind angle is 45 degrees) under case 1 (
) minus case 3 (
) to obtain the air age change value
, and then the air age (90 degrees wind angle of 90 degrees) under case 1 (
) minus case 3 (
) to obtain the air age change value
, average the two change values to obtain
, and then divide the average by time t (we set the time to 10 min, that is, 600 s) to obtain the average air age change rate (ARCA)
ε [
20].
Equations (13)–(16) were used for this purpose.
The
Table 4 shows that the variation of wind speed varies greatly, while the function of air age is roughly linearly correlated. The rate of change of human comfort air age decreases the most with open doors and windows, indicating that the shorter the replacement cycle of air at the sampling point in such cases, the more the air can be comfortable for people to breathe.
5. Conclusions
With the advent of the post-epidemic era in colleges and universities, people pay more and more attention to the indoor comfort of college laboratories. It is worth mentioning that, unlike previous studies on NV, our article links the effect of natural ventilation with human comfort, explains both, and finally comes up with a scheme to optimize both natural ventilation and human comfort. It not only focuses on university laboratories with relatively blank research but also proposes a new indicator, ARCA, to evaluate the improvement rate of air age and innovatively provide a more comfortable indoor environment for college students. Through the study, we came to the following four conclusions.
(1) The ARCA (The average rate of change in air age) indicator mentioned in this study can scientifically evaluate the improvement effect in the design of future building ventilation fields.
(2) According to the data analysis, laboratory open ventilation is the best solution in all optimization strategies, whether in terms of feasibility or economy. This optimization strategy increased the human-friendly wind speed zone by about 14.3% and reduced the ARCA by up to about 53.3%.
(3) Generally teachers would choose to close the laboratory door considering the problem of sound insulation when teaching, which causes an obvious obstruction to the natural ventilation of laboratories in the post-epidemic era.
(4) Through the analysis, it is found that most students learn with a sitting posture in the laboratory, the average breathing height is 1.25 m, and the average height of standing in the laboratory is 1.7 m. Under this section, the effect of high windows on indoor ventilation is not significant, so it is not appropriate to change the number and position of high windows to improve the natural ventilation of the laboratory.
In the analysis of the software simulation results, only the typical cross-section is selected for comparative analysis, and a more comprehensive analysis is suggested in the subsequent research to ensure the accuracy of the research results. In addition, this study mainly considers the influence of wind speed and air age on human comfort, and the index is relatively simple. Other factors that may have an impact on human comfort, such as PPD and PMV, will be introduced later to conduct more dimensional evaluation and more profound research.


